teacher survey for principal development and evaluation ...edisp/mde... · midwest researchers...
TRANSCRIPT

7188_08/16
Teacher Survey for Principal Development and Evaluation:
Administration Guidance
Regional Educational Laboratory Midwest researchers assisted the Minnesota Department of Education with the development of the Teacher Survey for Principal Development and Evaluation and helped prepare this guidance document about how to administer and use the survey. A Survey Working Group that included Minnesota teachers, principals, superintendents, and representatives from teacher and school administrator professional associations were also instrumental in the survey development process.

Table of Contents
Purpose of This Guidebook ........................................................................................................ 1
Background ................................................................................................................................ 1
1. How can surveys be used in Minnesota’s Principal Development and Evaluation? ......... 1
2. Why did MDE develop the Teacher Survey for Principal Development and Evaluation? .. 1
3. What does the survey measure? ..................................................................................... 2
4. How was the survey developed? ..................................................................................... 2
5. Who should use this survey? ........................................................................................... 3
Survey Administration Considerations ........................................................................................ 4
6. Should the survey be changed or adapted? .................................................................... 4
7. What should be communicated to principals and teachers? ............................................ 4
8. What steps should be completed during survey planning and administration? ................ 5
9. What time of year should the survey be administered? .................................................... 7
10. How should the survey be administered? ........................................................................ 7
11. Who should take the survey? .......................................................................................... 8
Survey Data Analysis and Interpretation .................................................................................... 9
12. How should the survey data be prepared? ...................................................................... 9
13. How can the survey data be analyzed? ..........................................................................12
14. How can the survey findings be reported? ......................................................................13
15. How can the survey results be interpreted and used in principal evaluations? ................15
16. How can survey feedback be incorporated into the annual five-step ContinuousImprovement Cycle? ..............................................................................................................16
17. Who should own the data? .............................................................................................18
References ...............................................................................................................................19
Appendix A. What Does The Research Literature Say About Measuring Principal Effectiveness?...........................................................................................................................21
Appendix B. Minnesota Principal Performance Measures and Indicators ..................................22
Appendix C. MDE Teacher Survey for Principal Development and Evaluation ..........................24
Appendix D. Frequently Asked Questions About the Teacher Survey for Principal Development and Evaluation ....................................................................................................29
Appendix E. Communication Templates for Survey Respondents .............................................30
Appendix F. Summary of Pilot Survey Results ..........................................................................33
Minnesota Department of Education Teacher Survey for Principal Development and Evaluation—1
Purpose of This Guidebook
This guidebook provides information to districts and schools about the Teacher Survey for Principal Development and Evaluation. This booklet describes why and how the survey was developed and includes suggestions and considerations for administering the survey and using the survey results in the context of a principal development and evaluation process. See appendix A for a general review of the literature regarding measuring principal effectiveness.
Background
1. How can surveys be used in Minnesota’s Principal Developmentand Evaluation?
In 2011, the Minnesota state legislature passed a number of laws requiring school districts to develop evaluation systems for principals and teachers. Under section §123B.147 of Minnesota Statute, school districts “must develop and implement a performance-based system for annually evaluating school principals assigned to supervise a school building within the district.” The legislation allows local school districts to design their own evaluation systems that meet specific state-mandated criteria, or they can choose to implement the state’s model evaluation system, originally developed by a working group of stakeholders in 2012. As a requirement of this statute, a district must “allow surveys to help identify a principal's effectiveness, leadership skills and processes, and strengths and weaknesses in exercising leadership in pursuit of school success.” No other requirements regarding the use of surveys exist for principal evaluation.
2. Why did MDE develop the Teacher Survey for PrincipalDevelopment and Evaluation?
During the 2012–13 school year, the state model for principal evaluation was piloted by 17 districts in Minnesota. A formal study of the pilot was conducted by FHI 360, an organization commissioned by the Minnesota Department of Education (MDE) to evaluate the implementation of the model. MDE convened a cohort of principals, evaluators, and other leaders who were involved in the development of the principal evaluation model or were participants in the pilot districts. This cohort reviewed the work of FHI 360 and looked at each of five recommended surveys to identify the survey instruments that could provide the best opportunity for feedback for principals in Minnesota. After compiling their opinions using an open-ended questionnaire, the cohort made the following recommendations: (1) MDE should seek the talent and resources to develop a state survey for use, and (2) of the five surveys they reviewed, the Delaware Performance Appraisal System survey of teachers was the only one the cohort would recommend. As a result of this cohort’s recommendation, MDE began the process to develop, pilot, and confirm the validity and reliability of an optional state Teacher Survey for Principal Development and Evaluation that was uniquely aligned to Minnesota’s principal performance measures and indicators.
Minnesota Department of Education Teacher Survey for Principal Development and Evaluation—2
3. What does the survey measure?
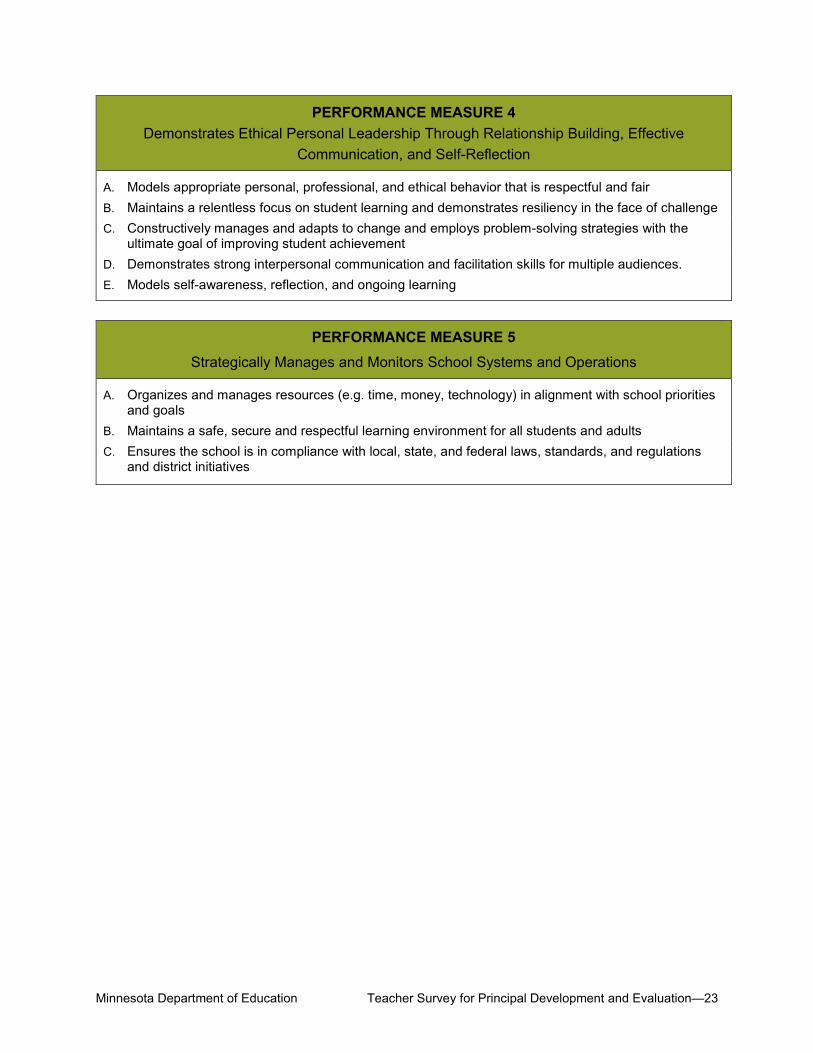
The Teacher Survey for Principal Development and Evaluation includes items aligned to the five MDE principal performance measures:
1. Develops, Advocates for, and Enacts a Shared Vision for High Student AchievementSupported by a Culture of High Expectations and Family Engagement
2. Provides Instructional Leadership for High Student Academic Performance
3. Develops and Maintains a High-Quality, Effective Staff
4. Demonstrates Ethical Personal Leadership through Relationship Building, EffectiveCommunication, and Self-Reflection
5. Strategically Manages and Monitors School Systems and Operations
The performance measures and corresponding indicators appear in appendix B. Aspects of each measure that can be observed by teachers are included in the survey instrument, which appears in appendix C.
Although the survey questions are aligned to Minnesota’s Principal Performance Measures, a district using another framework will still find this survey useful. The performance measures have parallels to many other frameworks, including the National Policy Board for Education Administration’s 2015 Professional Standards for Educational Leaders.
4. How was the survey developed?
MDE partnered with survey methodologists and principal evaluation content staff at the Regional Educational Laboratory (REL) Midwest to develop the survey. In addition, MDE assembled a Survey Working Group that included Minnesota teachers, principals, superintendents, and representatives from teacher and school administrator professional associations to guide the survey development process. In the summer of 2015, Survey Working Group members reviewed and helped draft survey items to align with the principal performance measures, and used these to create an initial draft of the survey. In the fall of 2015, REL Midwest researchers obtained feedback about this draft of the survey from Minnesota stakeholders outside of the Survey Working Group by conducting (1) interviews with superintendents, (2) cognitive interviews with teachers, and (3) focus groups with principals. Results of these pretesting activities were summarized and shared with the Survey Working Group along with recommendations for survey revisions in light of the results.
A survey item was recommended for inclusion in the next draft of the survey without revision if it met the following conditions:
• All teachers demonstrated through their “think-aloud” cognitive interview responses thatthe item was easily understood, and terms and phrases were interpreted as intended.
• Teachers indicated that they had sufficient knowledge to respond to the item.

Minnesota Department of Education Teacher Survey for Principal Development and Evaluation—3
• Principals indicated that their teachers would have sufficient knowledge to answer theitem accurately or to have a reasonably informed opinion.
• Superintendents and principals said the item referred to a policy or activity that was aprincipal’s responsibility and under principal control.
• Superintendents and principals indicated that the item was well aligned with the keycomponents of the associated MDE principal performance measure.
• Superintendents and principals thought that teachers’ responses to the item wouldprovide relevant and actionable information that would be useful during principalevaluations.
• Feedback from all participant groups indicated that the item would work equally well forelementary, middle, and high school settings.
• Superintendents and principals felt that the item measured a concept that would not bemore accurately collected from another data source (e.g., students, parents,administrative records).
In consultation with the Survey Working Group, staff at MDE and REL Midwest drafted the pilot version of the survey. In early 2016, MDE conducted a pilot test. Twenty-five principals invited their teachers and other credentialed school staff to complete the survey. Analyses were conducted on survey responses from 689 participants to investigate the psychometric properties of the survey items and the sets of survey items within each performance measure. In addition, participants were asked about their perceptions of the quality of the survey items and how well the survey captured the important features of their principal’s performance. The pilot test results indicated that the survey can produce reliable information for the five performance measures, but a few additional revisions were made to the wording of the items in light of pilot survey participants’ responses and the Survey Working Group’s input. The final survey appears in appendix C.
5. Who should use this survey?
District or school leaders who want to include teacher survey data from an instrument that was created to align with MDE principal performance measures can use this survey as part of their development and evaluation model. The survey data can be used, in conjunction with other sources of information, to provide principals with relevant feedback to support their professional growth.
Minnesota Department of Education Teacher Survey for Principal Development and Evaluation—4
Survey Administration Considerations
Planning is a crucial step to ensure success in administering teacher surveys and ensure use of the results in the principal development and evaluation process. Without a solid plan, it is difficult to administer a survey that can be used effectively for principal growth and evaluation. This section lays out some guidelines that district or school administrators should consider when planning the administration of the Teacher Survey for Principal Development and Evaluation, including guidance about survey adaptation, considerations related to survey recipients, and a checklist and timeline for survey administration.
6. Should the survey be changed or adapted?
To maintain the reliability of this survey, districts and schools should administer the survey items verbatim; the item wording was carefully tested in the pretesting and pilot test. The survey was designed to align with the five principal performance measures, and there are five corresponding sections of questions within the survey. Districts or schools may want to administer sections at different times of the year, or choose particular sections to administer that are most pertinent. All of the survey items within a section should be administered to fully represent that performance measure. Additional questions (such as the responding staff member’s role in the school) can be added so that survey responses can be analyzed by subgroup, but should be done carefully. The survey is meant to allow teachers to provide confidential feedback. Do not add questions that potentially could reveal personally identifiable information. Additional open-ended questions may be added to obtain feedback about other topics of interest.
7. What should be communicated to principals and teachers?
If the district is administering the survey, it is important to communicate with principals early when planning to administer a survey. Principals are likely to have important input regarding the timeline and mode of survey administration, and should be asked to participate in the survey’s administration. If possible, principals can be tasked with inviting teachers to participate in the survey, providing time and space for respondents to complete the survey, and sending follow-up communications and reminders. If the principal is administering the survey, principals also should communicate early with survey participants to ensure that administration processes are clear. If the principal is administering the survey in a paper-and-pencil format, it is recommended that someone other than the principal collect the completed surveys, tally the results and compile the open-ended answers so that teachers will be more comfortable answering honestly.
The primary communication activities are listed in the administration and planning checklist in table 1. A one-page “Frequently Asked Questions” overview of the survey that can be shared with principals and teachers to describe the survey appears in appendix D. In addition, some example messages for introducing the survey’s purpose and inviting teachers to take the survey, and for following up with teachers who have not yet completed the survey, are included in appendix E.
Minnesota Department of Education Teacher Survey for Principal Development and Evaluation—5
8. What steps should be completed during survey planning andadministration?
Regardless of the time of year the survey is administered, several steps must be completed—before, during, and after the survey’s administration—to ensure success. Each of these tasks is vital to the survey planning and administration process. Planning tasks are largely related to the overarching strategy of the survey, including deciding who will be charged with overseeing the survey’s administration, defining the sample, and determining how the results of the survey will be used. Administration tasks address logistical considerations—for example, determining survey mode, communicating with principals and teachers, and planning for data collection.
If the survey is to be administered districtwide, it may be necessary to appoint one or more persons to manage the survey process across all schools. For example, depending on the structure and capacity of the district, it may make sense for the survey coordinator to manage only logistics while the superintendent or another senior administrator is in charge of communication with principals. Individual schools can set aside time at a faculty or staff meeting to allow teachers to complete the survey. Providing dedicated time likely will result in a higher response rate and more timely data collection.
The suggested steps for planning and administrating the survey are described in table 1. This table also can be used as a checklist for administering this survey, with each task listed in the order of suggested completion. If more than one person will be responsible for planning or administrating the survey, the district may want to include a column indicating who is responsible for each step.

Minnesota Department of Education Teacher Survey for Principal Development and Evaluation—6
Table 1. Steps for planning and administering the MDE Teacher Survey for Principal Development and Evaluation
Planning and Administration Step
Check When
Complete
To Be Done:
Before During After
1. Decide who in the district or school office will be incharge of survey administration and planning. n/a n/a
2. Determine how the results of this survey will be usedand disseminated. n/a n/a
3. Determine the appropriate time of year to administerthe survey. n/a n/a
4. Define target population and develop a samplingframe. n/a n/a
5. Determine mode of survey administration: online orpaper. n/a n/a
6. (If online) determine which online survey tool will beused, and establish who will be tasked withmonitoring the survey site.
n/a n/a
7. Decide the length of time the survey will be openand available. n/a n/a
8. Refine sample and collect necessary information foradministration of survey (e.g., names, e-mailaddresses).
n/a n/a
9. Develop a data collection plan. n/a n/a
10. Develop a data analysis plan. n/a
11. Communicate purpose of survey to teachers, and letthem know the date of administration (if paper), orthe length of time the survey will be active (if online).
n/a
12. Write and deliver survey invitation (decide who willbe the main point of contact for each school). n/a n/a
13. Plan to track response rates. n/a
14. Prepare and send out follow-up communications tosurvey respondents (multiple reminders can be sentout if necessary).
n/a
15. (If online) work with web administrator to close thesurvey and collect the data. n/a
16. (If paper) work with the schools to collect the papersurveys and enter the responses into an electronicformat.
n/a
17. Analyze the survey responses. n/a n/a
18. Report the survey results. n/a n/a
Minnesota Department of Education Teacher Survey for Principal Development and Evaluation—7
9. What time of year should the survey be administered?
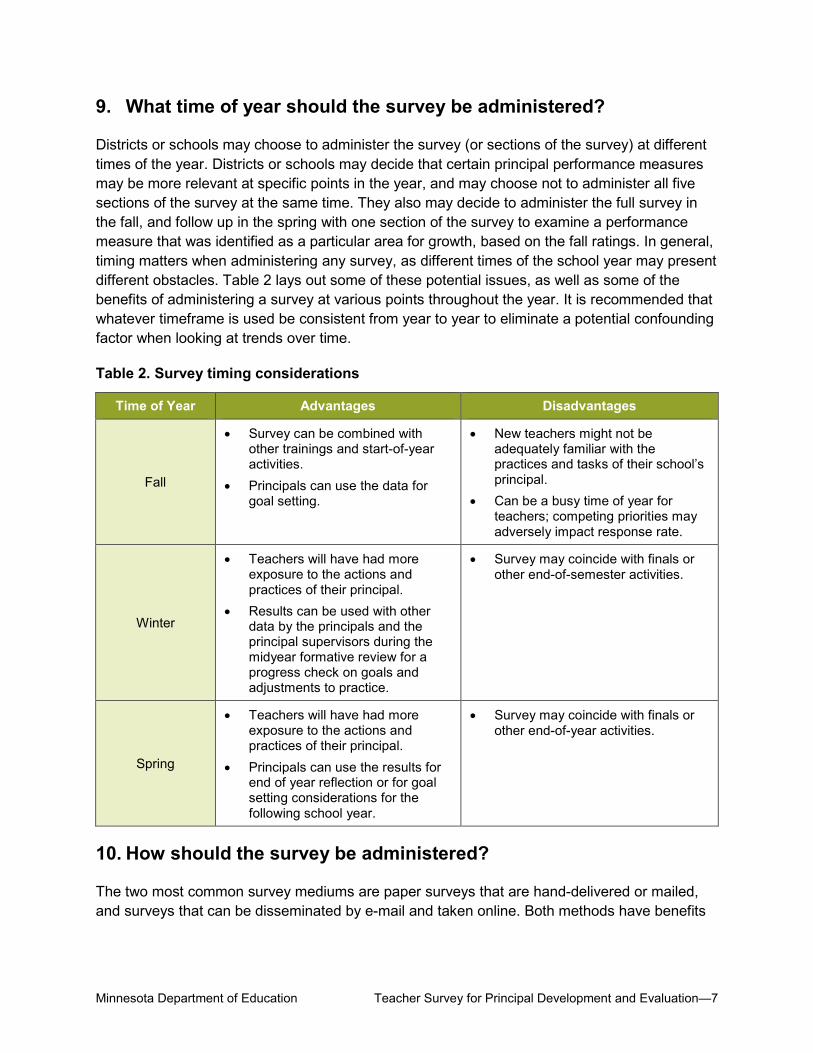
Districts or schools may choose to administer the survey (or sections of the survey) at different times of the year. Districts or schools may decide that certain principal performance measures may be more relevant at specific points in the year, and may choose not to administer all five sections of the survey at the same time. They also may decide to administer the full survey in the fall, and follow up in the spring with one section of the survey to examine a performance measure that was identified as a particular area for growth, based on the fall ratings. In general, timing matters when administering any survey, as different times of the school year may present different obstacles. Table 2 lays out some of these potential issues, as well as some of the benefits of administering a survey at various points throughout the year. It is recommended that whatever timeframe is used be consistent from year to year to eliminate a potential confounding factor when looking at trends over time.
Table 2. Survey timing considerations
Time of Year Advantages Disadvantages
Fall
• Survey can be combined withother trainings and start-of-yearactivities.
• Principals can use the data forgoal setting.
• New teachers might not beadequately familiar with thepractices and tasks of their school’sprincipal.
• Can be a busy time of year forteachers; competing priorities mayadversely impact response rate.
Winter
• Teachers will have had moreexposure to the actions andpractices of their principal.
• Results can be used with otherdata by the principals and theprincipal supervisors during themidyear formative review for aprogress check on goals andadjustments to practice.
• Survey may coincide with finals orother end-of-semester activities.
Spring
• Teachers will have had moreexposure to the actions andpractices of their principal.
• Principals can use the results forend of year reflection or for goalsetting considerations for thefollowing school year.
• Survey may coincide with finals orother end-of-year activities.
10. How should the survey be administered?
The two most common survey mediums are paper surveys that are hand-delivered or mailed, and surveys that can be disseminated by e-mail and taken online. Both methods have benefits

Minnesota Department of Education Teacher Survey for Principal Development and Evaluation—8
and drawbacks, and it is important to consider your district or school’s context when choosing which to use.
Table 3. Survey mode considerations
Survey Mode Advantages Disadvantages
Paper
• Survey quicker to prepare andadminister.
• Survey easier to administer in agroup setting (e.g., during ameeting).
• Survey does not require technicalstaff to program or administer thesurvey.
• More time is needed to enter datainto an analyzable data file unlessscannable forms are used.
• Data entry can be time consumingand costly, depending on size ofthe district or school.
Online
• An analysis-ready data file iscreated much quicker and withfewer errors than paper survey dataentered by hand
• Administration can be automated(survey invitation delivered by e-mail), with fewer staff needed todistribute the surveys and overseethe collection of responses
• More time is needed to prepare thesurvey instrument.
• Some online survey tools require afee.
• Survey may need technical staff toprepare and administer surveyusing the selected online tool.
• Schools with limited access totechnology may not be able toadminister with ease.
11. Who should take the survey?
This survey was pilot-tested with teachers and other licensed school staff members. The survey worked well for both types of respondents, although those who were not classroom teachers were more likely to answer “not applicable” to some survey items, especially in performance measure 3, “Develops and Maintains a High-Quality, Effective Staff.” The survey is intended for teachers and other certified school staff members, but districts or schools may choose to administer specific sections or the entire survey only to teachers.
It is important that surveys are completed by as many of those invited to participate as possible to increase the likelihood that the data are representative of the entire group of intended participants. It is best to administer the survey to the entire target population (e.g., all teachers at a school). However, in some rare cases where the school is too large and surveying everyone is burdensome, a probability sample of the target population can be surveyed instead. If this method is chosen, the school should consult with a sampling statistician to be sure the sample is designed properly.

Minnesota Department of Education Teacher Survey for Principal Development and Evaluation—9
Survey Data Analysis and Interpretation
12. How should the survey data be prepared?
Once all responses are received, the next step is to assemble the data and prepare them for analysis. For the purpose of the Teacher Survey for Principal Development and Evaluation, basic analyses using Microsoft Excel or any standard statistical software (e.g., SPSS, SAS, STATA) would be sufficient. The analyst would need to know how to conduct basic data manipulation (e.g., organizing, editing, saving data) and how to perform descriptive analysis techniques such as calculating frequencies, means, and standard deviations. For districts without data analytic and interpretation resources or capacity, organizations with evaluation services, such as the University of Minnesota’s Center for Applied Research and Educational Improvement (CAREI), can aid a district in analyzing and interpreting the survey data.
If the survey is administered on paper, the responses will need to be entered into Microsoft Excel or another spreadsheet software package. An important step in this process is to develop a codebook that lists each variable/question name, all of the answer options for each question, and the numerical code (if these were used) assigned to each answer option. The codebook is the analyst’s data key/legend and will serve as a reference for any other users of the data. If an online survey is used, the data file and codebook will likely already be stored and available in an electronic format. Before working with the electronic data file, make a copy of the original data and use the copied version for data preparation and analysis. Steps for data preparation and analysis include the following:
Inspecting the data. The analyst first should review the data for accuracy. This step ensures that the data collection process does not contribute inaccuracies, and reduces existing errors in the data. If the data are entered manually into a database or a spreadsheet, there is always a risk of human error. Using an online survey tool may eliminate the data-entry problems associated with paper surveys, but data generated from online surveys are not guaranteed to be free of errors. For example, data may not be populated into the spreadsheet correctly, resulting in a misalignment of variable names and responses. As soon as the data set is available, the analyst first should check whether it has the expected number of rows and columns. The analyst should check for columns that are blank; this can be caused by some error in data extraction. Second, the analyst should look at every question and see if the results make sense. For example, look for out-of-range values (e.g., a value of 6 would be out of range if the possible range of response options was 1 to 5). Simple frequency tables can be used to examine the whole data set for out-of-range values. If the data set is large, the analyst can check a randomly selected portion of the data for accuracy. If any errors are found, the analyst then should check the remainder of the data. The initial check often will uncover any issues with the survey responses. If it is not possible to correct an error, the analyst should document the error and assess its implications for analysis. The analyst may need to discuss the problem with school or district leaders before making decisions about how to handle the error in subsequent analyses.
Minnesota Department of Education Teacher Survey for Principal Development and Evaluation—10
Removing duplicate cases. The initial data review also may reveal duplicate cases. Duplicate cases in data from a paper survey can be detected by checking the number of cases in the electronic file against the number of completed survey forms. Duplicate responses are more likely in data from online surveys, resulting from the same person taking the survey or submitting the survey more than once. The online survey software the school or district chooses may or may not provide built-in features to help minimize the risk of duplicate responses (e.g., providing a unique survey link to each potential respondent, assigning a unique identifier or login name, or using technical tricks such as setting cookies and logging IP addresses). If duplicate data are not removed, the data will be skewed in favor of the duplicate responses. One way to detect duplicate responses is to examine the answers to any open-ended questions. When two open-ended questions have the exact same answer, a duplicate response may exist. To confirm whether a response is indeed a duplicate, compare the answers to all the other questions, then delete one of the responses if a match is found.
Examining response rate. After removing duplicate cases, the analyst should examine the response rate. The response rate of a survey is a measure of how many people who were approached (that is, were invited to participate) actually completed the survey, expressed as a percentage from 0 percent to 100 percent. The higher the response rate, the more likely the resulting sample will be representative of the total population. Lower response rates may be problematic, especially if people who do not respond are different from those who do. The results will be misleading or biased if certain types of people are more likely to respond to surveys than others. Moreover, for the Teacher Survey for Principal Development and Evaluation, the reliability of the average staff member rating for a performance measure for principals is partly determined by the number of staff members responding to the survey in each school. Based on the pilot test (which tested a version very similar to the final survey), an average of 22 staff in each school participated, and the reliabilities of principal average ratings were very good (between .083 and 0.89 for each domain average rating).1 It was estimated that with 10 survey respondents, the domain average ratings would be less reliable (0.68–0.78) for the pilot version of the survey. A reliability index of 0.70 is generally considered adequate. A small school — say, 20 teachers —would need a high response rate to obtain estimates of principal performance with acceptable reliability for all domains; lower response rates may be acceptable for larger schools (assuming those who responded are representative of the entire staff).
Editing and cleaning data. Although the analyst can begin editing and cleaning the data as soon as results are received, caution should be used, since any edits can be lost if the database is rebuilt—unless the analyst has written a program code that the analyst can rerun to repeat the data editing and cleaning procedures any time rather than have to start all over). To reduce the amount of error, wait until all data are received before beginning the editing and cleaning process. To start, find incomplete responses and decide how to address those cases. The
1 To determine school-level reliability, the intraclass correlation (ICC) for each domain was first estimated and then incorporated into the Spearman-Brown prediction formula to calculate school-level reliability for each domain. The reliability of the average school-level score as an estimator of the true school average for each subscale was assessed using [k(ICC) ] / [ (k-1)(ICC) + 1], where k is the average number of respondents per school.

Minnesota Department of Education Teacher Survey for Principal Development and Evaluation—11
decision rules for inclusion or exclusion of incomplete responses should be determined before the data analysis begins. Based on these criteria, the analyst may delete all records with incomplete responses or keep a record if the respondent has completed enough of the survey to be meaningful. Alternatively, the analyst can keep all the records in the file and create a variable that indicates whether the results are complete or not for each respondent. This latter approach keeps the data intact, and the analyst will be able to use the newly created indicator variable to filter out incomplete responses in subsequent analysis.
Table 4. Checklist for preparing and analyzing the data for the MDE Teacher Survey for Principal Development and Evaluation
Preparing and Analyzing Data Step Check When
Complete
I. Prepare the data (if paper-and-pencil format is used). n/a
Visually scan questionnaires for completeness and validity and review problematicquestionnaires.
Create code book, including variable names, labels, codes for responsecategories and code for missing values.
Choose data entry tool, statistical software, or both.
Enter data from paper questionnaires and double check entries.
II. Inspect the data. n/a
Check the number of rows and columns.
Check for columns that are entirely blank.
Create and review frequency tables for all questions.
- Check for completeness of each question and assess missing values.
- Assess out-of-range values.
III. Check and remove duplicate cases. n/a
Check the number of cases in the data file against the number of expectedrespondents or the number of completed survey forms.
Check for duplicate respondent IDs (if available).
Examine the answers to open-ended questions—identical responses may indicateduplicates.
IV. Examine response rate. n/a
Calculate response rate.
Discuss with district or school leaders if concerned about low response rate.
V. Edit and clean the data. n/a
Wait until all data are received before beginning editing the data.
Determine minimally complete cases and whether to keep or omit incompletecases.

Minnesota Department of Education Teacher Survey for Principal Development and Evaluation—12
Preparing and Analyzing Data Step Check When
Complete
Create new variables for each items (do not overwrite original variables) byassigning numerical values of 1 (not at all true) to 4 (very true) to responses;assign a special value (e.g., -99) to “not applicable” responses.
Calculate domain scores for each respondent by averaging responses acrossmultiple items in the same domain (do not count “not applicable” responses).
Save the file as new data file, but retain copy of original file.
VI. Analyze the data.
Calculate frequency statistics (i.e., counts and the percentages responses in eachresponse category) for each item.
Calculate descriptive statistics (i.e., means and standard deviations) for each itemand for each domain (do not count “not applicable” responses).
Calculate frequency statistics (i.e., counts and percentages of responses in eachresponse category) or descriptive statistics (i.e., means and standard deviations)for subgroups of interest.
Prepare tables or charts to present the findings.
13. How can the survey data be analyzed?
The analysis of any data produced by this survey is not intended to be difficult or time consuming, as the survey lends itself well to simple frequency counts and other descriptive analyses. In this survey, respondents are asked to indicate how true they thought each statement is (not at all true, a little true, mostly true, very true). In addition, respondents can select the not applicable option if the question does not apply to them or if they feel they do not have enough information to give an informed response. Basic data analysis includes calculating the frequency statistics (that is, the percentages or shares of responses in each response category). This is done by counting the number of respondents who selected each response choice for an item to obtain frequencies, and dividing these frequencies by the total number of responses to the item.
Another way to analyze the data is to assign numerical values of 1 (not at all true) to 4 (very true) to responses so a higher value is associated with a more positive rating. Note that the not applicable responses should not be assigned a numerical value and should not contribute to the item means. The responses then can be aggregated and compared in various ways. Two examples follow:
• The responses of all survey respondents to a particular item can be aggregated to obtaina “mean” score for that item. Then, one could compare the item means and identifyitems with relatively high means (indicating principals’ areas of strength) and items withrelatively low means (indicating principals’ areas of weakness).
• The responses of the same respondents to all items within a domain can be aggregated toobtain a mean score for that respondent on that domain. The domain scores of allrespondents in a school can then be averaged to obtain the principals’ scores on each
Minnesota Department of Education Teacher Survey for Principal Development and Evaluation—13
domain. Because ratings on a single item are more susceptible to erratic or random fluctuations (thereby lowering reliability) than summed ratings obtained from multiple items designed to measure the same underlying attribute, the domain scores provide a more reliable measurement of the principal performance measures than a single item can.
The frequencies and means also can be calculated for subgroups. For example, a district leader might want to know whether staff members in elementary schools answered differently from those in middle schools or high schools. Other ways to categorize the sample into subgroups may include analyzing responses of classroom teachers compared to other licensed staff, and new teachers compared to experienced teachers. The important thing is to think carefully about which subgroups are likely to be most meaningful to the school or district.
14. How can the survey findings be reported?
The goal of the reporting stage is to create easy-to-understand results from data analysis for the target users (e.g., principals or district superintendents), so that they can understand quickly and act upon the information. However, a few upfront decisions need to be made before presenting the data to the users. Two fundamental questions need to be asked: “To whom should the data be presented?” and “How much data should be presented to different users?” Depending on the answers to these questions, the format of the reports and delivery approaches may differ.
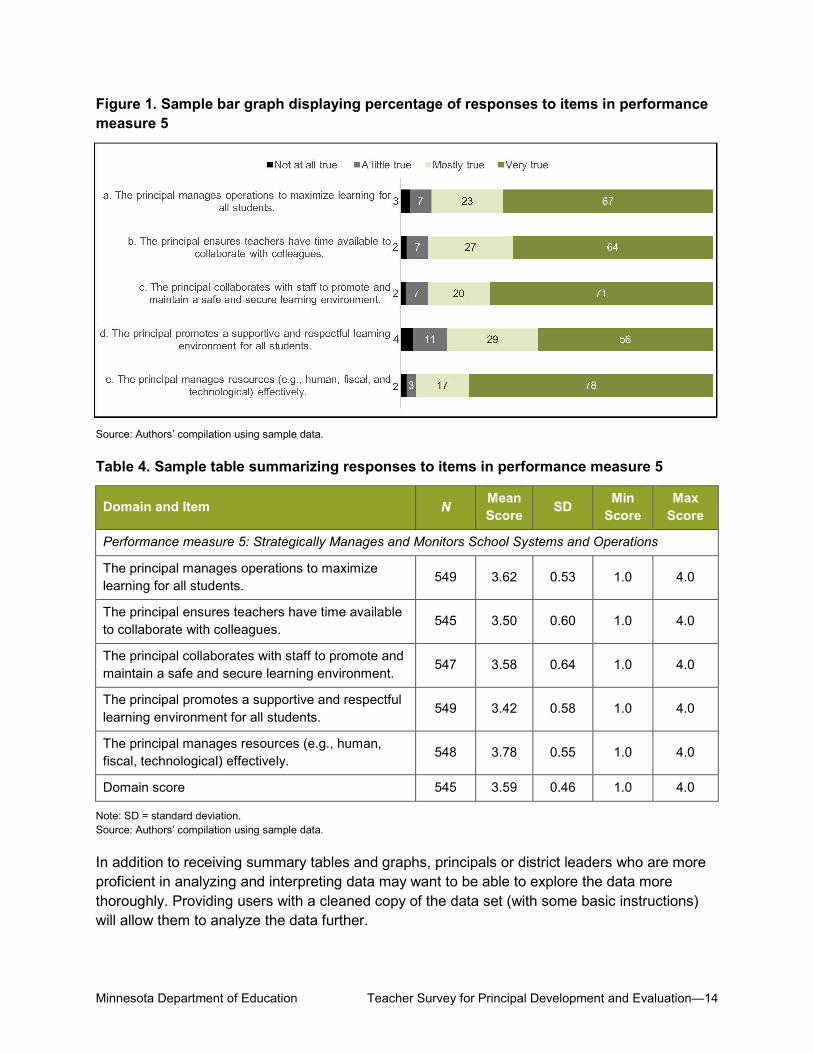
Simple tables, charts, and graphs can display and compare data effectively. An analysis using sample data—the percentage of teachers responding to individual items within performance measure 5—is presented in figure 1. This example shows the percentage of respondents that select responses for each item; a simpler alternative would be to display the combined percentages of mostly true and very true for each item. An analysis using sample data of item and domain means for the same performance measure is presented in table 4.
Minnesota Department of Education Teacher Survey for Principal Development and Evaluation—14
Figure 1. Sample bar graph displaying percentage of responses to items in performance measure 5
Source: Authors’ compilation using sample data.
Table 4. Sample table summarizing responses to items in performance measure 5
Domain and Item N Mean Score SD Min
Score Max
Score
Performance measure 5: Strategically Manages and Monitors School Systems and Operations
The principal manages operations to maximize learning for all students. 549 3.62 0.53 1.0 4.0
The principal ensures teachers have time available to collaborate with colleagues. 545 3.50 0.60 1.0 4.0
The principal collaborates with staff to promote and maintain a safe and secure learning environment. 547 3.58 0.64 1.0 4.0
The principal promotes a supportive and respectful learning environment for all students.
549 3.42 0.58 1.0 4.0
The principal manages resources (e.g., human, fiscal, technological) effectively. 548 3.78 0.55 1.0 4.0
Domain score 545 3.59 0.46 1.0 4.0
Note: SD = standard deviation. Source: Authors’ compilation using sample data.
In addition to receiving summary tables and graphs, principals or district leaders who are more proficient in analyzing and interpreting data may want to be able to explore the data more thoroughly. Providing users with a cleaned copy of the data set (with some basic instructions) will allow them to analyze the data further.
Minnesota Department of Education Teacher Survey for Principal Development and Evaluation—15
15. How can the survey results be interpreted and used in principalevaluations?
This step involves investigating patterns in the data, identifying strengths and weaknesses, and reflecting on how the data can guide future actions.
As they interpret the data, users should be reminded of the potential limitations (if there are any) due to a small number of responses or low response rates. Even if response rates were high, it is important not to draw conclusions based on small differences in item or domain average ratings. For instance, if one principal has an average rating of 3.6 on performance measure 1 one year and 3.4 the next year, it does not indicate a significant decline on their performance on this measure (nor would small differences between two principals be considered meaningful).
Based on results of the pilot test, the survey has good precision for the lower end of the scale and poorer precision at the high end (see appendix F for a summary of pilot test results). In other words, the instrument can do a good job of identifying principals with weak performance as reported by school staff, but it would not be a useful tool to sort out principals who are doing well versus those doing extremely well on these measures.
Principals can use the survey results to inform reflections and conversations about their professional development and growth. Principals should be encouraged to set aside sufficient time to review and reflect on the results. They many want to collaborate with a trusted colleague to help them think about how to use the results. Principals should be encouraged to focus on both areas of strength and opportunities for growth. They can use the data to identify strength areas and reflect on the two or three concrete things they do that contribute to their strength. Similarly, for each growth area pinpointed, they can identify two or three immediate next steps that they can take to improve in that area.
There are a number of strategies principals could use to identify areas for growth and focus their professional development efforts. A principal may choose to focus on the performance measure with the lowest domain score in the upcoming year, with special attention to the items with the lowest means within that domain or highest percentages of negative responses. Alternatively, a principal may identify and focus on the one item with the lowest ratings (lowest item mean or highest percentage of negative responses) within each performance measure, or the three to five items with the lowest ratings in the entire survey.
Minnesota Department of Education Teacher Survey for Principal Development and Evaluation—16
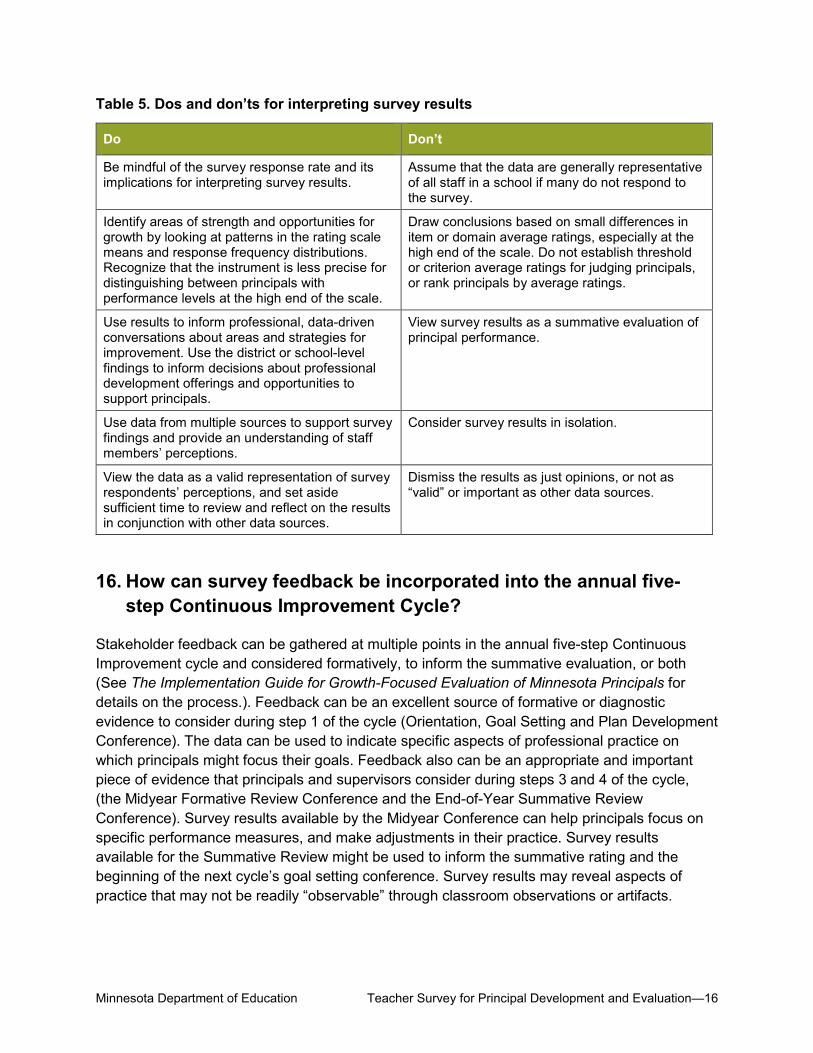
Table 5. Dos and don’ts for interpreting survey results
Do Don’t
Be mindful of the survey response rate and its implications for interpreting survey results.
Assume that the data are generally representative of all staff in a school if many do not respond to the survey.
Identify areas of strength and opportunities for growth by looking at patterns in the rating scale means and response frequency distributions. Recognize that the instrument is less precise for distinguishing between principals with performance levels at the high end of the scale.
Draw conclusions based on small differences in item or domain average ratings, especially at the high end of the scale. Do not establish threshold or criterion average ratings for judging principals, or rank principals by average ratings.
Use results to inform professional, data-driven conversations about areas and strategies for improvement. Use the district or school-level findings to inform decisions about professional development offerings and opportunities to support principals.
View survey results as a summative evaluation of principal performance.
Use data from multiple sources to support survey findings and provide an understanding of staff members’ perceptions.
Consider survey results in isolation.
View the data as a valid representation of survey respondents’ perceptions, and set aside sufficient time to review and reflect on the results in conjunction with other data sources.
Dismiss the results as just opinions, or not as “valid” or important as other data sources.
16. How can survey feedback be incorporated into the annual five-step Continuous Improvement Cycle?
Stakeholder feedback can be gathered at multiple points in the annual five-step Continuous Improvement cycle and considered formatively, to inform the summative evaluation, or both (See The Implementation Guide for Growth-Focused Evaluation of Minnesota Principals for details on the process.). Feedback can be an excellent source of formative or diagnostic evidence to consider during step 1 of the cycle (Orientation, Goal Setting and Plan Development Conference). The data can be used to indicate specific aspects of professional practice on which principals might focus their goals. Feedback also can be an appropriate and important piece of evidence that principals and supervisors consider during steps 3 and 4 of the cycle, (the Midyear Formative Review Conference and the End-of-Year Summative Review Conference). Survey results available by the Midyear Conference can help principals focus on specific performance measures, and make adjustments in their practice. Survey results available for the Summative Review might be used to inform the summative rating and the beginning of the next cycle’s goal setting conference. Survey results may reveal aspects of practice that may not be readily “observable” through classroom observations or artifacts.

Minnesota Department of Education Teacher Survey for Principal Development and Evaluation—17
Figure 2. Annual Five-Step Continuous Improvement Cycle
Survey feedback should be used to inform principals’ self-assessments, shape their goal-setting process, and demonstrate changes in their professional practice over time. Keep in mind that like all components of the development and evaluation process that require evidence, feedback from surveys is intended to act as one more piece of information to assist principals and supervisors in a comprehensive assessment, analysis, and realization of effective practice. For this reason, avoid assigning a weight or point value to survey results when calculating a summative rating. Rather, determine how survey feedback can inform and compliment the steps in the annual continuous improvement cycle. Survey results are not recommended for use in high-stakes contexts, such as personnel decisions.
Formative versus summative use of feedback relies on information that is timely and relevant. If feedback from surveys will play a formative role in the evaluation process by informing the self-assessment, goal setting, or principal plan development steps, districts should facilitate the collection of feedback shortly before any of these activities begin. Given a typical one-year cycle, most summative evaluations will occur at the end of a school year—therefore, self-assessment may start at the end of one year as principals reflect on their performance, and continue through the beginning of the next year as they set goals. As a result, survey feedback

Minnesota Department of Education Teacher Survey for Principal Development and Evaluation—18
used during the self-assessment, goal setting, or principal plan development steps is likely to be feedback collected toward the end of a school year.
Similarly, survey feedback used for summative purposes, whether to inform adjustments to practice at the formative assessment/evaluation or to serve as evidence of performance at the summative evaluation, should be collected and analyzed close to those steps of the development and evaluation cycle.
17. Who should own the data?
To the extent possible, give principals control over their own data. For example, the state of Virginia gives sole rights to survey data to the principal. The principal, however, must submit a summary of the data, for use with the principal’s supervisor in the continuous improvement cycle. In a 360-degree process used for growth and development, individuals will feel most invested in the process if they are able to choose when and with whom they share their survey feedback.
Districts should provide guidance on the best ways to share data so that it is constructive for everyone. It is also important not to exert subtle, unstated pressure to get people to share data when that may not be in their best interest.
If principals’ views are considered in the design of the survey process and they’re kept well informed throughout, it is less likely that they will feel that something is being done to them, rather than with them. A district needs to understand that this is a matter of respect, dignity, and fairness; principals should know who will have access to their feedback, how it will be used, and what ramifications it could have for their careers, if any.
Minnesota Department of Education Teacher Survey for Principal Development and Evaluation—19
References
Clifford, M., Behrstock-Sherratt, E., & Fetters, J. (2012). The Ripple Effect: A Synthesis of Research on Principal Influence to Inform Performance Evaluation Design. Washington, DC: American Institutes for Research. (ERIC ED530748)
Clifford, M., Menon, R., Gangi, T., Condon, C., & Hornung, K. (2012). Measuring School Climate for Gauging Principal Performance: A Review of the Validity and Reliability of Publicly Accessible Measures (Quality School Leadership Issue Brief). Washington, DC: American Institutes for Research. (ERIC ED531401)
Goe, L. (2007). The Link Between Teacher Quality and Student Outcomes: A Research Synthesis. Washington, DC: National Comprehensive Center for Teacher Quality.
Goldhaber, D. (2002). The Mystery of Good Teaching: Surveying the Evidence on Student Achievement and Teachers’ Characteristics. Education Next, 2(1), 50–55.
Hanushek, E. A., Kain, J. F., & Rivkin, S. G. (1998). Teachers, Schools and Academic Improvement (Working Paper 6691). Cambridge, MA: National Bureau of Economic Research.
Hallinger, P., & Heck, R. H. (1998). Exploring the Principal’s Contribution to School Effectiveness: 1980–1995. School Effectiveness and School Improvement, 9(2), 157–191.
Illinois State Board of Education. (2011). 2011 Teacher/Principal Evaluation Systems—Final Collection. Springfield, IL: Author. Retrieved from http://www.isbe.net/peac/pdf/survey/teacher_prin_eval_survey11_final.pdf
Leithwood, K., Harris, A., & Hopkins, D. (2008). Seven Strong Claims About Successful School Leadership. School Leadership and Management, 28, 27–42.
Leithwood, K., & Jantzi, D. (2005). A Review of Transformational School Leadership Research. Leadership and Policy in Schools, 4(3), 177–199.
Leithwood, K., Louis, K. S., Anderson, S., & Wahlstrom, K. (2004). How Leadership Influences Student Learning. Toronto, Canada: Center for Applied Research and Educational Improvement and Ontario Institute for Studies in Education.
Leithwood, K., Patten, S., & Jantzi, D. (2010). Testing a Conception of How School Leadership Influences Student Learning. Educational Administration Quarterly, 46(5), 671–706.
Liu, K., Springer, J., Stuit, D., Lindsay, J., & Wan, Y. (2014). The Utility of Teacher and Student Surveys in Principal Evaluations: An Empirical Investigation (REL 2015–047). Washington, DC: U.S. Department of Education, Institute of Education Sciences, National Center for Education Evaluation and Regional Assistance, Regional Educational Laboratory Midwest. Retrieved from http://ies.ed.gov/ncee/edlabs
Minnesota Department of Education Teacher Survey for Principal Development and Evaluation—20
Louis, K. S., Dretzke, B., & Wahlstrom, K. (2010). How Does Leadership Affect Student Achievement? Results from a National U.S. Survey. School Effectiveness and School Improvement, 21(3), 315–336.
Mattson Almanzán, H., Sanders, N., & Kearney, K. (2011). How Six States Are Implementing Principal Evaluation Systems. San Francisco: WestEd. (ERIC ED566127)
Minnesota Department of Education. (2014). Minnesota Principal Evaluation Model Pilot Study. Retrieved from http://www.fhi360.org/sites/default/files/media/documents/MN_SchoolLeadership_FinalReport_v5_WEB.pdf
National Conference of State Legislatures. (2011, November 15). State Approaches To Evaluating School Principal Effectiveness Webinar [Slide presentation]. Washington, DC: Author. Retrieved from http://www.ncsl.org/documents/educ/EvaluatingPrinpcipalEffecitvenessPowerPointSlides.pdf
Ohio Department of Education. (2011). Ohio Principal Evaluation System: Model Packet. Columbus, OH: Author. Retrieved from http://www.onetohio.org/library/Documents/OPES%20Model%20Final%20(3)09272011%20(2)_km-2.pdf
Roeber, E. (2011). Educator Evaluation—Models, Parameters, Issues, and Implementation. East Lansing, MI: Michigan Education Association. Retrieved from http://www.michiganassessmentconsortium.org/sites/default/files/MAC-Whitepaper-Roeber-Evaluation-Models.pdf
The New Teacher Project. (2012). The Indiana Evaluation Pilot: Mid-Year Report and Recommendations. Indianapolis: Indiana Department of Education. (ERIC ED566115)
Wacyk, L., Reeves, P., McNeill, P., & Zimmer, D. (2011, September). School ADvance: An Administrator Evaluation System. [Slide presentation]. Presented at the 2011 MASA Fall Conference, Lansing, MI. Retrieved from http://gomasa.org/sites/default/files/ADvance%20MASA%20presentation%20-%209-26.pptx
Wilson, S. M., Floden, R. E., & Ferrini-Mundy, J. (2001). Teacher Preparation Research: Current Knowledge, Gaps, and Recommendations. Seattle, WA: Center for the Study of Teaching and Policy. Retrieved from http://depts.washington.edu/ctpmail/PDFs/TeacherPrep-WFFM-02-2001.pdf
Wisconsin Educator Effectiveness Design Team. (2011). Preliminary Report and Recommendations. Retrieved from http://ee.dpi.wi.gov/files/ee/pdf/ee_report_prelim.pdf

Minnesota Department of Education Teacher Survey for Principal Development and Evaluation—21
Appendix A. What Does The Research Literature Say About Measuring Principal Effectiveness?
Research has shown that the most influential school-based factors affecting student achievement are teacher quality (Goldhaber, 2002; Hanushek, Kain, & Rivkin, 1998) and principal leadership (Hallinger & Heck, 1998; Leithwood & Jantzi, 2005; Leithwood et al., 2004). Principals are important engines of school change, and their leadership ability affects the learning environment, from teacher satisfaction to student achievement (Leithwood, Harris, & Hopkins, 2008; Leithwood, Patten, & Jantzi, 2010; Louis, Dretzke, & Wahlstrom, 2010). This line of research has created a paradigm shift in how policymakers view educator quality. Before these hallmark studies, policymakers based educator quality on whether an individual met a minimum set of criteria and possessed the necessary credentials (e.g., college degrees, Praxis scores, experience) to become a licensed teacher or principal. Research suggests, however, that little relationship exists between these minimum credentials and students’ academic achievement (Goe, 2007; Wilson, Floden, & Ferrini-Mundy, 2001). Although many states and districts maintain minimum standards for credentials, policymakers clearly have shifted their focus from qualifications to effectiveness. In line with this trend, education researchers and policymakers have been seeking ways to accurately and reliably measure teacher and principal effectiveness.
Improving the evaluation of principal performance is a priority for many states, including Minnesota. Many states have adopted new administrative rules, legislative codes, and state education policies on principal evaluation models and programs. These new models require districts to move beyond a single evaluation instrument to incorporate multiple performance measures, such as growth in student achievement, leadership competency assessments, and school climate surveys, to create a more complete picture of principal effectiveness (Clifford, Behrstock-Sherratt, & Fetters, 2012; Mattson Almanzán, Sanders, & Kearney, 2011; Minnesota Department of Education, 2014; Ohio Department of Education, 2011; Roeber, 2011; The New Teacher Project, 2012; Wisconsin Educator Effectiveness Design Team, 2011).
Policymakers’ and researchers’ calls for multiple-measure evaluation models have compelled many districts to search for new measures to add to their existing set of principal evaluation tools. Districts are particularly interested in exploring the use of incorporating teacher and student surveys for feedback about principals (Illinois State Board of Education, 2011; Mattson Almanzán, Sanders, & Kearney, 2011; National Conference of State Legislatures, 2011; Wacyk et al., 2011). Feedback surveys can provide rich information about a principal’s role in shaping school conditions that promote better teaching and learning (Clifford et al., 2012). One study found that two teacher survey measures—instructional leadership (measuring principal practices that focus on instruction and curriculum) and cultural press for excellence (measuring principal practices that help shape a culture of excellence and high expectations within the school)—showed significant incremental utility in explaining the across-school variance in student value-added achievement gains in mathematics and a composite of mathematics and reading (Liu et al., 2004).

Minnesota Department of Education Teacher Survey for Principal Development and Evaluation—22
Appendix B. Minnesota Principal Performance Measures and Indicators
PERFORMANCE MEASURE 1 Develops, Advocates for, and Enacts a Shared Vision for High Student Achievement
Supported by a Culture of High Expectations and Family Engagement
A. Develops and enacts a shared vision for high achievement and postsecondary success for all students
B. Identifies schoolwide priorities, establishes rigorous, measurable and aligned goals for student learning and implements a strategic plan to achieve those goals
C. Builds a sense of community where all students and adults are valued and fosters a shared commitment to high expectations for student and adult behaviors aligned to the vision
D. Develops cultural competence in school community and promotes responsiveness to both the resources and the biases connected to race, culture and diversity
E. Engages families and communities in the academic success of students
PERFORMANCE MEASURE 2
Provides Instructional Leadership for High Student Academic Performance
A. Ensures implementation of curricula and assessments aligned to college and career readiness standards
B. Supports teachers in implementing high-quality, effective classroom instructional strategies to meet diverse student learning needs, increase intellectual challenge, and drive increases in student achievement
C. Tracks and analyzes multiple forms of qualitative and quantitative student data to drive instructional and intervention strategies and to monitor the effectiveness of those strategies
D. Provides coherent systems of academic and social supports and services to meet the range of learning needs of each student
PERFORMANCE MEASURE 3 Develops and Maintains a High-Quality, Effective
Staff A. Implements a cohesive approach to recruiting, selecting, assigning, and retaining effective staff B. Facilitates high-quality professional learning for teachers and other staff C. Increases teacher and staff effectiveness through high-quality observations, actionable feedback,
coaching, and evaluation D. Selects, develops and supports a high-performing instructional leadership team with a diverse skill set
Minnesota Department of Education Teacher Survey for Principal Development and Evaluation—23
PERFORMANCE MEASURE 4 Demonstrates Ethical Personal Leadership Through Relationship Building, Effective
Communication, and Self-Reflection
A. Models appropriate personal, professional, and ethical behavior that is respectful and fair B. Maintains a relentless focus on student learning and demonstrates resiliency in the face of challenge C. Constructively manages and adapts to change and employs problem-solving strategies with the
ultimate goal of improving student achievement D. Demonstrates strong interpersonal communication and facilitation skills for multiple audiences. E. Models self-awareness, reflection, and ongoing learning
PERFORMANCE MEASURE 5 Strategically Manages and Monitors School Systems and Operations
A. Organizes and manages resources (e.g. time, money, technology) in alignment with school priorities and goals
B. Maintains a safe, secure and respectful learning environment for all students and adults C. Ensures the school is in compliance with local, state, and federal laws, standards, and regulations
and district initiatives
Minnesota Department of Education Teacher Survey for Principal Development and Evaluation—24
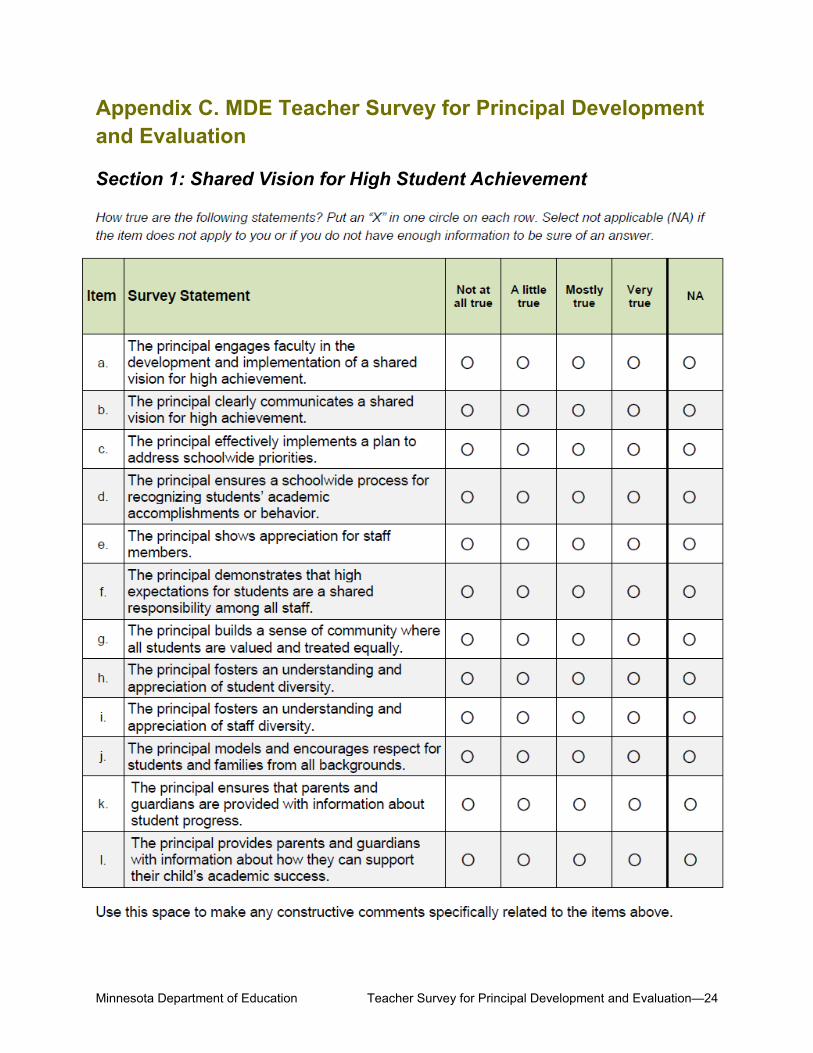
Appendix C. MDE Teacher Survey for Principal Development and Evaluation
Section 1: Shared Vision for High Student Achievement

Minnesota Department of Education Teacher Survey for Principal Development and Evaluation—25
Section 2: Instructional Leadership
Minnesota Department of Education Teacher Survey for Principal Development and Evaluation—26
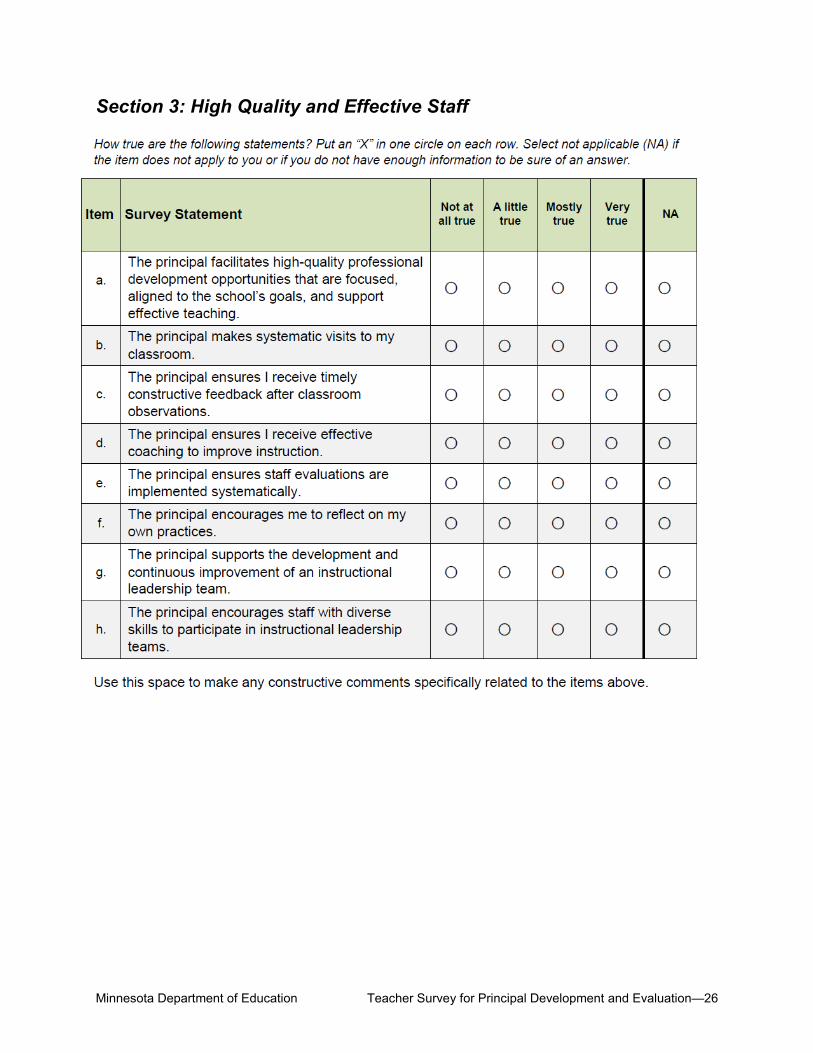
Section 3: High Quality and Effective Staff

Minnesota Department of Education Teacher Survey for Principal Development and Evaluation—27
Section 4: Personal Leadership

Minnesota Department of Education Teacher Survey for Principal Development and Evaluation—28
Section 5: Systems and Operations

Minnesota Department of Education Teacher Survey for Principal Development and Evaluation—29
Appendix D. Frequently Asked Questions About the Teacher Survey for Principal Development and Evaluation
How was this survey developed? The survey was developed by the Minnesota Department of Education (MDE), in partnership with Regional Educational Laboratory (REL) Midwest survey development and content experts, and by a team of Minnesota principals, superintendents, teachers, and teacher and school administrator association representatives. The survey items were designed to align with the MDE principal performance measures and indicators, and the items were reviewed and tested with stakeholders across the state.
Why was this survey developed? Minnesota statute allows surveys to be used to collect stakeholder feedback as part of the principal evaluation process. Since no existing survey was well aligned to MDE principal performance measures, this survey was created as an option for districts looking for a relevant instrument to collect teachers’ feedback about principals’ performance.
How will the results be used? Summary data across all survey respondents in a school will be shared with the principals as part of their evaluation process. All responses will be confidential. The data will be used by the principals to reflect on their strengths and weaknesses from their staff’s point of view and set goals for the future. The survey data will be one of many forms of information and feedback that contribute to a principal’s development and evaluation process.
Is this survey or any other stakeholder feedback required by Minnesota? Statute requires that annual evaluations “must allow surveys to help identify a principal’s effectiveness, leadership skills and processes, and strengths and weaknesses in exercising leadership in pursuit of school success.” Although surveys are not required to be a factor in a summative evaluation, districts should plan to use surveys as a formative tool in the development and evaluation process. The statute does not identify a particular survey or stakeholder groups to be surveyed.
Minnesota Department of Education Teacher Survey for Principal Development and Evaluation—30
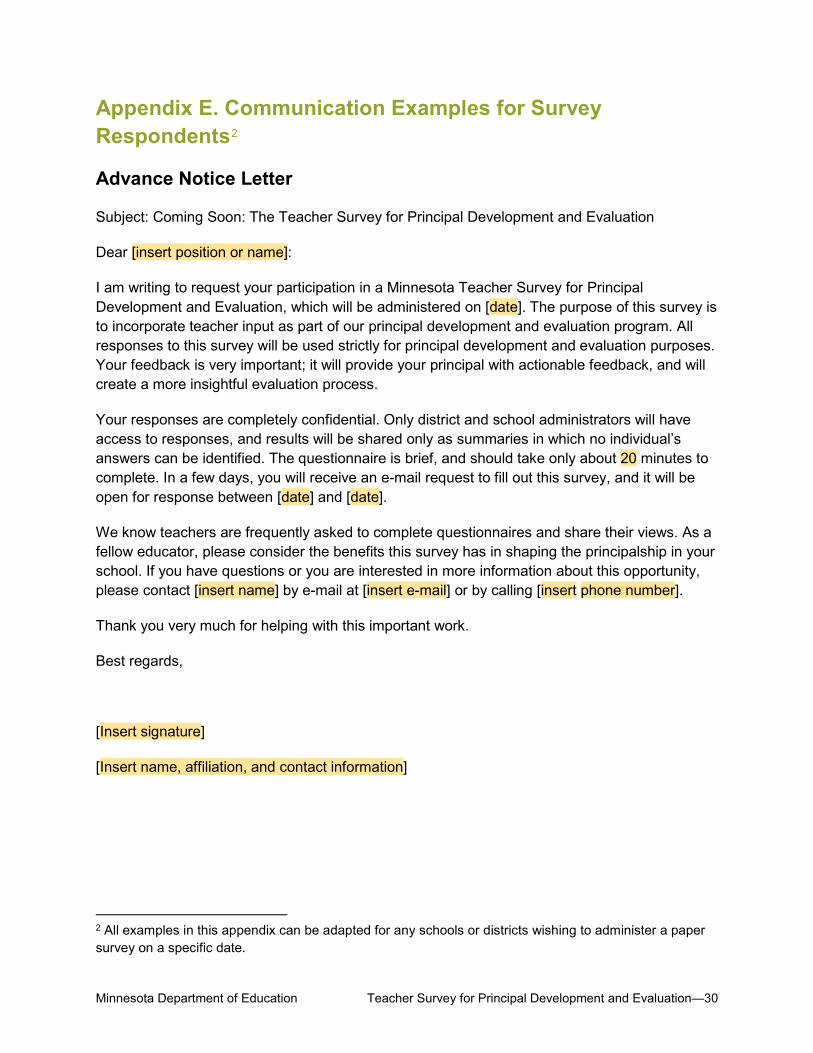
Appendix E. Communication Examples for Survey Respondents2
Advance Notice Letter
Subject: Coming Soon: The Teacher Survey for Principal Development and Evaluation
Dear [insert position or name]:
I am writing to request your participation in a Minnesota Teacher Survey for Principal Development and Evaluation, which will be administered on [date]. The purpose of this survey is to incorporate teacher input as part of our principal development and evaluation program. All responses to this survey will be used strictly for principal development and evaluation purposes. Your feedback is very important; it will provide your principal with actionable feedback, and will create a more insightful evaluation process.
Your responses are completely confidential. Only district and school administrators will have access to responses, and results will be shared only as summaries in which no individual’s answers can be identified. The questionnaire is brief, and should take only about 20 minutes to complete. In a few days, you will receive an e-mail request to fill out this survey, and it will be open for response between [date] and [date].
We know teachers are frequently asked to complete questionnaires and share their views. As a fellow educator, please consider the benefits this survey has in shaping the principalship in your school. If you have questions or you are interested in more information about this opportunity, please contact [insert name] by e-mail at [insert e-mail] or by calling [insert phone number].
Thank you very much for helping with this important work.
Best regards,
[Insert signature]
[Insert name, affiliation, and contact information]
2 All examples in this appendix can be adapted for any schools or districts wishing to administer a paper survey on a specific date.

Minnesota Department of Education Teacher Survey for Principal Development and Evaluation—31
Teacher Invitation With Survey Link (if online)
Subject: The Teacher Survey for Principal Development and Evaluation
Dear Survey Participant,
Thank you for taking part in the Teacher Survey for Principal Development and Evaluation. The results of this survey will be used for the purposes of principal development and evaluation. Your responses will be kept completely confidential. Individual responses will not be provided to any party. All survey results will be reported only in statistical summaries that ensure that individuals cannot be identified.
Your responses will be transferred to the district office. Your participation is completely voluntary and you can stop at any time.
Please complete the following survey at your earliest convenience. To begin, select the link below, and when prompted, enter the username and password provided below.
[Insert link]
[Insert username and password]
The survey will remain open through [date]. You will be able to save your work and complete the survey in more than one session, if necessary.
If you have any questions or would like more information about the survey, you may contact [insert name] by e-mail at [insert e-mail address] or by calling [insert phone number]. If you experience any technical difficulties with the survey, please contact [insert name] at [insert e-mail address].
Thank you! Your time and willingness to complete the survey are greatly appreciated.
Sincerely,
[Insert signature]
[Insert name, affiliation, and contact information]

Minnesota Department of Education Teacher Survey for Principal Development and Evaluation—32
Follow-Up E-mail or Communication (if online)
Subject: Reminder: Please complete the Teacher Survey for Principal Development and Evaluation
Recently, I sent you an invitation to complete a survey on principal leadership conducted by the [district or school name]. If you already have completed the survey, thank you. Your opinion is very valuable to us, and your time will be greatly appreciated. If you have not completed the survey yet, please do so. The deadline for filling out and submitting the survey is [date].
Please follow the link below to complete the survey.
[Insert link]
[Insert username and password]
If you have any questions or would like more information about the study, you may contact [insert district contact name and e-mail].
Sincerely,
[Insert signature]
[Insert name, affiliation, and contact information]
Minnesota Department of Education Teacher Survey for Principal Development and Evaluation—33
Appendix F. Summary of Pilot Survey Results
A version of the survey that was similar to the final survey presented in appendix B was pilot tested in January 2016. This appendix summarizes the results of that pilot test, which informed revisions to create the final survey.
• Respondents’ average ratings on the survey items were high. School-level domain scores did not differ significantly by school size, charter status, or grade-level. Teacher-level domain scores did not vary by grade level taught. There were some statistical differences by respondent’s type.
o A larger proportion of nonteachers than classroom teachers selected the “not sure” option, and teachers new to their schools were more likely to select the “not sure” option than teachers with more experience.
o Teachers provided significantly lower ratings than nonteachers on all five domains.
o Respondents with 0 to 2 years of experience at their current schools rated their principals higher on performance measures 1 and 4.
o Respondents from charter schools also had significantly higher ratings on performance measures 1 and 4 than respondents from traditional public schools.
o Principals in rural schools had relatively low ratings.
• The survey items measure five distinct domains of principal leadership corresponding to MDE’s principal performance measures. The reliability of both respondent-level and school-level scores for each performance measure was estimated.
o Respondent-level reliability indicates how well a measure can be used to assess individual differences among respondents on that measure. School-level reliability indicates how well a measure can be used to distinguish among principals in their average levels on the measure. The higher the school-level reliability, the more consistently the measure distinguishes principals with low scores from principals with high scores. Respondent-level internal consistency of reliability was estimated by calculating Cronbach’s alpha, using criterion of 0.70 as the benchmark for acceptable internal consistency reliability. Cronbach’s alpha assesses the extent to which survey items used in the same domain correlate with each other. Respondent-level reliability ranged from 0.87 to 0.97, indicating that each set of survey items consistently measures a single underlying principal leadership domain and can be used to consistently assess individual differences between respondents.
o To determine school-level reliability, the intraclass correlation coefficient (ICC) for each domain was first estimated and then incorporated into the Spearman-Brown prediction formula to calculate school-level reliability for each domain. ICCs account for the similarity of responses among individuals from the same school and the value of the ICC represents the proportion of variability in responses that results from differences among schools. The estimated school-level reliabilities for the domains, with approximately 22 respondents per school, ranged from 0.83 to 0.89 (table F-1).

Minnesota Department of Education Teacher Survey for Principal Development and Evaluation—34
Because school-level reliability also is determined by the number of respondents in each school, a range of reliability values corresponding to different school sample sizes also is included in table F-1. This result suggests that, with a sample of approximately 20 staff members in a school, all five measures are reliable when aggregated to the school level. With school sample sizes of 10 staff members, however, school-level reliability for performance measures 2 and 3 falls below 0.70.
Table F-1. Summary of school-level scores and reliability
Domain N Mean score SD Min
score Max
score ICC
Reliability: by number of respondents per school (k)
k = 22 (average
in the study)
k = 10 k = 30 k = 50 k = 100 k = 200
Performance measure 1 25 3.55 0.32 2.37 3.93 0.23 0.87 0.75 0.90 0.94 0.97 0.98
Performance measure 2 25 3.42 0.34 2.35 3.80 0.18 0.83 0.68 0.87 0.92 0.96 0.98
Performance measure 3 25 3.39 0.33 2.51 3.79 0.18 0.83 0.69 0.87 0.92 0.96 0.98
Performance measure 4 25 3.54 0.36 2.32 3.90 0.26 0.89 0.78 0.91 0.95 0.97 0.99
Performance measure 5 25 3.51 0.33 2.51 3.84 0.23 0.87 0.75 0.90 0.94 0.97 0.98
Note: Only respondents who had no missing data on the performance measure indicators were included. SD = standard deviation; ICC = intraclass correlation. Source: Authors’ analysis of the pilot survey data.
• The survey has good precision for the lower end of the scale and poor precision at the high end. The respondent-level and school-level reliability indexes defined previously are helpful in characterizing the survey’s average reliability. Such indexes assume errors of measurement to be constant across the trait scores distribution. However, item response theory (IRT) analyses makes it clear that the amount of error is not uniform across the distribution of scores. IRT uses the concept of item and test information to replace reliability and shows the degree of precision at different values of the trait. High information corresponds to high precision. IRT analysis of the pilot survey data showed that, for all five domains, as the latent score for the domain approaches the higher end of the scale, the amount of test information decreases significantly. Thus, latent scores for the domains are estimated with good precision in the lower ends and rather poorly on the higher ends. This suggests that the survey may not contain questions to assess or distinguish the highest-scoring individuals. In other words, the instrument does a good job of identifying principals with weak performance as reported by their teachers, but it would not be a useful tool to sort out principals who are doing well versus those doing extremely well on these measures.