teachers retirement association of minnesota a … · investments, in order to meet its ... in...
TRANSCRIPT

Teachers Retirement Association of Minnesota A Pension Trust Fund of the State of Minnesota
Investments

52 | Investments
State Board of Investment Letter
MINNESOTA STATE BOARD OF INVESTMENT
Board Members Governor Mark Dayton State Auditor Rebecca Otto Secretary of State Steve Simon Attorney General Lori Swanson Executive Director & Chief Investment Officer Mansco Perry
60 Empire Drive Suite 355
St. Paul, MN 55103 (651) 296-3328
FAX (651) 296-9572 E-mail:
[email protected] www.sbi.state.mn.us
An Equal Opportunity Employer
INVESTMENT AUTHORITY
The assets of the Minnesota Teachers Retirement Association (TRA) are invested along with the assets of the Minnesota Public Employees Retirement Association and the Minnesota State Retirement System under the direction and authority of the State Board of Investment (SBI) in accordance with Minnesota Statutes, Chapters 11A and 356A. The SBI includes Minnesota's governor, auditor, secretary of state and attorney general. The Legislature has established a 17-member Investment Advisory Council (IAC) to advise the SBI and its staff on investment related matters. I'RA's executive director is a member of the IAC.
INVESTMENT POLICY
Investment policy states that the SBI will operate within standard investment practices of the prudent person. The SBI is to "exercise that degree of judgment and care, under circumstances then prevailing, which persons of prudence, discretion, and intelligence exercise in the management of their own affairs, not for speculation, but for investment, considering the probable safety of their capital as well as the probable income to be derived therefrom." (See M.S., section 11A.09.) The SBI is authorized to own government obligations, corporate obligations, various short-term obligations, corporate stocks, venture capital interests, resource investments, and real estate interests subject to specific constraints. (See M.S., section 11A.24.) In particular, pension fund assets are to be invested for the exclusive benefit of the members of the fund.
INVESTMENT OBJECTIVES AND PERFORMANCE
TRA's pension contributions from employees and employers are invested in the Combined Funds. The Combined Funds include the assets of active and retired public employees who participate in the defined benefit plans administered by TRA, the Minnesota State Retirement System, and the Public Employees Retirement Association. TRA does not own any underlying assets, but instead owns a participation in the pooled Combined Funds. Because these assets normally accumulate for thirty to forty years, SBI's objective is to take advantage of the long investment time horizon offered by equities and alternative assets in order to meet its actuarial return target and ensure that sufficient funds are available to finance promised benefits at the time of retirement. The 2012 legislature lowered the actuarial return assumption from 8.5 percent to 8.0 percent annually for the period July 1, 2012 through June 30, 2017.

Investments | 53
The long term objectives of the Combined Funds are:
• Provide returns that are 3-5 percentage points greater than inflation over the latest 20-year period; and
• Outperform a composite market index weighted in a manner that reflects the actual asset mix of the Combined Funds over the latest 10-year period.
Consistent with these objectives, the SBI maintains a long-term asset allocation for the Combined Funds as follows:
• Domestic Equity 45% • International Equity 15% • Alternatives 20% • Fixed Income 18% • Cash 2%
Based on values on June 30, 2016, the Combined Funds returned 5.3 percentage points above the CPI over the last 20 years and returned 0.2 percentage point above the composite index over the past 10 years. Investment returns ranked in the 28th percentile over the past five years and in the 22nd percentile over the past 10 years, compared to similar funds in the Trust Universe Comparison Service.
INVESTMENT PRESENTATION
Investment returns were prepared using time-weighted rate of return methodology based upon fair market value, net of investment expenses.
Respectfully submitted,
Mansco Perry III Executive Director Minnesota State Board of Investment
54 | Investments
Investment Summary Prepared by TRA management with data obtained from the State Board of Investment’s Fiscal Year 2016 Quarterly Investment Reports
The assets of the Minnesota Teachers Retirement Association (TRA) are invested under the direction and authority of the State Board of Investment (SBI). The investment portfolio of TRA had a fair value of approximately $19.4 billion as of June 30, 2016.
The four-member SBI Board consists of Governor Mark Dayton (Chair), Attorney General Lori Swanson, Secretary of State Steve Simon, and State Auditor Rebecca Otto.
The Legislature has established a 17-member Investment Advisory Council (IAC) to advise the SBI and its staff on investment-related matters.
The mission statement of the Investment Advisory Council is: The IAC fulfills its statutory duty to the SBI by providing advice and independent due diligence review of the investment policy and implementation recommendations that guide the SBI’s investment of assets.
SBI appoints ten members experienced in finance and investment. These members traditionally have come from the Minneapolis and Saint Paul corporate investment community.
The Commissioner of Minnesota Management and Budget (MMB) and the executive directors of TRA, the Minnesota State Retirement System and the Public Employees Retirement Association are permanent members of the Council.
Two active employee representatives and one retiree representative are appointed to the Council by the Governor.
All proposed investment policies are reviewed by the full Council before they are presented to SBI for action.
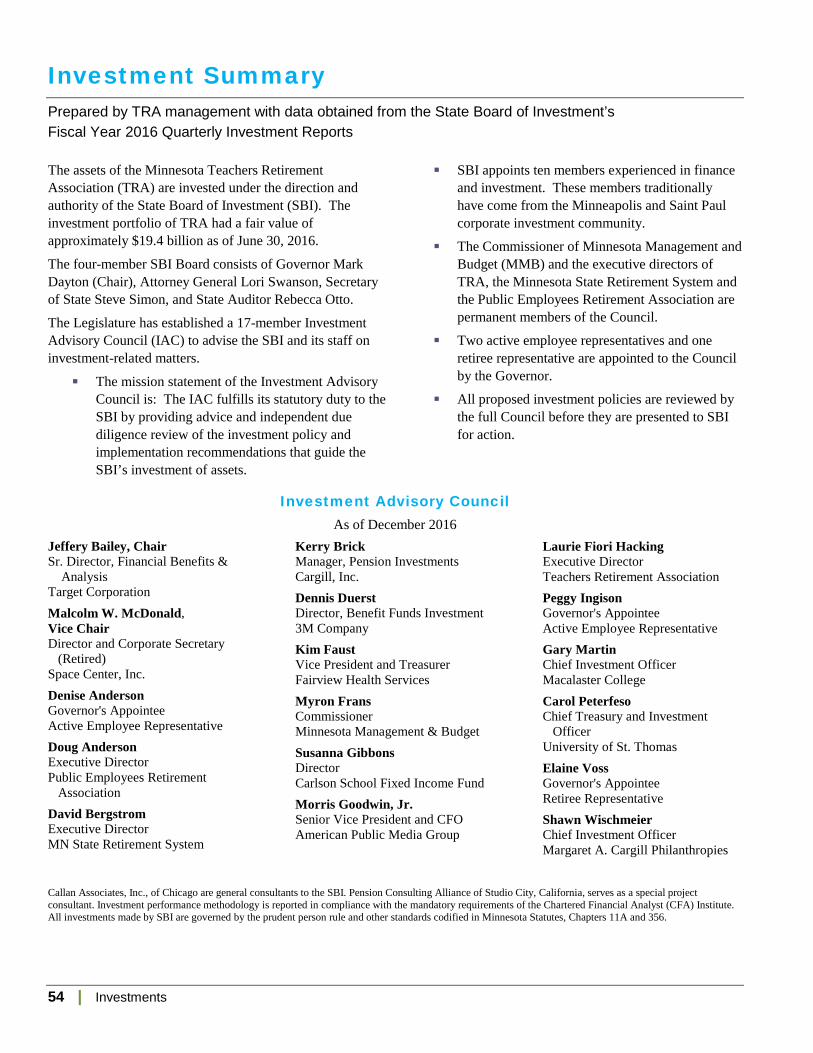
Investment Advisory Council As of December 2016
Jeffery Bailey, Chair Sr. Director, Financial Benefits & Analysis Target Corporation Malcolm W. McDonald, Vice Chair Director and Corporate Secretary (Retired) Space Center, Inc. Denise Anderson Governor's Appointee Active Employee Representative Doug Anderson Executive Director Public Employees Retirement Association David Bergstrom Executive Director MN State Retirement System
Kerry Brick Manager, Pension Investments Cargill, Inc. Dennis Duerst Director, Benefit Funds Investment 3M Company Kim Faust Vice President and Treasurer Fairview Health Services Myron Frans Commissioner Minnesota Management & Budget Susanna Gibbons Director Carlson School Fixed Income Fund Morris Goodwin, Jr. Senior Vice President and CFO American Public Media Group
Laurie Fiori Hacking Executive Director Teachers Retirement Association Peggy Ingison Governor's Appointee Active Employee Representative Gary Martin Chief Investment Officer Macalaster College Carol Peterfeso Chief Treasury and Investment Officer University of St. Thomas Elaine Voss Governor's Appointee Retiree Representative Shawn Wischmeier Chief Investment Officer Margaret A. Cargill Philanthropies
Callan Associates, Inc., of Chicago are general consultants to the SBI. Pension Consulting Alliance of Studio City, California, serves as a special project consultant. Investment performance methodology is reported in compliance with the mandatory requirements of the Chartered Financial Analyst (CFA) Institute. All investments made by SBI are governed by the prudent person rule and other standards codified in Minnesota Statutes, Chapters 11A and 356.

Investments | 55
Combined Retirement Funds Investment Objectives All TRA assets are accounted for within the Combined Funds managed by the Minnesota State Board of Investment (SBI). The Combined Funds consist not only of the TRA Fund, but also the assets of the Public Employees Retirement Association (PERA) and the Minnesota State Retirement System (MSRS). The SBI has one primary responsibility with respect to its management of the Combined Funds: to ensure that sufficient funds are available to finance pension benefits at the time of retirement. All assets in the Combined Funds, including TRA, are managed externally by outside money management firms retained by contract.
The Combined Funds include the pension contributions of most Minnesota public employees, including TRA members, during their working years. Employee and employer contribution rates are specified in state law as a percentage of an employee’s salary. The rates are set so that contributions plus expected investment earnings cover the projected cost of promised pension benefits. In order to meet these projected pension costs, the Combined Funds need to generate investment returns of at least 8.0 percent for fiscal years 2013 through 2017.
While an active member is working, employee and employer contributions are placed into the TRA Fund. The pre-funding of future pension benefits provides the SBI with a long investment time horizon to take advantage of long run return opportunities offered by equities and other investments, in order to meet its actuarial return target.
SBI measures the performance of the Combined Funds relative to a composite of market indices that is weighted in a manner that reflects their long-term asset allocation policy. The Combined Funds are expected to match or exceed the composite index over a ten-year period. The Combined Funds are also expected to generate returns 3 to 5 percent greater than inflation over the latest 20-year period. Investment returns are prepared using a time-weighted rate of return methodology, based upon fair value, net of investment expenses. Performance is measured net of all fees and costs to assure that SBI’s focus is on the Combined Funds’ true net return.
Asset Allocation The allocation of assets among equities, fixed income (bonds) and alternative investments can have a dramatic impact on investment results. In fact, asset allocation decisions overwhelm the impact of individual security selection within a total portfolio. Consequently, SBI focuses considerable attention on the selection of an appropriate long-term asset allocation policy for the Combined Funds.
Total Return Vehicles SBI invested the majority of the Combined Funds’ assets in common stocks (both domestic and international equities) and other equity investments. A large allocation is consistent with the long investment time horizon of the Combined Funds and the advantageous long-term risk-return characteristics of common stocks. Including international equities in the asset mix allowed SBI to diversify its holdings across world markets, offered the opportunity to enhance returns and reduced the risk/volatility of the total portfolio. The rationale underlying the inclusion of private equity alternative assets (e.g., venture capital) is similar.
SBI recognized that this sizable policy allocation to common stock and private equity likely produced more volatile portfolio returns than a more conservative policy focused on fixed income securities. It is understood that this policy may result in quarters or even years of disappointing results. Nevertheless, the long run return benefits of this policy are expected to compensate for the additional volatility.
Diversification Vehicles Other asset classes are included in the Combined Funds both to provide some insulation against highly inflationary or deflationary environments and to diversify the portfolio sufficiently to avoid excessive return volatility.
Real estate and resource (oil and gas) investments provide an inflation hedge that other financial assets do not offer. Under more normal financial conditions, such as low to moderate inflation, the returns on these assets were not highly correlated with common stocks. As a result, their inclusion in the Combined Funds served to dampen return volatility.
Yield oriented alternative investments provided the opportunity for higher long-term returns than those typically available from bonds yet still generated sufficient current income. Typically, these investments, including
56 | Investments
subordinated debt, mezzanine or resource income investments such as income-producing properties, are structured more like fixed income securities with the opportunity to participate in the appreciation of the underlying assets. While these investments may have an equity component, they display a return pattern more like a bond. As such, they helped reduce the volatility of the total portfolio, while generating higher returns relative to more traditional bond investments.
The allocation to fixed income (bonds) acts as a hedge against a deflationary economic environment. In the event of a major deflation, high-quality fixed income assets, particularly long-term bonds, are expected to protect principal and generate significant capital gains. And, like real estate and resource funds, under normal financial conditions, bonds help diversify the Combined Funds and thereby control return volatility.
Rate of Return Results The Combined Funds produced a total rate of return for fiscal year 2016 of -0.1 percent. Over the last five years, the Combined Funds generated an annualized return of 7.7 percent.
As stated earlier, the Combined Funds are expected to exceed the return of a composite of market indices over a ten-year period. Performance relative to this standard measured two effects:
The ability of the investment managers selected by SBI, in aggregate, to add value to the returns available from the broad capital markets.
The impact of SBI’s rebalancing activity. (SBI rebalances the total fund when market movements take the stock or bond segments measurably above or below their long-term asset allocation targets. The policy imposes a low risk, buy low sell high discipline among asset classes on a total fund basis.)
Combined Funds Performance vs. Composite Index
For the ten-year period ending June 30, 2016, the Combined Funds exceeded the composite index investment performance by 0.2 percent annualized. The Funds exceeded the composite index over the last five years by 0.1 percent annualized, and underperformed the index over the most recent fiscal year by 1.2 percentage points. Actual returns relative to the total fund composite index over the last five years are shown in the graph on the following page.

Investments | 57
Combined Funds
Investment Performance Combined Funds Performance vs. Composite Index FY 2012 – 2016
Combined Funds Performance of Asset Pools (Net of Fees) June 30, 2016 — Combined Funds Rates of Return (Annualized) FY 2016 3-Year 5-Year 10-Year
Domestic Equity Pool ....................................................... 0.0% 10.7% 11.2% 7.2%
Asset Class Target ........................................................ 2.1% 11.1% 11.6% 7.4% (Russell 3000 – effective 10-1-03)
Fixed Income (Bond) Pool ................................................ 5.9% 4.3% 4.3% 5.4%
Asset Class Target ........................................................ 6.0% 4.1% 3.8% 5.1% (Barclays Capital Aggregate Bond Index)
International Equity Pool ................................................. -9.7% 1.8% 0.9% 2.4%
Asset Class Target ........................................................ -10.2% 1.2% 0.1% 1.9% (Morgan Stanley Capital International All-Country World Index – since 10-1-03)
Alternative Assets ............................................................. 0.2% 8.6% 9.4% 9.6% (Real Estate, Private Equity, Resource Pool and Yield Oriented Pool)
CPI-U Inflation (No Established Index for Alternative Assets) 1.0% 1.1% 1.3% 1.7%
All investment performance methodology is reported in compliance with the mandatory requirements of the Chartered Financial Analyst (CFA) Institute.
58 | Investments
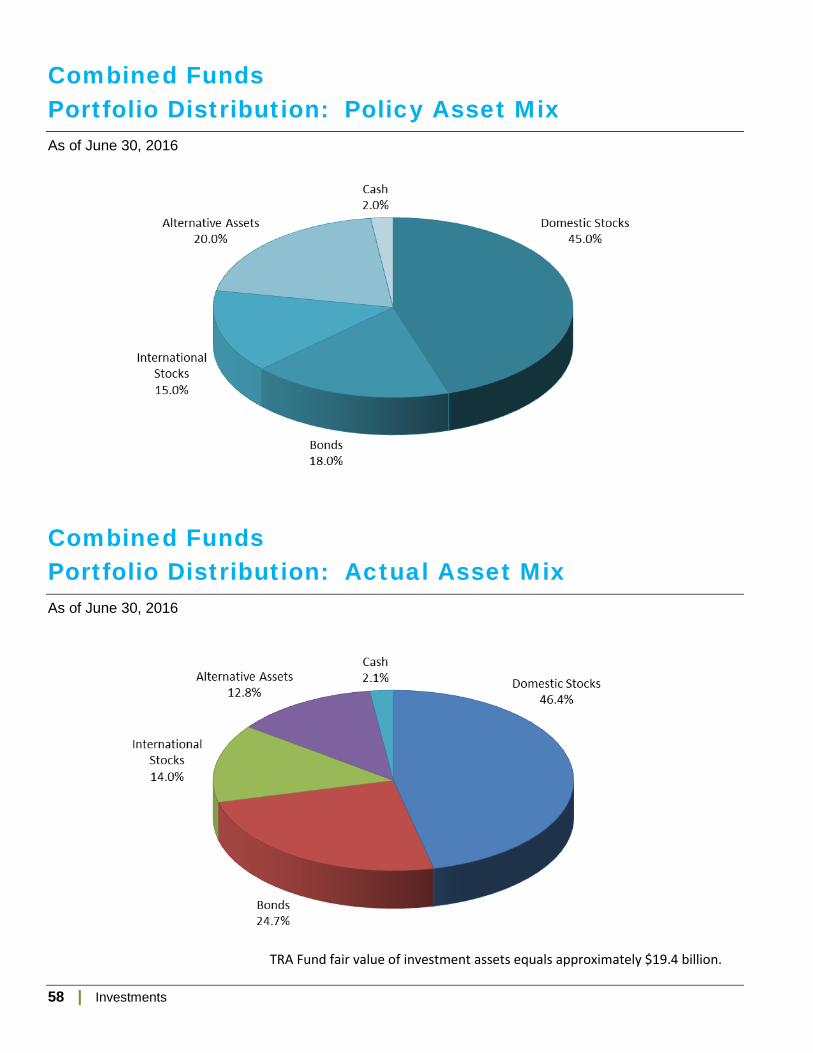
Combined Funds Portfolio Distribution: Policy Asset Mix As of June 30, 2016
Combined Funds Portfolio Distribution: Actual Asset Mix As of June 30, 2016
TRA Fund fair value of investment assets equals approximately $19.4 billion.

Investments | 59
Teachers Retirement Fund List of Largest Assets Held June 30, 2016 Composite Holdings of Top Ten Equities By Fair Value
Security $ Fair Value
(Millions) % of
Portfolio
Apple Inc $ 182.8 .94 Microsoft Corp $ 141.6 .73 Johnson + Johnson $ 126.6 .65
Exxon Mobil Corp $ 125.0 .64 Amazon.com Inc $ 116.6 .60 Facebook Inc A $ 116.5 .60 JPMorgan Chase + Co $ 98.5 .51
Pfizer Inc $ 94.6 .49 Wells Fargo + Co $ 92.0 .47 General Electric Co W/D $ 88.8 .46
Composite Holdings of Top Ten Bond Holdings By Fair Value
Security %
Coupon $ Fair Value
(Millions) % of
Portfolio
FNMA TBA 30 YR 3.5 3.5 $ 46.9 .24 FNMA TBA 30 YR 4 4.0 $ 46.8 .24 US TREASURY N/B 1.375 $ 42.9 .22 US TREASURY N/B 2.5 $ 41.5 .21 US TREASURY N/B 0.875 $ 39.5 .20 US TREASURY N/B 0.625 $ 37.9 .20 US TREASURY N/B 1.375 $ 36.4 .19 US TREASURY N/B 1.5 $ 34.6 .18 US TREASURY N/B 1.375 $ 33.7 .17 FNMA TBA 30 YR 3 3.0 $ 31.4 .16
TRA’s assets are commingled in various pooled investment accounts administered by the State Board of Investment (SBI). TRA does not own specific values of the underlying assets. The percentages and fair value shown are those attributable to the TRA Fund based on TRA’s participation in the SBI’s Combined Funds. Information on investment activity, a listing of specific investments owned by the pooled accounts and a schedule of fees and commissions can be obtained from SBI.

60 | Investments
Teachers Retirement Fund Schedule of Investment Management Fees For the Fiscal Year Ended June 30, 2016
Domestic Activity Equity Pool Managers Barrow, Hanley ....................................................................................................... $ 502,305 Earnest Partners ....................................................................................................... 327,899 Goldman Equity ...................................................................................................... 634,269 Hotchkis and Wiley ................................................................................................. 630,302 Intech Investment .................................................................................................... 597,782 Jacobs Levy Equity ................................................................................................. 650,022 LSV Asset ............................................................................................................... 807,526 Martingale ............................................................................................................... 511,723 Mckinley Cap .......................................................................................................... 704,855 Next Century Growth .............................................................................................. 659,877 Peregrine Capital ..................................................................................................... 697,704 Sands Capital ........................................................................................................... 591,975 Systematic Fin ......................................................................................................... 463,560 Winslow Capital ...................................................................................................... 325,779 Zevenbergen Capital ................................................................................................ 642,898 Total Domestic Activity Equity Pool Managers $ 8,748,476
Passive Domestic Equity Pool Managers Blackrock ................................................................................................................. $ 288,897 Total Passive Domestic Equity Pool Managers ............................................................... $ 288,897
Semi Passive Equity Pool Managers Blackrock ................................................................................................................. $ 782,931 Intech ....................................................................................................................... 725,191 JP Morgan ............................................................................................................... 939,945 Mellon Capital ......................................................................................................... 786,234 Total Semi Passive Equity Pool Managers ..................................................................... $ 3,234,301
Domestic Bonds Pool Managers Aberdeen Asset Management .................................................................................. $ 603,592 Blackrock Financial Mgmt ...................................................................................... 363,464 Columbia Invest ...................................................................................................... 391,555 Dodge & Cox ........................................................................................................... 547,779 Goldman .................................................................................................................. 607,041 Neuberger ................................................................................................................ 260,638 PIMCO .................................................................................................................... 1,120,200 Western Asset Management .................................................................................... 509,203 Total Domestic Bonds Pool Managers ........................................................................... $ 4,403,472
Page Subtotal .................................................................................................................. $ 16,675,146
Investments | 61
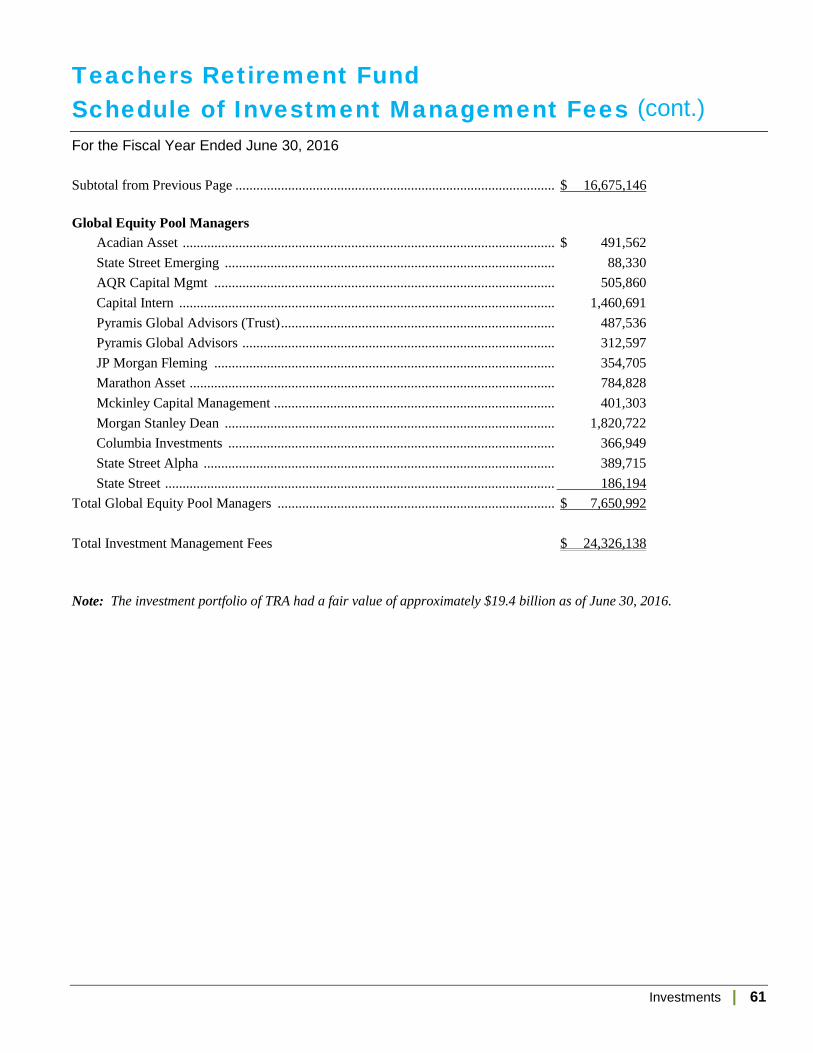
Teachers Retirement Fund Schedule of Investment Management Fees (cont.) For the Fiscal Year Ended June 30, 2016 Subtotal from Previous Page ........................................................................................... $ 16,675,146 Global Equity Pool Managers Acadian Asset .......................................................................................................... $ 491,562 State Street Emerging .............................................................................................. 88,330 AQR Capital Mgmt ................................................................................................. 505,860 Capital Intern ........................................................................................................... 1,460,691 Pyramis Global Advisors (Trust) .............................................................................. 487,536 Pyramis Global Advisors ......................................................................................... 312,597 JP Morgan Fleming ................................................................................................. 354,705 Marathon Asset ........................................................................................................ 784,828 Mckinley Capital Management ................................................................................ 401,303 Morgan Stanley Dean .............................................................................................. 1,820,722 Columbia Investments ............................................................................................. 366,949 State Street Alpha .................................................................................................... 389,715 State Street ............................................................................................................... 186,194 Total Global Equity Pool Managers ............................................................................... $ 7,650,992 Total Investment Management Fees $ 24,326,138 Note: The investment portfolio of TRA had a fair value of approximately $19.4 billion as of June 30, 2016.
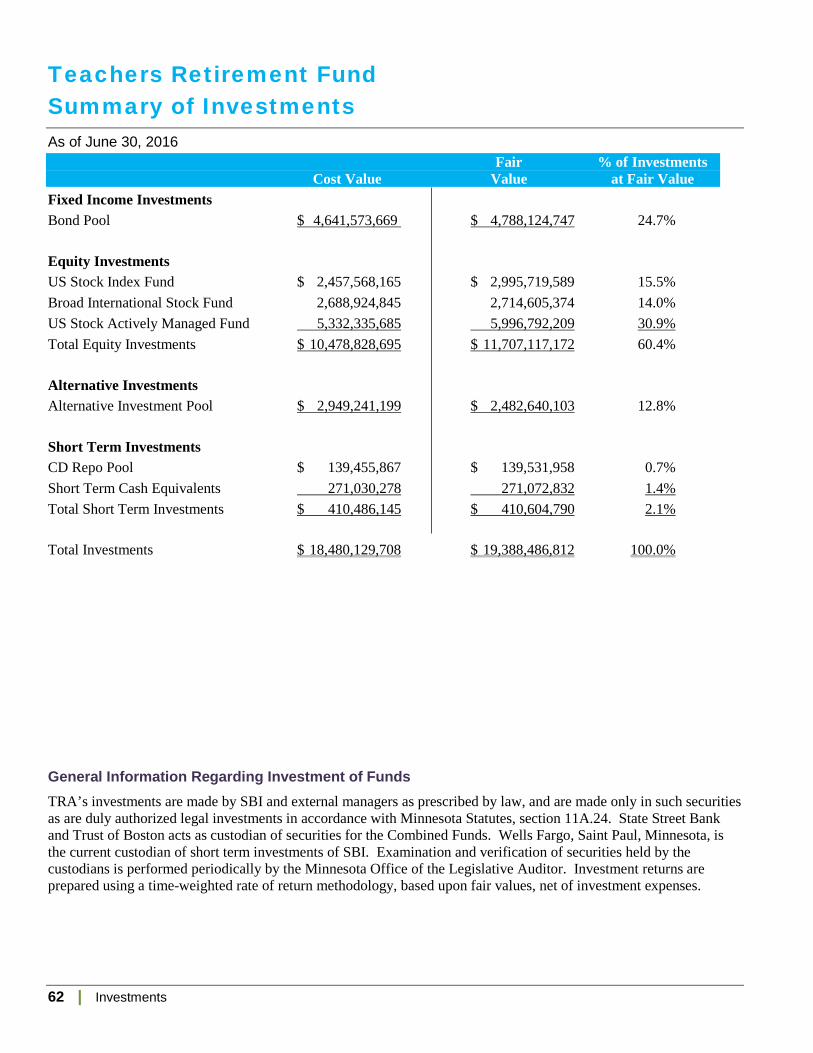
62 | Investments
Teachers Retirement Fund Summary of Investments As of June 30, 2016 Fair % of Investments Cost Value Value at Fair Value Fixed Income Investments Bond Pool $ 4,641,573,669 $ 4,788,124,747 24.7%
Equity Investments US Stock Index Fund $ 2,457,568,165 $ 2,995,719,589 15.5% Broad International Stock Fund 2,688,924,845 2,714,605,374 14.0% US Stock Actively Managed Fund 5,332,335,685 5,996,792,209 30.9% Total Equity Investments $ 10,478,828,695 $ 11,707,117,172 60.4%
Alternative Investments Alternative Investment Pool $ 2,949,241,199 $ 2,482,640,103 12.8%
Short Term Investments CD Repo Pool $ 139,455,867 $ 139,531,958 0.7% Short Term Cash Equivalents 271,030,278 271,072,832 1.4% Total Short Term Investments $ 410,486,145 $ 410,604,790 2.1%
Total Investments $ 18,480,129,708 $ 19,388,486,812 100.0%
General Information Regarding Investment of Funds TRA’s investments are made by SBI and external managers as prescribed by law, and are made only in such securities as are duly authorized legal investments in accordance with Minnesota Statutes, section 11A.24. State Street Bank and Trust of Boston acts as custodian of securities for the Combined Funds. Wells Fargo, Saint Paul, Minnesota, is the current custodian of short term investments of SBI. Examination and verification of securities held by the custodians is performed periodically by the Minnesota Office of the Legislative Auditor. Investment returns are prepared using a time-weighted rate of return methodology, based upon fair values, net of investment expenses.