teachers’ retirement system of the state … fy 10 valuation report in word c7038ret01-2010-val...
TRANSCRIPT
7228/Buck FY 10 valuation report in word C7038RET01-2010-Val (4).docx
BUCK CONSULTANTS, LLC
TEACHERS’ RETIREMENT SYSTEM
OF THE STATE OF ILLINOIS
June 30, 2010
Actuarial Valuation of
Pension Benefits
December 2010
December 6, 2010
Board of Trustees
Teachers' Retirement System
of The State of Illinois
2815 West Washington Street
Springfield, Illinois 62702
Ladies and Gentlemen:
We have completed the valuation of the System as of June 30, 2010 and the principal results are set forth
on Pages 1 and 2 of this report.
The contributions to the System, which are shown in the Summary of Principal Results, are based on the
provisions of Article 16 of the Illinois Pension Code. The member contribution rate is 9.4% of covered
payroll, which includes a 0.4% of pay ―Career ERO contribution‖ that became effective July 1, 2005.
The member rate for Modified ERO lump sum payments at retirement is 11.5%. An additional member
contribution has been required since July 1, 1995 to finance retiree health insurance through a state
agency other than TRS. School Districts are required to contribute 0.58% of payroll toward the cost of
the 2.2% formula. School Districts also pay the cost of pension benefits resulting from salary increases
over 6% used in the final average salary calculation, although PA 94-1057 provides permanent and
temporary exemptions from some of these payments for retirements occurring on or after July 31, 2006.
The School District rate for Modified ERO lump sum payments at retirement is 23.5%, and School
Districts make lump sum payments at retirement for excessive annual sick leave accruals.
In total, employer contributions to the System must be sufficient to "meet the cost of maintaining and
administering the system on a 90% funded basis in accordance with actuarial recommendations." The
statute specifies that this objective is to be met by June 30, 2045 through annual appropriations that are a
level percentage of payroll – before reduction for the maximum State contribution limitations of the
statute – for fiscal years 2011 through 2045.
Under Section 7.2(d) of the General Obligation Bond Act (GOBA), TRS received $4,330,374,000 on July
2, 2003. Commencing with fiscal year 2005, the maximum State contribution under the Act equals the
State contribution that would have been required if this $4.33 billion contribution had not been made,
reduced – but not below zero – by the State's debt service on the TRS portion of the full $10 billion of
Pension Obligation Bonds issued under Section 7.2 of the GOBA.
Under PA 94-0004 the FY 2006 and FY 2007 State contributions to the Benefit Trust Reserve were not
actuarially determined, but were set by statute to be, respectively, $531,827,700, and $735,514,500. Gross
appropriations, as a percentage of payroll, for fiscal years 2008 through 2010 were calculated to increase
in level annual increments, and gross appropriations are required to be a level percentage of payroll
thereafter. In fiscal years 1999 through 2004, minimum state contributions were specified.
At the direction of the board, and commencing with the contribution due for fiscal year 2006, the Federal
Funds contribution rate is the same as the certified State rate.

Board of Trustees
December 6, 2010
Page 2
As required under PA 96-0043, the method for determining the actuarial value of assets used to determine
the employer contribution rate was changed beginning with the June 30, 2009 valuation. The method was
changed from the market value to a smoothed value. The smoothed value recognizes actuarial investment
gains or losses for each fiscal year, beginning with FY 2009, in equal amounts over the ensuing five-year
period. The System incurred a gain on a market basis of $1,257,176,000 in FY 2010. Per statutory
requirement, 20% is recognized in the actuarial value of assets as of June 30, 2010, and recognition of the
remaining 80%, or $1,005,741,000, will be deferred and recognized in equal amounts over the next four
valuations. Depending on whether the total net deferral is an investment gain or loss, the smoothing
method will produce a contribution rate that is more or less than the rate based on the market value. As of
the June 30, 2010 valuation the total net deferral is a $6,115,308,000 loss, resulting in a contribution that
is lower than it would be if the assets were valued at market.
Significant pension legislation passed by the House and Senate on March 24 was signed into law by the
Governor on April 14, 2010. Public Act 96-0889, formerly Senate Bill 1946, adds a new section to the
Pension Code that will apply to anyone first hired in a position covered by the Teachers’ Retirement
System on or after January 1, 2011. Significant changes from the current pension law include raising the
minimum eligibility to draw a retirement benefit to age 67 with 10 years of service, calculating the
retirement benefit based on pensionable earnings allowed to grow more slowly than the Social Security
wage base, beginning with $106,800 as of 2011, and a cost-of-living annuity adjustment of the lesser of 3
percent or ½ of the annual increase in the CPI, not compounded. The retirement formula under the new-
hire pension law is unchanged. The new pension law does not apply to anyone who has TRS service prior
to January 1, 2011.
The unfunded pension benefit obligation of the System as of June 30, 2010 is $39,854,106,000, which
may be compared with the unfunded obligation of $35,001,154,000 as of June 30, 2009.
The funded status of the System as of June 30, 2010 is 40.5% based on the market value of assets and
48.4% based on the actuarial value of assets. As of June 30, 2009 the System’s funded status was 39.1%
based on the market value of assets, and 52.1% based on the actuarial value of assets.
This report is comprised of projections on two different bases:
Assuming the full fiscal year 2011 State Contribution is made - Projections on this basis are
contained in the body of the report.
Assuming that the fiscal year 2011 State Contribution is $110,000,000 - Projections on this
basis are contained in Appendix XII beginning on page 70.
Assuming the full fiscal year 2011 State Contribution is made, we calculate that the employer's
contribution rate to the Benefit Trust Reserve of the System for fiscal year 2012 is 25.49% of membership
payroll. The recommended total employer contribution for fiscal year 2012 to the Benefit Trust Reserve
under the provisions of Article 16 of the Illinois Pension Code is $2,547,803,000. Subtracting estimated
Federal Funds and School District contributions and adding a contribution to the Guaranteed Minimum
Annuity Reserve results in a total State Contribution for fiscal year 2012 of $2,406,472,000. This figure
represents an increase of $48,031,000 or 2.0% from the total State Contribution in fiscal year 2011 of
$2,358,441,000. These amounts are predicated on all contributions for the fiscal year 2011 being
paid.
Assuming the fiscal year 2011 State Contribution is $110,000,000, we calculate that the employer's
contribution rate to the Benefit Trust Reserve of the System for fiscal year 2012 is 27.02% of membership

Board of Trustees
December 6, 2010
Page 3
payroll. The recommended total employer contribution for fiscal year 2012 to the Benefit Trust Reserve
under the provisions of Article 16 of the Illinois Pension Code is $2,701,163,000. Subtracting estimated
Federal Funds and School District contributions and adding a contribution to the Guaranteed Minimum
Annuity Reserve results in a total State Contribution for fiscal year 2012 of $2,554,618,000. This figure
represents an increase of $196,177,000 or 8.3% from the total State Contribution in fiscal year 2011 of
$2,358,441,000. This certified amount is based on the projections presented at the November 15th, 2010
meeting which can be found in the Appendix. These amounts are predicated on state contributions of
only $110,000,000 for the fiscal year 2011 being paid.
Qualified actuaries completed this valuation in accordance with generally accepted actuarial procedures
as prescribed by the Actuarial Standards Board. The qualified actuaries are members of the American
Academy of Actuaries and are experienced in performing actuarial valuations of public employee
retirement systems. To the best of our knowledge, this report is complete and accurate and has been
prepared in accordance with generally accepted actuarial principles and practices. The undersigned with
actuarial designations are qualified to render the opinions contained in this report.
Sincerely,
Larry Langer, FCA, ASA, EA, MAAA Marco Ruffini
Principal, Retirement Sr. Consultant, Retirement
TEACHERS’ RETIREMENT SYSTEM
OF THE STATE OF ILLINOIS BUCK CONSULTANTS, LLC
TEACHERS' RETIREMENT SYSTEM
OF THE STATE OF ILLINOIS
TABLE OF CONTENTS Section Page
I Principal Results -------------------------------------------------------------------------- 1
II Financing Objective and Employer's Contribution Rate ------------------------------- 4
III Current Financial Position ------------------------------------------------------------------ 7
IV Gains and Losses During Year ------------------------------------------------------------ 9
V Membership Data -------------------------------------------------------------------------- 11
VI Assets -------------------------------------------------------------------------- 12
VII History of Legislative Changes ------------------------------------------------------------ 13
VIII Financial Results and Membership Data - Detailed Summaries ---------------------- 14
Schedule IA – Employer's Contribution Rates and Amounts -------------------- 15
Schedule IB – Determination of Employer Contribution Under Public Act 94-0004 ------------------------------------------ 16
Schedule II – GASB 25 and 27 - Required Supplementary Information ----- 18
Schedule III – Reconciliation of Unfunded Pension Benefit Obligation ------ 19
Schedule IV – Employer Cost in Excess of Contributions ----------------------- 20
Schedule V – 10-Year History of Unfunded Pension Benefit Obligation ---- 21
Schedule VI – 10-Year History of Funded Status --------------------------------- 22
Schedule VII – 10-Year History of System Revenue and Expenses ------------- 23
Schedule VIII – Membership Data ---------------------------------------------------- 24
Schedule IX – History of Active Membership Data for Last 10 Years -------- 26
Schedule X – History of Annuitant and Survivor Annuitant Membership for Last 10 Years ------------------------------------- 27
Schedule XI – Benefit Streams for Guaranteed Minimum Annuity Reserve ------------------------------------------------------ 28
Schedule XII – Itemization of Employer Contribution to Benefit Trust Reserve ----------------------------------------------- 29
Schedule XIII – Fiscal Year 2011 Employer Contribution Based on 50-Year Projection for Benefit Trust Reserve (50-Year Amortization with 15-Year Phase-In Beginning Fiscal Year 1996) ----------------------------------------------------- 31
Schedule XIV – Projection Of Assets, Employer, State And Federal Contributions Without Pension Obligation Bonds - State’s Debt Service On Pension Obligation Bonds, And State and Federal Fund Maximums With Pension Obligation Bonds ----------------------------------- 33
Schedule XV – Projections Using Certified Contributions and an 8.5% Market Rate of Return -------------------------------- 35
IX Statement of Actuarial Assumptions and Methods ------------------------------------- 37
X Summary of Benefit and Contribution Provisions -------------------------------------- 47
XI Detailed Tabulations of Data --------------------------------------------------------------- 56
XII Appendix – Projections Based on a State Contribution of $110,000,000 of the Certified Amount of $2,358,441,000 for Fiscal Year 2011 ------------------------------------------------------ 70
Page 1
TEACHERS’ RETIREMENT SYSTEM
OF THE STATE OF ILLINOIS BUCK CONSULTANTS, LLC
TEACHERS' RETIREMENT SYSTEM
OF THE STATE OF ILLINOIS
ACTUARIAL VALUATION
JUNE 30, 2010
SECTION I — PRINCIPAL RESULTS
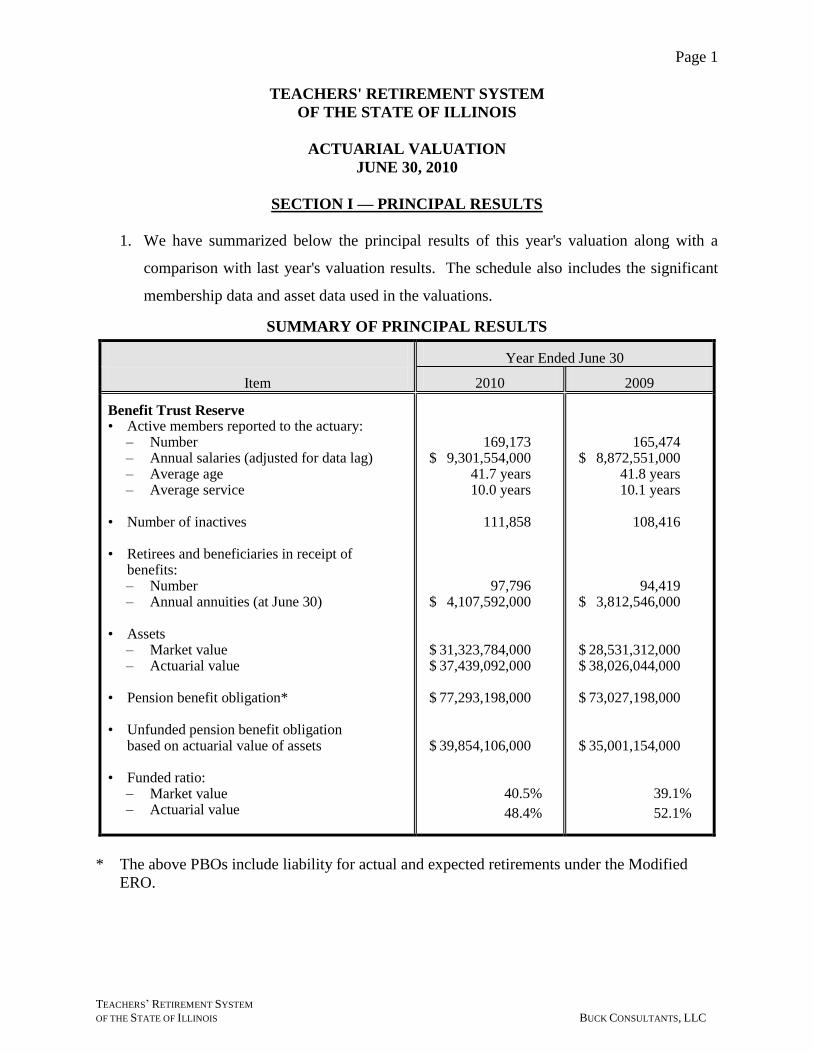
1. We have summarized below the principal results of this year's valuation along with a
comparison with last year's valuation results. The schedule also includes the significant
membership data and asset data used in the valuations.
SUMMARY OF PRINCIPAL RESULTS
Year Ended June 30
Item 2010 2009
Benefit Trust Reserve • Active members reported to the actuary:
– Number – Annual salaries (adjusted for data lag) – Average age – Average service
• Number of inactives • Retirees and beneficiaries in receipt of
benefits: – Number – Annual annuities (at June 30)
• Assets
– Market value – Actuarial value
• Pension benefit obligation* • Unfunded pension benefit obligation
based on actuarial value of assets • Funded ratio:
– Market value – Actuarial value
169,173 $ 9,301,554,000 41.7 years 10.0 years 111,858 97,796 $ 4,107,592,000 $ 31,323,784,000 $ 37,439,092,000 $ 77,293,198,000 $ 39,854,106,000 40.5%
48.4%
165,474 $ 8,872,551,000 41.8 years 10.1 years 108,416 94,419 $ 3,812,546,000 $ 28,531,312,000 $ 38,026,044,000 $ 73,027,198,000 $ 35,001,154,000 39.1%
52.1%
* The above PBOs include liability for actual and expected retirements under the Modified
ERO.
Page 2
TEACHERS’ RETIREMENT SYSTEM
OF THE STATE OF ILLINOIS BUCK CONSULTANTS, LLC
SUMMARY OF PRINCIPAL RESULTS (Continued)
Year Ended June 30
Item 2010 2009
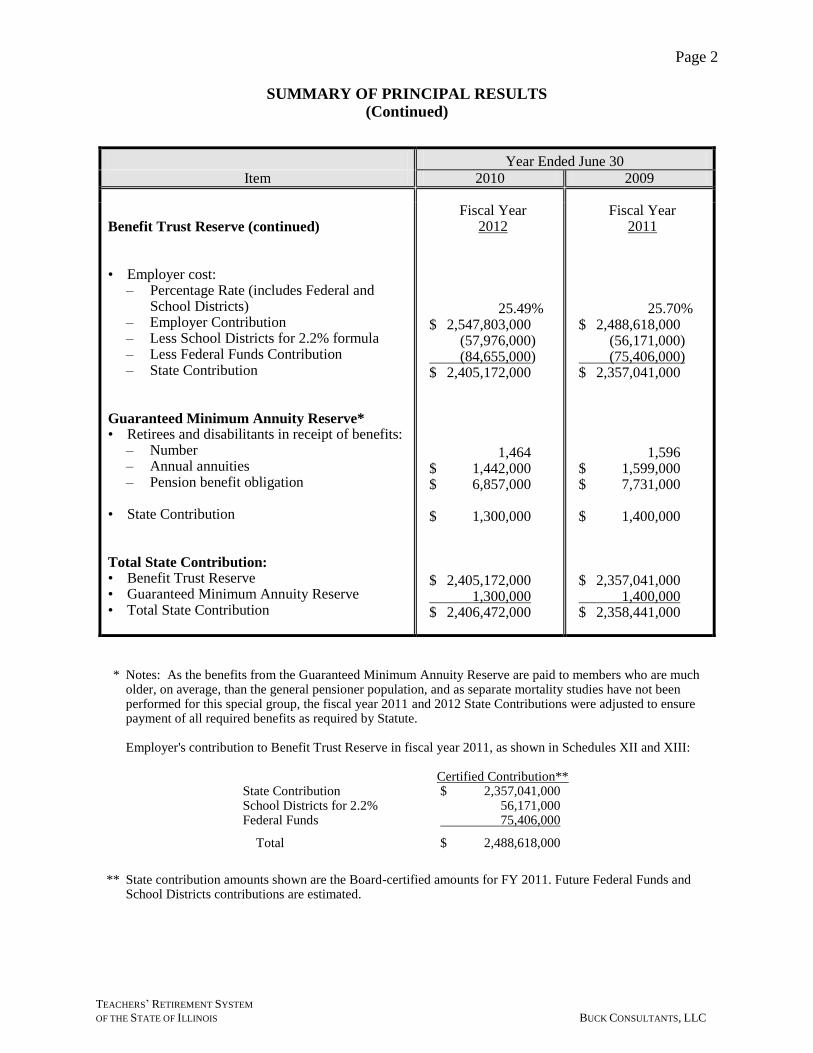
Benefit Trust Reserve (continued) • Employer cost:
– Percentage Rate (includes Federal and School Districts)
– Employer Contribution – Less School Districts for 2.2% formula – Less Federal Funds Contribution – State Contribution
Guaranteed Minimum Annuity Reserve* • Retirees and disabilitants in receipt of benefits:
– Number – Annual annuities – Pension benefit obligation
• State Contribution Total State Contribution: • Benefit Trust Reserve • Guaranteed Minimum Annuity Reserve • Total State Contribution
Fiscal Year 2012
25.49% $ 2,547,803,000 (57,976,000) (84,655,000) $ 2,405,172,000 1,464 $ 1,442,000 $ 6,857,000 $ 1,300,000 $ 2,405,172,000 1,300,000 $ 2,406,472,000
Fiscal Year 2011
25.70% $ 2,488,618,000 (56,171,000) (75,406,000) $ 2,357,041,000 1,596 $ 1,599,000 $ 7,731,000 $ 1,400,000 $ 2,357,041,000 1,400,000 $ 2,358,441,000
* Notes: As the benefits from the Guaranteed Minimum Annuity Reserve are paid to members who are much older, on average, than the general pensioner population, and as separate mortality studies have not been performed for this special group, the fiscal year 2011 and 2012 State Contributions were adjusted to ensure payment of all required benefits as required by Statute.
Employer's contribution to Benefit Trust Reserve in fiscal year 2011, as shown in Schedules XII and XIII:
State Contribution School Districts for 2.2% Federal Funds
Total
Certified Contribution** $ 2,357,041,000 56,171,000 75,406,000
$ 2,488,618,000
** State contribution amounts shown are the Board-certified amounts for FY 2011. Future Federal Funds and School Districts contributions are estimated.
Page 3
TEACHERS’ RETIREMENT SYSTEM
OF THE STATE OF ILLINOIS BUCK CONSULTANTS, LLC
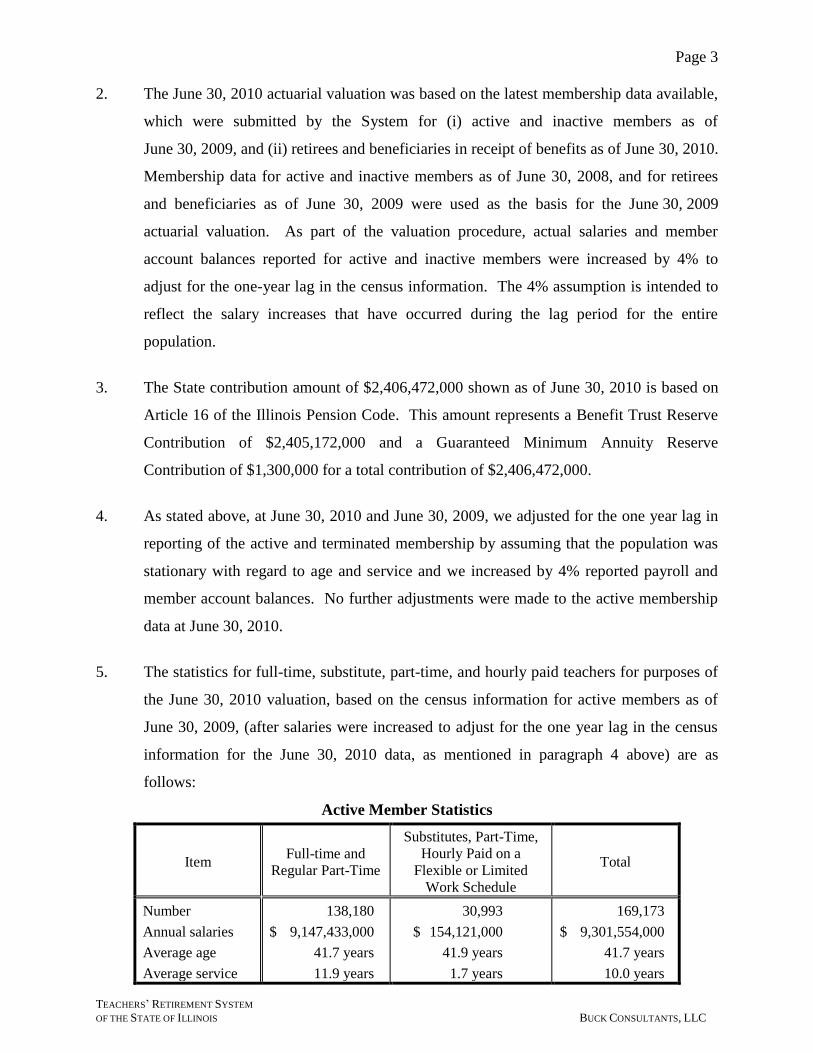
2. The June 30, 2010 actuarial valuation was based on the latest membership data available,
which were submitted by the System for (i) active and inactive members as of
June 30, 2009, and (ii) retirees and beneficiaries in receipt of benefits as of June 30, 2010.
Membership data for active and inactive members as of June 30, 2008, and for retirees
and beneficiaries as of June 30, 2009 were used as the basis for the June 30, 2009
actuarial valuation. As part of the valuation procedure, actual salaries and member
account balances reported for active and inactive members were increased by 4% to
adjust for the one-year lag in the census information. The 4% assumption is intended to
reflect the salary increases that have occurred during the lag period for the entire
population.
3. The State contribution amount of $2,406,472,000 shown as of June 30, 2010 is based on
Article 16 of the Illinois Pension Code. This amount represents a Benefit Trust Reserve
Contribution of $2,405,172,000 and a Guaranteed Minimum Annuity Reserve
Contribution of $1,300,000 for a total contribution of $2,406,472,000.
4. As stated above, at June 30, 2010 and June 30, 2009, we adjusted for the one year lag in
reporting of the active and terminated membership by assuming that the population was
stationary with regard to age and service and we increased by 4% reported payroll and
member account balances. No further adjustments were made to the active membership
data at June 30, 2010.
5. The statistics for full-time, substitute, part-time, and hourly paid teachers for purposes of
the June 30, 2010 valuation, based on the census information for active members as of
June 30, 2009, (after salaries were increased to adjust for the one year lag in the census
information for the June 30, 2010 data, as mentioned in paragraph 4 above) are as
follows:
Active Member Statistics
Item Full-time and
Regular Part-Time
Substitutes, Part-Time,
Hourly Paid on a
Flexible or Limited
Work Schedule
Total
Number
Annual salaries
Average age
Average service
138,180
$ 9,147,433,000
41.7 years
11.9 years
30,993
$ 154,121,000
41.9 years
1.7 years
169,173
$ 9,301,554,000
41.7 years
10.0 years
Page 4
TEACHERS’ RETIREMENT SYSTEM
OF THE STATE OF ILLINOIS BUCK CONSULTANTS, LLC
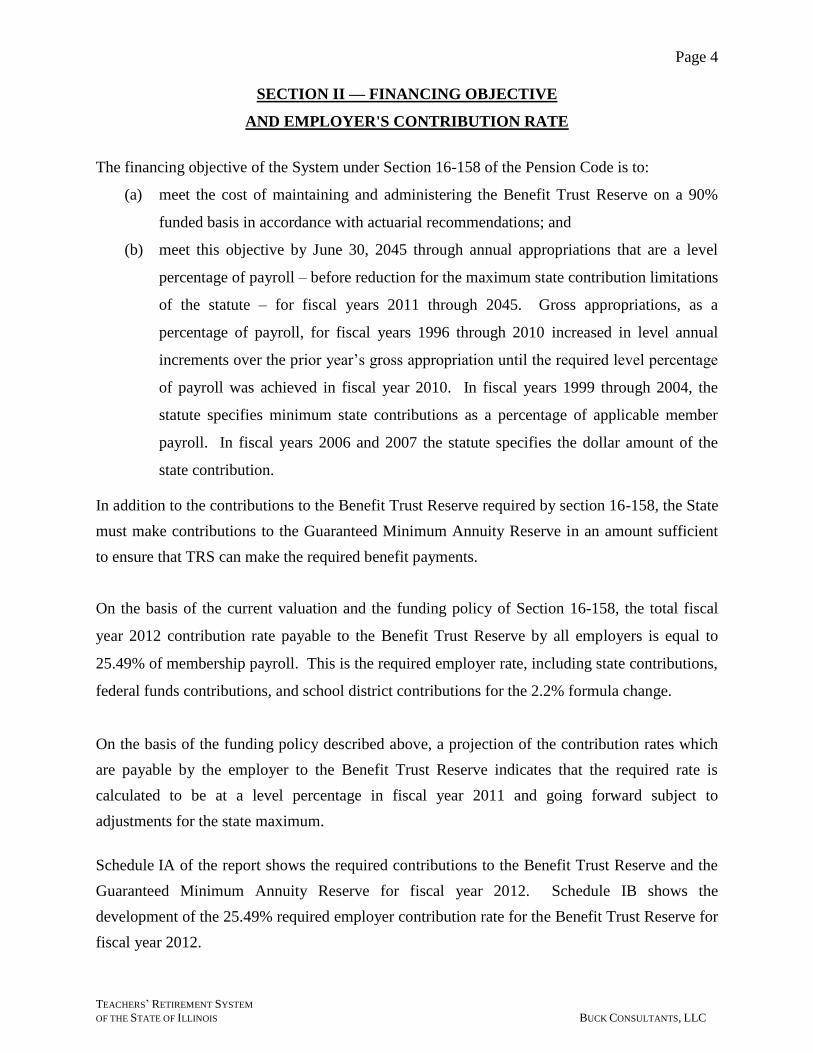
SECTION II — FINANCING OBJECTIVE
AND EMPLOYER'S CONTRIBUTION RATE
The financing objective of the System under Section 16-158 of the Pension Code is to:
(a) meet the cost of maintaining and administering the Benefit Trust Reserve on a 90%
funded basis in accordance with actuarial recommendations; and
(b) meet this objective by June 30, 2045 through annual appropriations that are a level
percentage of payroll – before reduction for the maximum state contribution limitations
of the statute – for fiscal years 2011 through 2045. Gross appropriations, as a
percentage of payroll, for fiscal years 1996 through 2010 increased in level annual
increments over the prior year’s gross appropriation until the required level percentage
of payroll was achieved in fiscal year 2010. In fiscal years 1999 through 2004, the
statute specifies minimum state contributions as a percentage of applicable member
payroll. In fiscal years 2006 and 2007 the statute specifies the dollar amount of the
state contribution.
In addition to the contributions to the Benefit Trust Reserve required by section 16-158, the State
must make contributions to the Guaranteed Minimum Annuity Reserve in an amount sufficient
to ensure that TRS can make the required benefit payments.
On the basis of the current valuation and the funding policy of Section 16-158, the total fiscal
year 2012 contribution rate payable to the Benefit Trust Reserve by all employers is equal to
25.49% of membership payroll. This is the required employer rate, including state contributions,
federal funds contributions, and school district contributions for the 2.2% formula change.
On the basis of the funding policy described above, a projection of the contribution rates which
are payable by the employer to the Benefit Trust Reserve indicates that the required rate is
calculated to be at a level percentage in fiscal year 2011 and going forward subject to
adjustments for the state maximum.
Schedule IA of the report shows the required contributions to the Benefit Trust Reserve and the
Guaranteed Minimum Annuity Reserve for fiscal year 2012. Schedule IB shows the
development of the 25.49% required employer contribution rate for the Benefit Trust Reserve for
fiscal year 2012.
Page 5
TEACHERS’ RETIREMENT SYSTEM
OF THE STATE OF ILLINOIS BUCK CONSULTANTS, LLC
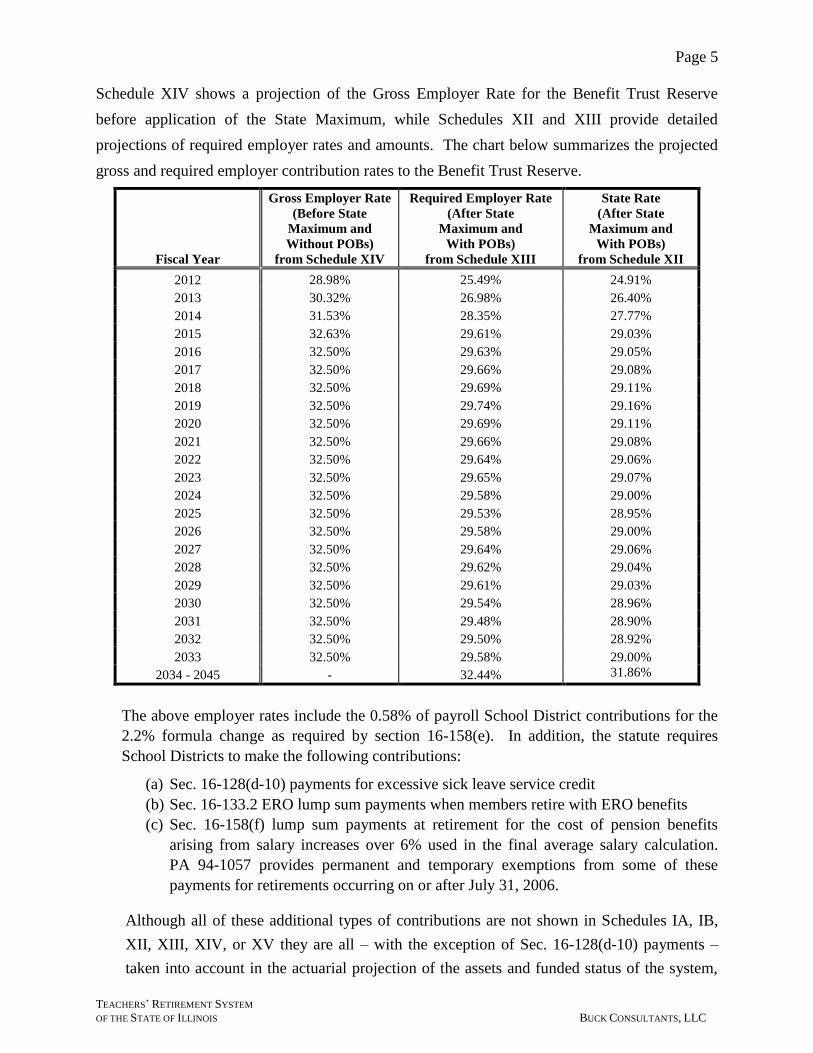
Schedule XIV shows a projection of the Gross Employer Rate for the Benefit Trust Reserve
before application of the State Maximum, while Schedules XII and XIII provide detailed
projections of required employer rates and amounts. The chart below summarizes the projected
gross and required employer contribution rates to the Benefit Trust Reserve.
Fiscal Year
Gross Employer Rate
(Before State
Maximum and
Without POBs)
from Schedule XIV
Required Employer Rate
(After State
Maximum and
With POBs)
from Schedule XIII
State Rate
(After State
Maximum and
With POBs)
from Schedule XII
2012 28.98% 25.49% 24.91%
2013 30.32% 26.98% 26.40%
2014 31.53% 28.35% 27.77%
2015 32.63% 29.61% 29.03%
2016 32.50% 29.63% 29.05%
2017 32.50% 29.66% 29.08%
2018 32.50% 29.69% 29.11%
2019 32.50% 29.74% 29.16%
2020 32.50% 29.69% 29.11%
2021 32.50% 29.66% 29.08%
2022 32.50% 29.64% 29.06%
2023 32.50% 29.65% 29.07%
2024 32.50% 29.58% 29.00%
2025 32.50% 29.53% 28.95%
2026 32.50% 29.58% 29.00%
2027 32.50% 29.64% 29.06%
2028 32.50% 29.62% 29.04%
2029 32.50% 29.61% 29.03%
2030 32.50% 29.54% 28.96%
2031 32.50% 29.48% 28.90%
2032 32.50% 29.50% 28.92%
2033 32.50% 29.58% 29.00%
2034 - 2045 - 32.44% 31.86%
The above employer rates include the 0.58% of payroll School District contributions for the
2.2% formula change as required by section 16-158(e). In addition, the statute requires
School Districts to make the following contributions:
(a) Sec. 16-128(d-10) payments for excessive sick leave service credit
(b) Sec. 16-133.2 ERO lump sum payments when members retire with ERO benefits
(c) Sec. 16-158(f) lump sum payments at retirement for the cost of pension benefits
arising from salary increases over 6% used in the final average salary calculation.
PA 94-1057 provides permanent and temporary exemptions from some of these
payments for retirements occurring on or after July 31, 2006.
Although all of these additional types of contributions are not shown in Schedules IA, IB,
XII, XIII, XIV, or XV they are all – with the exception of Sec. 16-128(d-10) payments –
taken into account in the actuarial projection of the assets and funded status of the system,
Page 6
TEACHERS’ RETIREMENT SYSTEM
OF THE STATE OF ILLINOIS BUCK CONSULTANTS, LLC
and the calculation of the Gross and Required employer rates is performed only after the
above contributions have been taken into account. (There is currently no assumption for
excessive sick leave service credit). A projection of School District contributions under
sections 16-133.2 and 16-158(f) can be found in Schedule XII.
Page 7
TEACHERS’ RETIREMENT SYSTEM
OF THE STATE OF ILLINOIS BUCK CONSULTANTS, LLC
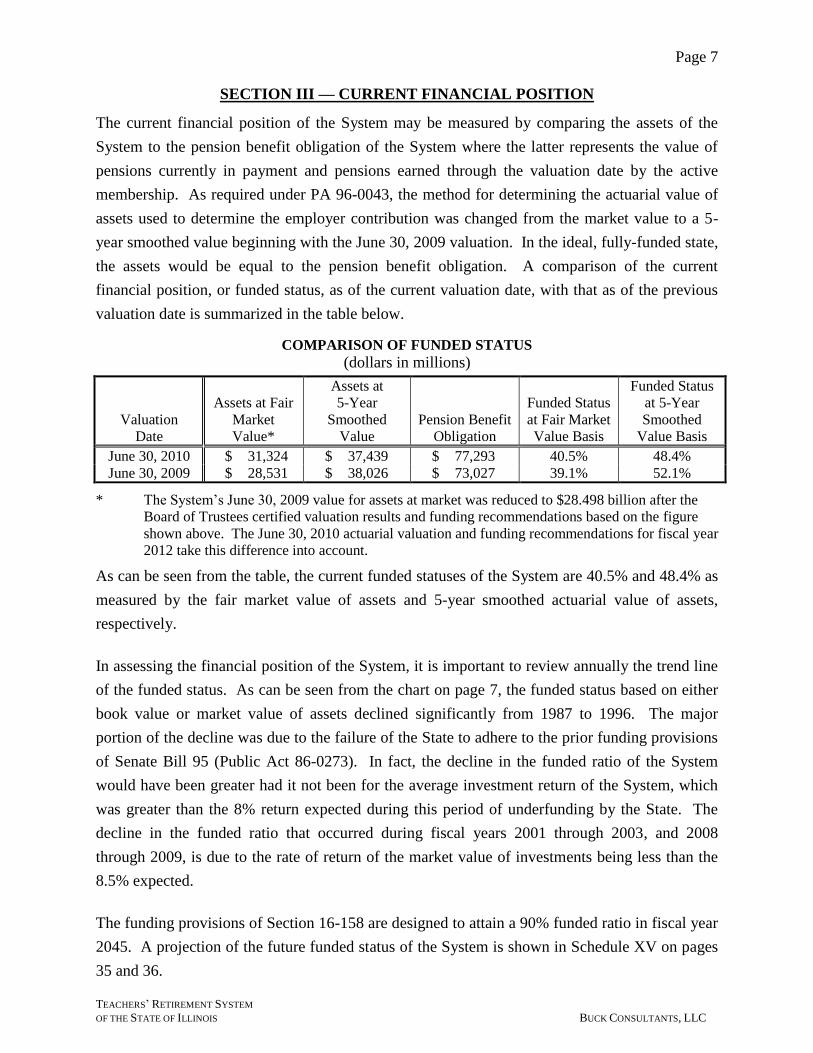
SECTION III — CURRENT FINANCIAL POSITION
The current financial position of the System may be measured by comparing the assets of the
System to the pension benefit obligation of the System where the latter represents the value of
pensions currently in payment and pensions earned through the valuation date by the active
membership. As required under PA 96-0043, the method for determining the actuarial value of
assets used to determine the employer contribution was changed from the market value to a 5-
year smoothed value beginning with the June 30, 2009 valuation. In the ideal, fully-funded state,
the assets would be equal to the pension benefit obligation. A comparison of the current
financial position, or funded status, as of the current valuation date, with that as of the previous
valuation date is summarized in the table below.
COMPARISON OF FUNDED STATUS
(dollars in millions)
Valuation
Date
Assets at Fair
Market
Value*
Assets at
5-Year
Smoothed
Value
Pension Benefit
Obligation
Funded Status
at Fair Market
Value Basis
Funded Status
at 5-Year
Smoothed
Value Basis
June 30, 2010 $ 31,324 $ 37,439 $ 77,293 40.5% 48.4%
June 30, 2009 $ 28,531 $ 38,026 $ 73,027 39.1% 52.1%
* The System’s June 30, 2009 value for assets at market was reduced to $28.498 billion after the
Board of Trustees certified valuation results and funding recommendations based on the figure
shown above. The June 30, 2010 actuarial valuation and funding recommendations for fiscal year
2012 take this difference into account.
As can be seen from the table, the current funded statuses of the System are 40.5% and 48.4% as
measured by the fair market value of assets and 5-year smoothed actuarial value of assets,
respectively.
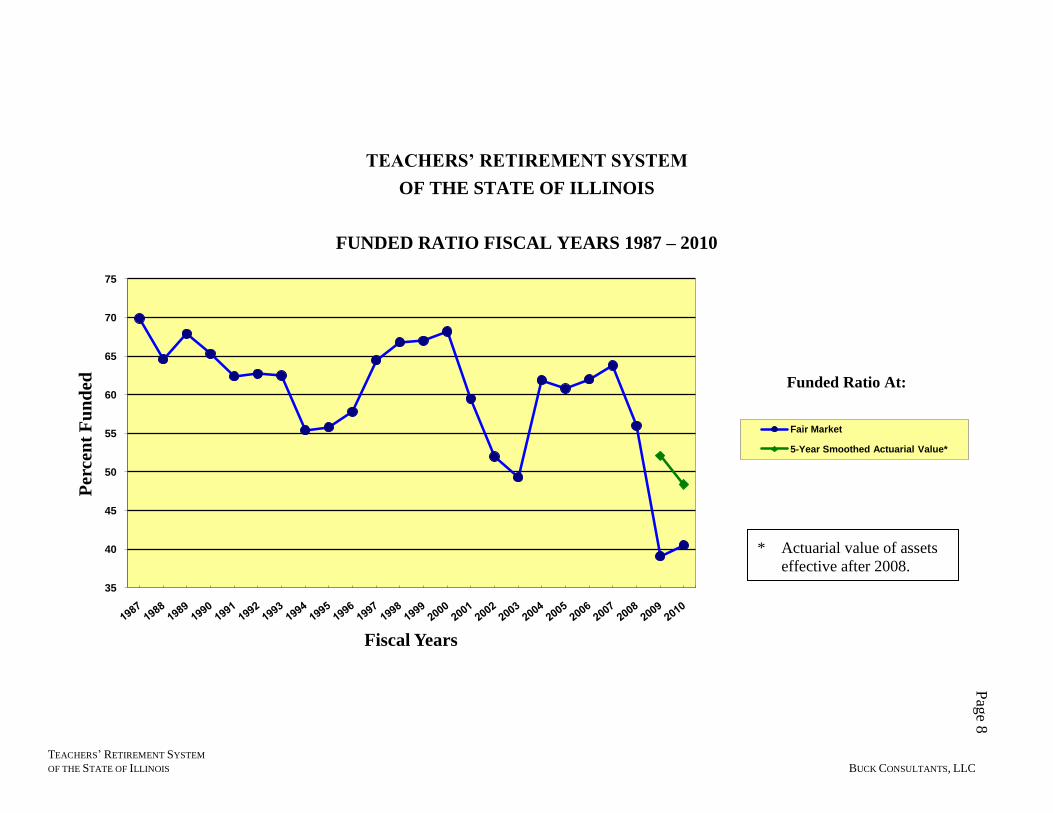
In assessing the financial position of the System, it is important to review annually the trend line
of the funded status. As can be seen from the chart on page 7, the funded status based on either
book value or market value of assets declined significantly from 1987 to 1996. The major
portion of the decline was due to the failure of the State to adhere to the prior funding provisions
of Senate Bill 95 (Public Act 86-0273). In fact, the decline in the funded ratio of the System
would have been greater had it not been for the average investment return of the System, which
was greater than the 8% return expected during this period of underfunding by the State. The
decline in the funded ratio that occurred during fiscal years 2001 through 2003, and 2008
through 2009, is due to the rate of return of the market value of investments being less than the
8.5% expected.
The funding provisions of Section 16-158 are designed to attain a 90% funded ratio in fiscal year
2045. A projection of the future funded status of the System is shown in Schedule XV on pages
35 and 36.
TEACHERS’ RETIREMENT SYSTEM
OF THE STATE OF ILLINOIS BUCK CONSULTANTS, LLC
TEACHERS’ RETIREMENT SYSTEM
OF THE STATE OF ILLINOIS
FUNDED RATIO FISCAL YEARS 1987 – 2010
Pag
e 8
35
40
45
50
55
60
65
70
75
Per
cen
t F
un
ded
Fiscal Years
Fair Market
5-Year Smoothed Actuarial Value*
Funded Ratio At:
* Actuarial value of assets
effective after 2008.
Page 9
TEACHERS’ RETIREMENT SYSTEM
OF THE STATE OF ILLINOIS BUCK CONSULTANTS, LLC
SECTION IV — GAINS AND LOSSES DURING YEAR
The gain and loss analysis provides a measure of the impact of the demographic and economic
factors on the results of the actuarial valuation, when compared to the actuarial assumptions used
to anticipate these factors. The analysis is significant in providing a test of the adequacy of these
assumptions over a period of time. A detailed reconciliation of the changes in the unfunded
pension benefit obligation, including actuarial gains and losses, can be found in Schedule III.
The demographic factors affecting the gain and loss analysis include the following:
(a) withdrawal from active membership;
(b) mortality during active membership;
(c) disability retirement;
(d) service retirement; and
(e) mortality after retirement.
The economic factors affecting the gain and loss analysis include the following:
(a) investment rate of return; and
(b) active members' salary increases.
During the fiscal year ended June 30, 2010, there was a net actuarial loss of $3,281 million
incurred by the System due to demographic and economic experience when compared to the
actuarial assumptions used to anticipate these factors.
Page 10
TEACHERS’ RETIREMENT SYSTEM
OF THE STATE OF ILLINOIS BUCK CONSULTANTS, LLC
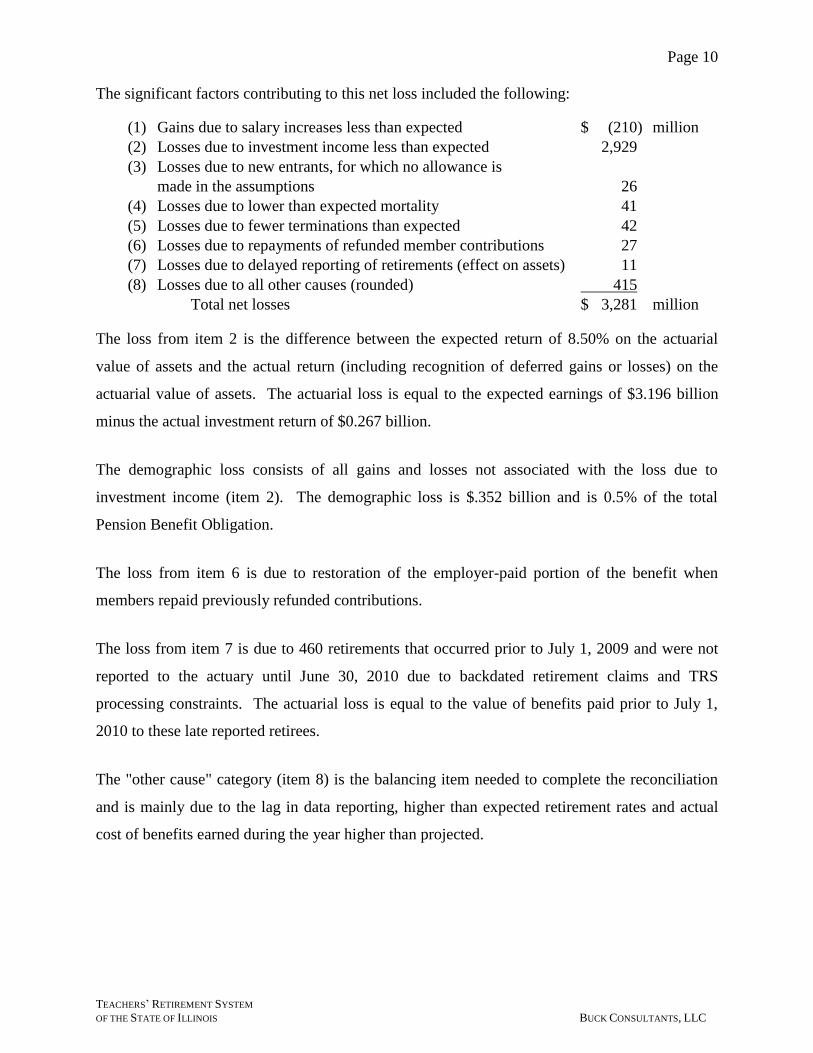
The significant factors contributing to this net loss included the following:
(1) Gains due to salary increases less than expected $ (210) million
(2) Losses due to investment income less than expected 2,929
(3) Losses due to new entrants, for which no allowance is
made in the assumptions 26
(4) Losses due to lower than expected mortality 41
(5) Losses due to fewer terminations than expected 42
(6) Losses due to repayments of refunded member contributions 27
(7) Losses due to delayed reporting of retirements (effect on assets) 11
(8) Losses due to all other causes (rounded) 415
Total net losses $ 3,281 million
The loss from item 2 is the difference between the expected return of 8.50% on the actuarial
value of assets and the actual return (including recognition of deferred gains or losses) on the
actuarial value of assets. The actuarial loss is equal to the expected earnings of $3.196 billion
minus the actual investment return of $0.267 billion.
The demographic loss consists of all gains and losses not associated with the loss due to
investment income (item 2). The demographic loss is $.352 billion and is 0.5% of the total
Pension Benefit Obligation.
The loss from item 6 is due to restoration of the employer-paid portion of the benefit when
members repaid previously refunded contributions.
The loss from item 7 is due to 460 retirements that occurred prior to July 1, 2009 and were not
reported to the actuary until June 30, 2010 due to backdated retirement claims and TRS
processing constraints. The actuarial loss is equal to the value of benefits paid prior to July 1,
2010 to these late reported retirees.
The "other cause" category (item 8) is the balancing item needed to complete the reconciliation
and is mainly due to the lag in data reporting, higher than expected retirement rates and actual
cost of benefits earned during the year higher than projected.
Page 11
TEACHERS’ RETIREMENT SYSTEM
OF THE STATE OF ILLINOIS BUCK CONSULTANTS, LLC
SECTION V — MEMBERSHIP DATA
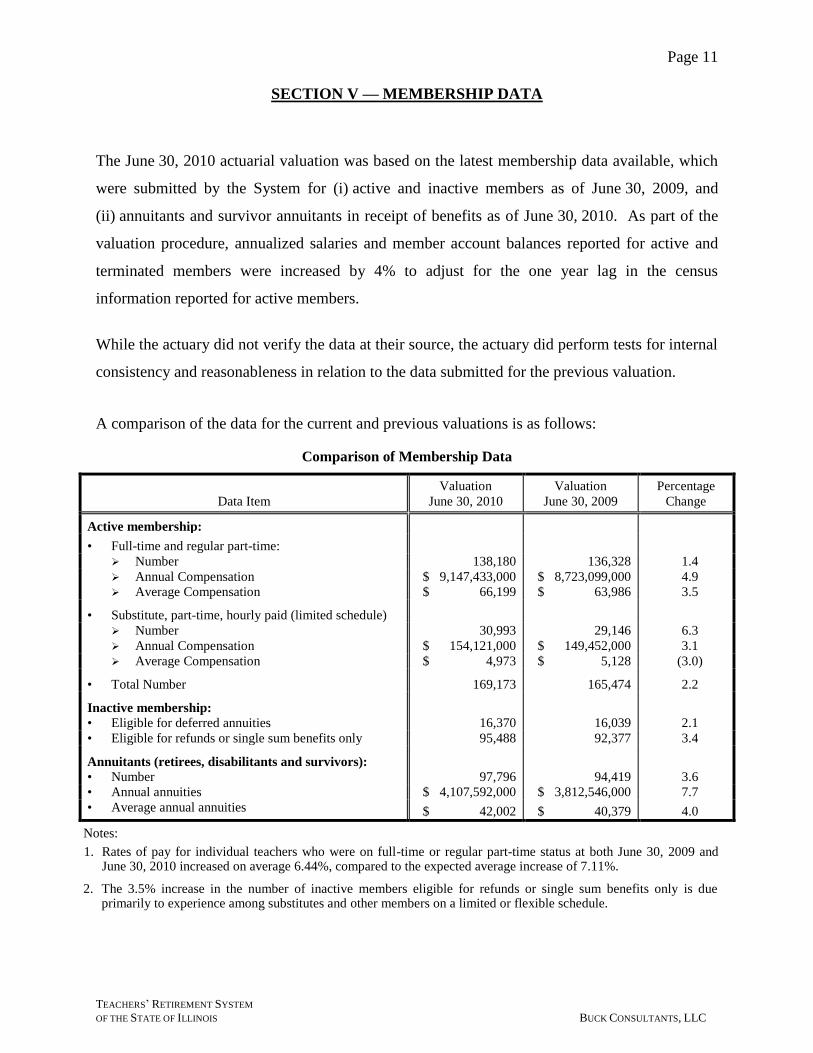
The June 30, 2010 actuarial valuation was based on the latest membership data available, which
were submitted by the System for (i) active and inactive members as of June 30, 2009, and
(ii) annuitants and survivor annuitants in receipt of benefits as of June 30, 2010. As part of the
valuation procedure, annualized salaries and member account balances reported for active and
terminated members were increased by 4% to adjust for the one year lag in the census
information reported for active members.
While the actuary did not verify the data at their source, the actuary did perform tests for internal
consistency and reasonableness in relation to the data submitted for the previous valuation.
A comparison of the data for the current and previous valuations is as follows:
Comparison of Membership Data
Data Item
Valuation
June 30, 2010
Valuation
June 30, 2009
Percentage
Change
Active membership:
• Full-time and regular part-time:
Number 138,180 136,328 1.4
Annual Compensation $ 9,147,433,000 $ 8,723,099,000 4.9
Average Compensation $ 66,199 $ 63,986 3.5
• Substitute, part-time, hourly paid (limited schedule)
Number 30,993 29,146 6.3
Annual Compensation $ 154,121,000 $ 149,452,000 3.1
Average Compensation $ 4,973 $ 5,128 (3.0)
• Total Number 169,173 165,474 2.2
Inactive membership:
• Eligible for deferred annuities 16,370 16,039 2.1
• Eligible for refunds or single sum benefits only 95,488 92,377 3.4
Annuitants (retirees, disabilitants and survivors):
• Number 97,796 94,419 3.6
• Annual annuities $ 4,107,592,000 $ 3,812,546,000 7.7
• Average annual annuities $ 42,002 $ 40,379 4.0
Notes:
1. Rates of pay for individual teachers who were on full-time or regular part-time status at both June 30, 2009 and June 30, 2010 increased on average 6.44%, compared to the expected average increase of 7.11%.
2. The 3.5% increase in the number of inactive members eligible for refunds or single sum benefits only is due primarily to experience among substitutes and other members on a limited or flexible schedule.
Page 12
TEACHERS’ RETIREMENT SYSTEM
OF THE STATE OF ILLINOIS BUCK CONSULTANTS, LLC
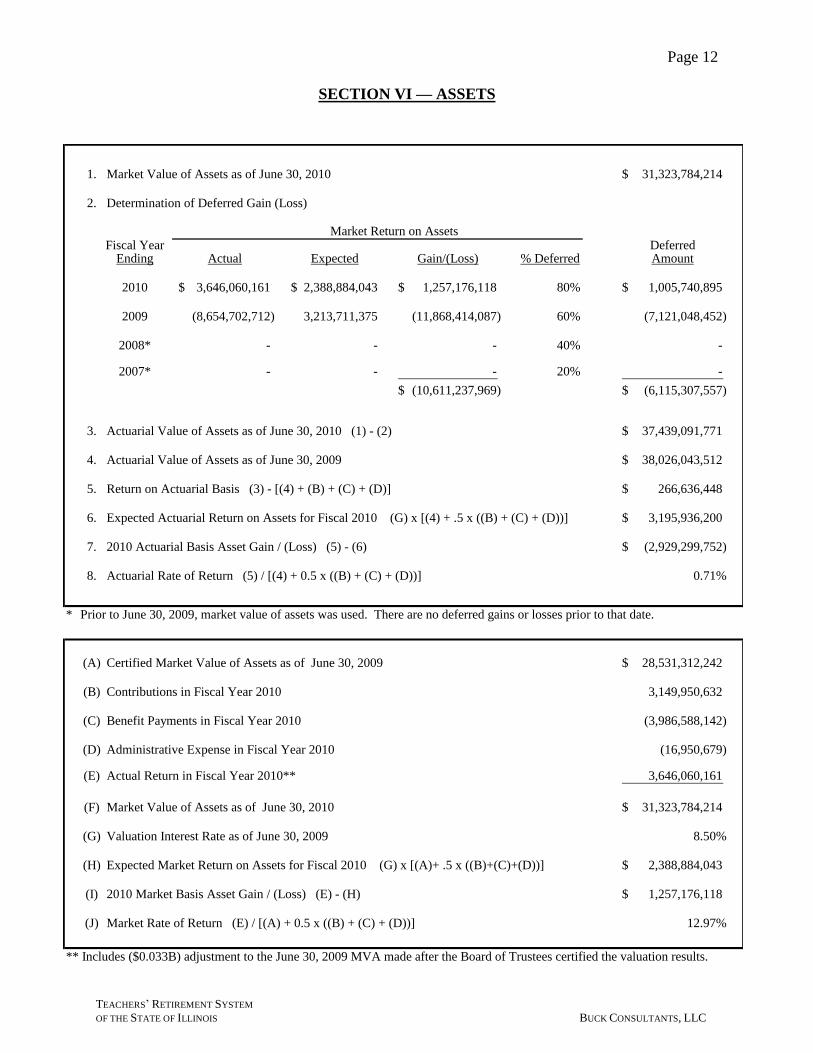
1. Market Value of Assets as of June 30, 2010 31,323,784,214$
2. Determination of Deferred Gain (Loss)
Market Return on AssetsFiscal Year Deferred
Ending Actual Expected Gain/(Loss) % Deferred Amount
2010 3,646,060,161$ 2,388,884,043$ 1,257,176,118$ 80% 1,005,740,895$
2009 (8,654,702,712) 3,213,711,375 (11,868,414,087) 60% (7,121,048,452)
2008* - - - 40% -
2007* - - - 20% -
(10,611,237,969)$ (6,115,307,557)$
3. Actuarial Value of Assets as of June 30, 2010 (1) - (2) 37,439,091,771$
4. Actuarial Value of Assets as of June 30, 2009 38,026,043,512$
5. Return on Actuarial Basis (3) - [(4) + (B) + (C) + (D)] 266,636,448$
6. Expected Actuarial Return on Assets for Fiscal 2010 (G) x [(4) + .5 x ((B) + (C) + (D))] 3,195,936,200$
7. 2010 Actuarial Basis Asset Gain / (Loss) (5) - (6) (2,929,299,752)$
8. Actuarial Rate of Return (5) / [(4) + 0.5 x ((B) + (C) + (D))] 0.71%
* Prior to June 30, 2009, market value of assets was used. There are no deferred gains or losses prior to that date.
(A) Certified Market Value of Assets as of June 30, 2009 28,531,312,242$
(B) Contributions in Fiscal Year 2010 3,149,950,632
(C) Benefit Payments in Fiscal Year 2010 (3,986,588,142)
(D) Administrative Expense in Fiscal Year 2010 (16,950,679)
(E) Actual Return in Fiscal Year 2010** 3,646,060,161
(F) Market Value of Assets as of June 30, 2010 31,323,784,214$
(G) Valuation Interest Rate as of June 30, 2009 8.50%
(H) Expected Market Return on Assets for Fiscal 2010 (G) x [(A)+ .5 x ((B)+(C)+(D))] 2,388,884,043$
(I) 2010 Market Basis Asset Gain / (Loss) (E) - (H) 1,257,176,118$
(J) Market Rate of Return (E) / [(A) + 0.5 x ((B) + (C) + (D))] 12.97%
** Includes ($0.033B) adjustment to the June 30, 2009 MVA made after the Board of Trustees certified the valuation results.
SECTION VI — ASSETS
Page 13
TEACHERS’ RETIREMENT SYSTEM
OF THE STATE OF ILLINOIS BUCK CONSULTANTS, LLC
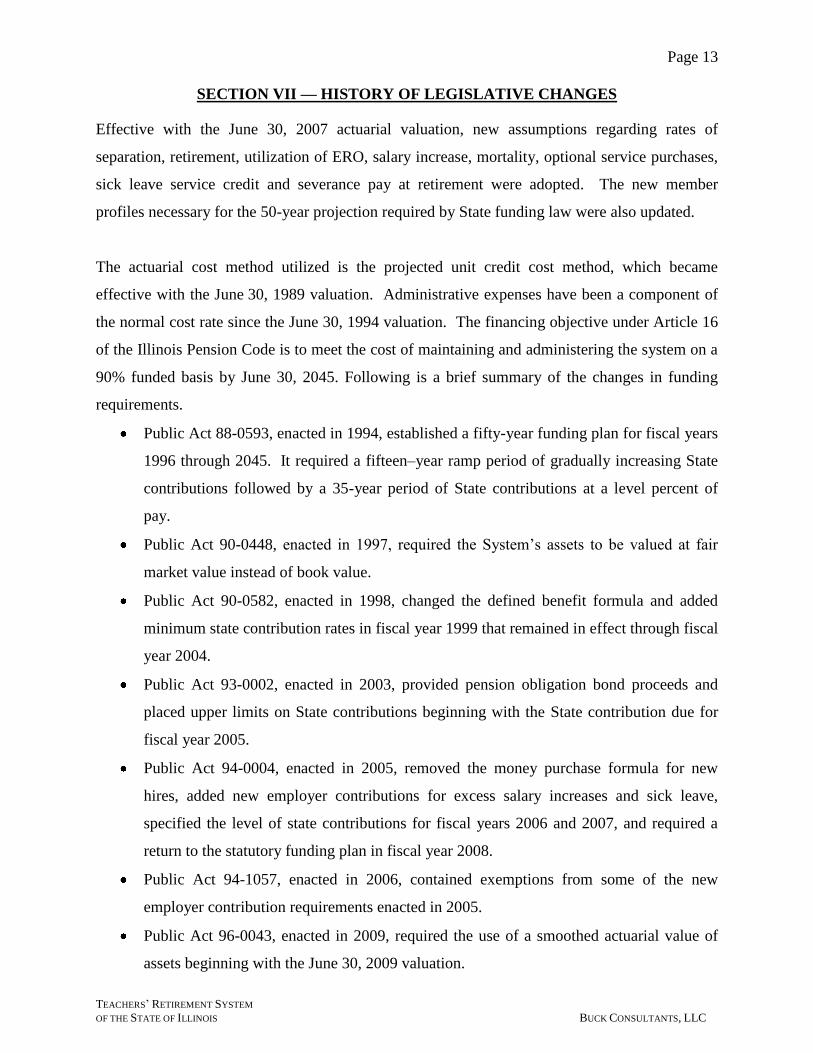
SECTION VII — HISTORY OF LEGISLATIVE CHANGES
Effective with the June 30, 2007 actuarial valuation, new assumptions regarding rates of
separation, retirement, utilization of ERO, salary increase, mortality, optional service purchases,
sick leave service credit and severance pay at retirement were adopted. The new member
profiles necessary for the 50-year projection required by State funding law were also updated.
The actuarial cost method utilized is the projected unit credit cost method, which became
effective with the June 30, 1989 valuation. Administrative expenses have been a component of
the normal cost rate since the June 30, 1994 valuation. The financing objective under Article 16
of the Illinois Pension Code is to meet the cost of maintaining and administering the system on a
90% funded basis by June 30, 2045. Following is a brief summary of the changes in funding
requirements.
Public Act 88-0593, enacted in 1994, established a fifty-year funding plan for fiscal years
1996 through 2045. It required a fifteen–year ramp period of gradually increasing State
contributions followed by a 35-year period of State contributions at a level percent of
pay.
Public Act 90-0448, enacted in 1997, required the System’s assets to be valued at fair
market value instead of book value.
Public Act 90-0582, enacted in 1998, changed the defined benefit formula and added
minimum state contribution rates in fiscal year 1999 that remained in effect through fiscal
year 2004.
Public Act 93-0002, enacted in 2003, provided pension obligation bond proceeds and
placed upper limits on State contributions beginning with the State contribution due for
fiscal year 2005.
Public Act 94-0004, enacted in 2005, removed the money purchase formula for new
hires, added new employer contributions for excess salary increases and sick leave,
specified the level of state contributions for fiscal years 2006 and 2007, and required a
return to the statutory funding plan in fiscal year 2008.
Public Act 94-1057, enacted in 2006, contained exemptions from some of the new
employer contribution requirements enacted in 2005.
Public Act 96-0043, enacted in 2009, required the use of a smoothed actuarial value of
assets beginning with the June 30, 2009 valuation.

Page 14
TEACHERS’ RETIREMENT SYSTEM
OF THE STATE OF ILLINOIS BUCK CONSULTANTS, LLC
SECTION VIII — FINANCIAL RESULTS AND MEMBERSHIP DATA -
DETAILED SUMMARIES
Detailed summaries of the financial results of the valuation and membership data used in
preparing the valuation are shown in the schedules that follow.
Schedules XII through XV are based upon the Public Act 94-0004, as amended by Public Acts
94-1057 and 96-0043. Public Act 96-0043 introduced a five-year smoothed asset value into the
determination of the contribution requests with the June 30, 2009 valuation. Prior to this date, the
projections were based on market.
Page 15
TEACHERS’ RETIREMENT SYSTEM
OF THE STATE OF ILLINOIS BUCK CONSULTANTS, LLC
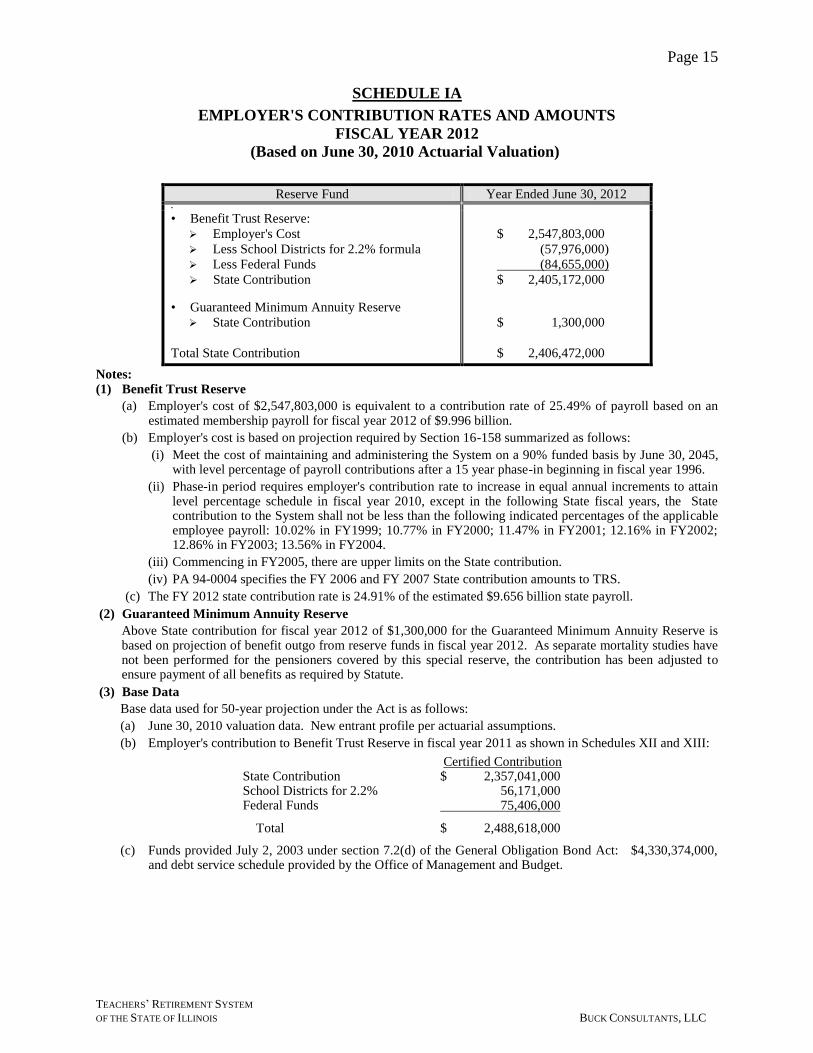
SCHEDULE IA
EMPLOYER'S CONTRIBUTION RATES AND AMOUNTS
FISCAL YEAR 2012
(Based on June 30, 2010 Actuarial Valuation)
Reserve Fund Year Ended June 30, 2012 •
• Benefit Trust Reserve:
Employer's Cost
Less School Districts for 2.2% formula
Less Federal Funds
State Contribution
• Guaranteed Minimum Annuity Reserve
State Contribution
Total State Contribution
$ 2,547,803,000
(57,976,000)
(84,655,000)
$ 2,405,172,000
$ 1,300,000
$ 2,406,472,000
Notes:
(1) Benefit Trust Reserve
(a) Employer's cost of $2,547,803,000 is equivalent to a contribution rate of 25.49% of payroll based on an estimated membership payroll for fiscal year 2012 of $9.996 billion.
(b) Employer's cost is based on projection required by Section 16-158 summarized as follows:
(i) Meet the cost of maintaining and administering the System on a 90% funded basis by June 30, 2045, with level percentage of payroll contributions after a 15 year phase-in beginning in fiscal year 1996.
(ii) Phase-in period requires employer's contribution rate to increase in equal annual increments to attain level percentage schedule in fiscal year 2010, except in the following State fiscal years, the State contribution to the System shall not be less than the following indicated percentages of the applicable employee payroll: 10.02% in FY1999; 10.77% in FY2000; 11.47% in FY2001; 12.16% in FY2002; 12.86% in FY2003; 13.56% in FY2004.
(iii) Commencing in FY2005, there are upper limits on the State contribution.
(iv) PA 94-0004 specifies the FY 2006 and FY 2007 State contribution amounts to TRS.
(c) The FY 2012 state contribution rate is 24.91% of the estimated $9.656 billion state payroll.
(2) Guaranteed Minimum Annuity Reserve
Above State contribution for fiscal year 2012 of $1,300,000 for the Guaranteed Minimum Annuity Reserve is based on projection of benefit outgo from reserve funds in fiscal year 2012. As separate mortality studies have not been performed for the pensioners covered by this special reserve, the contribution has been adjusted to ensure payment of all benefits as required by Statute.
(3) Base Data
Base data used for 50-year projection under the Act is as follows:
(a) June 30, 2010 valuation data. New entrant profile per actuarial assumptions.
(b) Employer's contribution to Benefit Trust Reserve in fiscal year 2011 as shown in Schedules XII and XIII:
State Contribution School Districts for 2.2% Federal Funds
Total
Certified Contribution $ 2,357,041,000 56,171,000 75,406,000
$ 2,488,618,000
(c) Funds provided July 2, 2003 under section 7.2(d) of the General Obligation Bond Act: $4,330,374,000, and debt service schedule provided by the Office of Management and Budget.
Page 16
TEACHERS’ RETIREMENT SYSTEM
OF THE STATE OF ILLINOIS BUCK CONSULTANTS, LLC
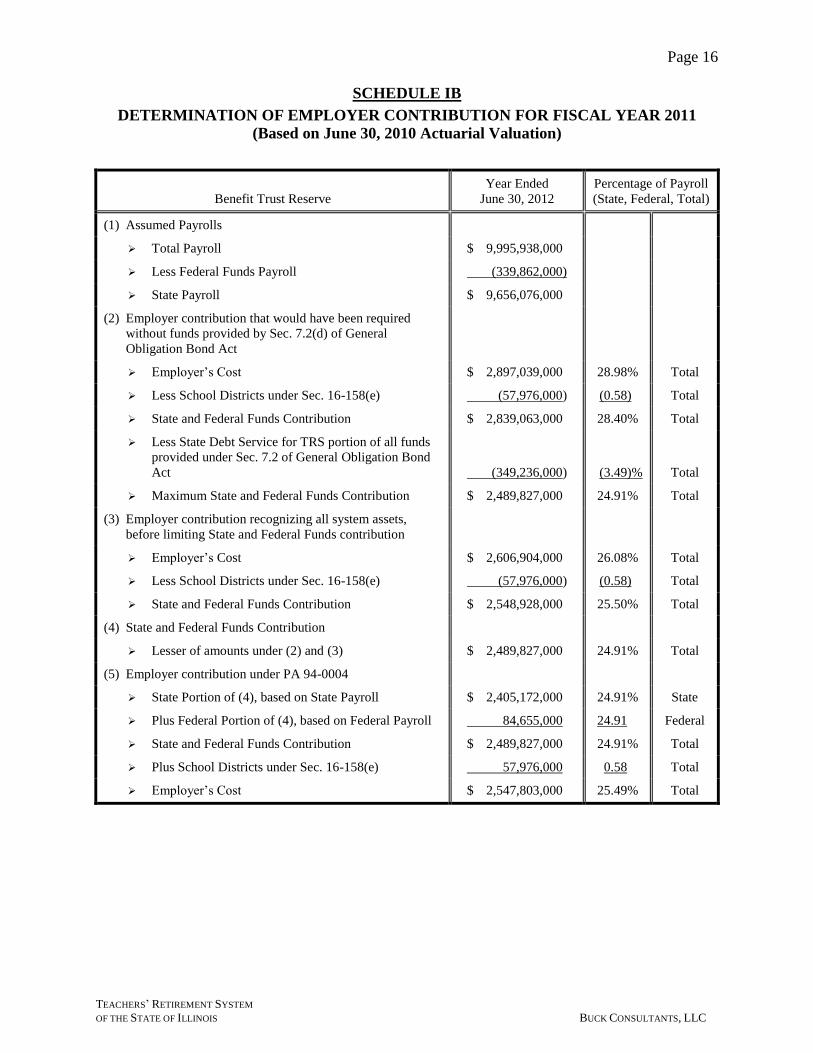
SCHEDULE IB
DETERMINATION OF EMPLOYER CONTRIBUTION FOR FISCAL YEAR 2011
(Based on June 30, 2010 Actuarial Valuation)
Benefit Trust Reserve
Year Ended
June 30, 2012
Percentage of Payroll
(State, Federal, Total)
(1) Assumed Payrolls
Total Payroll $ 9,995,938,000
Less Federal Funds Payroll (339,862,000)
State Payroll $ 9,656,076,000
(2) Employer contribution that would have been required
without funds provided by Sec. 7.2(d) of General
Obligation Bond Act
Employer’s Cost $ 2,897,039,000 28.98% Total
Less School Districts under Sec. 16-158(e) (57,976,000) (0.58) Total
State and Federal Funds Contribution $ 2,839,063,000 28.40% Total
Less State Debt Service for TRS portion of all funds
provided under Sec. 7.2 of General Obligation Bond
Act (349,236,000) (3.49)% Total
Maximum State and Federal Funds Contribution $ 2,489,827,000 24.91% Total
(3) Employer contribution recognizing all system assets,
before limiting State and Federal Funds contribution
Employer’s Cost $ 2,606,904,000 26.08% Total
Less School Districts under Sec. 16-158(e) (57,976,000) (0.58) Total
State and Federal Funds Contribution $ 2,548,928,000 25.50% Total
(4) State and Federal Funds Contribution
Lesser of amounts under (2) and (3) $ 2,489,827,000 24.91% Total
(5) Employer contribution under PA 94-0004
State Portion of (4), based on State Payroll $ 2,405,172,000 24.91% State
Plus Federal Portion of (4), based on Federal Payroll 84,655,000 24.91 Federal
State and Federal Funds Contribution $ 2,489,827,000 24.91% Total
Plus School Districts under Sec. 16-158(e) 57,976,000 0.58 Total
Employer’s Cost $ 2,547,803,000 25.49% Total
Page 17
TEACHERS’ RETIREMENT SYSTEM
OF THE STATE OF ILLINOIS BUCK CONSULTANTS, LLC
Notes:
(1) Assumed Payrolls The administrative staff of the System estimated Federal Funds payroll for the fiscal year ending June 30, 2012 would be 3.40% of total payroll. Federal Funds payroll was then projected to increase at the same rate as Total payroll for all subsequent fiscal years.
(2) Determination of Maximum State and Federal Funds Contribution Under Section 7.2(d) of the General Obligation Bond Act (GOBA), TRS received $4.33 billion on July 2, 2003. Commencing with fiscal year 2005, the maximum State contribution under the Act equals the State contribution that would have been required if this $4.33 billion contribution had not been made, reduced, but not below zero, by the State’s debt service on the TRS portion of the full $10 billion of Pension Obligation Bonds issued under Section 7.2 of the GOBA. Commencing with fiscal year 2006 the Federal Funds contribute at the same rate as the State, and so a Combined State and Federal Funds contribution must be determined.
(3) Employer Contribution Recognizing $4.33 Billion Received July 2, 2003 A gross employer contribution is determined that recognizes all system assets, and that meets the cost of maintaining and administering the System on a 90% funded basis by June 30, 2045, with level percentage of payroll contributions after a 15 year phase-in beginning in fiscal year 1996 (as described in Schedule IA).
(4) State and Federal Funds Contribution The State and Federal Funds contribution is the lesser of the maximum contribution determined under (2) or the contribution determined under (3).
(5) Employer Contribution The contribution determined under (4) is allocated to the State and to Federal Funds in proportion to their respective payrolls (shown in (1)). The employer contribution under PA 94-0004 equals the sum of these contributions, plus the expected 0.58% of payroll School District contributions for the 2.2% formula made under the provisions of Sec. 16-158(e).
Additional Information The following contributions made to the Benefit Trust Reserve are not shown in Schedule IB:
(a) From Members: 1. Sec. 16-128 payments for the purchase of optional service credit. 2. Sec. 133.2 ERO lump sum payments upon retirement with ERO benefits 3. Sec. 16-152 career contributions of 9.0% of salary, plus – commencing July 1, 2005 – an
additional 0.4% toward the ERO program. (b) From School Districts:
1. Sec. 16-128(d-10) payments for excessive sick leave service credit 2. Sec. 16-133.2 ERO lump sum payments when members retire with ERO benefits 3. Sec. 16-158(f) lump sum payments at retirement for the cost of pension benefits arising from
salary increases over 6% used in the final average salary calculation. Although these types of contributions are not shown in Schedule IB (or in Schedules XIII or XIV), they are all – with the exception of Sec. 16-128(d-10) payments – taken into account in the actuarial projection of the assets and funded status of the system, and the Schedule IB calculation is performed only after the above contributions have been taken into account.
An assumption for optional service purchases has been included in the projections since the June 30, 1994 valuation, and for payments under Sec. 16-158(f) since the recertified June 30, 2004 valuation. The career ERO contributions and lump sum payments toward ERO benefits were first recognized in the June 30, 2005 actuarial valuation. Finally, there are no current assumptions for excessive sick leave service credit, and so the actuarial projections do not currently include projected payments under Sec. 16-128(d-10).
Page 18
TEACHERS’ RETIREMENT SYSTEM
OF THE STATE OF ILLINOIS BUCK CONSULTANTS, LLC
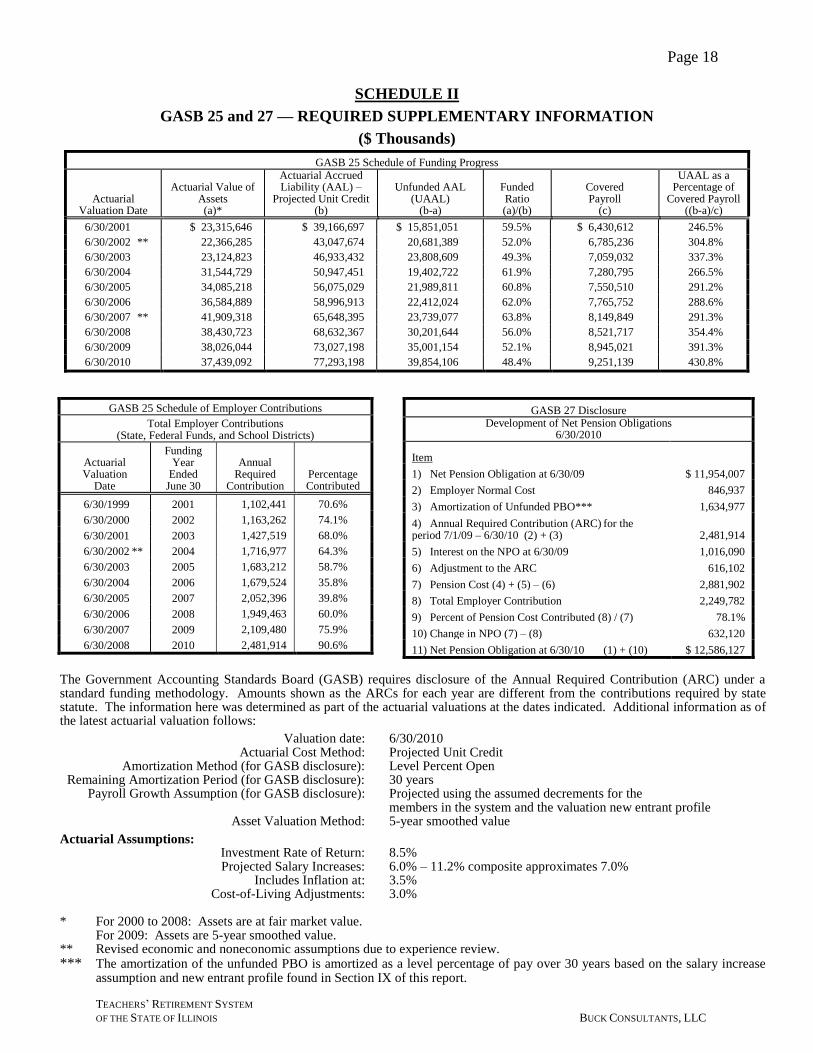
SCHEDULE II
GASB 25 and 27 — REQUIRED SUPPLEMENTARY INFORMATION
($ Thousands)
GASB 25 Schedule of Funding Progress
Actuarial Valuation Date
Actuarial Value of Assets (a)*
Actuarial Accrued Liability (AAL) –
Projected Unit Credit (b)
Unfunded AAL (UAAL)
(b-a)
Funded Ratio (a)/(b)
Covered Payroll
(c)
UAAL as a Percentage of
Covered Payroll ((b-a)/c)
6/30/2001 $ 23,315,646 $ 39,166,697 $ 15,851,051 59.5% $ 6,430,612 246.5%
6/30/2002 ** 22,366,285 43,047,674 20,681,389 52.0% 6,785,236 304.8%
6/30/2003 23,124,823 46,933,432 23,808,609 49.3% 7,059,032 337.3%
6/30/2004 31,544,729 50,947,451 19,402,722 61.9% 7,280,795 266.5%
6/30/2005 34,085,218 56,075,029 21,989,811 60.8% 7,550,510 291.2%
6/30/2006 36,584,889 58,996,913 22,412,024 62.0% 7,765,752 288.6%
6/30/2007 ** 41,909,318 65,648,395 23,739,077 63.8% 8,149,849 291.3%
6/30/2008 38,430,723 68,632,367 30,201,644 56.0% 8,521,717 354.4%
6/30/2009 38,026,044 73,027,198 35,001,154 52.1% 8,945,021 391.3%
6/30/2010 37,439,092 77,293,198 39,854,106 48.4% 9,251,139 430.8%
GASB 25 Schedule of Employer Contributions
Total Employer Contributions (State, Federal Funds, and School Districts)
Actuarial Valuation
Date
Funding Year
Ended June 30
Annual Required
Contribution Percentage Contributed
6/30/1999 2001 1,102,441 70.6%
6/30/2000 2002 1,163,262 74.1%
6/30/2001 2003 1,427,519 68.0%
6/30/2002 ** 2004 1,716,977 64.3%
6/30/2003 2005 1,683,212 58.7%
6/30/2004 2006 1,679,524 35.8%
6/30/2005 2007 2,052,396 39.8%
6/30/2006 2008 1,949,463 60.0%
6/30/2007 2009 2,109,480 75.9%
6/30/2008 2010 2,481,914 90.6%
GASB 27 Disclosure Development of Net Pension Obligations
6/30/2010
Item
1) Net Pension Obligation at 6/30/09 $ 11,954,007
2) Employer Normal Cost 846,937
3) Amortization of Unfunded PBO*** 1,634,977
4) Annual Required Contribution (ARC) for the period 7/1/09 – 6/30/10 (2) + (3) 2,481,914
5) Interest on the NPO at 6/30/09 1,016,090
6) Adjustment to the ARC 616,102
7) Pension Cost (4) + (5) – (6) 2,881,902
8) Total Employer Contribution 2,249,782
9) Percent of Pension Cost Contributed (8) / (7) 78.1%
10) Change in NPO (7) – (8) 632,120
11) Net Pension Obligation at 6/30/10 (1) + (10) $ 12,586,127
The Government Accounting Standards Board (GASB) requires disclosure of the Annual Required Contribution (ARC) under a standard funding methodology. Amounts shown as the ARCs for each year are different from the contributions required by state statute. The information here was determined as part of the actuarial valuations at the dates indicated. Additional information as of the latest actuarial valuation follows:
Valuation date: 6/30/2010 Actuarial Cost Method: Projected Unit Credit Amortization Method (for GASB disclosure): Level Percent Open Remaining Amortization Period (for GASB disclosure): 30 years Payroll Growth Assumption (for GASB disclosure): Projected using the assumed decrements for the members in the system and the valuation new entrant profile
Asset Valuation Method: 5-year smoothed value
Actuarial Assumptions: Investment Rate of Return: 8.5% Projected Salary Increases: 6.0% – 11.2% composite approximates 7.0% Includes Inflation at: 3.5% Cost-of-Living Adjustments: 3.0% * For 2000 to 2008: Assets are at fair market value. For 2009: Assets are 5-year smoothed value. ** Revised economic and noneconomic assumptions due to experience review. *** The amortization of the unfunded PBO is amortized as a level percentage of pay over 30 years based on the salary increase
assumption and new entrant profile found in Section IX of this report.
Page 19
TEACHERS’ RETIREMENT SYSTEM
OF THE STATE OF ILLINOIS BUCK CONSULTANTS, LLC
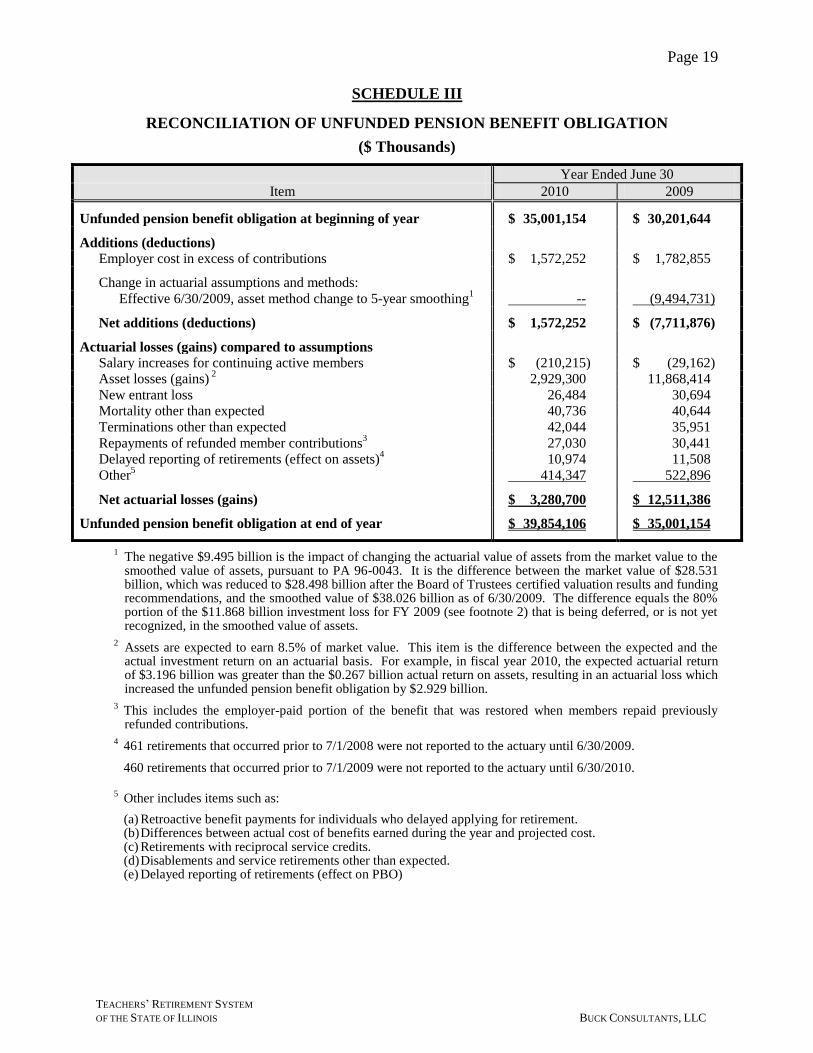
SCHEDULE III
RECONCILIATION OF UNFUNDED PENSION BENEFIT OBLIGATION
($ Thousands)
Year Ended June 30
Item 2010 2009
Unfunded pension benefit obligation at beginning of year $ 35,001,154 $ 30,201,644
Additions (deductions)
Employer cost in excess of contributions $ 1,572,252 $ 1,782,855
Change in actuarial assumptions and methods:
Effective 6/30/2009, asset method change to 5-year smoothing1 -- (9,494,731)
Net additions (deductions) $ 1,572,252 $ (7,711,876)
Actuarial losses (gains) compared to assumptions
Salary increases for continuing active members $ (210,215) $ (29,162)
Asset losses (gains) 2 2,929,300 11,868,414
New entrant loss 26,484 30,694
Mortality other than expected 40,736 40,644
Terminations other than expected 42,044 35,951
Repayments of refunded member contributions3 27,030 30,441
Delayed reporting of retirements (effect on assets)4 10,974 11,508
Other5 414,347 522,896
Net actuarial losses (gains) $ 3,280,700 $ 12,511,386
Unfunded pension benefit obligation at end of year $ 39,854,106 $ 35,001,154
1 The negative $9.495 billion is the impact of changing the actuarial value of assets from the market value to the smoothed value of assets, pursuant to PA 96-0043. It is the difference between the market value of $28.531 billion, which was reduced to $28.498 billion after the Board of Trustees certified valuation results and funding recommendations, and the smoothed value of $38.026 billion as of 6/30/2009. The difference equals the 80% portion of the $11.868 billion investment loss for FY 2009 (see footnote 2) that is being deferred, or is not yet recognized, in the smoothed value of assets.
2 Assets are expected to earn 8.5% of market value. This item is the difference between the expected and the actual investment return on an actuarial basis. For example, in fiscal year 2010, the expected actuarial return of $3.196 billion was greater than the $0.267 billion actual return on assets, resulting in an actuarial loss which increased the unfunded pension benefit obligation by $2.929 billion.
3 This includes the employer-paid portion of the benefit that was restored when members repaid previously refunded contributions.
4 461 retirements that occurred prior to 7/1/2008 were not reported to the actuary until 6/30/2009.
460 retirements that occurred prior to 7/1/2009 were not reported to the actuary until 6/30/2010.
5 Other includes items such as:
(a) Retroactive benefit payments for individuals who delayed applying for retirement. (b) Differences between actual cost of benefits earned during the year and projected cost. (c) Retirements with reciprocal service credits. (d) Disablements and service retirements other than expected. (e) Delayed reporting of retirements (effect on PBO)
Page 20
TEACHERS’ RETIREMENT SYSTEM
OF THE STATE OF ILLINOIS BUCK CONSULTANTS, LLC
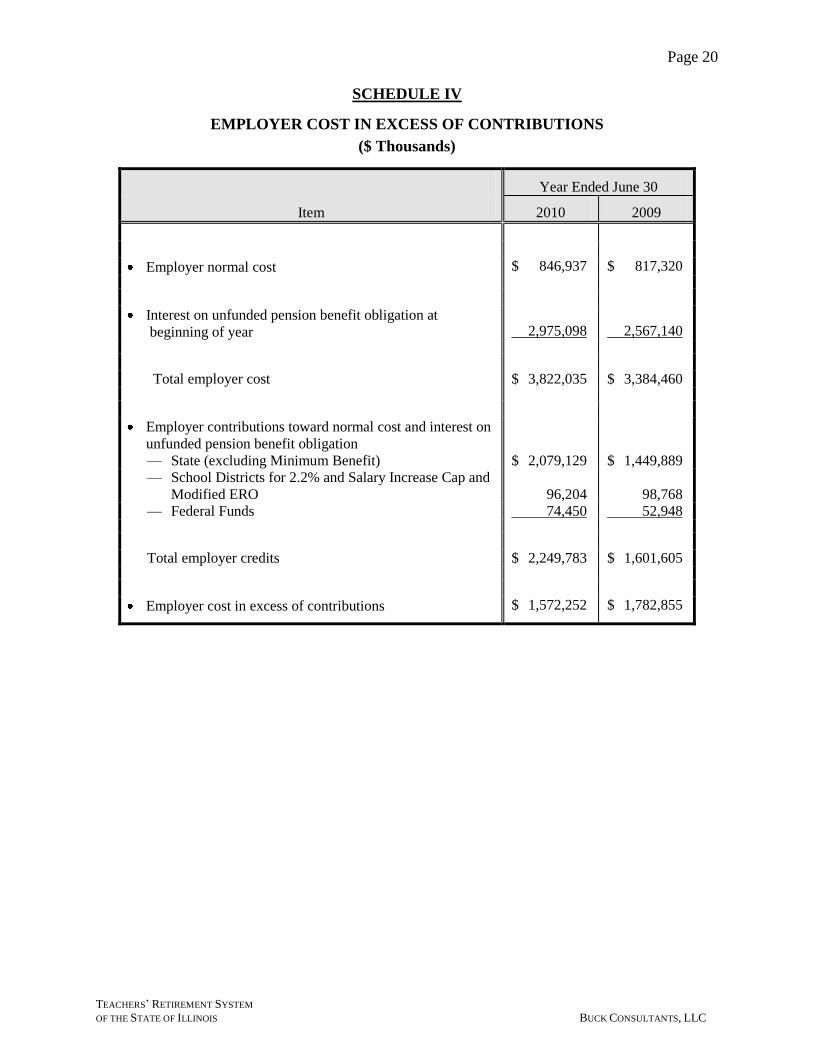
SCHEDULE IV
EMPLOYER COST IN EXCESS OF CONTRIBUTIONS
($ Thousands)
Year Ended June 30
Item 2010 2009
Employer normal cost $ 846,937 $ 817,320
Interest on unfunded pension benefit obligation at
beginning of year
2,975,098
2,567,140
Total employer cost $ 3,822,035 $ 3,384,460
Employer contributions toward normal cost and interest on
unfunded pension benefit obligation
— State (excluding Minimum Benefit) $ 2,079,129 $ 1,449,889
— School Districts for 2.2% and Salary Increase Cap and
Modified ERO 96,204 98,768
— Federal Funds 74,450 52,948
Total employer credits $ 2,249,783 $ 1,601,605
Employer cost in excess of contributions $ 1,572,252 $ 1,782,855
Page 21
TEACHERS’ RETIREMENT SYSTEM
OF THE STATE OF ILLINOIS BUCK CONSULTANTS, LLC
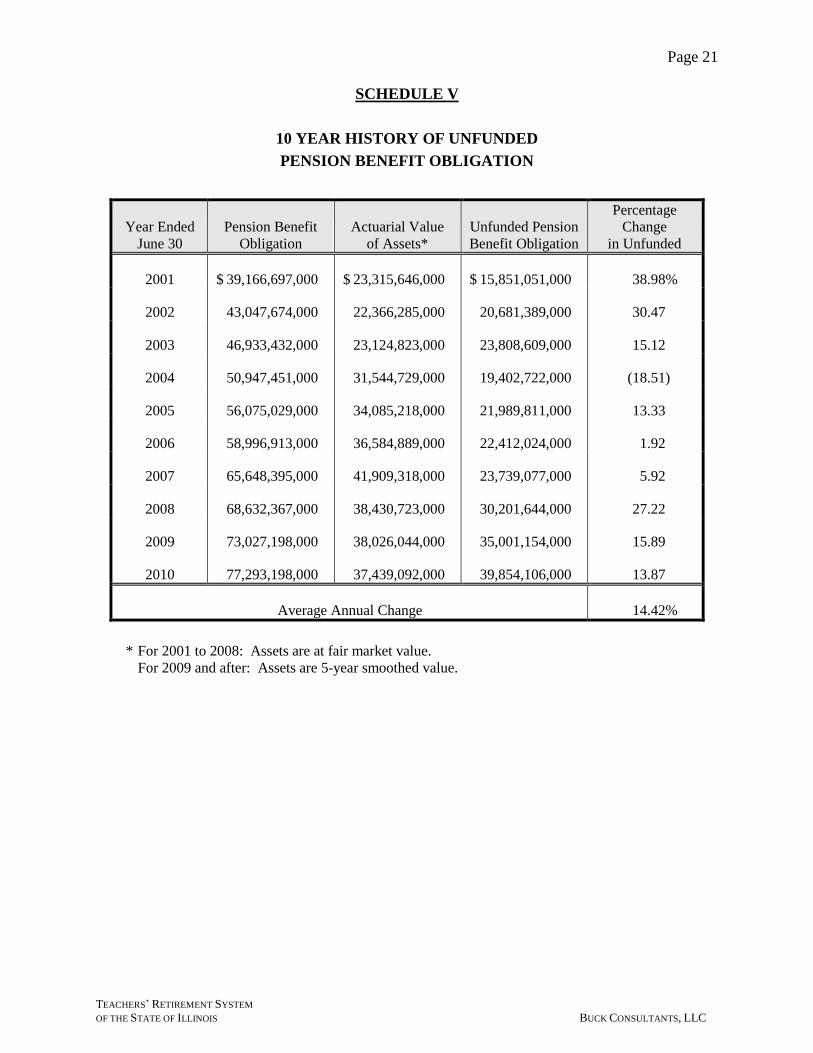
SCHEDULE V
10 YEAR HISTORY OF UNFUNDED
PENSION BENEFIT OBLIGATION
Year Ended
June 30
Pension Benefit
Obligation
Actuarial Value
of Assets*
Unfunded Pension
Benefit Obligation
Percentage
Change
in Unfunded
2001 $ 39,166,697,000 $ 23,315,646,000 $ 15,851,051,000 38.98%
2002 43,047,674,000 22,366,285,000 20,681,389,000 30.47
2003 46,933,432,000 23,124,823,000 23,808,609,000 15.12
2004 50,947,451,000 31,544,729,000 19,402,722,000 (18.51)
2005 56,075,029,000 34,085,218,000 21,989,811,000 13.33
2006 58,996,913,000 36,584,889,000 22,412,024,000 1.92
2007 65,648,395,000 41,909,318,000 23,739,077,000 5.92
2008 68,632,367,000 38,430,723,000 30,201,644,000 27.22
2009 73,027,198,000 38,026,044,000 35,001,154,000 15.89
2010 77,293,198,000 37,439,092,000 39,854,106,000 13.87
Average Annual Change 14.42%
* For 2001 to 2008: Assets are at fair market value.
For 2009 and after: Assets are 5-year smoothed value.
Page 22
TEACHERS’ RETIREMENT SYSTEM
OF THE STATE OF ILLINOIS BUCK CONSULTANTS, LLC
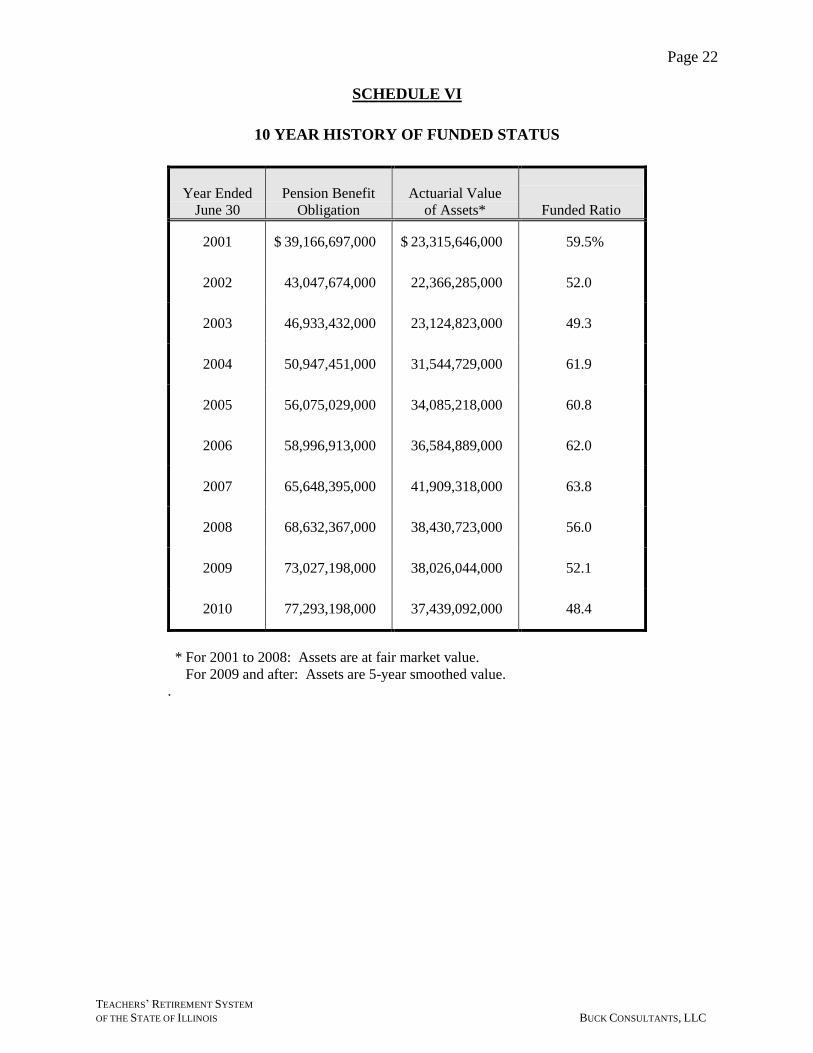
SCHEDULE VI
10 YEAR HISTORY OF FUNDED STATUS
Year Ended
June 30
Pension Benefit
Obligation
Actuarial Value
of Assets* Funded Ratio
2001 $ 39,166,697,000 $ 23,315,646,000 59.5%
2002 43,047,674,000 22,366,285,000 52.0
2003 46,933,432,000 23,124,823,000 49.3
2004 50,947,451,000 31,544,729,000 61.9
2005 56,075,029,000 34,085,218,000 60.8
2006 58,996,913,000 36,584,889,000 62.0
2007 65,648,395,000 41,909,318,000 63.8
2008 68,632,367,000 38,430,723,000 56.0
2009 73,027,198,000 38,026,044,000 52.1
2010 77,293,198,000 37,439,092,000 48.4
* For 2001 to 2008: Assets are at fair market value.
For 2009 and after: Assets are 5-year smoothed value.
.
Page 23
TEACHERS’ RETIREMENT SYSTEM
OF THE STATE OF ILLINOIS BUCK CONSULTANTS, LLC
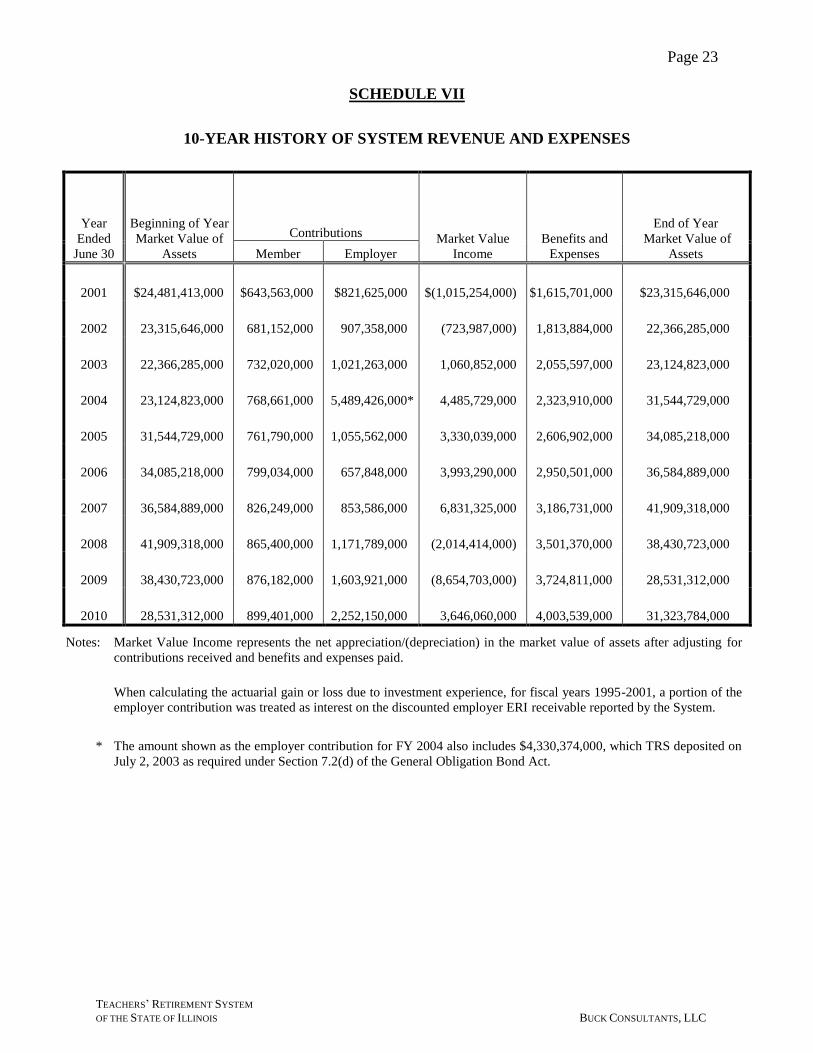
SCHEDULE VII
10-YEAR HISTORY OF SYSTEM REVENUE AND EXPENSES
Year
Ended
June 30
Beginning of Year
Market Value of
Assets
Contributions Market Value
Income
Benefits and
Expenses
End of Year
Market Value of
Assets Member Employer
2001 $24,481,413,000 $643,563,000 $821,625,000 $(1,015,254,000) $1,615,701,000 $23,315,646,000
2002 23,315,646,000 681,152,000 907,358,000 (723,987,000) 1,813,884,000 22,366,285,000
2003 22,366,285,000 732,020,000 1,021,263,000 1,060,852,000 2,055,597,000 23,124,823,000
2004 23,124,823,000 768,661,000 5,489,426,000* 4,485,729,000 2,323,910,000 31,544,729,000
2005 31,544,729,000 761,790,000 1,055,562,000 3,330,039,000 2,606,902,000 34,085,218,000
2006 34,085,218,000 799,034,000 657,848,000 3,993,290,000 2,950,501,000 36,584,889,000
2007 36,584,889,000 826,249,000 853,586,000 6,831,325,000 3,186,731,000 41,909,318,000
2008 41,909,318,000 865,400,000 1,171,789,000 (2,014,414,000) 3,501,370,000 38,430,723,000
2009 38,430,723,000 876,182,000 1,603,921,000 (8,654,703,000) 3,724,811,000 28,531,312,000
2010 28,531,312,000 899,401,000 2,252,150,000 3,646,060,000 4,003,539,000 31,323,784,000
Notes: Market Value Income represents the net appreciation/(depreciation) in the market value of assets after adjusting for
contributions received and benefits and expenses paid.
When calculating the actuarial gain or loss due to investment experience, for fiscal years 1995-2001, a portion of the
employer contribution was treated as interest on the discounted employer ERI receivable reported by the System.
* The amount shown as the employer contribution for FY 2004 also includes $4,330,374,000, which TRS deposited on
July 2, 2003 as required under Section 7.2(d) of the General Obligation Bond Act.
Page 24
TEACHERS’ RETIREMENT SYSTEM
OF THE STATE OF ILLINOIS BUCK CONSULTANTS, LLC
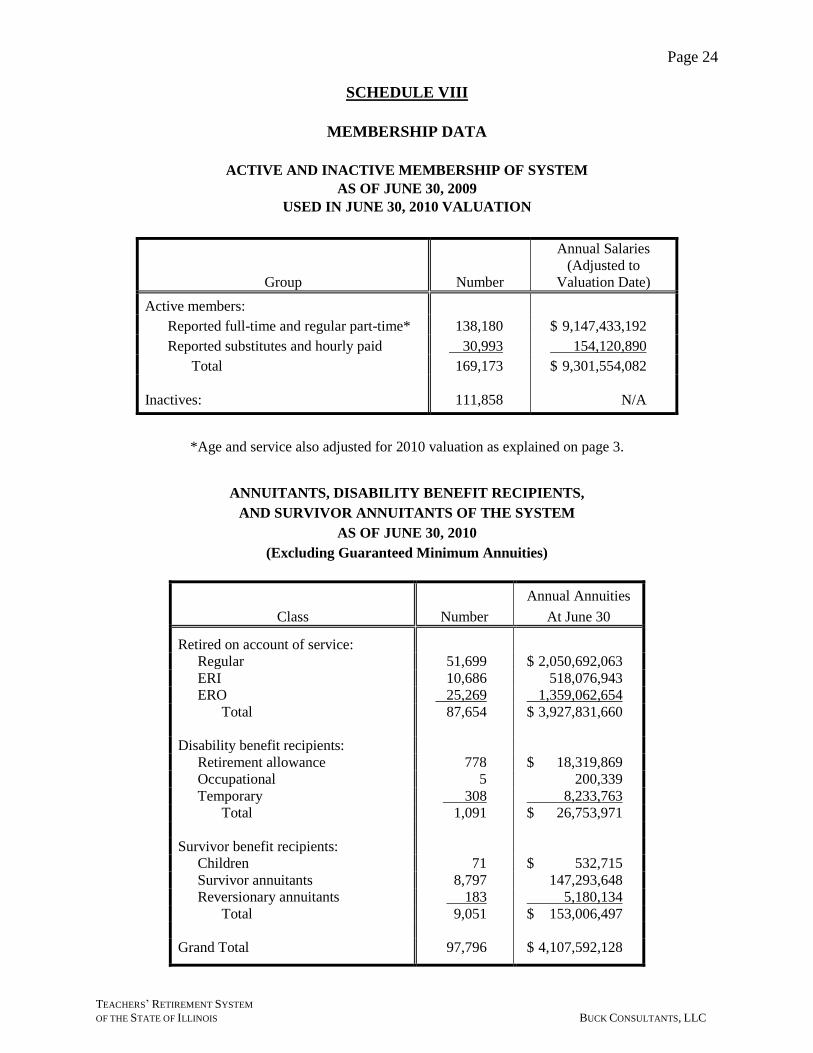
SCHEDULE VIII
MEMBERSHIP DATA
ACTIVE AND INACTIVE MEMBERSHIP OF SYSTEM
AS OF JUNE 30, 2009
USED IN JUNE 30, 2010 VALUATION
Group Number
Annual Salaries
(Adjusted to
Valuation Date)
Active members:
Reported full-time and regular part-time* 138,180 $ 9,147,433,192
Reported substitutes and hourly paid 30,993 154,120,890
Total 169,173 $ 9,301,554,082
Inactives: 111,858 N/A
*Age and service also adjusted for 2010 valuation as explained on page 3.
ANNUITANTS, DISABILITY BENEFIT RECIPIENTS,
AND SURVIVOR ANNUITANTS OF THE SYSTEM
AS OF JUNE 30, 2010
(Excluding Guaranteed Minimum Annuities)
Class Number
Annual Annuities
At June 30
Retired on account of service:
Regular 51,699 $ 2,050,692,063
ERI 10,686 518,076,943
ERO 25,269 1,359,062,654
Total 87,654 $ 3,927,831,660
Disability benefit recipients:
Retirement allowance 778 $ 18,319,869
Occupational 5 200,339
Temporary 308 8,233,763
Total 1,091 $ 26,753,971
Survivor benefit recipients:
Children 71 $ 532,715
Survivor annuitants 8,797 147,293,648
Reversionary annuitants 183 5,180,134
Total 9,051 $ 153,006,497
Grand Total 97,796 $ 4,107,592,128
Page 25
TEACHERS’ RETIREMENT SYSTEM
OF THE STATE OF ILLINOIS BUCK CONSULTANTS, LLC
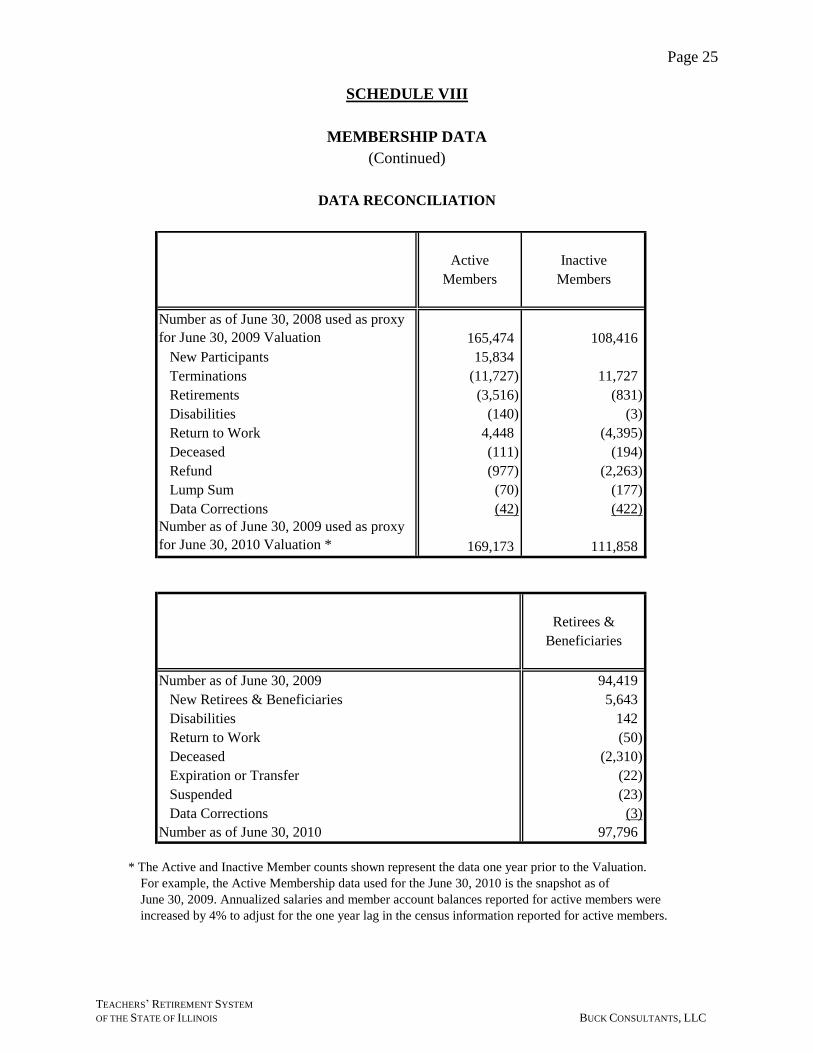
Active Inactive
Members Members
Number as of June 30, 2008 used as proxy
for June 30, 2009 Valuation 165,474 108,416
New Participants 15,834
Terminations (11,727) 11,727
Retirements (3,516) (831)
Disabilities (140) (3)
Return to Work 4,448 (4,395)
Deceased (111) (194)
Refund (977) (2,263)
Lump Sum (70) (177)
Data Corrections (42) (422)
Number as of June 30, 2009 used as proxy
for June 30, 2010 Valuation * 169,173 111,858
Retirees &
Beneficiaries
Number as of June 30, 2009 94,419
New Retirees & Beneficiaries 5,643
Disabilities 142
Return to Work (50)
Deceased (2,310)
Expiration or Transfer (22)
Suspended (23)
Data Corrections (3)
Number as of June 30, 2010 97,796
* The Active and Inactive Member counts shown represent the data one year prior to the Valuation.
For example, the Active Membership data used for the June 30, 2010 is the snapshot as of
June 30, 2009. Annualized salaries and member account balances reported for active members were
increased by 4% to adjust for the one year lag in the census information reported for active members.
SCHEDULE VIII
MEMBERSHIP DATA
(Continued)
DATA RECONCILIATION

Page 26
TEACHERS’ RETIREMENT SYSTEM
OF THE STATE OF ILLINOIS BUCK CONSULTANTS, LLC
SCHEDULE IX
HISTORY OF ACTIVE MEMBERSHIP DATA
FOR LAST 10 YEARS
Full-Time and Regular Part-Time
Census
Date
June 30
Number
of Active
Members
Percentage
Change in
Membership
Average
Annual
Salary
Percentage
Change in
Salary
2000 122,598 2.74% $ 50,195 2.70%
2001 125,044 2.00 51,720 3.04
2002 126,738 1.35 53,319 3.09
2003 128,140 1.11 55,466 4.03
2004 127,405 (0.57) 56,871 2.53
2005 126,798 (0.48) 58,715 3.24
2006 130,867 3.21 59,948 2.10
2007 132,287 1.09 61,713 2.94
2008 136,328 3.05 63,986 3.68
2009 138,180 1.36 66,199 3.46
Substitutes, Part-Time and Hourly-Paid
Census
Date
June 30
Number
of Active
Members
Percentage
Change in
Membership
Average
Annual
Salary
Percentage
Change in
Salary
2000 24,235 2.81% $ 4,306 5.75%
2001 24,778 2.24 4,532 5.25
2002 27,952 12.81 4,488 (0.97)
2003 29,645 6.06 4,587 2.21
2004 30,238 2.00 4,294 (6.39)
2005 29,148 (3.60) 4,636 7.96
2006 28,355 (2.72) 4,784 3.19
2007 28,514 0.56 4,890 2.22
2008 29,146 2.22 5,128 4.87
2009 30,993 6.34 4,973 (3.02)
Page 27
TEACHERS’ RETIREMENT SYSTEM
OF THE STATE OF ILLINOIS BUCK CONSULTANTS, LLC
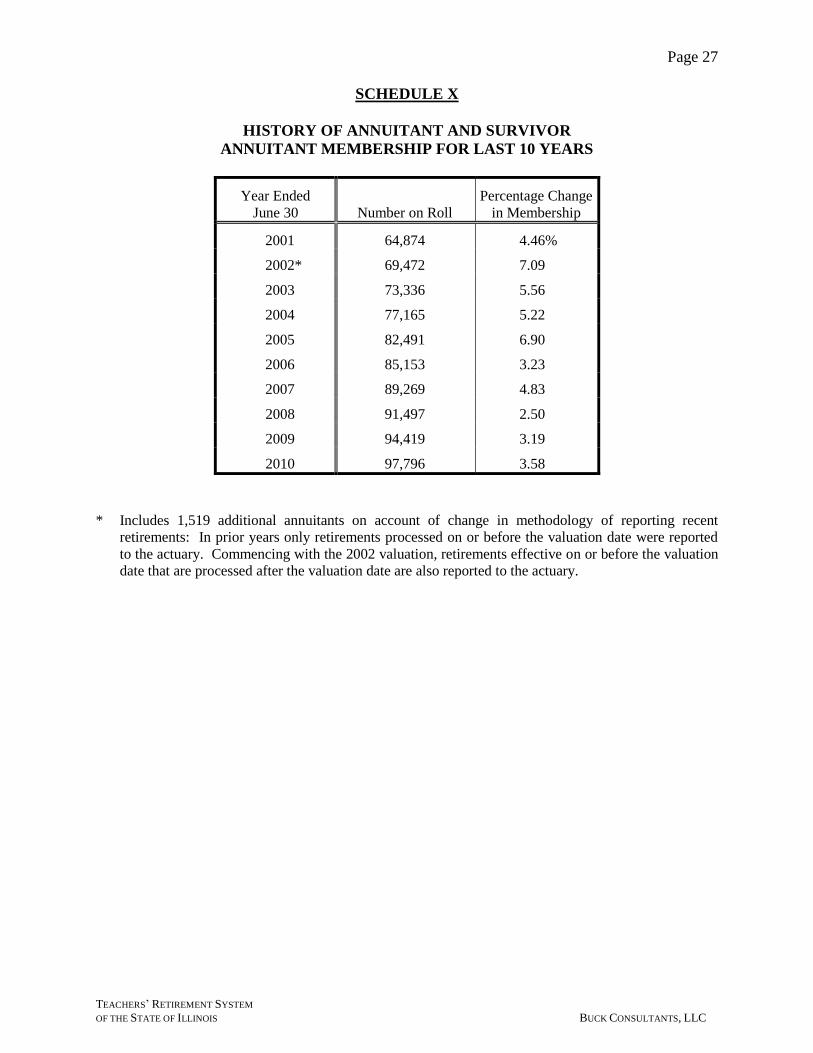
SCHEDULE X
HISTORY OF ANNUITANT AND SURVIVOR
ANNUITANT MEMBERSHIP FOR LAST 10 YEARS
Year Ended
June 30 Number on Roll
Percentage Change
in Membership
2001 64,874 4.46%
2002* 69,472 7.09
2003 73,336 5.56
2004 77,165 5.22
2005 82,491 6.90
2006 85,153 3.23
2007 89,269 4.83
2008 91,497 2.50
2009 94,419 3.19
2010 97,796 3.58
* Includes 1,519 additional annuitants on account of change in methodology of reporting recent
retirements: In prior years only retirements processed on or before the valuation date were reported
to the actuary. Commencing with the 2002 valuation, retirements effective on or before the valuation
date that are processed after the valuation date are also reported to the actuary.

Page 28
TEACHERS’ RETIREMENT SYSTEM
OF THE STATE OF ILLINOIS BUCK CONSULTANTS, LLC
SCHEDULE XI
BENEFIT STREAM FOR GUARANTEED MINIMUM ANNUITY RESERVE
Benefit Payment Stream Benefit Payment Stream
Fiscal Year
Guaranteed
Minimum
Fiscal Year
Guaranteed
Minimum
2011 $ 1,367,950 2035 $ 26,540
2012 1,222,430 2036 21,430
2013 1,087,310 2037 17,210
2014 962,360 2038 13,720
2015 847,520 2039 10,860
2016 742,670 2040 8,520
2017 647,540 2041 6,620
2018 561,810 2042 5,090
2019 485,030 2043 3,860
2020 416,710 2044 2,890
2021 356,310 2045 2,130
2022 303,260 2046 1,550
2023 256,950 2047 1,110
2024 216,800 2048 780
2025 182,180 2049 540
2026 152,510 2050 370
2027 127,220 2051 240
2028 105,780 2052 160
2029 87,670 2053 100
2030 72,450 2054 60
2031 59,680 2055 30
2032 49,010 2056 20
2033 40,110 2057 10
2034 32,700 2058 -
Notes:
(1) Above benefit payment amounts were projected based on the mortality assumptions for the
general pensioner population.
(2) As separate mortality studies have not been performed for this special group, the fiscal 2012 State
Contribution shown on the Summary of Principal Results has been adjusted to endure payment of
all required benefit amounts, as required by Statute.
Pag
e 29
TEACHERS’ RETIREMENT SYSTEM
OF THE STATE OF ILLINOIS BUCK CONSULTANTS, LLC
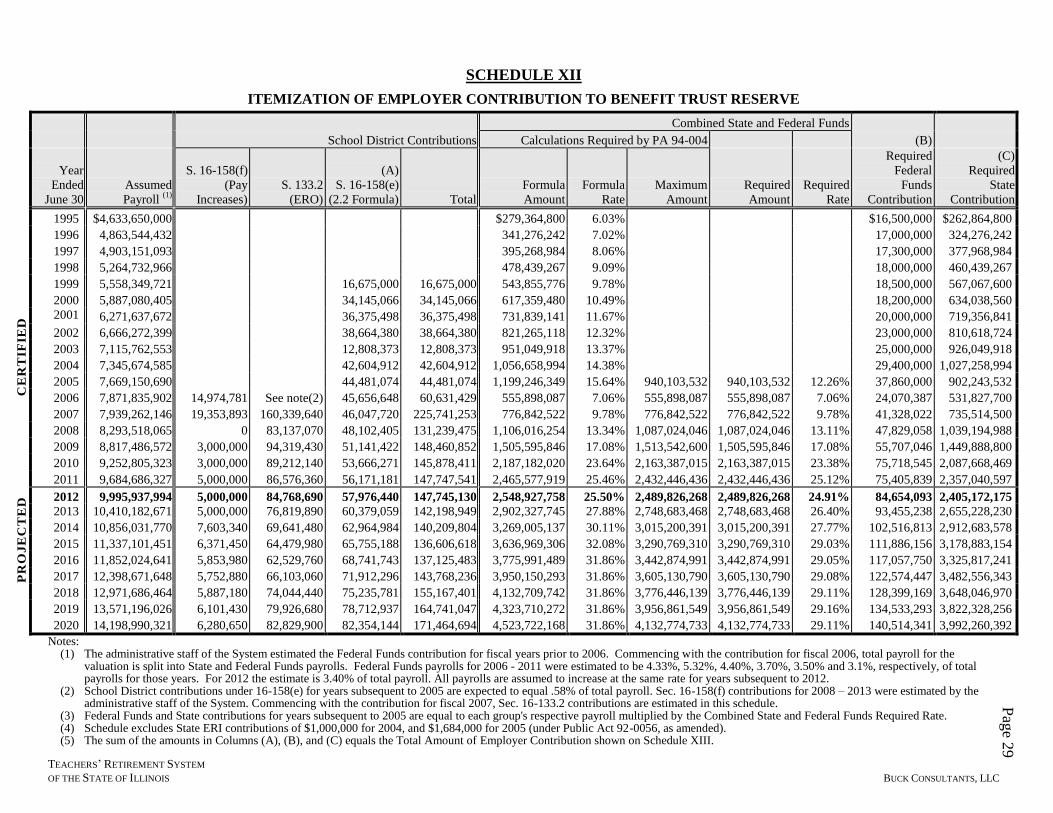
SCHEDULE XII
ITEMIZATION OF EMPLOYER CONTRIBUTION TO BENEFIT TRUST RESERVE
Combined State and Federal Funds
School District Contributions Calculations Required by PA 94-004 (B)
Year
Ended
June 30
Assumed
Payroll (1)
S. 16-158(f)
(Pay
Increases)
S. 133.2
(ERO)
(A)
S. 16-158(e)
(2.2 Formula) Total
Formula
Amount
Formula
Rate
Maximum
Amount
Required
Amount
Required
Rate
Required
Federal
Funds
Contribution
(C)
Required
State
Contribution
1995 $4,633,650,000 $279,364,800 6.03% $16,500,000 $262,864,800
1996 4,863,544,432 341,276,242 7.02% 17,000,000 324,276,242
1997 4,903,151,093 395,268,984 8.06% 17,300,000 377,968,984
1998 5,264,732,966 478,439,267 9.09% 18,000,000 460,439,267
1999 5,558,349,721 16,675,000 16,675,000 543,855,776 9.78% 18,500,000 567,067,600
2000 5,887,080,405 34,145,066 34,145,066 617,359,480 10.49% 18,200,000 634,038,560
2001 6,271,637,672 36,375,498 36,375,498 731,839,141 11.67% 20,000,000 719,356,841
2002 6,666,272,399 38,664,380 38,664,380 821,265,118 12.32% 23,000,000 810,618,724
2003 7,115,762,553 12,808,373 12,808,373 951,049,918 13.37% 25,000,000 926,049,918
2004 7,345,674,585 42,604,912 42,604,912 1,056,658,994 14.38% 29,400,000 1,027,258,994
2005 7,669,150,690 44,481,074 44,481,074 1,199,246,349 15.64% 940,103,532 940,103,532 12.26% 37,860,000 902,243,532
2006 7,871,835,902 14,974,781 See note(2) 45,656,648 60,631,429 555,898,087 7.06% 555,898,087 555,898,087 7.06% 24,070,387 531,827,700
2007 7,939,262,146 19,353,893 160,339,640 46,047,720 225,741,253 776,842,522 9.78% 776,842,522 776,842,522 9.78% 41,328,022 735,514,500
2008 8,293,518,065 0 83,137,070 48,102,405 131,239,475 1,106,016,254 13.34% 1,087,024,046 1,087,024,046 13.11% 47,829,058 1,039,194,988
2009 8,817,486,572 3,000,000 94,319,430 51,141,422 148,460,852 1,505,595,846 17.08% 1,513,542,600 1,505,595,846 17.08% 55,707,046 1,449,888,800
2010 9,252,805,323 3,000,000 89,212,140 53,666,271 145,878,411 2,187,182,020 23.64% 2,163,387,015 2,163,387,015 23.38% 75,718,545 2,087,668,469
2011 9,684,686,327 5,000,000 86,576,360 56,171,181 147,747,541 2,465,577,919 25.46% 2,432,446,436 2,432,446,436 25.12% 75,405,839 2,357,040,597
2012 9,995,937,994 5,000,000 84,768,690 57,976,440 147,745,130 2,548,927,758 25.50% 2,489,826,268 2,489,826,268 24.91% 84,654,093 2,405,172,175
2013 10,410,182,671 5,000,000 76,819,890 60,379,059 142,198,949 2,902,327,745 27.88% 2,748,683,468 2,748,683,468 26.40% 93,455,238 2,655,228,230
2014 10,856,031,770 7,603,340 69,641,480 62,964,984 140,209,804 3,269,005,137 30.11% 3,015,200,391 3,015,200,391 27.77% 102,516,813 2,912,683,578
2015 11,337,101,451 6,371,450 64,479,980 65,755,188 136,606,618 3,636,969,306 32.08% 3,290,769,310 3,290,769,310 29.03% 111,886,156 3,178,883,154
2016 11,852,024,641 5,853,980 62,529,760 68,741,743 137,125,483 3,775,991,489 31.86% 3,442,874,991 3,442,874,991 29.05% 117,057,750 3,325,817,241
2017 12,398,671,648 5,752,880 66,103,060 71,912,296 143,768,236 3,950,150,293 31.86% 3,605,130,790 3,605,130,790 29.08% 122,574,447 3,482,556,343
2018 12,971,686,464 5,887,180 74,044,440 75,235,781 155,167,401 4,132,709,742 31.86% 3,776,446,139 3,776,446,139 29.11% 128,399,169 3,648,046,970
2019 13,571,196,026 6,101,430 79,926,680 78,712,937 164,741,047 4,323,710,272 31.86% 3,956,861,549 3,956,861,549 29.16% 134,533,293 3,822,328,256
2020 14,198,990,321 6,280,650 82,829,900 82,354,144 171,464,694 4,523,722,168 31.86% 4,132,774,733 4,132,774,733 29.11% 140,514,341 3,992,260,392
Notes: (1) The administrative staff of the System estimated the Federal Funds contribution for fiscal years prior to 2006. Commencing with the contribution for fiscal 2006, total payroll for the
valuation is split into State and Federal Funds payrolls. Federal Funds payrolls for 2006 - 2011 were estimated to be 4.33%, 5.32%, 4.40%, 3.70%, 3.50% and 3.1%, respectively, of total payrolls for those years. For 2012 the estimate is 3.40% of total payroll. All payrolls are assumed to increase at the same rate for years subsequent to 2012.
(2) School District contributions under 16-158(e) for years subsequent to 2005 are expected to equal .58% of total payroll. Sec. 16-158(f) contributions for 2008 – 2013 were estimated by the administrative staff of the System. Commencing with the contribution for fiscal 2007, Sec. 16-133.2 contributions are estimated in this schedule.
(3) Federal Funds and State contributions for years subsequent to 2005 are equal to each group's respective payroll multiplied by the Combined State and Federal Funds Required Rate. (4) Schedule excludes State ERI contributions of $1,000,000 for 2004, and $1,684,000 for 2005 (under Public Act 92-0056, as amended). (5) The sum of the amounts in Columns (A), (B), and (C) equals the Total Amount of Employer Contribution shown on Schedule XIII.
PR
OJ
EC
TE
DC
ER
TIF
IED
Pag
e 30
TEACHERS’ RETIREMENT SYSTEM
OF THE STATE OF ILLINOIS BUCK CONSULTANTS, LLC
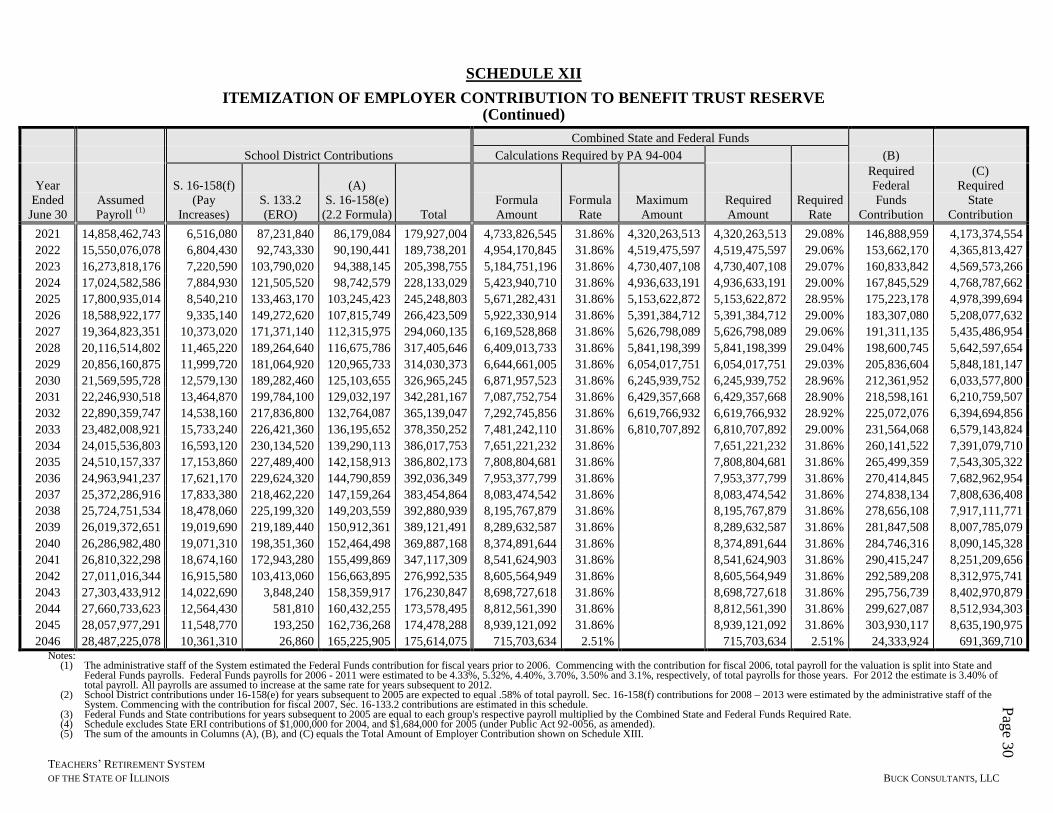
SCHEDULE XII
ITEMIZATION OF EMPLOYER CONTRIBUTION TO BENEFIT TRUST RESERVE (Continued)
Combined State and Federal Funds
School District Contributions Calculations Required by PA 94-004 (B)
Year
Ended
June 30
Assumed
Payroll (1)
S. 16-158(f)
(Pay
Increases)
S. 133.2
(ERO)
(A)
S. 16-158(e)
(2.2 Formula) Total
Formula
Amount
Formula
Rate
Maximum
Amount
Required
Amount
Required
Rate
Required
Federal
Funds
Contribution
(C)
Required
State
Contribution
2021 14,858,462,743 6,516,080 87,231,840 86,179,084 179,927,004 4,733,826,545 31.86% 4,320,263,513 4,320,263,513 29.08% 146,888,959 4,173,374,554
2022 15,550,076,078 6,804,430 92,743,330 90,190,441 189,738,201 4,954,170,845 31.86% 4,519,475,597 4,519,475,597 29.06% 153,662,170 4,365,813,427
2023 16,273,818,176 7,220,590 103,790,020 94,388,145 205,398,755 5,184,751,196 31.86% 4,730,407,108 4,730,407,108 29.07% 160,833,842 4,569,573,266
2024 17,024,582,586 7,884,930 121,505,520 98,742,579 228,133,029 5,423,940,710 31.86% 4,936,633,191 4,936,633,191 29.00% 167,845,529 4,768,787,662
2025 17,800,935,014 8,540,210 133,463,170 103,245,423 245,248,803 5,671,282,431 31.86% 5,153,622,872 5,153,622,872 28.95% 175,223,178 4,978,399,694
2026 18,588,922,177 9,335,140 149,272,620 107,815,749 266,423,509 5,922,330,914 31.86% 5,391,384,712 5,391,384,712 29.00% 183,307,080 5,208,077,632
2027 19,364,823,351 10,373,020 171,371,140 112,315,975 294,060,135 6,169,528,868 31.86% 5,626,798,089 5,626,798,089 29.06% 191,311,135 5,435,486,954
2028 20,116,514,802 11,465,220 189,264,640 116,675,786 317,405,646 6,409,013,733 31.86% 5,841,198,399 5,841,198,399 29.04% 198,600,745 5,642,597,654
2029 20,856,160,875 11,999,720 181,064,920 120,965,733 314,030,373 6,644,661,005 31.86% 6,054,017,751 6,054,017,751 29.03% 205,836,604 5,848,181,147
2030 21,569,595,728 12,579,130 189,282,460 125,103,655 326,965,245 6,871,957,523 31.86% 6,245,939,752 6,245,939,752 28.96% 212,361,952 6,033,577,800
2031 22,246,930,518 13,464,870 199,784,100 129,032,197 342,281,167 7,087,752,754 31.86% 6,429,357,668 6,429,357,668 28.90% 218,598,161 6,210,759,507
2032 22,890,359,747 14,538,160 217,836,800 132,764,087 365,139,047 7,292,745,856 31.86% 6,619,766,932 6,619,766,932 28.92% 225,072,076 6,394,694,856
2033 23,482,008,921 15,733,240 226,421,360 136,195,652 378,350,252 7,481,242,110 31.86% 6,810,707,892 6,810,707,892 29.00% 231,564,068 6,579,143,824
2034 24,015,536,803 16,593,120 230,134,520 139,290,113 386,017,753 7,651,221,232 31.86% 7,651,221,232 31.86% 260,141,522 7,391,079,710
2035 24,510,157,337 17,153,860 227,489,400 142,158,913 386,802,173 7,808,804,681 31.86% 7,808,804,681 31.86% 265,499,359 7,543,305,322
2036 24,963,941,237 17,621,170 229,624,320 144,790,859 392,036,349 7,953,377,799 31.86% 7,953,377,799 31.86% 270,414,845 7,682,962,954
2037 25,372,286,916 17,833,380 218,462,220 147,159,264 383,454,864 8,083,474,542 31.86% 8,083,474,542 31.86% 274,838,134 7,808,636,408
2038 25,724,751,534 18,478,060 225,199,320 149,203,559 392,880,939 8,195,767,879 31.86% 8,195,767,879 31.86% 278,656,108 7,917,111,771
2039 26,019,372,651 19,019,690 219,189,440 150,912,361 389,121,491 8,289,632,587 31.86% 8,289,632,587 31.86% 281,847,508 8,007,785,079
2040 26,286,982,480 19,071,310 198,351,360 152,464,498 369,887,168 8,374,891,644 31.86% 8,374,891,644 31.86% 284,746,316 8,090,145,328
2041 26,810,322,298 18,674,160 172,943,280 155,499,869 347,117,309 8,541,624,903 31.86% 8,541,624,903 31.86% 290,415,247 8,251,209,656
2042 27,011,016,344 16,915,580 103,413,060 156,663,895 276,992,535 8,605,564,949 31.86% 8,605,564,949 31.86% 292,589,208 8,312,975,741
2043 27,303,433,912 14,022,690 3,848,240 158,359,917 176,230,847 8,698,727,618 31.86% 8,698,727,618 31.86% 295,756,739 8,402,970,879
2044 27,660,733,623 12,564,430 581,810 160,432,255 173,578,495 8,812,561,390 31.86% 8,812,561,390 31.86% 299,627,087 8,512,934,303
2045 28,057,977,291 11,548,770 193,250 162,736,268 174,478,288 8,939,121,092 31.86% 8,939,121,092 31.86% 303,930,117 8,635,190,975
2046 28,487,225,078 10,361,310 26,860 165,225,905 175,614,075 715,703,634 2.51% 715,703,634 2.51% 24,333,924 691,369,710 Notes:
(1) The administrative staff of the System estimated the Federal Funds contribution for fiscal years prior to 2006. Commencing with the contribution for fiscal 2006, total payroll for the valuation is split into State and Federal Funds payrolls. Federal Funds payrolls for 2006 - 2011 were estimated to be 4.33%, 5.32%, 4.40%, 3.70%, 3.50% and 3.1%, respectively, of total payrolls for those years. For 2012 the estimate is 3.40% of total payroll. All payrolls are assumed to increase at the same rate for years subsequent to 2012.
(2) School District contributions under 16-158(e) for years subsequent to 2005 are expected to equal .58% of total payroll. Sec. 16-158(f) contributions for 2008 – 2013 were estimated by the administrative staff of the System. Commencing with the contribution for fiscal 2007, Sec. 16-133.2 contributions are estimated in this schedule.
(3) Federal Funds and State contributions for years subsequent to 2005 are equal to each group's respective payroll multiplied by the Combined State and Federal Funds Required Rate. (4) Schedule excludes State ERI contributions of $1,000,000 for 2004, and $1,684,000 for 2005 (under Public Act 92-0056, as amended). (5) The sum of the amounts in Columns (A), (B), and (C) equals the Total Amount of Employer Contribution shown on Schedule XIII.
Pag
e 31
TEACHERS’ RETIREMENT SYSTEM
OF THE STATE OF ILLINOIS BUCK CONSULTANTS, LLC
CE
RT
IFIE
D
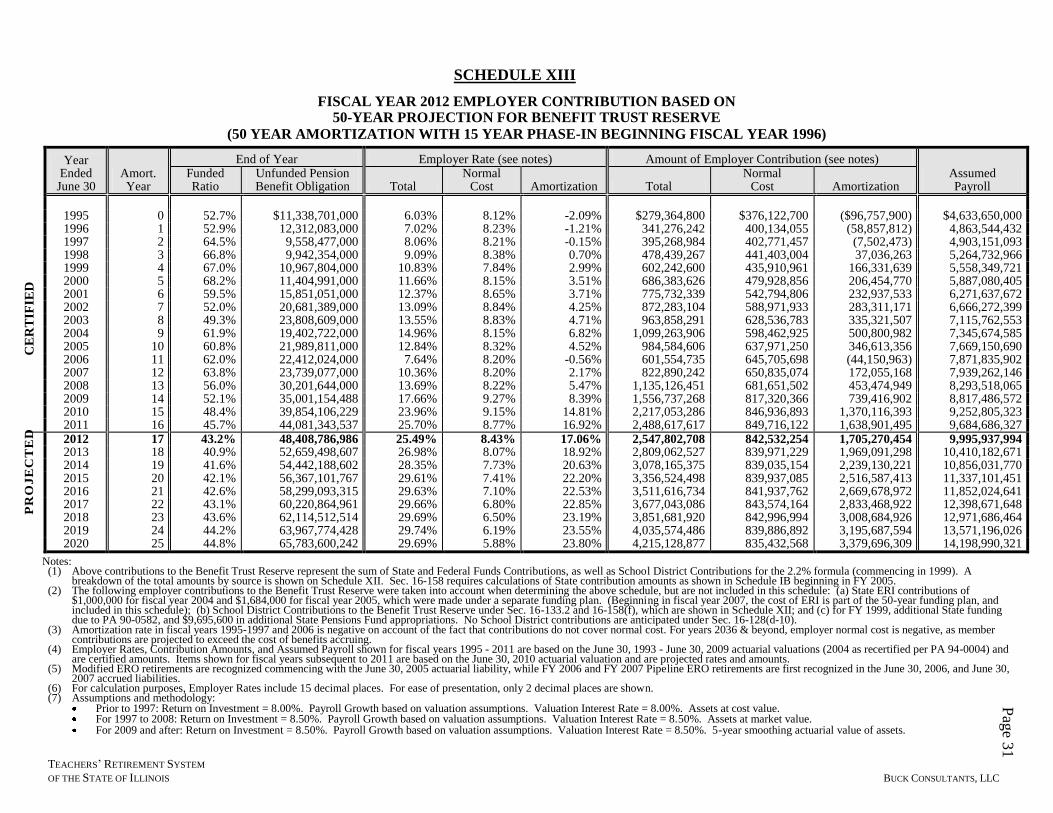
SCHEDULE XIII
FISCAL YEAR 2012 EMPLOYER CONTRIBUTION BASED ON 50-YEAR PROJECTION FOR BENEFIT TRUST RESERVE
(50 YEAR AMORTIZATION WITH 15 YEAR PHASE-IN BEGINNING FISCAL YEAR 1996)
Year Ended
June 30 Amort. Year
End of Year Employer Rate (see notes) Amount of Employer Contribution (see notes) Assumed Payroll
Funded Ratio
Unfunded Pension Benefit Obligation Total
Normal Cost Amortization Total
Normal Cost Amortization
1995 0 52.7% $11,338,701,000 6.03% 8.12% -2.09% $279,364,800 $376,122,700 ($96,757,900) $4,633,650,000 1996 1 52.9% 12,312,083,000 7.02% 8.23% -1.21% 341,276,242 400,134,055 (58,857,812) 4,863,544,432 1997 2 64.5% 9,558,477,000 8.06% 8.21% -0.15% 395,268,984 402,771,457 (7,502,473) 4,903,151,093 1998 3 66.8% 9,942,354,000 9.09% 8.38% 0.70% 478,439,267 441,403,004 37,036,263 5,264,732,966 1999 4 67.0% 10,967,804,000 10.83% 7.84% 2.99% 602,242,600 435,910,961 166,331,639 5,558,349,721 2000 5 68.2% 11,404,991,000 11.66% 8.15% 3.51% 686,383,626 479,928,856 206,454,770 5,887,080,405 2001 6 59.5% 15,851,051,000 12.37% 8.65% 3.71% 775,732,339 542,794,806 232,937,533 6,271,637,672 2002 7 52.0% 20,681,389,000 13.09% 8.84% 4.25% 872,283,104 588,971,933 283,311,171 6,666,272,399 2003 8 49.3% 23,808,609,000 13.55% 8.83% 4.71% 963,858,291 628,536,783 335,321,507 7,115,762,553 2004 9 61.9% 19,402,722,000 14.96% 8.15% 6.82% 1,099,263,906 598,462,925 500,800,982 7,345,674,585 2005 10 60.8% 21,989,811,000 12.84% 8.32% 4.52% 984,584,606 637,971,250 346,613,356 7,669,150,690 2006 11 62.0% 22,412,024,000 7.64% 8.20% -0.56% 601,554,735 645,705,698 (44,150,963) 7,871,835,902 2007 12 63.8% 23,739,077,000 10.36% 8.20% 2.17% 822,890,242 650,835,074 172,055,168 7,939,262,146 2008 13 56.0% 30,201,644,000 13.69% 8.22% 5.47% 1,135,126,451 681,651,502 453,474,949 8,293,518,065 2009 14 52.1% 35,001,154,488 17.66% 9.27% 8.39% 1,556,737,268 817,320,366 739,416,902 8,817,486,572 2010 15 48.4% 39,854,106,229 23.96% 9.15% 14.81% 2,217,053,286 846,936,893 1,370,116,393 9,252,805,323 2011 16 45.7% 44,081,343,537 25.70% 8.77% 16.92% 2,488,617,617 849,716,122 1,638,901,495 9,684,686,327 2012 17 43.2% 48,408,786,986 25.49% 8.43% 17.06% 2,547,802,708 842,532,254 1,705,270,454 9,995,937,994 2013 18 40.9% 52,659,498,607 26.98% 8.07% 18.92% 2,809,062,527 839,971,229 1,969,091,298 10,410,182,671 2014 19 41.6% 54,442,188,602 28.35% 7.73% 20.63% 3,078,165,375 839,035,154 2,239,130,221 10,856,031,770 2015 20 42.1% 56,367,101,767 29.61% 7.41% 22.20% 3,356,524,498 839,937,085 2,516,587,413 11,337,101,451 2016 21 42.6% 58,299,093,315 29.63% 7.10% 22.53% 3,511,616,734 841,937,762 2,669,678,972 11,852,024,641 2017 22 43.1% 60,220,864,961 29.66% 6.80% 22.85% 3,677,043,086 843,574,164 2,833,468,922 12,398,671,648 2018 23 43.6% 62,114,512,514 29.69% 6.50% 23.19% 3,851,681,920 842,996,994 3,008,684,926 12,971,686,464 2019 24 44.2% 63,967,774,428 29.74% 6.19% 23.55% 4,035,574,486 839,886,892 3,195,687,594 13,571,196,026 2020 25 44.8% 65,783,600,242 29.69% 5.88% 23.80% 4,215,128,877 835,432,568 3,379,696,309 14,198,990,321
Notes: (1) Above contributions to the Benefit Trust Reserve represent the sum of State and Federal Funds Contributions, as well as School District Contributions for the 2.2% formula (commencing in 1999). A
breakdown of the total amounts by source is shown on Schedule XII. Sec. 16-158 requires calculations of State contribution amounts as shown in Schedule IB beginning in FY 2005. (2) The following employer contributions to the Benefit Trust Reserve were taken into account when determining the above schedule, but are not included in this schedule: (a) State ERI contributions of
$1,000,000 for fiscal year 2004 and $1,684,000 for fiscal year 2005, which were made under a separate funding plan. (Beginning in fiscal year 2007, the cost of ERI is part of the 50-year funding plan, and included in this schedule); (b) School District Contributions to the Benefit Trust Reserve under Sec. 16-133.2 and 16-158(f), which are shown in Schedule XII; and (c) for FY 1999, additional State funding due to PA 90-0582, and $9,695,600 in additional State Pensions Fund appropriations. No School District contributions are anticipated under Sec. 16-128(d-10).
(3) Amortization rate in fiscal years 1995-1997 and 2006 is negative on account of the fact that contributions do not cover normal cost. For years 2036 & beyond, employer normal cost is negative, as member contributions are projected to exceed the cost of benefits accruing.
(4) Employer Rates, Contribution Amounts, and Assumed Payroll shown for fiscal years 1995 - 2011 are based on the June 30, 1993 - June 30, 2009 actuarial valuations (2004 as recertified per PA 94-0004) and are certified amounts. Items shown for fiscal years subsequent to 2011 are based on the June 30, 2010 actuarial valuation and are projected rates and amounts.
(5) Modified ERO retirements are recognized commencing with the June 30, 2005 actuarial liability, while FY 2006 and FY 2007 Pipeline ERO retirements are first recognized in the June 30, 2006, and June 30, 2007 accrued liabilities.
(6) For calculation purposes, Employer Rates include 15 decimal places. For ease of presentation, only 2 decimal places are shown. (7) Assumptions and methodology:
Prior to 1997: Return on Investment = 8.00%. Payroll Growth based on valuation assumptions. Valuation Interest Rate = 8.00%. Assets at cost value. For 1997 to 2008: Return on Investment = 8.50%. Payroll Growth based on valuation assumptions. Valuation Interest Rate = 8.50%. Assets at market value. For 2009 and after: Return on Investment = 8.50%. Payroll Growth based on valuation assumptions. Valuation Interest Rate = 8.50%. 5-year smoothing actuarial value of assets.
PR
OJ
EC
TE
D

Pag
e 32
TEACHERS’ RETIREMENT SYSTEM
OF THE STATE OF ILLINOIS BUCK CONSULTANTS, LLC
SCHEDULE XIII
FISCAL YEAR 2012 EMPLOYER CONTRIBUTION BASED ON 50-YEAR PROJECTION FOR BENEFIT TRUST RESERVE
(50 YEAR AMORTIZATION WITH 15 YEAR PHASE-IN BEGINNING FISCAL YEAR 1996) (Continued)
End of Year Employer Rate (see notes) Amount of Employer Contribution (see notes)
Year Ended
June 30 Amort. Year
Funded Ratio
Unfunded Pension Benefit Obligation Total
Normal Cost Amortization Total
Normal Cost Amortization
Assumed Payroll
2021 26 45.4% 67,542,018,349 29.66% 5.58% 24.08% 4,406,442,597 828,915,941 3,577,526,656 14,858,462,743 2022 27 46.2% 69,220,102,848 29.64% 5.26% 24.38% 4,609,666,038 818,516,555 3,791,149,483 15,550,076,078 2023 28 46.9% 70,788,232,741 29.65% 4.94% 24.70% 4,824,795,253 804,536,284 4,020,258,969 16,273,818,176 2024 29 47.8% 72,227,987,962 29.58% 4.61% 24.97% 5,035,375,770 784,619,820 4,250,755,950 17,024,582,586 2025 30 48.7% 73,514,635,852 29.53% 4.25% 25.28% 5,256,868,295 756,316,568 4,500,551,727 17,800,935,014 2026 31 49.8% 74,598,917,114 29.58% 3.87% 25.71% 5,499,200,461 719,158,239 4,780,042,222 18,588,922,177 2027 32 50.9% 75,449,800,483 29.64% 3.47% 26.16% 5,739,114,064 672,684,835 5,066,429,229 19,364,823,351 2028 33 52.1% 76,069,285,805 29.62% 3.08% 26.54% 5,957,874,185 619,336,456 5,338,537,729 20,116,514,802 2029 34 53.3% 76,464,934,128 29.61% 2.69% 26.91% 6,174,983,484 561,812,062 5,613,171,422 20,856,160,875 2030 35 54.6% 76,616,020,271 29.54% 2.31% 27.22% 6,371,043,407 499,065,724 5,871,977,683 21,569,595,728 2031 36 56.0% 76,502,413,542 29.48% 1.93% 27.55% 6,558,389,865 430,199,196 6,128,190,669 22,246,930,518 2032 37 57.4% 76,079,742,613 29.50% 1.55% 27.95% 6,752,531,019 354,513,600 6,398,017,419 22,890,359,747 2033 38 58.9% 75,325,192,729 29.58% 1.16% 28.43% 6,946,903,544 272,096,910 6,674,806,634 23,482,008,921 2034 39 60.8% 73,533,104,902 32.44% 0.76% 31.68% 7,790,511,345 183,417,774 7,607,093,571 24,015,536,803 2035 40 62.8% 71,329,191,247 32.44% 0.36% 32.08% 7,950,963,594 89,154,791 7,861,808,803 24,510,157,337 2036 41 64.8% 68,685,372,437 32.44% -0.03% 32.47% 8,098,168,658 (7,802,155) 8,105,970,813 24,963,941,237 2037 42 67.0% 65,591,386,152 32.44% -0.43% 32.87% 8,230,633,806 (108,150,311) 8,338,784,117 25,372,286,916 2038 43 69.2% 62,003,589,755 32.44% -0.83% 33.27% 8,344,971,438 (212,551,711) 8,557,523,149 25,724,751,534 2039 44 71.6% 57,913,107,220 32.44% -1.23% 33.67% 8,440,544,948 (319,063,519) 8,759,608,467 26,019,372,651 2040 45 74.1% 53,304,642,541 32.44% -1.61% 34.05% 8,527,356,142 (423,549,977) 8,950,906,119 26,286,982,480 2041 46 76.8% 48,032,157,350 32.44% -2.04% 34.48% 8,697,124,772 (547,266,695) 9,244,391,467 26,810,322,298 2042 47 79.7% 42,196,558,478 32.44% -2.49% 34.93% 8,762,228,844 (671,562,393) 9,433,791,237 27,011,016,344 2043 48 82.8% 35,784,110,561 32.44% -2.78% 35.22% 8,857,087,535 (759,377,765) 9,616,465,300 27,303,433,912 2044 49 86.2% 28,635,617,502 32.44% -2.98% 35.42% 8,972,993,645 (824,636,644) 9,797,630,289 27,660,733,623 2045 50 90.0% 20,688,736,678 32.44% -3.12% 35.56% 9,101,857,360 (875,760,654) 9,977,618,014 28,057,977,291 2046 51 90.0% 20,609,820,383 3.09% -3.16% 6.25% 880,929,539 (899,129,095) 1,780,058,634 28,487,225,078
Notes: (1) Above contributions to the Benefit Trust Reserve represent the sum of State and Federal Funds Contributions, as well as School District Contributions for the 2.2% formula (commencing in 1999). A
breakdown of the total amounts by source is shown on Schedule XII. Sec. 16-158 requires calculations of State contribution amounts as shown in Schedule IB beginning in FY 2005. (2) The following employer contributions to the Benefit Trust Reserve were taken into account when determining the above schedule, but are not included in this schedule: (a) State ERI contributions of
$1,000,000 for fiscal year 2004 and $1,684,000 for fiscal year 2005, which were made under a separate funding plan. (Beginning in fiscal year 2007, the cost of ERI is part of the 50-year funding plan, and included in this schedule); (b) School District Contributions to the Benefit Trust Reserve under Sec. 16-133.2 and 16-158(f), which are shown in Schedule XII; and (c) for FY 1999, additional State funding due to PA 90-0582, and $9,695,600 in additional State Pensions Fund appropriations. No School District contributions are anticipated under Sec. 16-128(d-10).
(3) Amortization rate in fiscal years 1995-1997 and 2006 is negative on account of the fact that contributions do not cover normal cost. For years 2036 & beyond, employer normal cost is negative, as member contributions are projected to exceed the cost of benefits accruing.
(4) Employer Rates, Contribution Amounts, and Assumed Payroll shown for fiscal years 1995 - 2011 are based on the June 30, 1993 - June 30, 2009 actuarial valuations (2004 as recertified per PA 94-0004) and are certified amounts. Items shown for fiscal years subsequent to 2011 are based on the June 30, 2010 actuarial valuation and are projected rates and amounts.
(5) Modified ERO retirements are recognized commencing with the June 30, 2005 actuarial liability, while FY 2006 and FY 2007 Pipeline ERO retirements are first recognized in the June 30, 2006, and June 30, 2007 accrued liabilities.
(6) For calculation purposes, Employer Rates include 15 decimal places. For ease of presentation, only 2 decimal places are shown. (7) Assumptions and methodology:
Prior to 1997: Return on Investment = 8.00%. Payroll Growth based on valuation assumptions. Valuation Interest Rate = 8.00%. Assets at cost value. For 1997 to 2008: Return on Investment = 8.50%. Payroll Growth based on valuation assumptions. Valuation Interest Rate = 8.50%. Assets at market value. For 2009 and after: Return on Investment = 8.50%. Payroll Growth based on valuation assumptions. Valuation Interest Rate = 8.50%. 5-year smoothing actuarial value of assets.
PR
OJ
EC
TE
D
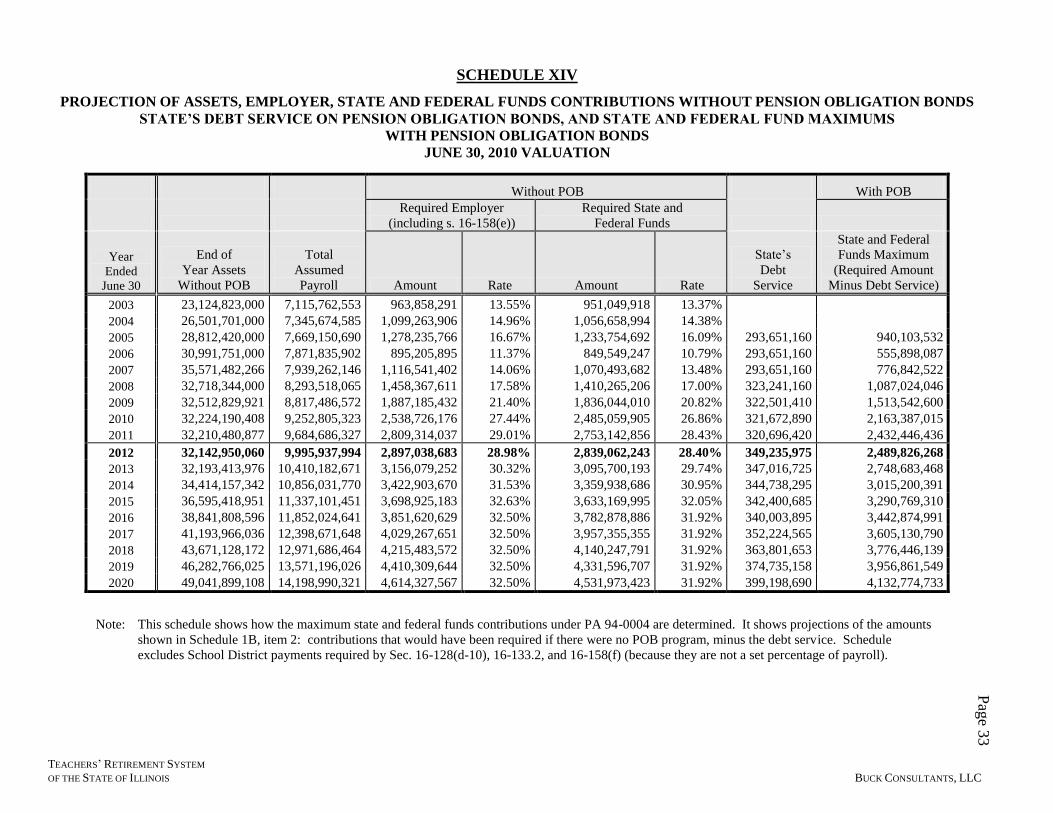
TEACHERS’ RETIREMENT SYSTEM
OF THE STATE OF ILLINOIS BUCK CONSULTANTS, LLC
Pag
e 33
SCHEDULE XIV
PROJECTION OF ASSETS, EMPLOYER, STATE AND FEDERAL FUNDS CONTRIBUTIONS WITHOUT PENSION OBLIGATION BONDS
STATE’S DEBT SERVICE ON PENSION OBLIGATION BONDS, AND STATE AND FEDERAL FUND MAXIMUMS
WITH PENSION OBLIGATION BONDS
JUNE 30, 2010 VALUATION
Without POB With POB
Required Employer
(including s. 16-158(e))
Required State and
Federal Funds
Year
Ended
June 30
End of
Year Assets
Without POB
Total
Assumed
Payroll Amount Rate Amount Rate
State’s
Debt
Service
State and Federal
Funds Maximum
(Required Amount
Minus Debt Service)
2003 23,124,823,000 7,115,762,553 963,858,291 13.55% 951,049,918 13.37%
2004 26,501,701,000 7,345,674,585 1,099,263,906 14.96% 1,056,658,994 14.38%
2005 28,812,420,000 7,669,150,690 1,278,235,766 16.67% 1,233,754,692 16.09% 293,651,160 940,103,532
2006 30,991,751,000 7,871,835,902 895,205,895 11.37% 849,549,247 10.79% 293,651,160 555,898,087
2007 35,571,482,266 7,939,262,146 1,116,541,402 14.06% 1,070,493,682 13.48% 293,651,160 776,842,522
2008 32,718,344,000 8,293,518,065 1,458,367,611 17.58% 1,410,265,206 17.00% 323,241,160 1,087,024,046
2009 32,512,829,921 8,817,486,572 1,887,185,432 21.40% 1,836,044,010 20.82% 322,501,410 1,513,542,600
2010 32,224,190,408 9,252,805,323 2,538,726,176 27.44% 2,485,059,905 26.86% 321,672,890 2,163,387,015
2011 32,210,480,877 9,684,686,327 2,809,314,037 29.01% 2,753,142,856 28.43% 320,696,420 2,432,446,436
2012 32,142,950,060 9,995,937,994 2,897,038,683 28.98% 2,839,062,243 28.40% 349,235,975 2,489,826,268
2013 32,193,413,976 10,410,182,671 3,156,079,252 30.32% 3,095,700,193 29.74% 347,016,725 2,748,683,468
2014 34,414,157,342 10,856,031,770 3,422,903,670 31.53% 3,359,938,686 30.95% 344,738,295 3,015,200,391
2015 36,595,418,951 11,337,101,451 3,698,925,183 32.63% 3,633,169,995 32.05% 342,400,685 3,290,769,310
2016 38,841,808,596 11,852,024,641 3,851,620,629 32.50% 3,782,878,886 31.92% 340,003,895 3,442,874,991
2017 41,193,966,036 12,398,671,648 4,029,267,651 32.50% 3,957,355,355 31.92% 352,224,565 3,605,130,790
2018 43,671,128,172 12,971,686,464 4,215,483,572 32.50% 4,140,247,791 31.92% 363,801,653 3,776,446,139
2019 46,282,766,025 13,571,196,026 4,410,309,644 32.50% 4,331,596,707 31.92% 374,735,158 3,956,861,549
2020 49,041,899,108 14,198,990,321 4,614,327,567 32.50% 4,531,973,423 31.92% 399,198,690 4,132,774,733
Note: This schedule shows how the maximum state and federal funds contributions under PA 94-0004 are determined. It shows projections of the amounts
shown in Schedule 1B, item 2: contributions that would have been required if there were no POB program, minus the debt service. Schedule
excludes School District payments required by Sec. 16-128(d-10), 16-133.2, and 16-158(f) (because they are not a set percentage of payroll).
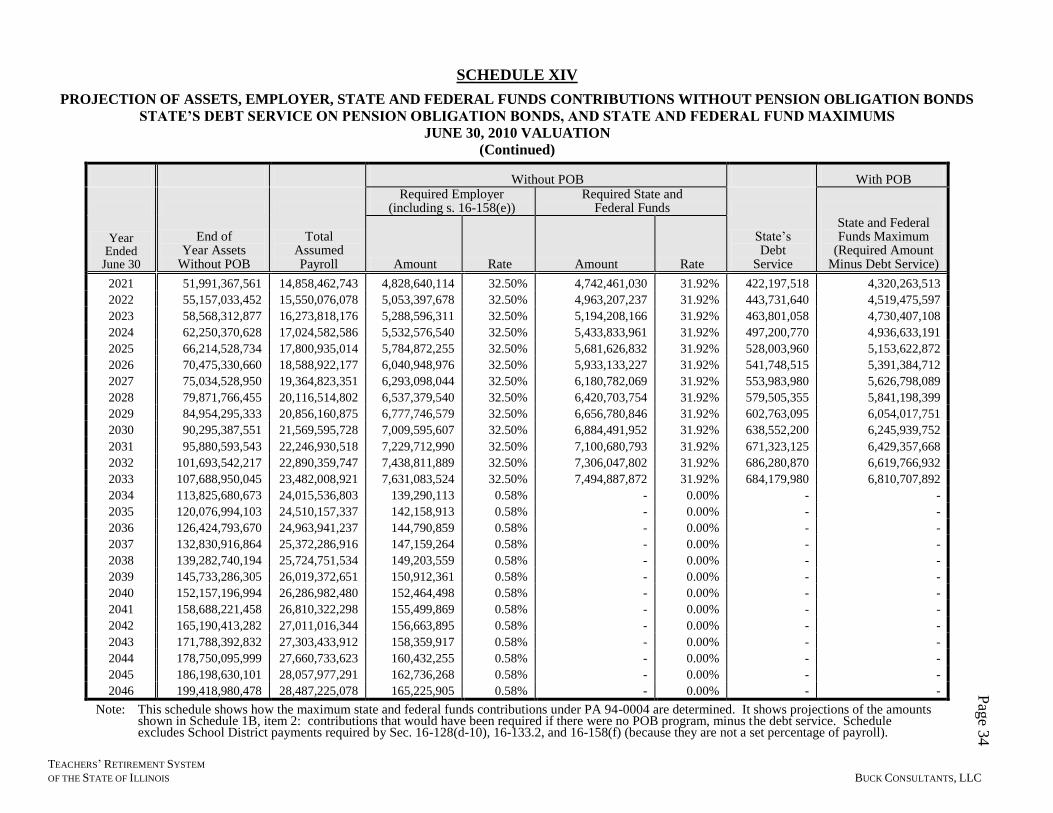
TEACHERS’ RETIREMENT SYSTEM
OF THE STATE OF ILLINOIS BUCK CONSULTANTS, LLC
Pag
e 34
SCHEDULE XIV
PROJECTION OF ASSETS, EMPLOYER, STATE AND FEDERAL FUNDS CONTRIBUTIONS WITHOUT PENSION OBLIGATION BONDS
STATE’S DEBT SERVICE ON PENSION OBLIGATION BONDS, AND STATE AND FEDERAL FUND MAXIMUMS
JUNE 30, 2010 VALUATION
(Continued)
Without POB With POB
Required Employer
(including s. 16-158(e)) Required State and
Federal Funds
Year Ended
June 30
End of Year Assets
Without POB
Total Assumed Payroll Amount Rate Amount Rate
State’s Debt
Service
State and Federal Funds Maximum
(Required Amount Minus Debt Service)
2021 51,991,367,561 14,858,462,743 4,828,640,114 32.50% 4,742,461,030 31.92% 422,197,518 4,320,263,513
2022 55,157,033,452 15,550,076,078 5,053,397,678 32.50% 4,963,207,237 31.92% 443,731,640 4,519,475,597
2023 58,568,312,877 16,273,818,176 5,288,596,311 32.50% 5,194,208,166 31.92% 463,801,058 4,730,407,108
2024 62,250,370,628 17,024,582,586 5,532,576,540 32.50% 5,433,833,961 31.92% 497,200,770 4,936,633,191
2025 66,214,528,734 17,800,935,014 5,784,872,255 32.50% 5,681,626,832 31.92% 528,003,960 5,153,622,872
2026 70,475,330,660 18,588,922,177 6,040,948,976 32.50% 5,933,133,227 31.92% 541,748,515 5,391,384,712
2027 75,034,528,950 19,364,823,351 6,293,098,044 32.50% 6,180,782,069 31.92% 553,983,980 5,626,798,089
2028 79,871,766,455 20,116,514,802 6,537,379,540 32.50% 6,420,703,754 31.92% 579,505,355 5,841,198,399
2029 84,954,295,333 20,856,160,875 6,777,746,579 32.50% 6,656,780,846 31.92% 602,763,095 6,054,017,751
2030 90,295,387,551 21,569,595,728 7,009,595,607 32.50% 6,884,491,952 31.92% 638,552,200 6,245,939,752
2031 95,880,593,543 22,246,930,518 7,229,712,990 32.50% 7,100,680,793 31.92% 671,323,125 6,429,357,668
2032 101,693,542,217 22,890,359,747 7,438,811,889 32.50% 7,306,047,802 31.92% 686,280,870 6,619,766,932
2033 107,688,950,045 23,482,008,921 7,631,083,524 32.50% 7,494,887,872 31.92% 684,179,980 6,810,707,892
2034 113,825,680,673 24,015,536,803 139,290,113 0.58% - 0.00% - -
2035 120,076,994,103 24,510,157,337 142,158,913 0.58% - 0.00% - -
2036 126,424,793,670 24,963,941,237 144,790,859 0.58% - 0.00% - -
2037 132,830,916,864 25,372,286,916 147,159,264 0.58% - 0.00% - -
2038 139,282,740,194 25,724,751,534 149,203,559 0.58% - 0.00% - -
2039 145,733,286,305 26,019,372,651 150,912,361 0.58% - 0.00% - -
2040 152,157,196,994 26,286,982,480 152,464,498 0.58% - 0.00% - -
2041 158,688,221,458 26,810,322,298 155,499,869 0.58% - 0.00% - -
2042 165,190,413,282 27,011,016,344 156,663,895 0.58% - 0.00% - -
2043 171,788,392,832 27,303,433,912 158,359,917 0.58% - 0.00% - -
2044 178,750,095,999 27,660,733,623 160,432,255 0.58% - 0.00% - -
2045 186,198,630,101 28,057,977,291 162,736,268 0.58% - 0.00% - -
2046 199,418,980,478 28,487,225,078 165,225,905 0.58% - 0.00% - -
Note: This schedule shows how the maximum state and federal funds contributions under PA 94-0004 are determined. It shows projections of the amounts shown in Schedule 1B, item 2: contributions that would have been required if there were no POB program, minus the debt service. Schedule excludes School District payments required by Sec. 16-128(d-10), 16-133.2, and 16-158(f) (because they are not a set percentage of payroll).

TEACHERS’ RETIREMENT SYSTEM
OF THE STATE OF ILLINOIS BUCK CONSULTANTS, LLC
Pag
e 35
SCHEDULE XV
PROJECTIONS USING CERTIFIED CONTRIBUTIONS AND
AN 8.5% MARKET RATE OF RETURN
Contributions Year
Ended June 30 Member
School District
Federal Funds State
Benefits and Expenses
Asset Return & Cash Income
Actuarial Value of Assets*
Market Value of Assets PBO
Funded Ratio
1995 $421,726,521 $16,500,000 $262,864,800 $1,108,283,000 $12,641,865,000 $12,641,865,000 $23,980,566,000 52.7%
1996 422,238,847 17,000,000 324,276,242 1,148,919,000 1,573,249,911 13,829,711,000 13,829,711,000 26,141,794,000 52.9%
1997 420,762,625 17,300,000 377,968,984 1,186,203,042 3,933,568,433 17,393,108,000 17,393,108,000 26,951,585,000 64.5%
1998 440,967,595 18,000,000 460,439,267 1,237,762,773 2,891,134,911 19,965,887,000 19,965,887,000 29,908,241,000 66.8%
1999 866,369,000 16,675,000 18,500,000 567,067,600 1,314,929,000 2,118,139,400 22,237,709,000 22,237,709,000 33,205,513,000 67.0%
2000 619,622,000 34,145,066 18,200,000 634,038,560 1,437,474,000 2,375,172,374 24,481,413,000 24,481,413,000 35,886,404,000 68.2%
2001 643,563,000 36,375,498 20,000,000 719,356,841 1,611,050,000 (974,012,339) 23,315,646,000 23,315,646,000 39,166,697,000 59.5%
2002 681,151,770 38,664,380 23,000,000 810,618,724 1,809,763,000 (693,032,874) 22,366,285,000 22,366,285,000 43,047,674,000 52.0%
2003 732,020,451 12,808,373 25,000,000 926,049,918 2,051,953,000 1,114,612,258 23,124,823,000 23,124,823,000 46,933,432,000 49.3%
2004 768,661,300 42,604,912 29,400,000 1,027,258,994 2,320,690,844 8,872,671,638 31,544,729,000 31,544,729,000 50,947,451,000 61.9%
2005 761,790,009 44,481,074 37,860,000 902,243,532 2,604,081,011 3,398,195,396 34,085,218,000 34,085,218,000 56,075,029,000 60.8%
2006 799,034,336 60,631,429 24,070,387 531,827,700 2,948,023,574 4,032,130,722 36,584,889,000 36,584,889,000 58,996,913,000 62.0%
2007 826,249,007 225,741,253 41,328,022 735,514,500 3,184,574,659 6,680,170,878 41,909,318,000 41,909,318,000 65,648,395,000 63.8%
2008 865,400,168 131,239,475 47,829,058 1,039,194,988 3,498,960,895 (2,063,297,794) 38,430,723,000 38,430,723,000 68,632,367,000 56.0%
2009 876,182,122 148,460,852 55,707,046 1,449,888,800 3,723,108,308 (8,706,541,270) 38,026,043,512 28,531,312,242 73,027,198,000 52.1%
2010 909,642,774 145,878,411 75,718,545 2,087,668,469 4,003,538,821 3,646,060,161 37,439,091,771 31,323,784,214 77,293,198,000 48.4%
2011 948,286,581 147,747,541 75,405,839 2,357,040,597 4,329,807,307 2,628,482,095 37,144,395,374 33,150,939,560 81,225,738,911 45.7%
2012 976,364,866 147,745,130 84,654,093 2,405,172,175 4,641,424,675 2,774,195,252 36,768,854,622 34,897,646,402 85,177,641,608 43.2%
2013 1,014,104,218 142,198,949 93,455,238 2,655,228,231 4,959,073,917 2,921,534,882 36,514,054,628 36,765,094,002 89,173,553,235 40.9%
2014 1,055,929,626 140,209,804 102,516,813 2,912,683,578 5,275,580,233 3,079,836,420 38,781,085,860 38,780,690,010 93,223,274,462 41.6%
2015 1,102,119,060 136,606,618 111,886,156 3,178,883,155 5,585,508,877 3,251,511,708 40,976,583,680 40,976,187,830 97,343,685,447 42.1%
2016 1,151,561,758 137,125,483 117,057,750 3,325,817,241 5,900,555,063 3,433,327,417 43,240,918,266 43,240,522,416 101,540,011,581 42.6%
2017 1,204,596,164 143,768,236 122,574,447 3,482,556,343 6,216,411,641 3,621,804,103 45,599,805,919 45,599,410,069 105,820,670,880 43.1%
2018 1,260,491,424 155,167,401 128,399,169 3,648,046,970 6,538,472,542 3,818,762,881 48,072,201,222 48,071,805,372 110,186,713,736 43.6%
2019 1,318,612,797 164,741,047 134,533,293 3,822,328,256 6,870,497,833 4,025,350,100 50,667,268,882 50,666,873,032 114,635,043,310 44.2%
2020 1,379,354,416 171,464,694 140,514,341 3,992,260,392 7,209,796,878 4,241,854,226 53,382,920,074 53,382,524,224 119,166,520,316 44.8%
Note: The projection of assets is based upon the assumption that the Employer maintains the funding policy under Public Act 94-0004 that begins with fiscal year 2006.
Projection amounts may not add to the dollar due to rounding.
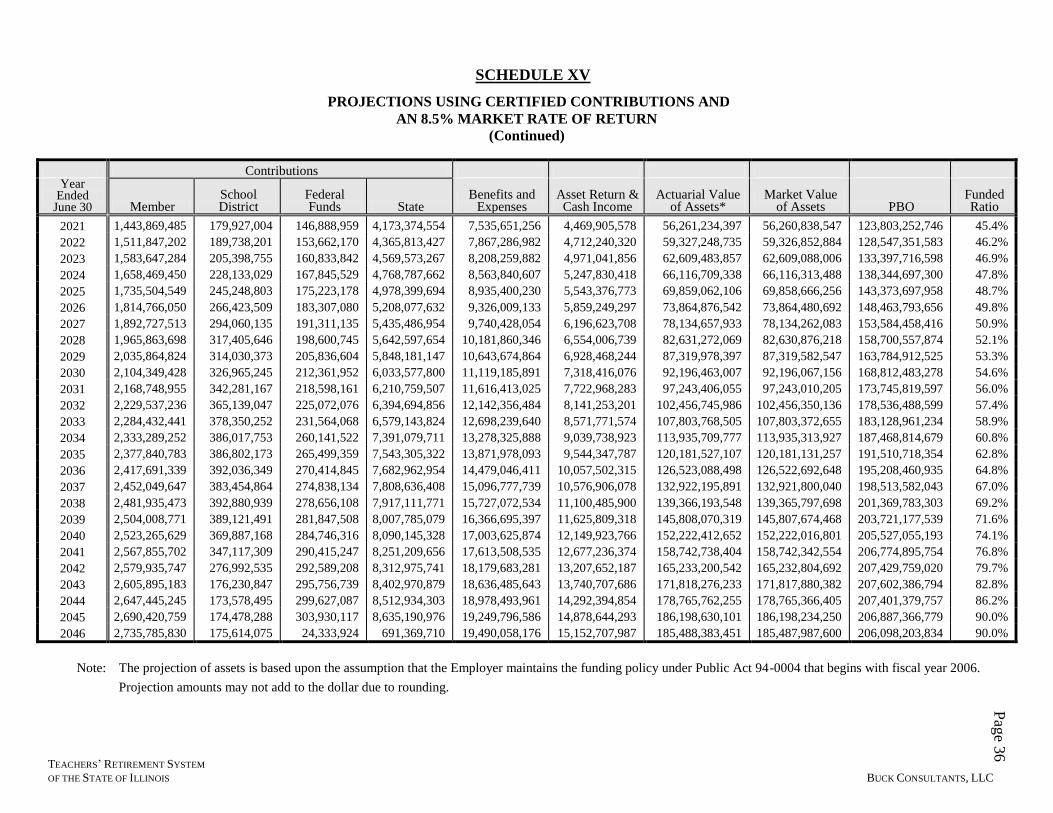
TEACHERS’ RETIREMENT SYSTEM
OF THE STATE OF ILLINOIS BUCK CONSULTANTS, LLC
Pag
e 36
SCHEDULE XV
PROJECTIONS USING CERTIFIED CONTRIBUTIONS AND
AN 8.5% MARKET RATE OF RETURN
(Continued)
Contributions Year
Ended June 30 Member
School District
Federal Funds State
Benefits and Expenses
Asset Return & Cash Income
Actuarial Value of Assets*
Market Value of Assets PBO
Funded Ratio
2021 1,443,869,485 179,927,004 146,888,959 4,173,374,554 7,535,651,256 4,469,905,578 56,261,234,397 56,260,838,547 123,803,252,746 45.4%
2022 1,511,847,202 189,738,201 153,662,170 4,365,813,427 7,867,286,982 4,712,240,320 59,327,248,735 59,326,852,884 128,547,351,583 46.2%
2023 1,583,647,284 205,398,755 160,833,842 4,569,573,267 8,208,259,882 4,971,041,856 62,609,483,857 62,609,088,006 133,397,716,598 46.9%
2024 1,658,469,450 228,133,029 167,845,529 4,768,787,662 8,563,840,607 5,247,830,418 66,116,709,338 66,116,313,488 138,344,697,300 47.8%
2025 1,735,504,549 245,248,803 175,223,178 4,978,399,694 8,935,400,230 5,543,376,773 69,859,062,106 69,858,666,256 143,373,697,958 48.7%
2026 1,814,766,050 266,423,509 183,307,080 5,208,077,632 9,326,009,133 5,859,249,297 73,864,876,542 73,864,480,692 148,463,793,656 49.8%
2027 1,892,727,513 294,060,135 191,311,135 5,435,486,954 9,740,428,054 6,196,623,708 78,134,657,933 78,134,262,083 153,584,458,416 50.9%
2028 1,965,863,698 317,405,646 198,600,745 5,642,597,654 10,181,860,346 6,554,006,739 82,631,272,069 82,630,876,218 158,700,557,874 52.1%
2029 2,035,864,824 314,030,373 205,836,604 5,848,181,147 10,643,674,864 6,928,468,244 87,319,978,397 87,319,582,547 163,784,912,525 53.3%
2030 2,104,349,428 326,965,245 212,361,952 6,033,577,800 11,119,185,891 7,318,416,076 92,196,463,007 92,196,067,156 168,812,483,278 54.6%
2031 2,168,748,955 342,281,167 218,598,161 6,210,759,507 11,616,413,025 7,722,968,283 97,243,406,055 97,243,010,205 173,745,819,597 56.0%
2032 2,229,537,236 365,139,047 225,072,076 6,394,694,856 12,142,356,484 8,141,253,201 102,456,745,986 102,456,350,136 178,536,488,599 57.4%
2033 2,284,432,441 378,350,252 231,564,068 6,579,143,824 12,698,239,640 8,571,771,574 107,803,768,505 107,803,372,655 183,128,961,234 58.9%
2034 2,333,289,252 386,017,753 260,141,522 7,391,079,711 13,278,325,888 9,039,738,923 113,935,709,777 113,935,313,927 187,468,814,679 60.8%
2035 2,377,840,783 386,802,173 265,499,359 7,543,305,322 13,871,978,093 9,544,347,787 120,181,527,107 120,181,131,257 191,510,718,354 62.8%
2036 2,417,691,339 392,036,349 270,414,845 7,682,962,954 14,479,046,411 10,057,502,315 126,523,088,498 126,522,692,648 195,208,460,935 64.8%
2037 2,452,049,647 383,454,864 274,838,134 7,808,636,408 15,096,777,739 10,576,906,078 132,922,195,891 132,921,800,040 198,513,582,043 67.0%
2038 2,481,935,473 392,880,939 278,656,108 7,917,111,771 15,727,072,534 11,100,485,900 139,366,193,548 139,365,797,698 201,369,783,303 69.2%
2039 2,504,008,771 389,121,491 281,847,508 8,007,785,079 16,366,695,397 11,625,809,318 145,808,070,319 145,807,674,468 203,721,177,539 71.6%
2040 2,523,265,629 369,887,168 284,746,316 8,090,145,328 17,003,625,874 12,149,923,766 152,222,412,652 152,222,016,801 205,527,055,193 74.1%
2041 2,567,855,702 347,117,309 290,415,247 8,251,209,656 17,613,508,535 12,677,236,374 158,742,738,404 158,742,342,554 206,774,895,754 76.8%
2042 2,579,935,747 276,992,535 292,589,208 8,312,975,741 18,179,683,281 13,207,652,187 165,233,200,542 165,232,804,692 207,429,759,020 79.7%
2043 2,605,895,183 176,230,847 295,756,739 8,402,970,879 18,636,485,643 13,740,707,686 171,818,276,233 171,817,880,382 207,602,386,794 82.8%
2044 2,647,445,245 173,578,495 299,627,087 8,512,934,303 18,978,493,961 14,292,394,854 178,765,762,255 178,765,366,405 207,401,379,757 86.2%
2045 2,690,420,759 174,478,288 303,930,117 8,635,190,976 19,249,796,586 14,878,644,293 186,198,630,101 186,198,234,250 206,887,366,779 90.0%
2046 2,735,785,830 175,614,075 24,333,924 691,369,710 19,490,058,176 15,152,707,987 185,488,383,451 185,487,987,600 206,098,203,834 90.0%
Note: The projection of assets is based upon the assumption that the Employer maintains the funding policy under Public Act 94-0004 that begins with fiscal year 2006.
Projection amounts may not add to the dollar due to rounding.
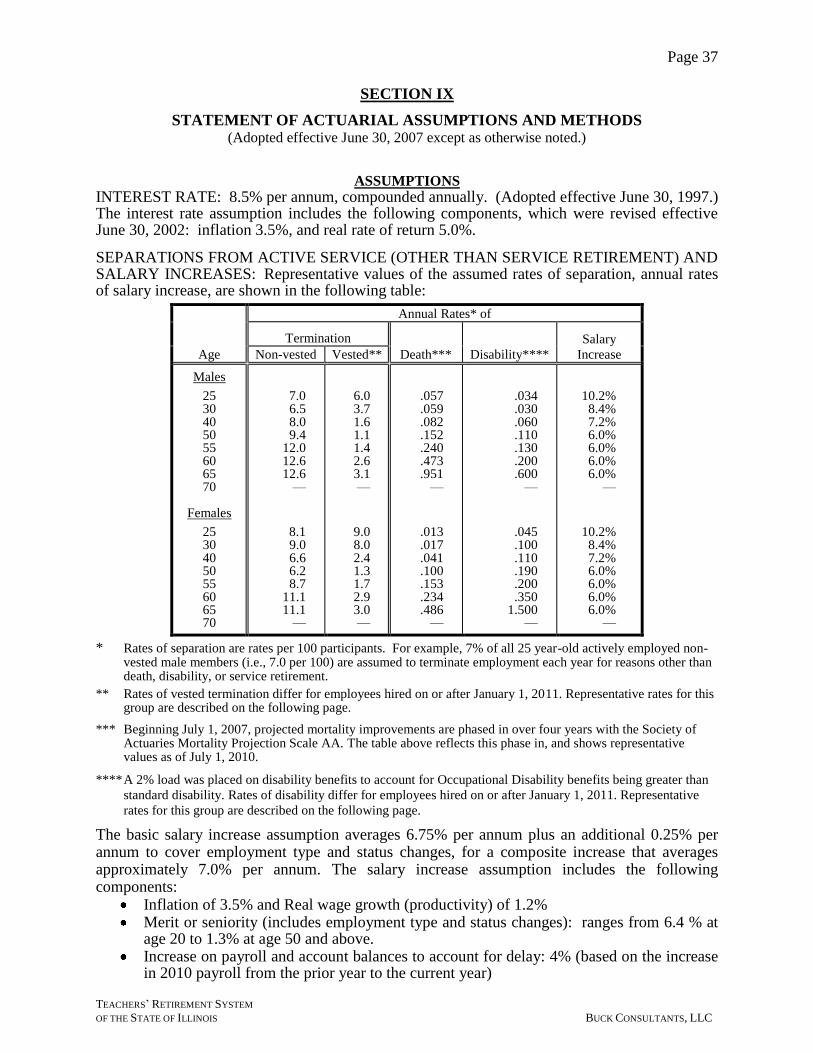
Page 37
TEACHERS’ RETIREMENT SYSTEM
OF THE STATE OF ILLINOIS BUCK CONSULTANTS, LLC
SECTION IX
STATEMENT OF ACTUARIAL ASSUMPTIONS AND METHODS (Adopted effective June 30, 2007 except as otherwise noted.)
ASSUMPTIONS INTEREST RATE: 8.5% per annum, compounded annually. (Adopted effective June 30, 1997.) The interest rate assumption includes the following components, which were revised effective June 30, 2002: inflation 3.5%, and real rate of return 5.0%.
SEPARATIONS FROM ACTIVE SERVICE (OTHER THAN SERVICE RETIREMENT) AND SALARY INCREASES: Representative values of the assumed rates of separation, annual rates of salary increase, are shown in the following table:
Annual Rates* of
Termination
Death*** Disability****
Salary
Increase Age Non-vested Vested**
Males
25 30 40 50 55 60 65 70
Females
25 30 40 50 55 60 65 70
7.0 6.5 8.0 9.4
12.0 12.6 12.6
—
8.1 9.0 6.6 6.2 8.7
11.1 11.1
—
6.0 3.7 1.6 1.1 1.4 2.6 3.1 —
9.0 8.0 2.4 1.3 1.7 2.9 3.0 —
.057
.059
.082
.152
.240
.473
.951 —
.013
.017
.041
.100
.153
.234
.486 —
.034
.030
.060
.110
.130
.200
.600 —
.045
.100
.110
.190
.200
.350 1.500
—
10.2% 8.4% 7.2% 6.0% 6.0% 6.0% 6.0%
—
10.2% 8.4% 7.2% 6.0% 6.0% 6.0% 6.0%
—
* Rates of separation are rates per 100 participants. For example, 7% of all 25 year-old actively employed non-vested male members (i.e., 7.0 per 100) are assumed to terminate employment each year for reasons other than death, disability, or service retirement.
** Rates of vested termination differ for employees hired on or after January 1, 2011. Representative rates for this group are described on the following page.
*** Beginning July 1, 2007, projected mortality improvements are phased in over four years with the Society of Actuaries Mortality Projection Scale AA. The table above reflects this phase in, and shows representative values as of July 1, 2010.
**** A 2% load was placed on disability benefits to account for Occupational Disability benefits being greater than
standard disability. Rates of disability differ for employees hired on or after January 1, 2011. Representative
rates for this group are described on the following page.
The basic salary increase assumption averages 6.75% per annum plus an additional 0.25% per annum to cover employment type and status changes, for a composite increase that averages approximately 7.0% per annum. The salary increase assumption includes the following components:
Inflation of 3.5% and Real wage growth (productivity) of 1.2% Merit or seniority (includes employment type and status changes): ranges from 6.4 % at
age 20 to 1.3% at age 50 and above. Increase on payroll and account balances to account for delay: 4% (based on the increase
in 2010 payroll from the prior year to the current year)
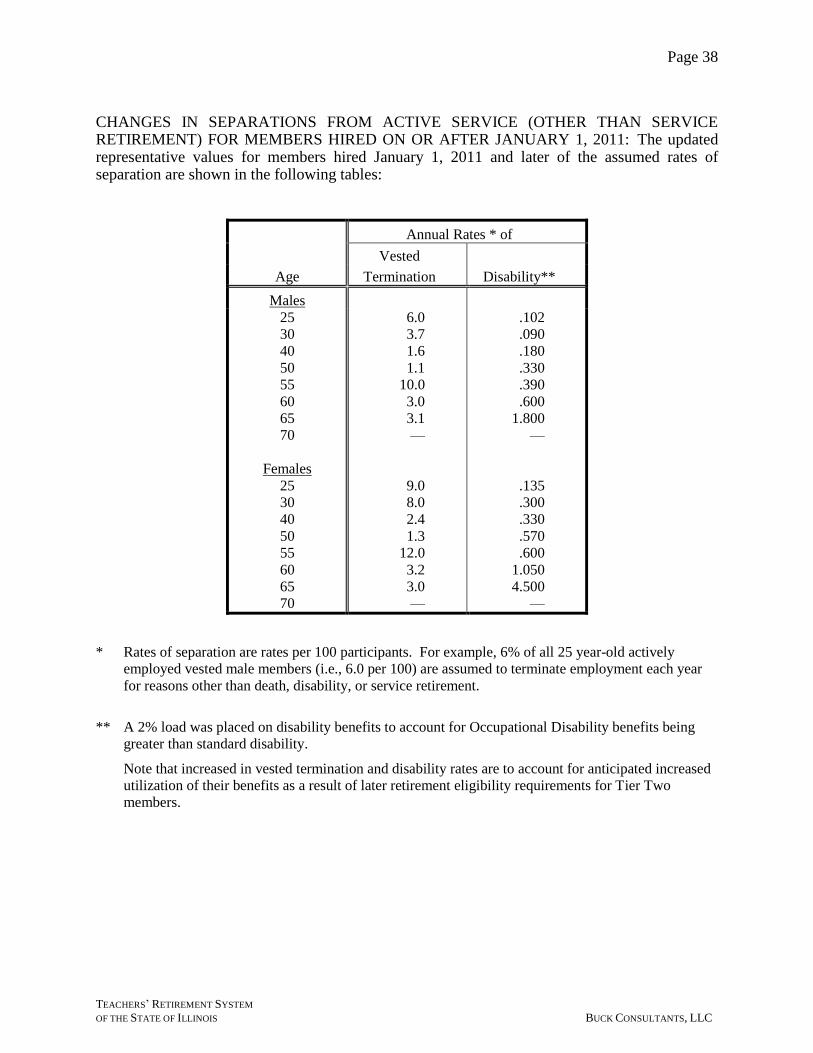
Page 38
TEACHERS’ RETIREMENT SYSTEM
OF THE STATE OF ILLINOIS BUCK CONSULTANTS, LLC
CHANGES IN SEPARATIONS FROM ACTIVE SERVICE (OTHER THAN SERVICE RETIREMENT) FOR MEMBERS HIRED ON OR AFTER JANUARY 1, 2011: The updated representative values for members hired January 1, 2011 and later of the assumed rates of separation are shown in the following tables:
Annual Rates * of
Vested
Age Termination Disability**
Males
25
30
40
50
55
60
65
70
Females
25
30
40
50
55
60
65
70
6.0
3.7
1.6
1.1
10.0
3.0
3.1
—
9.0
8.0
2.4
1.3
12.0
3.2
3.0
—
.102
.090
.180
.330
.390
.600
1.800
—
.135
.300
.330
.570
.600
1.050
4.500
—
* Rates of separation are rates per 100 participants. For example, 6% of all 25 year-old actively
employed vested male members (i.e., 6.0 per 100) are assumed to terminate employment each year
for reasons other than death, disability, or service retirement.
** A 2% load was placed on disability benefits to account for Occupational Disability benefits being
greater than standard disability.
Note that increased in vested termination and disability rates are to account for anticipated increased
utilization of their benefits as a result of later retirement eligibility requirements for Tier Two
members.
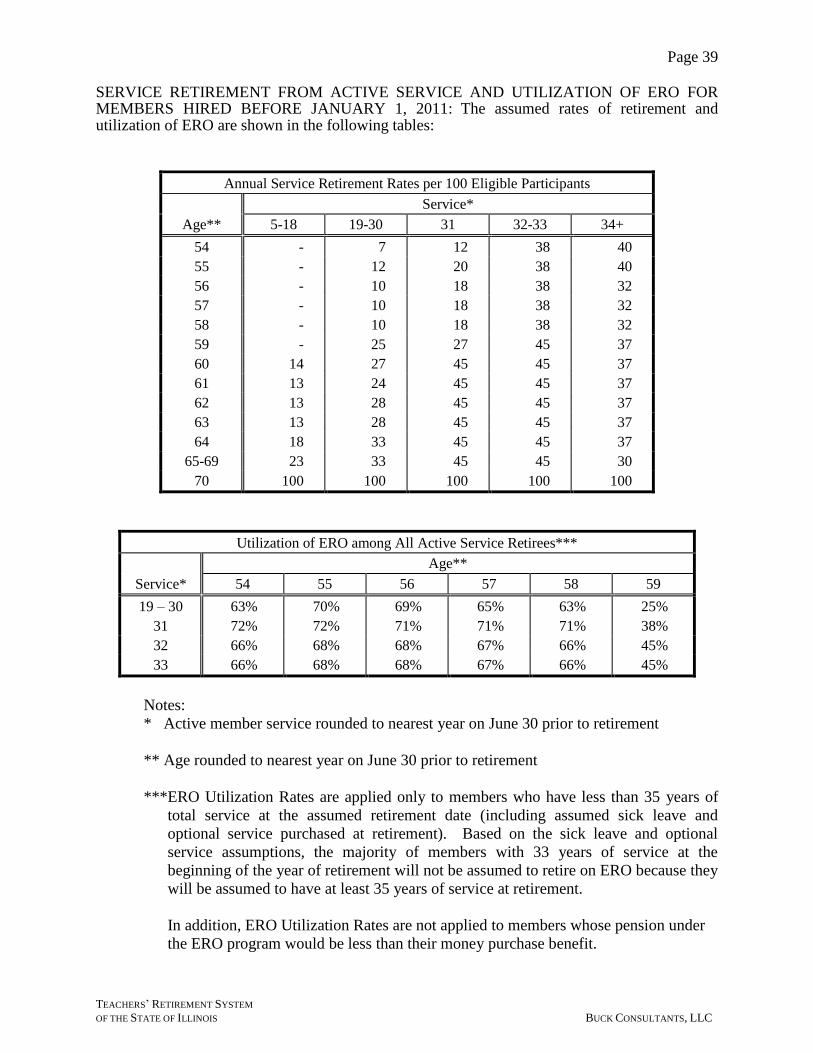
Page 39
TEACHERS’ RETIREMENT SYSTEM
OF THE STATE OF ILLINOIS BUCK CONSULTANTS, LLC
SERVICE RETIREMENT FROM ACTIVE SERVICE AND UTILIZATION OF ERO FOR MEMBERS HIRED BEFORE JANUARY 1, 2011: The assumed rates of retirement and utilization of ERO are shown in the following tables:
Annual Service Retirement Rates per 100 Eligible Participants
Service*
Age** 5-18 19-30 31 32-33 34+
54 - 7 12 38 40
55 - 12 20 38 40
56 - 10 18 38 32
57 - 10 18 38 32
58 - 10 18 38 32
59 - 25 27 45 37
60 14 27 45 45 37
61 13 24 45 45 37
62 13 28 45 45 37
63 13 28 45 45 37
64 18 33 45 45 37
65-69 23 33 45 45 30
70 100 100 100 100 100
Utilization of ERO among All Active Service Retirees***
Age**
Service* 54 55 56 57 58 59
19 – 30 63% 70% 69% 65% 63% 25%
31 72% 72% 71% 71% 71% 38%
32 66% 68% 68% 67% 66% 45%
33 66% 68% 68% 67% 66% 45%
Notes:
* Active member service rounded to nearest year on June 30 prior to retirement
** Age rounded to nearest year on June 30 prior to retirement
***ERO Utilization Rates are applied only to members who have less than 35 years of
total service at the assumed retirement date (including assumed sick leave and
optional service purchased at retirement). Based on the sick leave and optional
service assumptions, the majority of members with 33 years of service at the
beginning of the year of retirement will not be assumed to retire on ERO because they
will be assumed to have at least 35 years of service at retirement.
In addition, ERO Utilization Rates are not applied to members whose pension under
the ERO program would be less than their money purchase benefit.
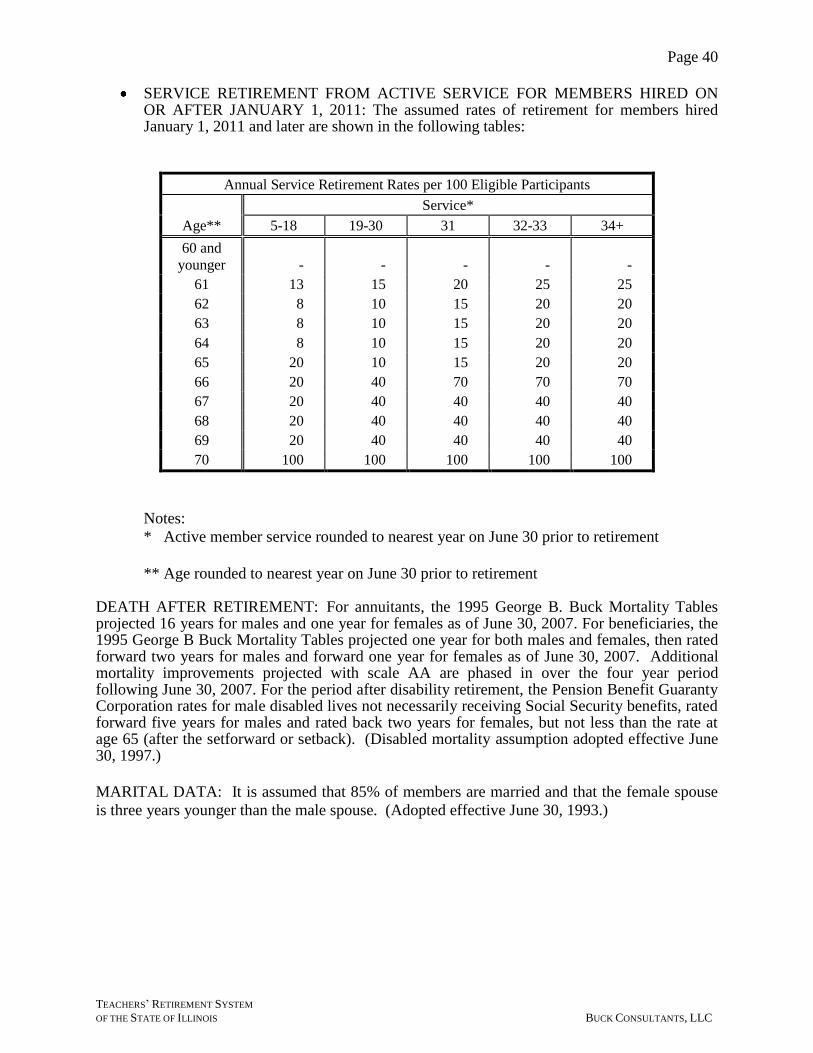
Page 40
TEACHERS’ RETIREMENT SYSTEM
OF THE STATE OF ILLINOIS BUCK CONSULTANTS, LLC
SERVICE RETIREMENT FROM ACTIVE SERVICE FOR MEMBERS HIRED ON OR AFTER JANUARY 1, 2011: The assumed rates of retirement for members hired January 1, 2011 and later are shown in the following tables:
Annual Service Retirement Rates per 100 Eligible Participants
Service*
Age** 5-18 19-30 31 32-33 34+
60 and
younger - - - - -
61 13 15 20 25 25
62 8 10 15 20 20
63 8 10 15 20 20
64 8 10 15 20 20
65 20 10 15 20 20
66 20 40 70 70 70
67 20 40 40 40 40
68 20 40 40 40 40
69 20 40 40 40 40
70 100 100 100 100 100
Notes:
* Active member service rounded to nearest year on June 30 prior to retirement
** Age rounded to nearest year on June 30 prior to retirement DEATH AFTER RETIREMENT: For annuitants, the 1995 George B. Buck Mortality Tables projected 16 years for males and one year for females as of June 30, 2007. For beneficiaries, the 1995 George B Buck Mortality Tables projected one year for both males and females, then rated forward two years for males and forward one year for females as of June 30, 2007. Additional mortality improvements projected with scale AA are phased in over the four year period following June 30, 2007. For the period after disability retirement, the Pension Benefit Guaranty Corporation rates for male disabled lives not necessarily receiving Social Security benefits, rated forward five years for males and rated back two years for females, but not less than the rate at age 65 (after the setforward or setback). (Disabled mortality assumption adopted effective June 30, 1997.)
MARITAL DATA: It is assumed that 85% of members are married and that the female spouse
is three years younger than the male spouse. (Adopted effective June 30, 1993.)
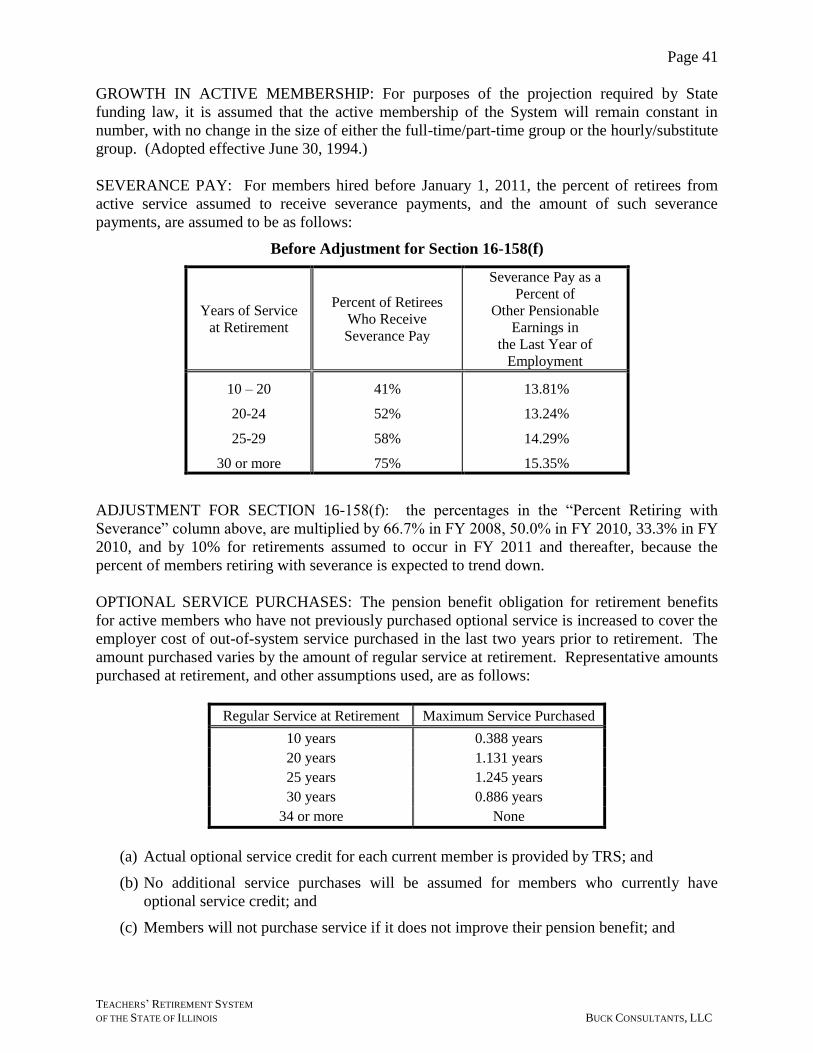
Page 41
TEACHERS’ RETIREMENT SYSTEM
OF THE STATE OF ILLINOIS BUCK CONSULTANTS, LLC
GROWTH IN ACTIVE MEMBERSHIP: For purposes of the projection required by State
funding law, it is assumed that the active membership of the System will remain constant in
number, with no change in the size of either the full-time/part-time group or the hourly/substitute
group. (Adopted effective June 30, 1994.)
SEVERANCE PAY: For members hired before January 1, 2011, the percent of retirees from
active service assumed to receive severance payments, and the amount of such severance
payments, are assumed to be as follows:
Before Adjustment for Section 16-158(f)
Years of Service
at Retirement
Percent of Retirees
Who Receive
Severance Pay
Severance Pay as a
Percent of
Other Pensionable
Earnings in
the Last Year of
Employment
10 – 20
20-24
25-29
30 or more
41%
52%
58%
75%
13.81%
13.24%
14.29%
15.35%
ADJUSTMENT FOR SECTION 16-158(f): the percentages in the ―Percent Retiring with
Severance‖ column above, are multiplied by 66.7% in FY 2008, 50.0% in FY 2010, 33.3% in FY
2010, and by 10% for retirements assumed to occur in FY 2011 and thereafter, because the
percent of members retiring with severance is expected to trend down.
OPTIONAL SERVICE PURCHASES: The pension benefit obligation for retirement benefits
for active members who have not previously purchased optional service is increased to cover the
employer cost of out-of-system service purchased in the last two years prior to retirement. The
amount purchased varies by the amount of regular service at retirement. Representative amounts
purchased at retirement, and other assumptions used, are as follows:
Regular Service at Retirement Maximum Service Purchased
10 years 0.388 years
20 years 1.131 years
25 years 1.245 years
30 years 0.886 years
34 or more None
(a) Actual optional service credit for each current member is provided by TRS; and
(b) No additional service purchases will be assumed for members who currently have
optional service credit; and
(c) Members will not purchase service if it does not improve their pension benefit; and
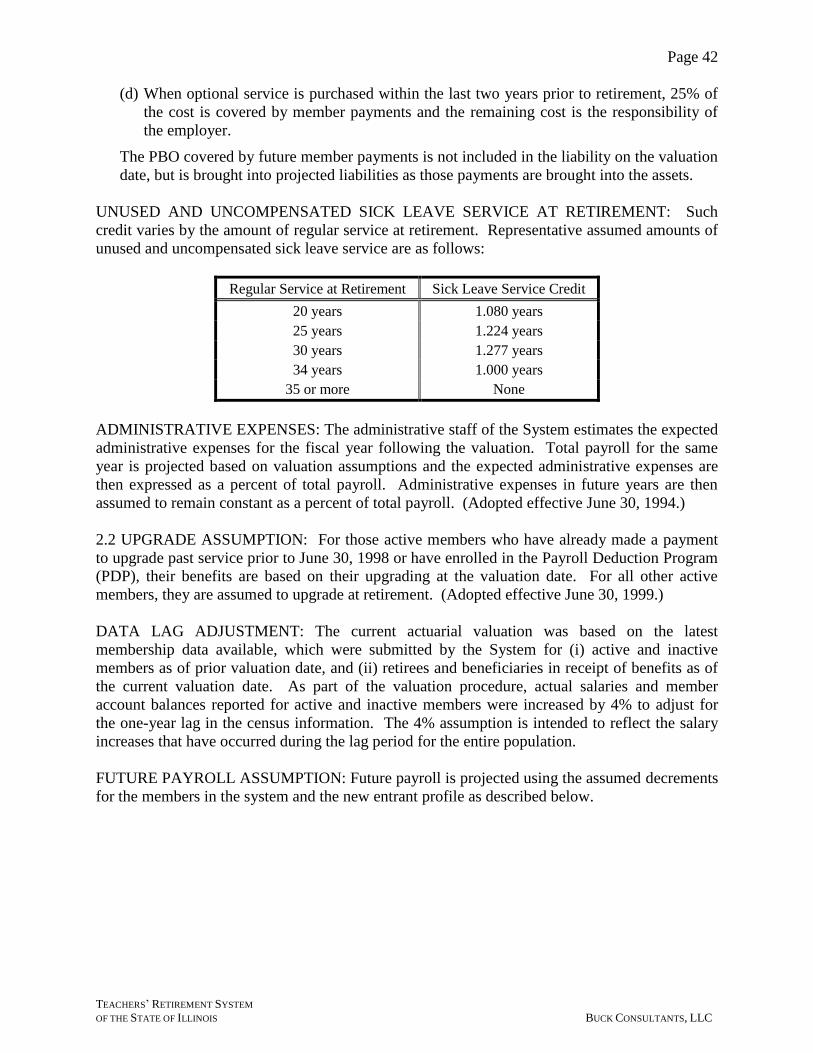
Page 42
TEACHERS’ RETIREMENT SYSTEM
OF THE STATE OF ILLINOIS BUCK CONSULTANTS, LLC
(d) When optional service is purchased within the last two years prior to retirement, 25% of
the cost is covered by member payments and the remaining cost is the responsibility of
the employer.
The PBO covered by future member payments is not included in the liability on the valuation
date, but is brought into projected liabilities as those payments are brought into the assets.
UNUSED AND UNCOMPENSATED SICK LEAVE SERVICE AT RETIREMENT: Such
credit varies by the amount of regular service at retirement. Representative assumed amounts of
unused and uncompensated sick leave service are as follows:
Regular Service at Retirement Sick Leave Service Credit
20 years 1.080 years
25 years 1.224 years
30 years 1.277 years
34 years 1.000 years
35 or more None
ADMINISTRATIVE EXPENSES: The administrative staff of the System estimates the expected
administrative expenses for the fiscal year following the valuation. Total payroll for the same
year is projected based on valuation assumptions and the expected administrative expenses are
then expressed as a percent of total payroll. Administrative expenses in future years are then
assumed to remain constant as a percent of total payroll. (Adopted effective June 30, 1994.)
2.2 UPGRADE ASSUMPTION: For those active members who have already made a payment
to upgrade past service prior to June 30, 1998 or have enrolled in the Payroll Deduction Program
(PDP), their benefits are based on their upgrading at the valuation date. For all other active
members, they are assumed to upgrade at retirement. (Adopted effective June 30, 1999.)
DATA LAG ADJUSTMENT: The current actuarial valuation was based on the latest
membership data available, which were submitted by the System for (i) active and inactive
members as of prior valuation date, and (ii) retirees and beneficiaries in receipt of benefits as of
the current valuation date. As part of the valuation procedure, actual salaries and member
account balances reported for active and inactive members were increased by 4% to adjust for
the one-year lag in the census information. The 4% assumption is intended to reflect the salary
increases that have occurred during the lag period for the entire population.
FUTURE PAYROLL ASSUMPTION: Future payroll is projected using the assumed decrements
for the members in the system and the new entrant profile as described below.
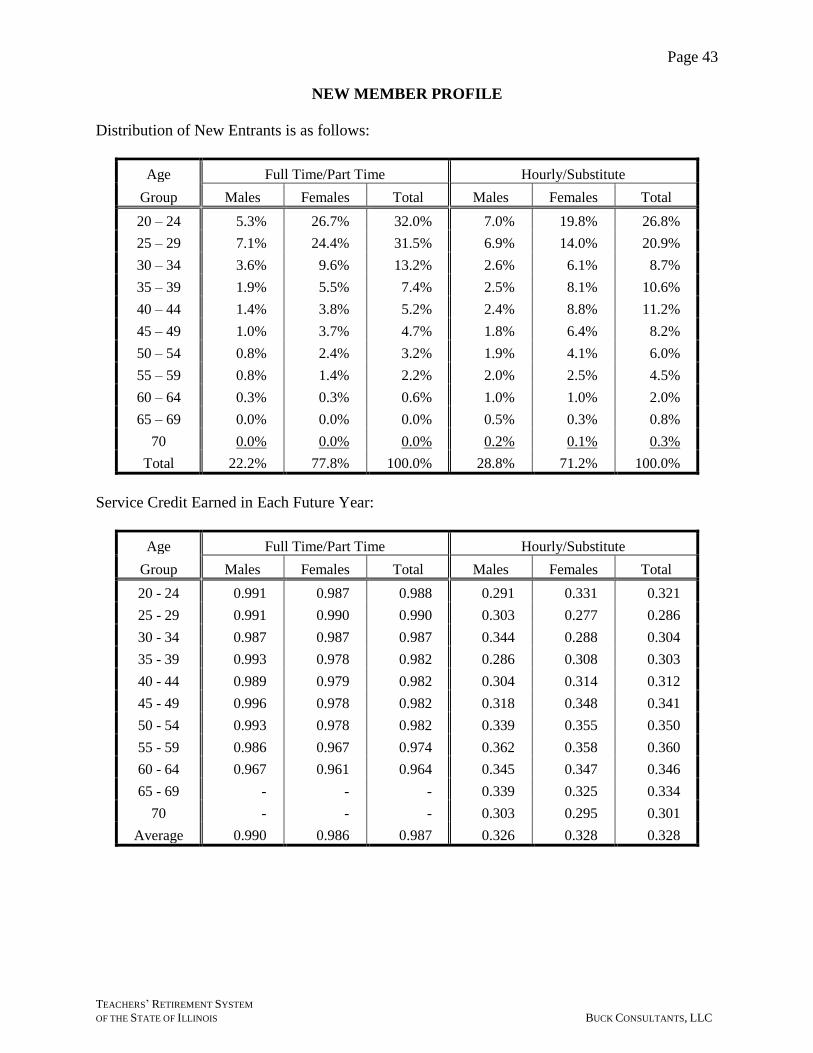
Page 43
TEACHERS’ RETIREMENT SYSTEM
OF THE STATE OF ILLINOIS BUCK CONSULTANTS, LLC
NEW MEMBER PROFILE
Distribution of New Entrants is as follows:
Age Full Time/Part Time Hourly/Substitute
Group Males Females Total Males Females Total
20 – 24 5.3% 26.7% 32.0% 7.0% 19.8% 26.8%
25 – 29 7.1% 24.4% 31.5% 6.9% 14.0% 20.9%
30 – 34 3.6% 9.6% 13.2% 2.6% 6.1% 8.7%
35 – 39 1.9% 5.5% 7.4% 2.5% 8.1% 10.6%
40 – 44 1.4% 3.8% 5.2% 2.4% 8.8% 11.2%
45 – 49 1.0% 3.7% 4.7% 1.8% 6.4% 8.2%
50 – 54 0.8% 2.4% 3.2% 1.9% 4.1% 6.0%
55 – 59 0.8% 1.4% 2.2% 2.0% 2.5% 4.5%
60 – 64 0.3% 0.3% 0.6% 1.0% 1.0% 2.0%
65 – 69 0.0% 0.0% 0.0% 0.5% 0.3% 0.8%
70 0.0% 0.0% 0.0% 0.2% 0.1% 0.3%
Total 22.2% 77.8% 100.0% 28.8% 71.2% 100.0%
Service Credit Earned in Each Future Year:
Age Full Time/Part Time Hourly/Substitute
Group Males Females Total Males Females Total
20 - 24 0.991 0.987 0.988 0.291 0.331 0.321
25 - 29 0.991 0.990 0.990 0.303 0.277 0.286
30 - 34 0.987 0.987 0.987 0.344 0.288 0.304
35 - 39 0.993 0.978 0.982 0.286 0.308 0.303
40 - 44 0.989 0.979 0.982 0.304 0.314 0.312
45 - 49 0.996 0.978 0.982 0.318 0.348 0.341
50 - 54 0.993 0.978 0.982 0.339 0.355 0.350
55 - 59 0.986 0.967 0.974 0.362 0.358 0.360
60 - 64 0.967 0.961 0.964 0.345 0.347 0.346
65 - 69 - - - 0.339 0.325 0.334
70 - - - 0.303 0.295 0.301
Average 0.990 0.986 0.987 0.326 0.328 0.328
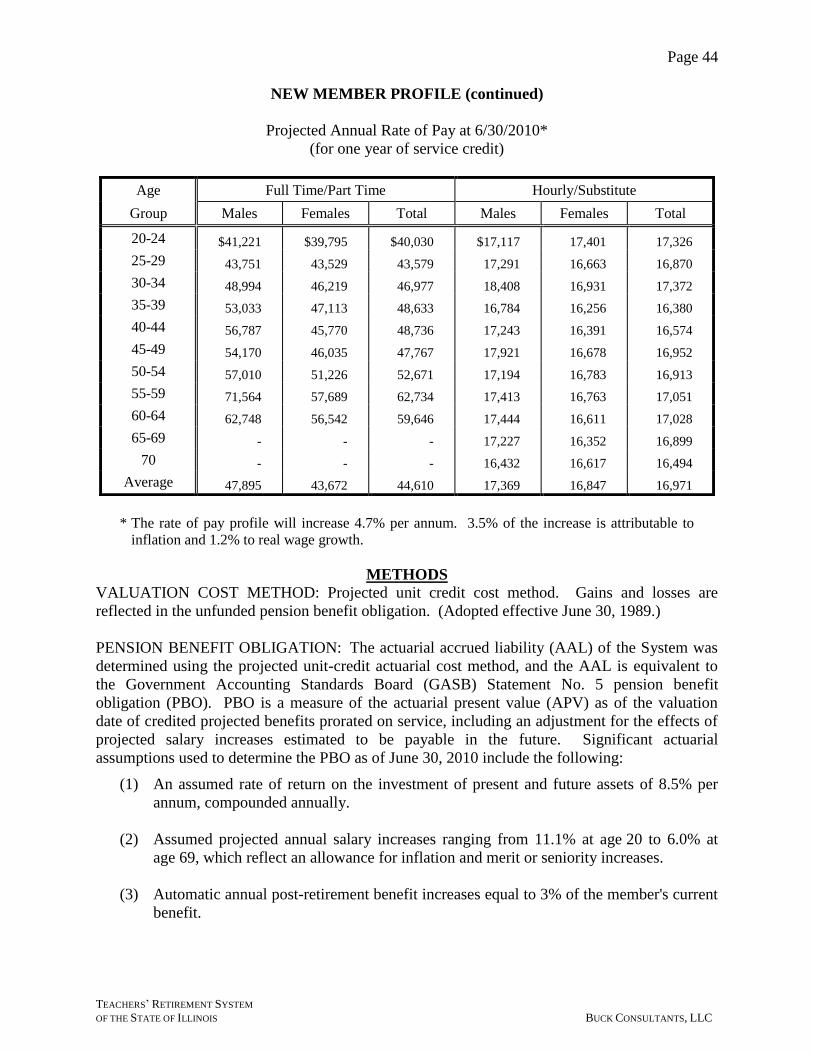
Page 44
TEACHERS’ RETIREMENT SYSTEM
OF THE STATE OF ILLINOIS BUCK CONSULTANTS, LLC
NEW MEMBER PROFILE (continued)
Projected Annual Rate of Pay at 6/30/2010*
(for one year of service credit)
Age Full Time/Part Time Hourly/Substitute
Group Males Females Total Males Females Total
20-24 $41,221 $39,795 $40,030 $17,117 17,401 17,326
25-29 43,751 43,529 43,579 17,291 16,663 16,870
30-34 48,994 46,219 46,977 18,408 16,931 17,372
35-39 53,033 47,113 48,633 16,784 16,256 16,380
40-44 56,787 45,770 48,736 17,243 16,391 16,574
45-49 54,170 46,035 47,767 17,921 16,678 16,952
50-54 57,010 51,226 52,671 17,194 16,783 16,913
55-59 71,564 57,689 62,734 17,413 16,763 17,051
60-64 62,748 56,542 59,646 17,444 16,611 17,028
65-69 - - - 17,227 16,352 16,899
70 - - - 16,432 16,617 16,494
Average 47,895 43,672 44,610 17,369 16,847 16,971
* The rate of pay profile will increase 4.7% per annum. 3.5% of the increase is attributable to
inflation and 1.2% to real wage growth.
METHODS
VALUATION COST METHOD: Projected unit credit cost method. Gains and losses are
reflected in the unfunded pension benefit obligation. (Adopted effective June 30, 1989.)
PENSION BENEFIT OBLIGATION: The actuarial accrued liability (AAL) of the System was
determined using the projected unit-credit actuarial cost method, and the AAL is equivalent to
the Government Accounting Standards Board (GASB) Statement No. 5 pension benefit
obligation (PBO). PBO is a measure of the actuarial present value (APV) as of the valuation
date of credited projected benefits prorated on service, including an adjustment for the effects of
projected salary increases estimated to be payable in the future. Significant actuarial
assumptions used to determine the PBO as of June 30, 2010 include the following:
(1) An assumed rate of return on the investment of present and future assets of 8.5% per
annum, compounded annually.
(2) Assumed projected annual salary increases ranging from 11.1% at age 20 to 6.0% at
age 69, which reflect an allowance for inflation and merit or seniority increases.
(3) Automatic annual post-retirement benefit increases equal to 3% of the member's current
benefit.
Page 45
TEACHERS’ RETIREMENT SYSTEM
OF THE STATE OF ILLINOIS BUCK CONSULTANTS, LLC
ASSET VALUATION METHOD: Beginning with the June 30, 2010 valuation, the method for
determining the actuarial value of assets was changed from the market value to a smoothed
value. The smoothed value recognizes the actuarial investment gains or losses for each fiscal
year in equal amounts over the ensuing five-year period.
AMORTIZATION OF UNFUNDED ACCRUED LIABILITY: The amortization of the
unfunded accrued liability is amortized as a level percentage of pay over 30 years based on the
salary increase assumption and new entrant profile found elsewhere in the report. The
determination of the Annual Required Contribution (ARC) can be found in Schedule II of this
report.

Page 46
TEACHERS’ RETIREMENT SYSTEM
OF THE STATE OF ILLINOIS BUCK CONSULTANTS, LLC
SECTION X — SUMMARY OF
BENEFIT AND CONTRIBUTION PROVISIONS
MEMBERSHIP
Employers of the System include:
(a) the Illinois public common school districts outside of Chicago,
(b) certain state agencies employing certificated teachers, and
(c) the State Board of Education, Illinois School Board Association, statewide and national
teacher organizations, educational cooperatives and the retirement system.
Employees covered under the System include:
Any educational, administrative, professional or other staff employed in the public common
schools outside the City of Chicago in a position requiring certification under the teacher
certification law, including substitute teachers, part-time teachers, and hourly paid teachers
who are on a flexible work schedule;
Any position requiring teacher certification in certain state agencies;
Any regional superintendent of schools, assistant regional superintendent of schools, State
Superintendent of Education; any person employed by the State Board of Education as an
executive; any executive of the boards engaged in the service of public common school
education in school districts covered under this system of which the State Superintendent of
Education is an ex-officio member;
Any employee of a school board association who is certificated under the teacher
certification law;
Any person employed by the retirement system who was an employee of and a participant in
the system on August 17, 2001 or becomes an employee of the system on or after
August 17, 2001;
Any educational, administrative, professional or other staff employed by and under the
supervision and control of a regional superintendent of schools, provided such employment
position requires the person to be certificated under the teacher certification law;
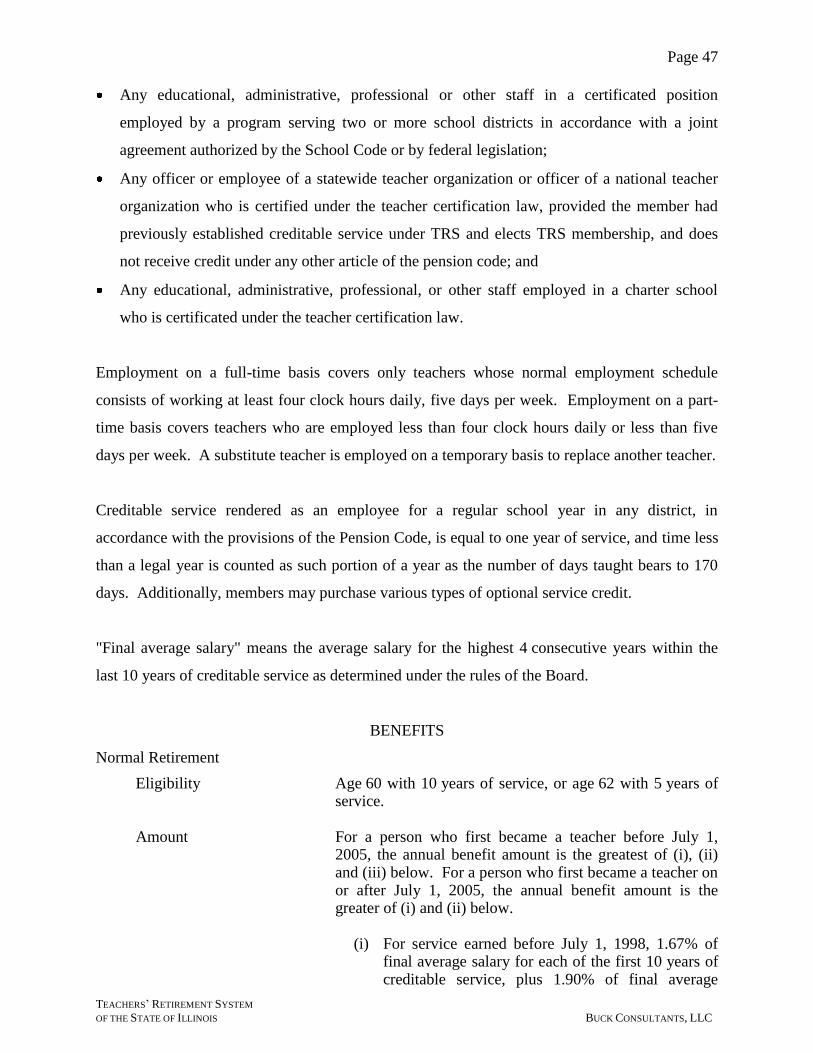
Page 47
TEACHERS’ RETIREMENT SYSTEM
OF THE STATE OF ILLINOIS BUCK CONSULTANTS, LLC
Any educational, administrative, professional or other staff in a certificated position
employed by a program serving two or more school districts in accordance with a joint
agreement authorized by the School Code or by federal legislation;
Any officer or employee of a statewide teacher organization or officer of a national teacher
organization who is certified under the teacher certification law, provided the member had
previously established creditable service under TRS and elects TRS membership, and does
not receive credit under any other article of the pension code; and
Any educational, administrative, professional, or other staff employed in a charter school
who is certificated under the teacher certification law.
Employment on a full-time basis covers only teachers whose normal employment schedule
consists of working at least four clock hours daily, five days per week. Employment on a part-
time basis covers teachers who are employed less than four clock hours daily or less than five
days per week. A substitute teacher is employed on a temporary basis to replace another teacher.
Creditable service rendered as an employee for a regular school year in any district, in
accordance with the provisions of the Pension Code, is equal to one year of service, and time less
than a legal year is counted as such portion of a year as the number of days taught bears to 170
days. Additionally, members may purchase various types of optional service credit.
"Final average salary" means the average salary for the highest 4 consecutive years within the
last 10 years of creditable service as determined under the rules of the Board.
BENEFITS
Normal Retirement
Eligibility Age 60 with 10 years of service, or age 62 with 5 years of service.
Amount For a person who first became a teacher before July 1,
2005, the annual benefit amount is the greatest of (i), (ii) and (iii) below. For a person who first became a teacher on or after July 1, 2005, the annual benefit amount is the greater of (i) and (ii) below.
(i) For service earned before July 1, 1998, 1.67% of
final average salary for each of the first 10 years of creditable service, plus 1.90% of final average
Page 48
TEACHERS’ RETIREMENT SYSTEM
OF THE STATE OF ILLINOIS BUCK CONSULTANTS, LLC
salary for each year in excess of 10 but not exceeding 20, plus 2.10% of final average salary for each year in excess of 20 but not exceeding 30, and 2.30% of final average salary for each year in excess of 30. For all other service, 2.2% of final average salary.*
* Service earned before July 1, 1998 can be upgraded to 2.2% through additional member contributions or 1% of
the member’s highest salary within the last four years for each year of prior service. Maximum payment is 20% of salary, but all years are upgraded. The number of years to be upgraded is reduced by one for each three full years worked under the 2.2% formula. The 2.2% formula upgrade cost is reduced on a sliding scale for members who have more than 34 years of service credit.
(ii) 1½% of final average salary for each year of
creditable service, plus $7.50 per year for each of the first 20 years of creditable service.
(iii) An actuarially equivalent life annuity, resulting
from the member's contributions and State-match-ing contributions (1.4 times member contributions) plus compound interest on both.
Maximum amount under (i) and (ii) above - 75% of final
average salary. Automatic Postretirement Cost-of-Living Adjustment
Eligibility Member contributed for at least an equivalent period of one full year of creditable service after July 1, 1969.
Amount Initial increase of 1½% of base annuity for periods prior to
January 1, 1972, 2% for periods from and after January 1, 1972 and prior to January 1, 1978, and 3% for periods thereafter (such periods to exclude any period of retirement that precedes attainment of age 55). Initial increase payable effective with the later of: January 1 following first anniversary of retirement; or January 1 following attainment of age 61.
Following the initial increase, automatic annual increases
payable on each January 1 thereafter. Prior to January 1, 1990, annual increases were determined as a percentage of the original retirement annuity. Effective on and after January 1, 1990, automatic annual increases granted to eligible annuitants equal 3% of the total annuity being received, including previous increases granted.
Page 49
TEACHERS’ RETIREMENT SYSTEM
OF THE STATE OF ILLINOIS BUCK CONSULTANTS, LLC
Early Retirement
Eligibility Age 55 with 20 years of service. Amount Equal to the amount computed under normal retirement,
reduced by 6% for each year the member is under age 60. There is no reduction for a member who retires prior to age 60 with 35 years of credited service.
Early Retirement Incentive for State Employees Some TRS-covered members employed by state agencies
were eligible for an early retirement incentive (ERI) during fiscal year 2003. PA 92-566, enacted in June 2002, allowed certain state employees to purchase up to five years of service credit and an equal amount of age enhancement. Retirement must have occurred between August 1, 2002 and December 31, 2002, with deferrals until April 30, 2003, for key employees. Some employees who were not yet eligible to retire could also purchase the age and service enhancements if they terminated state employment.
Early Retirement Option A member retiring after June 1, 1980 and within six
months of the last day of teaching for which retirement contributions were required, may elect to make a one time employee contribution to avoid the early retirement reduction described in the foregoing paragraph. Such employee and employer contributions will be a multiple of the member's last full time annual salary rate as a teacher, the full time equivalent if less than full time, or the highest year's salary used for determining final average salary.
The member lump sum ERO contribution rate for persons
who retired under ERO prior to July 1, 2005, or who retired during the ―Pipeline ERO‖ period July 1, 2005 through July 1, 2007 after having properly notified their employer by June 1, 2005 of their intent to retire under ERO during the Pipeline ERO period is 7%, and the employer lump sum ERO contribution rate for such persons is 20%.
The member lump sum ERO contribution rate for other
persons is 11.5%, and the employer lump sum ERO contribution rate for such persons is 23.5%. Such other persons are referred to as ―Modified ERO‖ retirees.
The multiple of salary to be contributed by the member
equals the member rate times the lesser of the following two periods: (a) the number of years (including fractional years) that the member is less than age 60; or (b) the
Page 50
TEACHERS’ RETIREMENT SYSTEM
OF THE STATE OF ILLINOIS BUCK CONSULTANTS, LLC
number of years (including fractional years) that the member's creditable service is less than 35 years.
The multiple of salary to be contributed by the member’s
employer equals the employer rate times the number of years (including fractional years) that the member is less than age 60.
Both the member and employer contributions are waived
for Pipeline ERO retirees who are at least age 55 with at least 34 years of service. There is no waiver for Modified ERO retirees.
The ERO provisions will not be applicable until the
member contributions have been received; however, the date such contributions are received will not be considered in determining the effective date of retirement. The number of employees of a single employer who may retire under this paragraph in any year may be limited at the option of the employer to a specified percentage of those eligible, not lower than 30% for Pipeline ERO retirees, and not lower than 10% for Modified ERO retirees, with the right to participate to be allocated among those applying on the basis of seniority in the service of the employer.
Rule of 85 for State Employees An employee of a state agency retiring on or after
January 1, 2001 is entitled to a nondiscounted annuity if his or her attained age at retirement and total creditable service equal at least 85, provided he or she has (i) earned during the period immediately preceding the last day of service at least one year of contributing creditable service as a state employee and (ii) has earned at least 5 years of contributing creditable service as a state employee.
Single Sum Benefit
Eligibility Age 65 with fewer than 5 years of creditable service after July 1, 1947.
Amount Lump sum payment actuarially equivalent to a life annuity
consisting of 1.67% of final average salary for each year of service.
Temporary Disability Benefit
Eligibility 3 years of credited service. Amount Equal to 40% of the member's most recent annual contract
salary at time of disablement. The benefit is payable beginning with the 31st day after disablement and ending at the earlier of (1) cessation of disability, (2) when the member requests termination of the benefit, (3) when the
Page 51
TEACHERS’ RETIREMENT SYSTEM
OF THE STATE OF ILLINOIS BUCK CONSULTANTS, LLC
period for which payments have been made equals one-fourth the period of creditable service, or (4) the member is gainfully employed or able to be gainfully employed.
Disability Retirement Annuity
Eligibility Termination of temporary disability benefit, provided member remains disabled.
Amount The larger of 35% of the member's most recent annual
contract salary or (a) if disability commences prior to age 55, the benefit payable as for normal retirement, but reduced by ½% for each month by which the member is less than age 55, or (b) if disability commences after age 55 and the member has 20 years of service, the benefit payable as for normal retirement with no discount.
Other formulas may be applicable if disability retirement
occurred prior to July 1, 1971. Occupational Disability
Eligibility Totally and immediately incapacitated for the performance of duty.
Amount Equal to 60% of salary, if disability is duty-connected or
occupational adjudicated by the Illinois Industrial Commission as compensable under either the Workers' Compensation or Occupational Diseases Act. Any amounts payable under these Acts shall be applied as an offset to any occupational disability benefits payable by the Teachers' Retirement System. In general, benefits are payable throughout the period of disability.
Deferred Vested Benefits
Eligibility 5 years of service. Amount Equal to the amount computed under normal retirement
deferred to age 62 if member has less than 10 years of service. With 10 or more years of service the annuity is payable at age 60.
Reversionary Retirement Annuity Any member entitled to a retirement annuity for age may
elect to receive a reduced annuity with the remainder determined on an actuarial basis to become, upon the member's death, an annuity for life to any designated person dependent upon the member at the time of the member's retirement, provided such payment shall not be less than $10 nor more than the amount of reduced age
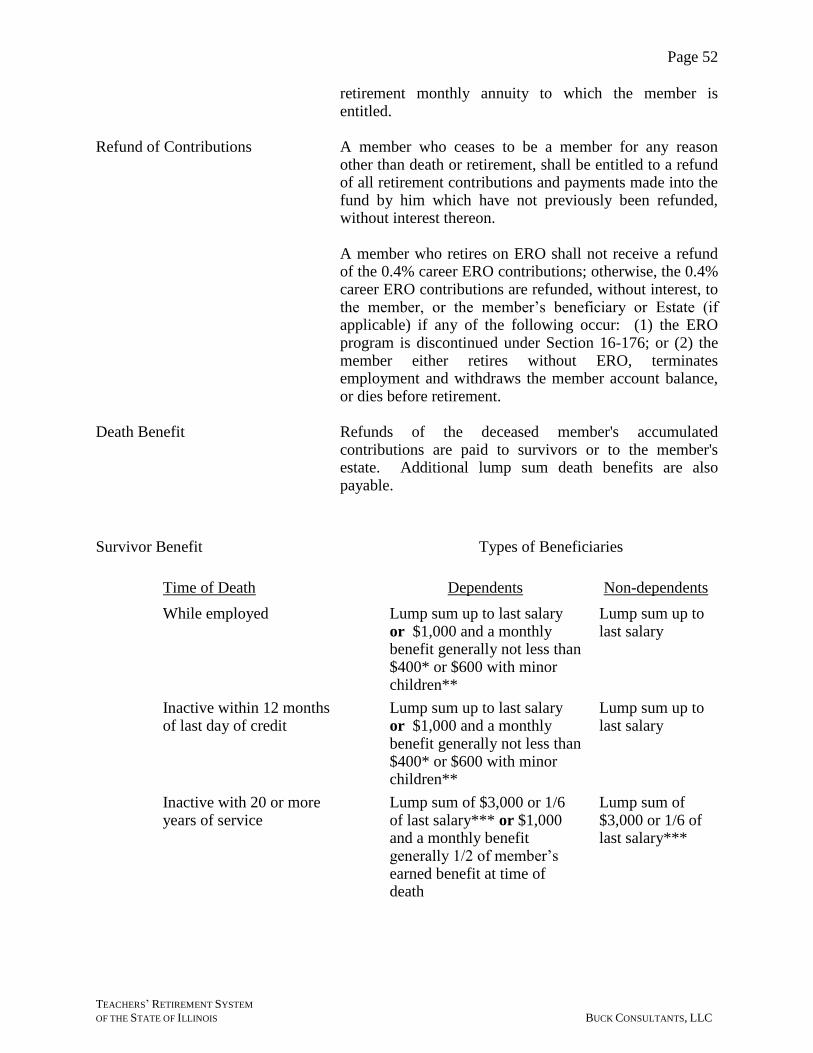
Page 52
TEACHERS’ RETIREMENT SYSTEM
OF THE STATE OF ILLINOIS BUCK CONSULTANTS, LLC
retirement monthly annuity to which the member is entitled.
Refund of Contributions A member who ceases to be a member for any reason
other than death or retirement, shall be entitled to a refund of all retirement contributions and payments made into the fund by him which have not previously been refunded, without interest thereon.
A member who retires on ERO shall not receive a refund
of the 0.4% career ERO contributions; otherwise, the 0.4% career ERO contributions are refunded, without interest, to the member, or the member’s beneficiary or Estate (if applicable) if any of the following occur: (1) the ERO program is discontinued under Section 16-176; or (2) the member either retires without ERO, terminates employment and withdraws the member account balance, or dies before retirement.
Death Benefit Refunds of the deceased member's accumulated
contributions are paid to survivors or to the member's estate. Additional lump sum death benefits are also payable.
Survivor Benefit Types of Beneficiaries
Time of Death Dependents Non-dependents
While employed Lump sum up to last salary or $1,000 and a monthly benefit generally not less than $400* or $600 with minor children**
Lump sum up to last salary
Inactive within 12 months of last day of credit
Lump sum up to last salary or $1,000 and a monthly benefit generally not less than $400* or $600 with minor children**
Lump sum up to last salary
Inactive with 20 or more years of service
Lump sum of $3,000 or 1/6 of last salary*** or $1,000 and a monthly benefit generally 1/2 of member’s earned benefit at time of death
Lump sum of $3,000 or 1/6 of last salary***

Page 53
TEACHERS’ RETIREMENT SYSTEM
OF THE STATE OF ILLINOIS BUCK CONSULTANTS, LLC
Annuitant Lump sum of $3,000 or 1/6 of last salary*** or $1,000 and a monthly benefit generally 1/2 of annuitant’s earned benefit at time of death
Lump sum of $3,000 or 1/6 of last salary***
* Certain circumstances might provide a monthly annuity less than $400 per month for an active
member.
** TRS will pay 50 percent of the member’s earned retirement annuity at death if it is greater than
the above amounts.
*** Certain lump sums may be greater if the annuitant or inactive member has been in retirement or
out of service for less than five years.
Member Contributions Beginning July 1, 2005, each member contributes an
additional 0.4% of pay ―career ERO contribution,‖ bringing the total contribution to 9.4%. This contribution requirement shall cease if the Early Retirement Option program ends.
Beginning July 1, 1998, contributions for creditable
service are made at the rate of 8% (exclusive of the 1% Survivor Benefit Contribution) of salary which is comprised of a rate of 7½% of salary towards the cost of the retirement annuity plus ½% of salary toward the cost of the automatic annual increase in retirement annuity.
Beginning July 24, 1959, each member contributes an additional 1% of salary toward Survivor's Benefits. These contributions are subject to refund if there is no dependent beneficiary at retirement, provided the member elects such refund.
Beginning July 1, 1995, each member not employed by a
State agency contributes to the Teachers' Health Insurance Security Fund, administered by the Department of Central Management Services. These contributions are not refundable and do not become part of the System's assets.
Additional contributions as are necessary to receive credit
for service during which contributions were not made, such as military service or service outside the System.
New Benefit Increases: The term ―new benefit increase‖ means an increase in the
amount of any benefit provided by the statute, or an expansion of the eligibility requirements for any benefit provided by the statute, resulting from an amendment that takes effect on or after June 1, 2005.
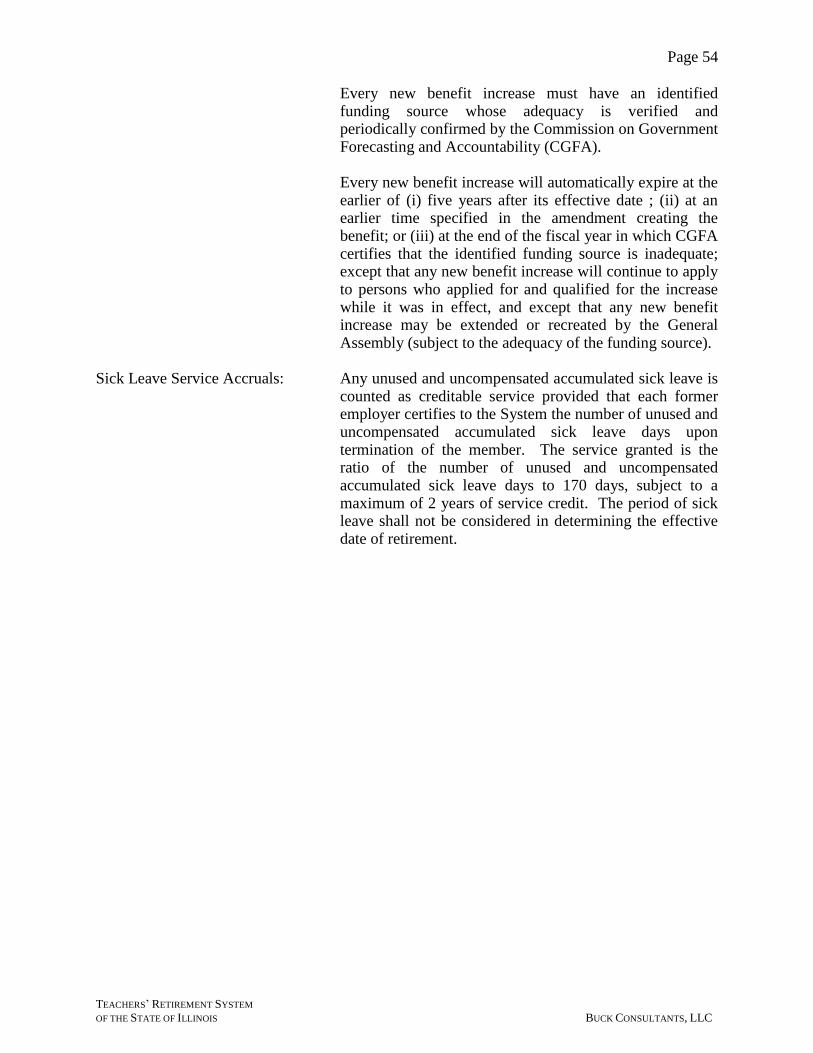
Page 54
TEACHERS’ RETIREMENT SYSTEM
OF THE STATE OF ILLINOIS BUCK CONSULTANTS, LLC
Every new benefit increase must have an identified funding source whose adequacy is verified and periodically confirmed by the Commission on Government Forecasting and Accountability (CGFA).
Every new benefit increase will automatically expire at the
earlier of (i) five years after its effective date ; (ii) at an earlier time specified in the amendment creating the benefit; or (iii) at the end of the fiscal year in which CGFA certifies that the identified funding source is inadequate; except that any new benefit increase will continue to apply to persons who applied for and qualified for the increase while it was in effect, and except that any new benefit increase may be extended or recreated by the General Assembly (subject to the adequacy of the funding source).
Sick Leave Service Accruals: Any unused and uncompensated accumulated sick leave is
counted as creditable service provided that each former employer certifies to the System the number of unused and uncompensated accumulated sick leave days upon termination of the member. The service granted is the ratio of the number of unused and uncompensated accumulated sick leave days to 170 days, subject to a maximum of 2 years of service credit. The period of sick leave shall not be considered in determining the effective date of retirement.
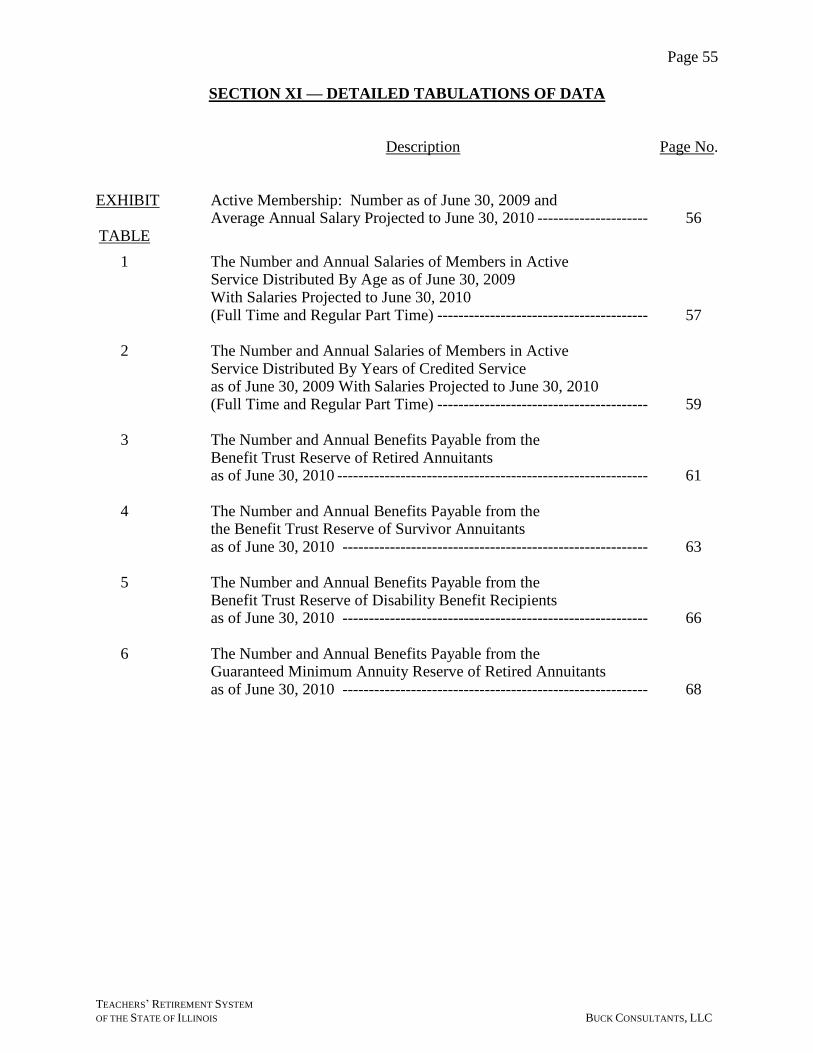
Page 55
TEACHERS’ RETIREMENT SYSTEM
OF THE STATE OF ILLINOIS BUCK CONSULTANTS, LLC
SECTION XI — DETAILED TABULATIONS OF DATA Description Page No. EXHIBIT Active Membership: Number as of June 30, 2009 and Average Annual Salary Projected to June 30, 2010 --------------------- 56 TABLE
1 The Number and Annual Salaries of Members in Active Service Distributed By Age as of June 30, 2009 With Salaries Projected to June 30, 2010 (Full Time and Regular Part Time) ---------------------------------------- 57 2 The Number and Annual Salaries of Members in Active
Service Distributed By Years of Credited Service as of June 30, 2009 With Salaries Projected to June 30, 2010 (Full Time and Regular Part Time) ---------------------------------------- 59
3 The Number and Annual Benefits Payable from the Benefit Trust Reserve of Retired Annuitants as of June 30, 2010 ----------------------------------------------------------- 61 4 The Number and Annual Benefits Payable from the the Benefit Trust Reserve of Survivor Annuitants as of June 30, 2010 ---------------------------------------------------------- 63 5 The Number and Annual Benefits Payable from the Benefit Trust Reserve of Disability Benefit Recipients as of June 30, 2010 ---------------------------------------------------------- 66 6 The Number and Annual Benefits Payable from the Guaranteed Minimum Annuity Reserve of Retired Annuitants as of June 30, 2010 ---------------------------------------------------------- 68

TEACHERS’ RETIREMENT SYSTEM
OF THE STATE OF ILLINOIS BUCK CONSULTANTS, LLC
Pag
e 56
Service Substitutes Grand Total
Age 0-4 5-9 10-14 15-19 20-24 25-29 30-34 35-39 40+ Total
Under 25 4,817 4,817 3,673 8,490
41,692 41,692 4,788 46,481
25-29 15,623$ 6,229$ 21,852$ 4,500$ 26,352
46,940$ 55,196$ 49,293$ 5,082$ 54,375
30-34 6,028 11,982 3,670 21,680 2,608 24,288
49,987$ 59,104$ 67,049$ 57,914$ 4,565$ 62,479
35-39 3,288$ 5,097$ 7,960$ 2,611$ 18,956$ 2,985$ 21,941
50,535 60,473 69,948 76,383 64,919 4,543 69,462
40-44 2,500$ 3,035$ 3,497$ 5,359$ 1,466$ 15,857$ 4,290$ 20,147
49,771$ 60,963$ 70,498$ 79,887$ 84,327$ 69,857$ 4,762$ 74,618
45-49 2,048 2,795 2,503 2,709 3,795 1,276 15,126 3,786$ 18,912
50,687$ 59,877$ 67,990$ 78,692$ 85,807$ 88,144$ 72,235$ 4,993 77,228
50-54 1,376$ 2,361$ 2,508$ 2,644$ 2,353$ 3,567$ 2,695$ 17,504$ 3,193$ 20,697
52,206 60,987 68,498 76,402 84,160 89,532 92,850 77,539 5,459$ 82,998
55-59 771$ 1,430$ 2,185$ 2,894$ 2,529$ 2,204$ 3,677$ 645$ 16,335$ 2,976$ 19,311
56,948$ 63,663$ 68,618$ 78,091$ 83,440$ 90,019$ 94,524$ 98,139$ 81,491$ 5,508 86,999
60-64 320 523 738 1,028 877 692 559 408 102 5,247 1,859 7,106
63,252$ 67,572$ 71,610$ 78,186$ 86,487$ 90,030$ 95,403$ 94,702$ 103,078$ 81,844$ 5,230$ 87,074
Over 64 52$ 87$ 109$ 136$ 113$ 92$ 78$ 44$ 95$ 806$ 1,123$ 1,929
57,164 70,714 72,768 79,838 82,022 82,753 91,741 92,553 95,242 80,735 4,740$ 85,475
Total 36,823$ 33,539$ 23,170$ 17,381$ 11,133$ 7,831$ 7,009$ 1,097$ 197$ 138,180$ 30,993 169,173
48,036$ 59,308$ 69,144$ 78,244$ 84,742$ 89,408$ 93,919$ 96,637$ 99,299$ 66,199$ 4,973$ 54,982
EXHIBIT
ACTIVE MEMBERSHIP
NUMBER AS OF JUNE 30, 2009 AND
AVERAGE ANNUAL SALARY PROJECTED TO JUNE 30, 2010
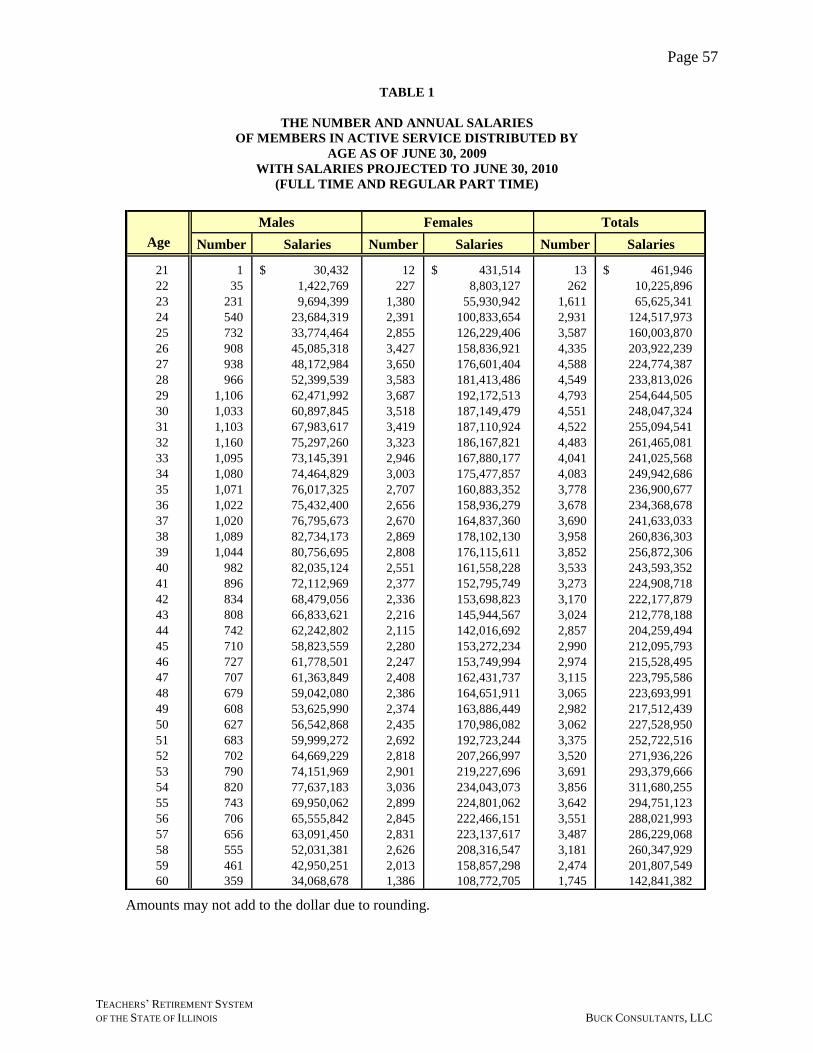
Page 57
TEACHERS’ RETIREMENT SYSTEM
OF THE STATE OF ILLINOIS BUCK CONSULTANTS, LLC
Males Females Totals
Age Number Salaries Number Salaries Number Salaries
21 1 30,432$ 12 431,514$ 13 461,946$
22 35 1,422,769 227 8,803,127 262 10,225,896
23 231 9,694,399 1,380 55,930,942 1,611 65,625,341
24 540 23,684,319 2,391 100,833,654 2,931 124,517,973
25 732 33,774,464 2,855 126,229,406 3,587 160,003,870
26 908 45,085,318 3,427 158,836,921 4,335 203,922,239
27 938 48,172,984 3,650 176,601,404 4,588 224,774,387
28 966 52,399,539 3,583 181,413,486 4,549 233,813,026
29 1,106 62,471,992 3,687 192,172,513 4,793 254,644,505
30 1,033 60,897,845 3,518 187,149,479 4,551 248,047,324
31 1,103 67,983,617 3,419 187,110,924 4,522 255,094,541
32 1,160 75,297,260 3,323 186,167,821 4,483 261,465,081
33 1,095 73,145,391 2,946 167,880,177 4,041 241,025,568
34 1,080 74,464,829 3,003 175,477,857 4,083 249,942,686
35 1,071 76,017,325 2,707 160,883,352 3,778 236,900,677
36 1,022 75,432,400 2,656 158,936,279 3,678 234,368,678
37 1,020 76,795,673 2,670 164,837,360 3,690 241,633,033
38 1,089 82,734,173 2,869 178,102,130 3,958 260,836,303
39 1,044 80,756,695 2,808 176,115,611 3,852 256,872,306
40 982 82,035,124 2,551 161,558,228 3,533 243,593,352
41 896 72,112,969 2,377 152,795,749 3,273 224,908,718
42 834 68,479,056 2,336 153,698,823 3,170 222,177,879
43 808 66,833,621 2,216 145,944,567 3,024 212,778,188
44 742 62,242,802 2,115 142,016,692 2,857 204,259,494
45 710 58,823,559 2,280 153,272,234 2,990 212,095,793
46 727 61,778,501 2,247 153,749,994 2,974 215,528,495
47 707 61,363,849 2,408 162,431,737 3,115 223,795,586
48 679 59,042,080 2,386 164,651,911 3,065 223,693,991
49 608 53,625,990 2,374 163,886,449 2,982 217,512,439
50 627 56,542,868 2,435 170,986,082 3,062 227,528,950
51 683 59,999,272 2,692 192,723,244 3,375 252,722,516
52 702 64,669,229 2,818 207,266,997 3,520 271,936,226
53 790 74,151,969 2,901 219,227,696 3,691 293,379,666
54 820 77,637,183 3,036 234,043,073 3,856 311,680,255
55 743 69,950,062 2,899 224,801,062 3,642 294,751,123
56 706 65,555,842 2,845 222,466,151 3,551 288,021,993
57 656 63,091,450 2,831 223,137,617 3,487 286,229,068
58 555 52,031,381 2,626 208,316,547 3,181 260,347,929
59 461 42,950,251 2,013 158,857,298 2,474 201,807,549
60 359 34,068,678 1,386 108,772,705 1,745 142,841,382
TABLE 1
THE NUMBER AND ANNUAL SALARIES
OF MEMBERS IN ACTIVE SERVICE DISTRIBUTED BY
AGE AS OF JUNE 30, 2009
WITH SALARIES PROJECTED TO JUNE 30, 2010
(FULL TIME AND REGULAR PART TIME)
Amounts may not add to the dollar due to rounding.
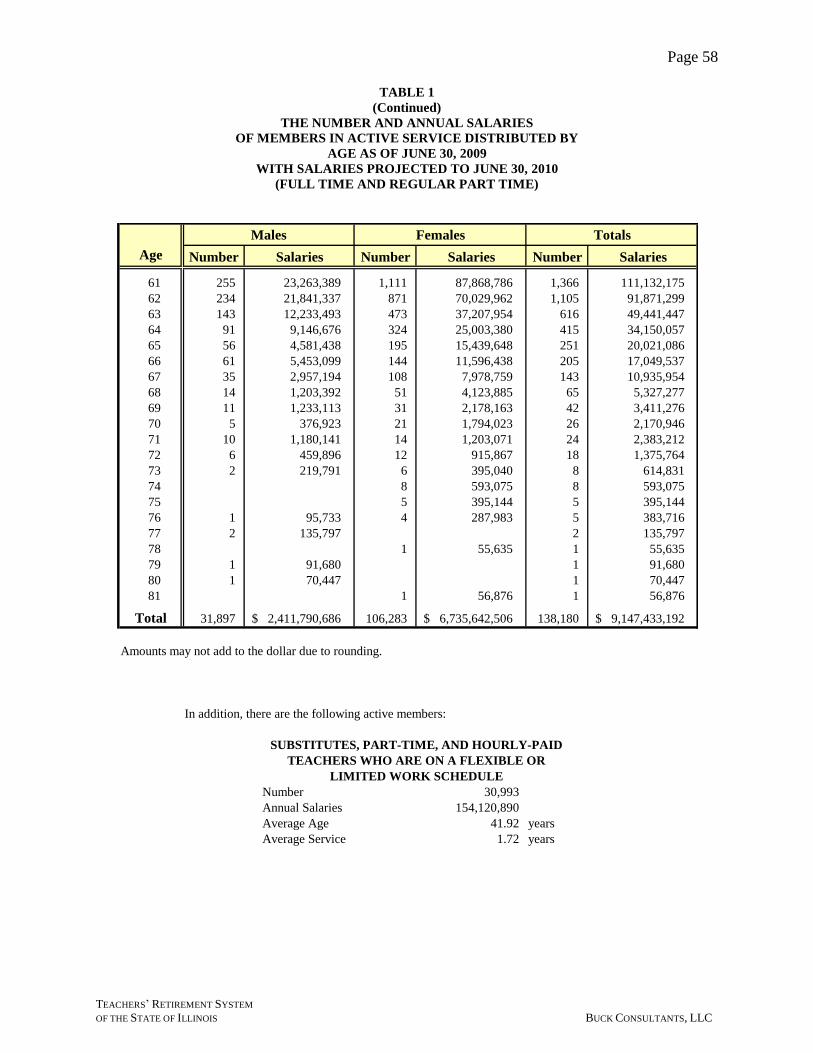
Page 58
TEACHERS’ RETIREMENT SYSTEM
OF THE STATE OF ILLINOIS BUCK CONSULTANTS, LLC
Males Females Totals
Age Number Salaries Number Salaries Number Salaries
61 255 23,263,389 1,111 87,868,786 1,366 111,132,175
62 234 21,841,337 871 70,029,962 1,105 91,871,299
63 143 12,233,493 473 37,207,954 616 49,441,447
64 91 9,146,676 324 25,003,380 415 34,150,057
65 56 4,581,438 195 15,439,648 251 20,021,086
66 61 5,453,099 144 11,596,438 205 17,049,537
67 35 2,957,194 108 7,978,759 143 10,935,954
68 14 1,203,392 51 4,123,885 65 5,327,277
69 11 1,233,113 31 2,178,163 42 3,411,276
70 5 376,923 21 1,794,023 26 2,170,946
71 10 1,180,141 14 1,203,071 24 2,383,212
72 6 459,896 12 915,867 18 1,375,764
73 2 219,791 6 395,040 8 614,831
74 8 593,075 8 593,075
75 5 395,144 5 395,144
76 1 95,733 4 287,983 5 383,716
77 2 135,797 2 135,797
78 1 55,635 1 55,635
79 1 91,680 1 91,680
80 1 70,447 1 70,447
81 1 56,876 1 56,876
Total 31,897 2,411,790,686$ 106,283 6,735,642,506$ 138,180 9,147,433,192$
Amounts may not add to the dollar due to rounding.
In addition, there are the following active members:
SUBSTITUTES, PART-TIME, AND HOURLY-PAID
TEACHERS WHO ARE ON A FLEXIBLE OR
LIMITED WORK SCHEDULE
Number 30,993
Annual Salaries 154,120,890
Average Age 41.92 years
Average Service 1.72 years
TABLE 1
(Continued)
THE NUMBER AND ANNUAL SALARIES
OF MEMBERS IN ACTIVE SERVICE DISTRIBUTED BY
AGE AS OF JUNE 30, 2009
WITH SALARIES PROJECTED TO JUNE 30, 2010
(FULL TIME AND REGULAR PART TIME)
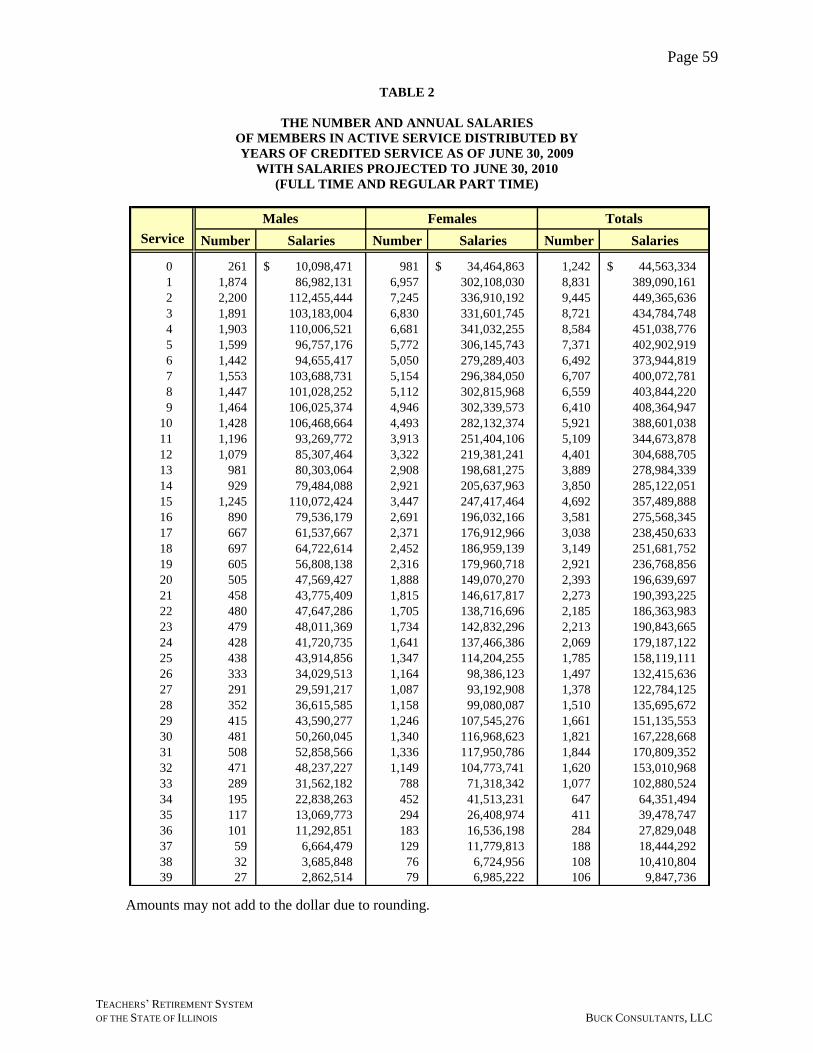
Page 59
TEACHERS’ RETIREMENT SYSTEM
OF THE STATE OF ILLINOIS BUCK CONSULTANTS, LLC
Males Females Totals
Service Number Salaries Number Salaries Number Salaries
0 261 10,098,471$ 981 34,464,863$ 1,242 44,563,334$
1 1,874 86,982,131 6,957 302,108,030 8,831 389,090,161
2 2,200 112,455,444 7,245 336,910,192 9,445 449,365,636
3 1,891 103,183,004 6,830 331,601,745 8,721 434,784,748
4 1,903 110,006,521 6,681 341,032,255 8,584 451,038,776
5 1,599 96,757,176 5,772 306,145,743 7,371 402,902,919
6 1,442 94,655,417 5,050 279,289,403 6,492 373,944,819
7 1,553 103,688,731 5,154 296,384,050 6,707 400,072,781
8 1,447 101,028,252 5,112 302,815,968 6,559 403,844,220
9 1,464 106,025,374 4,946 302,339,573 6,410 408,364,947
10 1,428 106,468,664 4,493 282,132,374 5,921 388,601,038
11 1,196 93,269,772 3,913 251,404,106 5,109 344,673,878
12 1,079 85,307,464 3,322 219,381,241 4,401 304,688,705
13 981 80,303,064 2,908 198,681,275 3,889 278,984,339
14 929 79,484,088 2,921 205,637,963 3,850 285,122,051
15 1,245 110,072,424 3,447 247,417,464 4,692 357,489,888
16 890 79,536,179 2,691 196,032,166 3,581 275,568,345
17 667 61,537,667 2,371 176,912,966 3,038 238,450,633
18 697 64,722,614 2,452 186,959,139 3,149 251,681,752
19 605 56,808,138 2,316 179,960,718 2,921 236,768,856
20 505 47,569,427 1,888 149,070,270 2,393 196,639,697
21 458 43,775,409 1,815 146,617,817 2,273 190,393,225
22 480 47,647,286 1,705 138,716,696 2,185 186,363,983
23 479 48,011,369 1,734 142,832,296 2,213 190,843,665
24 428 41,720,735 1,641 137,466,386 2,069 179,187,122
25 438 43,914,856 1,347 114,204,255 1,785 158,119,111
26 333 34,029,513 1,164 98,386,123 1,497 132,415,636
27 291 29,591,217 1,087 93,192,908 1,378 122,784,125
28 352 36,615,585 1,158 99,080,087 1,510 135,695,672
29 415 43,590,277 1,246 107,545,276 1,661 151,135,553
30 481 50,260,045 1,340 116,968,623 1,821 167,228,668
31 508 52,858,566 1,336 117,950,786 1,844 170,809,352
32 471 48,237,227 1,149 104,773,741 1,620 153,010,968
33 289 31,562,182 788 71,318,342 1,077 102,880,524
34 195 22,838,263 452 41,513,231 647 64,351,494
35 117 13,069,773 294 26,408,974 411 39,478,747
36 101 11,292,851 183 16,536,198 284 27,829,048
37 59 6,664,479 129 11,779,813 188 18,444,292
38 32 3,685,848 76 6,724,956 108 10,410,804
39 27 2,862,514 79 6,985,222 106 9,847,736
TABLE 2
THE NUMBER AND ANNUAL SALARIES
OF MEMBERS IN ACTIVE SERVICE DISTRIBUTED BY
YEARS OF CREDITED SERVICE AS OF JUNE 30, 2009
WITH SALARIES PROJECTED TO JUNE 30, 2010
(FULL TIME AND REGULAR PART TIME)
Amounts may not add to the dollar due to rounding.
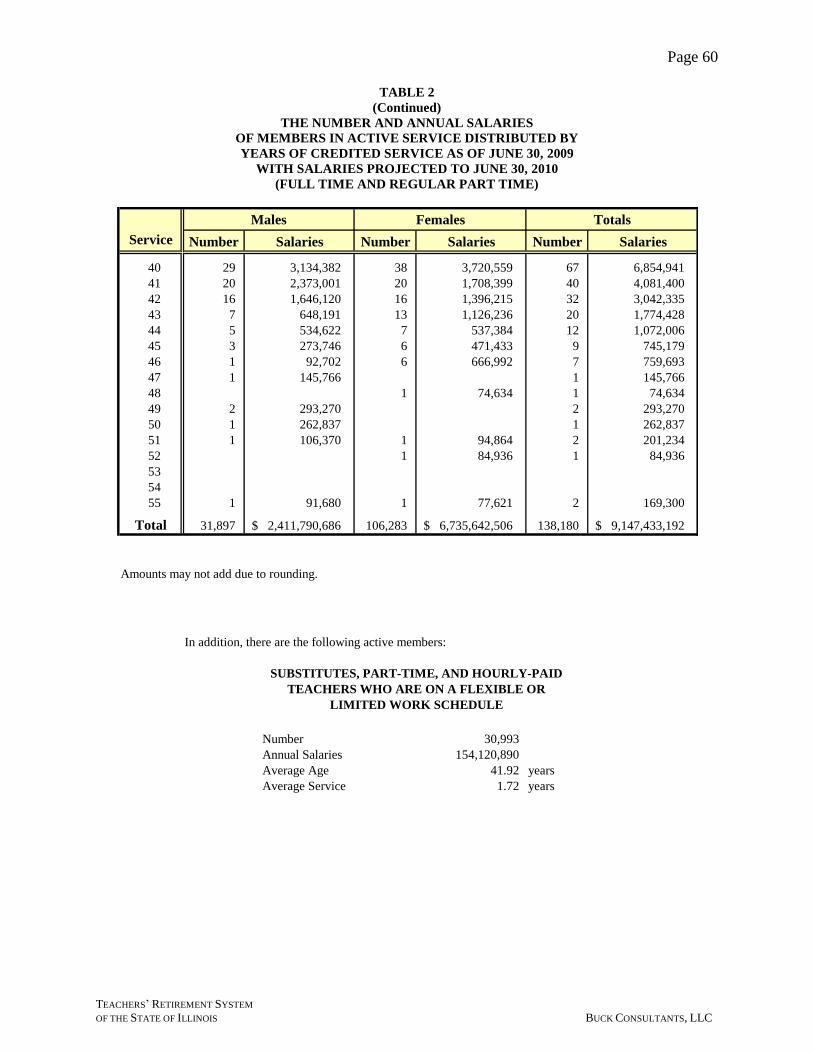
Page 60
TEACHERS’ RETIREMENT SYSTEM
OF THE STATE OF ILLINOIS BUCK CONSULTANTS, LLC
Males Females Totals
Service Number Salaries Number Salaries Number Salaries
40 29 3,134,382 38 3,720,559 67 6,854,941
41 20 2,373,001 20 1,708,399 40 4,081,400
42 16 1,646,120 16 1,396,215 32 3,042,335
43 7 648,191 13 1,126,236 20 1,774,428
44 5 534,622 7 537,384 12 1,072,006
45 3 273,746 6 471,433 9 745,179
46 1 92,702 6 666,992 7 759,693
47 1 145,766 1 145,766
48 1 74,634 1 74,634
49 2 293,270 2 293,270
50 1 262,837 1 262,837
51 1 106,370 1 94,864 2 201,234
52 1 84,936 1 84,936
53
54
55 1 91,680 1 77,621 2 169,300
Total 31,897 2,411,790,686$ 106,283 6,735,642,506$ 138,180 9,147,433,192$
Amounts may not add due to rounding.
In addition, there are the following active members:
SUBSTITUTES, PART-TIME, AND HOURLY-PAID
TEACHERS WHO ARE ON A FLEXIBLE OR
LIMITED WORK SCHEDULE
Number 30,993
Annual Salaries 154,120,890
Average Age 41.92 years
Average Service 1.72 years
TABLE 2
(Continued)
THE NUMBER AND ANNUAL SALARIES
OF MEMBERS IN ACTIVE SERVICE DISTRIBUTED BY
YEARS OF CREDITED SERVICE AS OF JUNE 30, 2009
WITH SALARIES PROJECTED TO JUNE 30, 2010
(FULL TIME AND REGULAR PART TIME)
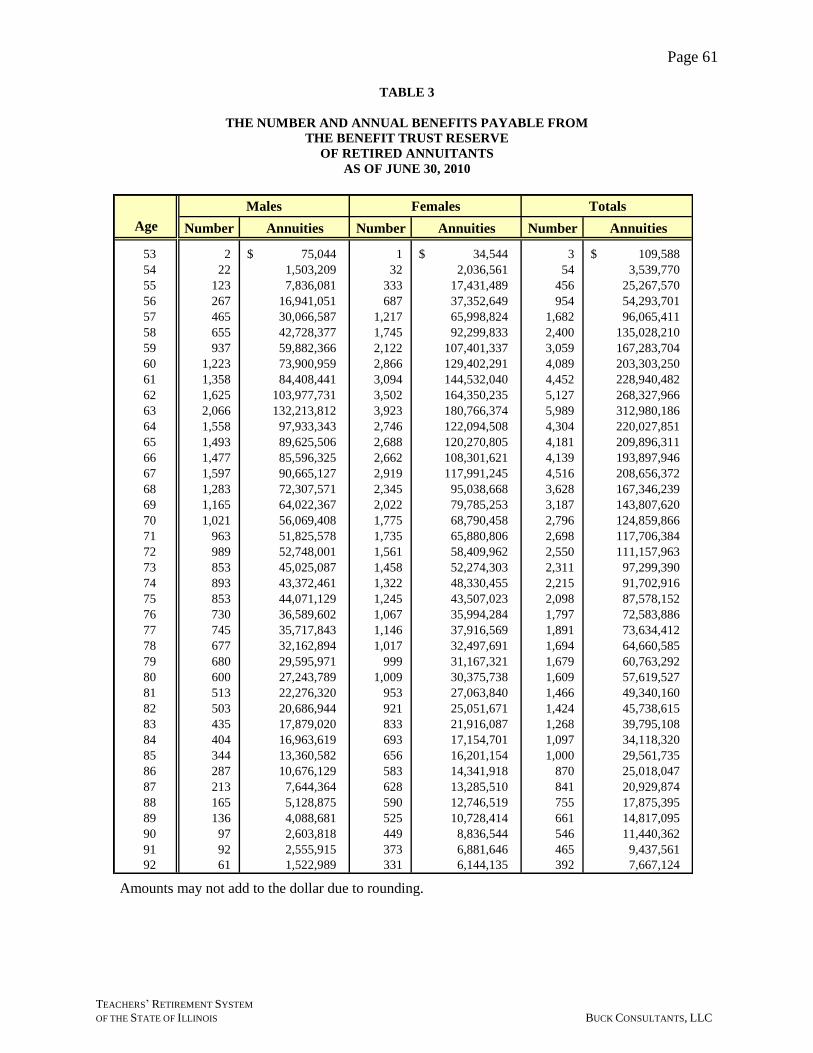
Page 61
TEACHERS’ RETIREMENT SYSTEM
OF THE STATE OF ILLINOIS BUCK CONSULTANTS, LLC
Males Females Totals
Age Number Annuities Number Annuities Number Annuities
53 2 75,044$ 1 34,544$ 3 109,588$
54 22 1,503,209 32 2,036,561 54 3,539,770
55 123 7,836,081 333 17,431,489 456 25,267,570
56 267 16,941,051 687 37,352,649 954 54,293,701
57 465 30,066,587 1,217 65,998,824 1,682 96,065,411
58 655 42,728,377 1,745 92,299,833 2,400 135,028,210
59 937 59,882,366 2,122 107,401,337 3,059 167,283,704
60 1,223 73,900,959 2,866 129,402,291 4,089 203,303,250
61 1,358 84,408,441 3,094 144,532,040 4,452 228,940,482
62 1,625 103,977,731 3,502 164,350,235 5,127 268,327,966
63 2,066 132,213,812 3,923 180,766,374 5,989 312,980,186
64 1,558 97,933,343 2,746 122,094,508 4,304 220,027,851
65 1,493 89,625,506 2,688 120,270,805 4,181 209,896,311
66 1,477 85,596,325 2,662 108,301,621 4,139 193,897,946
67 1,597 90,665,127 2,919 117,991,245 4,516 208,656,372
68 1,283 72,307,571 2,345 95,038,668 3,628 167,346,239
69 1,165 64,022,367 2,022 79,785,253 3,187 143,807,620
70 1,021 56,069,408 1,775 68,790,458 2,796 124,859,866
71 963 51,825,578 1,735 65,880,806 2,698 117,706,384
72 989 52,748,001 1,561 58,409,962 2,550 111,157,963
73 853 45,025,087 1,458 52,274,303 2,311 97,299,390
74 893 43,372,461 1,322 48,330,455 2,215 91,702,916
75 853 44,071,129 1,245 43,507,023 2,098 87,578,152
76 730 36,589,602 1,067 35,994,284 1,797 72,583,886
77 745 35,717,843 1,146 37,916,569 1,891 73,634,412
78 677 32,162,894 1,017 32,497,691 1,694 64,660,585
79 680 29,595,971 999 31,167,321 1,679 60,763,292
80 600 27,243,789 1,009 30,375,738 1,609 57,619,527
81 513 22,276,320 953 27,063,840 1,466 49,340,160
82 503 20,686,944 921 25,051,671 1,424 45,738,615
83 435 17,879,020 833 21,916,087 1,268 39,795,108
84 404 16,963,619 693 17,154,701 1,097 34,118,320
85 344 13,360,582 656 16,201,154 1,000 29,561,735
86 287 10,676,129 583 14,341,918 870 25,018,047
87 213 7,644,364 628 13,285,510 841 20,929,874
88 165 5,128,875 590 12,746,519 755 17,875,395
89 136 4,088,681 525 10,728,414 661 14,817,095
90 97 2,603,818 449 8,836,544 546 11,440,362
91 92 2,555,915 373 6,881,646 465 9,437,561
92 61 1,522,989 331 6,144,135 392 7,667,124
TABLE 3
THE NUMBER AND ANNUAL BENEFITS PAYABLE FROM
THE BENEFIT TRUST RESERVE
OF RETIRED ANNUITANTS
AS OF JUNE 30, 2010
Amounts may not add to the dollar due to rounding.
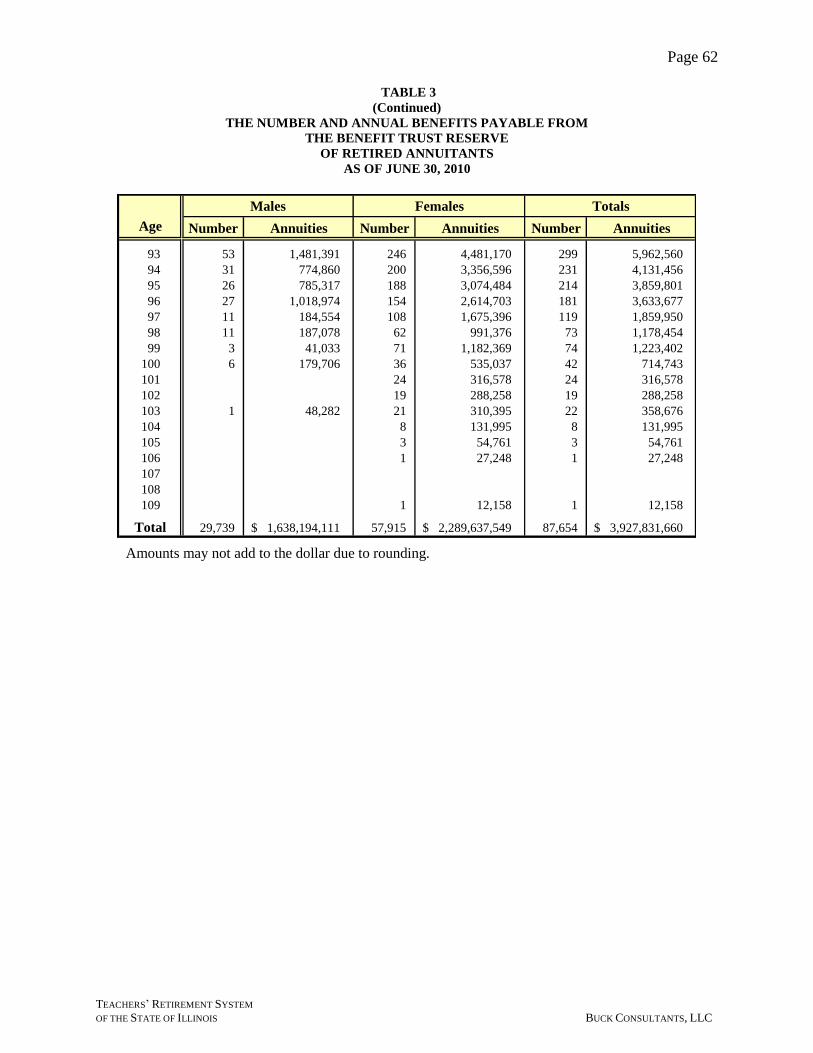
Page 62
TEACHERS’ RETIREMENT SYSTEM
OF THE STATE OF ILLINOIS BUCK CONSULTANTS, LLC
Males Females Totals
Age Number Annuities Number Annuities Number Annuities
93 53 1,481,391 246 4,481,170 299 5,962,560
94 31 774,860 200 3,356,596 231 4,131,456
95 26 785,317 188 3,074,484 214 3,859,801
96 27 1,018,974 154 2,614,703 181 3,633,677
97 11 184,554 108 1,675,396 119 1,859,950
98 11 187,078 62 991,376 73 1,178,454
99 3 41,033 71 1,182,369 74 1,223,402
100 6 179,706 36 535,037 42 714,743
101 24 316,578 24 316,578
102 19 288,258 19 288,258
103 1 48,282 21 310,395 22 358,676
104 8 131,995 8 131,995
105 3 54,761 3 54,761
106 1 27,248 1 27,248
107
108
109 1 12,158 1 12,158
Total 29,739 1,638,194,111$ 57,915 2,289,637,549$ 87,654 3,927,831,660$
TABLE 3
(Continued)
THE NUMBER AND ANNUAL BENEFITS PAYABLE FROM
THE BENEFIT TRUST RESERVE
OF RETIRED ANNUITANTS
AS OF JUNE 30, 2010
Amounts may not add to the dollar due to rounding.
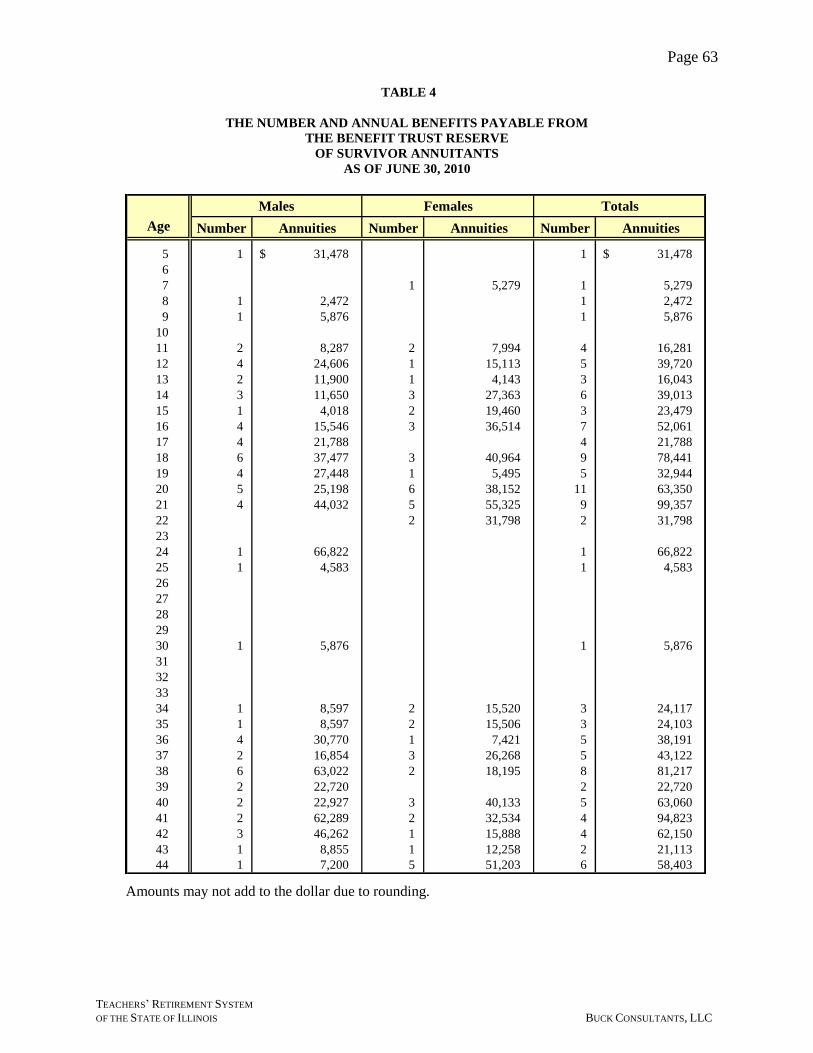
Page 63
TEACHERS’ RETIREMENT SYSTEM
OF THE STATE OF ILLINOIS BUCK CONSULTANTS, LLC
Males Females Totals
Age Number Annuities Number Annuities Number Annuities
5 1 31,478$ 1 31,478$
6
7 1 5,279 1 5,279
8 1 2,472 1 2,472
9 1 5,876 1 5,876
10
11 2 8,287 2 7,994 4 16,281
12 4 24,606 1 15,113 5 39,720
13 2 11,900 1 4,143 3 16,043
14 3 11,650 3 27,363 6 39,013
15 1 4,018 2 19,460 3 23,479
16 4 15,546 3 36,514 7 52,061
17 4 21,788 4 21,788
18 6 37,477 3 40,964 9 78,441
19 4 27,448 1 5,495 5 32,944
20 5 25,198 6 38,152 11 63,350
21 4 44,032 5 55,325 9 99,357
22 2 31,798 2 31,798
23
24 1 66,822 1 66,822
25 1 4,583 1 4,583
26
27
28
29
30 1 5,876 1 5,876
31
32
33
34 1 8,597 2 15,520 3 24,117
35 1 8,597 2 15,506 3 24,103
36 4 30,770 1 7,421 5 38,191
37 2 16,854 3 26,268 5 43,122
38 6 63,022 2 18,195 8 81,217
39 2 22,720 2 22,720
40 2 22,927 3 40,133 5 63,060
41 2 62,289 2 32,534 4 94,823
42 3 46,262 1 15,888 4 62,150
43 1 8,855 1 12,258 2 21,113
44 1 7,200 5 51,203 6 58,403
TABLE 4
THE NUMBER AND ANNUAL BENEFITS PAYABLE FROM
THE BENEFIT TRUST RESERVE
OF SURVIVOR ANNUITANTS
AS OF JUNE 30, 2010
Amounts may not add to the dollar due to rounding.
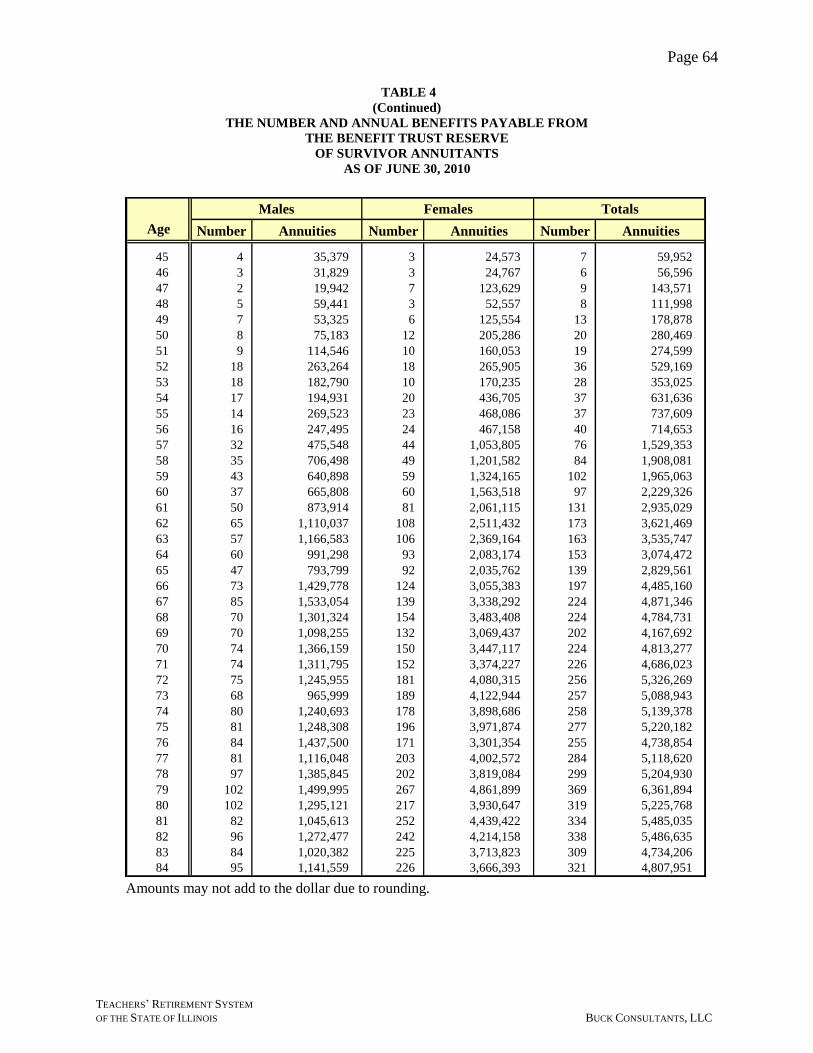
Page 64
TEACHERS’ RETIREMENT SYSTEM
OF THE STATE OF ILLINOIS BUCK CONSULTANTS, LLC
Males Females Totals
Age Number Annuities Number Annuities Number Annuities
45 4 35,379 3 24,573 7 59,952
46 3 31,829 3 24,767 6 56,596
47 2 19,942 7 123,629 9 143,571
48 5 59,441 3 52,557 8 111,998
49 7 53,325 6 125,554 13 178,878
50 8 75,183 12 205,286 20 280,469
51 9 114,546 10 160,053 19 274,599
52 18 263,264 18 265,905 36 529,169
53 18 182,790 10 170,235 28 353,025
54 17 194,931 20 436,705 37 631,636
55 14 269,523 23 468,086 37 737,609
56 16 247,495 24 467,158 40 714,653
57 32 475,548 44 1,053,805 76 1,529,353
58 35 706,498 49 1,201,582 84 1,908,081
59 43 640,898 59 1,324,165 102 1,965,063
60 37 665,808 60 1,563,518 97 2,229,326
61 50 873,914 81 2,061,115 131 2,935,029
62 65 1,110,037 108 2,511,432 173 3,621,469
63 57 1,166,583 106 2,369,164 163 3,535,747
64 60 991,298 93 2,083,174 153 3,074,472
65 47 793,799 92 2,035,762 139 2,829,561
66 73 1,429,778 124 3,055,383 197 4,485,160
67 85 1,533,054 139 3,338,292 224 4,871,346
68 70 1,301,324 154 3,483,408 224 4,784,731
69 70 1,098,255 132 3,069,437 202 4,167,692
70 74 1,366,159 150 3,447,117 224 4,813,277
71 74 1,311,795 152 3,374,227 226 4,686,023
72 75 1,245,955 181 4,080,315 256 5,326,269
73 68 965,999 189 4,122,944 257 5,088,943
74 80 1,240,693 178 3,898,686 258 5,139,378
75 81 1,248,308 196 3,971,874 277 5,220,182
76 84 1,437,500 171 3,301,354 255 4,738,854
77 81 1,116,048 203 4,002,572 284 5,118,620
78 97 1,385,845 202 3,819,084 299 5,204,930
79 102 1,499,995 267 4,861,899 369 6,361,894
80 102 1,295,121 217 3,930,647 319 5,225,768
81 82 1,045,613 252 4,439,422 334 5,485,035
82 96 1,272,477 242 4,214,158 338 5,486,635
83 84 1,020,382 225 3,713,823 309 4,734,206
84 95 1,141,559 226 3,666,393 321 4,807,951
TABLE 4
(Continued)
THE NUMBER AND ANNUAL BENEFITS PAYABLE FROM
THE BENEFIT TRUST RESERVE
OF SURVIVOR ANNUITANTS
AS OF JUNE 30, 2010
Amounts may not add to the dollar due to rounding.
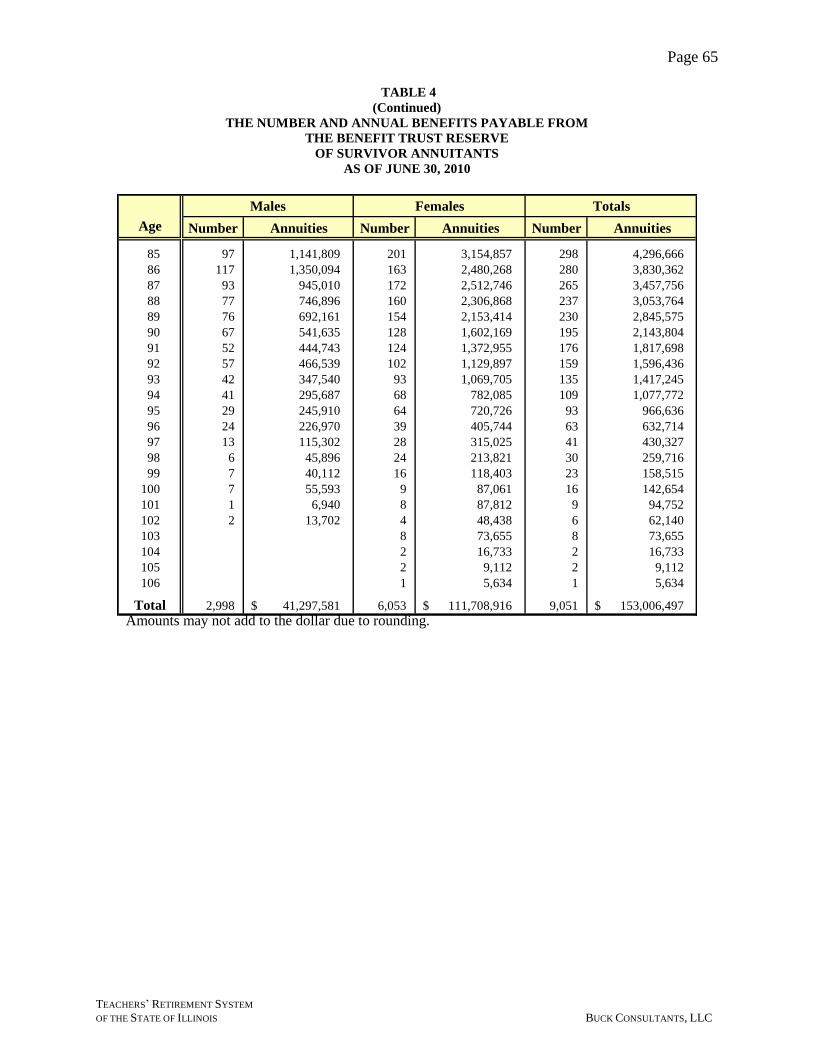
Page 65
TEACHERS’ RETIREMENT SYSTEM
OF THE STATE OF ILLINOIS BUCK CONSULTANTS, LLC
Males Females Totals
Age Number Annuities Number Annuities Number Annuities
85 97 1,141,809 201 3,154,857 298 4,296,666
86 117 1,350,094 163 2,480,268 280 3,830,362
87 93 945,010 172 2,512,746 265 3,457,756
88 77 746,896 160 2,306,868 237 3,053,764
89 76 692,161 154 2,153,414 230 2,845,575
90 67 541,635 128 1,602,169 195 2,143,804
91 52 444,743 124 1,372,955 176 1,817,698
92 57 466,539 102 1,129,897 159 1,596,436
93 42 347,540 93 1,069,705 135 1,417,245
94 41 295,687 68 782,085 109 1,077,772
95 29 245,910 64 720,726 93 966,636
96 24 226,970 39 405,744 63 632,714
97 13 115,302 28 315,025 41 430,327
98 6 45,896 24 213,821 30 259,716
99 7 40,112 16 118,403 23 158,515
100 7 55,593 9 87,061 16 142,654
101 1 6,940 8 87,812 9 94,752
102 2 13,702 4 48,438 6 62,140
103 8 73,655 8 73,655
104 2 16,733 2 16,733
105 2 9,112 2 9,112
106 1 5,634 1 5,634
Total 2,998 41,297,581$ 6,053 111,708,916$ 9,051 153,006,497$
TABLE 4
(Continued)
THE NUMBER AND ANNUAL BENEFITS PAYABLE FROM
THE BENEFIT TRUST RESERVE
OF SURVIVOR ANNUITANTS
AS OF JUNE 30, 2010
Amounts may not add to the dollar due to rounding.
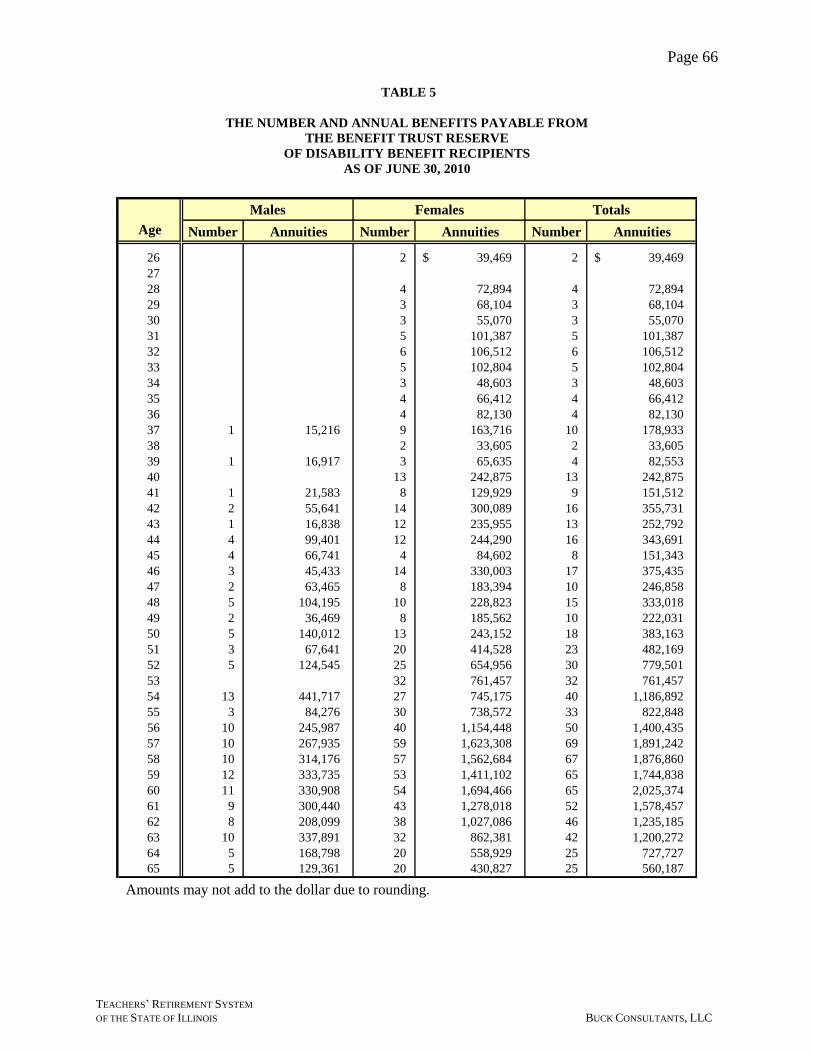
Page 66
TEACHERS’ RETIREMENT SYSTEM
OF THE STATE OF ILLINOIS BUCK CONSULTANTS, LLC
Males Females Totals
Age Number Annuities Number Annuities Number Annuities
26 2 39,469$ 2 39,469$
27
28 4 72,894 4 72,894
29 3 68,104 3 68,104
30 3 55,070 3 55,070
31 5 101,387 5 101,387
32 6 106,512 6 106,512
33 5 102,804 5 102,804
34 3 48,603 3 48,603
35 4 66,412 4 66,412
36 4 82,130 4 82,130
37 1 15,216 9 163,716 10 178,933
38 2 33,605 2 33,605
39 1 16,917 3 65,635 4 82,553
40 13 242,875 13 242,875
41 1 21,583 8 129,929 9 151,512
42 2 55,641 14 300,089 16 355,731
43 1 16,838 12 235,955 13 252,792
44 4 99,401 12 244,290 16 343,691
45 4 66,741 4 84,602 8 151,343
46 3 45,433 14 330,003 17 375,435
47 2 63,465 8 183,394 10 246,858
48 5 104,195 10 228,823 15 333,018
49 2 36,469 8 185,562 10 222,031
50 5 140,012 13 243,152 18 383,163
51 3 67,641 20 414,528 23 482,169
52 5 124,545 25 654,956 30 779,501
53 32 761,457 32 761,457
54 13 441,717 27 745,175 40 1,186,892
55 3 84,276 30 738,572 33 822,848
56 10 245,987 40 1,154,448 50 1,400,435
57 10 267,935 59 1,623,308 69 1,891,242
58 10 314,176 57 1,562,684 67 1,876,860
59 12 333,735 53 1,411,102 65 1,744,838
60 11 330,908 54 1,694,466 65 2,025,374
61 9 300,440 43 1,278,018 52 1,578,457
62 8 208,099 38 1,027,086 46 1,235,185
63 10 337,891 32 862,381 42 1,200,272
64 5 168,798 20 558,929 25 727,727
65 5 129,361 20 430,827 25 560,187
TABLE 5
THE NUMBER AND ANNUAL BENEFITS PAYABLE FROM
THE BENEFIT TRUST RESERVE
OF DISABILITY BENEFIT RECIPIENTS
AS OF JUNE 30, 2010
Amounts may not add to the dollar due to rounding.
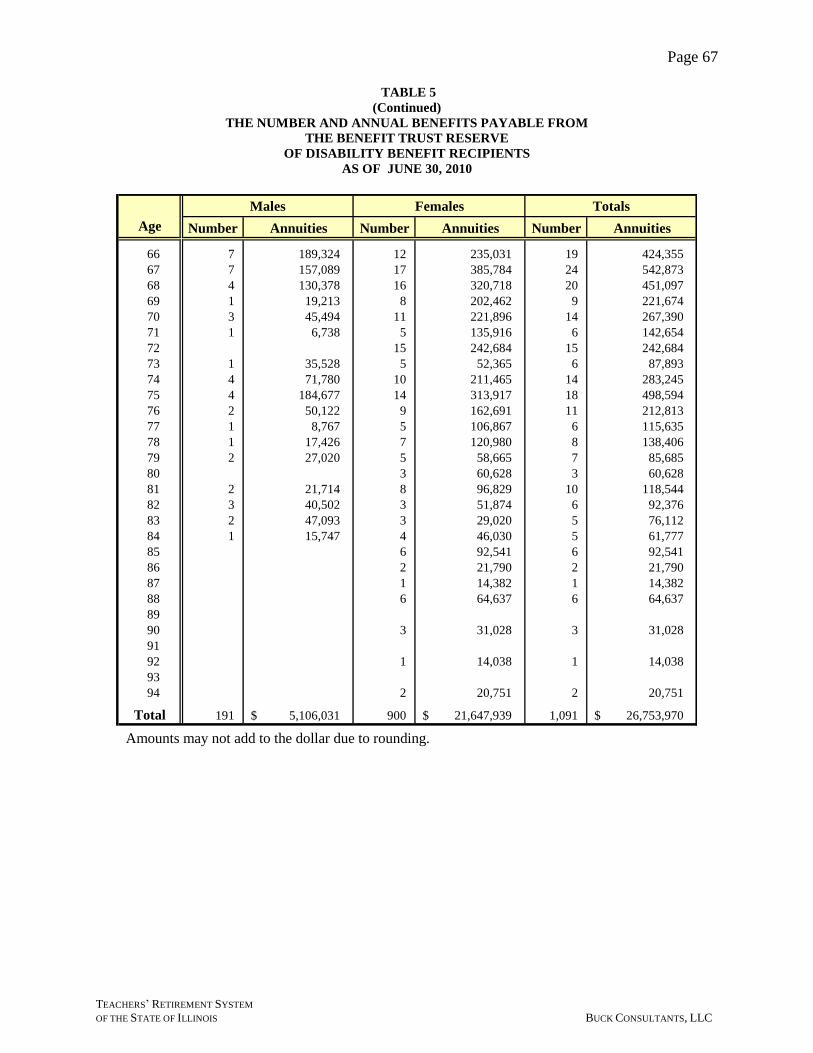
Page 67
TEACHERS’ RETIREMENT SYSTEM
OF THE STATE OF ILLINOIS BUCK CONSULTANTS, LLC
Males Females Totals
Age Number Annuities Number Annuities Number Annuities
66 7 189,324 12 235,031 19 424,355
67 7 157,089 17 385,784 24 542,873
68 4 130,378 16 320,718 20 451,097
69 1 19,213 8 202,462 9 221,674
70 3 45,494 11 221,896 14 267,390
71 1 6,738 5 135,916 6 142,654
72 15 242,684 15 242,684
73 1 35,528 5 52,365 6 87,893
74 4 71,780 10 211,465 14 283,245
75 4 184,677 14 313,917 18 498,594
76 2 50,122 9 162,691 11 212,813
77 1 8,767 5 106,867 6 115,635
78 1 17,426 7 120,980 8 138,406
79 2 27,020 5 58,665 7 85,685
80 3 60,628 3 60,628
81 2 21,714 8 96,829 10 118,544
82 3 40,502 3 51,874 6 92,376
83 2 47,093 3 29,020 5 76,112
84 1 15,747 4 46,030 5 61,777
85 6 92,541 6 92,541
86 2 21,790 2 21,790
87 1 14,382 1 14,382
88 6 64,637 6 64,637
89
90 3 31,028 3 31,028
91
92 1 14,038 1 14,038
93
94 2 20,751 2 20,751
Total 191 5,106,031$ 900 21,647,939$ 1,091 26,753,970$
TABLE 5
(Continued)
THE NUMBER AND ANNUAL BENEFITS PAYABLE FROM
THE BENEFIT TRUST RESERVE
OF DISABILITY BENEFIT RECIPIENTS
AS OF JUNE 30, 2010
Amounts may not add to the dollar due to rounding.

Page 68
TEACHERS’ RETIREMENT SYSTEM
OF THE STATE OF ILLINOIS BUCK CONSULTANTS, LLC
Males Females Totals
Age Number Annuities Number Annuities Number Annuities
62 4 3,718$ 4 3,718$
63 1 217 1 217
64 3 1,724 3 1,724
65 5 3,222 5 3,222
66 1 6 6 2,373 7 2,378
67 3 159 8 4,502 11 4,662
68 1 367 11 4,765 12 5,132
69 1 208 7 8,108 8 8,316
70 11 4,951 11 4,951
71 2 1,231 19 9,506 21 10,736
72 29 14,319 29 14,319
73 3 1,483 29 18,098 32 19,581
74 3 3,368 24 11,527 27 14,894
75 29 14,398 29 14,398
76 2 968 18 12,093 20 13,060
77 3 810 15 8,820 18 9,630
78 3 1,947 24 19,240 27 21,187
79 3 1,202 45 29,103 48 30,306
80 8 5,025 42 30,962 50 35,986
81 6 4,200 66 42,692 72 46,891
82 10 6,678 50 36,821 60 43,499
83 12 9,354 65 58,220 77 67,574
84 7 6,318 55 43,982 62 50,300
85 10 9,402 60 61,103 70 70,506
86 9 10,932 45 49,456 54 60,388
87 6 4,250 90 89,724 96 93,975
88 13 9,820 69 77,864 82 87,685
89 7 8,660 70 83,889 77 92,549
90 7 9,454 68 75,100 75 84,554
91 9 12,411 48 52,720 57 65,130
92 6 12,774 66 90,562 72 103,336
93 3 2,983 36 54,760 39 57,743
94 5 8,384 37 42,611 42 50,994
95 2 3,549 46 59,636 48 63,185
96 2 6,161 27 35,747 29 41,908
97 2 1,023 19 26,804 21 27,827
98 2 3,149 15 26,763 17 29,912
99 11 19,021 11 19,021
100 13 17,687 13 17,687
101 7 15,471 7 15,471
TABLE 6
THE NUMBER AND ANNUAL BENEFITS PAYABLE FROM
THE GUARANTEED MINIMUM ANNUITY RESERVE
OF RETIRED ANNUITANTS
AS OF JUNE 30, 2010
Amounts may not add to the dollar due to rounding.
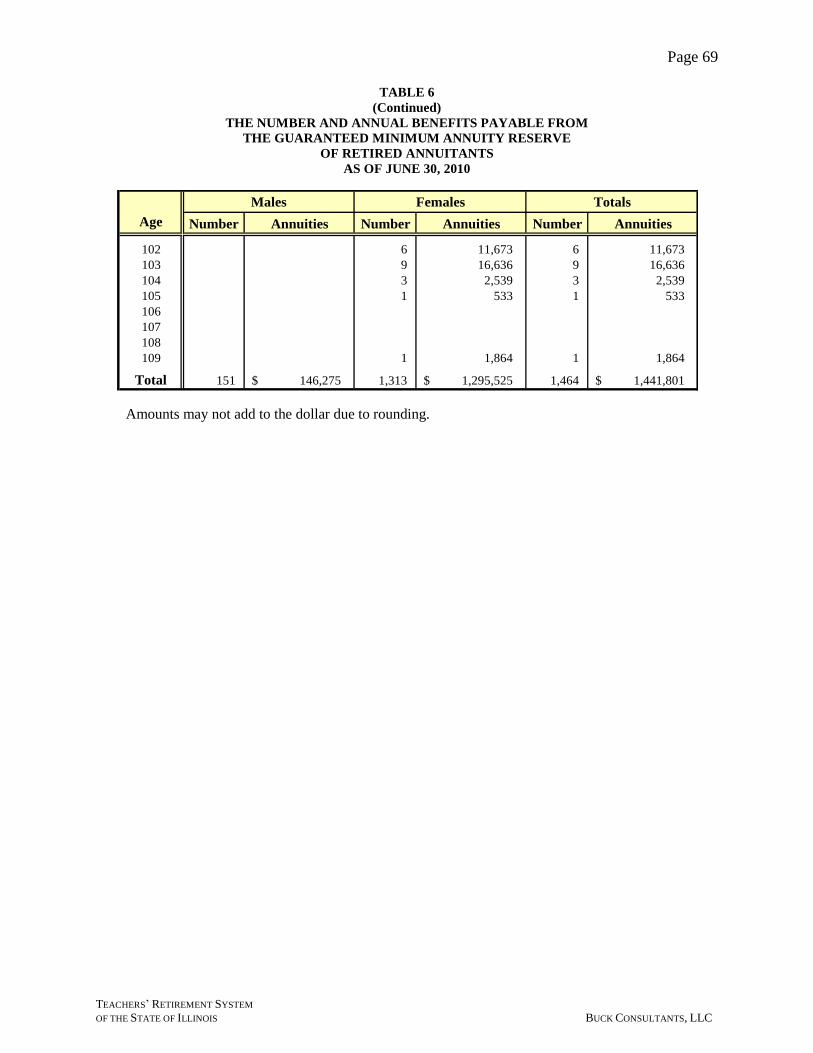
Page 69
TEACHERS’ RETIREMENT SYSTEM
OF THE STATE OF ILLINOIS BUCK CONSULTANTS, LLC
Males Females Totals
Age Number Annuities Number Annuities Number Annuities
102 6 11,673 6 11,673
103 9 16,636 9 16,636
104 3 2,539 3 2,539
105 1 533 1 533
106
107
108
109 1 1,864 1 1,864
Total 151 146,275$ 1,313 1,295,525$ 1,464 1,441,801$
TABLE 6
(Continued)
THE NUMBER AND ANNUAL BENEFITS PAYABLE FROM
THE GUARANTEED MINIMUM ANNUITY RESERVE
OF RETIRED ANNUITANTS
AS OF JUNE 30, 2010
Amounts may not add to the dollar due to rounding.

Page 70
TEACHERS’ RETIREMENT SYSTEM
OF THE STATE OF ILLINOIS BUCK CONSULTANTS, LLC
SECTION XII — APPENDIX
PROJECTIONS BASED ON A STATE CONTRIBUTION
OF $110,000,000 OF THE CERTIFIED AMOUNT
OF $2,358,441,000 FOR FISCAL YEAR 2011
Users of this report are encouraged to refer to the report cover letter for important information
regarding the basis for the results contained in this appendix.
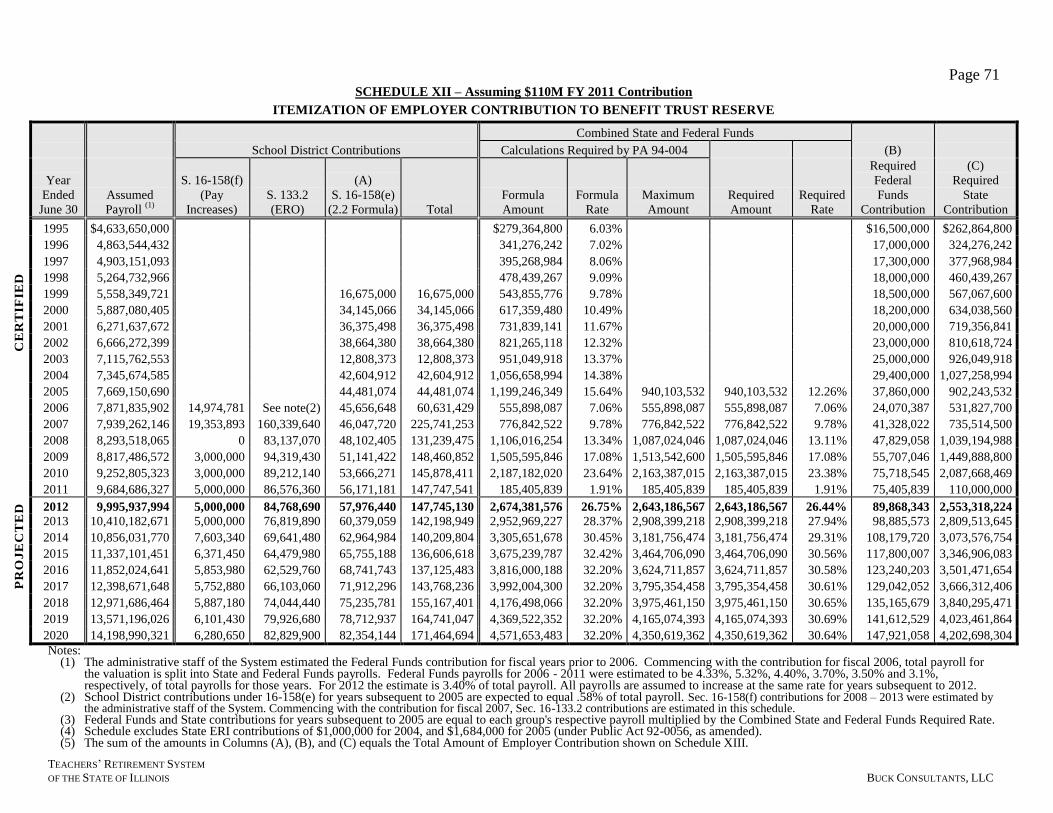
Page 71
TEACHERS’ RETIREMENT SYSTEM
OF THE STATE OF ILLINOIS BUCK CONSULTANTS, LLC
SCHEDULE XII – Assuming $110M FY 2011 Contribution
ITEMIZATION OF EMPLOYER CONTRIBUTION TO BENEFIT TRUST RESERVE
Combined State and Federal Funds
School District Contributions Calculations Required by PA 94-004 (B)
Year
Ended
June 30
Assumed
Payroll (1)
S. 16-158(f)
(Pay
Increases)
S. 133.2
(ERO)
(A)
S. 16-158(e)
(2.2 Formula) Total
Formula
Amount
Formula
Rate
Maximum
Amount
Required
Amount
Required
Rate
Required
Federal
Funds
Contribution
(C)
Required
State
Contribution
1995 $4,633,650,000 $279,364,800 6.03% $16,500,000 $262,864,800
1996 4,863,544,432 341,276,242 7.02% 17,000,000 324,276,242
1997 4,903,151,093 395,268,984 8.06% 17,300,000 377,968,984
1998 5,264,732,966 478,439,267 9.09% 18,000,000 460,439,267
1999 5,558,349,721 16,675,000 16,675,000 543,855,776 9.78% 18,500,000 567,067,600
2000 5,887,080,405 34,145,066 34,145,066 617,359,480 10.49% 18,200,000 634,038,560
2001 6,271,637,672 36,375,498 36,375,498 731,839,141 11.67% 20,000,000 719,356,841
2002 6,666,272,399 38,664,380 38,664,380 821,265,118 12.32% 23,000,000 810,618,724
2003 7,115,762,553 12,808,373 12,808,373 951,049,918 13.37% 25,000,000 926,049,918
2004 7,345,674,585 42,604,912 42,604,912 1,056,658,994 14.38% 29,400,000 1,027,258,994
2005 7,669,150,690 44,481,074 44,481,074 1,199,246,349 15.64% 940,103,532 940,103,532 12.26% 37,860,000 902,243,532
2006 7,871,835,902 14,974,781 See note(2) 45,656,648 60,631,429 555,898,087 7.06% 555,898,087 555,898,087 7.06% 24,070,387 531,827,700
2007 7,939,262,146 19,353,893 160,339,640 46,047,720 225,741,253 776,842,522 9.78% 776,842,522 776,842,522 9.78% 41,328,022 735,514,500
2008 8,293,518,065 0 83,137,070 48,102,405 131,239,475 1,106,016,254 13.34% 1,087,024,046 1,087,024,046 13.11% 47,829,058 1,039,194,988
2009 8,817,486,572 3,000,000 94,319,430 51,141,422 148,460,852 1,505,595,846 17.08% 1,513,542,600 1,505,595,846 17.08% 55,707,046 1,449,888,800
2010 9,252,805,323 3,000,000 89,212,140 53,666,271 145,878,411 2,187,182,020 23.64% 2,163,387,015 2,163,387,015 23.38% 75,718,545 2,087,668,469
2011 9,684,686,327 5,000,000 86,576,360 56,171,181 147,747,541 185,405,839 1.91% 185,405,839 185,405,839 1.91% 75,405,839 110,000,000
2012 9,995,937,994 5,000,000 84,768,690 57,976,440 147,745,130 2,674,381,576 26.75% 2,643,186,567 2,643,186,567 26.44% 89,868,343 2,553,318,224
2013 10,410,182,671 5,000,000 76,819,890 60,379,059 142,198,949 2,952,969,227 28.37% 2,908,399,218 2,908,399,218 27.94% 98,885,573 2,809,513,645
2014 10,856,031,770 7,603,340 69,641,480 62,964,984 140,209,804 3,305,651,678 30.45% 3,181,756,474 3,181,756,474 29.31% 108,179,720 3,073,576,754
2015 11,337,101,451 6,371,450 64,479,980 65,755,188 136,606,618 3,675,239,787 32.42% 3,464,706,090 3,464,706,090 30.56% 117,800,007 3,346,906,083
2016 11,852,024,641 5,853,980 62,529,760 68,741,743 137,125,483 3,816,000,188 32.20% 3,624,711,857 3,624,711,857 30.58% 123,240,203 3,501,471,654
2017 12,398,671,648 5,752,880 66,103,060 71,912,296 143,768,236 3,992,004,300 32.20% 3,795,354,458 3,795,354,458 30.61% 129,042,052 3,666,312,406
2018 12,971,686,464 5,887,180 74,044,440 75,235,781 155,167,401 4,176,498,066 32.20% 3,975,461,150 3,975,461,150 30.65% 135,165,679 3,840,295,471
2019 13,571,196,026 6,101,430 79,926,680 78,712,937 164,741,047 4,369,522,352 32.20% 4,165,074,393 4,165,074,393 30.69% 141,612,529 4,023,461,864
2020 14,198,990,321 6,280,650 82,829,900 82,354,144 171,464,694 4,571,653,483 32.20% 4,350,619,362 4,350,619,362 30.64% 147,921,058 4,202,698,304
Notes: (1) The administrative staff of the System estimated the Federal Funds contribution for fiscal years prior to 2006. Commencing with the contribution for fiscal 2006, total payroll for
the valuation is split into State and Federal Funds payrolls. Federal Funds payrolls for 2006 - 2011 were estimated to be 4.33%, 5.32%, 4.40%, 3.70%, 3.50% and 3.1%, respectively, of total payrolls for those years. For 2012 the estimate is 3.40% of total payroll. All payrolls are assumed to increase at the same rate for years subsequent to 2012.
(2) School District contributions under 16-158(e) for years subsequent to 2005 are expected to equal .58% of total payroll. Sec. 16-158(f) contributions for 2008 – 2013 were estimated by the administrative staff of the System. Commencing with the contribution for fiscal 2007, Sec. 16-133.2 contributions are estimated in this schedule.
(3) Federal Funds and State contributions for years subsequent to 2005 are equal to each group's respective payroll multiplied by the Combined State and Federal Funds Required Rate. (4) Schedule excludes State ERI contributions of $1,000,000 for 2004, and $1,684,000 for 2005 (under Public Act 92-0056, as amended). (5) The sum of the amounts in Columns (A), (B), and (C) equals the Total Amount of Employer Contribution shown on Schedule XIII.
PR
OJ
EC
TE
DC
ER
TIF
IED
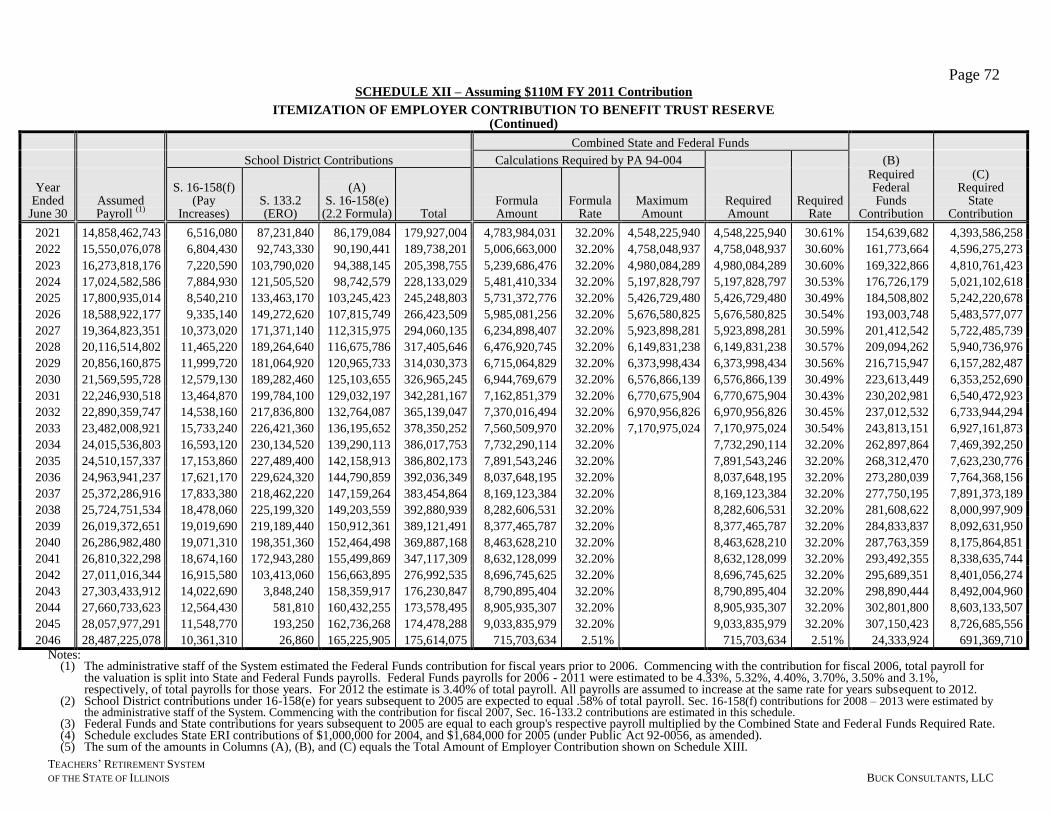
Page 72
TEACHERS’ RETIREMENT SYSTEM
OF THE STATE OF ILLINOIS BUCK CONSULTANTS, LLC
SCHEDULE XII – Assuming $110M FY 2011 Contribution
ITEMIZATION OF EMPLOYER CONTRIBUTION TO BENEFIT TRUST RESERVE (Continued)
Combined State and Federal Funds
School District Contributions Calculations Required by PA 94-004 (B)
Year Ended
June 30 Assumed Payroll
(1)
S. 16-158(f) (Pay
Increases) S. 133.2 (ERO)
(A) S. 16-158(e)
(2.2 Formula) Total Formula Amount
Formula Rate
Maximum Amount
Required Amount
Required Rate
Required Federal Funds
Contribution
(C) Required
State Contribution
2021 14,858,462,743 6,516,080 87,231,840 86,179,084 179,927,004 4,783,984,031 32.20% 4,548,225,940 4,548,225,940 30.61% 154,639,682 4,393,586,258
2022 15,550,076,078 6,804,430 92,743,330 90,190,441 189,738,201 5,006,663,000 32.20% 4,758,048,937 4,758,048,937 30.60% 161,773,664 4,596,275,273
2023 16,273,818,176 7,220,590 103,790,020 94,388,145 205,398,755 5,239,686,476 32.20% 4,980,084,289 4,980,084,289 30.60% 169,322,866 4,810,761,423
2024 17,024,582,586 7,884,930 121,505,520 98,742,579 228,133,029 5,481,410,334 32.20% 5,197,828,797 5,197,828,797 30.53% 176,726,179 5,021,102,618
2025 17,800,935,014 8,540,210 133,463,170 103,245,423 245,248,803 5,731,372,776 32.20% 5,426,729,480 5,426,729,480 30.49% 184,508,802 5,242,220,678
2026 18,588,922,177 9,335,140 149,272,620 107,815,749 266,423,509 5,985,081,256 32.20% 5,676,580,825 5,676,580,825 30.54% 193,003,748 5,483,577,077
2027 19,364,823,351 10,373,020 171,371,140 112,315,975 294,060,135 6,234,898,407 32.20% 5,923,898,281 5,923,898,281 30.59% 201,412,542 5,722,485,739
2028 20,116,514,802 11,465,220 189,264,640 116,675,786 317,405,646 6,476,920,745 32.20% 6,149,831,238 6,149,831,238 30.57% 209,094,262 5,940,736,976
2029 20,856,160,875 11,999,720 181,064,920 120,965,733 314,030,373 6,715,064,829 32.20% 6,373,998,434 6,373,998,434 30.56% 216,715,947 6,157,282,487
2030 21,569,595,728 12,579,130 189,282,460 125,103,655 326,965,245 6,944,769,679 32.20% 6,576,866,139 6,576,866,139 30.49% 223,613,449 6,353,252,690
2031 22,246,930,518 13,464,870 199,784,100 129,032,197 342,281,167 7,162,851,379 32.20% 6,770,675,904 6,770,675,904 30.43% 230,202,981 6,540,472,923
2032 22,890,359,747 14,538,160 217,836,800 132,764,087 365,139,047 7,370,016,494 32.20% 6,970,956,826 6,970,956,826 30.45% 237,012,532 6,733,944,294
2033 23,482,008,921 15,733,240 226,421,360 136,195,652 378,350,252 7,560,509,970 32.20% 7,170,975,024 7,170,975,024 30.54% 243,813,151 6,927,161,873
2034 24,015,536,803 16,593,120 230,134,520 139,290,113 386,017,753 7,732,290,114 32.20% 7,732,290,114 32.20% 262,897,864 7,469,392,250
2035 24,510,157,337 17,153,860 227,489,400 142,158,913 386,802,173 7,891,543,246 32.20% 7,891,543,246 32.20% 268,312,470 7,623,230,776
2036 24,963,941,237 17,621,170 229,624,320 144,790,859 392,036,349 8,037,648,195 32.20% 8,037,648,195 32.20% 273,280,039 7,764,368,156
2037 25,372,286,916 17,833,380 218,462,220 147,159,264 383,454,864 8,169,123,384 32.20% 8,169,123,384 32.20% 277,750,195 7,891,373,189
2038 25,724,751,534 18,478,060 225,199,320 149,203,559 392,880,939 8,282,606,531 32.20% 8,282,606,531 32.20% 281,608,622 8,000,997,909
2039 26,019,372,651 19,019,690 219,189,440 150,912,361 389,121,491 8,377,465,787 32.20% 8,377,465,787 32.20% 284,833,837 8,092,631,950
2040 26,286,982,480 19,071,310 198,351,360 152,464,498 369,887,168 8,463,628,210 32.20% 8,463,628,210 32.20% 287,763,359 8,175,864,851
2041 26,810,322,298 18,674,160 172,943,280 155,499,869 347,117,309 8,632,128,099 32.20% 8,632,128,099 32.20% 293,492,355 8,338,635,744
2042 27,011,016,344 16,915,580 103,413,060 156,663,895 276,992,535 8,696,745,625 32.20% 8,696,745,625 32.20% 295,689,351 8,401,056,274
2043 27,303,433,912 14,022,690 3,848,240 158,359,917 176,230,847 8,790,895,404 32.20% 8,790,895,404 32.20% 298,890,444 8,492,004,960
2044 27,660,733,623 12,564,430 581,810 160,432,255 173,578,495 8,905,935,307 32.20% 8,905,935,307 32.20% 302,801,800 8,603,133,507
2045 28,057,977,291 11,548,770 193,250 162,736,268 174,478,288 9,033,835,979 32.20% 9,033,835,979 32.20% 307,150,423 8,726,685,556
2046 28,487,225,078 10,361,310 26,860 165,225,905 175,614,075 715,703,634 2.51% 715,703,634 2.51% 24,333,924 691,369,710
Notes: (1) The administrative staff of the System estimated the Federal Funds contribution for fiscal years prior to 2006. Commencing with the contribution for fiscal 2006, total payroll for
the valuation is split into State and Federal Funds payrolls. Federal Funds payrolls for 2006 - 2011 were estimated to be 4.33%, 5.32%, 4.40%, 3.70%, 3.50% and 3.1%, respectively, of total payrolls for those years. For 2012 the estimate is 3.40% of total payroll. All payrolls are assumed to increase at the same rate for years subsequent to 2012.
(2) School District contributions under 16-158(e) for years subsequent to 2005 are expected to equal .58% of total payroll. Sec. 16-158(f) contributions for 2008 – 2013 were estimated by the administrative staff of the System. Commencing with the contribution for fiscal 2007, Sec. 16-133.2 contributions are estimated in this schedule.
(3) Federal Funds and State contributions for years subsequent to 2005 are equal to each group's respective payroll multiplied by the Combined State and Federal Funds Required Rate. (4) Schedule excludes State ERI contributions of $1,000,000 for 2004, and $1,684,000 for 2005 (under Public Act 92-0056, as amended). (5) The sum of the amounts in Columns (A), (B), and (C) equals the Total Amount of Employer Contribution shown on Schedule XIII.
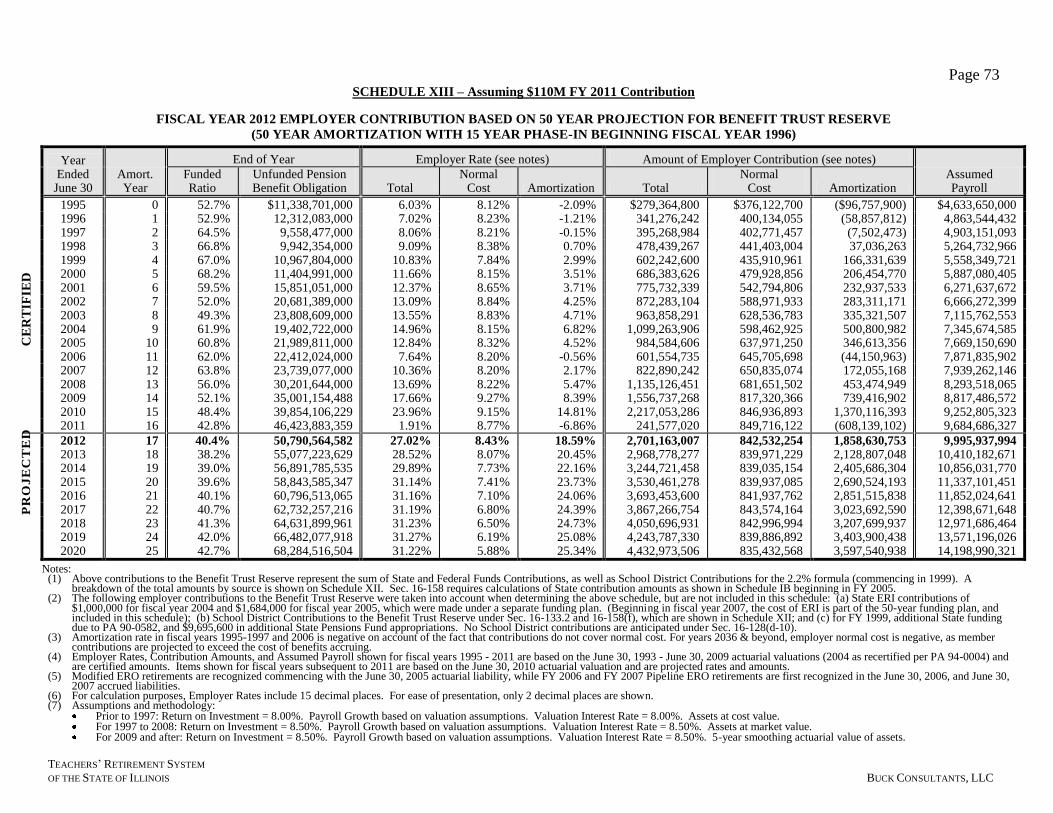
Page 73
TEACHERS’ RETIREMENT SYSTEM
OF THE STATE OF ILLINOIS BUCK CONSULTANTS, LLC
CE
RT
IFIE
D
SCHEDULE XIII – Assuming $110M FY 2011 Contribution
FISCAL YEAR 2012 EMPLOYER CONTRIBUTION BASED ON 50 YEAR PROJECTION FOR BENEFIT TRUST RESERVE
(50 YEAR AMORTIZATION WITH 15 YEAR PHASE-IN BEGINNING FISCAL YEAR 1996)
Year Ended
June 30 Amort. Year
End of Year Employer Rate (see notes) Amount of Employer Contribution (see notes)
Assumed Payroll
Funded Ratio
Unfunded Pension Benefit Obligation Total
Normal Cost Amortization Total
Normal Cost Amortization
1995 0 52.7% $11,338,701,000 6.03% 8.12% -2.09% $279,364,800 $376,122,700 ($96,757,900) $4,633,650,000 1996 1 52.9% 12,312,083,000 7.02% 8.23% -1.21% 341,276,242 400,134,055 (58,857,812) 4,863,544,432 1997 2 64.5% 9,558,477,000 8.06% 8.21% -0.15% 395,268,984 402,771,457 (7,502,473) 4,903,151,093 1998 3 66.8% 9,942,354,000 9.09% 8.38% 0.70% 478,439,267 441,403,004 37,036,263 5,264,732,966 1999 4 67.0% 10,967,804,000 10.83% 7.84% 2.99% 602,242,600 435,910,961 166,331,639 5,558,349,721 2000 5 68.2% 11,404,991,000 11.66% 8.15% 3.51% 686,383,626 479,928,856 206,454,770 5,887,080,405 2001 6 59.5% 15,851,051,000 12.37% 8.65% 3.71% 775,732,339 542,794,806 232,937,533 6,271,637,672 2002 7 52.0% 20,681,389,000 13.09% 8.84% 4.25% 872,283,104 588,971,933 283,311,171 6,666,272,399 2003 8 49.3% 23,808,609,000 13.55% 8.83% 4.71% 963,858,291 628,536,783 335,321,507 7,115,762,553 2004 9 61.9% 19,402,722,000 14.96% 8.15% 6.82% 1,099,263,906 598,462,925 500,800,982 7,345,674,585 2005 10 60.8% 21,989,811,000 12.84% 8.32% 4.52% 984,584,606 637,971,250 346,613,356 7,669,150,690 2006 11 62.0% 22,412,024,000 7.64% 8.20% -0.56% 601,554,735 645,705,698 (44,150,963) 7,871,835,902 2007 12 63.8% 23,739,077,000 10.36% 8.20% 2.17% 822,890,242 650,835,074 172,055,168 7,939,262,146 2008 13 56.0% 30,201,644,000 13.69% 8.22% 5.47% 1,135,126,451 681,651,502 453,474,949 8,293,518,065 2009 14 52.1% 35,001,154,488 17.66% 9.27% 8.39% 1,556,737,268 817,320,366 739,416,902 8,817,486,572 2010 15 48.4% 39,854,106,229 23.96% 9.15% 14.81% 2,217,053,286 846,936,893 1,370,116,393 9,252,805,323 2011 16 42.8% 46,423,883,359 1.91% 8.77% -6.86% 241,577,020 849,716,122 (608,139,102) 9,684,686,327
2012 17 40.4% 50,790,564,582 27.02% 8.43% 18.59% 2,701,163,007 842,532,254 1,858,630,753 9,995,937,994 2013 18 38.2% 55,077,223,629 28.52% 8.07% 20.45% 2,968,778,277 839,971,229 2,128,807,048 10,410,182,671 2014 19 39.0% 56,891,785,535 29.89% 7.73% 22.16% 3,244,721,458 839,035,154 2,405,686,304 10,856,031,770 2015 20 39.6% 58,843,585,347 31.14% 7.41% 23.73% 3,530,461,278 839,937,085 2,690,524,193 11,337,101,451 2016 21 40.1% 60,796,513,065 31.16% 7.10% 24.06% 3,693,453,600 841,937,762 2,851,515,838 11,852,024,641 2017 22 40.7% 62,732,257,216 31.19% 6.80% 24.39% 3,867,266,754 843,574,164 3,023,692,590 12,398,671,648 2018 23 41.3% 64,631,899,961 31.23% 6.50% 24.73% 4,050,696,931 842,996,994 3,207,699,937 12,971,686,464 2019 24 42.0% 66,482,077,918 31.27% 6.19% 25.08% 4,243,787,330 839,886,892 3,403,900,438 13,571,196,026 2020 25 42.7% 68,284,516,504 31.22% 5.88% 25.34% 4,432,973,506 835,432,568 3,597,540,938 14,198,990,321
Notes: (1) Above contributions to the Benefit Trust Reserve represent the sum of State and Federal Funds Contributions, as well as School District Contributions for the 2.2% formula (commencing in 1999). A
breakdown of the total amounts by source is shown on Schedule XII. Sec. 16-158 requires calculations of State contribution amounts as shown in Schedule IB beginning in FY 2005. (2) The following employer contributions to the Benefit Trust Reserve were taken into account when determining the above schedule, but are not included in this schedule: (a) State ERI contributions of
$1,000,000 for fiscal year 2004 and $1,684,000 for fiscal year 2005, which were made under a separate funding plan. (Beginning in fiscal year 2007, the cost of ERI is part of the 50-year funding plan, and included in this schedule); (b) School District Contributions to the Benefit Trust Reserve under Sec. 16-133.2 and 16-158(f), which are shown in Schedule XII; and (c) for FY 1999, additional State funding due to PA 90-0582, and $9,695,600 in additional State Pensions Fund appropriations. No School District contributions are anticipated under Sec. 16-128(d-10).
(3) Amortization rate in fiscal years 1995-1997 and 2006 is negative on account of the fact that contributions do not cover normal cost. For years 2036 & beyond, employer normal cost is negative, as member contributions are projected to exceed the cost of benefits accruing.
(4) Employer Rates, Contribution Amounts, and Assumed Payroll shown for fiscal years 1995 - 2011 are based on the June 30, 1993 - June 30, 2009 actuarial valuations (2004 as recertified per PA 94-0004) and are certified amounts. Items shown for fiscal years subsequent to 2011 are based on the June 30, 2010 actuarial valuation and are projected rates and amounts.
(5) Modified ERO retirements are recognized commencing with the June 30, 2005 actuarial liability, while FY 2006 and FY 2007 Pipeline ERO retirements are first recognized in the June 30, 2006, and June 30, 2007 accrued liabilities.
(6) For calculation purposes, Employer Rates include 15 decimal places. For ease of presentation, only 2 decimal places are shown. (7) Assumptions and methodology:
Prior to 1997: Return on Investment = 8.00%. Payroll Growth based on valuation assumptions. Valuation Interest Rate = 8.00%. Assets at cost value. For 1997 to 2008: Return on Investment = 8.50%. Payroll Growth based on valuation assumptions. Valuation Interest Rate = 8.50%. Assets at market value. For 2009 and after: Return on Investment = 8.50%. Payroll Growth based on valuation assumptions. Valuation Interest Rate = 8.50%. 5-year smoothing actuarial value of assets.
PR
OJ
EC
TE
D
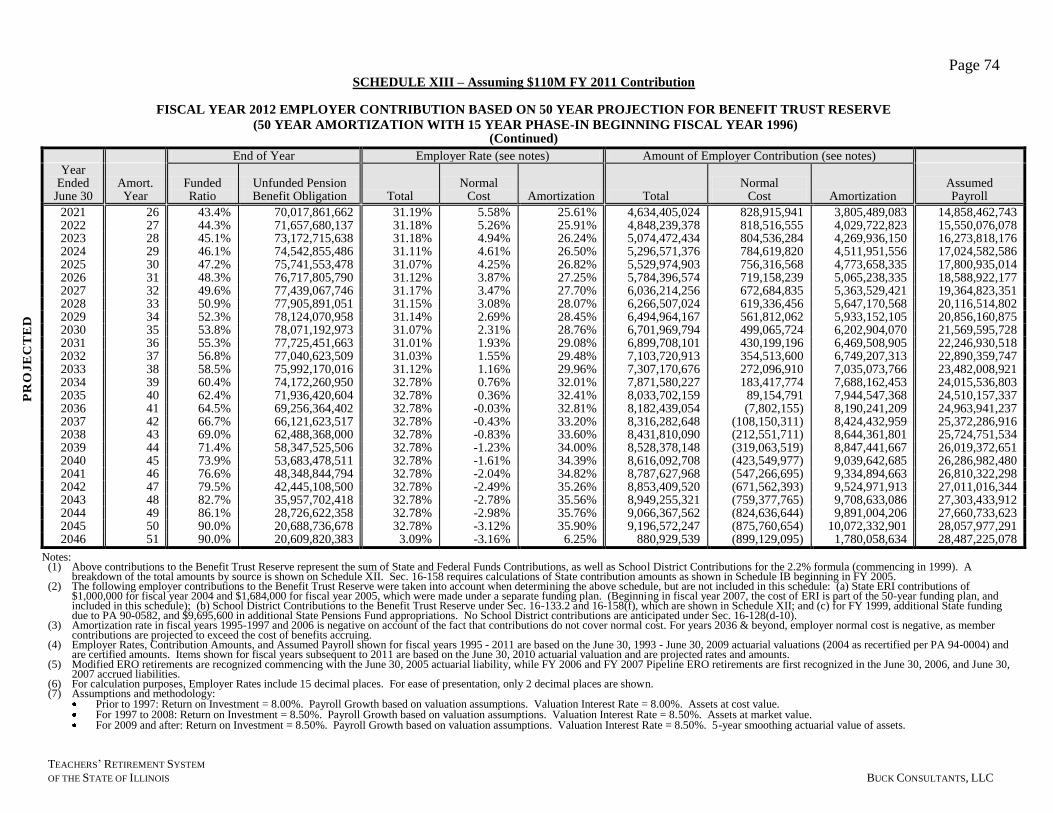
Page 74
TEACHERS’ RETIREMENT SYSTEM
OF THE STATE OF ILLINOIS BUCK CONSULTANTS, LLC
SCHEDULE XIII – Assuming $110M FY 2011 Contribution
FISCAL YEAR 2012 EMPLOYER CONTRIBUTION BASED ON 50 YEAR PROJECTION FOR BENEFIT TRUST RESERVE
(50 YEAR AMORTIZATION WITH 15 YEAR PHASE-IN BEGINNING FISCAL YEAR 1996) (Continued)
End of Year Employer Rate (see notes) Amount of Employer Contribution (see notes)
Year Ended
June 30 Amort. Year
Funded Ratio
Unfunded Pension Benefit Obligation Total
Normal Cost Amortization Total
Normal Cost Amortization
Assumed Payroll
2021 26 43.4% 70,017,861,662 31.19% 5.58% 25.61% 4,634,405,024 828,915,941 3,805,489,083 14,858,462,743 2022 27 44.3% 71,657,680,137 31.18% 5.26% 25.91% 4,848,239,378 818,516,555 4,029,722,823 15,550,076,078 2023 28 45.1% 73,172,715,638 31.18% 4.94% 26.24% 5,074,472,434 804,536,284 4,269,936,150 16,273,818,176 2024 29 46.1% 74,542,855,486 31.11% 4.61% 26.50% 5,296,571,376 784,619,820 4,511,951,556 17,024,582,586 2025 30 47.2% 75,741,553,478 31.07% 4.25% 26.82% 5,529,974,903 756,316,568 4,773,658,335 17,800,935,014 2026 31 48.3% 76,717,805,790 31.12% 3.87% 27.25% 5,784,396,574 719,158,239 5,065,238,335 18,588,922,177 2027 32 49.6% 77,439,067,746 31.17% 3.47% 27.70% 6,036,214,256 672,684,835 5,363,529,421 19,364,823,351 2028 33 50.9% 77,905,891,051 31.15% 3.08% 28.07% 6,266,507,024 619,336,456 5,647,170,568 20,116,514,802 2029 34 52.3% 78,124,070,958 31.14% 2.69% 28.45% 6,494,964,167 561,812,062 5,933,152,105 20,856,160,875 2030 35 53.8% 78,071,192,973 31.07% 2.31% 28.76% 6,701,969,794 499,065,724 6,202,904,070 21,569,595,728 2031 36 55.3% 77,725,451,663 31.01% 1.93% 29.08% 6,899,708,101 430,199,196 6,469,508,905 22,246,930,518 2032 37 56.8% 77,040,623,509 31.03% 1.55% 29.48% 7,103,720,913 354,513,600 6,749,207,313 22,890,359,747 2033 38 58.5% 75,992,170,016 31.12% 1.16% 29.96% 7,307,170,676 272,096,910 7,035,073,766 23,482,008,921 2034 39 60.4% 74,172,260,950 32.78% 0.76% 32.01% 7,871,580,227 183,417,774 7,688,162,453 24,015,536,803 2035 40 62.4% 71,936,420,604 32.78% 0.36% 32.41% 8,033,702,159 89,154,791 7,944,547,368 24,510,157,337 2036 41 64.5% 69,256,364,402 32.78% -0.03% 32.81% 8,182,439,054 (7,802,155) 8,190,241,209 24,963,941,237 2037 42 66.7% 66,121,623,517 32.78% -0.43% 33.20% 8,316,282,648 (108,150,311) 8,424,432,959 25,372,286,916 2038 43 69.0% 62,488,368,000 32.78% -0.83% 33.60% 8,431,810,090 (212,551,711) 8,644,361,801 25,724,751,534 2039 44 71.4% 58,347,525,506 32.78% -1.23% 34.00% 8,528,378,148 (319,063,519) 8,847,441,667 26,019,372,651 2040 45 73.9% 53,683,478,511 32.78% -1.61% 34.39% 8,616,092,708 (423,549,977) 9,039,642,685 26,286,982,480 2041 46 76.6% 48,348,844,794 32.78% -2.04% 34.82% 8,787,627,968 (547,266,695) 9,334,894,663 26,810,322,298 2042 47 79.5% 42,445,108,500 32.78% -2.49% 35.26% 8,853,409,520 (671,562,393) 9,524,971,913 27,011,016,344 2043 48 82.7% 35,957,702,418 32.78% -2.78% 35.56% 8,949,255,321 (759,377,765) 9,708,633,086 27,303,433,912 2044 49 86.1% 28,726,622,358 32.78% -2.98% 35.76% 9,066,367,562 (824,636,644) 9,891,004,206 27,660,733,623 2045 50 90.0% 20,688,736,678 32.78% -3.12% 35.90% 9,196,572,247 (875,760,654) 10,072,332,901 28,057,977,291 2046 51 90.0% 20,609,820,383 3.09% -3.16% 6.25% 880,929,539 (899,129,095) 1,780,058,634 28,487,225,078
Notes: (1) Above contributions to the Benefit Trust Reserve represent the sum of State and Federal Funds Contributions, as well as School District Contributions for the 2.2% formula (commencing in 1999). A
breakdown of the total amounts by source is shown on Schedule XII. Sec. 16-158 requires calculations of State contribution amounts as shown in Schedule IB beginning in FY 2005. (2) The following employer contributions to the Benefit Trust Reserve were taken into account when determining the above schedule, but are not included in this schedule: (a) State ERI contributions of
$1,000,000 for fiscal year 2004 and $1,684,000 for fiscal year 2005, which were made under a separate funding plan. (Beginning in fiscal year 2007, the cost of ERI is part of the 50-year funding plan, and included in this schedule); (b) School District Contributions to the Benefit Trust Reserve under Sec. 16-133.2 and 16-158(f), which are shown in Schedule XII; and (c) for FY 1999, additional State funding due to PA 90-0582, and $9,695,600 in additional State Pensions Fund appropriations. No School District contributions are anticipated under Sec. 16-128(d-10).
(3) Amortization rate in fiscal years 1995-1997 and 2006 is negative on account of the fact that contributions do not cover normal cost. For years 2036 & beyond, employer normal cost is negative, as member contributions are projected to exceed the cost of benefits accruing.
(4) Employer Rates, Contribution Amounts, and Assumed Payroll shown for fiscal years 1995 - 2011 are based on the June 30, 1993 - June 30, 2009 actuarial valuations (2004 as recertified per PA 94-0004) and are certified amounts. Items shown for fiscal years subsequent to 2011 are based on the June 30, 2010 actuarial valuation and are projected rates and amounts.
(5) Modified ERO retirements are recognized commencing with the June 30, 2005 actuarial liability, while FY 2006 and FY 2007 Pipeline ERO retirements are first recognized in the June 30, 2006, and June 30, 2007 accrued liabilities.
(6) For calculation purposes, Employer Rates include 15 decimal places. For ease of presentation, only 2 decimal places are shown. (7) Assumptions and methodology:
Prior to 1997: Return on Investment = 8.00%. Payroll Growth based on valuation assumptions. Valuation Interest Rate = 8.00%. Assets at cost value. For 1997 to 2008: Return on Investment = 8.50%. Payroll Growth based on valuation assumptions. Valuation Interest Rate = 8.50%. Assets at market value. For 2009 and after: Return on Investment = 8.50%. Payroll Growth based on valuation assumptions. Valuation Interest Rate = 8.50%. 5-year smoothing actuarial value of assets.
PR
OJ
EC
TE
D
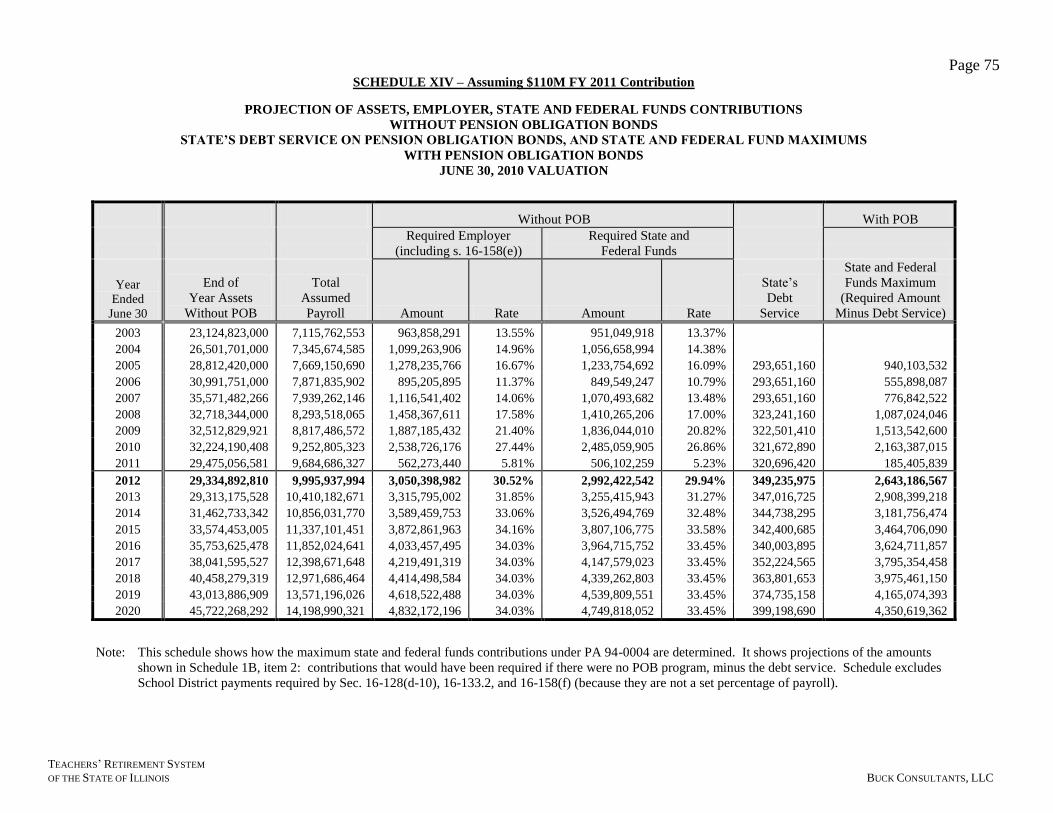
Page 75
TEACHERS’ RETIREMENT SYSTEM
OF THE STATE OF ILLINOIS BUCK CONSULTANTS, LLC
SCHEDULE XIV – Assuming $110M FY 2011 Contribution
PROJECTION OF ASSETS, EMPLOYER, STATE AND FEDERAL FUNDS CONTRIBUTIONS
WITHOUT PENSION OBLIGATION BONDS
STATE’S DEBT SERVICE ON PENSION OBLIGATION BONDS, AND STATE AND FEDERAL FUND MAXIMUMS
WITH PENSION OBLIGATION BONDS
JUNE 30, 2010 VALUATION
Without POB With POB
Required Employer
(including s. 16-158(e))
Required State and
Federal Funds
Year
Ended
June 30
End of
Year Assets
Without POB
Total
Assumed
Payroll Amount Rate Amount Rate
State’s
Debt
Service
State and Federal
Funds Maximum
(Required Amount
Minus Debt Service)
2003 23,124,823,000 7,115,762,553 963,858,291 13.55% 951,049,918 13.37%
2004 26,501,701,000 7,345,674,585 1,099,263,906 14.96% 1,056,658,994 14.38%
2005 28,812,420,000 7,669,150,690 1,278,235,766 16.67% 1,233,754,692 16.09% 293,651,160 940,103,532
2006 30,991,751,000 7,871,835,902 895,205,895 11.37% 849,549,247 10.79% 293,651,160 555,898,087
2007 35,571,482,266 7,939,262,146 1,116,541,402 14.06% 1,070,493,682 13.48% 293,651,160 776,842,522
2008 32,718,344,000 8,293,518,065 1,458,367,611 17.58% 1,410,265,206 17.00% 323,241,160 1,087,024,046
2009 32,512,829,921 8,817,486,572 1,887,185,432 21.40% 1,836,044,010 20.82% 322,501,410 1,513,542,600
2010 32,224,190,408 9,252,805,323 2,538,726,176 27.44% 2,485,059,905 26.86% 321,672,890 2,163,387,015
2011 29,475,056,581 9,684,686,327 562,273,440 5.81% 506,102,259 5.23% 320,696,420 185,405,839
2012 29,334,892,810 9,995,937,994 3,050,398,982 30.52% 2,992,422,542 29.94% 349,235,975 2,643,186,567
2013 29,313,175,528 10,410,182,671 3,315,795,002 31.85% 3,255,415,943 31.27% 347,016,725 2,908,399,218
2014 31,462,733,342 10,856,031,770 3,589,459,753 33.06% 3,526,494,769 32.48% 344,738,295 3,181,756,474
2015 33,574,453,005 11,337,101,451 3,872,861,963 34.16% 3,807,106,775 33.58% 342,400,685 3,464,706,090
2016 35,753,625,478 11,852,024,641 4,033,457,495 34.03% 3,964,715,752 33.45% 340,003,895 3,624,711,857
2017 38,041,595,527 12,398,671,648 4,219,491,319 34.03% 4,147,579,023 33.45% 352,224,565 3,795,354,458
2018 40,458,279,319 12,971,686,464 4,414,498,584 34.03% 4,339,262,803 33.45% 363,801,653 3,975,461,150
2019 43,013,886,909 13,571,196,026 4,618,522,488 34.03% 4,539,809,551 33.45% 374,735,158 4,165,074,393
2020 45,722,268,292 14,198,990,321 4,832,172,196 34.03% 4,749,818,052 33.45% 399,198,690 4,350,619,362
Note: This schedule shows how the maximum state and federal funds contributions under PA 94-0004 are determined. It shows projections of the amounts
shown in Schedule 1B, item 2: contributions that would have been required if there were no POB program, minus the debt service. Schedule excludes
School District payments required by Sec. 16-128(d-10), 16-133.2, and 16-158(f) (because they are not a set percentage of payroll).
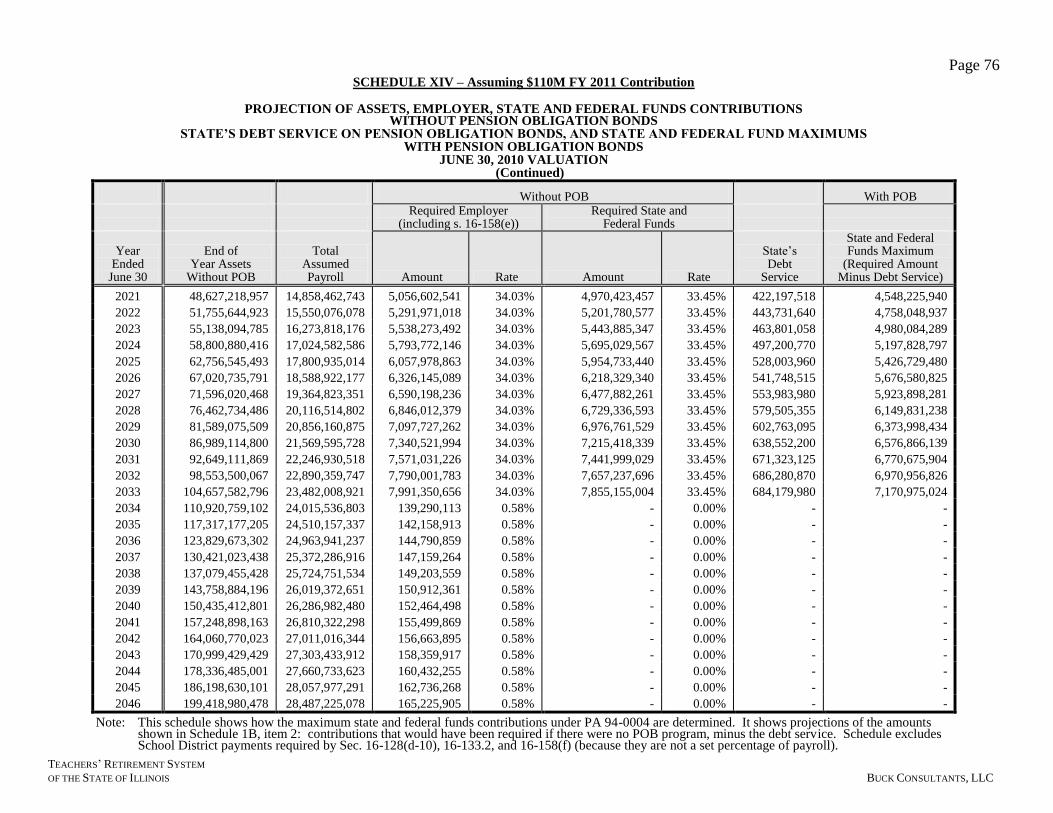
Page 76
TEACHERS’ RETIREMENT SYSTEM
OF THE STATE OF ILLINOIS BUCK CONSULTANTS, LLC
SCHEDULE XIV – Assuming $110M FY 2011 Contribution
PROJECTION OF ASSETS, EMPLOYER, STATE AND FEDERAL FUNDS CONTRIBUTIONS WITHOUT PENSION OBLIGATION BONDS
STATE’S DEBT SERVICE ON PENSION OBLIGATION BONDS, AND STATE AND FEDERAL FUND MAXIMUMS WITH PENSION OBLIGATION BONDS
JUNE 30, 2010 VALUATION (Continued)
Without POB With POB
Required Employer
(including s. 16-158(e)) Required State and
Federal Funds
Year Ended
June 30
End of Year Assets
Without POB
Total Assumed Payroll Amount Rate Amount Rate
State’s Debt
Service
State and Federal Funds Maximum
(Required Amount Minus Debt Service)
2021 48,627,218,957 14,858,462,743 5,056,602,541 34.03% 4,970,423,457 33.45% 422,197,518 4,548,225,940
2022 51,755,644,923 15,550,076,078 5,291,971,018 34.03% 5,201,780,577 33.45% 443,731,640 4,758,048,937
2023 55,138,094,785 16,273,818,176 5,538,273,492 34.03% 5,443,885,347 33.45% 463,801,058 4,980,084,289
2024 58,800,880,416 17,024,582,586 5,793,772,146 34.03% 5,695,029,567 33.45% 497,200,770 5,197,828,797
2025 62,756,545,493 17,800,935,014 6,057,978,863 34.03% 5,954,733,440 33.45% 528,003,960 5,426,729,480
2026 67,020,735,791 18,588,922,177 6,326,145,089 34.03% 6,218,329,340 33.45% 541,748,515 5,676,580,825
2027 71,596,020,468 19,364,823,351 6,590,198,236 34.03% 6,477,882,261 33.45% 553,983,980 5,923,898,281
2028 76,462,734,486 20,116,514,802 6,846,012,379 34.03% 6,729,336,593 33.45% 579,505,355 6,149,831,238
2029 81,589,075,509 20,856,160,875 7,097,727,262 34.03% 6,976,761,529 33.45% 602,763,095 6,373,998,434
2030 86,989,114,800 21,569,595,728 7,340,521,994 34.03% 7,215,418,339 33.45% 638,552,200 6,576,866,139
2031 92,649,111,869 22,246,930,518 7,571,031,226 34.03% 7,441,999,029 33.45% 671,323,125 6,770,675,904
2032 98,553,500,067 22,890,359,747 7,790,001,783 34.03% 7,657,237,696 33.45% 686,280,870 6,970,956,826
2033 104,657,582,796 23,482,008,921 7,991,350,656 34.03% 7,855,155,004 33.45% 684,179,980 7,170,975,024
2034 110,920,759,102 24,015,536,803 139,290,113 0.58% - 0.00% - -
2035 117,317,177,205 24,510,157,337 142,158,913 0.58% - 0.00% - -
2036 123,829,673,302 24,963,941,237 144,790,859 0.58% - 0.00% - -
2037 130,421,023,438 25,372,286,916 147,159,264 0.58% - 0.00% - -
2038 137,079,455,428 25,724,751,534 149,203,559 0.58% - 0.00% - -
2039 143,758,884,196 26,019,372,651 150,912,361 0.58% - 0.00% - -
2040 150,435,412,801 26,286,982,480 152,464,498 0.58% - 0.00% - -
2041 157,248,898,163 26,810,322,298 155,499,869 0.58% - 0.00% - -
2042 164,060,770,023 27,011,016,344 156,663,895 0.58% - 0.00% - -
2043 170,999,429,429 27,303,433,912 158,359,917 0.58% - 0.00% - -
2044 178,336,485,001 27,660,733,623 160,432,255 0.58% - 0.00% - -
2045 186,198,630,101 28,057,977,291 162,736,268 0.58% - 0.00% - -
2046 199,418,980,478 28,487,225,078 165,225,905 0.58% - 0.00% - -
Note: This schedule shows how the maximum state and federal funds contributions under PA 94-0004 are determined. It shows projections of the amounts shown in Schedule 1B, item 2: contributions that would have been required if there were no POB program, minus the debt service. Schedule excludes School District payments required by Sec. 16-128(d-10), 16-133.2, and 16-158(f) (because they are not a set percentage of payroll).
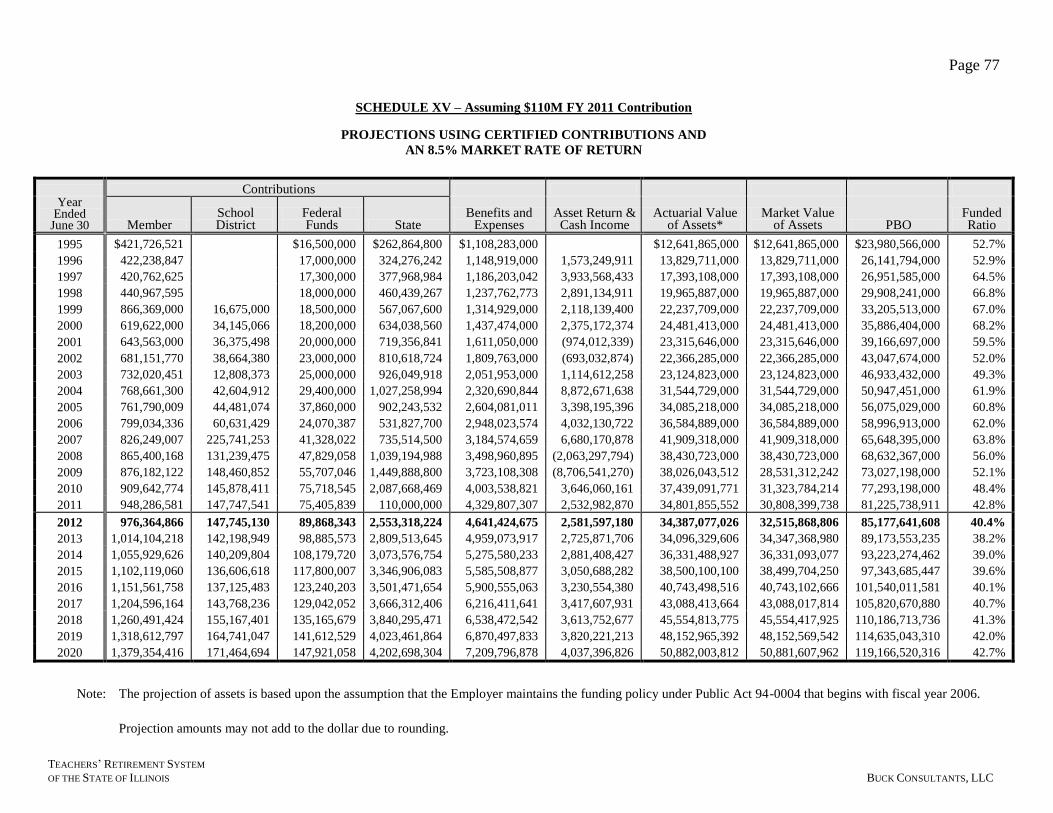
Page 77
TEACHERS’ RETIREMENT SYSTEM
OF THE STATE OF ILLINOIS BUCK CONSULTANTS, LLC
SCHEDULE XV – Assuming $110M FY 2011 Contribution
PROJECTIONS USING CERTIFIED CONTRIBUTIONS AND
AN 8.5% MARKET RATE OF RETURN
Contributions Year
Ended June 30 Member
School District
Federal Funds State
Benefits and Expenses
Asset Return & Cash Income
Actuarial Value of Assets*
Market Value of Assets PBO
Funded Ratio
1995 $421,726,521 $16,500,000 $262,864,800 $1,108,283,000 $12,641,865,000 $12,641,865,000 $23,980,566,000 52.7%
1996 422,238,847 17,000,000 324,276,242 1,148,919,000 1,573,249,911 13,829,711,000 13,829,711,000 26,141,794,000 52.9%
1997 420,762,625 17,300,000 377,968,984 1,186,203,042 3,933,568,433 17,393,108,000 17,393,108,000 26,951,585,000 64.5%
1998 440,967,595 18,000,000 460,439,267 1,237,762,773 2,891,134,911 19,965,887,000 19,965,887,000 29,908,241,000 66.8%
1999 866,369,000 16,675,000 18,500,000 567,067,600 1,314,929,000 2,118,139,400 22,237,709,000 22,237,709,000 33,205,513,000 67.0%
2000 619,622,000 34,145,066 18,200,000 634,038,560 1,437,474,000 2,375,172,374 24,481,413,000 24,481,413,000 35,886,404,000 68.2%
2001 643,563,000 36,375,498 20,000,000 719,356,841 1,611,050,000 (974,012,339) 23,315,646,000 23,315,646,000 39,166,697,000 59.5%
2002 681,151,770 38,664,380 23,000,000 810,618,724 1,809,763,000 (693,032,874) 22,366,285,000 22,366,285,000 43,047,674,000 52.0%
2003 732,020,451 12,808,373 25,000,000 926,049,918 2,051,953,000 1,114,612,258 23,124,823,000 23,124,823,000 46,933,432,000 49.3%
2004 768,661,300 42,604,912 29,400,000 1,027,258,994 2,320,690,844 8,872,671,638 31,544,729,000 31,544,729,000 50,947,451,000 61.9%
2005 761,790,009 44,481,074 37,860,000 902,243,532 2,604,081,011 3,398,195,396 34,085,218,000 34,085,218,000 56,075,029,000 60.8%
2006 799,034,336 60,631,429 24,070,387 531,827,700 2,948,023,574 4,032,130,722 36,584,889,000 36,584,889,000 58,996,913,000 62.0%
2007 826,249,007 225,741,253 41,328,022 735,514,500 3,184,574,659 6,680,170,878 41,909,318,000 41,909,318,000 65,648,395,000 63.8%
2008 865,400,168 131,239,475 47,829,058 1,039,194,988 3,498,960,895 (2,063,297,794) 38,430,723,000 38,430,723,000 68,632,367,000 56.0%
2009 876,182,122 148,460,852 55,707,046 1,449,888,800 3,723,108,308 (8,706,541,270) 38,026,043,512 28,531,312,242 73,027,198,000 52.1%
2010 909,642,774 145,878,411 75,718,545 2,087,668,469 4,003,538,821 3,646,060,161 37,439,091,771 31,323,784,214 77,293,198,000 48.4%
2011 948,286,581 147,747,541 75,405,839 110,000,000 4,329,807,307 2,532,982,870 34,801,855,552 30,808,399,738 81,225,738,911 42.8%
2012 976,364,866 147,745,130 89,868,343 2,553,318,224 4,641,424,675 2,581,597,180 34,387,077,026 32,515,868,806 85,177,641,608 40.4%
2013 1,014,104,218 142,198,949 98,885,573 2,809,513,645 4,959,073,917 2,725,871,706 34,096,329,606 34,347,368,980 89,173,553,235 38.2%
2014 1,055,929,626 140,209,804 108,179,720 3,073,576,754 5,275,580,233 2,881,408,427 36,331,488,927 36,331,093,077 93,223,274,462 39.0%
2015 1,102,119,060 136,606,618 117,800,007 3,346,906,083 5,585,508,877 3,050,688,282 38,500,100,100 38,499,704,250 97,343,685,447 39.6%
2016 1,151,561,758 137,125,483 123,240,203 3,501,471,654 5,900,555,063 3,230,554,380 40,743,498,516 40,743,102,666 101,540,011,581 40.1%
2017 1,204,596,164 143,768,236 129,042,052 3,666,312,406 6,216,411,641 3,417,607,931 43,088,413,664 43,088,017,814 105,820,670,880 40.7%
2018 1,260,491,424 155,167,401 135,165,679 3,840,295,471 6,538,472,542 3,613,752,677 45,554,813,775 45,554,417,925 110,186,713,736 41.3%
2019 1,318,612,797 164,741,047 141,612,529 4,023,461,864 6,870,497,833 3,820,221,213 48,152,965,392 48,152,569,542 114,635,043,310 42.0%
2020 1,379,354,416 171,464,694 147,921,058 4,202,698,304 7,209,796,878 4,037,396,826 50,882,003,812 50,881,607,962 119,166,520,316 42.7%
Note: The projection of assets is based upon the assumption that the Employer maintains the funding policy under Public Act 94-0004 that begins with fiscal year 2006.
Projection amounts may not add to the dollar due to rounding.
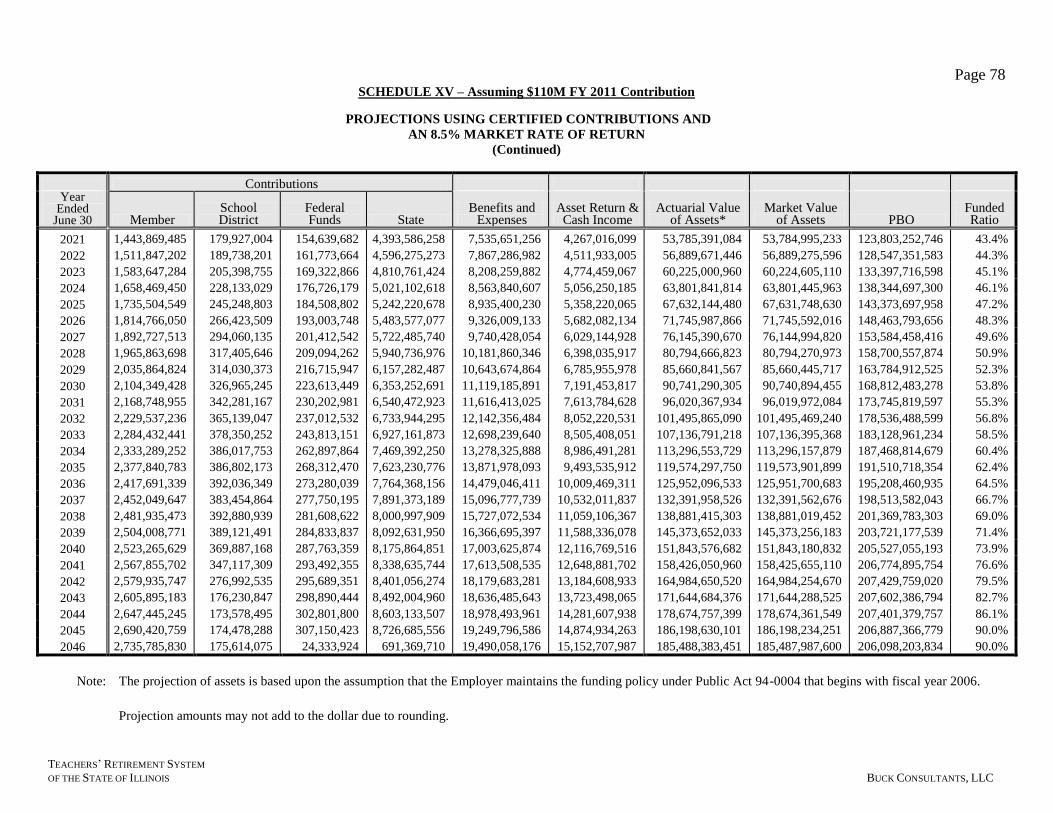
Page 78
TEACHERS’ RETIREMENT SYSTEM
OF THE STATE OF ILLINOIS BUCK CONSULTANTS, LLC
SCHEDULE XV – Assuming $110M FY 2011 Contribution
PROJECTIONS USING CERTIFIED CONTRIBUTIONS AND
AN 8.5% MARKET RATE OF RETURN
(Continued)
Contributions Year
Ended June 30 Member
School District
Federal Funds State
Benefits and Expenses
Asset Return & Cash Income
Actuarial Value of Assets*
Market Value of Assets PBO
Funded Ratio
2021 1,443,869,485 179,927,004 154,639,682 4,393,586,258 7,535,651,256 4,267,016,099 53,785,391,084 53,784,995,233 123,803,252,746 43.4%
2022 1,511,847,202 189,738,201 161,773,664 4,596,275,273 7,867,286,982 4,511,933,005 56,889,671,446 56,889,275,596 128,547,351,583 44.3%
2023 1,583,647,284 205,398,755 169,322,866 4,810,761,424 8,208,259,882 4,774,459,067 60,225,000,960 60,224,605,110 133,397,716,598 45.1%
2024 1,658,469,450 228,133,029 176,726,179 5,021,102,618 8,563,840,607 5,056,250,185 63,801,841,814 63,801,445,963 138,344,697,300 46.1%
2025 1,735,504,549 245,248,803 184,508,802 5,242,220,678 8,935,400,230 5,358,220,065 67,632,144,480 67,631,748,630 143,373,697,958 47.2%
2026 1,814,766,050 266,423,509 193,003,748 5,483,577,077 9,326,009,133 5,682,082,134 71,745,987,866 71,745,592,016 148,463,793,656 48.3%
2027 1,892,727,513 294,060,135 201,412,542 5,722,485,740 9,740,428,054 6,029,144,928 76,145,390,670 76,144,994,820 153,584,458,416 49.6%
2028 1,965,863,698 317,405,646 209,094,262 5,940,736,976 10,181,860,346 6,398,035,917 80,794,666,823 80,794,270,973 158,700,557,874 50.9%
2029 2,035,864,824 314,030,373 216,715,947 6,157,282,487 10,643,674,864 6,785,955,978 85,660,841,567 85,660,445,717 163,784,912,525 52.3%
2030 2,104,349,428 326,965,245 223,613,449 6,353,252,691 11,119,185,891 7,191,453,817 90,741,290,305 90,740,894,455 168,812,483,278 53.8%
2031 2,168,748,955 342,281,167 230,202,981 6,540,472,923 11,616,413,025 7,613,784,628 96,020,367,934 96,019,972,084 173,745,819,597 55.3%
2032 2,229,537,236 365,139,047 237,012,532 6,733,944,295 12,142,356,484 8,052,220,531 101,495,865,090 101,495,469,240 178,536,488,599 56.8%
2033 2,284,432,441 378,350,252 243,813,151 6,927,161,873 12,698,239,640 8,505,408,051 107,136,791,218 107,136,395,368 183,128,961,234 58.5%
2034 2,333,289,252 386,017,753 262,897,864 7,469,392,250 13,278,325,888 8,986,491,281 113,296,553,729 113,296,157,879 187,468,814,679 60.4%
2035 2,377,840,783 386,802,173 268,312,470 7,623,230,776 13,871,978,093 9,493,535,912 119,574,297,750 119,573,901,899 191,510,718,354 62.4%
2036 2,417,691,339 392,036,349 273,280,039 7,764,368,156 14,479,046,411 10,009,469,311 125,952,096,533 125,951,700,683 195,208,460,935 64.5%
2037 2,452,049,647 383,454,864 277,750,195 7,891,373,189 15,096,777,739 10,532,011,837 132,391,958,526 132,391,562,676 198,513,582,043 66.7%
2038 2,481,935,473 392,880,939 281,608,622 8,000,997,909 15,727,072,534 11,059,106,367 138,881,415,303 138,881,019,452 201,369,783,303 69.0%
2039 2,504,008,771 389,121,491 284,833,837 8,092,631,950 16,366,695,397 11,588,336,078 145,373,652,033 145,373,256,183 203,721,177,539 71.4%
2040 2,523,265,629 369,887,168 287,763,359 8,175,864,851 17,003,625,874 12,116,769,516 151,843,576,682 151,843,180,832 205,527,055,193 73.9%
2041 2,567,855,702 347,117,309 293,492,355 8,338,635,744 17,613,508,535 12,648,881,702 158,426,050,960 158,425,655,110 206,774,895,754 76.6%
2042 2,579,935,747 276,992,535 295,689,351 8,401,056,274 18,179,683,281 13,184,608,933 164,984,650,520 164,984,254,670 207,429,759,020 79.5%
2043 2,605,895,183 176,230,847 298,890,444 8,492,004,960 18,636,485,643 13,723,498,065 171,644,684,376 171,644,288,525 207,602,386,794 82.7%
2044 2,647,445,245 173,578,495 302,801,800 8,603,133,507 18,978,493,961 14,281,607,938 178,674,757,399 178,674,361,549 207,401,379,757 86.1%
2045 2,690,420,759 174,478,288 307,150,423 8,726,685,556 19,249,796,586 14,874,934,263 186,198,630,101 186,198,234,251 206,887,366,779 90.0%
2046 2,735,785,830 175,614,075 24,333,924 691,369,710 19,490,058,176 15,152,707,987 185,488,383,451 185,487,987,600 206,098,203,834 90.0%
Note: The projection of assets is based upon the assumption that the Employer maintains the funding policy under Public Act 94-0004 that begins with fiscal year 2006.
Projection amounts may not add to the dollar due to rounding.