teaching practices and pedagogical innovation - oecd 2012 (tppi)--ebook.pdf · teaching practices...
TRANSCRIPT
T e a c h i n g A n d L e a r n i n g I n t e r n at i o n a l S u r v e y
Teaching Practices and Pedagogical InnovationEvIdEncE from TALIS
C e n t r e f o r E d u c a t i o n a l R e s e a r c h a n d I n n o v a t i o n
ceri ceri ceri ceri ceri ceri ceri ceri ceri ceri ceri ceri ceri ceri ceri ceri ceri ceri ceri ceri ceri ceri ceri ceri ceri ceri ceri ceri ceri ceri ceri ceri ceri ceri ceri ceri ceri ceri ceri ceri ceri ceri ceri ceri ceri ceri ceri ceri ceri ceri ceri ceri ceri ceri ceri ceri ceri ceri ceri ceri ceri ceri ceri ceri ceri ceri ceri ceri ceri ceri ceri ceri ceri ceri ceri ceri ceri ceri ceri ceri ceri ceri ceri ceri ceri ceri ceri ceri ceri ceri ceri ceri ceri ceri ceri ceri ceri ceri ceri ceri ceri ceri ceri ceri ceri ceri ceri ceri ceri ceri ceri ceri ceri ceri ceri ceri ceri ceri ceri ceri ceri ceri ceri ceri ceri ceri ceri ceri ceri ceri ceri ceri ceri ceri ceri ceri ceri ceri ceri ceri ceri ceri ceri ceri ceri ceri ceri ceri ceri ceri ceri cericeri ceri ceri ceri ceri ceri ceri ceri ceri ceri ceri ceri ceri ceri ceri ceri ceri ceri ceri ceri ceri ceri ceri ceri ceri ceri ceri ceri ceri ceri ceri ceri ceri ceri ceri ceri ceri ceri ceri ceri ceri ceri ceri ceri ceri ceri ceri ceri ceri ceri ceri ceri ceri ceri ceri ceri ceri ceri ceri ceri ceri ceri ceri ceri ceri ceri ceri ceri ceri ceri ceri ceri ceri ceri ceri ceri ceri ceri ceri ceri ceri ceri ceri ceri ceri ceri ceri ceri ceri ceri ceri ceri ceri ceri ceri ceri ceri ceri ceri ceri ceri ceri ceri ceri ceri ceri ceri ceri ceri ceri ceri ceri ceri ceri ceri ceri ceri ceri ceri ceri ceri ceri ceri ceri ceri ceri ceri ceri ceri ceri ceri ceri ceri


Teaching Practices and Pedagogical Innovation
EvidEncE from TALiS
Svenja Vieluf, David Kaplan, Eckhard Klieme, Sonja Bayer

Photo credits:
© Mike Kemp/Rubberball Productions/Getty Images© Shutterstock/Morgan Lane Photography
Corrigenda to OECD publications may be found on line at: www.oecd.org/publishing/corrigenda.
© OECD 2012
You can copy, download or print OECD content for your own use, and you can include excerpts from OECD publications, databases and multimedia products in your own documents, presentations, blogs, websites and teaching materials, provided that suitable acknowledgement of OECD as source and copyright owner is given. All requests for public or commercial use and translation rights should be submitted to [email protected]. Requests for permission to photocopy portions of this material for public or commercial use shall be addressed directly to the Copyright Clearance Center (CCC) at [email protected] or the Centre français d’exploitation du droit de copie (CFC) at [email protected].
This work is published on the responsibility of the Secretary-General of the OECD. The opinions expressed and arguments employed herein do not necessarily reflect the official views of the Organisation or of the governments of its member countries.
This document and any map included herein are without prejudice to the status of or sovereignty over any territory, to the delimitation of international frontiers and boundaries and to the name of any territory, city or area.
Please cite this publication as:
Vieluf S., et al. (2012), Teaching Practices and Pedagogical Innovation: Evidence from TALIS, OECD Publishing.
http://dx.doi.org/10.1787/9789264123540-en
ISBN 978-92-64-12328-1 (print)ISBN 978-92-64-12354-0 (PDF)

Foreword
Teaching PracTices and Pedagogical innovaTion: evidence from Talis © OECD 2012
3
The eagerness to continually improve the educational experience of students has been growing steadily around the world. We are now more aware of how teaching practices help shape the student learning experience and advance motivation and achievement. When teachers work well together they tend to also work well with students. so, it has become important to encourage teachers to share more of their expertise and experience and in ways that go beyond the mere exchange of information.
This instructive publication, Teaching Practices and Pedagogical Innovation: Evidence from TALIS, is using the Teaching and learning international survey (Talis) 2008 data. it precisely identifies and arranges profiles in relation to two connected areas of professional teacher practices: classroom teaching practices and participation in professional learning communities. it compares these profiles across different educational systems and examines evidence and links to inputs and processes.
as teachers perform energetically in the classroom they are simultaneously professionally active in co-operation and collaboration with colleagues. This relationship is achieved through the exchange of ideas, information and instructional materials, such as in meetings to discuss student progress and in collective learning activities. one of the key messages of this report is that teacher collaboration helps support teacher reflection. Therefore, it is an essential feature of professional practice.
This report has been commissioned by the centre for educational research and innovation (ceri) as part of its innovative Teaching for effective learning (iTel) project. iTel draws on oecd work about teachers and teaching such as Talis. it focuses on the pedagogical core of the teaching profession, namely the pedagogical knowledge base of teachers. it questions whether this knowledge base is still in tune with recent advancements in learning research and with new skills demands that society expects from students.
We wish to thank svenja vieluf, david Kaplan, eckhard Klieme and sonja Bayer who successfully drafted this report. The editorial preparation of this report was efficiently managed by Julie Bélanger, on behalf of the oecd secretariat. in addition, we wish to thank members of the Talis Board of Participating countries who provided valuable feedback on the contents. We are very grateful for the additional advice as well as editorial support provided by the Talis Technical advisory group (eduardo Backhoff, Jesper lund and fons van de vijver), francesco avvisati, Bruno della-chiesa, sarah gielen, david istance, Kiira Kärkkäinen, dirk van damme, stéphan vincent-lancrin, Kristen Weatherby and Thérèse hogan. We wish

Teaching PracTices and Pedagogical innovaTion: evidence from Talis© OECD 2012
FOrEwOrD
4
to extend our gratitude to lynda hawe who helped prepare the report for publication and to isabelle moulherat and ashley allen who provided valuable administrative support. Thanks also to fung Kwan Tam who creatively did the layout design.
Barbara IschingerDirector for Education, OECD
Table of Contents
Teaching PracTices and Pedagogical innovaTion: evidence from Talis © OECD 2012
5
Foreword .........................................................................................................................................................................................3
executive Summary ........................................................................................................................................................... 13
chapter 1 IntrODuCtIOn ........................................................................................................................................................................... 17rationale and aims of the report ........................................................................................................................................ 18outline of the report ................................................................................................................................................................... 18Background and main findings ............................................................................................................................................ 19readers’ guide ................................................................................................................................................................................ 21References ......................................................................................................................................................................................... 22
chapter 2 tEaChErs’ PrOFEssIOnal PraCtICEs ........................................................................................................................ 25 highlights ........................................................................................................................................................................................... 26classroom teaching practices ............................................................................................................................................... 27Philosophies of learning and teaching ........................................................................................................................... 28 research in educational effectiveness ............................................................................................................................ 29correlates of classroom teaching practices ................................................................................................................. 31Professional learning communities ................................................................................................................................... 32conditions that facilitate the development of professional learning communities .......................... 36 formal conditions at the school level ................................................................................................................. 36 social conditions at the school level ................................................................................................................... 36Teachers’ professional practices in a cross-national comparison ................................................................. 37Teachers’ professional practices and educational innovation ........................................................................ 38conclusions ...................................................................................................................................................................................... 40References ......................................................................................................................................................................................... 42
chapter 3 analysIng tEaChErs’ PrOFEssIOnal PraCtICEs wIth talIs Data ................................................. 49highlights ........................................................................................................................................................................................... 50 Teaching Practices in Talis 2008 ...................................................................................................................................... 51Professional learning communities in Talis 2008 ............................................................................................... 52other relevant variables in Talis 2008 ........................................................................................................................ 53measures ............................................................................................................................................................................................. 53 items and scales used in latent profile analysis ............................................................................................ 53items and scales used as independent variables in multilevel latent profile regression analysis ....................................................................................................................................................................... 55 single items ........................................................................................................................................................................... 55 indices and scales ........................................................................................................................................................... 57

Teaching PracTices and Pedagogical innovaTion: evidence from Talis© OECD 2012
tablE OF COntEnts
6
Participants ........................................................................................................................................................................................ 58 statistical modelling .................................................................................................................................................................... 59analytic sequence ...................................................................................................................................................................... 60References ......................................................................................................................................................................................... 62
chapter 4 PrOFIlEs OF tEaChErs’ PrOFEssIOnal PraCtICEs ......................................................................................... 63highlights ........................................................................................................................................................................................... 64 latent profiles of classroom teaching practices ........................................................................................................ 65country-specific results: classroom teaching practices ...................................................................................... 65summary of country-specific effects on profiles of classroom teaching practices............................ 84 Teacher-level effects across countries ................................................................................................................. 84 school-level effects across countries ................................................................................................................... 84
chapter 5 PrOFIlEs OF PartICIPatIOn In PrOFEssIOnal lEarnIng COmmunItIEs ................................. 87highlights ........................................................................................................................................................................................... 88 latent profiles of participation in professional learning communities ...................................................... 89country-specific results: Participation in professional learning communities ..................................... 89 summary of country specific effects on profiles of participation in professional learning communities ..............................................................................................................................................................108 Teacher-level effects across countries ...............................................................................................................109 school-level effects across countries .................................................................................................................110
chapter 6 KEy FInDIngs anD POlICy ImPlICatIOns ..........................................................................................................111highlights .........................................................................................................................................................................................112cross-national comparisons of latent profiles of professional practices ................................................113regressions of latent profiles on teacher- and school-level variables .....................................................115summary ...........................................................................................................................................................................................117conclusions ....................................................................................................................................................................................121 References .......................................................................................................................................................................................123
annex amultilevel latent Profile analysis....................................................................................................................................125multilevel latent class analysis ..........................................................................................................................................126addition of predictors to the mlPa model ................................................................................................................127estimation of the multilevel latent profile model ..................................................................................................128measures of model adequacy .............................................................................................................................................128References .......................................................................................................................................................................................130
annex Bmodel Fit for latent Profile analysis with Different numbers of Profiles .........................................131
annex cresults of multilevel multinomial regression analyses ..................................................................................145

Teaching PracTices and Pedagogical innovaTion: evidence from Talis © OECD 2012
tablE OF COntEnts7
FigureS
figure 2.1 model of “essential supports” (left) and “classroom black box” (right).............................................................. 31
figure 3.1 education systems participating in Talis 2008 ....................................................................................................... 59
figure 4.1 latent profiles of classroom teaching practices for Belgium (flemish community), ireland, italy, and malta ........................................................................................................................................................................ 66
figure 4.2 latent profiles of classroom teaching practices for australia, estonia, and Portugal ........................................ 68
figure 4.3 latent profiles of classroom teaching practices for austria, Bulgaria, hungary, lithuania, Poland, the slovak republic, and slovenia ............................................................................................................................ 70
figure 4.4 latent profiles of classroom teaching practices for malaysia and Turkey ........................................................... 74
figure 4.5 latent profiles of classroom teaching practices for Brazil, denmark, iceland, Korea, mexico, norway and spain ........................................................................................................................................................ 75
figure 5.1 latent profiles of participation in professional learning communities for austria, Belgium (flemish community), Bulgaria, estonia, hungary, iceland, italy, norway, Poland, and Turkey ...................................................................................................................................................................... 90
figure 5.2 latent profiles of participation in professional learning communities for ireland, malta, mexico, and spain ........................................................................................................................................................................ 95
figure 5.3 latent profiles of participation in professional learning communities for australia, Brazil, and denmark ................................................................................................................................................................. 97
figure 5.4 latent profiles of participation in professional learning communities for Korea, lithuania, malaysia, Portugal, the slovak republic and slovenia............................................................................................................. 99
figure a.1 latent class analysis model with continuous latent class indicators ................................................................. 126
figure a.2 multilevel latent profile analysis model with predictors ..................................................................................... 128
taBleS
Table 3.1 items wording of classroom teaching practices items and dimensions .............................................................. 54
Table 3.2 item wording of professional learning communities items and dimensions ...................................................... 55
Table 4.1 results of multinomial multilevel regression predicting teacher membership in profiles of classroom teaching practices – overview over teacher level effects in all countries ........................................................... 84
Table 4.2 results of multinomial multilevel regression predicting teacher membership in profiles of classroom teaching practices – overview over school level effects in all countries ............................................................ 85
Table 5.1 results of multinomial multilevel regression predicting teacher membership in profiles of participation in professional learning communities – overview over teacher level effects in all countries ...................... 108
Table 5.2 results of multinomial multilevel regression predicting teacher membership in profiles of participation in professional learning communities – overview over school level effects in all countries ........................ 109
Table B.1 model fit for latent profile analysis with different numbers of profiles of teaching practices for australia .................................................................................................................................................................. 132
Table B.2 model fit for latent profile analysis with different numbers of profiles of teaching practices for austria ..................................................................................................................................................................... 132
Table B.3 model fit for latent profile analysis with different numbers of profiles of teaching practices for Belgium (flemish community) ............................................................................................................................ 132
Table B.4 model fit for latent profile analysis with different numbers of profiles of teaching practices for Brazil ....................................................................................................................................................................... 132

Teaching PracTices and Pedagogical innovaTion: evidence from Talis© OECD 2012
tablE OF COntEnts
8
Table B.5 model fit for latent profile analysis with different numbers of profiles of teaching practices for Bulgaria ................................................................................................................................................................... 133
Table B.6 model fit for latent profile analysis with different numbers of profiles of teaching practices for denmark ................................................................................................................................................................. 133
Table B.7 model fit for latent profile analysis with different numbers of profiles of teaching practices for estonia ..................................................................................................................................................................... 133
Table B.8 model fit for latent profile analysis with different numbers of profiles of teaching practices for hungary .................................................................................................................................................................. 133
Table B.9 model fit for latent profile analysis with different numbers of profiles of teaching practices for iceland .................................................................................................................................................................... 134
Table B.10 model fit for latent profile analysis with different numbers of profiles of teaching practices for ireland ..................................................................................................................................................................... 134
Table B.11 model fit for latent profile analysis with different numbers of profiles of teaching practices for italy .......................................................................................................................................................................... 134
Table B.12 model fit for latent profile analysis with different numbers of profiles of teaching practices for Korea ....................................................................................................................................................................... 134
Table B.13 model fit for latent profile analysis with different numbers of profiles of teaching practices for lithuania ................................................................................................................................................................. 135
Table B.14 model fit for latent profile analysis with different numbers of profiles of teaching practices for malaysia .................................................................................................................................................................. 135
Table B.15 model fit for latent profile analysis with different numbers of profiles of teaching practices for malta ....................................................................................................................................................................... 135
Table B.16 model fit for latent profile analysis with different numbers of profiles of teaching practices for mexico .................................................................................................................................................................... 135
Table B.17 model fit for latent profile analysis with different numbers of profiles of teaching practices for norway ................................................................................................................................................................... 136
Table B.18 model fit for latent profile analysis with different numbers of profiles of teaching practices for Poland ..................................................................................................................................................................... 136
Table B.19 model fit for latent profile analysis with different numbers of profiles of teaching practices for Portugal ................................................................................................................................................................... 136
Table B.20 model fit for latent profile analysis with different numbers of profiles of teaching practices for the slovak republic .............................................................................................................................................. 136
Table B.21 model fit for latent profile analysis with different numbers of profiles of teaching practices for slovenia .................................................................................................................................................................. 137
Table B.22 model fit for latent profile analysis with different numbers of profiles of teaching practices for spain ........................................................................................................................................................................ 137
Table B.23 model fit for latent profile analysis with different numbers of profiles of teaching practices for Turkey ...................................................................................................................................................................... 137
Table B.24 model fit for latent profile analysis with different numbers of profiles of participation in professional learning communities for australia .............................................................................................. 137
Table B.25 model fit for latent profile analysis with different numbers of profiles of participation in professional learning communities for austria ................................................................................................. 138
Table B.26 model fit for latent profile analysis with different numbers of profiles of participation in professional learning communities for Belgium (flemish community) ........................................................ 138
Table B.27 model fit for latent profile analysis with different numbers of profiles of participation in professional learning communities for Brazil ................................................................................................... 138
Table B.28 model fit for latent profile analysis with different numbers of profiles of participation in professional learning communities for Bulgaria ............................................................................................... 138
Teaching PracTices and Pedagogical innovaTion: evidence from Talis © OECD 2012
tablE OF COntEnts9
Table B.29 model fit for latent profile analysis with different numbers of profiles of participation in professional learning communities for denmark ............................................................................................. 139
Table B.30 model fit for latent profile analysis with different numbers of profiles of participation in professional learning communities for estonia ................................................................................................. 139
Table B.31 model fit for latent profile analysis with different numbers of profiles of participation in professional learning communities for hungary .............................................................................................. 139
Table B.32 model fit for latent profile analysis with different numbers of profiles of participation in professional learning communities for iceland................................................................................................. 139
Table B.33 model fit for latent profile analysis with different numbers of profiles of participation in professional learning communities for ireland ................................................................................................. 140
Table B.34 model fit for latent profile analysis with different numbers of profiles of participation in professional learning communities for italy ...................................................................................................... 140
Table B.35 model fit for latent profile analysis with different numbers of profiles of participation in professional learning communities for Korea.................................................................................................... 140
Table B.36 model fit for latent profile analysis with different numbers of profiles of participation in professional learning communities for lithuania ............................................................................................. 140
Table B.37 model fit for latent profile analysis with different numbers of profiles of participation in professional learning communities for malaysia .............................................................................................. 141
Table B.38 model fit for latent profile analysis with different numbers of profiles of participation in professional learning communities for malta .................................................................................................... 141
Table B.39 model fit for latent profile analysis with different numbers of profiles of participation in professional learning communities for mexico ................................................................................................ 141
Table B.40 model fit for latent profile analysis with different numbers of profiles of participation in professional learning communities for norway ................................................................................................ 141
Table B.41 model fit for latent profile analysis with different numbers of profiles of participation in professional learning communities for Poland ................................................................................................. 142
Table B.42 model fit for latent profile analysis with different numbers of profiles of participation in professional learning communities for Portugal ............................................................................................... 142
Table B.43 model fit for latent profile analysis with different numbers of profiles of participation in professional learning communities for the slovak republic .......................................................................... 142
Table B.44 model fit for latent profile analysis with different numbers of profiles of participation in professional learning communities for slovenia............................................................................................... 142
Table B.45 model fit for latent profile analysis with different numbers of profiles of participation in professional learning communities for spain .................................................................................................... 143
Table B.46 model fit for latent profile analysis with different numbers of profiles of participation in professional learning communities for Turkey .................................................................................................. 143
Table c.1 multilevel multinomial regression analysis for teaching practices for australia ............................................. 147
Table c.2 multilevel multinomial regression analysis for teaching practices for austria ................................................ 147
Table c.3 multilevel multinomial regression analysis for teaching practices for Belgium (flemish community) ....... 148
Table c.4 multilevel multinomial regression analysis for teaching practices for Bulgaria .............................................. 148
Table c.5 multilevel multinomial regression analysis for teaching practices for Brazil .................................................. 149
Table c.6 multilevel multinomial regression analysis for teaching practices for denmark ............................................ 149
Table c.7 multilevel multinomial regression analysis for teaching practices for estonia ................................................ 150
Table c.8 multilevel multinomial regression analysis for teaching practices for hungary ............................................. 150
Table c.9 multilevel multinomial regression analysis for teaching practices for iceland................................................ 151
Table c.10 multilevel multinomial regression analysis for teaching practices for ireland ................................................ 151
Table c.11 multilevel multinomial regression analysis for teaching practices for italy ..................................................... 152
Table c.12 multilevel multinomial regression analysis for teaching practices for Korea .................................................. 152
Teaching PracTices and Pedagogical innovaTion: evidence from Talis© OECD 2012
tablE OF COntEnts
10
Table c.13 multilevel multinomial regression analysis for teaching practices for lithuania ............................................ 153
Table c.14 multilevel multinomial regression analysis for teaching practices for malaysia ............................................. 153
Table c.15 multilevel multinomial regression analysis for teaching practices for malta................................................... 154
Table c.16 multilevel multinomial regression analysis for teaching practices for mexico ............................................... 154
Table c.17 multilevel multinomial regression analysis for teaching practices for norway............................................... 155
Table c.18 multilevel multinomial regression analysis for teaching practices for Poland ................................................ 155
Table c.19 multilevel multinomial regression analysis for teaching practices for Portugal .............................................. 156
Table c.20 multilevel multinomial regression analysis for teaching practices for the slovak republic ......................... 156
Table c.21 multilevel multinomial regression analysis for teaching practices for slovenia.............................................. 157
Table c.22 multilevel multinomial regression analysis for teaching practices for spain ................................................... 157
Table c.23 multilevel multinomial regression analysis for teaching practices for Turkey ................................................. 158
Table c.24 multilevel multinomial regression analysis for participation in professional learning communities for australia .................................................................................................................................................................. 158
Table c.25 multilevel multinomial regression analysis for participation in professional learning communities for austria ..................................................................................................................................................................... 159
Table c.26 multilevel multinomial regression analysis for participation in professional learning communities for Belgium (flemish community) ............................................................................................................................ 159
Table c.27 multilevel multinomial regression analysis for participation in professional learning communities for Brazil ....................................................................................................................................................................... 160
Table c.28 multilevel multinomial regression analysis for participation in professional learning communities for Bulgaria ................................................................................................................................................................... 160
Table c.29 multilevel multinomial regression analysis for participation in professional learning communities for denmark ................................................................................................................................................................. 161
Table c.30 multilevel multinomial regression analysis for participation in professional learning communities for estonia ..................................................................................................................................................................... 161
Table c.31 multilevel multinomial regression analysis for participation in professional learning communities for hungary .................................................................................................................................................................. 162
Table c.32 multilevel multinomial regression analysis for participation in professional learning communities for iceland .................................................................................................................................................................... 162
Table c.33 multilevel multinomial regression analysis for participation in professional learning communities for ireland ..................................................................................................................................................................... 163
Table c.34 multilevel multinomial regression analysis for participation in professional learning communities for italy .......................................................................................................................................................................... 163
Table c.35 multilevel multinomial regression analysis for participation in professional learning communities for Korea ....................................................................................................................................................................... 164
Table c.36 multilevel multinomial regression analysis for participation in professional learning communities for lithuania ................................................................................................................................................................. 164
Table c.37 multilevel multinomial regression analysis for participation in professional learning communities for malaysia .................................................................................................................................................................. 165
Table c.38 multilevel multinomial regression analysis for participation in professional learning communities for malta ....................................................................................................................................................................... 165
Table c.39 multilevel multinomial regression analysis for participation in professional learning communities for mexico .................................................................................................................................................................... 166
Table c.40 multilevel multinomial regression analysis for participation in professional learning communities for norway ................................................................................................................................................................... 166
Table c.41 multilevel multinomial regression analysis for participation in professional learning communities for Poland ..................................................................................................................................................................... 167
Table c.42 multilevel multinomial regression analysis for participation in professional learning communities for Portugal ................................................................................................................................................................... 167

Teaching PracTices and Pedagogical innovaTion: evidence from Talis © OECD 2012
tablE OF COntEnts11
Table c.43 multilevel multinomial regression analysis for participation in professional learning communities for the slovak republic .............................................................................................................................................. 168
Table c.44 multilevel multinomial regression analysis for participation in professional learning communities for slovenia .................................................................................................................................................................. 168
Table c.45 multilevel multinomial regression analysis for participation in professional learning communities for spain ........................................................................................................................................................................ 169
Table c.46 multilevel multinomial regression analysis for participation in professional learning communities for Turkey ...................................................................................................................................................................... 169
This book has...
StatLinks 2A service that delivers Excel® files from the printed page!
Look for the StatLinks at the bottom left-hand corner of the tables or graphs in this book.To download the matching Excel® spreadsheet, just type the link into your Internet browser,starting with the http://dx.doi.org prefix.If you’re reading the PDF e-book edition, and your PC is connected to the Internet, simplyclick on the link. You’ll find StatLinks appearing in more OECD books.

Executive Summary
Teaching PracTices and Pedagogical innovaTion: evidence from Talis © OECD 2012
13
BackgroundThe pressure to increase equity and improve educational outcomes for students is growing around the world. Teaching practices, in contrast to student background variables such as socio-economic status and cultural capital, are factors affecting student learning that are more readily modifiable. moreover, additional professional practices have received attention, especially those that help transform the school into a professional learning community.
The report uses data from the 2008 oecd Teaching and learning international survey (Talis). Talis is an international survey focused on the working conditions of teachers and the learning environment in lower secondary schools. it uses self-report questionnaires and representative samples of schools and teachers within schools along with their principal. for the purpose of this report, this rich dataset is used to identify, in each of the 23 participating countries, underlying profiles in teachers’ participation in two related areas of teachers’ work: (1) classroom teaching practices and (2) participation in professional learning communities.
The report furthermore compares these profiles among countries and relates them to teacher background variables (such as teachers’ qualification, gender and age, as well as subject taught), teacher beliefs, school background variables (such as social composition of the student population) and school policies (such as autonomy, management, feedback and appraisal systems).
This report does not evaluate the effectiveness of any teaching practice, nor does it provide data on subjective judgement of practices within countries, but rather aims to enable a more comprehensive understanding of teaching practice and participation in professional learning communities nationally and internationally and thereby provide policy makers and other key stakeholders with relevant information for system monitoring.
conceptual frameworkThe selection of the teacher practices dimensions examined in this report is based on an underlying theoretical framework rooted in past and current theories on teacher practices, both at the classroom level (teaching practices) and the school level (professional learning communities, with professional development and shared practices to improve teaching). at the beginning of the 21st century, socio-constructivist ideas (i.e., examining a learner’s psychological processes within the context of the learning process) became prominent in normative approaches to classroom teaching. however, research on school effectiveness suggests that practices based on these theoretical ideas are insufficient to foster student learning. rather, a combination of clear, well-structured classroom management, supportive, student-oriented classroom climate,
Teaching PracTices and Pedagogical innovaTion: evidence from Talis© OECD 2012
ExECutIvE summary
14
and cognitive activation (e.g. challenging content that promotes deep reflection in the student) has been shown to be effective. The conceptual framework therefore incorporates both socio-constructivist thinking and more classical process-product research, which provides a way to build a bridge between constructivism and direct instruction approaches to education.
Three dimensions of classroom teaching practices are identified in Talis 2008 that reflect these different approaches: structuring, student orientation and enhanced activities. The structuring dimension describes teaching practices that clarify the structure of a unit or lesson and its ultimate goals, as well as test whether all students have understood the content and performed their tasks. The student orientation dimension concerns group work and adaptive instruction, but also student participation in classroom planning. Both dimensions ask for practices that involve close interaction of the teacher with the whole class, small groups or individual students. This is not the case for the enhanced activities dimension, which instead summarises practices that give students the chance to work independently over a longer period of time.
The concept of professional learning communities is also rooted in socio-constructivist ideas, as well as in models of learning organisations. These models of learning organisations, which originated from the business sector, focus on the interactions between teachers and students and on how these interactions can achieve the goals of fostering students’ learning. These interactions are driven by norms, rules and expectations that are, to a large extent, shaped by teachers and school leaders. This requires a system that promotes collaboration and the sharing of values and knowledge, i.e. a professional learning community.
central features of professional learning communities that are measured by Talis and used in this report are co-operation, holding a shared vision, having a clear focus on learning, practising reflective inquiry and engaging in the de-privatisation of practice. Two types of co-operative hands-on activities were distinguished: the exchange of material, and teaching jointly as a team. While the former can be expected to be common in most countries, teaching jointly as a team requires a higher level of co-ordination and reflection. holding a shared vision refers to individuals in a group having common goals and a common mind-set to work for them. having a clear focus on student learning implies regularly evaluating whether this goal has been achieved, which can be realised through the performance of systematic assessments. reflective inquiry takes place when teachers have detailed and critical discussions about their teaching practices and their experiences in classrooms. Professional learning activities within schools, such as team supervision, are one setting where such reflection can take place. finally, de-privatisation of practice implies that teachers observe each other, give feedback, and act as mentor, advisor or specialist.
key findings
classroom teaching practicesUsing multilevel latent profile analysis, this report shows that teachers can be separated along their overall frequency of using the three dimensions of teaching practices rather than their specific preference for one dimension or another. in each country, three profiles were detected: one group of teachers reports frequent use of structuring, student orientation and enhanced

Teaching PracTices and Pedagogical innovaTion: evidence from Talis © OECD 2012
ExECutIvE summary15
activities, while another group reports rarely using any of the three practices and one group falls in between. in all countries, the highest percentage of teachers was found in the profile with the lowest means for all three teaching practice dimensions while the lowest percentage of teachers fell within the profile with the highest means for all three dimensions. hence, only a minority of teachers constitute the profile that reports a comparatively diverse and frequent use of classroom teaching practices.
at the country level, qualitative differences in the profiles are observed. While in some countries student orientation and enhanced activities are comparatively frequent in all three profiles, we observe a clear focus on structuring in others. This suggests that teaching practices are influenced by pedagogical traditions and national cultures.
The profile that reports the most frequent use of all three dimensions of classroom teaching practices also agrees more with constructivist beliefs about the nature of teaching and learning, holds stronger self-efficacy beliefs, reports a more frequent attendance of professional development activities outside of school, and receives feedback and appraisal more often.
participation in professional learning communitiesWith respect to participation in professional learning communities, results were more varied among countries: three or four profiles were identified and differences were both quantitative and qualitative. according to theory, a professional learning community exists only when all five aspects are realised in a school or within a certain group of teachers. results from the analysis show this is not the case for all teachers. in fact, some of the practices used to measure these five aspects are reported to be used infrequently. moreover, the differences among the profiles are not only in level, but also in kind.
This report shows that participation in professional learning communities tends to be separated by co-operative practices that reduce autonomy. in most countries, large differences among profiles are found with regard to team teaching, a rather sophisticated form of teacher co-operation. for half of the countries there is also considerable variation in the frequency of observation visits with mutual feedback about instruction. in a number of countries, the profiles are further defined by joint reflection on instruction in the context of school-based professional learning activities such as team supervision.
Profile membership is related to other behaviours, as well. Teachers in profiles with higher means for the indicators of self-reported professional practices engage in more professional development and receive more feedback on their teaching. These findings suggest that in all countries there is a group of teachers who report being very active in improving their own practices through activities inside and outside of school; this group is also more likely to report often using a variety of teaching practices, and they believe in their own efficacy.
key policy implicationsThe analysis results presented above show that considerable variation exist within and between countries in profiles of teaching practices and of participation in professional learning communities. Thus, as expected, patterns of self-reported professional practice seem to be

Teaching PracTices and Pedagogical innovaTion: evidence from Talis© OECD 2012
ExECutIvE summary
16
strongly influenced by the specific interaction between traditions, culture and educational policy in each education system. This variation therefore limits the cross-national comparability of profiles and their correlations with other variables. however, general conclusions and policy implications from this research can be reached.
classroom teaching practiceshigh-quality instruction is often defined as the use of a variety of classroom teaching practices, allowing for both teacher-directed and self-regulated learning. for educational policy and teacher education, the results support calls for a good balance among the three dimensions of classroom teaching practices: (a) enhanced activities including challenging tasks and content, (b) student-oriented, supportive practices and (c) teacher-directed practices that provide structure and clarity.
moreover, the profiles with the highest means also reported higher self-efficacy, reported receiving more feedback and appraisal on their instruction, and reported being more involved in professional development activities outside of schools. Thus, the conception of instructional quality as diversity of practices also reflects teachers’ self-perception.
participation in professional learning communitiesThis report shows that practices that help to realise these features within a school exist across different education systems. in many countries, developing a shared vision and a focus on student learning, but also the exchange of materials, as a fairly basic form of co-operation among staff is similarly common in most profiles. however, practices involving a reduction of autonomy are more difficult (less common) than a simple exchange of materials or co-ordination in the preparation of instruction.
moreover, empirical support for the value of de-privatising practice comes from the finding that teachers who report being involved in such activities regularly also have higher self-efficacy.
in conclusion, under the premise that professional practices based on socio-constructivist theories examined by Talis are considered innovative and beneficial for student learning and non-cognitive outcomes, the results suggest that the main driver for advancement is developing a large repertoire of classroom teaching practices as well as taking collective responsibility and working co-operatively to improve instruction. Teachers who are less involved in such activities should especially be the focus of policy and on-site intervention.

17
Teaching PracTices and Pedagogical innovaTion: evidence from Talis © OECD 2012
Introduction
Chapter 1
This chapter introduces the premises and vocabulary needed to understand
and interpret the report. it sets forth what the Talis 2008 has ascertained
about teaching practices and teachers’ participation in professional
learning communities. chapter 1 also states what the Talis study was
unable to measure; for example, the cause-and-effect relationship between
teachers’ level of motivation and their participation in extracurricular
learning activities. chapter 1 indicates that country-by-country profiles
will further develop the Talis findings.
Teaching PracTices and Pedagogical innovaTion: evidence from Talis© OECD 2012
ChaPtEr 1 IntroductIon
18
rationale and aims of the reportTeachers and teaching have become an important focus of national and local policy. all around the world, reforms and actions aim to promote high-quality teaching in classrooms and professional collaboration at the school level. in order to tailor policies and interventions to the needs of different stakeholders and to improve the learning conditions of students, it is important to understand what is happening in schools and classrooms in different education systems.
This report aims to contribute to this knowledge base. Using data from the 2008 oecd Teaching and learning international survey (Talis), it sets out to identify and harmonise profiles with regard to two related areas of professional teacher activities: classroom teaching practices and participation in professional learning communities.
for each of these areas, the report identifies and describes typical profiles of practices within countries using a statistical technique that allows for the identification of “latent” (unobservable) profiles based on self-reports obtained from teachers. The report furthermore compares these latent profiles among countries and relates them to teacher background variables (such as qualification, subject taught, gender and age), to teacher beliefs, to the school background (such as social composition of the student population) and to school policies (such as autonomy, management, feedback and appraisal).
results will inform policy makers and key stakeholders on professional practices, both separately for each country and in comparison across countries, and thereby provide relevant information for system monitoring. analysing relationships of the profiles with teacher-, school- and system-level background variables and processes will also inform comparative research on teachers and teaching. The results will enable a more comprehensive understanding of professional practices.
outline of the reportWhile stakeholders across countries agree on the aim of promoting high-quality teaching, they may have different conceptions of what characterises good practice. moreover, teaching and learning can be regarded a cultural activity. What works in one system might not be easily transferred to others (Bempechat, Jimenez and Boulay, 2002; Bennett, 1987; Berliner and Biddle, 1995), and reforms in different countries sometimes move in opposite directions (döbert, Klieme and sroka, 2004). Therefore, the report starts by describing the theoretical framework for the selection of the practices examined. This allows the reader to better contextualise and interpret the results.
chapter 2 provides substantive theory on professional practices, both at the classroom level (teaching practices) and the school level (professional learning communities, with professional development and shared practices to improve teaching). here, two perspectives are taken: that of evidence-based education and of a more normative theoretical position. The former refers to international research in educational and teacher effectiveness, and the latter to philosophies of education, e.g. constructivism (visions of education), reform pedagogy (giving schools greater autonomy) and the concept of professional learning communities.
While chapter 2 delineates a broad array of concepts from school research and pedagogy, chapter 3 relates the discussion directly to the Talis 2008 study and identifies the issues

Teaching PracTices and Pedagogical innovaTion: evidence from Talis © OECD 2012
IntroductIon ChaPtEr 119
discussed in the literature review based on the study’s design, instrumentation and data structure. Talis provides multilevel data on different areas of professional activities, as well as a broad set of explanatory variables on both the teacher and the school level. nevertheless, Talis does not evaluate the effectiveness of any professional practice, nor does it provide data on subjective judgement of practices within countries. These limitations are considered in chapter 3, which introduces the Talis design and sample as well as the statistical approaches used in the report. a detailed presentation of the statistical model and software considerations is provided in annex a.
chapter 4 provides empirical results on profiles of teaching practices and on teacher- and school-level predictors of profile membership, while chapter 5 presents similar results for professional learning communities. in conclusion, chapter 6 interprets the findings. different perspectives, as outlined in chapter 2, are applied.
Background and main findingsclassroom teaching practices are at the core of a teacher’s work. at the beginning of the 21st century, teaching practices based on socio-constructivist theories became popular in educational philosophy (e.g. Brown, 1994; deci and ryan, 1985; evensen and hmelo, 2000; lee and songer, 2003; mayer, 2004; scardamalia and Bereiter, 2006). These theories are, to a certain degree, supported by empirical research: instructional methods based on socio-constructivist ideas (i.e., examining a learner’s psychological processes within the context of the learning process) – for example, student-oriented practices and cognitive activation – are associated with student motivation and conceptual understanding. however, empirical research also suggests that these factors are not sufficient to foster learning. cognitive outcomes may also require clear structuring of lessons and good classroom management (e.g. Baumert et al., 2009; creemers and Kyriakides, 2008; Klieme, Pauli, and reusser, 2009; lipowsky et al., 2009; Pianta and hamre, 2001). Therefore, three dimensions of classroom teaching practices are identified in Talis 2008 that reflect all of these aspects: structuring, student orientation and enhanced activities (oecd, 2009; oecd 2010a).
Using multilevel latent profile analysis, this report shows that teachers can be separated along their overall frequency of using the three dimensions of classroom teaching practices rather than their specific preference for one dimension or another. across countries that participated in Talis 2008, three parallel latent profiles are found. hence, in each country, one group of teachers reports frequent use of structuring, student orientation and enhanced activities, while another group reports rarely using any of the three practices and one group falls in between. at the country level, on the other hand, qualitative differences are observed. While in some countries student orientation and enhanced activities are comparatively frequent in all three latent profiles, we observe a clear focus on structuring in other countries. This suggests that classroom teaching practices are influenced by pedagogical traditions and national cultures.
socio-constructivist ideas have also led to the development of new forms of teachers’ professional learning. Professional learning communities involve teachers in a number of co-operative activities and in reflective inquiry, help teachers to develop a shared vision and to focus on student learning, and promote de-privatisation of teaching (sharing ideas through

Teaching PracTices and Pedagogical innovaTion: evidence from Talis© OECD 2012
ChaPtEr 1 IntroductIon
20
peer coaching) (hord, 2004; Kruse, louis and Bryk, 1995). empirical studies suggest that such practices may help improve instruction and enhance learning (Bolam et al., 2005; lee and smith, 1996; louis and marks, 1998; supovitz, 2002).
This report also shows that participation in professional learning communities tends to be separated by co-operative practices that reduce autonomy. in most countries, large differences among profiles are found with regard to team teaching. for half of these countries there is also considerable variation in the frequency of observation visits with mutual feedback about instruction. in a number of countries, the profiles are further defined by joint reflection on instruction in the context of school-based professional learning activities such as team supervision. only small differences among profiles are found for the other items. There is one exception, however: in the Korea, profiles are separated mainly by the reported frequency of attending staff meetings in order to discuss the vision and the mission of the school. Thus, as with the profiles for classroom teaching practices, the profiles for participation in professional learning communities vary considerably among countries, suggesting an influence of pedagogical traditions and national cultures.
Profile membership is related to other professional behaviours, as well. Teachers in profiles with higher means for the indicators of self-reported professional practices engage in more professional development and receive more feedback on their teaching. These findings suggest that in all countries there is a group of teachers who report being very active in improving their own practices through activities inside and outside of school; this group is also more likely to report often using a variety of teaching practices, and they believe in their own efficacy. Based on a cross-sectional survey it is not possible to determine whether professional development and feedback help teachers develop a wider repertoire of practices or whether teachers who report greater use of professional practices are more motivated to get involved in professional learning. similarly, it remains open whether participation in professional learning communities helps teachers develop high self-efficacy, or whether high self-efficacy helps use a diverse set of professional practices. The positive associations suggest at a minimum that it may be worthwhile to examine these links in more detail to study whether existing programmes are effective and reach teachers most in need of support.
The results further show constructivist beliefs about the nature of teaching and learning to be associated with membership in profiles for teaching practices. The higher the agreement with constructivist beliefs, the more likely a teacher is to be in a profile with higher means for the three dimensions of classroom teaching practices. no association is observed, however, with participation in professional learning communities. Beliefs are considered to guide the professional practices of teachers (e.g. leuchter, Pauli, reusser and lipowsky, 2006). it is likely that the relation between both aspects is reciprocal. The present report confirms this association in a variety of education systems. This suggests including beliefs in actions aimed at improving teaching practices.
school characteristics also play a role in teachers’ professional practices: In some countries school size, teachers’ average working hours and parents’ socio-economic background predict the school average membership for both profiles of professional practices. These associations vary considerably, however, among countries.

Teaching PracTices and Pedagogical innovaTion: evidence from Talis © OECD 2012
IntroductIon ChaPtEr 121
Readers’ guide
Data underlying the figuresThe data referred to in chapters 4 and 5 of this report are presented in annexes B, and c.
Reporting of teacher and school dataThe report uses “teachers” and “principals” as shorthand for the Talis target population. in practice, this refers to a representative sample of teachers of lower secondary education [level 2 of the international standard classification of education (isced-97)] and the principals of their schools.
Abbreviations used in this reportisced international standard classification of education
aic akaike information criterion
Bic Bayesian information criterion
Classification of levels of educationThe classification of the levels of education is based on the revised international standard classification of education (isced-97). isced is an instrument for compiling statistics on education internationally and distinguishes among the following levels of education:
• Pre-primary education (isced level 0).
• Primary education (isced level 1).
• lower secondary education (isced level 2).
• Upper secondary education (isced level 3).
• Post-secondary non-tertiary level of education (isced level 4).
• Tertiary-type a education (isced level 5a).
• Tertiary-type B education (isced level 5B).
• advanced research Qualifications (isced level 6).
Rounding of figuresBecause of rounding, some figures in tables might not add up exactly to the totals. Totals, differences and averages are always calculated on the basis of exact numbers and are rounded only after calculation. When standard errors in this publication have been rounded to one or two decimal places and the value 0.0 or 0.00 is shown, this does not imply that the standard error is 0, but that it is smaller than 0.05 or 0.005 respectively.
Territorial entitiesin the entire document, the flemish community of Belgium is referred to as “Belgium (fl.)”.
Further documentationfor further information on the instruments and the methods used in Talis 2008 see the initial report, Creating Effective Teaching and Learning Environments: First Results from TALIS (oecd, 2009); the TALIS Technical Report (oecd, 2010a) and the Talis Web site (www.oecd.org/edu/talis).

Teaching PracTices and Pedagogical innovaTion: evidence from Talis© OECD 2012
ChaPtEr 1 IntroductIon
22
RefeRencesBaumert, J., M. Kunter, W. Blum, M. Brunner, T. Voss, A. Jordan, U. Klusmann, S. Krauss, M. Neubrand and Y.-M. Tsai (2009), “Teachers’ mathematical knowledge, cognitive activation in the classroom, and student progress”, American Educational Research Journal, vol. 47, pp. 133-180.
Bempechat, J., N. Jimenez and B. Boulay (2002), “cultural-cognitive issues in academic achievement: new directions for cross-national research. national research council”, in a.c. Porter and a. gamoran (eds). Methodological Advances in Cross-National Surveys of Educational Achievement, Board on Testing and assessment, center for education, division of Behavioral and social sciences and education. Washington, dc., national academy Press.
Bennett, W. (1987), “looking at Japanese education: implications for american education”, NASSP Bulletin 71, vol. 499, pp. 102-108.
Berliner, D. and B. Biddle (1995), “The manufactured crisis: myths, fraud and the attack on america’s public schools”, reading, ma, addison-Wesley.
Bolam, R., A. McMahon, L. Stoll, S. Thomas, M. Wallace, A. Greenwood, A. et al. (2005), Creating and sustaining effective professional learning communities. dfes and University of Bristol, london.
Brown, A.L. (1994), “The advancement of learning”, Educational Researcher, vol. 23, no. 8, pp. 4-12.
Creemers, B.P.M. and L. Kyriakides (2008), The Dynamics of Educational Effectiveness, A Contribution to Policy, Practice and Theory in Contemporary Schools, routledge, london/new York.
Deci, E.L. and R.M. Ryan (1985), Intrinsic motivation and self-determination in human behavior, Plenum, new York.
Döbert, H., E. Klieme, and W. Sroka (eds.). (2004), “conditions of school Performance in seven countries. a Quest for Understanding the international variation of Pisa results”, münster, Waxmann.
Evenson, D.H. and C.E. Hmelo (2000, eds), Problem-Based Learning: A Research Perspective on Learning Interactions, lawrence erlbaum associates, london.
Hord, S.M. (ed.) (2004), Learning together, leading together: Changing schools through professional learning communities, Teachers college Press, new York.
Klieme, E., C. Pauli and K. Reusser (2009), “The Pythagoras study”, in J. Tomás and T. seidel (eds.), The power of video studies in investigating teaching and learning in the classroom, Waxmann, münster, pp. 137-160.
Kruse, S., K.L. Louis and A. Bryk (1995), Let’s build teachers’ professional community. WCER Highlights, Url: http://www.wcer.wisc.edu/publications/WCER_Highlights/Vol.7_No.1_Spring_1995/Teachers_prof_community.html, retrieved 1, may 2011.
Lee, V.S. E. and J. Smith (1996), “collective responsibility for learning and its effects on gains in achievement and engagement for early secondary students”, American Journal of Education, vol. 104, pp. 103-147.
Lee, H.S. and N.B. Songer (2003), “making authentic science accessible to students”, International Journal of Science Education, vol. 25, no. 1, pp. 1-26.
Leuchter, M., Pauli, C., Reusser, K. and Lipowsky, F. (2006), „Unterrichtsbezogene Überzeugungen und Kognitionen von lehrpersonen“, Zeitschrift für Erziehungswissenschaft, vol. 9 no. 4, pp. 562-579.
Lipowsky, F., K. Rakoczy, C. Pauli, B. Drollinger-Vetter, E. Klieme and K. Reusser (2009), “Quality of geometry instruction and its short-term impact on students’ understanding of the Pythagorean Theorem”, Learning and Instruction, vol. 19, pp. 527-537.
Louis, K.S. and H.M. Marks (1998), “does professional learning community affect the classroom? Teachers’ work and student experiences in restructuring schools”, American Journal of Education, vol. 106, no. 4, pp. 532-575.
Mayer, R. (2004), “should there be a three-strikes rule against pure discovery learning? The case for guided methods of instruction”, American Psychologist, vol. 59, no. 1, pp. 14-19.
Pianta, R.C. and B. Hamre (2001), Students, teachers, and relationship support [STARS]: User’s guide, Psychological assessment resources, inc., lutz, fl.
OECD (2009), Creating Effective Teaching and Learning Environments: First Results from TALIS, oecd Publishing.
Teaching PracTices and Pedagogical innovaTion: evidence from Talis © OECD 2012
IntroductIon ChaPtEr 123
OECD (2010a), TALIS Technical Report, oecd Publishing.
OECD (2010b), PISA 2009 Results: What makes a School Successful? Resources, Policies and Practices (volume iv), oecd Publishing.
Scardamalia, M. and C. Bereiter (2006), “Knowledge building: Theory, pedagogy, and technology”, in K. sawyer (ed.), Cambridge Handbook of the Learning Sciences, cambridge University Press, new York, pp. 97-118.
Supovitz, J.A. (2002), “developing communities of instructional practice”, Teachers College Record, vol. 104, no. 2, pp. 127-146.


25
Teaching PracTices and Pedagogical innovaTion: evidence from Talis © OECD 2012
Teachers’ Professional Practices
Chapter 2
This chapter reviews Western educational theory from the 20th century, and
concludes that teaching practices can be developed through professional
development and appraisal from colleagues. central features of professional
learning communities are co-operation, shared vision, a focus on learning,
reflective inquiry and de-privatisation of practice. a small school size,
high autonomy, a school management that feels responsible for improving
instruction, and a constructive feedback culture also help develop a
professional learning community. chapter 2 notes variations within the
West and contrasts, for example, asian countries where confucian thought
has long promoted collective thinking and action.

Teaching PracTices and Pedagogical innovaTion: evidence from Talis© OECD 2012
ChaPtEr 2 teachers’ ProfessIonal PractIces
26
Highlights
• Teacher professional practices encompass both teaching practices in the classroom and broader professional practices that shape the school learning environment. Both types of practices have their roots in philosophies of education and in empirical research on educational effectiveness.
• instructional quality is complex: There is no single best way of teaching and teachers continually must adapt their practices to serve the needs of the specific context, class and students. a combination of a constructivist and of a more direct approach to instruction is needed.
• The concept of a school as a learning organisation is gaining popularity in education and considers teachers as part of a professional learning community with a high level of collaboration, coherent activities of professional development and shared practices.
• cross-cultural research suggests that pedagogical traditions and national cultures have considerable influences on the use of teacher professional practices. Therefore, it is important to take cross-national differences into account and to empirically test assumptions of universality.

Teaching PracTices and Pedagogical innovaTion: evidence from Talis © OECD 2012
Teachers’ Professional PracTices ChaptEr 227
classroom instruction is at the core of teachers’ work, and instructors spend a large proportion of their time teaching students in classrooms and preparing lessons. But teachers also act outside classrooms shaping the school-level learning environment. in recent decades, research has begun to give more weight to the school as a learning organisation and has acknowledged additional kinds of professional practices of teaching staff, including co-operating in teams and professional development (oecd, 2010d; darling-hammond et al. 2005; leithwood and louis, 1998; Kruse, louis and Bryk, 1995). Both types of practices will be discussed in light of normative approaches and empirical research on educational effectiveness.
The normative approach draws on philosophies of learning, such as constructivism, or visions of education, such as european reform pedagogy. research in educational and teacher effectiveness examines associations between educational inputs, processes and outcomes (e.g. Brophy and good, 1986; ditton, 2000; fend, 1998; leithwood and louis, 1998; reynolds, 1996; sammons, Thomas & mortimore, 1997a, 1997b; scheerens and Bosker, 1997; seidel and shavelson, 2007; slavin, 1996; stringfield, 1994; Teddlie and reynolds, 2001; Wang, haertel and Walberg, 1993a; Wang, haertel and Walberg, 1993b).
current education policy (sykes, Plank and schneider, 2009) provides prominent examples of both approaches. many researchers believe that existing evidence on policy advocates for “an implied, preferred model of the education system with a basic structure of state standards-based reforms, clear goals and standards, aligned resources, and appropriate accountability” (smith and smith 2009; p.389). at the same time, school reformers value so-called charter schools – schools that are freed from many regulations – as “laboratories for innovation in public education” (vergari 2009, p.482). results from the oecd’s Programme for international student assessment (Pisa) 2009 seem to support the latter strategy by showing that “in countries where schools have greater autonomy over what is taught and how students are assessed, students tend to perform better” (oecd, 2010b, p. 14). however, Pisa 2009 also suggests a complex interaction between accountability, autonomy and student performance: schools that enjoy greater autonomy in resource allocation tend to do relatively well if accountability requirements are strong, but the reverse is true if accountability requirements are weak (oecd, 2010b, p. 14).
recently, the notion of “professional learning communities”, believed to be the core of schools as “learning organisations”, has gained popularity among professionals as well as policy makers. The ultimate goal is to improve student learning, but there is also a strong focus on teacher learning. considering the teaching staff as a learning community with a high level of collaboration, coherent activities of professional development and shared practices to improve classroom teaching may help summarise and structure related concepts and findings.
Classroom teaChing praCtiCesThe oecd innovation strategy states that teaching quality is especially important for improving educational outcomes (oecd; 2010c). empirical research links instructional quality to effective classroom learning and student outcomes (Brophy, 2000; Brophy and good, 1986; oecd, 2010b; seidel and shavelson, 2007; Wang, haertel and Walberg, 1993a). over and above individual variables such as family background, intellectual ability and previous knowledge, the “local” teaching and learning environment, i.e. the social and spatial context wherein students interact with each other and their teachers, generally has a stronger impact on learning
Teaching PracTices and Pedagogical innovaTion: evidence from Talis© OECD 2012
ChaptEr 2 Teachers’ Professional PracTices
28
outcomes than do teacher background and other school- or system-level variables. in short: proximal (“near”) variables are better predictors than distal (“far”) ones of student learning and outcomes. Both pedagogical norms and empirical evidence may help identify salient aspects of the classroom learning environment. They are discussed in succession below.
philosophies of learning and teaChing The dominant philosophies of learning and teaching have undergone significant developments over the past century [see de corte in oecd (2010d)]. The most important school of thought in the United states educational psychology in the first half of the 20th century was behaviourism. it described learning as the acquisition, strengthening and application of stimulus-response connections through reinforcement. Teaching was thought to influence this through providing adequate reinforcement. according to behaviourist views, positive rewards following a correct response automatically strengthen the connection to the stimulus. even complex behaviour can be taught by reinforcing spontaneous behaviours step by step, until the whole behaviour sequence is built together. exercise and repetition are seen as crucial to develop and maintain stimulus-response connections. models based on these theories are called “drill and practice” and “programmed instruction”.
Behaviourism was also relevant, but less prominent, in the european countries at the beginning of the 20th century. rather, some alternative theories were developed, like Gestalt psychology and the Würzburg school of Denkpsychology. The central tenet of gestalt can be summarised in the quote, “The whole is greater than the sum of its parts”. accordingly, the gestalt approach criticised behaviourism for breaking down behaviour into its parts. in the gestalt perspective, learning is seen as a process of understanding the structures of problems and gaining sudden insight rather than as an iterative development of stimulus-response connections. similarly, the Würzburg school studied problem-solving processes. in general, these theories were less helpful for developing instructional approaches.
influenced by behaviourism as well as gestalt and denkpsychology, the middle of the 20th century saw the rise of cognitive psychology in both the United states and europe (later adopted worldwide) and thus a shift of focus from behaviour to information processing. cognitive psychology examines mental processes and knowledge structures. it tries to understand how knowledge of different themes is acquired and structured, and which strategies are used for problem solving. learning is seen as the acquisition of knowledge. But while the rise of cognitive psychology led to a deeper understanding of learning processes, it did not yield many innovative approaches for teaching. By and large, cognitive theories still encouraged lectures and the use of textbooks as the preferred instructional methods and assigned students a rather passive role in learning.
during the 1970s and 1980s, yet another theory emerged to overcome the limits of cognitive approaches. Constructivism suggested a more student-centred approach to instruction. Through interacting with the environment, students were thought to actively build up and reorganise mental structures of knowledge and skills. numerous instructional approaches are based on constructivism. central to these is that teachers are not thought to be direct transmitters of knowledge, but rather facilitators of an active, self-directed construction of knowledge.
at the end of the 20th century, there was yet another turn in educational theory. inspired by the ideas of vygotsky and culturally comparative research, socio-constructivist theories started

Teaching PracTices and Pedagogical innovaTion: evidence from Talis © OECD 2012
Teachers’ Professional PracTices ChaptEr 229
examining the interaction of psychological processes within the learner with social and situational characteristics of the learning process. While constructivism described learning as a process happening within the isolated mind of an individual, the socio-constructivist view rather understands knowledge as situated and “being in part a product of the activity, context, and culture in which it is developed and used” (Brown, collins and duguid, 1989; p. 32). several practices have evolved from this approach; for example, “self-directed learning”, “co-operative learning”, “self-regulated learning”, “guided discovery”, “scaffolding”, “cognitive apprenticeship”, “teacher-mediated dialogue”, “independent group discussion”, “problem-based learning”, “project-based learning”, and “knowledge building” (e.g. evensen and hmelo, 2000; lee and songer, 2003; scardamalia and Bereiter, 2006).
it is important to note that all of these approaches are rooted in Western thought, though they are also influential outside of north america and Western europe. for example, hong Kong’s Target-oriented curriculum reform alludes to constructivism in promoting a “learner-centred approach” and an emphasis on “communicating, inquiring, conceptualising, reasoning and problem-solving”. it also integrates ideas of adaptive or differentiated instruction, making demands to account for “individual differences and the needs of individual students” and the use of formative assessment. likewise, in Turkey (isikoglu, Basturk and Karaca, 2009) and in chile (Zurita and nussbaum, 2004) socio-constructivism has been subject to scientific debate. nevertheless, other theories and approaches not mentioned here may be even more influential in some regions, especially confucian traditions in southeast asia or islamic concepts in the mideast, but also newer non-Western theories such as gu’s pedagogical theory in hong Kong (gu, 2001).
researCh in eduCational effeCtiveness aside from theoretical approaches, the selection of classroom teaching practices examined in this report was also based on research in educational effectiveness. The main goal of educational effectiveness research is to identify
“factors in teaching, curriculum, and learning environment at different levels such as the classroom, the school, and the above-school levels [that] can directly or indirectly explain the differences in the outcomes
of students, taking into account background characteristics, such as ability, ses, and prior attainment.” (creemers and Kyriakides, 2008; p.12).
a number of authors explicitly include classroom-level factors in their research overview and empirical design. for example, scheerens (2008) identifies five factors that operate on the classroom level in his model of educational effectiveness: classroom management and time-on-task, structure, classroom climate, individualised and adaptive instruction, and feedback. some of these are rooted in specific paradigms of educational effectiveness research.
educational researchers have set out to describe high-quality, effective teaching using more general, generic terms:
• Classroom climate: research has shown that student learning is generally supported by a positive and respectful atmosphere that is relatively free of disruption and is focused on student performance (creemers and Kyriakides, 2008; harris and chrispeels, 2006; hopkins, 2005; scheerens and Bosker, 1997). The major facets of a positive classroom climate are: supportive teacher-student interactions, good student-student relationships, achievement orientation and an orderly learning atmosphere with clear disciplinary rules.

Teaching PracTices and Pedagogical innovaTion: evidence from Talis© OECD 2012
ChaPtEr 2 teachers’ ProfessIonal PractIces
30
• Direct instruction: direct instruction advocates the use of close monitoring, adequate pacing and classroom management, structure, clarity of presentation, and informative and encouraging feedback. These components help create an orderly environment and maximise effective learning time. Well-structured lessons implementing features of direct instruction have been shown to have a positive impact on student performance, especially for disadvantaged students.
• Support for self-determination: approaches based on reform pedagogy (see oelkers, 2005) and humanistic psychology (e.g. deci and ryan, 1985) emphasise the role of autonomy and social relatedness in promoting student motivation and non-cognitive outcomes. researchers inspired by these theoretical approaches, (e.g. deci and ryan, 1985), argue that student motivation and non-cognitive outcomes require additional facets of quality, such as a classroom climate and teacher-student relations that support autonomy, competence and social relatedness.
• Cognitive activation and challenge: finally, in order to foster “cognitive activity” (mayer, 2004) – rather than “activity per se” – and conceptual understanding, instruction should use deep, challenging content (Brown, 1994). in the case of mathematics, for example, this means making connections between mathematical facts, procedures, ideas and representations (hiebert and grouws, 2007). To achieve this, argumentation and non-routine problem solving should be promoted.
This review suggests that instructional quality is complex. large-scale assessments such as Pisa have been able to identify various aspects of the classroom climate, while there has been less success in identifying types of teaching practices and quality in international surveys. existing evidence suggests there is no single best way of teaching. student sub-populations may benefit from different practices. Thus, teachers have to tailor learning in a way that serves the needs of the specific class.
Klieme, Pauli and reusser (2009) condensed this knowledge into a framework of three “basic dimensions of instructional quality”: (a) clear, well-structured classroom management, (b) supportive, student-oriented classroom climate, and (c) cognitive activation with challenging content. empirical support for the separation of these dimensions and their association with student learning comes from the german extension to the Timss 1995 video study (Klieme, schümer and Knoll, 2001), a german large-scale study on mathematics teachers (Baumert et al., 2009), a swiss-german video study on math instruction (lipowsky, et al., 2009), international work in educational effectiveness (e.g. creemers and Kyriakides, 2008), classroom observations in elementary schools (Pianta and hamre, 2001) and research on teacher self-efficacy (Tschannen-moran and Woolfolk-hoy, 2007). By incorporating both (socio)-constructivist thinking and classical process-product research, the framework may help to build a bridge between constructivism and direct instruction (Tobias and duffy, 2009).
lipowsky et al. (2009) consider the basic dimensions as latent variables that are related, but not identical, to specific instructional practices. Talis attempts to tap these dimensions by asking teachers about the frequency of specific practices that were believed to indicate structure, student orientation and enhanced (high-challenge) learning, respectively.

Teaching PracTices and Pedagogical innovaTion: evidence from Talis © OECD 2012
teachers’ ProfessIonal PractIces ChaPtEr 231
correlates of classroom teaching practicesclassroom teaching practices are shaped by input characteristics and processes at different levels of education systems. early reviews of educational effectiveness such as edmonds (1979) focused mainly on school-level factors like school climate, including high expectations for student achievement, school leadership, evaluation policies and quality of the curriculum; at the time, the quality of the curriculum was described as “focus on basic skills”. This list of effectiveness indicators has been reiterated over the years in many reviews and meta-analyses (see citations of effectiveness research above). more recent reviews such as creemers and reezigt (1996) as well as scheerens (2008) add co-operation and coherence among teaching staff, as well as parental involvement.
The resulting list of factors is very similar to the list of “five essential supports” for school improvement that Bryk, Bender sebring, allensworth, luppescu, and easton (2010) recently identified in their seminal longitudinal study on school development in chicago during the 1990s (figure 2.1, left). Bryk et al. (2010) acknowledge that student outcomes are driven mainly by classroom instruction and the dynamics of student learning (figure 2.1, right); however, they are unable to describe classroom instruction empirically because their design lacks appropriate instruments. classroom teaching and learning, although believed to be the core mediating process in school-based education, are treated as a “black box” by these authors. school-level variables like the “five essential supports” can be used to describe conditions for high-level, demanding teaching.
in their review of educational effectiveness research, creemers and reezigt (1996) further elaborate on what has been called “instructional guidance” in the Bryk et al. (2010) model: a clear focus on core competencies such as basic skills, co-ordination of curriculum and instruction across classrooms.
Figure 2.1Model of “Essential supports” (left) and “Classroom black box” (right)
Source: Bryk et al. (2010), Organizing Schools for Improvement: Lessons from Chicago, University of Chicago Press, Chicago, IL.
Classroom Black Box
Instructional Guidance
Community Ties
Parent, School
School Learning Climate
Professional Capacity
Relational Trust across a School Community
Community Local School Context
Student Outcomes • Enhanced
Engagement • Expanded
Academic Learning
Stru
ctur
al F
acto
rs
Leadership as the Driver for Change
The Classroom Black Box Technical Core
Dynamics of Student Learning
Motivation
School Participation
+
Classroom Instruction
Time
Supplemental Resources

Teaching PracTices and Pedagogical innovaTion: evidence from Talis© OECD 2012
ChaPtEr 2 teachers’ ProfessIonal PractIces
32
research on correlates of teaching practices has also addressed teachers’ professional knowledge and beliefs. however, the evidence is rather inconclusive. While some studies showed beliefs to be correlated with classroom teaching practices (e.g. dubberke, Kunter, mcelvany, Brunner and Baumert, 2008; Peterson, fennema, carpenter and loef, 1989; staub and stern, 2002), others find no such link (e.g. Wilcox-herzog, 2002). The inconsistency might be partly attributable to differences in the definition of the constructs.
also, reverse effects of practices on teachers’ beliefs seem to be plausible. for example, there is some evidence that teachers review and change their belief systems only if they are convinced that teaching activities can make a difference. more consistent associations are found with teachers’ self-efficacy beliefs (e.g. gibson and dembo, 1984). Teachers with higher self-efficacy not only report more effective instructional strategies (e.g. gibson and dembo, 1984), they also seem to implement innovations more easily (fuchs, fuchs and Bishop, 1992; ghait and Yaghi, 1997).
finally, professional learning of individual teachers and staff as well as teacher training activities can affect instructional quality. Teacher education reformers consider the mentor-novice relationship important to improve the quality of teaching (holmes group, 1986; holmes group, 1990). in the United states, teacher educators have been developing mentoring programmes at both pre-service and induction levels (odell, huling and sweeny, 1999).
Thus, research suggests several factors are correlated with classroom teaching practices. at the individual level, associations have been observed with teacher beliefs (e.g. staub and stern, 2002; gibson and dembo, 1984) and professional development, as well as feedback and appraisal from the principal, colleagues or external observers (e.g. cuevas, lee, hart and deaktor, 2005; desimone, Porter, garet, suk Yoon and Birman, 2002; guskey, 2002; Jeanpierre, oberhauser and freeman, 2005; supovitz and Turner, 2000; Timperley et al., 2007). major factors shaping the working environment for teachers at the school level are school leadership and the school climate (Bryk et al., 2010). implementation of reforms in schools in australia further showed that teacher learning proceeds most effectively when situated within school-based professional learning teams, and can be supported through a variety of experiences including reflection on practice, workshops, shared discussions and action research, and mentor support. a model for school and teacher change that is based on professional learning teams in schools, and focuses on a clear framework for describing effective pedagogy, provides powerful support for change that is both substantial and embedded (Tytler, 2007).
professional learning communitiessocio-constructivist theory is the source not only of several teaching strategies, but also of “progressive” approaches to teachers’ professional learning; for example, the concept of professional learning communities. in addition to normative support for this design of co-operative learning, there is growing empirical evidence of its effectiveness. The following section starts by discussing professional learning and professional learning communities in detail. The second part summarises research on its correlations with conditions at different levels of the education system.
Professional learning refers to any activity that equips teachers with the tools and resources necessary to provide high-quality instruction. it includes school-based programmes as well as networking, coaching, seminars or other types of training that foster in-service learning and thus promote the professionalisation of teaching.

Teaching PracTices and Pedagogical innovaTion: evidence from Talis © OECD 2012
teachers’ ProfessIonal PractIces ChaPtEr 233
even though professional development is generally regarded as crucial for improving teaching and student achievement, early reviews of professional development practices concluded that programmes were not effective in supporting teachers and stimulating reform (e.g. guskey, 1986; little, 1993). sykes (1996) even referred to the ineffectiveness of common training activities as “the most serious unsolved problem for policy and practice” (p. 465). more recent studies, however, report positive effects on teacher knowledge (radford,1998; supovitz, mayers and Kahle, 2000), beliefs and attitudes (stein, smith and silver, 1999), teaching practices and classroom climate (cuevas, lee, hart and deaktor, 2005; desimone, Porter, garet, suk Yoon and Birman, 2002; guskey, 2002; Jeanpierre, oberhauser and freeman, 2005; supovitz and Turner, 2000; Timperley et al., 2007) as well as student achievement (e.g. mcdowall, cameron, dingle, gilmore and macgibbon, 2007; shayer and adhami, 2007). This apparent inconsistency may be partly reconciled by the different features of the programmes examined. summarising previous studies, Buzcynski and hansen (2010) describe ineffective programmes to be “too conventionally taught, too top-down, and too isolated from school and classroom realities to have much impact on practice” (p.600). in a research review, supovitz and Turner (2000) conclude that effective programmes must “immerse participants in inquiry, questioning, and experimentation and therefore model inquiry forms of teaching”, “be both intensive and sustained”, “engage teachers in concrete teaching tasks and be based on teachers’ experiences with students”, “focus on subject-matter knowledge and deepen teachers’ content skills”, and “be grounded in a common set of professional development standards and show teachers how to connect their work to specific standards for student performance” (pp.964-965). These features are rarely present in traditional professional development (e.g. workshops and courses) but are more likely to be found in networks for professional development, mentoring, coaching and peer observation arrangements, as well as individual or collaborative research programmes.
The past few decades have seen a growing interest in the latter kinds of professional development. research on teacher professionalisation suggests that “strong professional development communities are important contributors to instructional improvement and school reform” (little, 2002; p. 936). already during the 1980s, scholars pointed to the benefits of supportive networks for teachers (e.g. darling-hammond, 1984; rosenholtz, 1989; Bryk and driscoll, 1988). in 1990, the idea of the “learning organisation” emerged in the business sector. one of its founding fathers, the economist senge (1990), described it as an organisation where “people continually expand their capacity to create the results they truly desire, where new and expansive patterns of thinking are nurtured, where collective aspiration is set free, and where people are continually learning how to learn together” (p. 3).
specialists in the theory of education quickly adopted this approach (dufour and eaker, 1998). They further integrated knowledge from research on professional development and teacher learning to accommodate the specificities of schools (dreeben and Barr, 1988; meyer and rowan, 2006). Their basic process is the interaction between teachers and their “clients” – namely, students and parents – focusing on subject matter, with the goal of fostering students’ understanding, competencies and personal growth.
Teaching and learning, like all social interaction, are driven by norms, rules and expectations that are partly determined from outside (e.g. by curricula and standards), but are to a large

Teaching PracTices and Pedagogical innovaTion: evidence from Talis© OECD 2012
ChaPtEr 2 teachers’ ProfessIonal PractIces
34
degree shaped by the professional actors. Thus, the teaching staff and its leadership determine how a school functions as a learning organisation. This requires staff members to collaborate closely, share values and knowledge, and act in a reliable manner (Teddlie and stringfield, 1993), thus overcoming the classic structure of bureaucratic schools that has been characterised as “loosely coupled” and “cellular”. Therefore, schools that function as learning organisations are considered professional learning communities.
around the same time, lave and Wenger (1991) developed the concept of “communities of practice”. These have many parallel features to professional learning communities, and sometimes the terms are used interchangeably. While the work on professional learning communities draws on models of learning organisations, however, the communities of practice tradition is rooted in situated learning and social constructivism. situated learning posits that the circumstances and social context in which learning takes place are central to the learning process (e.g. Putnam and Borko, 2000). Thus, professional learning – just like classroom student learning – is viewed as collective construction of knowledge and identity through participation in contextualised practice (lave and Wenger, 1991; Wenger, 1998). This model puts a stronger focus on the social aspect of learning in the formation of new knowledge, while the literature on professional learning communities places more emphasis on the roles of leadership and school culture (Blankenship and ruona, 2007). We focus on the latter in this report, but also incorporate knowledge from the communities of practice tradition.
Professional learning communities aim at continuous improvement of teaching practices by involving staff in in-depth, systematic, collaborative activities of professional development at the school level (hord, 1997). central features of professional learning communities are (a) co-operation, (b) shared vision, (c) a focus on learning, (d) reflective inquiry and (e) de-privatisation of practice (hord, 2004; Kruse, louis and Bryk, 1995).
a. Co-operation implies working together to achieve goals; for example, exchanging and developing materials, preparing instruction or other school activities together, developing and learning new techniques, or working on concrete projects to improve the school environment. such co-operation can also encourage and support teachers, and help build and reinforce shared values and the willingness to improve. Teacher co-operation is its own strand of research. several models have been developed to describe levels of co-operation (graesel, fußangel and Pröbstel, 2006; steinert, Klieme, maag merki, döbrich, halbheer and Kunz, 2006). The lowest level of co-operation is restricted to a sporadic exchange of information and materials. higher levels include increasing degrees of interaction, critical reflection, co-ordination and trust. They further require a definition of common goals and a high frequency and harmonisation of concerted action. The higher levels of co-operation also encompass most additional criteria of professional learning communities.
b. Shared vision refers to common goals, and a common mind-set to work towards them and to take them into account for decision making. Through co-operative discussion and reflection, professional learning communities develop a shared view on fundamental questions such as: “What do we want each student to learn?”, “What is the role of the teacher?”, “Which are effective teaching strategies?”, “Which are good strategies for classroom management?”, “how can we improve social relations and the general atmosphere within classrooms
Teaching PracTices and Pedagogical innovaTion: evidence from Talis © OECD 2012
teachers’ ProfessIonal PractIces ChaPtEr 235
and the school?”, “how do we know whether our goals are reached?” and “how can we respond when students have difficulties in learning?”. not all values will be shared among all teachers – otherwise the institution would be a totalitarian one – but teachers come to an agreement on the most fundamental educational questions.
c. The literature on professional learning communities suggests a shift of focus from teaching to learning. fundamental is the assumption that all students can learn at reasonably high levels, and individual variance is found only with regard to the time needed and the most helpful strategies. it is up to the teachers to help all students to find their individual route to knowledge and competence. This implies a strong sense of responsibility and accountability for student outcomes. it also means that strategies and techniques are not only applied because they are appealing from a theoretical point of view; rather, teachers need to constantly evaluate the efficiency of different practices.
d. Reflective inquiry takes place when teachers have thorough conversations about students, teaching and learning. Through an examination of basic and often implicit assumptions about teaching and learning, a deeper understanding of educational processes and outcomes is gained. This implies an open discussion and critical reflection of teachers’ own behaviours, roles and practices, as well as of school culture, customs and structures. developing and debating creative strategies for improving learning and solving specific problems with individual students or groups of students is another central characteristic. a fundamental premise for this kind of communication is mutual trust, as well as the willingness to accept and share new knowledge and information. several strategies can support the process: action research, coaching, mentoring, and collaborative and collegial decision making.
e. Teachers’ work is, to a large extent, confined to the classroom, where they interact with groups of students. often, the only feedback teachers get is from students. a critical appraisal and ideas for improvement from colleagues are not part of everyday teaching in schools. De-privatisation of practice has the goal to end this isolation of teachers. it implies talking about practice and sharing ideas and problems, but it also involves opening up one’s own practice to other adults through programmes of peer coaching, teamed teaching and structured classroom observations. Teachers observe each other, give feedback, and act as mentor, advisor or specialist.
in the literature there is some disagreement on how and where professional learning communities are best achieved. While hord (1997) stated that these communities require the involvement of a school’s whole staff, lieberman (1996) emphasised the importance of co-operating with like-minded people and described several potential contexts. graesel et al. (2006), darling-hammond and mclaughlin (1995) as well as Wood (1995) examined the benefits of cross-institutional co-operation, and Putnam and Borko (2000) described communities of teachers, university-based researchers and staff developers.
as Talis drew samples of teachers who may be teaching a variety of subjects, we will focus on the school level and refer to hord’s (1997) suggestion that a schools’ whole staff should be included in co-operative activities.

Teaching PracTices and Pedagogical innovaTion: evidence from Talis© OECD 2012
ChaPtEr 2 teachers’ ProfessIonal PractIces
36
conditions that facilitate the development of professional learning communitiesschool-level conditions that support the development of professional learning communities can be either formal or social in nature.
formal conditions at the school levelformal conditions encompass the school size, availability of resources and school autonomy. school size affects physical proximity, familiarity, identification with the school and the communication flow. in smaller schools, teachers have more opportunity to interact (Bryk, camburn and louis, 1999). a collective identity and common norms are further developed more easily in smaller schools (lee, Bryk and smith, 1993; huberman, 1993). Thus, school size may be positively or negatively related to the existence of professional learning communities. co-operation also requires time and space to meet and talk, and thus a good infrastructure (Kruse, louis and Bryk, 1995).
finally, louis, marks and Kruse (1996; p. 762) state, “Professional communities are more likely to thrive in schools with flexible governance arrangements, such as site-based management and school-based decision making, rather than bureaucratic centralisation,” suggesting an effect of school autonomy. When teachers participate in the selection of new teachers, they may feel more responsible for their integration and qualification (hord, 1997). autonomy further gives freedom to devote time and resources to the specific needs of the school, its staff and its student body (hord, 1997). This may be used to establish systems of professional learning.
social conditions at the school levela supportive social environment can encourage teachers to reflect on their practice, share ideas and talk openly about problems. hence, a respectful and positive social climate is central for engaging teachers in professional learning communities (e.g. louis, 1992). co-operative improvement of pedagogic practice also requires openness to innovation within the school community (Ibid.).
a key factor for developing co-operative practices and professional learning communities is the school management. instructional leadership and a focus on learning and development may help create a climate conducive to collective learning (e.g. leithwood and louis, 1998; louis and Kruse, 1995; hord, 1997). accordingly, the initial Talis report has shown that “in almost three-quarters of Talis countries, principals who adopt an instructional leadership style tend to create professional development programmes for instructionally weak teachers”, and that “in more than one quarter of Talis countries, teachers whose school principal adopts a more pronounced instructional leadership style are more likely to engage in collaborative activities with their colleagues” (p. 190).
finally, professional reflection and development by teachers also necessitate information on their own strengths and weaknesses (caldwell and spinks, 1998). hence, regular feedback and appraisal may also contribute to the development of professional learning communities and help transform schools into learning organisations.
in summary, research points to school-level factors that are associated with participation in professional learning communities; specifically school size, autonomy, and management, in addition to a culture of feedback.
Teaching PracTices and Pedagogical innovaTion: evidence from Talis © OECD 2012
teachers’ ProfessIonal PractIces ChaPtEr 237
teachers’ professional practices in a cross-national comparisonThe previous sections of this chapter have described a variety of professional practices and have cited substantive theory and research documenting their effectiveness. however, the approaches were developed and tested mainly in Western countries, and they might not be easily transferable to other cultures. What is an innovation in one education system may be well-established practice in another; what is appreciated as an improvement may be rejected elsewhere.
moreover, the effects of inputs and processes on outcomes may vary between countries; characteristics of education systems can moderate relations between teachers’ professional practices and student learning. Therefore, it is important to take cross-national differences into account and to empirically test assumptions of universality. Thus far, there is little research examining teachers’ practices from a cross-cultural perspective. existing studies reveal both similarities and differences.
many basic characteristics of educational policy and instruction are similar across countries. all industrialised nations have an established system of mass public schooling, and even the general role of teachers and school principals is very similar (Baker and leTendre, 2005). Baker and leTendre find “remarkable similarities in what is taught and learned in schools all around the world” (Ibid. p. xii). Teachers across most industrialised countries employ similar basic practices like whole class work, seat work and lecturing (givvin, hiebert, Jacobs, hollingsworth and gallimore, 2005). moreover, a number of international trends can be observed, for example the disappearance of gender difference in mathematics and science, the growing use of private tutoring and a trend towards decentralisation (Baker and leTendre, 2005).
on the other hand, several pedagogical traditions vary considerably among countries. for example, there is a strong tradition of early tracking in german-speaking countries, and recent attempts to extend comprehensive schooling have evoked fierce public debates. in the United states, canada and many scandinavian countries, on the other hand, comprehensive schooling is taken for granted. similarly, the importance of standardised tests in the United stated stands in stark contrast to the traditions of its neighbour canada and most Western european countries. another example is that for decades most european countries have used “all-day schools”, whereas this practice has been introduced only recently in german-speaking countries (hagemann, Jarausch and allemann-ghionda, 2011). These organisational conditions shape the opportunity structures for teaching and co-operation in different countries.
Teachers’ professional practices also vary among countries. classroom teaching practices originate in quite different educational traditions: While Plato, aristotle, Bandura, Piaget and dewey are frequently cited in Western discussions of teaching, education in southeast asia cannot be understood without a basic knowledge of confucius’ teachings. accordingly, stigler and hiebert (1999) identified country-specific instructional “scripts” that reflect these differences. Previous analysis of Talis data also showed some fundamental differences in the reported frequencies of classroom teaching practices among countries (vieluf and Klieme, 2011).
research also suggests cross-national variation in teachers’ co-operative practices. autonomy is a central feature of the profession in many Western countries, and programmes to strengthen co-operation and de-privatise practice are considered novel and innovative, while this does not

Teaching PracTices and Pedagogical innovaTion: evidence from Talis© OECD 2012
ChaPtEr 2 teachers’ ProfessIonal PractIces
38
hold true for southeast asian countries. in china, for example, co-operation among teachers is a longstanding tradition. Teachers are usually organised in research groups, which are an intermediary between the teachers and the principal. They work together studying national guidelines and defining teaching goals, as well as preparing and improving teaching. They even organise observation visits to give colleagues feedback and involve teachers in out-of-school activities (Paine and ma, 1993). hence, many features of professional learning communities have long been present in chinese schools. The same holds for Japan, where “lesson studies” are common practice among teachers (stigler and hiebert, 1999).
in addition to variations in the quality and quantity of educational inputs and processes, cross-cultural differences have been described with regard to their effectiveness. for example, scheerens (2001) identified two fundamental differences between developing and developed countries. he found stronger effects of resources and smaller effects of teacher competence and instructional strategies in developing countries.
similarly, Pisa shows cross-national variance in the effects of science teaching practices, with larger differences between oecd and non-oecd countries (oecd, 2007). This is likely to be attributable to economic and cultural factors. for example, fuller and clarke (1994) argue that participatory forms of teaching are incompatible with strong hierarchies in cultures with a high value of power distance. similarly, alavi and mccormick (2004) suggest that teachers’ critical reflection and inquiry may be less effective for school improvement in collectivist countries with high power distance, where criticism is communicated in a more indirect and face-saving manner and open critical discussions are not common. at the same time, they hypothesise that “systems thinking”, that is, understanding how factors influence one another within a school, may be more easily accomplished in collectivist cultures. The same may hold true for creating team spirit or group cohesion. finally, stronger hierarchies and uneven power distributions may also lead to a greater importance of leadership for school development (hallinger and Kantamara, 2001).
in summary, these examples of cross-national variations in the prevalence and effectiveness of different educational processes illustrate that theory and research carried out in one country cannot be assumed to be valid in another. rather, they should be tested empirically. recently the culture or, more generally, context-specificity is becoming more widely recognised in research on innovation. for example, in its innovation strategy the oecd (2010c) cautions against “one size fits it all” policy strategies.
This report also seeks to carefully consider possible differences between education systems. it starts with analysing profiles of teachers’ professional practice and their association with educational input and process characteristics separately for each country. an overall model is only built in a second step, if there is empirical proof for equivalence of profiles across countries.
teachers’ professional practices and educational innovationcurrent debates in educational policy, both at national and international levels, often seek innovations that may help educational systems adapt in a changing world, responding to growing demands from the labour market; to new social, ecological, and economic challenges;

Teaching PracTices and Pedagogical innovaTion: evidence from Talis © OECD 2012
teachers’ ProfessIonal PractIces ChaPtEr 239
and to evolving norms and practices in the life of children and youth. This also pertains to teachers’ professional practices.
innovation can be defined as a new idea or a further development of an existing product, process or method that is applied in a specific context with the intention to create a value added (Kirkland and sutch, 2009). innovations sometimes involve radical changes, but often they result only in incremental adaptations of well-known practices. Pedagogical practice always needs to be innovative. adapting to characteristics of students and responding to their development is an inherent aspect of pedagogy. But as harvey and green (1993) put it: “education is not a service for a customer but an on-going process of transformation of the participant, be it student or researcher” (p. 24). These adaptations can be considered innovations if are based on a new idea and when they have the potential to improve student learning, or when they are linked with other outcomes (such as improving the health of students, preventing teenage violence or drug abuse, or improving the job satisfaction and well-being of teachers).
innovations is difficult to examine with questionnaires. rather than discovering completely new ideas or examining the process of innovation, a survey can help educators gain knowledge on their implementation. good ideas developed in a specific context by practitioners, researchers or policy makers need to be spread across classrooms and schools to improve processes and outcomes on a more global scale. When the spreading of a new idea is steered by policy makers with a top-down approach, the process is referred to as implementation (graesel, 2010). data on the prevalence of professional practices that are based on fairly new ideas and advocated by educational policy for improving an education system can serve policy makers for an implementation check. This can inform how well developments in educational theory are communicated in practice and identify a possible discrepancy between policy and classroom activity.
how do the teachers’ professional practices assessed in Talis relate to innovation in education? arguably, among the most recent advances in educational philosophy are teaching and learning practices associated within the socio-constructivist paradigm. This is still not implemented into regular practice in many countries, but among advocates of “progressive” teaching there is strong support. additionally, there are strongly held beliefs that co-constructive practices will provide added value – probably not for rote learning, but for conceptual understanding, higher-order thinking, and problem-solving skills. Thus, these practices are obvious candidates for an implementation check. aside from possibly being considered innovative, they may also be better-suited for giving students the generic, social and personal skills they need in today’s innovation-driven knowledge society (oecd, 2008). hence, data on their prevalence may also inform educators about conditions for future innovation.
opponents, however, argue that the expectation that socio-constructivist teaching will improve student learning is based on a shortcut between surface features of the learning environment – like methods, media and form of interactions – and deep cognitive processes. it may well be the case that lecture-style teaching helps foster student understanding compared with self-directed or co-operative learning, because students in the first case are given guidance and support that students under the second condition are not. also, the cognitive demands of self-directed learning might be rather low, depending on the tasks and how they are implemented. (for an overview of the discussion between constructivism and explicit instruction see Tobias and duffy, 2009.)
Teaching PracTices and Pedagogical innovaTion: evidence from Talis© OECD 2012
ChaPtEr 2 teachers’ ProfessIonal PractIces
40
Professional learning communities may also be considered innovative because the concept is still fairly novel – at least in Western countries – and it has the potential to create added value. even though research on the effects of professional learning communities is still limited, there is some indication that it has a positive effect on processes and outcomes in schools. empirical research suggests a correlation with student achievement (Bolam et al., 2005; lee and smith, 1996; louis and marks, 1998; supovitz, 2002), and this correlation seems to be mediated by instructional quality (e.g. louis and marks, 1998).
in addition to being innovative, professional learning communities can also be described as supportive conditions for innovation in schools, because they are about “the will and the skills for change” (miles and louis, 1990). They help schools to constantly develop and improve their processes and practices and thereby create incremental innovations.1 in fact, qualitative studies suggest that professional learning communities can stimulate change and contribute to school improvement and reform (darling-hammond, 1996; little, 2002; mclaughlin and Talbert, 1993).
it should be noted, however, that results on the prevalence of socio-constructivist approaches to teaching and professional learning communities need to be interpreted in light of the pedagogical traditions and policies in each country or state. Using the data for an implementation check is informative mainly in education systems where these practices are not yet common to all teachers even though they have recently been advocated by educational policy. Therefore, this report describes profiles of different practices, but leaves it up to the reader to judge how innovative they are in each specific local context.
ConClusIons • a major part of teachers’ work consists of teaching students in classroom and preparing
instruction. But recently, additional professional practices have received attention, especially those that help transform the school into a professional learning community. Both practices are substantiated with educational philosophy and empirical research.
• at the beginning of the 21st century, socio-constructivist ideas became prominent in normative approaches to classroom teaching. however, research on school effectiveness suggests that practices based on these theoretical ideas are insufficient to foster student learning. rather, a combination of clear, well-structured classroom management, supportive, student-oriented classroom climate, and cognitive activation with challenging content has been shown to be effective.
• classroom teaching practices can be developed through professional development as well as constructive feedback and appraisal from the principal or from colleagues, and they have been shown to be associated with teachers’ beliefs. at the school level, school leadership and co-operation among staff are important conditions for advancing instruction.
• The concept of professional learning communities is rooted in socio-constructivist ideas as well as models of learning organisations. central features of professional learning communities are co-operation, shared vision, a focus on learning, reflective inquiry and de-privatisation of practice.

Teaching PracTices and Pedagogical innovaTion: evidence from Talis © OECD 2012
teachers’ ProfessIonal PractIces ChaPtEr 241
• according to the literature, a small school size, high autonomy especially with regard to hiring teachers, a school management that feels responsible for improving instruction as well as a constructive feedback culture can help develop a professional learning community.
• research examining teachers’ professional practices from a cross-cultural perspective suggests considerable influences of pedagogical traditions and national cultures on the use of both types of practices examined by Talis.
• Talis does not lend itself to discovering radically new ideas in education, nor is it appropriate for studying the process of innovation. But, in education systems where educational policy advocates socio-constructivist approaches to teaching and professional learning communities as innovation, data from Talis on profiles regarding these practices can contribute to an implementation check.

Teaching PracTices and Pedagogical innovaTion: evidence from Talis© OECD 2012
ChaPtEr 2 teachers’ ProfessIonal PractIces
42
note1. Incremental innovations describe smaller improvements that involve incremental changes only as opposed to radical innovations, which cause radical changes (dewar and dutton, 1986; ettlie, Bridges, and o’Keefe, 1984).
RefeRencesAlavi, S.B. and J. McCormick (2004), “a cross-cultural analysis of the effectiveness of the learning organisation model in school contexts”, The International Journal of Educational Management, vol. 18, no. 7, pp. 408-416.
Baker, D. and G. LeTendre (2005), National differences, global similarities: World culture and the future of schooling, stanford University Press, stanford.
Baumert, J., M. Kunter, W. Blum, M. Brunner, T. Voss, A. Jordan, U. Klusmann, S. Krauss, M. Neubrand and Y.-M. Tsai (2009), “Teachers’ mathematical knowledge, cognitive activation in the classroom, and student progress”, American Educational Research Journal, vol. 47, pp. 133-180.
Blankenship and Ruona (2007), International Conference Proceedings, academy of human resource development, indianapolis, in.
Bolam, R., A. McMahon, L. Stoll, S. Thomas, M. Wallace, A. Greenwood, A. et al. (2005), Creating and sustaining effective professional learning communities. dfes and University of Bristol, london.
Brophy, J. and T.L. Good (1986), “Teacher behavior and student achievement”, in m. c. Wittrock (ed.), handbook of research on teaching (3rd ed., pp. 28-375), merrill/Prentice, Upper saddle river, nJ.
Brophy, J.E. (2000), Teaching, international academy of education/international Bureau of education (iae), geneva, switzerland.
Brown, A.L. (1994), “The advancement of learning”, Educational Researcher, vol. 23, no. 8, pp. 4-2.
Brown, J.S., A. Collins and P. Duguid (1989), “situated cognition and the culture of learning”, Educational Researcher, vol. 18, no. 1, pp. 32-41.
Bryk, A.S., P. Bender Sebring, E. Allensworth, S. Luppescu and J. Q. Easton (2010), Organizing Schools for Improvement: Lessons from Chicago, University of chicago Press, chicago.
Bryk, A.S. and M. E. Driscoll (1988), The high school as community: Contextual influences and consequences for students and teachers, national center on effective secondary schools, University of Wisconsin-madison, madison, Wi.
Bryk, A.S., E. Camburn and K.S. Louis (1999), “Promoting school improvement through professional communities: an analysis of chicago elementary schools”, Educational Administration Quarterly, vol. 35, pp. 707-750.
Buczynski, S. and B. Hansen (2010), “impact of professional development on teacher practice: Uncovering connections”, Teaching and Teacher Education, vol. 26, no. 3, pp. 599-607.
Caldwell, B.J. and J.M. Spinks (1998), Beyond the Self-Managing School, falmer Press, london.
Creemers, B.P.M. and L. Kyriakides (2008), The Dynamics of Educational Effectiveness, A Contribution to Policy, Practice and Theory in Contemporary Schools, routledge, london/new York.
Creemers, B.P.M. and G.J. Reezigt (1996), “school level conditions affecting the effectiveness of instruction”, School Effectiveness and School Improvement, vol. 7, no. 3, pp. 197-228.
Cuevas, P., O. Lee, J. Hart and R. Deaktor (2005), “improving science inquiry with elementary students of diverse backgrounds”, Journal of Research in Science Teaching, vol. 42, no. 3, pp. 337-357.
Darling-Hammond, L. (1984), Beyond the commission reports: The coming crisis in teaching, rand corporation, santa monica, ca.
Darling-Hammond, L. (1996), “What matters most: a competent teacher for every child”, Phi Delta Kappan, vol. 78, no. 3, pp. 193-200.
Darling-Hammond, L. and M.W. McLaughlin (1995), “Policies that support professional development in an era of reform”, Phi Delta Kappan, vol. 76, no. 8, pp. 597-604.

Teaching PracTices and Pedagogical innovaTion: evidence from Talis © OECD 2012
teachers’ ProfessIonal PractIces ChaPtEr 243
Darling-Hammond, L., D. J. Holtzman, S. J. Gatlin, and J.VS. Heilig (2005), “does Teacher Preparation matter? evidence about Teacher certification, Teach for america, and Teacher effectiveness”, education Policy analysis archives, vol. 13, no. 42, Url: http://epaa.asu.edu/epaa/v13n42/, retrieved 15.5.2010.
Deci, E.L. and R.M. Ryan (1985), Intrinsic Motivation and Self-determination in Human Behavior, Plenum, new York.
Desimone, L.M., A.C. Porter, M.S. Garet, K.S. Yoon and B.F. Birman (2002), “effects of professional development on teachers’ instruction: results from a three-year longitudinal study”, Educational evaluation and Policy analysis, vol. 24, no. 2, pp. 81-112.
Dewar, R.D. and J.E. Dutton (1986), “The adoption of radical and incremental innovations: an empirical analysis”, Management Science, vol. 32, no. 11, pp. 1422-1433.
Ditton, H. (2000), „Qualitätskontrolle und -sicherung in schule und Unterricht. ein Überblick zum stand der empirischen forschung“, in a. helmke, W. hornstein, and e. Terhart, e. (eds.), Qualität und Qualitätssicherung im Bildungsbereich, Weinheim.
Dreeben, R. and R. Barr (1988), “classroom composition and the design of instruction”, Sociology of Education, vol. 61, no. 3, pp. 129-142.
Dubberke, T., M. Kunter, N. McElvany, M. Brunner and J. Baumert (2008), „lerntheoretische Überzeugungen von mathematiklehrkräften. einflüsse auf die Unterrichtsgestaltung und den lernerfolg von schülerinnen und schülern“, Zeitschrift für Pädagogische Psychologie, vol. 22, no. 3-4, pp. 193-206.
DuFour, R. and R. Eaker (1998), Professional learning communities at work: Best practices for enhancing student achievement, association for supervision and curriculum development, alexandria, va.
Edmonds, R. (1979), “effective schools for the urban poor”, educational leadership, vol. 37, pp. 15-24.
Ettlie, E., W. P. Bridges and R. D. O’Keefe (1984), “organization strategy and structural differences for radical versus incremental innovation”, Management Science, vol. 30, pp. 682-695.
Evenson, D.H. and C.E. Hmelo (2000, eds), Problem-Based Learning: A Research Perspective on Learning Interactions, lawrence erlbaum associates, london fend, h. (1998), Qualität im Bildungswesen, Weinheim, Juventa.
Fuchs, L. S., D. Fuchs and N. Bishop (1992). instructional adaptation for students at risk. Journal of Educational Research, no. 86, pp. 70-84.
Fuller and Clarke (1994), “raising school effects while ignoring culture? local conditions and the influence of classroom Tools, rules and Pedagogy”, Review of Educational Research, vol. 64, pp. 119-157.
Ghaith, G. and H. Yaghi (1997), “relationships among experience, teacher efficacy, and attitudes toward instructional innovation”, Teaching and Teacher Education, vol. 13, no. 4, pp. 451-458.
Gibson, S. and M. Dembo (1984), “Teacher efficacy: a construct validation”, Journal of Educational Psychology, vol. 76, pp. 569-582.
Givvin, K.B., J. Hiebert, J.K. Jacobs, H. Hollingsworth and R. Gallimore (2005), “are There national Patterns of Teaching? evidence from the Timss 1999 video study”, Comparative Education Review, vol. 49, no. 3, pp. 311-343.
Graesel, C., K. Fußangel and C. Pröbstel (2006), “lehrkräfte zur Kooperation anregen – eine aufgabe für sisyphos?”, Zeitschrift für Pädagogik, no. 52 (2), pp. 205-219.
Graesel, C. (2010), “stichwort: Transfer und Transferforschung im Bildungsbereich“, Zeitschrift für Erziehungswissenschaft, vol. 13, pp. 7-20.
Gu, M. (2001), Education in China and Abroad: Perspectives from a Lifetime in Comparative Education, hong Kong, comparative education research centre, The University of hong Kong.
Guskey, T.R. (1986), “staff development and the process of teacher change”, Educational Researcher, vol. 15, no. 5, pp. 5-12.
Guskey, T.R. (2002), “Professional development and teacher change”, Teachers and Teaching: Theory and Practice, vol. 8, no. 3/4, pp. 381-391.
Hagemann, K., K.H. Jarausch and C. Allemann-Ghionda (2011), Children, Families and States: Time Policies of Child Care, Preschool and Primary Schooling in Europe, Berghahn Books, oxford and new York.

Teaching PracTices and Pedagogical innovaTion: evidence from Talis© OECD 2012
ChaPtEr 2 teachers’ ProfessIonal PractIces
44
Hallinger, P. and P. Kantamara (2001), “exploring the cultural context of school improvement in Thailand“, School Effectiveness and School Improvement, vol. 12, no. 4, pp. 385-408.
Harris, A. and J. Chrispeels (2006), Improving Schools and Educational Systems: International Perspectives, routledge, new York.
Harvey, L. and D. Green (1993), “defining Quality”, Assessment and Evaluation in Higher Education, vol. 18, no. 1, pp. 9-34.
Hiebert J. and D.A. Grouws (2007). second handbook of research on mathematics teaching and learning, The effects of classroom mathematics teaching on students’ learning, information age, greenwich, cT, pp. 371-404.
Holmes Group (1986), Tomorrow’s teachers, east lansing, mi.
Holmes Group (1990), Tomorrow’s schools: Principles for the design of professional development schools, east lansing, mi.
Hopkins, D. (ed.) (2005), “The Practice and Theory of school improvement”, in international handbook of educational change, springer, dordrecht.
Hord, S.M. (1997), Professional Learning Communities: Communities of Continuous Inquiry and Improvement. southwest educational development laboratory, austin TX.
Hord, S.M. (ed.) (2004), Learning together, leading together: Changing schools through professional learning communities, Teachers college Press, new York.
Huberman, M. (1993), “The model of the independent artisan in teachers’ professional relations”, in J.W. little and m.W. mclaughlin (eds.), Teachers’ work: individuals, colleagues, and contexts, Teacher college Press, new York.
Isikoglu, N., R. Basturk and F. Karaca (2009), “assessing in-service teachers’ instructional beliefs about student-centered education: a Turkish perspective”, Teaching and Teacher education, vol. 25, no. 2, pp. 350-356.
Jeanpierre, B., K. Oberhauser and C. Freeman (2005), “characteristics of professional development that effect change in secondary science teachers’ classroom practices”, Journal of research in science Teaching, vol. 42, no. 6, pp. 668-690.
Kirkland, K. and D. Sutch (2009), Overcoming the barriers to educational innovation. A literature review, Url: www.futurelab.org.uk/projects/map-of-innovations, retrieved 15.4.2011.
Klieme, E., C. Pauli and K. Reusser (2009), “The Pythagoras study”, in J. Tomás and T. seidel (eds.), The power of video studies in investigating teaching and learning in the classroom, Waxmann, münster, pp. 137-160.
Klieme, E., G. Schümer and S. Knoll (2001), „mathematikunterricht in der sekundarstufe i: “aufgabenkultur” und Unterrichtsgestaltung“, in e. Klieme and J. Baumert (eds.), Timss – impulse für schule und Unterricht. forschungsbefunde, reforminitiativen, Praxisberichte und video-dokumente,Bundesministerium für Bildung und forschung, Bonn, pp. 43-57.
Kruse, S., K.L. Louis and A. Bryk (1995), Let’s build teachers’ professional community. WCER Highlights, Url: www.wcer.wisc.edu/publications/WCER_Highlights/Vol.7_No.1_Spring_1 995/Teachers_prof_community.html, retrieved 1 may, 2011.
Lave, J. and E. Wenger (1991), Situated learning: Legitimate peripheral participation, cambridge University Press, new York.
Lee, H.S. and N.B. Songer (2003), “making authentic science accessible to students”, International Journal of Science Education, vol. 25, no. 1, pp. 1-26.
Lee, V.S.E. and J. Smith (1996), “collective responsibility for learning and its effects on gains in achievement and engagement for early secondary students”, American Journal of Education, vol. 104, pp. 103-147.
Lee, V.S.E., A.S. Bryk and J.B. Smith (1993), “The organisation of effective high schools”, in l. darling-hammond (ed.) Review of research in education. american educational research association, Washington, dc.
Leithwood, K. and K.S. Louis (1998), “organisational learning in schools: an introduction”, in K. leithwood and K.s. louis (eds.), organisational learning in schools. swets and Zeitlinger, lisse, the netherlands, pp. 1-14.
Lieberman, A. (1996), “Practices that support teacher development: transforming conceptions of professional learning”, in m.W. mclaughlin and i. oberman (eds.), Teacher learning: New policies, new practices, Teachers college Press, new York, pp. 185-201.
Lipowsky, F., K. Rakoczy, C. Pauli, B. Drollinger-Vetter, E. Klieme and K. Reusser (2009), “Quality of geometry instruction and its short-term impact on students’ understanding of the Pythagorean Theorem”, Learning and Instruction, vol. 19, pp. 527-537.

Teaching PracTices and Pedagogical innovaTion: evidence from Talis © OECD 2012
Teachers’ Professional PracTices ChaptEr 245
Little, J.W. (1993), “Teachers’ professional development in a climate of educational reform”, Educational Evaluation and Policy Analysis, vol. 15, no. 2, pp. 129-151.
Little, J.W. (2002), “locating learning in teachers’ professional community: opening up problems of analysis in records of everyday work”, Teaching and Teacher Education, vol. 18, no. 8, pp. 917-946.
Louis, K.S. (1992), “restructuring and the problem of teachers’ work”. in a. lieberman (ed.), The changing contexts of teaching (91stYearbook of the national society for the study of education, vol. 1). chicago, pp. 138-156.
Louis, K.S. and H.M. Marks (1998), “does professional learning community affect the classroom? Teachers’ work and student experiences in restructuring schools”, American Journal of Education, vol. 106, no. 4, pp. 532-575.
Louis, K.S. and S.D. Kruse (1995), Professionalism and community: Perspectives on reforming urban schools, corwin Press, Thousand oaks, ca.
Louis, K.S., H.M. Marks and S. Kruse (1996), “Teacher’ Professional community in restructuring schools”, American Educational Research Journal, vol. 33, no. 4, pp. 757-798,
Mayer, R. (2004), “should there be a three-strikes rule against pure discovery learning? The case for guided methods of instruction”, American Psychologist, vol. 59, no. 1, pp. 14-19.
McDowall, S., M. Cameron, R. Dingle, A. Gilmore and L. MacGibbon (2007), Evaluation of the Literacy Professional Development Project, ministry of education, new Zealand.
McLaughlin, M. and J. Talbert (1993), Contexts that matter for teaching and learning, stanford University, stanford.
Meyer, H.-D. and B. Rowan (2006), The new institutionalism in education, state University of new York Press, albany, nY.
Miles, M. and K. Louis (1990), ”mustering the will and the skill for change”, Educational Leadership, vol. 47, no. 8, pp. 57-61.
Odell, S.J., L. Huling and B. Sweeny (1999), “conceptualising quality mentoring: Background information”, in s.J. odell and l. huling (eds.), Quality mentoring for novice teachers. Kappa delta Pi, indianapolis, in, pp. 8-17.
Oelkers, J. (2005), reformpädagogik – eine kritische dogmengeschichte, Juventa verlag, Weinheim und münchen.
OECD (2007), PISA 2006 Science Competencies for Tomorrow’s World, oecd Publishing.
OECD (2008), Higher Education to 2030, oecd Publishing.
OECD (2010b), PISA 2009 Results: What makes a School Successful? Resources, Policies and Practices (volume iv), oecd Publishing.
OECD (2010c), The OECD Innovation Strategy: Getting a Head Start on Tomorrow, oecd Publishing.
OECD (2010d), dumont, h., d. istance and f. Benavides (eds.) (2010), The Nature of Learning: Using Research to Inspire Practice, educational research and innovation, oecd Publishing.
Paine, L. and L. Ma (1993), “Teachers working together: a dialogue on organisational and cultural perspectives of chinese teachers”, International Journal of Educational Research, vol. 19, no. 8, pp. 675-697.
Peterson, P. L., E. Fennema, T.P. Carpenter and M. Loef (1989), “Teachers’ pedagogical content beliefs in mathematics”, Cognition and Instruction, vol. 6, pp. 1-40.
Pianta, R.C. and B. Hamre (2001), Students, teachers, and relationship support [STARS]: User’s guide, Psychological assessment resources, inc., lutz, fl.
Putnam, R.T. and H. Borko (2000), “What do new views of Knowledge and Thinking have to say about research on Teacher learning?”, Educational Researcher, vol. 29, no. 1, pp. 4-15.
Radford, D.L. (1998), “Transferring theory into practice: a model for professional development for science education reform”, Journal of Research in Science Teaching, vol. 35, no. 10, pp. 73-88.
Reynolds, D. (1996), “Turning around ineffective schools: some evidence and some speculations”, in J. gray, d. reynolds, c. fitz-gibbon and d. Jesson (eds.), merging traditions: The future of research on school effectiveness and school improvement, london, cassell.
Rosenholtz, S.J. (1989), “Workplace conditions that affect teacher quality and commitment: implications for teacher induction programs”, Elementary School Journal, vol. 89, no. 4, pp. 421-439.

Teaching PracTices and Pedagogical innovaTion: evidence from Talis© OECD 2012
ChaptEr 2 Teachers’ Professional PracTices
46
Sammons, P., Thomas, S. and P. Mortimore (1997a), Forging links: Effective schools and effective departments, Paul chapman, london.
Sammons, P., Thomas, S. and P. Mortimore (1997b), “differential school effectiveness. departmental variations in gcse attainment”, The school field, vol. 8, no 1-2, pp. 97-125.
Scardamalia, M. and C. Bereiter (2006), “Knowledge building: Theory, pedagogy, and technology”, in K. sawyer (ed.), Cambridge Handbook of the Learning Sciences, cambridge University Press, new York, pp. 97-118.
Scheerens, J. (guest editor) (2001), “school effectiveness in developing countries”, special issue of School Effectiveness and School Improvement, vol. 12, no. 4, pp. 353-466.
Scheerens, J. (2008), “review and meta-analyses of school and teaching effectiveness”. Bundesministerium für Bildung und forschung (BmBf), Berlin.
Scheerens, J. and R.J. Bosker (1997), The Foundations of Educational Effectiveness, Pergamon, oxford.
Seidel, T. and R.J. Shavelson (2007), “Teaching effectiveness research in the Past decade: The role of Theory and research design in disentangling meta-analysis results”, Review of Educational Research, vol. 77, no. 4, pp. 454-499.
Senge, P.M. (1990), The fifth discipline: The art and practice of the learning organisation, doubleday, new York.
Shayer, M. and M. Adhami (2007), “fostering cognitive development through the context of mathematics: results of the came Project”, Educational Studies in Mathematics, vol. 64, pp. 256-291.
Slavin, R. (1996), education for all, swets and Zeitlinger Publishers, exton, Pa.
Smith, M.S. and M.L. Smith (2009), “research in the policy process”, in g. sykes, B. schneider and d.n. Plank (eds.), handbook of education policy research, routledge, new York.
Staub, F. and E. Stern (2002), “The nature of teacher’s pedagogical content beliefs matters for students’ achievement gains: quasi-experimental evidence from elementary mathematics”, Journal of Educational Psychology, vol. 94, no. 2, pp. 344-355.
Stein, M.K., M.S. Smith and E.A. Silver (1999), “The development of professional developers”, Harvard Educational Review, vol. 69, no. 3, pp. 237-269.
Steinert, B., E. Klieme, K. Maag Merki, P. Döbrich, U. Halbheer and A. Kunz (2006), „lehrerkooperation in der schule. Konzeption, erfassung, ergebnisse“, Zeitschrift für Pädagogik, vol. 52, no. 2, pp. 185-204.
Stigler, J.W. and J. Hiebert (1999), The teaching gap: Best ideas from the world’s teachers for improving education in the classroom, free Press, new York.
Stringfield, S. (1994), “a model of elementary school effects”, in d. reynolds, B.P.m. creemers, P. s. nesselrodt, c. Teddlie, e.c. shaffer and s. stringfield (eds.), advances in school effectiveness research and practice, Pergamon, oxford, pp. 153-187.
Supovitz, J.A., D.P. Mayer and J.B. Kahle (2000), “Promoting inquiry-based instructional practice: The longitudinal impact of professional development in the context of systemic reform”, Educational Policy, vol. 14 no. 3, pp. 331-356.
Supovitz, J.A. and H.M. Turner (2000), “The effects of Professional development on science Teaching Practices and classroom culture”, Journal of Research in Science Teaching, vol. 37, no. 9, pp. 963-980.
Supovitz, J.A. (2002), “developing communities of instructional practice”, Teachers College Record, vol. 104, no. 2, pp. 127-146.
Sykes, G. (1996), “reform of and as professional development”, Phi Delta Kappan, vol. 77, pp. 465-467.
Sykes, G., D. Plank and B. Schneider (eds.) (2009), handbook on educational Policy research. routledge.
Teddlie, C. and D. Reynolds (2001), “countering the critics: responses to recent criticisms of school effectiveness research”, school effectiveness and school improvement, vol. 12, no. 1, pp. 41-82.
Teddlie, C. and S. Stringfield (1993), Schools do make a difference: Lessons learned from a 10-year study on school effects, Teachers college Press, new York.
Timperley, H. et al. (2007). Teacher Professional Learning and Development: Best Evidence Synthesis Iteration [BES]. Wellington, new Zealand: ministry of education. Url: www.educationcounts.govt.nz/goto/BES, retrieved 15 april 2011.
Teaching PracTices and Pedagogical innovaTion: evidence from Talis © OECD 2012
Teachers’ Professional PracTices ChaptEr 247
Tobias, S. and T.M. Duffy (2009), Constructivist instruction: Success or failure? (1st ed.), routledge, new York.
Tschannen-Moran, M. and A. Woolfolk Hoy (2007), “The differential antecedents of self-efficacy beliefs of novice and experienced teachers”, Teaching and Teacher education, vol. 23, pp. 944-956.
Tytler, R. (2007), ”school innovation in science: a model for supporting school and teacher development”, Research in Science Education, vol. 37, no. 2, pp. 189-216.
Vergari, S. (ed.) (2009), The charter school landscape: Politics, policies, and prospects, University of Pittsburgh Press, Pittsburgh.
Vieluf, S. and E. Klieme (2011), “cross-nationally comparative results on Teachers’ Qualification, Beliefs, and Practices”, in Y. li and g. Kaiser (eds.), Expertise in Mathematics Instruction: An International Perspective. springer: new York, dordrecht, heidelberg, london, pp. 295-326.
Wang, M.C., G.D. Haertel and H.J. Walberg (1993a), “Toward a knowledge base for school learning”, Review of educational research, vol. 63, pp. 249-94.
Wang, M.C., G.D. Haertel and H.J. Walberg (1993b), “What helps students learn?”, educational leadership, vol. 51, no. 4, pp. 74-79.
Wenger, E. (1998), Communities of Practice. Learning as a social system, Systems Thinker, www.open.ac.uk/ldc08/sites/www.open.ac.uk.ldc08/files/Learningasasocialsystem.pdf, retrieved 20 may 2011.
Wilcox-Herzog, A. (2002). is There a link Between Teachers’ Beliefs and Behaviors? Early Education and Development, 13(1), 81-106.
Wood, C.J. (1995), You can’t teach what you don’t know: A summary report on NM-FAME., The University of new mexico, albuquerque, nm.
Zurita, G. and M. Nussbaum (2004), “a constructivist mobile learning environment supported by a wireless handheld network”, Journal of computer assisted learning, vol. 20, no. 4, pp. 235-243.

49
Teaching PracTices and Pedagogical innovaTion: evidence from Talis © OECD 2012
Analysing Teachers’ Professional Practices with TALIS Data
Chapter 3
chapter 3 details the factors that this report studied. drawing on socio-
constructivist approaches to teaching practices and professional learning
communities, discussed in chapter 2, questions drawn from the Talis 2008
teacher and school questionnaires were chosen for further analyses. The main
themes covered by Talis 2008: the teachers’ professional development, the
type of appraisal and feedback they receive, their activities and attitudes,
and schools’ leadership and management styles. The aim was to characterise
the underlying profiles of teaching practices and participation in learning
communities in each of the 23 countries that participated in Talis 2008. for
this purpose, multilevel latent profile analysis was applied.

Teaching PracTices and Pedagogical innovaTion: evidence from Talis© OECD 2012
ChaPtEr 3 analysIng teachers’ ProfessIonal PractIces wIth talIs data
50
Highlights
• This report draws on the first oecd Teaching and learning international survey (Talis), which provides a rich source of international data on teachers and teaching in 23 countries. as a cross-sectional survey, Talis cannot test causal effects, but it allows for cross-cultural comparisons of the prevalence and interrelations of different practices with relevant factors. This report characterises profiles of classroom teaching practices and of participation in professional learning communities in each country and examines their relationships with teacher and school characteristics.
• Profiles of classroom teaching practices are measured with three sets of variables that form three classroom teaching practices scales (structuring, student orientation, and enhanced activities) that include both constructivist and more traditional or direct approaches to instruction.
• Profiles of participation in professional learning communities are measured with variables that represent five central features of this concept – co-operation, shared vision, a focus on learning, reflective inquiry, de-privatisation of practice.

Teaching PracTices and Pedagogical innovaTion: evidence from Talis © OECD 2012
analysIng teachers’ ProfessIonal PractIces wIth talIs data ChaPtEr 351
This report aims to identify profiles of teachers’ professional practices, compare these across education systems and examine their relationships to teacher and school characteristics. it uses data from the oecd survey Talis. The survey was initiated as a response to the oecd’s 2005 review of teacher policy, which identified relevant gaps in international data on teachers and teaching. The data collection provides policy makers with empirical information on the effectiveness and attractiveness of the teaching profession internationally. To this end, a programme of surveys was initiated, with successive rounds addressing different policy foci chosen by the participating countries.
This report is based on the first Talis cycle, Talis 2008. This round examined nationally representative samples of teachers and principals in 23 countries across four continents1. The main themes were the professional development that teachers undertake; the nature and form of appraisal that teachers receive; teachers’ self-reported practices, activities, beliefs and attitudes; and schools’ leadership and management (see oecd, 2009; 2010a). This report focuses on teachers’ self-reported professional practices and relates them to other input and process characteristics covered by Talis. data were collected from questionnaires with likert-type response scales and very few open questions.
The Talis design has implications for how the results are interpreted. first of all, a questionnaire can only ask about practices that are well-known – at least to the experts designing the study. Thus, Talis cannot discover innovations in education. rather, it can serve for an implementation check in countries where educational policy has recently advocated the use of teachers’ professional practices included in the questionnaire. secondly, Talis is a cross-sectional survey and can therefore not test causal effects. however, Talis does provide rich descriptive data for a large sample of 23 education systems. This allows for cross-cultural comparisons of the prevalence and interrelations of different practices with third variables, even though the level of comparability will depend on the degree of equivalence of professional profiles.
With regard to the selection of variables within the main Talis themes, we build on two positions: a normative and an empirical stance. chapter 2 concluded that socio-constructivist approaches gained importance towards the end of the 20th century, and practices in accordance with this theoretical approach are the best candidates for ensuring innovation in education. socio-constructivism suggests the use of diverse and cognitively challenging tasks for collaborative learning, both in student instruction and teacher professional development.
teaching practices in talis 2008in Talis, several items and scales address teaching practices that are in accordance with socio-constructivist theories. for example, the scale of classroom teaching practices -- student orientation includes items that tap the issue of self-directed learning (“i ask my students to suggest or to help plan classroom activities or topics”), self-regulated learning (“students evaluate and reflect upon their own work”), co-operative and problem-based learning (“students work in small groups to come up with a joint solution to a problem or task”) and adaptive instruction (“i give different work to the students that have difficulties learning and/or to those who can advance faster” and “students work in groups based upon their abilities”). items in the scale classroom teaching practices – enhanced activities further address independent group discussions (“students hold a debate and argue for a particular point of view which may not be

Teaching PracTices and Pedagogical innovaTion: evidence from Talis© OECD 2012
ChaPtEr 3 analysIng teachers’ ProfessIonal PractIces wIth talIs data
52
their own”) as well as project-based learning (“students work on projects that require at least one week to complete” and “students make a product that will be used by someone else”).
for an empirically based selection of innovative classroom teaching practices, the report further draws on research in educational effectiveness summarised by Klieme, Pauli and reusser (2009). They defined three “basic dimensions of instructional quality”: (a) clear, well-structured classroom management, (b) a supportive, student-oriented classroom climate, and (c) cognitive activation with challenging content. The three classroom teaching practices scales – structuring, student orientation, and enhanced activities – also reflect these dimensions. The structuring scale describes strategies that clarify the structure of a unit or lesson and its ultimate goals, as well as test whether all students have understood the content and performed their tasks. The student orientation scale concerns group work and adaptive instruction, but also student participation in classroom planning. Both dimensions ask for practices that involve close interaction of the teacher with the whole class, small groups or individual students. This is not the case for the enhanced activities scale. This scale, rather, summarises practices that give students the chance to work independently over a longer period of time. These practices are in accordance with principles of self-directed learning. at the same time they are instrumental in instructing large groups, where it becomes difficult to be in constant close interaction with individual students or small groups.
Thus, the student orientation and enhanced activities scales include both socio-constructivist and more traditional practices. from a theoretical normative point of view, the structuring scale is less innovative. nevertheless, empirical research shows that structuring is no less important for producing educational outcomes than student orientation and enhanced activities. in fact, research suggests that good instruction combines all three aspects.
professional learning communities in talis 2008in addition to classroom practices, the literature on teachers and teaching has also extensively discussed the concept of professional learning communities. Their valuation is mainly based on organisational theory and socio-constructivist ideas. empirical research has also supported their relevance for improving teaching and learning. central features of professional learning communities are (a) co-operation, (b) shared vision, (c) a focus on learning, (d) reflective inquiry and (e) de-privatisation of practice (see chapter 2 of this report). These are reflected in several items in the “co-operation among staff” section of the Talis 2008 teacher questionnaire, as follows:
• for “co-operation”, two items ask for co-operative hands-on activities: “exchange teaching materials with colleagues” and “Teach jointly as a team in the same class”. in many schools, the latter is expected to be less common than the former.
• for “shared vision”, the item “attend staff meetings to discuss the vision and mission of the school” was chosen as one important strategy.
• for “a focus on learning”, the item “ensure common standards in evaluations for assessing student progress” was chosen because a focus on learning also implicates regular verification of whether the aim that all students learn has been achieved.
• for “reflective inquiry”, the item “Take part in professional learning activities (e.g. team supervision)” was considered one important setting where reflection of past practices can take place and strategies for improvement are developed.

Teaching PracTices and Pedagogical innovaTion: evidence from Talis © OECD 2012
analysIng teachers’ ProfessIonal PractIces wIth talIs data ChaPtEr 353
• finally, for “de-privatisation of practice”, the item “observe other teachers’ classes and provide feedback” was chosen. Participating in professional learning activities within the school, teaching jointly as a team, observing other teachers and giving feedback all directly aim at improving instruction, and they are forms of professional learning that – to a certain degree – reduce teachers’ autonomy and isolation. Thus, they best tap the core idea of professional learning communities, and they can be expected to be least common, at least in Western europe.
This report describes profiles of these innovative practices and compares them across countries. moreover, it aims to predict profile membership using teacher and school characteristics and processes that research has shown to be related to teaching practices and the development of professional learning communities.
The literature review in chapter 2 suggests associations of classroom teaching practices with school leadership and co-operation among staff at the school level, and with school-external professional development, feedback and appraisal, as well as teacher self-efficacy beliefs at the individual teacher level. results are inconclusive on beliefs about the nature of teaching and learning. The development of professional learning communities is correlated with school size, autonomy, and management, as well as feedback at the school level.
other relevant variaBles in talis 2008all of these variables are used as predictors in regression models with both types of practices as independent variables. The former group of variables is expected to be more closely associated with classroom teaching practices, and the latter is expected to better predict professional learning in communities. in addition, the following are used as control variables at the teacher level: teachers’ gender, the subject they teach, their highest level of education and their professional experience. at the school level, the school composition is used for similar purposes. as both types of professional practices are likely to require additional time for preparation and co-operation, it seemed appropriate also to include the average hours of work.
To take into account cross-national differences in educational processes and their effectiveness, all analyses are made within countries. similarly, correlations and multivariate relationships of practices with beliefs, professional background and other conditioning variables (see previous chapter) are examined within countries, and the results then compared to identify cross-national similarities and differences. an overall model for all countries is built only if profiles prove to be equivalent across countries.
The measures used and the analysis techniques employed are described in more detail in the following section.
measuresitems and scales used in latent profile analysis Classroom teaching practices: in Talis, classroom teaching practices were measured with 13 items that formed three scales: classroom teaching practice: structuring (TPsTrUc) consisting of five items; classroom teaching practice: student orientation (TPsTUd) consisting

Teaching PracTices and Pedagogical innovaTion: evidence from Talis© OECD 2012
ChaPtEr 3 analysIng teachers’ ProfessIonal PractIces wIth talIs data
54
of four items; and classroom teaching practice: enhanced activities (TPacTiv), also consisting of four items. items are shown in Table 3.1. response categories were:
• never or hardly ever
• in about one-quarter of lessons
• in about one-half of lessons• in about three-quarters of lessons• in almost every lesson
Table 3.1Items wording of classroom teaching practices items and dimensions
Classroom teaching practice
how often do each of the following activities happen in this target class throughout the school year?
Variable name Item wording
Structuring BTG42B i explicitly state learning goals.
BTG30C i review with the students the homework they have prepared.
BTG42H at the beginning of the lesson i present a short summary of the previous lesson.
BTG42I i check my students’ exercise books.
BTG42M i check, by asking questions, whether or not the subject matter has been understood.
Student orientation
BTG42D students work in small groups to come up with a joint solution to a problem or task.
BTG42E i give different work to the students that have difficulties learning and/or to those who can advance faster.
BTG42F i ask my students to suggest or to help plan classroom activities or topics.
BTG42N students work in groups based upon their abilities.
Enhanced activities
BTG42J students work on projects that require at least one week to complete.
BTG42O students make a product that will be used by someone else.
BTG42Q i ask my students to write an essay in which they are expected to explain their thinking or reasoning at some length.
BTG42S students hold a debate and argue for a particular point of view which may not be their own.
These scales have a good reliability for the total sample (structuring: a = .73, student orientation: a = .70, and enhanced activities; a = .72), and also for each of the participating countries. here, cronbach’s alpha varies between .50 and .84 for all three scales. factor scores were computed with the programme mplus. (for more detailed information, see oecd, 2010a.) This report uses these factor scores as the basis for latent profile analysis.
Professional learning communities: six items from Talis were selected to operationalise Professional learning communities. These are shown in Table 3.2. all items were answered on six-point ordinal scales. response categories were:
• never
• less than once per year
• once per year
• 3-4 times per year
• monthly
• weekly

Teaching PracTices and Pedagogical innovaTion: evidence from Talis © OECD 2012
analysIng teachers’ ProfessIonal PractIces wIth talIs data ChaPtEr 355
items and scales used as independent variaBles in multilevel latent profile regression analysis a number of Talis items, indictors and scales were used as independent variables in the multilevel latent profile analysis.
single itemsnine items from the teacher questionnaire and one from the school questionnaire were used as predictors of profile membership. all of these were recoded before they were used in multilevel regression analysis. all teacher-level items were re-coded to be dichotomous with the labels “1” and “0”. in regression analysis, the category with the label “1” is always compared with the category with the label “0”. if, for example females are labelled “1”, then a positive regression coefficient suggests that women are more likely to have a certain characteristic than males, while a negative coefficient suggest the opposite. at the school level, we computed percentages of teachers. here, a higher score means that more teachers within a school agree with a certain statement or have a certain characteristic. a more detailed description of the coding is presented below.
gender: The teacher questionnaire asked teachers about their gender. gender was coded as “1” for females and “0” for males.
level of education: another question concerned the highest level of education a teacher has reached. isced level 5a master degree or isced level 6 were coded as “1” and isced level 5a Bachelor degree or below were coded as “0”.
subject taught in target class: Teachers were asked which subjects they teach in isced level 2 and which subject they teach in a specific “target class”. in many countries teachers teach more than one subject. The “target class” is the class teachers were instructed to have in mind when they were describing their classroom teaching practices2. Based on the responses, three “dummy” variables were computed:
• Teaching mathematics was coded “1” for mathematics and “0” for all other subjects.
• Teaching reading was coded “1” for reading and “0” for all other subjects.
• Teaching “other” was coded “1” for all subjects except for mathematics, reading and science and “0” for mathematics, reading and science.
Table 3.2Item wording of professional learning communities items and dimensions
Dimension
how often do you do the following in this school?Variable name Item wording
Shared vision BTG30A attend staff meetings to discuss the vision and mission of the school.
Focus on learning BTG30F Ensure common standards in evaluations for assessing student progress.
Reflection BTG30I Take part in professional learning activities (e.g. team supervision).
De-privatisation of practice
BTG30J observe other teachers’ classes and provide feedback.
Collaborative activities
BTG30D exchange teaching materials with colleagues.
BTG30H Teach jointly as a team in the same class.

Teaching PracTices and Pedagogical innovaTion: evidence from Talis© OECD 2012
ChaPtEr 3 analysIng teachers’ ProfessIonal PractIces wIth talIs data
56
When all variables are entered at once in the regression analysis, the three subject groups are compared with a group that teaches science in the target class.
novice status: another question asked how long respondents had been working as a teacher. response categories were:
• This is my first year
• 1-2 years
• 3-5 years
• 6-10 years
• 11-15 years
• 16-20 years
• more than 20 years
for the regression analysis, teachers with up to five years of experience were coded as “1” and those with longer experience were coded as “0”.
Professional development: Teachers were also asked, “during the last 18 months, did you participate in any of the following kinds of professional development activities, and what was the impact of these activities on your development as a teacher?” items were (a) courses/workshops (e.g. on subject matter or methods and/or other education-related topics), (b) education conferences or seminars (where teachers and/or researchers present their research results and discuss educational problems), (c) Qualification programme (e.g. a degree programme), (d) observation visits to other schools, (e) Participation in a network of teachers formed specifically for the professional development of teachers, (f) individual or collaborative research on a topic of interest to you professionally and (g) mentoring and/or peer observation and coaching, as part of a formal school arrangement. response categories were “yes” or “no”.
The index “participating in co-operative learning arrangements for professional development” is the standardised sum of (d), (e), and (g). The index “attending professional development workshops and seminars” is the standardised sum of (a) and (b).
receiving feedback and appraisal for innovative teaching: Teachers reported whether and how often they receive appraisal from the school principal, from other teachers and from external individuals or groups. moreover, they were asked which themes have been considered in their feedback and appraisal. Both aspects were combined into one variable. Teachers who reported that innovative teaching practices had been considered in their feedback were coded as “1” and those who either reported that innovative teaching practices had not been considered or who had not received any appraisal were coded as “0”.
school size: This index is based on an item in the school questionnaire that asked principals how many teachers, personnel for pedagogical support and school administrative or management personnel work in their school. for this report we computed the z-standardised number of teachers working in the school.
average hours of work: The hours of work for every teacher was calculated by adding the time he or she reported to spend on teaching, planning, administrative duties and other tasks each

Teaching PracTices and Pedagogical innovaTion: evidence from Talis © OECD 2012
analysIng teachers’ ProfessIonal PractIces wIth talIs data ChaPtEr 357
week. The school mean for hours of work was then calculated by using a school-level aggregate of the sum of items. These aggregate scores were calculated using final teacher weights.
Percentage of teachers reporting feedback and appraisal for innovative teaching: The percentage of teachers in a school who got the code “1”: innovative teaching practices were considered in feedback and appraisal” for the variable “receiving feedback and appraisal for innovative teaching” was calculated. These percentages were calculated using final teacher weights.
indices and scales a further number of indexes and scales included in the public Talis database were used. These variables were kept as they were, but they were z-standardised before being included in regression models. for more detailed information on the wording of the items and the psychometric quality of the scales, see oecd (2010a).
Constructivist beliefs about the nature of teaching and learning: The scale was measured with four items in the teacher questionnaire, e.g. “my role as a teacher is to facilitate students’ own inquiry”. response categories were:
• strongly agree
• agree
• disagree
• strongly disagree
The scale has an acceptable reliability across participating countries (a = .44 to a = .72).
teacher self-efficacy: four items in the teacher questionnaire were further used to measure teacher self-efficacy with response categories:
• strongly agree
• agree
• disagree
• strongly disagree
less than 1% of the teachers used the response category “strongly disagree”. Therefore “disagree” and “strongly disagree” were collapsed. an exemplary item is: “if i try really hard, i can make progress with even the most difficult and unmotivated students.” With cronbach’s alpha between a = .65 and a = .82, the scale has a satisfactory reliability across all 23 countries participating in Talis.
Educational level of the students’ parents: This index is based on teachers’ report on the percentage of students in the target class who have at least one parent/guardian who has completed isced level 5 or higher. The school-level index was calculated as the mean of the values reported by teachers for that school.
school autonomy in curriculum: This index is based on a question asking the school principal to indicate who, among a range of stakeholders, had considerable responsibility in the decision making for several specific tasks. Tasks relevant for this indicator are choosing which textbooks

Teaching PracTices and Pedagogical innovaTion: evidence from Talis© OECD 2012
ChaPtEr 3 analysIng teachers’ ProfessIonal PractIces wIth talIs data
58
are used, determining course content and deciding which courses are offered. The extent of school-level autonomy was determined by calculating for how many of the tasks considerable responsibility lay either with the principal, the teachers or the school governing board as opposed to other authorities.
school autonomy in hiring teachers and determining salaries: This index is based on a question asking the principal to indicate who, among a range of stakeholders, had considerable responsibility in the decision making for several specific tasks. Tasks relevant for this indicator are selecting teachers for hire, firing teachers, establishing starting salaries, determining salary increases and allocating funds for teachers’ professional development. The extent of school-level autonomy was determined by calculating the number of tasks that were the main responsibility of either the principal, or the teachers or the school governing board, versus other authorities.
administrative leadership style: The administrative leadership index was defined as the combination of the two remaining school management indices: i) accountability role of the principal and ii) Bureaucratic rule-following. Together, these indices relate to administrative tasks, the enforcement of rules and procedures, and accountability role of the school principal. The composite score was built by taking a simple average of the two component management indices. These were measured with nine items. response categories were:
• strongly agree
• agree
• disagree
• strongly disagree
The two scales show an acceptable reliability across participating countries (accountability role: a = .47 to a = .71; Bureaucratic rule-following: a = .39 to a = .79).
Instructional leadership style: The instructional leadership scale was computed as the average of three first-order scales: i) framing and communicating the school’s goals and curricular development; ii) Promoting instructional improvements and professional development; and iii) supervising the instruction in the school.
The composite score was built by taking a simple average of the three component management indices. These were measured with 14 items. The items belong to two different questions. response categories were either “strongly agree”, “agree”, “disagree” and “strongly disagree” or “never”, “seldom”, “quite often”, and “very often”.
The three scales show an acceptable reliability across participating countries (framing and communicating the school’s goals: a = .63 to a = .83; Promoting instructional improvements: a = .46 to a = .80, and supervising instruction: a = .40 to a = .76).
participantsTalis 2008 examined 23 education systems: australia, austria, Belgium (fl.),3 Brazil, Bulgaria, denmark, estonia, hungary, iceland, ireland, italy, Korea, lithuania, malaysia, malta, mexico, norway, Poland, Portugal, the slovak republic, slovenia, spain and Turkey. all together, 73 100 teachers in 4 362 schools filled out the questionnaires. The samples are representative for the
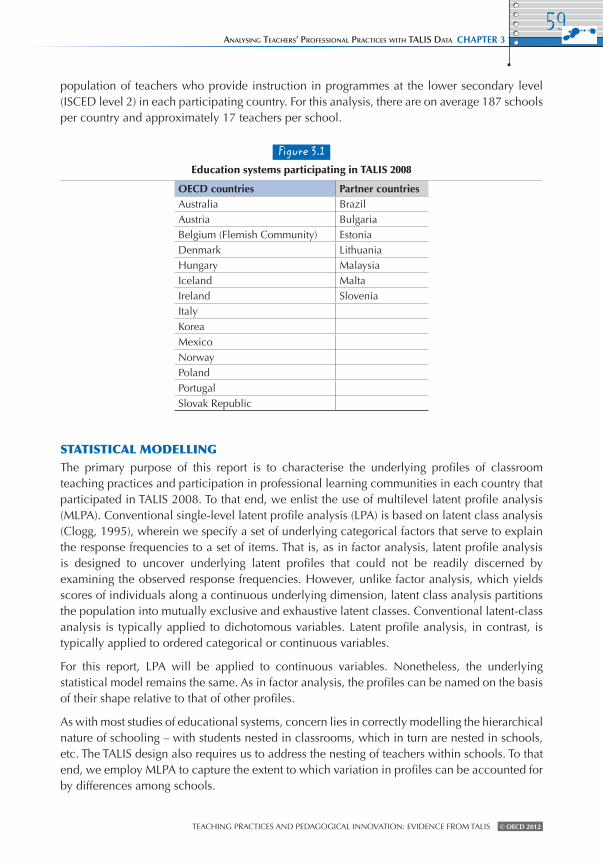
Teaching PracTices and Pedagogical innovaTion: evidence from Talis © OECD 2012
analysIng teachers’ ProfessIonal PractIces wIth talIs data ChaPtEr 359
population of teachers who provide instruction in programmes at the lower secondary level (isced level 2) in each participating country. for this analysis, there are on average 187 schools per country and approximately 17 teachers per school.
Figure 3.1Education systems participating in TAlIs 2008
OECD countries Partner countriesaustralia Brazilaustria BulgariaBelgium (flemish community) estoniadenmark lithuaniahungary malaysiaiceland maltaireland sloveniaitalyKoreamexiconorwayPolandPortugalslovak republic
statistical modellingThe primary purpose of this report is to characterise the underlying profiles of classroom teaching practices and participation in professional learning communities in each country that participated in Talis 2008. To that end, we enlist the use of multilevel latent profile analysis (mlPa). conventional single-level latent profile analysis (lPa) is based on latent class analysis (clogg, 1995), wherein we specify a set of underlying categorical factors that serve to explain the response frequencies to a set of items. That is, as in factor analysis, latent profile analysis is designed to uncover underlying latent profiles that could not be readily discerned by examining the observed response frequencies. however, unlike factor analysis, which yields scores of individuals along a continuous underlying dimension, latent class analysis partitions the population into mutually exclusive and exhaustive latent classes. conventional latent-class analysis is typically applied to dichotomous variables. latent profile analysis, in contrast, is typically applied to ordered categorical or continuous variables.
for this report, lPa will be applied to continuous variables. nonetheless, the underlying statistical model remains the same. as in factor analysis, the profiles can be named on the basis of their shape relative to that of other profiles.
as with most studies of educational systems, concern lies in correctly modelling the hierarchical nature of schooling – with students nested in classrooms, which in turn are nested in schools, etc. The Talis design also requires us to address the nesting of teachers within schools. To that end, we employ mlPa to capture the extent to which variation in profiles can be accounted for by differences among schools.

Teaching PracTices and Pedagogical innovaTion: evidence from Talis© OECD 2012
ChaPtEr 3 analysIng teachers’ ProfessIonal PractIces wIth talIs data
60
lPa and its extension to the multilevel situation also allows for the addition of predictors of class membership at all levels of the hierarchy in question. specifically, once teachers are assigned to a profile, their class assignment becomes an observed categorical variable. The appropriate statistical model for examining predictors of a categorical outcome (in this case, latent profile membership) is multinomial regression (or logistic regression in the case of only two profiles). for this report, we will incorporate predictors at both the teacher and school level to explain profile membership. a technical presentation of lPa and mlPa is given in annex a.
analytic sequencein order to derive and describe the number of profiles of teacher practices and co-operation, a combination of statistical and qualitative criteria was employed.4 a set of statistical criteria was used to aid in determining the number of latent profiles. first, for each country, we extracted 2, 3, 4, 5, and 6 latent profiles taking into account school differences via mlPa. for each additional latent profile, we examined the Bayesian information criterion (Bic; schwarz, 1978). The Bic is a measure of predictive efficacy of a model. That is, among a set of competing models, the one with the lowest Bic is to be preferred from a predictive point of view.
in addition to the Bic, another measure of model adequacy is the “entropy index”. it provides a measure of the extent of latent profile separation (ramaswamy, desarbo, reibstein and robinson, 1993). That is, a goal of lPa is to test whether the data support clearly distinguishable latent profiles. one way to assess this separability is to examine the predicted probabilities of profile membership. The entropy index is a summary measure of the separability of the profiles. The index ranges from 0, representing a complete lack of separation, to 1, representing perfect separation. a technical presentation of the statistical criteria used in this report is given in annex a.
The Bic and the entropy index represent the statistical criteria used in this study. results for each of the countries are shown in annex B. although they are necessary in aiding in the determination of the number of latent profiles, they often cannot be relied on alone to indicate the number of latent profiles, nor do they always help provide substantive interpretation. given that the literature does not provide much guidance on the number or shape of teacher practices or teacher co-operation profiles, we used more qualitative criteria to settle on the number of latent profiles. specifically, the authors of this report independently examined the statistical criteria, as well as plots of profile shapes. each author then submitted her or his judgment based on the statistical criteria, as well as the plots of profile shapes. admittedly, there were disagreements, and these were resolved via discussion. in addition to settling on profile shapes for each country, the authors examined patterns of profile shapes across countries. again, in the case of disagreements about profile shapes, the authors worked together to reach a consensus.
our strategy for determining the number of latent profiles has implications for comparing profiles across countries. Three equivalence aspects are relevant for latent profiles: equivalence in the number of profiles, equivalence of the profile-specific indicator means and equivalence in profile sizes. measurement equivalence requires equivalent numbers of profiles and equivalent profile means. it indicates that the latent profiles are structurally similar, and it is a precondition for comparing profile sizes across countries. concluding that more people are in profile a in

Teaching PracTices and Pedagogical innovaTion: evidence from Talis © OECD 2012
analysIng teachers’ ProfessIonal PractIces wIth talIs data ChaPtEr 361
country 1 than in country 2 makes sense only when the latent profile a is defined in the same way in both countries. When the profile sizes are also equivalent, then it can be concluded that the typological structure is similar (eid, langeheine and diener, 2003).
an important component to the robustness of mlPa concerns the ratio of teachers to schools and the amount of variation among teachers that can be accounted for by schools. a recent paper by Kaplan and Keller (2011) examined the influence of clustering on the Bic and the entropy index. in specific terms, the influence of clustering on the Bic suggests that ignoring clustering results in larger values of Bic, which, in turn, suggests that such a model would not be chosen among a set of competing models. When cluster effects are large, as measured by the intraclass correlation (icc), and cluster sample sizes are small, the absolute difference in Bic is even larger. in terms of the entropy index, we find that the bias in this measure begins to exceed the 10% level for an icc of 0.20 or greater, regardless of sample size or class proportion conditions.
for this report, the school sample size within a country is quite large relative to the number of teachers in the school. moreover, the iccs are relatively small across most of the items used in the latent profile analysis. Therefore, based on the findings of Kaplan and Keller (2011) we believe that the use of mlPa is a fairly conservative approach to examining underlying profiles of teacher practices and participation in professional learning communities. That is, even though there is very little variation in the responses that exist among schools within a country, the method of mlPa is still advised insofar as it will produce more accurate fit statistics and more accurate standard errors.

Teaching PracTices and Pedagogical innovaTion: evidence from Talis© OECD 2012
ChaPtEr 3 analysIng teachers’ ProfessIonal PractIces wIth talIs data
62
notes1. Talis was also conducted in the netherlands, but as the required sampling standards were not achieved, their data are not included in the international comparisons.
2. The target class is defined as the first isced level 2 class that a teacher (typically) teaches in the school where the data collection takes place after 11 a.m. on Tuesdays. The class can occur on a day following Tuesday if the teacher does not teach an isced level 2 class in a relevant subject on Tuesday.
3. from Belgium, only the flemish community participated in Talis 2008.
4. The situation is not different from exploratory factor analysis, where the number of factors can be determined by statistical criteria, but directly choosing the number of factors and naming the factors require subjective and theoretical criteria.
RefeRencesClogg, C.C. (1995), “latent class models”, in g. arminger, c.c. clogg, and m.e. sobel (eds.), Handbook of statistical modeling in the social and behavioral sciences, Jossey-Bass, san francisco, ca, pp. 81-110.
Eid, M., Langeheine R. and E. Diener (2003), “comparing typological structures across cultures by multigroup latent class analysis. a primer”, Journal of Cross-Cultural Psychology, no. 34, pp. 195-210.
Evenson, D.H. and C.E. Hmelo (eds.) (2000), Problem-Based Learning: A Research Perspective on Learning Interactions, lawrence erlbaum associates, london.
Kaplan, D. and B. Keller (2011), “a note on cluster effects in latent class analysis”, Structural Equation Modeling, vol. 18, pp. 525-536.
Klieme, E., C. Pauli and K. Reusser (2009), “The Pythagoras study”, in J. Tomás and T. seidel (eds.), The Power of Video Studies in Investigating Teaching and Learning in the Classroom, Waxmann, münster, pp. 137-160.
OECD (2010a), TALIS Technical Report, oecd Publishing.
Ramaswamy, VS., W.S. Desarbo, D.J. Reibstein and W.T. Robinson (1993), “an empirical pooling approach for estimating marketing mix elasticities with pims data”, Marketing Science, vol. 12, pp. 103-124.
Schwarz, G. (1978), “estimating the dimension of a model”, The Annals of Statistics, vol. 6, pp. 461-464.
63
Teaching PracTices and Pedagogical innovaTion: evidence from Talis © OECD 2012
Profiles of Teachers’ Professional Practices
Chapter 4
chapter 4 provides country-specific results for classroom teaching practices.
specifically, scales are developed and compared for structuring activities,
student orientation and enhanced activities. at the teacher level, some
relevant variables are the level of education, participation in professional
development, gender, subject matter taught, and beliefs about teaching and
learning. at the school level, variables include school size, average hours
of work, autonomy in curriculum and in hiring, parents’ educational level,
administrative and academic leadership style and percentage of teachers
reporting appraisal for innovative teaching.

Teaching PracTices and Pedagogical innovaTion: evidence from Talis© OECD 2012
ChaPtEr 4 ProfIles of teachers’ ProfessIonal PractIces
64
Highlights
• in each country, three main profiles of classroom teaching practices emerged: one in which teachers make high use all three types of teaching practices, one in which teachers make much less use of all three types of practices, and one in which teachers are in between. across countries, a set of general patterns of profiles emerged.
• Teachers in Belgium (fl.), ireland, italy and malta show relatively high uses of structuring teaching practices, compared with student orientation practices and enhanced activities.
• Teachers in australia, estonia and Portugal use the three types of classroom teaching practices approximately to the same extent.
• Teachers in austria, Bulgaria, hungary, lithuania, Poland, the slovak republic and slovenia, show a preference for using practices with a student orientation over the other two types of teaching practices.
• in malaysia and Turkey, teachers show a preference for enhanced activities, with about an equal focus on student orientation and enhanced activities.
• in Brazil, denmark, iceland, mexico, Korea, norway and spain, teachers use enhanced activities relatively more frequently in the classroom.
• Participation in professional development activities and receiving appraisal and feedback for innovative teaching is related to a wider use of classroom teaching practices.

Teaching PracTices and Pedagogical innovaTion: evidence from Talis © OECD 2012
ProfIles of teachers’ ProfessIonal PractIces ChaPtEr 465
latent profiles of classroom teaching practices
on the basis of the statistical and subjective criteria, we determined that three latent profiles were common across the participating countries. moreover, across the participating countries a set of general profile patterns emerged. The latent profiles for each country are shown in figures 4.1 to 4.5.
To aid in the interpretation of the profiles, consider the results of Belgium (fl.) in figure 4.1. The horizontal axis lists the scales used in the multilevel latent profile analysis; namely, structuring, student orientation and enhanced activities. The vertical axis gives the profile factor score means. The mlPa extracted three profile shapes that were optimal with respect to the Bic and the entropy index. at the top of the figure, we note that the mlPa assigned approximately 69% of the sample to Profile a, 26% of the sample to Profile B and 5% of the sample to Profile c. in examining the shapes themselves, we note that the profiles do not cross, and thus the major differences among these profile shapes are in level. specifically, Profiles a, B and c are all relatively high on structuring, and more spread apart on student orientation and enhanced activities. nevertheless, the relative rankings of the profiles remain the same.
an inspection of the latent profiles suggests some general patterns across most countries. specifically, we find that the profiles for Belgium (fl.), ireland, italy and malta exhibit relatively high levels of structuring, compared with student orientation and enhanced activities. in australia, estonia and Portugal the means for all three scales are about the same. We further find that austria, Bulgaria, hungary, lithuania, Poland, the slovak republic and slovenia, show higher levels of student orientation. malaysia and Turkey show relatively high levels of enhanced activities, with about an equal focus on student orientation and enhanced activities.
country-specific results: classroom teaching practices
annex c shows the results of the multilevel latent profiles for teaching practices. given the large volume of results, we present only the statistically significant ones associated with policy-malleable variables. at the teacher level, these include level of education, participation in co-operative learning arrangements for professional development, attending professional development workshops and seminars, and receiving feedback and appraisal for innovative teaching. control variables include gender, subject matter taught in the target profile (math vs. science and “other” vs. science), holding constructivist beliefs about the nature of teaching and learning, and teacher self-efficacy.
at the school level, policy-malleable variables include school size, average hours of work, autonomy in curriculum, and autonomy in hiring teachers and determining salaries. control variables at the school level include educational level of the students’ parents, administrative leadership style, instructional leadership style, and percentage of teachers reporting feedback and appraisal for innovative teaching.
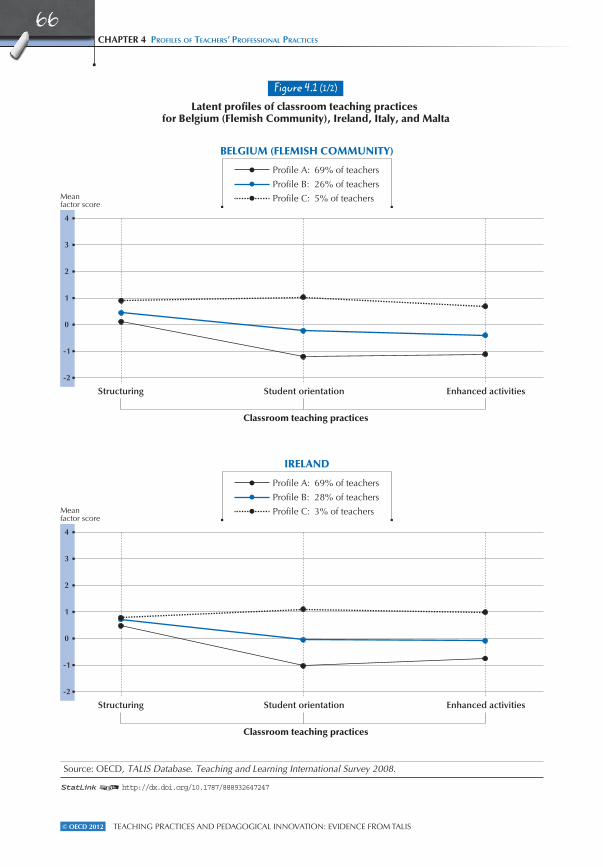
Teaching PracTices and Pedagogical innovaTion: evidence from Talis© OECD 2012
ChaPtEr 4 ProfIles of teachers’ ProfessIonal PractIces
66
Structuring Student orientation Enhanced activities
Classroom teaching practices
Mean factor score
4
3
2
1
0
-1
-2
Structuring Student orientation Enhanced activities
Figure 4.1 (1/2)
Latent profiles of classroom teaching practices for Belgium (Flemish Community), Ireland, Italy, and Malta
Classroom teaching practices
Mean factor score
Source: OECD, TALIS Database. Teaching and Learning International Survey 2008.
4
3
2
1
0
-1
-2
IRELAND
Profile A: 69% of teachers
Profile B: 28% of teachers
Profile C: 3% of teachers
BELGIUM (FLEMISH COMMUNITY)
Profile A: 69% of teachers
Profile B: 26% of teachers
Profile C: 5% of teachers
1 2 http://dx.doi.org/10.1787/888932647247

Teaching PracTices and Pedagogical innovaTion: evidence from Talis © OECD 2012
ProfIles of teachers’ ProfessIonal PractIces ChaPtEr 467
1 2 http://dx.doi.org/10.1787/888932647247
Structuring Student orientation Enhanced activities
Classroom teaching practices
Mean factor score
4
3
2
1
0
-1
-2
Structuring Student orientation Enhanced activities
Figure 4.1 (2/2)
Latent profiles of classroom teaching practices for Belgium (Flemish Community), Ireland, Italy, and Malta
Classroom teaching practices
Mean factor score
Source: OECD, TALIS Database. Teaching and Learning International Survey 2008.
4
3
2
1
0
-1
-2
MALTA
Profile A: 64% of teachers
Profile B: 28% of teachers
Profile C: 8% of teachers
ITALY
Profile A: 46% of teachers
Profile B: 41% of teachers
Profile C: 13% of teachers
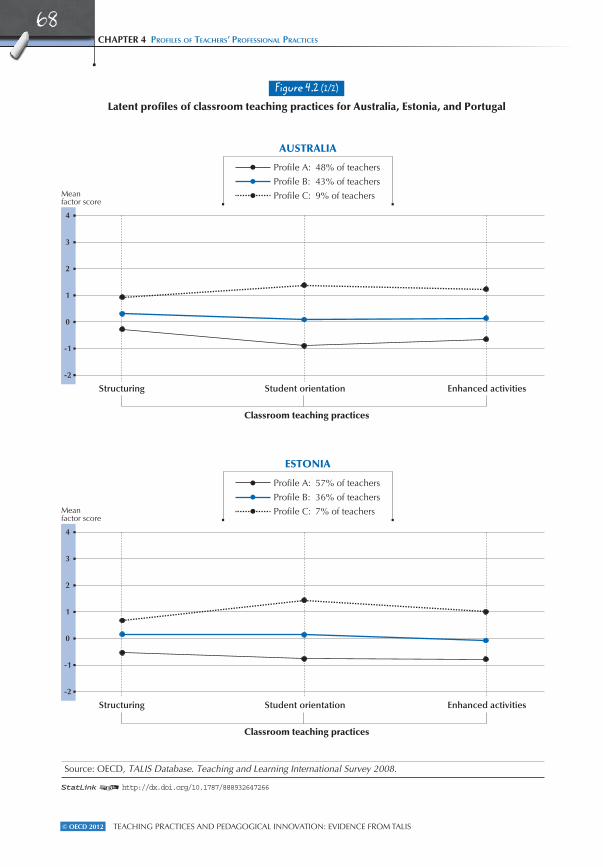
Teaching PracTices and Pedagogical innovaTion: evidence from Talis© OECD 2012
ChaPtEr 4 ProfIles of teachers’ ProfessIonal PractIces
68
Structuring Student orientation Enhanced activities
Classroom teaching practices
Mean factor score
4
3
2
1
0
-1
-2
Structuring Student orientation Enhanced activities
Figure 4.2 (1/2)
Latent profiles of classroom teaching practices for Australia, Estonia, and Portugal
Classroom teaching practices
Mean factor score
4
3
2
1
0
-1
-2
ESTONIA
Profile A: 57% of teachers
Profile B: 36% of teachers
Profile C: 7% of teachers
AUSTRALIA
Profile A: 48% of teachers
Profile B: 43% of teachers
Profile C: 9% of teachers
Source: OECD, TALIS Database. Teaching and Learning International Survey 2008.
1 2 http://dx.doi.org/10.1787/888932647266

Teaching PracTices and Pedagogical innovaTion: evidence from Talis © OECD 2012
ProfIles of teachers’ ProfessIonal PractIces ChaPtEr 469
1 2 http://dx.doi.org/10.1787/888932647266
Structuring Student orientation Enhanced activities
Figure 4.2 (2/2)
Latent profiles of classroom teaching practices for Australia, Estonia, and Portugal
Classroom teaching practices
Mean factor score
4
3
2
1
0
-1
-2
PORTUGAL
Profile A: 36% of teachers
Profile B: 54% of teachers
Profile C: 10% of teachers
Source: OECD, TALIS Database. Teaching and Learning International Survey 2008.

Teaching PracTices and Pedagogical innovaTion: evidence from Talis© OECD 2012
ChaPtEr 4 ProfIles of teachers’ ProfessIonal PractIces
70
Structuring Student orientation Enhanced activities
Classroom teaching practices
Mean factor score
4
3
2
1
0
-1
-2
Structuring Student orientation Enhanced activities
Figure 4.3 (1/4)
Latent profiles of classroom teaching practices for Austria, Bulgaria, Hungary, Lithuania, Poland, the Slovak Republic, and Slovenia
Classroom teaching practices
Mean factor score
4
3
2
1
0
-1
-2
BULGARIA
Profile A: 46% of teachers
Profile B: 42% of teachers
Profile C: 13% of teachers
AUSTRIA
Profile A: 57% of teachers
Profile B: 34% of teachers
Profile C: 9% of teachers
Source: OECD, TALIS Database. Teaching and Learning International Survey 2008.
1 2 http://dx.doi.org/10.1787/888932647285

Teaching PracTices and Pedagogical innovaTion: evidence from Talis © OECD 2012
ProfIles of teachers’ ProfessIonal PractIces ChaPtEr 471
1 2 http://dx.doi.org/10.1787/888932647285
Structuring Student orientation Enhanced activities
Classroom teaching practices
Mean factor score
4
3
2
1
0
-1
-2
Structuring Student orientation Enhanced activities
Figure 4.3 (2/4)
Latent profiles of classroom teaching practices for Austria, Bulgaria, Hungary, Lithuania, Poland, the Slovak Republic, and Slovenia
Classroom teaching practices
Mean factor score
4
3
2
1
0
-1
-2
LITHUANIA
Profile A: 45% of teachers
Profile B: 44% of teachers
Profile C: 11% of teachers
HUNGARY
Profile A: 55% of teachers
Profile B: 37% of teachers
Profile C: 8% of teachers
Source: OECD, TALIS Database. Teaching and Learning International Survey 2008.

Teaching PracTices and Pedagogical innovaTion: evidence from Talis© OECD 2012
ChaPtEr 4 ProfIles of teachers’ ProfessIonal PractIces
72
Structuring Student orientation Enhanced activities
Classroom teaching practices
Mean factor score
4
3
2
1
0
-1
-2
Structuring Student orientation Enhanced activities
Figure 4.3 (3/4)
Latent profiles of classroom teaching practices for Austria, Bulgaria, Hungary, Lithuania, Poland, the Slovak Republic, and Slovenia
Classroom teaching practices
Mean factor score
4
3
2
1
0
-1
-2
SLOVAK REPUBLIC
Profile A: 54% of teachers
Profile B: 38% of teachers
Profile C: 8% of teachers
POLAND
Profile A: 37% of teachers
Profile B: 50% of teachers
Profile C: 14% of teachers
Source: OECD, TALIS Database. Teaching and Learning International Survey 2008.
1 2 http://dx.doi.org/10.1787/888932647285

Teaching PracTices and Pedagogical innovaTion: evidence from Talis © OECD 2012
ProfIles of teachers’ ProfessIonal PractIces ChaPtEr 473
1 2 http://dx.doi.org/10.1787/888932647285
Structuring Student orientation Enhanced activities
Figure 4.3 (4/4)
Latent profiles of classroom teaching practices for Austria, Bulgaria, Hungary, Lithuania, Poland, the Slovak Republic, and Slovenia
Classroom teaching practices
Mean factor score
4
3
2
1
0
-1
-2
SLOVENIA
Profile A: 60% of teachers
Profile B: 35% of teachers
Profile C: 5% of teachers
Source: OECD, TALIS Database. Teaching and Learning International Survey 2008.

Teaching PracTices and Pedagogical innovaTion: evidence from Talis© OECD 2012
ChaPtEr 4 ProfIles of teachers’ ProfessIonal PractIces
74
Structuring Student orientation Enhanced activities
Classroom teaching practices
Mean factor score
4
3
2
1
0
-1
-2
Structuring Student orientation Enhanced activities
Figure 4.4Latent profiles of classroom teaching practices for Malaysia and Turkey
Classroom teaching practices
Mean factor score
4
3
2
1
0
-1
-2
TURKEY
Profile A: 40% of teachers
Profile B: 43% of teachers
Profile C: 17% of teachers
MALAYSIA
Profile A: 43% of teachers
Profile B: 42% of teachers
Profile C: 15% of teachers
Source: OECD, TALIS Database. Teaching and Learning International Survey 2008.
1 2 http://dx.doi.org/10.1787/888932647304

Teaching PracTices and Pedagogical innovaTion: evidence from Talis © OECD 2012
ProfIles of teachers’ ProfessIonal PractIces ChaPtEr 475
1 2 http://dx.doi.org/10.1787/888932647323
Structuring Student orientation Enhanced activities
Classroom teaching practices
Mean factor score
4
3
2
1
0
-1
-2
Structuring Student orientation Enhanced activities
Figure 4.5 (1/4)
Latent profiles of classroom teaching practices for Brazil, Denmark, Iceland, Korea, Mexico, Norway and Spain
Classroom teaching practices
Mean factor score
4
3
2
1
0
-1
-2
DENMARK
Profile A: 48% of teachers
Profile B: 41% of teachers
Profile C: 11% of teachers
BRAZIL
Profile A: 37% of teachers
Profile B: 42% of teachers
Profile C: 21% of teachers
Source: OECD, TALIS Database. Teaching and Learning International Survey 2008.

Teaching PracTices and Pedagogical innovaTion: evidence from Talis© OECD 2012
ChaPtEr 4 ProfIles of teachers’ ProfessIonal PractIces
76
Structuring Student orientation Enhanced activities
Classroom teaching practices
Mean factor score
4
3
2
1
0
-1
-2
Structuring Student orientation Enhanced activities
Figure 4.5 (2/4)
Latent profiles of classroom teaching practices for Brazil, Denmark, Iceland, Korea, Mexico, Norway and Spain
Classroom teaching practices
Mean factor score
4
3
2
1
0
-1
-2
KOREA
Profile A: 65% of teachers
Profile B: 27% of teachers
Profile C: 7% of teachers
ICELAND
Profile A: 45% of teachers
Profile B: 46% of teachers
Profile C: 9% of teachers
Source: OECD, TALIS Database. Teaching and Learning International Survey 2008.
1 2 http://dx.doi.org/10.1787/888932647323

Teaching PracTices and Pedagogical innovaTion: evidence from Talis © OECD 2012
ProfIles of teachers’ ProfessIonal PractIces ChaPtEr 477
1 2 http://dx.doi.org/x10.1787/888932647323
Structuring Student orientation Enhanced activities
Classroom teaching practices
Mean factor score
4
3
2
1
0
-1
-2
Structuring Student orientation Enhanced activities
Figure 4.5 (3/4)
Latent profiles of classroom teaching practices for Brazil, Denmark, Iceland, Korea, Mexico, Norway and Spain
Classroom teaching practices
Mean factor score
4
3
2
1
0
-1
-2
NORWAY
Profile A: 45% of teachers
Profile B: 43% of teachers
Profile C: 13% of teachers
MEXICO
Profile A: 34% of teachers
Profile B: 44% of teachers
Profile C: 23% of teachers
Source: OECD, TALIS Database. Teaching and Learning International Survey 2008.

Teaching PracTices and Pedagogical innovaTion: evidence from Talis© OECD 2012
ChaPtEr 4 ProfIles of teachers’ ProfessIonal PractIces
78
1 2 http://dx.doi.org/10.1787/888932647323
Structuring Student orientation Enhanced activities
Figure 4.5 (4/4)
Latent profiles of classroom teaching practices for Brazil, Denmark, Iceland, Korea, Mexico, Norway and Spain
Classroom teaching practices
Mean factor score
4
3
2
1
0
-1
-2
SPAIN
Profile A: 60% of teachers
Profile B: 33% of teachers
Profile C: 7% of teachers
Source: OECD, TALIS Database. Teaching and Learning International Survey 2008.

Teaching PracTices and Pedagogical innovaTion: evidence from Talis © OECD 2012
ProfIles of teachers’ ProfessIonal PractIces ChaPtEr 479
australia
at the teacher level, teachers participating in co-operative learning arrangements for professional development are 50% more likely to be in Profile B vs. Profile a and 74% more likely to be in Profile c vs. Profile a. Teachers who receive feedback and appraisal for innovative teaching are 75% more likely to be in Profile B vs. Profile a.
at the school level, large schools are associated with the greater average odds of being in Profiles B and c vs. a.
austria
at the teacher level, teachers participating in co-operative learning arrangements for professional development are 30% more likely to be in Profile B vs. Profile a and 47% more likely to be in Profile c vs. Profile a. Teachers who attend professional development workshops and seminars are 14% more likely to be in Profile B vs. Profile a and 34% more likely to be in Profile c vs. Profile a. Teachers receiving feedback and appraisal for innovative teaching are 68% more likely to be in Profile B vs. Profile a and 96% more likely to be in Profile c vs. Profile a.
at the school level, large schools are associated with greater average log-odds1 of being in Profile B vs. Profile a. schools with greater levels of autonomy in hiring teachers and determining salaries show higher average log-odds of membership in Profile c vs. Profile a. The average hours of work were also found to positively predict membership in Profile B vs. Profile a and positively predict membership in Profile c vs. Profile a. The higher the average working hours of teachers in a school, the more likely a teacher will belong to Profile B or c as opposed to Profile a.
Belgium (flemish community)
at the teacher level, teachers participating in co-operative learning arrangements for professional development are 41% more likely to be in Profile B vs. Profile a and 52% more likely to be in Profile c vs. Profile a. Teachers receiving feedback and appraisal for innovative teaching are 49% more likely to be in Profile B vs. Profile a and 60% more likely to be in Profile c vs. Profile a.
at the school level, large schools are associated with lower average log-odds of being in Profile B vs. Profile a. longer average working hours are associated with greater average log-odds of being in Profile B vs. Profile a.
Bulgaria
at the teacher level, teachers participating in co-operative learning arrangements for professional development are 34% more likely to be in Profile B vs. Profile a and 66% more likely to be in Profile c vs. Profile a. Teachers receiving feedback and appraisal for innovative teaching are 77% more likely to be in Profile B vs. Profile a and almost twice as likely to be in Profile c vs. Profile a.
at the school level, large schools are associated with lower average log-odds of being in Profile c vs. Profile a. greater average working hours are associated with greater average log-odds of membership in Profile B vs. Profile a. schools with greater levels of autonomy in hiring teachers and setting salaries have lower average log-odds of membership in Profile B vs. Profile a.
Teaching PracTices and Pedagogical innovaTion: evidence from Talis© OECD 2012
ChaPtEr 4 ProfIles of teachers’ ProfessIonal PractIces
80
Brazilat the teacher level, teachers participating in co-operative learning arrangements for professional development are 23% more likely to be in Profile B vs. Profile a and 53% more likely to be in Profile c vs. Profile a. Teachers who attend professional development workshops and seminars are 16% more likely to be in Profile B vs. Profile a and 16% more likely to be in Profile c vs. Profile a. Teachers receiving feedback and appraisal for innovative teaching are 87% more likely to be in Profile B vs. Profile a and a little over twice as likely to be in Profile c vs. Profile a.
at the school level, greater average working hours are associated with greater average log-odds of membership in Profile c vs. Profile a.
denmarkat the teacher level, teachers participating in co-operative learning arrangements for professional development are 29% more likely to be in Profile B vs. Profile a. Teachers receiving feedback and appraisal for innovative teaching are 2.2 times more likely to be in Profile c vs. Profile a.
at the school level, none of the policy-malleable variables was found to be statistically significant.
estoniaat the teacher level, teachers participating in co-operative learning arrangements for professional development are 29% more likely to be in Profile B vs. Profile a and 59% more likely to be in Profile c vs. Profile a. Teachers who attend professional development workshops and seminars are 24% more likely to be in Profile B vs. Profile a. Teachers receiving feedback and appraisal for innovative teaching are twice as likely to be in Profile B vs. Profile a and a little more than twice as likely to be in Profile c vs. Profile a.
at the school level, greater average working hours are associated with lower average log-odds of membership in Profiles B and c vs. Profile a.
hungaryat the teacher level, teachers participating in co-operative learning arrangements for professional development are 23% more likely to be in Profile B vs. Profile a and 40% more likely to be in Profile c vs. Profile a. Teachers who attend professional development workshops and seminars are 23% more likely to be in Profile B vs. Profile a and 25% more likely to be in Profile c vs. Profile a. Teachers receiving feedback and appraisal for innovative teaching are almost twice as likely to be in Profile B vs. Profile a and 2.6 times more likely to be in Profile c vs. Profile a.
at the school level, greater average working hours are associated with higher average log-odds of membership in Profiles B and c vs. Profile a.
icelandat the teacher level, teachers receiving feedback and appraisal for innovative teaching are almost twice as likely to be in Profile B vs. Profile a and over 3 times more likely to be in Profile c vs. Profile a.
at the school level, none of the policy-malleable variables was found to be statistically significant.
irelandat the teacher level, teachers attending professional development workshops and seminars are 17% more likely to be in Profile B vs. Profile a. Teachers receiving feedback and appraisal for

Teaching PracTices and Pedagogical innovaTion: evidence from Talis © OECD 2012
Profiles of Teachers’ Professional PracTices ChaptEr 481
innovative teaching are 42% more likely to be in Profile B vs. Profile a and 2.7 times likely to be in Profile c vs. Profile a.
at the school level, schools with greater levels of autonomy in hiring teachers and determining salaries show higher average log-odds of membership in Profile c vs. Profile a.
Italyat the teacher level, teachers participating in co-operative learning arrangements for professional development are 21% more likely to be in Profile B vs. Profile a and 34% more likely to be in Profile c vs. Profile a. Teachers who attend professional development workshops and seminars are 12% more likely to be in Profile B vs. Profile a and 20% more likely to be in Profile c vs. Profile a. Teachers receiving feedback and appraisal for innovative teaching are 31% more likely to be in Profile B vs. Profile a and a little twice as likely to be in Profile c vs. Profile a.
at the school level, none of the policy-malleable variables was found to be statistically significant.
Koreaat the teacher level, teachers participating in co-operative learning arrangements for professional development are 38% more likely to be in Profile B vs. Profile a and 34% more likely to be in Profile c vs. Profile a. Teachers who attend professional development workshops and seminars are 15% more likely to be in Profile B vs. Profile a. Teachers receiving feedback and appraisal for innovative teaching are 70% more likely to be in Profile B vs. Profile a and 63% more likely to be in Profile c vs. Profile a.
at the school level, large schools are associated with lower average log-odds of being in Profiles B and c vs. Profile a.
Lithuaniaat the teacher level, teachers participating in co-operative learning arrangements for professional development are 37% more likely to be in Profile B vs. Profile a and 87% more likely to be in Profile c vs. Profile a. Teachers who attend professional development workshops and seminars are 17% more likely to be in Profile B vs. Profile a. Teachers receiving feedback and appraisal for innovative teaching are 89% more likely to be in Profile B vs. Profile a and 2.2 times more likely to be in Profile c vs. Profile a.
at the school level, schools with greater levels of autonomy in hiring teachers and determining salaries show lower average log-odds of membership in Profile c vs. Profile a.
Maltaat the teacher level, teachers participating in co-operative learning arrangements for professional development are 43% more likely to be in Profile B vs. Profile a and 90% more likely to be in Profile c vs. Profile a. Teachers who attend professional development workshops and seminars are 41% more likely to be in Profile c vs. Profile a. Teachers receiving feedback and appraisal for innovative teaching are 47% more likely to be in Profile B vs. Profile a.
school analyses were not reported because the number of schools was insufficient for analysing the full multilevel model.

Teaching PracTices and Pedagogical innovaTion: evidence from Talis© OECD 2012
ChaPtEr 4 ProfIles of teachers’ ProfessIonal PractIces
82
malaysiaat the teacher level, teachers participating in co-operative learning arrangements for professional development are 21% more likely to be in Profile B vs. Profile a and 37% more likely to be in Profile c vs. Profile a. Teachers who attend professional development workshops and seminars are 32% more likely to be in Profile c vs. Profile a. Teachers receiving feedback and appraisal for innovative teaching are 54% more likely to be in Profile B vs. Profile a and over 3 times more likely to be in Profile c vs. Profile a.
at the school level, none of the policy-malleable variables significantly predicted profile membership.
mexicoat the teacher level, teachers participating in co-operative learning arrangements for professional development are 39% more likely to be in Profile B vs. Profile a and 72% more likely to be in Profile c vs. Profile a. Teachers who attend professional development workshops and seminars are 23% more likely to be in Profile c vs. Profile a. Teachers receiving feedback and appraisal for innovative teaching are 79% more likely to be in Profile B vs. Profile a and 95% more likely to be in Profile c vs. Profile a.
at the school level, large schools are associated with lower average log-odds of being in Profile c vs. Profile a. longer average working hours are associated with greater average log-odds of being in Profile B vs. Profile a.
norwayat the teacher level, teachers participating in co-operative learning arrangements for professional development are 30% more likely to be in Profile c vs. Profile a. Teachers receiving feedback and appraisal for innovative teaching are 67% more likely to be in Profile B vs. Profile a and 97% more likely to be in Profile c vs. Profile a.
at the school level, none of the policy-malleable variables significantly predicted profile membership.
polandat the teacher level, teachers participating in co-operative learning arrangements for professional development are 25% more likely to be in Profile c vs. Profile a. Teachers who attend professional development workshops and seminars are 48% more likely to be in Profile B vs. Profile a and 65% more likely to be in Profile c vs. Profile a. Teachers receiving feedback and appraisal for innovative teaching are 63% more likely to be in Profile B vs. Profile a and 2.5 times more likely to be in Profile c vs. Profile a.
at the school level, large schools are associated with lower average log-odds of being in Profile B vs. Profile a.
portugalat the teacher level, teachers participating in co-operative learning arrangements for professional development are 41% more likely to be in Profile B vs. Profile a and 84% more likely to be in Profile c vs. Profile a. Teachers receiving feedback and appraisal for innovative teaching are 73% more likely to be in Profile B vs. Profile a and 2.6 times more likely to be in Profile c vs. Profile a.

Teaching PracTices and Pedagogical innovaTion: evidence from Talis © OECD 2012
ProfIles of teachers’ ProfessIonal PractIces ChaPtEr 483
at the school level, none of the policy-malleable variables was found to significantly predict profile membership.
the slovak republic
at the teacher level, teachers participating in co-operative learning arrangements for professional development are 36% more likely to be in Profile B vs. Profile a and 53% more likely to be in Profile c vs. Profile a. Teachers who attend professional development workshops and seminars are 16% more likely to be in Profile c vs. Profile a. Teachers receiving feedback and appraisal for innovative teaching are 89% more likely to be in Profile B vs. Profile a and 93% more likely to be in Profile c vs. Profile a.
at the school level, schools with greater levels of autonomy in hiring teachers and determining salaries show higher average log-odds of membership in Profile c vs. Profile a.
slovenia
at the teacher level, teachers participating in co-operative learning arrangements for professional development are 15% more likely to be in Profile B vs. Profile a and 44% more likely to be in Profile c vs. Profile a. Teachers who attend professional development workshops and seminars are 26% more likely to be in Profile B vs. Profile a and 35% more likely to be in Profile c vs. Profile a. Teachers receiving feedback and appraisal for innovative teaching are 98% more likely to be in Profile B vs. Profile a and 2.2 times more likely to be in Profile c vs. Profile a.
at the school level, longer average working hours are associated with greater average log-odds of being in Profile B vs. Profile a.
spain
at the teacher level, teachers participating in co-operative learning arrangements for professional development are 44% more likely to be in Profile B vs. Profile a and 51% more likely to be in Profile c vs. Profile a. Teachers who attend professional development workshops and seminars are 26% more likely to be in Profile B vs. Profile a and 49% more likely to be in Profile c vs. Profile a. Teachers receiving feedback and appraisal for innovative teaching are 88% more likely to be in Profile B vs. Profile a and 84% more likely to be in Profile c vs. Profile a.
at the school level, none of the policy-malleable variables was found to significantly predict profile membership.
turkey
at the teacher level, teachers participating in co-operative learning arrangements for professional development are 25% more likely to be in Profile B vs. Profile a and 47% more likely to be in Profile c vs. Profile a. Teachers receiving feedback and appraisal for innovative teaching are 65% more likely to be in Profile c vs. Profile a.
at the school level, none of the policy-malleable variables was found to significantly predict profile membership.

Teaching PracTices and Pedagogical innovaTion: evidence from Talis© OECD 2012
ChaPtEr 4 ProfIles of teachers’ ProfessIonal PractIces
84
summary of country-specific effects on profiles of classroom teaching practicesTables 4.1 and 4.2 present a summary of the teacher and school effects across all countries. a single positive sign means that at least one comparison is statistically significant, with Profile B vs. Profile a or Profile c vs. Profile a, with Profile B or Profile c being favoured over Profile a. Two positive signs mean that both comparisons are statistically significant, favouring Profile B and Profile c over Profile a. a single negative sign favours Profile a over either Profile B or Profile c, and two negative signs favour Profile a over Profile B and Profile c. a blank means that the variable was not statistically significant in any comparison.
teacher-level effects across countriesin the vast majority of the countries, teachers who participated in co-operative learning arrangements for professional developmen, attended workshops and seminars for professional development, and who have received feedback and appraisal for innovative teaching are more likely to be in Profile B and/or Profile c than in Profile a.
school-level effects across countriesat the school level, the majority of policy-malleable variables were not statistically significant across the participating countries. in cases of significant effects for school size and average hours of work, the results are mixed across the countries.
Table 4.1 Results of multinomial multilevel regression predicting teacher membership in profiles
of classroom teaching practices – overview over teacher level effects in all countriesteacher level aus aut bFl bra bgr DnK Est hun Isl Irl Ita KOr ltu mys mlt mEx nOr POl Prt svK svn EsP tur
Gender + + ++ ++ - - + + + ++ ++ ++ ++ + ++ ++
Level of education + -- - -- + -
Subject taught in target class: mathematics
-- -- - -- -- - + + -- - - -- - -- -- - --
Subject taught in target class: reading
++ ++ ++ ++ + ++ ++ ++ + ++ + + + ++ ++ ++ ++ ++ +
Subject taught in target class: other
++ ++ ++ ++ - + ++ ++ ++ + ++ + + - ++ - ++ +
Teaching experience + + - - ++ + ++ ++ + - - ++ - +
Participating in co-operative learning arrangements for PD
++ ++ ++ ++ ++ + ++ ++ ++ ++ ++ ++ ++ ++ + + ++ ++ ++ ++ ++
Attending PD workshops and seminars
++ ++ + ++ + ++ + + + + + ++ + ++ ++
Receiving feedback and appraisal for innovative teaching
+ ++ ++ ++ ++ + ++ ++ ++ ++ ++ ++ ++ ++ + ++ ++ ++ ++ ++ ++ ++ +
Constructivist beliefs about the nature of teaching and learning
+ ++ + ++ + ++ + + + ++ + ++ ++ ++ + ++
Teacher self-efficacy ++ ++ ++ ++ ++ ++ ++ ++ + ++ ++ ++ ++ ++ + ++ ++ ++ ++ ++ ++ ++ ++
note: cells where one comparison is statistically significant, with either Profile B or Profile c being favoured over Profile a are indicated with +. cells where two comparisons are statistically significant, with Profile B and Profile c being favoured over Profile a are indicated with ++. cells where one comparison is statistically significant, with Profile a being favoured over either Profile B or Profile c are indicated with -. cells where two comparisons are statistically significant, with Profile a being favoured over Profile B and Profile c are indicated with --. source: oecd, TALIS Database. Teaching and Learning International Survey 2008.1 2 http://dx.doi.org/10.1787/888932647418

Teaching PracTices and Pedagogical innovaTion: evidence from Talis © OECD 2012
ProfIles of teachers’ ProfessIonal PractIces ChaPtEr 485
note1. see annex c for a discussion of the use of log-odds and a guide as to their interpretation in this report.
Table 4.2 Results of multinomial multilevel regression predicting teacher membership in profiles
of classroom teaching practices – overview over school level effects in all countriesschool level aus aut bFl bra bgr DnK Est hun Isl Irl Ita KOr ltu mys mlt mEx nOr POl Prt svK svn EsP tur
Educational level of the student’s parents
- -- - - + -- - --
School size ++ + - - -- - -
Average hours of work ++ + + + -- + + +
School autonomy in curriculum
School autonomy in hiring teachers and determining salaries
+ - + - +
Administrative leadership style
- + - - +
Instructional leadership style
+ +
Percent of teachers reporting feedback and appraisal for innovative teaching
+ ++ + ++ -
notes: cells where one comparison is statistically significant, with either Profile B or Profile c being favoured over Profile a are indicated with +. cells where two comparisons are statistically significant, with Profile B and Profile c being favoured over Profile a are indicated with ++. cells where one comparison is statistically significant, with Profile a being favoured over either Profile B or Profile c are indicated with -. cells where two comparisons are statistically significant, with Profile a being favoured over Profile B and Profile c are indicated with --.
school analyses were not reported for iceland and malta because the number of schools was insufficient for analysing the full multilevel model.
source: oecd, TALIS Database. Teaching and Learning International Survey 2008.1 2 http://dx.doi.org/10.1787/888932647437


87
Teaching PracTices and Pedagogical innovaTion: evidence from Talis © OECD 2012
Profiles of Participation in Professional Learning Communities
Chapter 5
as in chapter 4, profile patterns emerge here among the countries studied,
but this time with regards to teachers’ participation in professional learning
communities. one general pattern is defined mostly by a separation on
teachers’ participation in collaborative activities involving joint teaching.
another shows separation in both joint teaching collaboration and the
de-privatisation of practice. a third pattern shows a separation in joint
teaching collaborations, de-privatisation of practice and, to a lesser degree,
reflective inquiry.

Teaching PracTices and Pedagogical innovaTion: evidence from Talis© OECD 2012
ChaPtEr 5 ProfIles of PartIcIPatIon In ProfessIonal learnIng communItIes
88
Highlights
• in each country three or four main profiles of participation in learning communities emerged with differences in both the level of participation in all activities and in the kind of activities preferred. across countries, a set of general patterns of profiles emerged.
• in austria, Belgium (fl.), Bulgaria, estonia, hungary, iceland, italy, norway, Poland and Turkey, the profiles of teachers are mostly separated by a group of teachers who show high, medium or low levels of collaborative activities involving joint teaching.
• in ireland, malta, mexico and spain, profiles also differ on the dimension of collaborative activities involving joint teaching, but in addition, they differ on the dimension of de-privatisation of practice with one group of teachers scoring much higher on this dimension than the other groups of teachers.
• in australia, Brazil and denmark, profiles are also somewhat differentiated by their level of reflective inquiry with some groups of teachers showing lower levels of reflection and other groups of teachers showing higher levels.
• in most countries, participation in professional development and receiving appraisal and feedback for innovative teaching is related to higher participation in all co-operative activities.

Teaching PracTices and Pedagogical innovaTion: evidence from Talis © OECD 2012
ProfIles of PartIcIPatIon In ProfessIonal learnIng communItIes ChaPtEr 589
latent profiles of participation in professional learning communitiesour approach to determining the number of latent profiles of participation in professional learning communities proceeded in the same way as our approach to teaching practices. in contrast to the results for teaching practices, however, we find that some countries exhibit a better fitting three-profile solution, while others exhibit a better fitting four-profile solution. Thus, we find some countries in which a larger number of different profiles exists than in others.
an inspection of figures 5.1 to 5.4 shows the general profile patterns across clusters of countries. We find one general pattern defined mostly by separation on collaborative activities involving joint teaching. The countries exhibiting this pattern are austria, Belgium (fl.), Bulgaria, estonia, hungary, iceland, italy, norway, Poland and Turkey.
The second general pattern shows separation on both joint teaching collaborations and on de-privatisation of practice. countries exhibiting this pattern include ireland, malta, mexico and spain.
a third general pattern shows separation on joint teaching collaborations, de-privatisation of practice and, to a lesser degree, reflection. countries included in this pattern are australia, Brazil and denmark.
finally, we find a set of countries that do not clearly belong to any of the previous patterns. countries in this group include Korea, lithuania, malaysia, Portugal, the slovak republic and slovenia.
country-specific results: participation in professional learning communitiesannex c shows the results of the multilevel latent profiles for participation in professional learning communities. given the large volume of results, we present only the statistically significant ones associated with policy-malleable variables. at the teacher level, these include level of education, participation in co-operative learning arrangements for professional development, attending professional development workshops and seminars, and receiving feedback and appraisal for innovative teaching. control variables include, gender, subject matter taught in target Profile (math vs. science and “other” vs. science), holding constructivist beliefs about the nature of teaching and learning, and teacher self-efficacy.
at the school level, policy-malleable variables include school size, average hours of work, autonomy in curriculum, and autonomy in hiring teachers and determining salaries. control variables at the school level include educational level of the students’ parents, administrative leadership style, instructional leadership style, and percentage of teachers reporting feedback and appraisal for innovative teaching.
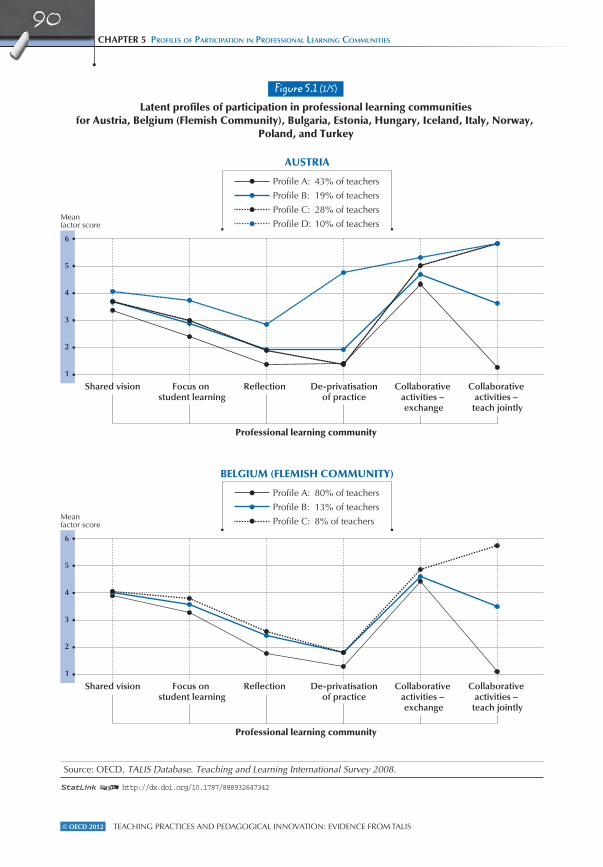
Teaching PracTices and Pedagogical innovaTion: evidence from Talis© OECD 2012
ChaPtEr 5 ProfIles of PartIcIPatIon In ProfessIonal learnIng communItIes
90
Shared vision Focus on student learning
Reflection De-privatisationof practice
Collaborative activities – exchange
Collaborative activities –
teach jointly
Figure 5.1 (1/5)
Latent profiles of participation in professional learning communities for Austria, Belgium (Flemish Community), Bulgaria, Estonia, Hungary, Iceland, Italy, Norway,
Poland, and Turkey
Professional learning community
Mean factor score
AUSTRIA
Profile A: 43% of teachers
Profile B: 19% of teachers
Profile C: 28% of teachers
Profile D: 10% of teachers
6
5
4
3
2
1
BELGIUM (FLEMISH COMMUNITY)
Profile A: 80% of teachers
Profile B: 13% of teachers
Profile C: 8% of teachers
Shared vision Focus on student learning
Reflection De-privatisationof practice
Collaborative activities – exchange
Collaborative activities –
teach jointly
Professional learning community
Mean factor score
6
5
4
3
2
1
Source: OECD, TALIS Database. Teaching and Learning International Survey 2008.
1 2 http://dx.doi.org/10.1787/888932647342

Teaching PracTices and Pedagogical innovaTion: evidence from Talis © OECD 2012
ProfIles of PartIcIPatIon In ProfessIonal learnIng communItIes ChaPtEr 591
1 2 http://dx.doi.org/10.1787/888932647342
Figure 5.1 (2/5)
Latent profiles of participation in professional learning communities for Austria, Belgium (Flemish Community), Bulgaria, Estonia, Hungary, Iceland, Italy, Norway,
Poland, and Turkey
BULGARIA
Profile A: 78% of teachers
Profile B: 10% of teachers
Profile C: 12% of teachers
Shared vision Focus on student learning
Reflection De-privatisationof practice
Collaborative activities – exchange
Collaborative activities –
teach jointly
Professional learning community
Mean factor score
6
5
4
3
2
1
Shared vision Focus on student learning
Reflection De-privatisationof practice
Collaborative activities – exchange
Collaborative activities –
teach jointly
Professional learning community
Mean factor score
ESTONIA
6
5
4
3
2
1
Profile A: 46% of teachers
Profile B: 26% of teachers
Profile C: 28% of teachers
Source: OECD, TALIS Database. Teaching and Learning International Survey 2008.

Teaching PracTices and Pedagogical innovaTion: evidence from Talis© OECD 2012
ChaPtEr 5 ProfIles of PartIcIPatIon In ProfessIonal learnIng communItIes
92
Shared vision Focus on student learning
Reflection De-privatisationof practice
Collaborative activities – exchange
Collaborative activities –
teach jointly
Figure 5.1 (3/5)
Latent profiles of participation in professional learning communities for Austria, Belgium (Flemish Community), Bulgaria, Estonia, Hungary, Iceland, Italy, Norway,
Poland, and Turkey
Professional learning community
Mean factor score
HUNGARY
6
5
4
3
2
1
ICELAND
Profile A: 61% of teachers
Profile B: 8% of teachers
Profile C: 31% of teachers
Profile A: 82% of teachers
Profile B: 11% of teachers
Profile C: 6% of teachers
Shared vision Focus on student learning
Reflection De-privatisationof practice
Collaborative activities – exchange
Collaborative activities –
teach jointly
Professional learning community
Mean factor score
6
5
4
3
2
1
Source: OECD, TALIS Database. Teaching and Learning International Survey 2008.
1 2 http://dx.doi.org/10.1787/888932647342

Teaching PracTices and Pedagogical innovaTion: evidence from Talis © OECD 2012
ProfIles of PartIcIPatIon In ProfessIonal learnIng communItIes ChaPtEr 593
1 2 http://dx.doi.org/10.1787/888932647342
Shared vision Focus on student learning
Reflection De-privatisationof practice
Collaborative activities – exchange
Collaborative activities –
teach jointly
Figure 5.1 (4/5)
Latent profiles of participation in professional learning communities for Austria, Belgium (Flemish Community), Bulgaria, Estonia, Hungary, Iceland, Italy, Norway,
Poland, and Turkey
Professional learning community
Mean factor score
ITALY
6
5
4
3
2
1
NORWAY
Profile A: 26% of teachers
Profile B: 14% of teachers
Profile C: 60% of teachers
Profile A: 43% of teachers
Profile B: 48% of teachers
Profile C: 9% of teachers
Shared vision Focus on student learning
Reflection De-privatisationof practice
Collaborative activities – exchange
Collaborative activities –
teach jointly
Professional learning community
Mean factor score
6
5
4
3
2
1
Source: OECD, TALIS Database. Teaching and Learning International Survey 2008.

Teaching PracTices and Pedagogical innovaTion: evidence from Talis© OECD 2012
ChaPtEr 5 ProfIles of PartIcIPatIon In ProfessIonal learnIng communItIes
94
TURKEY
Profile A: 37% of teachers
Profile B: 36% of teachers
Profile C: 16% of teachers
Profile D: 10% of teachers
Shared vision Focus on student learning
Reflection De-privatisationof practice
Collaborative activities – exchange
Collaborative activities –
teach jointly
Figure 5.1 (5/5)
Latent profiles of participation in professional learning communities for Austria, Belgium (Flemish Community), Bulgaria, Estonia, Hungary, Iceland, Italy, Norway,
Poland, and Turkey
Professional learning community
Mean factor score
6
5
4
3
2
1
Shared vision Focus on student learning
Reflection De-privatisationof practice
Collaborative activities – exchange
Collaborative activities –
teach jointly
Professional learning community
Mean factor score
6
5
4
3
2
1
POLAND
Profile A: 20% of teachers
Profile B: 25% of teachers
Profile C: 25% of teachers
Profile D: 30% of teachers
Source: OECD, TALIS Database. Teaching and Learning International Survey 2008.
1 2 http://dx.doi.org/10.1787/888932647342

Teaching PracTices and Pedagogical innovaTion: evidence from Talis © OECD 2012
ProfIles of PartIcIPatIon In ProfessIonal learnIng communItIes ChaPtEr 595
1 2 http://dx.doi.org/10.1787/888932647361
IRELAND
Profile A: 78% of teachers
Profile B: 17% of teachers
Profile C: 5% of teachers
MALTA
Profile A: 78% of teachers
Profile B: 13% of teachers
Profile C: 8% of teachers
Shared vision Focus on student learning
Reflection De-privatisationof practice
Collaborative activities – exchange
Collaborative activities –
teach jointly
Figure 5.2 (1/2)
Latent profiles of participation in professional learning communities for Ireland, Malta, Mexico, and Spain
Professional learning community
Mean factor score
6
5
4
3
2
1
Shared vision Focus on student learning
Reflection De-privatisationof practice
Collaborative activities – exchange
Collaborative activities –
teach jointly
Professional learning community
Mean factor score
6
5
4
3
2
1
Source: OECD, TALIS Database. Teaching and Learning International Survey 2008.

Teaching PracTices and Pedagogical innovaTion: evidence from Talis© OECD 2012
ChaPtEr 5 ProfIles of PartIcIPatIon In ProfessIonal learnIng communItIes
96
MEXICO
Profile A: 40% of teachers
Profile B: 41% of teachers
Profile C: 19% of teachers
SPAIN
Profile A: 73% of teachers
Profile B: 18% of teachers
Profile C: 9% of teachers
Shared vision Focus on student learning
Reflection De-privatisationof practice
Collaborative activities – exchange
Collaborative activities –
teach jointly
Figure 5.2 (2/2)
Latent profiles of participation in professional learning communities for Ireland, Malta, Mexico, and Spain
Professional learning community
Mean factor score
6
5
4
3
2
1
Shared vision Focus on student learning
Reflection De-privatisationof practice
Collaborative activities – exchange
Collaborative activities –
teach jointly
Professional learning community
Mean factor score
6
5
4
3
2
1
Source: OECD, TALIS Database. Teaching and Learning International Survey 2008.
1 2 http://dx.doi.org/10.1787/888932647361
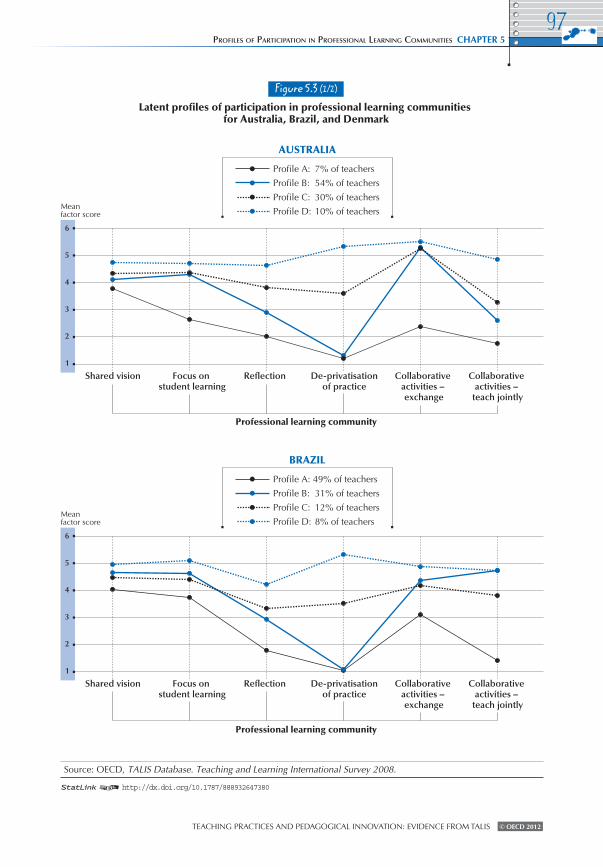
Teaching PracTices and Pedagogical innovaTion: evidence from Talis © OECD 2012
ProfIles of PartIcIPatIon In ProfessIonal learnIng communItIes ChaPtEr 597
1 2 http://dx.doi.org/10.1787/888932647380
AUSTRALIA
Profile A: 7% of teachers
Profile B: 54% of teachers
Profile C: 30% of teachers
Profile D: 10% of teachers
BRAZIL
Profile A: 49% of teachers
Profile B: 31% of teachers
Profile C: 12% of teachers
Profile D: 8% of teachers
Shared vision Focus on student learning
Reflection De-privatisationof practice
Collaborative activities – exchange
Collaborative activities –
teach jointly
Figure 5.3 (1/2)
Latent profiles of participation in professional learning communities for Australia, Brazil, and Denmark
Professional learning community
Mean factor score
6
5
4
3
2
1
Shared vision Focus on student learning
Reflection De-privatisationof practice
Collaborative activities – exchange
Collaborative activities –
teach jointly
Professional learning community
Mean factor score
6
5
4
3
2
1
Source: OECD, TALIS Database. Teaching and Learning International Survey 2008.

Teaching PracTices and Pedagogical innovaTion: evidence from Talis© OECD 2012
ChaPtEr 5 ProfIles of PartIcIPatIon In ProfessIonal learnIng communItIes
98
DENMARK
Profile A: 12% of teachers
Profile B: 60% of teachers
Profile C: 16% of teachers
Profile D: 12% of teachers
Shared vision Focus on student learning
Reflection De-privatisationof practice
Collaborative activities – exchange
Collaborative activities –
teach jointly
Figure 5.3 (2/2)
Latent profiles of participation in professional learning communities for Australia, Brazil, and Denmark
Professional learning community
Mean factor score
6
5
4
3
2
1
Source: OECD, TALIS Database. Teaching and Learning International Survey 2008.
1 2 http://dx.doi.org/10.1787/888932647380
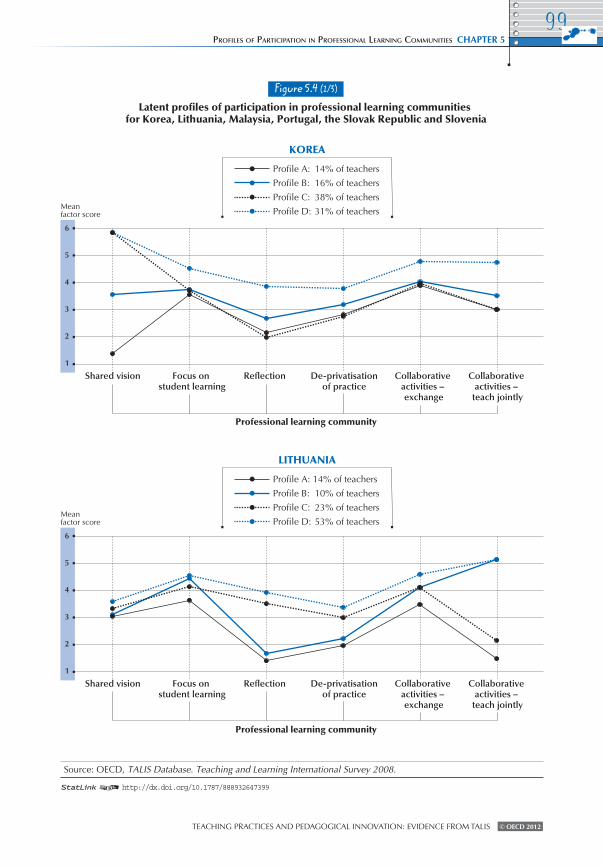
Teaching PracTices and Pedagogical innovaTion: evidence from Talis © OECD 2012
ProfIles of PartIcIPatIon In ProfessIonal learnIng communItIes ChaPtEr 599
1 2 http://dx.doi.org/10.1787/888932647399
KOREA
Profile A: 14% of teachers
Profile B: 16% of teachers
Profile C: 38% of teachers
Profile D: 31% of teachers
LITHUANIA
Profile A: 14% of teachers
Profile B: 10% of teachers
Profile C: 23% of teachers
Profile D: 53% of teachers
Shared vision Focus on student learning
Reflection De-privatisationof practice
Collaborative activities – exchange
Collaborative activities –
teach jointly
Figure 5.4 (1/3)
Latent profiles of participation in professional learning communities for Korea, Lithuania, Malaysia, Portugal, the Slovak Republic and Slovenia
Professional learning community
Mean factor score
6
5
4
3
2
1
Shared vision Focus on student learning
Reflection De-privatisationof practice
Collaborative activities – exchange
Collaborative activities –
teach jointly
Professional learning community
Mean factor score
6
5
4
3
2
1
Source: OECD, TALIS Database. Teaching and Learning International Survey 2008.

Teaching PracTices and Pedagogical innovaTion: evidence from Talis© OECD 2012
ChaPtEr 5 ProfIles of PartIcIPatIon In ProfessIonal learnIng communItIes
100
MALAYSIA
Profile A: 37% of teachers
Profile B: 15% of teachers
Profile C: 23% of teachers
Profile D: 24% of teachers
PORTUGAL
Profile A: 87% of teachers
Profile B: 8% of teachers
Profile C: 5% of teachers
Shared vision Focus on student learning
Reflection De-privatisationof practice
Collaborative activities – exchange
Collaborative activities –
teach jointly
Figure 5.4 (2/3)
Latent profiles of participation in professional learning communities for Korea, Lithuania, Malaysia, Portugal, the Slovak Republic and Slovenia
Professional learning community
Mean factor score
6
5
4
3
2
1
Shared vision Focus on student learning
Reflection De-privatisationof practice
Collaborative activities – exchange
Collaborative activities –
teach jointly
Professional learning community
Mean factor score
6
5
4
3
2
1
Source: OECD, TALIS Database. Teaching and Learning International Survey 2008.
1 2 http://dx.doi.org/10.1787/888932647399
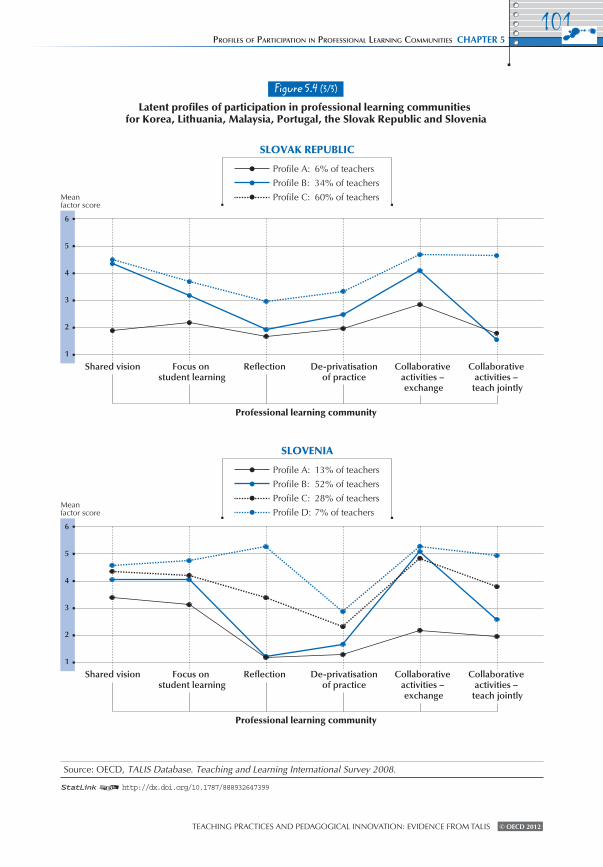
Teaching PracTices and Pedagogical innovaTion: evidence from Talis © OECD 2012
ProfIles of PartIcIPatIon In ProfessIonal learnIng communItIes ChaPtEr 5101
1 2 http://dx.doi.org/10.1787/888932647399
SLOVENIA
Profile A: 13% of teachers
Profile B: 52% of teachers
Profile C: 28% of teachers
Profile D: 7% of teachers
SLOVAK REPUBLIC
Profile A: 6% of teachers
Profile B: 34% of teachers
Profile C: 60% of teachers
Shared vision Focus on student learning
Reflection De-privatisationof practice
Collaborative activities – exchange
Collaborative activities –
teach jointly
Figure 5.4 (3/3)
Latent profiles of participation in professional learning communities for Korea, Lithuania, Malaysia, Portugal, the Slovak Republic and Slovenia
Professional learning community
Mean factor score
6
5
4
3
2
1
Shared vision Focus on student learning
Reflection De-privatisationof practice
Collaborative activities – exchange
Collaborative activities –
teach jointly
Professional learning community
Mean factor score
6
5
4
3
2
1
Source: OECD, TALIS Database. Teaching and Learning International Survey 2008.

Teaching PracTices and Pedagogical innovaTion: evidence from Talis© OECD 2012
ChaPtEr 5 ProfIles of PartIcIPatIon In ProfessIonal learnIng communItIes
102
australiaat the teacher level, holding constant the teacher control variables, teachers participating in co-operative learning arrangements for professional development are 44% more likely to be in Profile B vs. Profile a and almost 3 times more likely to be in Profile d vs. Profile a. Teachers attending professional development workshops and seminars are 1.6 times more likely to be in Profile d vs. Profile a. Teachers receiving feedback and appraisal for innovative teaching are almost 4 times more likely to be in Profile d vs. Profile a. all other effects of policy-malleable variables on profile membership are non-significant.
at the school level, holding constant school-level control variables, school size is a significant predictor of the average log-odds of belonging to Profile B, Profile c, and Profile d vs. Profile a. specifically, larger schools are associated with a higher probability that teachers within that school will belong Profile B, c, or d as opposed to Profile a. The average hours of work were found to positively predict membership in Profile B vs. Profile a and positively predict membership in Profile d vs. Profile a. The higher the average working hours of teachers in a school, the higher the school’s probability that a teacher will belong to Profile B or d as opposed to Profile a.
austriaat the teacher level, holding constant the teacher control variables, teachers participating in co-operative learning arrangements for professional development are 18% more likely to be in Profile B vs. Profile a, about 87% more likely to be in Profile c vs. Profile a and a little over twice as likely to be in Profile d vs. Profile a. Teachers attending professional development workshops and seminars are 13% times more likely to be in Profile B vs. Profile a and 53% more likely to be in Profile d vs. Profile a. Teachers receiving feedback and appraisal for innovative teaching are 43% more likely to be in Profile B vs. Profile a, almost twice as likely to be in Profile c vs. Profile a and 2.5 times more likely to be in Profile d vs. Profile a.
at the school level, holding constant school-level control variables, larger schools are associated with greater average log-odds of membership in Profile c vs. Profile a. longer average working hours were also found to be associated with greater average log-odds of belonging to Profile c vs. Profile a. finally, a greater level of school autonomy in hiring teachers and determining salaries was found to be a positively associated with the average log-odds of belonging to Profile d vs. Profile a.
Belgium (flemish community)at the teacher level, holding constant the teacher control variables, teachers participating in co-operative learning arrangements for professional development are about 2.4 times more likely to be in Profile B vs. Profile a. Teachers receiving feedback and appraisal for innovative teaching are 55% more likely to be in Profile c vs. Profile a.
at the school level, holding constant school-level control variables, none of the policy-malleable variables is a significant predictor of the average log-odds of profile membership.
Bulgariaat the teacher level, holding constant the teacher control variables, teachers participating in co-operative learning arrangements for professional development are 29% more likely to be
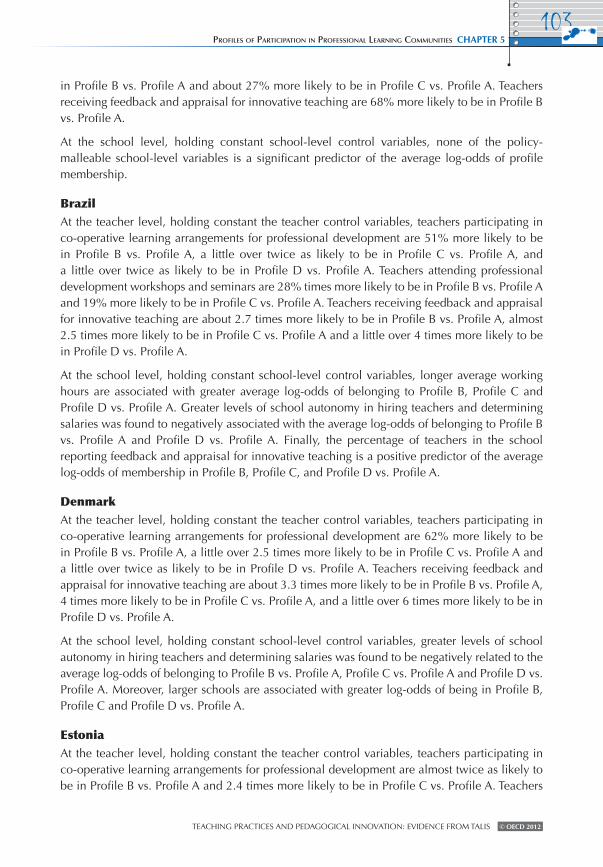
Teaching PracTices and Pedagogical innovaTion: evidence from Talis © OECD 2012
ProfIles of PartIcIPatIon In ProfessIonal learnIng communItIes ChaPtEr 5103
in Profile B vs. Profile a and about 27% more likely to be in Profile c vs. Profile a. Teachers receiving feedback and appraisal for innovative teaching are 68% more likely to be in Profile B vs. Profile a.
at the school level, holding constant school-level control variables, none of the policy-malleable school-level variables is a significant predictor of the average log-odds of profile membership.
Brazilat the teacher level, holding constant the teacher control variables, teachers participating in co-operative learning arrangements for professional development are 51% more likely to be in Profile B vs. Profile a, a little over twice as likely to be in Profile c vs. Profile a, and a little over twice as likely to be in Profile d vs. Profile a. Teachers attending professional development workshops and seminars are 28% times more likely to be in Profile B vs. Profile a and 19% more likely to be in Profile c vs. Profile a. Teachers receiving feedback and appraisal for innovative teaching are about 2.7 times more likely to be in Profile B vs. Profile a, almost 2.5 times more likely to be in Profile c vs. Profile a and a little over 4 times more likely to be in Profile d vs. Profile a.
at the school level, holding constant school-level control variables, longer average working hours are associated with greater average log-odds of belonging to Profile B, Profile c and Profile d vs. Profile a. greater levels of school autonomy in hiring teachers and determining salaries was found to negatively associated with the average log-odds of belonging to Profile B vs. Profile a and Profile d vs. Profile a. finally, the percentage of teachers in the school reporting feedback and appraisal for innovative teaching is a positive predictor of the average log-odds of membership in Profile B, Profile c, and Profile d vs. Profile a.
denmarkat the teacher level, holding constant the teacher control variables, teachers participating in co-operative learning arrangements for professional development are 62% more likely to be in Profile B vs. Profile a, a little over 2.5 times more likely to be in Profile c vs. Profile a and a little over twice as likely to be in Profile d vs. Profile a. Teachers receiving feedback and appraisal for innovative teaching are about 3.3 times more likely to be in Profile B vs. Profile a, 4 times more likely to be in Profile c vs. Profile a, and a little over 6 times more likely to be in Profile d vs. Profile a.
at the school level, holding constant school-level control variables, greater levels of school autonomy in hiring teachers and determining salaries was found to be negatively related to the average log-odds of belonging to Profile B vs. Profile a, Profile c vs. Profile a and Profile d vs. Profile a. moreover, larger schools are associated with greater log-odds of being in Profile B, Profile c and Profile d vs. Profile a.
estoniaat the teacher level, holding constant the teacher control variables, teachers participating in co-operative learning arrangements for professional development are almost twice as likely to be in Profile B vs. Profile a and 2.4 times more likely to be in Profile c vs. Profile a. Teachers

Teaching PracTices and Pedagogical innovaTion: evidence from Talis© OECD 2012
ChaPtEr 5 ProfIles of PartIcIPatIon In ProfessIonal learnIng communItIes
104
attending professional development workshops and seminars are almost 60% more likely to be in Profile B vs. Profile a and almost 75% more likely to be in Profile c vs. Profile a. Teachers receiving feedback and appraisal for innovative teaching are about 3.3 times more likely to be in Profile B vs. Profile a and about 3.7 times more likely to be in Profile c vs. Profile a.
at the school level, holding constant school-level control variables, none of the policy malleable variables is a significant predictor of the average log-odds of profile membership.
hungaryat the teacher level, holding constant the teacher control variables, teachers participating in co-operative learning arrangements for professional development are 22% more likely to be in Profile B vs. Profile a. Teachers attending professional development workshops and seminars are 54% more likely to be in Profile B vs. Profile a.
at the school level, holding constant school-level control variables, none of the policy malleable variables is a significant predictor of the average log-odds of profile membership.
icelandat the teacher level, holding constant the teacher control variables, teachers participating in co-operative learning arrangements for professional development are 35% more likely to be in Profile B vs. Profile a and 60% more likely to be in Profile c vs. Profile a. Teachers receiving feedback and appraisal for innovative teaching are 54% more likely to be in Profile B vs. Profile a and 77% more likely to be in Profile c vs. Profile a.
Between-school effects could not be calculated because the number of schools in iceland is too small for computing multilevel latent profile regressions
irelandat the teacher level, holding constant the teacher control variables, teachers participating in co-operative learning arrangements for professional development are almost 31% more likely to be in Profile B vs. Profile a and a little over twice as likely to be in Profile c vs. Profile a. Teachers receiving feedback and appraisal for innovative teaching are about 70% more likely to be in Profile c vs. Profile a.
at the school level, holding constant school-level control variables, greater school autonomy in curriculum decision making is negatively associated the average log-odds of being in Profile c vs. Profile a. however, greater school autonomy in hiring teachers and determining salaries is positively associated with the average log-odds of being in Profile B vs. Profile a.
italyat the teacher level, holding constant the teacher control variables, teachers participating in co-operative learning arrangements for professional development are almost 40% more likely to be in Profile B vs. Profile a and 35% more likely to be in Profile c vs. Profile a. Teachers attending professional development workshops and seminars are 13% more likely to be in Profile B vs. Profile a and 23% more likely to be in Profile c vs. Profile a. Teachers receiving feedback and appraisal for innovative teaching are 82% more likely to be in Profile B vs. Profile a and 94% more likely to be in Profile c vs. Profile a.
Teaching PracTices and Pedagogical innovaTion: evidence from Talis © OECD 2012
ProfIles of PartIcIPatIon In ProfessIonal learnIng communItIes ChaPtEr 5105
at the school level, holding constant school-level control variables, greater school autonomy in curriculum decision making is a positively related to the average log-odds of membership in Profile c vs. Profile a.
koreaat the teacher level, holding constant the teacher control variables, teachers participating in co-operative learning arrangements for professional development are almost 14% less likely to be in Profile c vs. Profile a but about 61% more likely to be in Profile d vs. Profile a. Teachers attending professional development workshops and seminars are about 25% more likely to be in Profile d vs. Profile a. Teachers receiving feedback and appraisal for innovative teaching are about 74% more likely to be in Profile B vs. Profile a, about 40% more likely to be in Profile c vs. Profile a and about 3 times more likely to be in Profile d vs. Profile a.
at the school level, holding constant school-level control variables, greater school autonomy in curriculum decision making is negatively associated with the average log-odds of being in Profile c vs. Profile a and Profile d vs. Profile a.
lithuaniaat the teacher level, holding constant the teacher control variables, teachers participating in co-operative learning arrangements for professional development are almost 58% more likely to be in Profile B vs. Profile a, 59% more likely to be in Profile c vs. Profile a and about 3 times more likely to be in Profile d vs. Profile a. Teachers attending professional development workshops and seminars are about 64% more likely to be in Profile c vs. Profile a and 98% more likely to be in Profile d vs. Profile a. Teachers receiving feedback and appraisal for innovative teaching are about 2.5 times more likely to be in Profile B vs. Profile a, about 2.6 times more likely to be in Profile c vs. Profile a and a little over 6.5 times more likely to be in Profile d vs. Profile a.
at the school level, holding constant school-level control variables, larger schools size are associated with lower average log-odds of being in Profile B vs. Profile a and Profile d vs. Profile a.
malaysiaat the teacher level, holding constant the teacher control variables, teachers participating in co-operative learning arrangements for professional development are about 2.2 times more likely to be in Profile B vs. Profile a, 56% more likely to be in Profile c vs. Profile a and about 2.7 times more likely to be in Profile d vs. Profile a. Teachers attending professional development workshops and seminars are 23% more likely to be in Profile c vs. Profile a and 31% more likely to be in Profile d vs. Profile a. Teachers receiving feedback and appraisal for innovative teaching are 90% more likely to be in Profile d vs. Profile a.
at the school level, holding constant school-level control variables, large schools are associated with lower average log-odds of being in Profile B vs. Profile a. average hours of work was found to positively predict membership in Profile B vs. Profile a. The higher the average working hours of teachers in a school, the higher the school’s probability that a teacher will belong to Profile B as opposed to Profile a.

Teaching PracTices and Pedagogical innovaTion: evidence from Talis© OECD 2012
ChaPtEr 5 ProfIles of PartIcIPatIon In ProfessIonal learnIng communItIes
106
maltaat the teacher level, holding constant the teacher control variables, teachers participating in co-operative learning arrangements for professional development are 2.3 times more likely to be in Profile c vs. Profile a. Teachers receiving feedback and appraisal for innovative teaching are 75% more likely to be in Profile c vs. Profile a.
Between-school effects could not be calculated because the number of schools in malta is too small for computing multilevel latent profile regressions.
mexicoat the teacher level, holding constant the teacher control variables, teachers participating in co-operative learning arrangements for professional development are almost 61% more likely to be in Profile B vs. Profile a and 85% more likely to be in Profile c vs. Profile a. Teachers attending professional development workshops and seminars are about 23% more likely to be in Profile B vs. Profile a and 35% more likely to be in Profile c vs. Profile a. Teachers receiving feedback and appraisal for innovative teaching are almost twice as likely to be in Profile B vs. Profile a and are twice as likely to be in Profile c vs. Profile a.
at the school level, holding constant school-level control variables, larger schools are associated with lower average log-odds of being in Profile c vs. Profile a.
norwayat the teacher level, holding constant the teacher control variables, teachers participating in co-operative learning arrangements for professional development are almost 18% more likely to be in Profile c vs. Profile a. Teachers attending professional development workshops and seminars are about 27% more likely to be in Profile c vs. Profile a.
at the school level, holding constant school-level control variables, greater school size is associated with lower average log-odds of being in Profile B vs. Profile a. greater school autonomy hiring teachers and setting salaries is negatively associated with being in Profile B vs. Profile a and also Profile c vs. Profile a. average hours of work was found to positively predict membership in Profile B vs. Profile a. The higher the average working hours of teachers in a school, the higher the school’s probability that a teacher will belong to Profile B as opposed to Profile a.
Poland
at the teacher level, holding constant the teacher control variables, teachers participating in co-operative learning arrangements for professional development are almost 93% more likely to be in Profile c vs. Profile a and 96% more likely to be in Profile d vs. Profile a. Teachers attending professional development workshops and seminars are about 30% more likely to be in Profile c vs. Profile a and 52% more likely to be in Profile d vs. Profile a. Teachers receiving feedback and appraisal for innovative teaching are 81% more likely to be in Profile B vs. Profile a, 2.4 times more likely to be in Profile c vs. Profile a and 2.8 times more likely to be in Profile d vs. Profile a.
at the school level, holding constant school-level control variables, none of the policy-malleable variables is a significant predictor of the average log-odds of Profile membership.

Teaching PracTices and Pedagogical innovaTion: evidence from Talis © OECD 2012
ProfIles of PartIcIPatIon In ProfessIonal learnIng communItIes ChaPtEr 5107
average hours of work were found to positively predict membership in Profile c vs. Profile a and positively predict membership in Profile d vs. Profile a. The higher the average working hours of teachers in a school, the higher the school’s probability that a teacher will belong to Profile c or d as opposed to Profile a.
portugalat the teacher level, holding constant the teacher control variables, teachers participating in co-operative learning arrangements for professional development are almost 64% more likely to be in Profile B vs. Profile a and 37% more likely to be in Profile d vs. Profile a. Teachers receiving feedback and appraisal for innovative teaching are a little more than 2.5 times more likely to be in Profile B vs. Profile a.
at the school level, holding constant school-level control variables, school autonomy in curriculum decision making is associated with lower average log-odds of membership in Profile B vs. Profile a.
the slovak republicat the teacher level, holding constant the teacher control variables, teachers participating in co-operative learning arrangements for professional development are almost 62% more likely to be in Profile c vs. Profile a. Teachers receiving feedback and appraisal for innovative teaching are almost 3 times more likely to be in Profile B vs. Profile a and about than 5 times more likely to be in Profile c vs. Profile a.
at the school level, holding constant school-level control variables, none of the policy-malleable variables is a significant predictor of the average log-odds of profile membership.
sloveniaat the teacher level, holding constant the teacher control variables, teachers participating in co-operative learning arrangements for professional development are 32% more likely to be in Profile B vs. Profile a, 62% more likely to be in Profile c vs. Profile a and 95% more likely to be in Profile d vs. Profile a. Teachers attending professional development workshops and seminars are 28% less likely to be in Profile B vs. Profile a, 39% more likely to be in Profile c vs. Profile a and 36% more likely to be in Profile d vs. Profile a. Teachers receiving feedback and appraisal for innovative teaching are 41% more likely to be in Profile B vs. Profile a, about twice as likely to be in Profile c vs. Profile a and 3.2 times more likely to be in Profile d vs. Profile a.
at the school level, holding constant school-level control variables, larger school size is associated with greater average log-odds of being in Profile B, Profile c, and Profile d vs. Profile a.
spainat the teacher level, holding constant the teacher control variables, teachers participating in co-operative learning arrangements for professional development are 38% more likely to be in Profile B vs. Profile a. Teachers receiving feedback and appraisal for innovative teaching are 55% more likely to be in Profile B vs. Profile a and 73% more likely to be in Profile c vs. Profile a.
at the school level, holding constant school-level control variables, larger schools are associated with greater log-odds of being in Profile c vs. Profile a.

Teaching PracTices and Pedagogical innovaTion: evidence from Talis© OECD 2012
ChaPtEr 5 ProfIles of PartIcIPatIon In ProfessIonal learnIng communItIes
108
turkeyat the teacher level, holding constant the teacher control variables, teachers participating in co-operative learning arrangements for professional development are 28% more likely to be in Profile B vs. Profile a, 82% more likely to be in Profile c vs. Profile a and 2.3 times more likely to be in Profile d vs. Profile a. Teachers attending professional development workshops and seminars are 19% more likely to be in Profile B vs. Profile a. Teachers receiving feedback and appraisal for innovative teaching are almost 3 times more likely to be in Profile B vs. Profile a, almost 2.5 times more likely to be in Profile c vs. Profile a and a little over 3.5 times more likely to be in Profile d vs. Profile a.
at the school level, holding constant school-level control variables, none of the policy-malleable variables is a significant predictor of the average log-odds of profile membership.
Table 5.1 Results of multinomial multilevel regression predicting teacher membership in profiles
of participation in professional learning communities – overview over teacher level effects in all countries
teacher level aus aut bFl bra bgr DnK Est hun Isl Irl Ita KOr ltu mys mlt mEx nOr POl Prt svK svn EsP tur
Gender + - + -- ++ + - -- - ++ - - - ++ - ++ - +-
Level of education --- - + - -
Subject taught in target class: mathematics
+++ + + - + +++
Subject taught in target class: reading
+++ - -- ++ + ++
Subject taught in target class: other
+ + ++ + + - + + -- --- ++
Teaching experience + + + -- -- - - + - ++
Participating in co-operative learning arrangements for PD
++ +++ + +++ ++ +++ ++ + ++ ++ ++ -+ +++ +++ + ++ + ++ ++ + +++ + +++
Attending PD workshops and seminars
+ ++ ++ ++ ++ + ++ ++ ++ + ++ +++ +
Receiving feedback and appraisal for innovative teaching
+ +++ + +++ + +++ ++ + ++ + ++ +++ +++ + + ++ +++ + ++ +++ ++ +++
Constructivist beliefs about the nature of teaching and learning
- + +
Teacher self-efficacy ++ +++ ++ +++ + ++ ++ ++ ++ + ++ + ++ ++ + + + + + +++
note: cells where one comparison is statistically significant, with either Profile B, Profile c, or Profile d being favoured over Profile a are indicated with +. cells where two comparisons are statistically significant, with either Profile B and Profile c, Profile B and Profile d, or Profile c and Profile d being favoured over Profile a are indicated with ++. cells were three comparisons are statistically significant, with Profile B, Profile c and Profile d being favoured over Profile a are indicated with +++. cells where one comparison is statistically significant, with Profile a being favoured over either Profile B, Profile c, or Profile d are indicated with -. cells where two comparisons are statistically significant, with Profile a being favoured over either Profile B and Profile c, Profile B and profile d, or Profile c and Profile d are indicated with --. cells where three comparisons are statistically significant, with Profile a being favoured over Profile B, Profile c, and Profile d are indicated with ---. source: oecd, TALIS Database. Teaching and Learning International Survey 2008.1 2 http://dx.doi.org/10.1787/888932647456
summary of country specific effects on profiles of participation in professional learning communitiesTables 5.1 and 5.2 present a summary of the teacher and school effects across all countries.
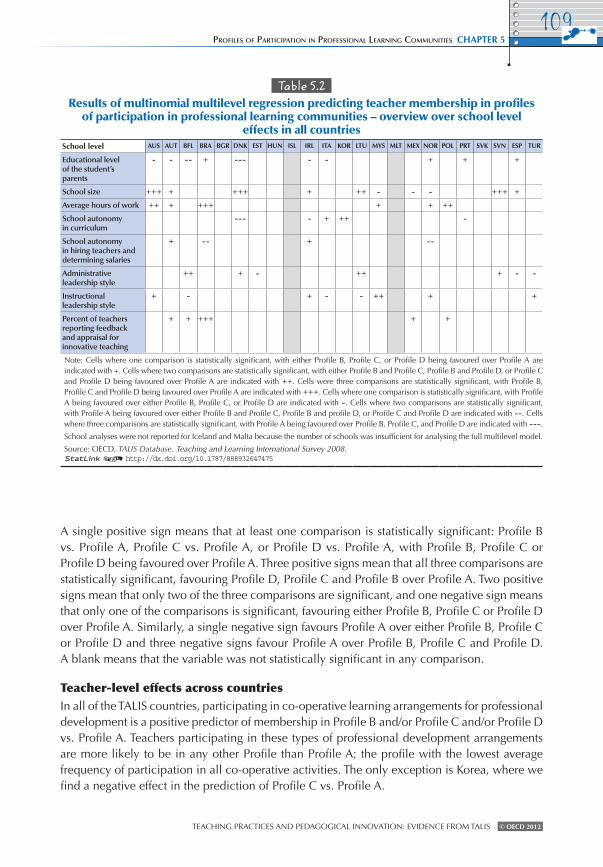
Teaching PracTices and Pedagogical innovaTion: evidence from Talis © OECD 2012
ProfIles of PartIcIPatIon In ProfessIonal learnIng communItIes ChaPtEr 5109
a single positive sign means that at least one comparison is statistically significant: Profile B vs. Profile a, Profile c vs. Profile a, or Profile d vs. Profile a, with Profile B, Profile c or Profile d being favoured over Profile a. Three positive signs mean that all three comparisons are statistically significant, favouring Profile d, Profile c and Profile B over Profile a. Two positive signs mean that only two of the three comparisons are significant, and one negative sign means that only one of the comparisons is significant, favouring either Profile B, Profile c or Profile d over Profile a. similarly, a single negative sign favours Profile a over either Profile B, Profile c or Profile d and three negative signs favour Profile a over Profile B, Profile c and Profile d. a blank means that the variable was not statistically significant in any comparison.
teacher-level effects across countriesin all of the Talis countries, participating in co-operative learning arrangements for professional development is a positive predictor of membership in Profile B and/or Profile c and/or Profile d vs. Profile a. Teachers participating in these types of professional development arrangements are more likely to be in any other Profile than Profile a; the profile with the lowest average frequency of participation in all co-operative activities. The only exception is Korea, where we find a negative effect in the prediction of Profile c vs. Profile a.
Table 5.2 Results of multinomial multilevel regression predicting teacher membership in profiles
of participation in professional learning communities – overview over school level effects in all countries
school level aus aut bFl bra bgr DnK Est hun Isl Irl Ita KOr ltu mys mlt mEx nOr POl Prt svK svn EsP tur
Educational level of the student’s parents
- - -- + --- - - + + +
School size +++ + +++ + ++ - - - +++ +
Average hours of work ++ + +++ + + ++
School autonomy in curriculum
--- - + ++ -
School autonomy in hiring teachers and determining salaries
+ -- + --
Administrative leadership style
++ + - ++ + - -
Instructional leadership style
+ - + - - ++ + +
Percent of teachers reporting feedback and appraisal for innovative teaching
+ + +++ + +
note: cells where one comparison is statistically significant, with either Profile B, Profile c, or Profile d being favoured over Profile a are indicated with +. cells where two comparisons are statistically significant, with either Profile B and Profile c, Profile B and Profile d, or Profile c and Profile d being favoured over Profile a are indicated with ++. cells were three comparisons are statistically significant, with Profile B, Profile c and Profile d being favoured over Profile a are indicated with +++. cells where one comparison is statistically significant, with Profile a being favoured over either Profile B, Profile c, or Profile d are indicated with -. cells where two comparisons are statistically significant, with Profile a being favoured over either Profile B and Profile c, Profile B and profile d, or Profile c and Profile d are indicated with --. cells where three comparisons are statistically significant, with Profile a being favoured over Profile B, Profile c, and Profile d are indicated with ---.
school analyses were not reported for iceland and malta because the number of schools was insufficient for analysing the full multilevel model.
source: oecd, TALIS Database. Teaching and Learning International Survey 2008.1 2 http://dx.doi.org/10.1787/888932647475

Teaching PracTices and Pedagogical innovaTion: evidence from Talis© OECD 2012
ChaPtEr 5 ProfIles of PartIcIPatIon In ProfessIonal learnIng communItIes
110
in addition, receiving feedback and appraisal for innovative teaching is a significant and positive predictor of Profile membership for all of the participating countries. Teachers who receive feedback and appraisal with regard to innovative teaching are more likely to be in Profiles B, c and/or d.
attending professional development workshops and seminars was also found to be a positive and significant predictor for many participating countries.
school-level effects across countriesat the between-school level, the results were quite mixed. for many countries the policy malleable variables of school size, autonomy in curriculum, autonomy in hiring teachers and determining salaries were not significant. in cases of significant effects, for example for school size, some of the relationships were positive and some negative. Between-school results are not presented for iceland and malta because the size of the school sample was too small for conducting multilevel latent profile regression analysis.
111
Teaching PracTices and Pedagogical innovaTion: evidence from Talis © OECD 2012
Key Findings and Policy Implications
Chapter 6
This chapter summarises the findings and policy implications of this
research. although the patterns of teaching practices and participation in
professional practice are strongly influenced by the specific interaction
between traditions, culture and educational policy in each education
system. across systems, however, it is clear that high-quality instruction
must surpass teacher-centred instruction: its vocation is to stimulate and
challenge students. student motivation is enhanced by both autonomy
and social relatedness, as well as structured teaching and good classroom
management. This report suggests that the main driver for advancement
in teachers’ professional practices lies with developing a large repertoire
of classroom teaching practices and granting autonomy and isolation to
co-operatively reflect pedagogical practice.

Teaching PracTices and Pedagogical innovaTion: evidence from Talis© OECD 2012
ChaPtEr 6 Key fIndIngs and PolIcy ImPlIcatIons
112
Highlights
• high-quality instruction is reflected in the use of a variety of classroom teaching practices, allowing for both teacher-directed and self-regulated learning. although this is seen in every country examined, only a minority of teachers reports a comparatively diverse and frequent use of classroom teaching practices.
• Theoretically, a professional learning community exists when all five aspects examined in this report are realised in a school or within a certain group of teachers. The results show this is not the case for all teachers. in many countries, basic forms of co-operation among staff are common, but participation in reflective inquiry and de-privatisation, where teachers work together on the core of their professional activities are much less common.
• Teachers who use more diverse teaching practices and who participate more actively in professional learning communities also report higher levels of self-efficacy, receive more feedback and appraisal on their instruction, and report being more involved in professional development activities outside of schools.
• While teachers in smaller schools were on average more likely to show diverse and frequent use of teaching practices, participation in co-operative practices that involve de-privatisation was more frequent in larger schools.
• longer working hours was associated with diverse and frequent use of teaching practices and with participation in co-operative practices, suggesting that high-quality teaching and intensive forms of co-operative professional learning can be time-consuming.
Teaching PracTices and Pedagogical innovaTion: evidence from Talis © OECD 2012
Key fIndIngs and PolIcy ImPlIcatIons ChaPtEr 6113
in the globalised knowledge economy, education has gained significance both for the well-being of individuals and for the prosperity of whole societies. apart from influences of the family and social background, it is especially teachers who shape students’ learning environments and help them reach their intellectual potential. Thus, it is important for educational policy makers to understand and monitor educational processes in schools.
This report set out to describe the use of teachers’ professional practices in different educational systems. The analysis has established profiles of classroom teaching practices and professional learning communities separately for the 23 countries that participated in Talis 2008. it has also shed important light on the relationship between the profiles of professional practices and teachers, as well as school-level input and process variables. in the following sections, these findings are summarised in turn. finally, conclusions and policy implications are discussed.
cross-national comparisons of latent profiles of professional practiceschapters 4 and 5 described profiles of classroom teaching practices and participation in professional learning communities separately for each of the countries that participated in Talis 2008. considerable cross-national differences in the profiles were observed, but also some similarities.
for classroom teaching practices, the profiles were based on factor scores for three dimensions: structuring, student orientation and enhanced activities. The latter two dimensions represent strategies rooted in socio-constructivist theories, such as self-directed and self-regulated learning, co-operative and problem-based learning, adaptive instruction, group discussions and project-based learning. in combination with structuring practices, such as stating learning goals, summarising the lesson and checking student understanding, they operationalise the three basic dimensions of instructional quality suggested by Klieme, Pauli and reusser (2009).
latent profile analysis based on these indicators identified three parallel profiles of classroom teaching practices within each of the countries. The respective profile lines did not cross. rather, teachers had either high, medium or low means for each of the three scales. in other words, the distinctions in latent profiles are in level, not so much in kind. hence, teachers within each of the countries can be distinguished along their overall frequency of using prescribed teaching practices rather than based on their specific preference for one type or another. The highest percentage of teachers was found in Profile a – the profile with the lowest means for all three classroom teaching practice dimensions – and the lowest percentage in Profile c, or the profile with the highest means for all three dimensions. hence, only a minority of teachers constitute the profile that reports a comparatively diverse and frequent use of classroom teaching practices. These findings were consistent across all education systems that participated in Talis 2008.
in contrast, the shape of the profiles varied considerably among countries. four groups of countries emerged from the data are:
• in Belgium (fl.), ireland, italy and malta, all three profiles had above average scores in structuring and relatively low scores in student orientation and enhanced activities.
• in austria, Bulgaria, hungary, lithuania, Poland, the slovak republic and slovenia, we found a peak for student orientation.
Teaching PracTices and Pedagogical innovaTion: evidence from Talis© OECD 2012
ChaPtEr 6 Key fIndIngs and PolIcy ImPlIcatIons
114
• malaysia and Turkey, on the other hand, had comparatively high levels of enhanced activities and student orientation.
• finally, a peak for enhanced activities was observed in Brazil, denmark, iceland, Korea, mexico, norway and spain.
australia, estonia and Portugal did not show any specific focus, as they have fairly similar means for all scales.
Thus, the ratio of frequencies of one practice compared to the others seems to be specific for certain geographical regions. an interesting finding is the similarity between scandinavian countries and non-european countries, which both showed peaks in reported enhanced activities. Presumably, similar profiles with a focus on enhanced activities can be ascribed to different motives and country-specific developments.
Profiles of co-operative practices in schools were based on six items representing the five central features of professional learning communities: co-operation, shared vision, a focus on learning, reflective inquiry and de-privatisation of practice (hord, 2004; Kruse, louis, and Bryk, 1995).
Two types of co-operative hands-on activities were distinguished: the exchange of material, and teaching jointly as a team. While the former can be expected to be common in most countries, teaching jointly as a team requires a higher level of co-ordination and reflection. all other characteristics were represented by a single item.
a shared vision refers to common goals and a common mind-set to work for them. The questionnaire asked about staff meetings as one setting to develop such a shared understanding.
a focus on student learning implies a regular evaluation of whether this goal has been achieved, which can be realised through systematic assessments.
reflective inquiry takes place when teachers have detailed and critical discussions about teaching practices and their experiences in classrooms. Professional learning activities within schools, such as team supervision, are one setting where such reflection can take place.
finally, de-privatisation of practice implies that teachers observe each other, give feedback, and act as mentor, advisor or specialist (lomos, hofman, and Bosker, 2011).
according to theory, a professional learning community exists only when all five aspects are realised in a school or within a certain group of teachers. latent profile analysis shows this is not the case for all teachers. in fact, some of the practices are reported to be used infrequently. moreover, in contrast to the profiles of classroom teaching practices, the curves for professional learning communities intersect in a number of countries. Thus, for participation in professional learning communities, the differences among profiles are not only in level, but also in kind.
results also showed that the profiles were mainly separated by three of the six items, while there was less variation among profile groups with regard to the other practices. in 20 of the 23 countries, the main differences among profiles were found with regard to team teaching, a rather sophisticated form of teacher co-operation. for half of these countries, there was also considerable variation in the average frequency of observation visits with mutual feedback

Teaching PracTices and Pedagogical innovaTion: evidence from Talis © OECD 2012
Key fIndIngs and PolIcy ImPlIcatIons ChaPtEr 6115
about instruction. in many of the countries, the profiles were further defined by reflective inquiry in the context of school internal professional learning activities; for example, team supervision.
Thus, the latent profiles could be distinguished mainly through practices that involve de-privatisation and reduction of autonomy with regard to the core of teachers’ everyday work: instructing students in classrooms. There was, however, one exception. in Korea, the profiles were rather separated by differences in the frequency of attending staff meetings in order to discuss the vision and the mission of the school. This is in line with previous research showing that team-teaching and classroom observations have a longer-standing tradition in east asia than in europe or the United states (e.g. Paine and ma, 1993; stigler and hiebert, 1999).
regressions of latent profiles on teacher- and school-level variaBlesin addition to the profile shape, the prediction of profile membership by several teacher- and school-level characteristics and processes was analysed. The literature review in chapter 2 suggested associations of classroom teaching practices with school leadership and co-operation among staff at the school level, and with professional development, feedback and appraisal, beliefs about the nature of teaching and learning, and teacher self-efficacy beliefs at the individual teacher level. Professional learning communities were expected to correlate with school size, autonomy, management and with a culture of feedback at the school level.
We used all predictors in regressions of both profiles, expecting the former group of variables to be more closely associated with classroom teaching practices and the latter to better predict participation in professional learning communities. By and large, the results confirmed our hypotheses. The profile that reports the most frequent use of all three dimensions of classroom teaching practices also agrees more with constructivist beliefs about the nature of teaching and learning, holds stronger self-efficacy beliefs, reports a more frequent attendance of professional development activities outside of school, and receives feedback and appraisal more often.
similar effects were observed for professional learning communities: only constructivist beliefs were shown to be less relevant for this kind of practice. classroom teaching practices were further shown to be more subject-specific than were co-operative professional learning activities. fewer significant effects were observed at the school level, especially for classroom teaching practices. interpretation of these associations is limited by the cross-sectional design of Talis that does not allow for causal inferences. nevertheless, a few conclusions can be drawn.
associations with professional development, as well as those with feedback and appraisal, suggest that teachers using all dimensions of classroom teaching practices more frequently and who are more involved in collaborative practices that reduce autonomy are also more involved in professional learning outside of schools and receive more systematic advice. either these programmes help teachers establish co-operative forms of professional learning within schools and provide instrumental support for improving instruction, or teachers who use more diverse teaching practices and co-operate more within schools are also more inclined to seek additional external support for improving their professional practice. This raises the question whether programmes that support teachers’ professional learning reach those most in need

Teaching PracTices and Pedagogical innovaTion: evidence from Talis© OECD 2012
ChaPtEr 6 Key fIndIngs and PolIcy ImPlIcatIons
116
of them. given the survey nature of the data, however, it cannot be ruled out that the group of teachers with the highest means are simply those with the strongest tendency to provide socially desirable answers.
at the school level, school size, attendance of teachers and the parents’ socio-economic background all predicted the average probability to be in profiles with higher average means for different indicators of professional practices. While teachers in smaller schools were on average more likely to be in profiles with higher reported frequency of classroom teaching practices, profile membership for participation in co-operative practices that involve de-privatisation was positively associated with school size. Thus, an average school size may be optimal if the aim is achieving both a culture of professional learning and diversification of classroom teaching practices. The only exceptions were australia and austria, where a positive relation with school size was found for both profiles, and mexico, where more diverse classroom teaching practices and the willingness to give up autonomy and work co-operatively were both higher in smaller schools.
for working hours, positive regression coefficients were observed predicting membership in both profiles. This stresses that high-quality teaching and intensive forms of co-operative professional learning can be time-consuming.
Positive regression coefficients for the socio-economic background suggests that teachers actively try to engage students growing up in non-academic environments by using a wide repertoire of practices, and it supports the claim that adapting to student characteristics is an inherent aspect of pedagogy.
interestingly, the parents’ educational background had dissimilar effects on the average participation in professional learning communities internationally: while a higher average education of parents is associated with an increase in the schools’ average odds of being in profiles with high reported frequencies for participation in professional learning communities in australia, austria, Belgium (fl.), denmark, ireland and italy, the opposite was found in Brazil, norway, Portugal and spain. This may suggest that in the former countries, teachers working under more difficult conditions rather tend to support each other while, in the latter, teachers in more advantaged environments showed a higher level of co-operation. in most eastern european countries as well as in Korea, no effect of the student composition on teacher collaboration was observed.
in contrast, neither school autonomy nor school leadership had a significant effect in more than a handful of countries. Previous research had suggested that school autonomy, especially with regard to the selection of teachers, would facilitate teachers’ co-operation (louis, marks, and Kruse, 1996). moreover, school autonomy is also considered an important factor in Pisa reports on successful schools (oecd, 2010b). This could not be supported with Talis data, however.
longitudinal research examining the process of developing a professional learning community internationally may help explain this finding. The expected positive effect of instructional leadership on both classroom teaching practices (e.g. Bryk et al., 2010) and participation in professional learning communities (e.g. leithwood and louis, 1998; louis and Kruse, 1995; hord, 1997) was also not observed. This could suggest either that leadership is less relevant for teachers’ professional practices than theoretically expected or that the non-significance is

Teaching PracTices and Pedagogical innovaTion: evidence from Talis © OECD 2012
Key fIndIngs and PolIcy ImPlIcatIons ChaPtEr 6117
attributable to the Talis design. international longitudinal and experimental studies are needed to clarify the reason for the unexpected results.
individual teacher background variables may be less malleable through educational policy than school policies and thus not a relevant starting point for policy makers. nevertheless, the effects of teacher background on professional practices shown in appendix c are interesting from a research point of view. first of all, we observed considerable gender effects. for future studies it would be worthwhile to examine whether these differences influence the actual quality of instruction or whether, on the contrary, they are functional for producing similar student outcomes under different conditions.
gender effects were also found for participation in professional learning communities, but they vary among countries. Based on previous research (Kruse, louis, and Bryk, 1995), we had expected more women than men to participate often in professional learning communities. This hypothesis was confirmed in seven countries, but in eight countries we observed the opposite.
other than gender, significant coefficients were found in 10 countries for regressions of profile membership regarding classroom teaching practices on teaching experience. These suggest that change might be taking place, with younger teachers being prepared differently during initial education and learning more diverse instructional methods.
Profiles of classroom teaching practices were, furthermore, subject-specific. While reading teachers were most likely to belong to the profile with the highest means, mathematics teachers were the least likely and science teachers were in between. Thus, reading instruction appears more variable in terms of teaching practices than science or mathematics instruction.
significant associations of classroom teaching practices with constructivist beliefs about the nature of teaching and learning replicate previous findings. Beliefs are considered to guide teachers’ professional practice (e.g. leuchter, Pauli, reusser and lipowsky, 2006). Therefore, the findings suggest it might also be worthwhile to address beliefs in actions aimed at improving teaching practices.
generally, the results confirm that teachers’ beliefs are more closely related to their classroom teaching practices, and that school-level conditions are more relevant for professional learning communities. Thus, we could replicate previous research on the nomological network of teachers’ professional practices at the teacher level, but only partly for the school level. most of the associations can – at least to a certain extent – be generalised across countries. The effect sizes vary cross-nationally, but the pattern of associations is consistent.
summaryTalis provides data on two foci of school development, with considerable variation within countries: classroom teaching practices and participation in professional learning communities. These can be considered prime candidates for further innovation in schools.
high-quality instruction is often defined as the use of a variety of classroom teaching practices, allowing for both teacher-directed and self-regulated learning. as described in chapter 2, this definition is substantiated by philosophies of education and empirical research: constructivist philosophies of teaching and learning suggest that students need diverse opportunities to

Teaching PracTices and Pedagogical innovaTion: evidence from Talis© OECD 2012
ChaPtEr 6 Key fIndIngs and PolIcy ImPlIcatIons
118
develop their understanding of the subject matter and to find solutions to problems on their own. This requires teaching practices that go beyond teacher-centred instruction, that are cognitively activating (mayer, 2004) and that confront students with challenging content (Brown, 1994).
student motivation and other affective outcomes may be best addressed by supporting autonomy, competence and social relatedness (deci and ryan, 1985). But these dimensions are insufficient for learning. research suggests strong effects of well-structured instruction and good classroom management on cognitive and – probably to a lesser extent – non-cognitive outcomes (creemers and Kyriakides, 2008; harris and chrispeels, 2006; hopkins, 2005; scheerens and Bosker, 1997). Thus, a combination of different practices is most promising for supporting both cognitive and non-cognitive student development: (a) enhanced activities including challenging tasks and content, (b) student-oriented, supportive practices and (c) teacher-directed practices that provide structure and clarity.
findings of the present report show that this conception of instructional quality as the diverse use of practices can, in fact, be identified across all participating countries: profiles of classroom teaching practices were not defined by preferences for one dimension of practices over the other, but could rather be separated along the average reported frequency for all of the three dimensions. a small group of teachers in each country reports a more frequent use of all three practices, while two larger groups report lower ones.
The latent profile with the highest means also reported higher self-efficacy, reported receiving more feedback and appraisal on their instruction, and reported being more involved in professional development activities outside of schools. Thus, the conception of instructional quality as diversity of practices also reflects teachers’ self-perception.
for educational policy and teacher education, the findings support calls for a good balance among the three dimensions of classroom teaching practices; that is, structuring, student orientation and enhanced activities. Propagating solely the use of enhanced activities would not match the complexity of teaching and learning processes. rather than promoting a single type of activity, it is advisable to regularly evaluate whether the ratio of structuring, student orientation, and enhanced activities is optimal.
The second focus of this report was on professional learning communities. The concept was developed during the 1990s and has received considerable attention. central features of professional learning communities are (a) co-operation, (b) shared vision, (c) a focus on learning, (d) reflective inquiry and (e) de-privatisation of practice (hord, 2004; Kruse, louis and Bryk, 1995). Practices that help to realise these features within a school exist across different education systems, as this report shows.
in many countries, developing a shared vision and a focus on student learning, but also the exchange of materials, as a fairly basic form of co-operation among staff is similarly common in most profiles. variation within schools was mainly found with regard to participation in reflective inquiry and de-privatisation, where teachers work together on the core of their professional activities.
The finding of stronger within-school differences on these practices replicates previous research showing that practices involving a reduction of autonomy are more difficult (less common)

Teaching PracTices and Pedagogical innovaTion: evidence from Talis © OECD 2012
Key fIndIngs and PolIcy ImPlIcatIons ChaPtEr 6119
than a simple exchange of materials or co-ordination in the preparation of instruction (e.g. steinert et al., 2006). it is also in line with studies in school development that advocate the improvement of instruction (e.g. Bryk et al., 2010).
empirical support for the value of de-privatising practice comes from the finding that teachers who report being involved in such activities regularly to also have higher self-efficacy. however, it remains open in which direction this effect operates.
Ultimately, evaluating the effectiveness of the profiles of classroom teaching practices and participation in co-operative professional learning activities would require more information on students’ views of their teacher’s instruction as well as their cognitive and non-cognitive outcomes – preferably from longitudinal or even experimental studies. currently, there is too little knowledge about the effects of educational processes on outcomes on a large scale, and especially about their cross-national comparability. one reason is that international surveys like Talis and Pisa have a cross-sectional design. Thus, they can describe instruction and examine correlations with background characteristics and other processes and outcomes at the classroom, school and country level. They cannot, however, examine effects of instruction on students’ development.
apart from conclusions about patterns of teachers’ practices and their nomological networks, the results also allow for evaluating the appropriateness of the method used. While factor analysis and item response theory scaling require items to be ordered on a single continuum that is obligatory for all participants, latent profile models allow for modelling heterogeneity within the population (eid, langeheine and diener, 2003). like latent class and cluster analysis, latent models describe typologies instead of dimensions. classification approaches have been used in previous studies examining both types of professional practices. for example, Kobarg et al. (2011) identified three profiles of science teaching: a blended pattern in which all types of scientific enquiry are frequently encountered, a focused pattern with ample opportunity for scientific enquiry but less frequent involvement in experiments, and a restricted pattern in which students report being seldom involved in scientific inquiry. for professional learning communities lomos, hofman and Bosker (2011) conducted cluster analysis and found four clusters. The first cluster had the highest scores for reflective dialogue, collaborative activity, shared sense of purpose and a focus on student learning. a second cluster was identified with relatively high scores for de-privatisation of practices and collaborative activity, and a third had high scores only for collaborative activity. The fourth cluster showed lower scores for all of the five characteristics.
These studies suggested that latent profile analysis may be more adequate for describing teachers’ professional practices than a dimensional model. With Talis data, we could only partly confirm this hypothesis. for classroom teaching practices we rather observed parallel profile lines, suggesting that the teachers’ responses within a school vary quantitatively rather than qualitatively. This may, however, be because we analysed a second order model based on three factor scores instead of using single items. Teachers within a school may vary more with respect to specific practices than to dimensions of practices. for professional learning communities, on the other hand, we observed intersecting profile lines. Thus, for this construct, latent profile analysis better represents the observed heterogeneity in patterns of practices within countries.
Teaching PracTices and Pedagogical innovaTion: evidence from Talis© OECD 2012
ChaPtEr 6 Key fIndIngs and PolIcy ImPlIcatIons
120
The findings of this study also bear upon the cross-national comparability of teachers’ professional practices. Previous research had suggested that it is not so much the instructional strategies that vary among countries, but rather the sequencing of lessons (stigler and hiebert, 1999) and their deep structure (mok et al., 2001). Therefore, rather small cross-national differences in the profiles of the use of self-reported classroom teaching practice were expected. There is little cross-national research examining professional learning communities. Thus, the analyses were rather exploratory for this construct.
The results of multilevel latent profile regressions suggest some similarities in the structure and function of both types of practices. across countries, three profiles were identified for classroom teaching practices that differed rather in level than in type. Three or four profiles were observed for professional learning communities that were differentiated mainly by three items: classroom observations, teaching jointly as a team and participating in school-internal professional development activities. in the vast majority of countries, profile membership regarding both types of practices was further associated with professional development activities outside of schools, receiving feedback and appraisal for innovative teaching, and teacher self-efficacy.
at the same time, we also found considerable differences. first, the shape of the profiles varied among countries. for classroom teaching practices some countries showed peaks for structuring, others for student orientation, and again others for enhanced activities. Profile shapes for participation in professional learning communities varied even more fundamentally among countries. The grouping for profiles of participation in professional learning communities is also different from that for classroom teaching practices and is not linked to geography. Thus, the structure of both types of professional practices is clearly country-specific, which limits their comparability. comparing profile sizes across countries and building an overall latent profile model would have required equivalence of the number of profiles and of the profile-specific means. concluding that the typological structure is similar would also have required similar profile sizes (eid, langeheine and diener, 2003).
analogously, equivalence can be tested for factor models. only when the factor structure and loadings are equivalent can correlations be made across countries, and a comparison of mean scores also requires equal intercepts (fontaine, 2008; vandenberg and lance, 2000). analyses of cross-cultural equivalence of factors of classroom teaching practices and collaboration among staff are described in the Talis Technical report (oecd, 2010a). equivalence of factor loadings was established, but intercepts were found to vary. hence, correlations can be compared across countries, but mean score comparisons are hard to interpret (oecd, 2010a). findings reported here suggest that latent profiles are not more comparable. This further suggests that country-specific conditions and traditions are responsible for the differences in profiles of practices. it remains open whether the higher visibility of enhanced activities and higher average frequencies for different co-operative activities in some countries reflect higher innovativeness, different pedagogical traditions or other practical reasons, e.g. larger class sizes that require students to work more self-reliantly. clearly, the results reinforce previous calls for more culture-specific definitions and analyses of innovation in education (e.g. scheerens, 2001).
What do these results tell us about innovation in education? in chapter 2, it was argued that cross-sectional survey data are not appropriate for discovering radically new ideas in education,
Teaching PracTices and Pedagogical innovaTion: evidence from Talis © OECD 2012
Key fIndIngs and PolIcy ImPlIcatIons ChaPtEr 6121
nor for examining the process of innovation. rather, they are better suited for an implementation check; that is, for determining whether rather recent developments in educational research and policy have found their way into teachers’ everyday practice. But even here, caution is advised to consider national and regional traditions and cultures when evaluating the profiles. Thus, we mainly leave it up to the reader to decide whether or not the observed practices suggest that policy foci are well-implemented.
Under the premise that professional practices based on socio-constructivist theories examined by Talis are considered innovative and beneficial for student learning and non-cognitive outcomes, the results suggest that the main driver for advancement is developing a large repertoire of classroom teaching practices as well as taking collective responsibility and working co-operatively to improve instruction. Teachers who are less involved in such activities should especially be the focus of policy and on-site intervention.
conclusions
• multilevel latent profile regression analysis served to characterise profiles of classroom teaching practices and professional learning communities and their nomological networks in 23 countries.
• across all countries we found three parallel profiles of classroom teaching practices. These were not defined by preferences for one dimension of practices over the other, but could rather be separated along the average reported frequency for all of the three dimensions. Qualitative differences of profile shapes were, however, observed among countries.
• for participation in professional learning communities, three or four latent profiles were identified. differences were both quantitative and qualitative. Profiles were separated mainly by three items that all measure co-operative practices involving a reduction of autonomy. only in the Korea was this pattern not observed; there, it was rather staff meetings for discussing the vision and mission of the school that define profiles. generally, cross-national variation in profile shapes was even stronger than for classroom teaching practices.
• Profile membership regarding both latent profiles was associated with external professional development, feedback and appraisal on innovation in instruction, and self-efficacy beliefs. This pattern was observed cross-nationally. school-level effects are, on the other hand, significant only in individual countries.
• The Talis design does not allow for causal inferences. Ultimately, an evaluation of the teaching practices profiles and participation in co-operative professional learning activities as effective would require additional information.
• The findings suggest that:
– The structure of the profiles is country-specific. Thus, patterns of self-reported professional practice are strongly influenced by the specific interaction between traditions, culture and educational policy in each education system. This variation limits the cross-national comparability of profiles and their correlations with other variables.

Teaching PracTices and Pedagogical innovaTion: evidence from Talis© OECD 2012
ChaPtEr 6 Key fIndIngs and PolIcy ImPlIcatIons
122
– Teachers vary considerably within schools with regard to their patterns of professional practices. for participation in professional learning communities, types of teachers with preferences for different practices were identified. latent profile analysis is more appropriate for modelling this within-country heterogeneity for patterns of participation in professional learning communities, while factor or irT (item response theory) models may serve well for scaling classroom teaching practices.
– latent profiles are not more comparable across countries than are factor models.
– Under the premise that professional practices based on socio-constructivist theories examined by Talis are considered innovative and beneficial for student learning and non-cognitive outcomes, the main driver for advancement in teachers’ professional practices lies with developing a large repertoire of classroom teaching practices and granting autonomy and isolation to co-operatively reflect pedagogical practice.

Teaching PracTices and Pedagogical innovaTion: evidence from Talis © OECD 2012
Key fIndIngs and PolIcy ImPlIcatIons ChaPtEr 6123
RefeRencesBrown, A.L. (1994), “The advancement of learning”, Educational Researcher, vol. 23, no. 8, pp. 4-12.
Bryk, A.S., P. Bender Sebring, E. Allensworth, S. Luppescu and J.Q. Easton (2010), Organizing Schools for Improvement: Lessons from Chicago, University of chicago Press, chicago.
Creemers, B.P.M. and L. Kyriakides (2008), The Dynamics of Educational Effectiveness, A Contribution to Policy, Practice and Theory in Contemporary Schools, routledge, london/new York.
Deci, E.L. and R.M. Ryan (1985), Intrinsic motivation and self-determination in human behavior, Plenum, new York.
Eid, M., Langeheine R. and E. Diener (2003), “comparing typological structures across cultures by multigroup latent class analysis. a primer”, Journal of Cross-Cultural Psychology, No. 34, pp. 195–210.evenson, d.h. and c.e. hmelo (2000, eds.), Problem-Based Learning: A Research Perspective on Learning Interactions, lawrence erlbaum associates, london.
Fontaine, J.R.J. (2008), “Traditional and multilevel approaches in cross-cultural research: an integration of methodological frameworks”, in f. J. r van de vijver, d.a. van hemert, and Y.h. Poortinga (eds.), Multilevel Analysis of Individuals and Cultures, lawrence erlbaum associates new York, london, pp. 65-92.
Harris, A. and J. Chrispeels (2006), Improving schools and educational systems: International perspectives, routledge, new York.
Hopkins, D. (ed.) (2005), “The Practice and Theory of school improvement”, in International Handbook of Educational Change, springer, dordrecht.
Hord, S.M. (1997), Professional Learning Communities: Communities of Continuous Inquiry and Improvement. southwest educational development laboratory, austin TX.
Hord, S.M. (ed.) (2004), Learning together, Leading together: Changing Schools through Professional Learning Communities, Teachers college Press, new York.
Klieme, E., C. Pauli and K. Reusser (2009), “The Pythagoras study”, in J. Tomás and T. seidel (eds.), The Power of Video Studies in Investigating Teaching and Learning in the Classroom, Waxmann, münster, pp. 137-160.
Kobarg, M., M. Prenzel, T. Seidel, M. Walker, B. McCrae, J. Cresswell and J. Wittwer (2011), An International Comparison of Science Teaching and Learning. Further Results from PISA 2006, Waxmann, münster.
Kruse, S., K.L. Louis and A. Bryk (1995), Let’s build teachers’ professional community. WCER Highlights, Url: http://www.wcer.wisc.edu/publications/WCER_Highlights/Vol.7_No.1_Spring_1 995/Teachers_prof_community.html, retrieved 1 may, 2011.
Leithwood, K. and K.S. Louis (1998), “organisational learning in schools: an introduction”, in K. leithwood and K. s. louis (eds.), Organisational learning in schools. swets and Zeitlinger, lisse, the netherlands, pp. 1-14.
Leuchter, M., C. Pauli, K. Reusser and F. Lipowsky (2006), „Unterrichtsbezogene Überzeugungen und Kognitionen von lehrpersonen“, Zeitschrift für Erziehungswissenschaft, vol. 9, no. 4, pp. 562-579.
Lomos, C., R.H. Hofman and R.J. Bosker, (2011), “The relationship between departments as professional communities and student achievement in secondary schools”, Teaching and Teacher Education, vol. 27 no. 4, pp. 722-731 .louis, K.s. (1992), “restructuring and the problem of teachers’ work”. in a. lieberman (ed.), The changing contexts of teaching (91st Yearbook of the national society for the study of education, vol. 1). chicago, pp. 138-156.
Louis, K.S. and S.D. Kruse (1995), Professionalism and community: Perspectives on reforming urban schools, corwin Press, Thousand oaks, ca.
Louis, K.S., H.M. Marks and S. Kruse (1996), “Teachers’ Professional community in restructuring schools”, American Educational Research Journal, vol. 33, no. 4, pp. 757-798.
Mayer, R. (2004), “should there be a three-strikes rule against pure discovery learning? The case for guided methods of instruction”, American Psychologist, vol. 59, no. 1, pp. 14-19.
Mok, I.A.C., P.M. Chik, P.Y. Ko, T. Kwan, M.L. Lo and F. Marton et al. (2001), “solving the paradox of the chinese teacher”, in d. a. Watkins and J. B. Biggs (eds.), Teaching the Chinese learner: Psychological and pedagogical perspectives, comparative education research centre, The University of hong Kong, hong Kong sar, china, pp. 161-180.
OECD (2010a), TALIS Technical Report, oecd Publishing.

Teaching PracTices and Pedagogical innovaTion: evidence from Talis© OECD 2012
ChaPtEr 6 Key fIndIngs and PolIcy ImPlIcatIons
124
OECD (2010b), PISA 2009 Results: What Makes a School Successful? Resources, Policies and Practices (volume iv), oecd Publishing.
Paine, L. and L. Ma (1993), “Teachers working together: a dialogue on organisational and cultural perspectives of chinese teachers”, International Journal of Educational Research, vol. 19, no. 8, pp. 675-697.
Scheerens, J. and R.J. Bosker (1997), The Foundations of Educational Effectiveness, Pergamon, oxford.
Scheerens, J. (guest editor) (2001), school effectiveness in developing countries, special issue of School Effectiveness and School Improvement, vol. 12, no. 4, pp. 353-466.
Steinert, B., E. Klieme, K. Maag Merki, P. Döbrich, U. Halbheer and A. Kunz (2006), „lehrerkooperation in der schule. Konzeption, erfassung, ergebnisse“, Zeitschrift für Pädagogik, vol. 52, no. 2, pp. 185-204.
Stigler, J.W. and J. Hiebert (1999), The teaching gap: Best ideas from the world’s teachers for improving education in the classroom, free Press, new York.
Vandenberg, R. J. and Lance, C. E. (2000), “a review and synthesis of the measurement invariance literature: suggestions, practices, and recommendations for organisational research”, Organisational Research Methods, vol. 3, no. 1, pp. 4-69.

125
Teaching PracTices and Pedagogical innovaTion: evidence from Talis © OECD 2012
Annex AMultilevel Latent Profile Analysis

Teaching PracTices and Pedagogical innovaTion: evidence from Talis© OECD 2012
annEx a multIlevel latent ProfIle analysIs
126
latent profile analysis (lPa) is derived from conventional latent class analysis, originally introduced by lazarsfeld and henry (1968) for the purposes of deriving latent attitude variables from responses to dichotomous survey items. important contributions to latent class analysis have been made by clogg (1995). for a review, see magidson and vermunt (2004) and Kaplan, Kim, and Kim (2009). in a traditional latent class analysis, it is assumed that an individual belongs to one and only one latent class, and that – given an individual’s latent class membership – the observed responses are independent of one another (referred to as the assumption of local independence). The latent classes arise from the patterns of response frequencies to categorical items, where the response frequencies play a role similar to that of the correlation matrix in factor analysis (lanza, collins, lemmon and schafer, 2007). The analogue of factor loadings are parameters that estimate the probability of a particular response on the manifest indicators given membership in the latent class. Unlike continuous latent variables (i.e. factors), categorical latent variables (latent classes) divide individuals into mutually exclusive and exhaustive groups.
The extension of latent class analysis to the problem of lPa is based on modelling finite mixtures of normal densities described next. specifically, rather than analysing dichotomous (or ordered categorical outcomes), we assume that each of the variables is continuous, typically assumed to follow a normal distribution. figure a.1 shows a diagram of a latent profile model. The squares represent the observed continuous items, and the circle inscribed with a C represents the categorical latent variable.
Figure A.1Latent class analysis model with continuous latent class indicators
y1
y2
y3
y4
c
multilevel latent class analysisUntil recently, applications of latent class and lPa were limited to single-level problems, ignoring possible clustering of observations due to sample design and research considerations. more general frameworks have been developed that allow latent class models to be extended to multilevel contexts, however, using the finite mixture modelling framework of latent class
Teaching PracTices and Pedagogical innovaTion: evidence from Talis © OECD 2012
multIlevel latent ProfIle analysIs annEx a127
analysis (mclachlan and Peel, 2000) implemented in software packages such as mplus (muthén and muthén, 1998-2007) and latent gold (vermunt and magidson, 2000). a paper by Kaplan and Keller (forthcoming) discuss problems of cluster effects in latent class analysis. The results indicate that the size of the intraclass correlation (icc), as well as between and within cluster sizes, is the most prominent factor in determining the amount of bias in these outcome measures, with increasing intraclass correlations combined with small between cluster sizes resulting in increased bias. Thus, for statistical as well as policy analytic reasons, we use multilevel latent profile analysis (mlPa) as our main statistical tool in this report.
our specification of mlPa is in line with vermunt (2003). To begin, let yig be the vector of responses for teacher i in school g, where i = 1, 2, … , ng ; g = 1,2, … , G. let K be the number of variables, where k = 1, 2, … , K. The multilevel latent profile model can be written in the form of a mixture of normal densities as
f (y ig ) = π cc=1
C
∑ f (y ig µcg ,Σcg )
where yig is a K -dimensional vector of responses for teacher i in school g, c are the proportion of teachers in profile c, and f(yig) is the density function for the outcomes for teacher i in school g. The density function is assumed to be normal with a mean vector µ and covariance matrix that are allowed to vary across schools and profiles.
addition of predictors to the mlpa modelan important extension to mlPa is the ability to add predictors to the model. specifically, it is not only important to reliably and validly determine the number of latent profiles; it is also important from a policy viewpoint to test the importance of predictors of profile membership. in the context of mlPa, these predictors can be measured at both levels – in Talis, measurements are taken at both the teacher and school levels.
figure a.2 shows an mlPa with predictors of profile membership at the teacher and school levels. in the diagram, the square inscribed with X represents any generic teacher-level predictor of latent profile membership. noting that profile membership is a categorical variable, the teacher-level part of the model represents a multinomial logistic regression. regression coefficients associated with teacher effects are, in fact, the log-odds of profile membership relative to a reference group for a unit change in the predictor variable. note that the regression coefficients at the teacher level can be transformed to odds ratios. specifically, let ßk represent any of the K regression coefficients, then, eßk gives the odds of membership in a particular latent profile relative to a reference profile.
The dark circles inscribed on the categorical latent variable in the within (teacher) level part of figure a.2 represent random intercepts. These are represented as circles because they are, in fact, latent variables. These are modelled as a function of predictor variables at the school level, represented generically as W. The circle inscribed with f is a latent variable used to handle often-difficult numerical integration problems associated with the fact that the latent classes are often highly correlated.

Teaching PracTices and Pedagogical innovaTion: evidence from Talis© OECD 2012
annEx a multIlevel latent ProfIle analysIs
128
estimation of the multilevel latent profile modelanalyses described in chapter 4 and chapter 5 utilise the mplus software program (muthén and muthén, 1998-2007). estimation of the multilevel latent profile model utilises maximum likelihood estimation via the em algorithm (dempster, laird and rubin, 1977), with robust standard errors. missing data are handled via a full information maximum likelihood approach, which rests on the assumption that the missing data are missing at random (mar). The mar assumption suggests that missing data on any of the indicators of the model are not dependent on the indictors themselves, but could be dependent on other indicators. for example, a teacher’s decision to omit her age is assumed to be unrelated to her age, but could be due to other indicators in the model.
measures of model adequacyin lPa, developing labels for the latent profiles presumes that the model adequately describes the data. although there are many methods for assessing the adequacy of a latent profile model, for simplicity, we focus on one measure of model selection and one measure of classification adequacy. in terms of model selection, we focus on the Bayesian information criterion (Bic),
w
Figure A.2Multilevel latent profile analysis model with predictors
y1 y2 y3 y4 y5 y6
c
x
f
Within
Between
y1 y2 y3 y4 y5 y6
c
x
y1 y2 y3 y4 y5 y6
c
x
c#1 c#2

Teaching PracTices and Pedagogical innovaTion: evidence from Talis © OECD 2012
multIlevel latent ProfIle analysIs annEx a129
also referred to as schwarz criterion (schwarz, 1978). The Bic is a measure used for selecting among a set of competing models and has its origins in model selection based on the notion of Bayes factors (Kass and raftery, 1995); it is, arguably, the most widely used method for model selection in the context of categorical latent variable models (magidson and vermunt, 2004). The Bic can be written as
BIC = −2logL + qlog(n)
where log L is the log likelihood value, q is the number of parameters in the model, and n represents the total sample size. in terms of model comparison, the model with the lower Bic among a set of competing models is preferred from a posterior predictive point of view.
in terms of classification quality, we focus on the entropy-R2, which starts with the general problem of reducing classification errors. one measure of the proportional reduction in classification errors is based on the concept of entropy. entropy was developed for the latent class model by ramaswamy, desarbo, reibstein and robinson (1993) as an overall measure of the degree of fuzziness in profile membership. values close to 0 can occur when the posterior probabilities of profile membership are equal, suggesting that the latent classes are not distinct. higher values of entropy suggest clearer distinctions among the latent classes. The entropy-R2 is used in an analogous fashion for latent profile analysis.

Teaching PracTices and Pedagogical innovaTion: evidence from Talis© OECD 2012
annEx a multIlevel latent ProfIle analysIs
130
RefeRences
Clogg, C.C. (1995), “latent class models”, in g. arminger, c.c. clogg, and m.e. sobel (eds.), handbook of statistical modeling in the social and behavioral sciences, Jossey-Bass, san francisco, ca, pp. 81-110.
Dempster, A.P., N.M. Laird and D.B. Rubin (1977), “maximum likelihood from incomplete data via the em algorithm (with discussion)”, Journal of the Royal Statistical Society, Series B, vol. 39, pp. 1-38.
Kaplan, D., J.-S. Kim and S.-Y. Kim (2009), “multilevel latent variable modeling: current research and recent developments”, in r. e. millsap and a. maydeu-olivares (eds.), Handbook of quantitative methods in psychology, sage Publications, newbury Park.
Kass, R.E. and A.E. Raftery (1995), “Bayes factors”, Journal of the American Statistical Association, vol. 90, pp. 773-795.
Lanza, S.T., L.M. Collins, D.R. Lemmon and J.L. Schafer (2007), “Proc lca: a sas procedure for latent class analysis”, Structural Equation Modeling, vol. 14, pp. 671-694.
Lazarsfeld, P.F. and N.W. Henry (1968), Latent structure analysis, houghton mifflin, Boston.
McLachlan, G. and D. Peel (2000), Finite mixture models, John Wiley and sons, new York.
Magidson, J. and J.K. Vermunt (2004), “latent class models”, in d. Kaplan (ed.), The Sage handbook of quantitative methodology for the social sciences . sage Publications, Thousand oaks, ca, pp. 175-198.
Muthén, L.K. and B. Muthén (1998-2007), Mplus user’s guide, Fifth edition, muthén and muthén, los angeles.
Ramaswamy, VS., W.S. Desarbo, D.J. Reibstein and W.T. Robinson (1993), “an empirical pooling approach for estimating marketing mix elasticities with pims data”, Marketing Science, vol. 12, pp. 103-124.
Schwarz, G. (1978), “estimating the dimension of a model”, The Annals of Statistics, vol. 6, pp. 461-464.
Vermunt, J.K. and J. Magidson (2000), latent gold user’s guide: statistical innovations [computer software manual]. Belmont, ma.
Vermunt, J.K. (2003), multilevel latent class models. in r.m. stolzenberg (ed.), Sociological methodology (vol. 23, pp. 213-239). Boston: Blackwell Publishing.

131
Teaching PracTices and Pedagogical innovaTion: evidence from Talis © OECD 2012
Annex BModel Fit for Latent Profile Analysis with Different Numbers of Profiles

Teaching PracTices and Pedagogical innovaTion: evidence from Talis© OECD 2012
annEx b model fIt for latent ProfIle analysIs wIth dIfferent numbers of ProfIles
132
Table B.4 Model fit for latent profile analysis with different numbers of profiles of teaching practices for Brazil
Number of profiles of teaching practices BIC AIC Entropy % in p 1 % in p 2 % in p 3 % in p 4 % in p 5 % in p 6
2 42 084 42 011 0.85 62.25 37.75
3 38 205 38 099 0.87 36.85 42.34 20.80
4 35 949 35 810 0.87 24.46 25.63 38.02 11.90
5 34 234 34 061 0.88 16.45 27.98 30.52 17.73 7.32
6 33 062 32 856 0.88 11.72 24.94 25.00 13.60 18.90 5.85
notes: aic refers to the akaike information criterion; Bic refers to the Bayesian information criterion. source: oecd, TALIS Database. Teaching and Learning International Survey 2008.1 2 http://dx.doi.org/10.1787/888932647551
Table B.3 Model fit for latent profile analysis with different numbers of profiles of teaching practices for Belgium (Flemish community)
Number of profiles of teaching practices BIC AIC Entropy % in p 1 % in p 2 % in p 3 % in p 4 % in p 5 % in p 6
2 16 629 16 561 0.91 83.11 16.90
3 14 851 14 753 0.91 5.36 25.60 69.04
4 13 936 13 807 0.89 28.01 10.58 58.61 2.80
5 13 489 13 330 0.89 54.23 12.55 28.37 4.05 0.81
6 13 155 12 965 0.88 48.45 2.44 0.42 28.10 14.63 5.96
notes: aic refers to the akaike information criterion; Bic refers to the Bayesian information criterion. source: oecd, TALIS Database. Teaching and Learning International Survey 2008.1 2 http://dx.doi.org/10.1787/888932647532
Table B.2 Model fit for latent profile analysis with different numbers of profiles of teaching practices for Austria
Number of profiles of teaching practices BIC AIC Entropy % in p 1 % in p 2 % in p 3 % in p 4 % in p 5 % in p 6
2 22 669 22 599 0.87 78.11 21.89
3 20 701 20 600 0.86 34.25 57.01 8.74
4 19 411 19 279 0.87 47.21 14.22 35.74 2.83
5 18 801 18 637 0.84 33.16 20.68 9.33 2.53 34.30
6 18 305 18 110 0.86 33.71 21.77 31.32 0.60 9.93 2.68
notes: aic refers to the akaike information criterion; Bic refers to the Bayesian information criterion. source: oecd, TALIS Database. Teaching and Learning International Survey 2008.1 2 http://dx.doi.org/10.1787/888932647513
Table B.1 Model fit for latent profile analysis with different numbers of profiles of teaching practices for Australia
Number of profiles of teaching practices BIC AIC Entropy % in p 1 % in p 2 % in p 3 % in p 4 % in p 5 % in p 6
2 13 047 12 985 0.82 73.49 26.52
3 12 221 12 130 0.82 43.13 47.63 9.23
4 11 736 11 617 0.83 33.90 42.90 4.17 19.03
5 11 513 11 366 0.85 31.53 40.96 6.20 0.01 20.69
6 11 424 11 249 0.81 27.37 34.75 0.57 21.97 11.46 3.88
notes: aic refers to the akaike information criterion; Bic refers to the Bayesian information criterion. source: oecd, TALIS Database. Teaching and Learning International Survey 2008.1 2 http://dx.doi.org/10.1787/888932647494

Teaching PracTices and Pedagogical innovaTion: evidence from Talis © OECD 2012
model fIt for latent ProfIle analysIs wIth dIfferent numbers of ProfIles annEx b133
Table B.8 Model fit for latent profile analysis with different numbers of profiles of teaching practices for Hungary
Number of profiles of teaching practices BIC AIC Entropy % in p 1 % in p 2 % in p 3 % in p 4 % in p 5 % in p 6
2 14 237 14 171 0.87 19.72 80.28
3 13 044 12 949 0.83 37.25 7.53 55.23
4 12 363 12 238 0.85 13.52 42.86 1.95 41.67
5 11 936 11 781 0.84 19.23 32.16 6.27 1.39 40.94
6 11 729 11 544 0.81 36.27 0.87 20.98 4.50 26.03 11.36
notes: aic refers to the akaike information criterion; Bic refers to the Bayesian information criterion. source: oecd, TALIS Database. Teaching and Learning International Survey 2008.1 2 http://dx.doi.org/10.1787/888932647627
Table B.7 Model fit for latent profile analysis with different numbers of profiles of teaching practices for Estonia
Number of profiles of teaching practices BIC AIC Entropy % in p 1 % in p 2 % in p 3 % in p 4 % in p 5 % in p 6
2 18 254 18 188 0.85 77.80 22.20
3 16 915 16 818 0.84 57.31 35.69 7.00
4 16 337 16 210 0.84 38.28 12.58 46.78 2.37
5 16 013 15 856 0.80 37.18 20.97 33.61 6.74 1.49
6 15 797 15 610 0.82 31.12 36.21 0.29 22.89 7.29 2.20
notes: aic refers to the akaike information criterion; Bic refers to the Bayesian information criterion. source: oecd, TALIS Database. Teaching and Learning International Survey 2008.1 2 http://dx.doi.org/10.1787/888932647608
Table B.6 Model fit for latent profile analysis with different numbers of profiles of teaching practices for Denmark
Number of profiles of teaching practices BIC AIC Entropy % in p 1 % in p 2 % in p 3 % in p 4 % in p 5 % in p 6
2 8 040 7 980 0.86 69.90 30.10
3 7 028 6 941 0.86 47.89 11.34 40.77
4 6 462 6 349 0.86 36.79 18.34 41.32 3.56
5 6 050 5 909 0.86 17.37 12.36 2.59 38.48 29.19
6 5 773 5 606 0.88 15.68 36.31 4.34 29.31 13.99 0.36
notes: aic refers to the akaike information criterion; Bic refers to the Bayesian information criterion. source: oecd, TALIS Database. Teaching and Learning International Survey 2008.1 2 http://dx.doi.org/10.1787/888932647589
Table B.5 Model fit for latent profile analysis with different numbers of profiles of teaching practices for Bulgaria
Number of profiles of teaching practices BIC AIC Entropy % in p 1 % in p 2 % in p 3 % in p 4 % in p 5 % in p 6
2 24 170 24 101 0.80 62.22 37.78
3 22 853 22 754 0.81 45.52 12.94 41.54
4 21 960 21 830 0.82 9.62 11.64 42.37 36.37
5 21 655 21 494 0.81 8.85 2.77 37.78 35.34 15.27
6 21 374 21 182 0.82 7.66 5.03 32.88 34.76 3.18 16.48
notes: aic refers to the akaike information criterion; Bic refers to the Bayesian information criterion. source: oecd, TALIS Database. Teaching and Learning International Survey 2008.1 2 http://dx.doi.org/10.1787/888932647570

Teaching PracTices and Pedagogical innovaTion: evidence from Talis© OECD 2012
annEx b model fIt for latent ProfIle analysIs wIth dIfferent numbers of ProfIles
134
Table B.12 Model fit for latent profile analysis with different numbers of profiles of teaching practices for Korea
Number of profiles of teaching practices BIC AIC Entropy % in p 1 % in p 2 % in p 3 % in p 4 % in p 5 % in p 6
2 21 906 21 840 0.92 82.88 17.12
3 20 154 20 058 0.89 27.35 7.31 65.34
4 19 370 19 244 0.83 37.30 16.75 40.08 5.87
5 18 700 18 544 0.87 31.47 41.11 2.75 6.59 18.09
6 18 433 18 248 0.84 25.26 5.05 10.36 38.47 18.33 2.54
notes: aic refers to the akaike information criterion; Bic refers to the Bayesian information criterion. source: oecd, TALIS Database. Teaching and Learning International Survey 2008.1 2 http://dx.doi.org/10.1787/888932647703
Table B.11 Model fit for latent profile analysis with different numbers of profiles of teaching practices for Italy
Number of profiles of teaching practices BIC AIC Entropy % in p 1 % in p 2 % in p 3 % in p 4 % in p 5 % in p 6
2 31 888 31 816 0.82 67.25 32.75
3 29 457 29 353 0.83 45.52 41.30 13.18
4 27 950 27 813 0.83 43.92 7.49 21.27 27.32
5 27 008 26 839 0.85 15.84 28.14 38.79 13.60 3.64
6 26 572 26 370 0.85 15.08 26.62 36.59 5.91 14.82 0.98
notes: aic refers to the akaike information criterion; Bic refers to the Bayesian information criterion. source: oecd, TALIS Database. Teaching and Learning International Survey 2008.1 2 http://dx.doi.org/10.1787/888932647684
Table B.10 Model fit for latent profile analysis with different numbers of profiles of teaching practices for Ireland
Number of profiles of teaching practices BIC AIC Entropy % in p 1 % in p 2 % in p 3 % in p 4 % in p 5 % in p 6
2 11 316 11 254 0.84 20.93 79.07
3 10 697 10 606 0.87 69.13 3.30 27.58
4 10 496 10 377 0.82 55.80 10.72 1.92 31.56
5 10 325 10 177 0.81 51.21 10.67 2.34 6.18 29.59
6 10 108 9 931 0.79 10.31 6.83 2.20 44.48 10.22 25.97
notes: aic refers to the akaike information criterion; Bic refers to the Bayesian information criterion. source: oecd, TALIS Database. Teaching and Learning International Survey 2008.1 2 http://dx.doi.org/10.1787/888932647665
Table B.9 Model fit for latent profile analysis with different numbers of profiles of teaching practices for Iceland
Number of profiles of teaching practices BIC AIC Entropy % in p 1 % in p 2 % in p 3 % in p 4 % in p 5 % in p 6
2 6 151 6 095 0.84 77.88 22.12
3 5 602 5 521 0.81 44.92 9.24 45.85
4 5 337 5 230 0.84 12.88 46.70 1.86 38.56
5 5 183 5 051 0.82 23.14 1.36 23.22 44.32 7.97
6 5 102 4 945 0.85 23.48 24.07 42.80 7.71 1.70 0.25
notes: aic refers to the akaike information criterion; Bic refers to the Bayesian information criterion. source: oecd, TALIS Database. Teaching and Learning International Survey 2008.1 2 http://dx.doi.org/10.1787/888932647646

Teaching PracTices and Pedagogical innovaTion: evidence from Talis © OECD 2012
model fIt for latent ProfIle analysIs wIth dIfferent numbers of ProfIles annEx b135
Table B.16 Model fit for latent profile analysis with different numbers of profiles of teaching practices for Mexico
Number of profiles of teaching practices BIC AIC Entropy % in p 1 % in p 2 % in p 3 % in p 4 % in p 5 % in p 6
2 22 166 22 099 0.82 46.20 53.80
3 20 112 20 014 0.86 33.65 22.68 43.68
4 19 184 19 056 0.84 16.38 34.01 16.90 32.71
5 18 494 18 336 0.86 29.91 12.28 30.70 19.42 7.69
6 18 104 17 915 0.85 9.51 21.34 25.26 23.59 4.77 15.53
notes: aic refers to the akaike information criterion; Bic refers to the Bayesian information criterion. source: oecd, TALIS Database. Teaching and Learning International Survey 2008.1 2 http://dx.doi.org/10.1787/888932647779
Table B.15 Model fit for latent profile analysis with different numbers of profiles of teaching practices for Malta
Number of profiles of teaching practices BIC AIC Entropy % in p 1 % in p 2 % in p 3 % in p 4 % in p 5 % in p 6
2 5 941 5 885 0.90 82.00 18.00
3 5 402 5 322 0.88 28.08 8.37 63.55
4 5 246 5 140 0.82 45.55 7.20 32.40 14.85
5 5 127 4 996 0.84 18.45 31.59 7.11 1.89 40.95
6 5 100 4 945 0.83 17.10 6.03 5.49 31.50 38.07 1.80
notes: aic refers to the akaike information criterion; Bic refers to the Bayesian information criterion. source: oecd, TALIS Database. Teaching and Learning International Survey 2008.1 2 http://dx.doi.org/10.1787/888932647760
Table B.14 Model fit for latent profile analysis with different numbers of profiles of teaching practices for Malaysia
Number of profiles of teaching practices BIC AIC Entropy % in p 1 % in p 2 % in p 3 % in p 4 % in p 5 % in p 6
2 32 417 32 347 0.84 30.62 69.38
3 29 678 29 577 0.86 43.24 14.80 41.96
4 28 600 28 467 0.88 38.54 3.87 41.01 16.58
5 27 737 27 572 0.85 21.35 28.70 32.80 13.85 3.30
6 27 221 27 024 0.85 10.34 18.69 2.75 29.06 28.08 11.08
notes: aic refers to the akaike information criterion; Bic refers to the Bayesian information criterion. source: oecd, TALIS Database. Teaching and Learning International Survey 2008.1 2 http://dx.doi.org/10.1787/888932647722
Table B.13 Model fit for latent profile analysis with different numbers of profiles of teaching practices for lithuania
Number of profiles of teaching practices BIC AIC Entropy % in p 1 % in p 2 % in p 3 % in p 4 % in p 5 % in p 6
2 23 686 23 619 0.82 72.46 27.54
3 21 962 21 864 0.83 45.03 10.68 44.29
4 21 095 20 966 0.81 20.32 45.62 26.01 8.05
5 20 666 20 507 0.80 8.64 31.55 17.43 6.31 36.07
6 20 354 20 164 0.81 22.74 7.90 35.57 22.77 8.05 2.98
notes: aic refers to the akaike information criterion; Bic refers to the Bayesian information criterion. source: oecd, TALIS Database. Teaching and Learning International Survey 2008.1 2 http://dx.doi.org/10.1787/888932647722

Teaching PracTices and Pedagogical innovaTion: evidence from Talis© OECD 2012
annEx b model fIt for latent ProfIle analysIs wIth dIfferent numbers of ProfIles
136
Table B.20 Model fit for latent profile analysis with different numbers of profiles of teaching practices for the slovak Republic
Number of profiles of teaching practices BIC AIC Entropy % in p 1 % in p 2 % in p 3 % in p 4 % in p 5 % in p 6
2 19 785 19 719 0.84 74.89 25.12
3 18 013 17 916 0.86 53.55 38.26 8.19
4 17 241 17 115 0.86 43.49 39.58 2.93 14.00
5 16 568 16 412 0.85 27.58 1.97 24.56 8.58 37.31
6 16 304 16 118 0.85 25.54 36.75 0.82 23.93 9.11 3.85
notes: aic refers to the akaike information criterion; Bic refers to the Bayesian information criterion. source: oecd, TALIS Database. Teaching and Learning International Survey 2008.1 2 http://dx.doi.org/10.1787/888932647855
Table B.19 Model fit for latent profile analysis with different numbers of profiles of teaching practices for Portugal
Number of profiles of teaching practices BIC AIC Entropy % in p 1 % in p 2 % in p 3 % in p 4 % in p 5 % in p 6
2 19 265 19 199 0.85 77.91 22.10
3 18 194 18 098 0.83 54.46 9.66 35.88
4 17 731 17 605 0.83 42.91 3.01 39.90 14.19
5 17 443 17 287 0.82 33.24 2.37 36.32 8.65 19.43
6 17 299 17 113 0.82 32.77 5.27 18.21 2.37 32.80 8.58
notes: aic refers to the akaike information criterion; Bic refers to the Bayesian information criterion. source: oecd, TALIS Database. Teaching and Learning International Survey 2008.1 2 http://dx.doi.org/10.1787/888932647836
Table B.18 Model fit for latent profile analysis with different numbers of profiles of teaching practices for Poland
Number of profiles of teaching practices BIC AIC Entropy % in p 1 % in p 2 % in p 3 % in p 4 % in p 5 % in p 6
2 20 108 20 042 0.79 36.09 63.91
3 18 510 18 413 0.82 13.79 49.71 36.50
4 17 938 17 811 0.81 27.73 5.33 44.22 22.72
5 17 611 17 454 0.80 17.03 36.60 31.36 12.40 2.60
6 17 452 17 265 0.79 8.45 32.65 2.28 26.64 9.42 20.57
notes: aic refers to the akaike information criterion; Bic refers to the Bayesian information criterion. source: oecd, TALIS Database. Teaching and Learning International Survey 2008.1 2 http://dx.doi.org/10.1787/888932647817
Table B.17 Model fit for latent profile analysis with different numbers of profiles of teaching practices for norway
Number of profiles of teaching practices BIC AIC Entropy % in p 1 % in p 2 % in p 3 % in p 4 % in p 5 % in p 6
2 10 163 10 100 0.83 70.83 29.17
3 9 086 8 994 0.82 44.81 12.66 42.53
4 8 548 8 428 0.83 30.92 20.54 43.76 4.77
5 8 185 8 036 0.84 21.64 10.69 39.33 0.88 27.46
6 7 953 7 775 0.84 16.21 36.22 0.35 27.68 14.50 5.04
notes: aic refers to the akaike information criterion; Bic refers to the Bayesian information criterion. source: oecd, TALIS Database. Teaching and Learning International Survey 2008.1 2 http://dx.doi.org/10.1787/888932647798

Teaching PracTices and Pedagogical innovaTion: evidence from Talis © OECD 2012
model fIt for latent ProfIle analysIs wIth dIfferent numbers of ProfIles annEx b137
Table B.24 Model fit for latent profile analysis with different numbers of profiles of participation in professional learning communities for Australia
Number of profiles of teaching practices BIC AIC Entropy % in p 1 % in p 2 % in p 3 % in p 4 % in p 5 % in p 6
2 44 953 44 839 0.89 56.25 43.75
3 44 267 44 107 0.89 50.80 6.59 42.62
4 43 909 43 704 0.93 6.86 53.70 29.81 9.63
5 43 290 43 039 0.93 43.84 5.82 25.94 12.99 11.40
6 43 084 42 788 0.90 37.17 12.72 17.99 19.45 5.45 7.22
notes: aic refers to the akaike information criterion; Bic refers to the Bayesian information criterion. source: oecd, TALIS Database. Teaching and Learning International Survey 2008.1 2 http://dx.doi.org/10.1787/888932647931
Table B.23 Model fit for latent profile analysis with different numbers of profiles of teaching practices for Turkey
Number of profiles of teaching practices BIC AIC Entropy % in p 1 % in p 2 % in p 3 % in p 4 % in p 5 % in p 6
2 24 852 24 786 0.86 66.77 33.23
3 22 702 22 605 0.86 40.19 43.07 16.74
4 21 481 21 354 0.87 30.36 38.39 8.94 22.32
5 20 878 20 721 0.86 25.81 21.87 31.00 6.77 14.55
6 20 464 20 277 0.86 16.32 26.48 4.39 26.77 17.00 9.03
notes: aic refers to the akaike information criterion; Bic refers to the Bayesian information criterion. source: oecd, TALIS Database. Teaching and Learning International Survey 2008.1 2 http://dx.doi.org/10.1787/888932647912
Table B.22 Model fit for latent profile analysis with different numbers of profiles of teaching practices for spain
Number of profiles of teaching practices BIC AIC Entropy % in p 1 % in p 2 % in p 3 % in p 4 % in p 5 % in p 6
2 19 467 19 400 0.88 78.55 21.45
3 17 301 17 203 0.89 32.80 6.73 60.47
4 16 223 16 095 0.86 44.43 34.36 4.47 16.74
5 15 423 15 265 0.88 34.24 2.17 5.85 38.83 18.91
6 15 041 14 852 0.85 27.14 5.23 2.05 30.78 13.56 21.24
notes: aic refers to the akaike information criterion; Bic refers to the Bayesian information criterion. source: oecd, TALIS Database. Teaching and Learning International Survey 2008.1 2 http://dx.doi.org/10.1787/888932647893
Table B.21 Model fit for latent profile analysis with different numbers of profiles of teaching practices for slovenia
Number of profiles of teaching practices BIC AIC Entropy % in p 1 % in p 2 % in p 3 % in p 4 % in p 5 % in p 6
2 16 261 16 195 0.83 78.20 21.81
3 15 066 14 970 0.84 59.84 34.75 5.41
4 14 495 14 369 0.84 50.58 10.72 37.29 1.42
5 14 091 13 936 0.80 22.11 43.04 5.54 1.05 28.26
6 13 904 13 718 0.79 42.80 1.01 11.70 3.96 27.92 12.61
notes: aic refers to the akaike information criterion; Bic refers to the Bayesian information criterion. source: oecd, TALIS Database. Teaching and Learning International Survey 2008.1 2 http://dx.doi.org/10.1787/888932647874

Teaching PracTices and Pedagogical innovaTion: evidence from Talis© OECD 2012
annEx b model fIt for latent ProfIle analysIs wIth dIfferent numbers of ProfIles
138
Table B.28 Model fit for latent profile analysis with different numbers of profiles of participation in professional learning communities for Bulgaria
Number of profiles of teaching practices BIC AIC Entropy % in p 1 % in p 2 % in p 3 % in p 4 % in p 5 % in p 6
2 64 826 64 702 0.96 83.81 16.19
3 61 891 61 717 0.97 78.18 12.11 9.71
4 61 131 60 906 0.95 72.92 9.21 6.26 11.61
5 n.a. n.a. n.a. n.a. n.a. n.a. n.a. n.a.
6 n.a. n.a. n.a. n.a. n.a. n.a. n.a. n.a. n.a.
notes: aic refers to the akaike information criterion; Bic refers to the Bayesian information criterion. source: oecd, TALIS Database. Teaching and Learning International Survey 2008.1 2 http://dx.doi.org/10.1787/888932648007
Table B.27 Model fit for latent profile analysis with different numbers of profiles of participation in professional learning communities for Brazil
Number of profiles of teaching practices BIC AIC Entropy % in p 1 % in p 2 % in p 3 % in p 4 % in p 5 % in p 6
2 117 186 117 053 0.97 80.58 19.42
3 113 406 113 220 0.99 12.44 7.75 79.82
4 110 289 110 049 0.93 48.68 31.19 7.72 12.42
5 n.a. n.a. n.a. n.a. n.a. n.a. n.a. n.a.
6 n.a. n.a. n.a. n.a. n.a. n.a. n.a. n.a. n.a.
notes: aic refers to the akaike information criterion; Bic refers to the Bayesian information criterion. source: oecd, TALIS Database. Teaching and Learning International Survey 2008.1 2 http://dx.doi.org/10.1787/888932647988
Table B.26 Model fit for latent profile analysis with different numbers of profiles of participation in professional learning communities for Belgium (Flemish community)
Number of profiles of teaching practices BIC AIC Entropy % in p 1 % in p 2 % in p 3 % in p 4 % in p 5 % in p 6
2 57 449 57 327 0.99 88.34 11.66
3 55 504 55 333 0.99 79.57 12.71 7.72
4 n.a. n.a. n.a. n.a. n.a. n.a. n.a.
5 n.a. n.a. n.a. n.a. n.a. n.a. n.a. n.a.
6 n.a. n.a. n.a. n.a. n.a. n.a. n.a. n.a. n.a.
notes: aic refers to the akaike information criterion; Bic refers to the Bayesian information criterion. source: oecd, TALIS Database. Teaching and Learning International Survey 2008.1 2 http://dx.doi.org/10.1787/888932647969
Table B.25 Model fit for latent profile analysis with different numbers of profiles of participation in professional learning communities for Austria
Number of profiles of teaching practices BIC AIC Entropy % in p 1 % in p 2 % in p 3 % in p 4 % in p 5 % in p 6
2 79 942 79 816 0.92 49.57 50.43
3 78 053 77 876 0.92 49.57 12.37 38.07
4 76 235 76 008 0.96 43.39 28.18 18.59 9.84
5 n.a. n.a. n.a. n.a. n.a. n.a. n.a. n.a.
6 n.a. n.a. n.a. n.a. n.a. n.a. n.a. n.a. n.a.
notes: aic refers to the akaike information criterion; Bic refers to the Bayesian information criterion. source: oecd, TALIS Database. Teaching and Learning International Survey 2008.1 2 http://dx.doi.org/10.1787/888932647950
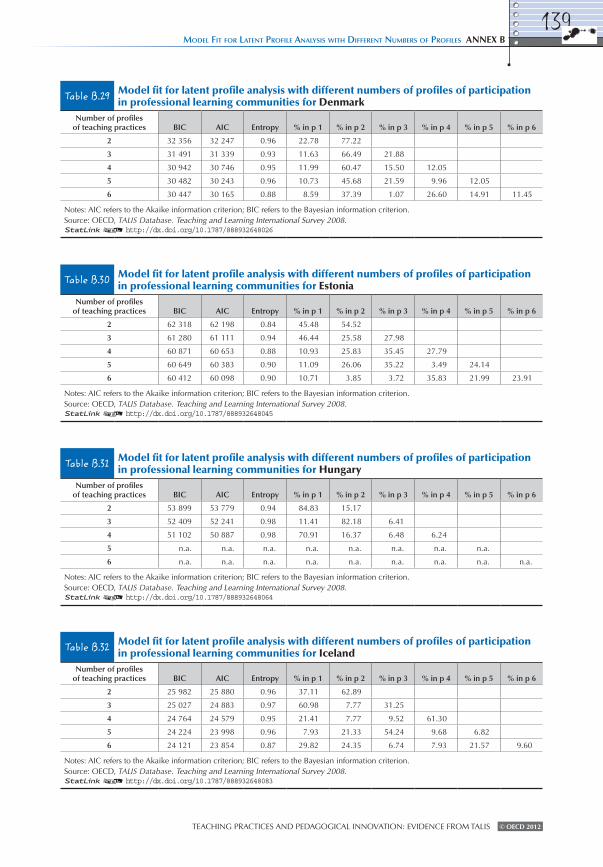
Teaching PracTices and Pedagogical innovaTion: evidence from Talis © OECD 2012
model fIt for latent ProfIle analysIs wIth dIfferent numbers of ProfIles annEx b139
Table B.32 Model fit for latent profile analysis with different numbers of profiles of participation in professional learning communities for Iceland
Number of profiles of teaching practices BIC AIC Entropy % in p 1 % in p 2 % in p 3 % in p 4 % in p 5 % in p 6
2 25 982 25 880 0.96 37.11 62.89
3 25 027 24 883 0.97 60.98 7.77 31.25
4 24 764 24 579 0.95 21.41 7.77 9.52 61.30
5 24 224 23 998 0.96 7.93 21.33 54.24 9.68 6.82
6 24 121 23 854 0.87 29.82 24.35 6.74 7.93 21.57 9.60
notes: aic refers to the akaike information criterion; Bic refers to the Bayesian information criterion. source: oecd, TALIS Database. Teaching and Learning International Survey 2008.1 2 http://dx.doi.org/10.1787/888932648083
Table B.31 Model fit for latent profile analysis with different numbers of profiles of participation in professional learning communities for Hungary
Number of profiles of teaching practices BIC AIC Entropy % in p 1 % in p 2 % in p 3 % in p 4 % in p 5 % in p 6
2 53 899 53 779 0.94 84.83 15.17
3 52 409 52 241 0.98 11.41 82.18 6.41
4 51 102 50 887 0.98 70.91 16.37 6.48 6.24
5 n.a. n.a. n.a. n.a. n.a. n.a. n.a. n.a.
6 n.a. n.a. n.a. n.a. n.a. n.a. n.a. n.a. n.a.
notes: aic refers to the akaike information criterion; Bic refers to the Bayesian information criterion. source: oecd, TALIS Database. Teaching and Learning International Survey 2008.1 2 http://dx.doi.org/10.1787/888932648064
Table B.30 Model fit for latent profile analysis with different numbers of profiles of participation in professional learning communities for Estonia
Number of profiles of teaching practices BIC AIC Entropy % in p 1 % in p 2 % in p 3 % in p 4 % in p 5 % in p 6
2 62 318 62 198 0.84 45.48 54.52
3 61 280 61 111 0.94 46.44 25.58 27.98
4 60 871 60 653 0.88 10.93 25.83 35.45 27.79
5 60 649 60 383 0.90 11.09 26.06 35.22 3.49 24.14
6 60 412 60 098 0.90 10.71 3.85 3.72 35.83 21.99 23.91
notes: aic refers to the akaike information criterion; Bic refers to the Bayesian information criterion. source: oecd, TALIS Database. Teaching and Learning International Survey 2008.1 2 http://dx.doi.org/10.1787/888932648045
Table B.29 Model fit for latent profile analysis with different numbers of profiles of participation in professional learning communities for Denmark
Number of profiles of teaching practices BIC AIC Entropy % in p 1 % in p 2 % in p 3 % in p 4 % in p 5 % in p 6
2 32 356 32 247 0.96 22.78 77.22
3 31 491 31 339 0.93 11.63 66.49 21.88
4 30 942 30 746 0.95 11.99 60.47 15.50 12.05
5 30 482 30 243 0.96 10.73 45.68 21.59 9.96 12.05
6 30 447 30 165 0.88 8.59 37.39 1.07 26.60 14.91 11.45
notes: aic refers to the akaike information criterion; Bic refers to the Bayesian information criterion. source: oecd, TALIS Database. Teaching and Learning International Survey 2008.1 2 http://dx.doi.org/10.1787/888932648026

Teaching PracTices and Pedagogical innovaTion: evidence from Talis© OECD 2012
annEx b model fIt for latent ProfIle analysIs wIth dIfferent numbers of ProfIles
140
Table B.36 Model fit for latent profile analysis with different numbers of profiles of participation in professional learning communities for lithuania
Number of profiles of teaching practices BIC AIC Entropy % in p 1 % in p 2 % in p 3 % in p 4 % in p 5 % in p 6
2 66 152 66 029 0.84 24.60 75.40
3 65 777 65 604 0.69 19.82 23.11 57.07
4 64 986 64 764 0.84 13.57 10.20 23.02 53.21
5 64 433 64 162 0.87 12.85 12.96 28.16 8.79 37.24
6 n.a. n.a. n.a. n.a. n.a. n.a. n.a. n.a. n.a.
notes: aic refers to the akaike information criterion; Bic refers to the Bayesian information criterion. source: oecd, TALIS Database. Teaching and Learning International Survey 2008.1 2 http://dx.doi.org/10.1787/888932648159
Table B.35 Model fit for latent profile analysis with different numbers of profiles of participation in professional learning communities for Korea
Number of profiles of teaching practices BIC AIC Entropy % in p 1 % in p 2 % in p 3 % in p 4 % in p 5 % in p 6
2 56 178 56 058 0.95 20.79 79.21
3 54 724 54 557 0.99 70.39 13.57 16.03
4 53 454 53 238 0.87 13.57 16.03 39.25 31.15
5 53 148 52 885 0.85 13.59 16.16 23.31 40.53 6.41
6 n.a. n.a. n.a. n.a. n.a. n.a. n.a. n.a. n.a.
notes: aic refers to the akaike information criterion; Bic refers to the Bayesian information criterion. source: oecd, TALIS Database. Teaching and Learning International Survey 2008.1 2 http://dx.doi.org/10.1787/888932648140
Table B.34 Model fit for latent profile analysis with different numbers of profiles of participation in professional learning communities for Italy
Number of profiles of teaching practices BIC AIC Entropy % in p 1 % in p 2 % in p 3 % in p 4 % in p 5 % in p 6
2 94 226 94 095 0.98 44.45 55.55
3 89 191 89 008 0.98 43.01 48.45 8.54
4 87 904 87 669 0.95 35.52 12.60 43.34 8.54
5 n.a. n.a. n.a. n.a. n.a. n.a. n.a. n.a.
6 85 421 85 081 0.95 2.16 8.60 35.23 5.81 33.42 14.78
notes: aic refers to the akaike information criterion; Bic refers to the Bayesian information criterion. source: oecd, TALIS Database. Teaching and Learning International Survey 2008.1 2 http://dx.doi.org/10.1787/888932648121
Table B.33 Model fit for latent profile analysis with different numbers of profiles of participation in professional learning communities for Ireland
Number of profiles of teaching practices BIC AIC Entropy % in p 1 % in p 2 % in p 3 % in p 4 % in p 5 % in p 6
2 38 046 37 932 1.00 94.94 5.06
3 36 225 36 066 0.98 78.05 4.97 16.98
4 n.a. n.a. n.a. n.a. n.a. n.a. n.a.
5 n.a. n.a. n.a. n.a. n.a. n.a. n.a. n.a.
6 n.a. n.a. n.a. n.a. n.a. n.a. n.a. n.a. n.a.
notes: aic refers to the akaike information criterion; Bic refers to the Bayesian information criterion. source: oecd, TALIS Database. Teaching and Learning International Survey 2008.1 2 http://dx.doi.org/10.1787/888932648102

Teaching PracTices and Pedagogical innovaTion: evidence from Talis © OECD 2012
model fIt for latent ProfIle analysIs wIth dIfferent numbers of ProfIles annEx b141
Table B.40 Model fit for latent profile analysis with different numbers of profiles of participation in professional learning communities for norway
Number of profiles of teaching practices BIC AIC Entropy % in p 1 % in p 2 % in p 3 % in p 4 % in p 5 % in p 6
2 47 213 47 098 0.95 29.88 70.12
3 45 756 45 595 0.97 26.25 14.17 59.58
4 44 920 44 712 0.93 26.21 38.80 14.21 20.79
5 44 499 44 246 0.95 23.56 2.65 14.00 38.80 21.00
6 44 375 44 075 0.92 14.04 3.71 35.38 23.77 2.65 20.44
notes: aic refers to the akaike information criterion; Bic refers to the Bayesian information criterion. source: oecd, TALIS Database. Teaching and Learning International Survey 2008.1 2 http://dx.doi.org/10.1787/888932648235
Table B.39 Model fit for latent profile analysis with different numbers of profiles of participation in professional learning communities for Mexico
Number of profiles of teaching practices BIC AIC Entropy % in p 1 % in p 2 % in p 3 % in p 4 % in p 5 % in p 6
2 68 357 68 235 0.96 45.39 54.61
3 66 705 66 534 0.94 40.29 40.67 19.04
4 64 840 64 619 0.98 38.80 13.98 40.56 6.57
5 64 277 64 008 0.92 44.26 12.56 28.83 8.95 5.40
6 n.a. n.a. n.a. n.a. n.a. n.a. n.a. n.a. n.a.
notes: aic refers to the akaike information criterion; Bic refers to the Bayesian information criterion. source: oecd, TALIS Database. Teaching and Learning International Survey 2008.1 2 http://dx.doi.org/10.1787/888932648216
Table B.38 Model fit for latent profile analysis with different numbers of profiles of participation in professional learning communities for Malta
Number of profiles of teaching practices BIC AIC Entropy % in p 1 % in p 2 % in p 3 % in p 4 % in p 5 % in p 6
2 20 155 20 055 1.00 91.56 8.44
3 19 416 19 275 0.98 78.28 13.47 8.26
4 18 989 18 809 0.98 9.25 11.13 5.84 73.79
5 n.a. n.a. n.a. n.a. n.a. n.a. n.a. n.a.
6 n.a. n.a. n.a. n.a. n.a. n.a. n.a. n.a. n.a.
notes: aic refers to the akaike information criterion; Bic refers to the Bayesian information criterion. source: oecd, TALIS Database. Teaching and Learning International Survey 2008.1 2 http://dx.doi.org/10.1787/888932648197
Table B.37 Model fit for latent profile analysis with different numbers of profiles of participation in professional learning communities for Malaysia
Number of profiles of teaching practices BIC AIC Entropy % in p 1 % in p 2 % in p 3 % in p 4 % in p 5 % in p 6
2 78 380 78 253 0.91 51.54 48.46
3 76 696 76 518 0.97 48.49 33.31 18.20
4 75 598 75 369 0.94 37.35 23.48 15.15 24.02
5 74 815 74 535 0.94 3.45 34.23 15.13 23.90 23.29
6 n.a. n.a. n.a. n.a. n.a. n.a. n.a. n.a. n.a.
notes: aic refers to the akaike information criterion; Bic refers to the Bayesian information criterion. source: oecd, TALIS Database. Teaching and Learning International Survey 2008.1 2 http://dx.doi.org/10.1787/888932648178

Teaching PracTices and Pedagogical innovaTion: evidence from Talis© OECD 2012
annEx b model fIt for latent ProfIle analysIs wIth dIfferent numbers of ProfIles
142
Table B.44 Model fit for latent profile analysis with different numbers of profiles of participation in professional learning communities for slovenia
Number of profiles of teaching practices BIC AIC Entropy % in p 1 % in p 2 % in p 3 % in p 4 % in p 5 % in p 6
2 59 080 58 960 0.83 68.47 31.53
3 58 178 58 010 0.94 64.74 28.09 7.17
4 57 447 57 230 0.89 52.05 12.79 27.99 7.17
5 n.a. n.a. n.a. n.a. n.a. n.a. n.a. n.a.
6 56 758 56 445 0.86 11.28 7.82 35.75 20.72 16.91 7.52
notes: aic refers to the akaike information criterion; Bic refers to the Bayesian information criterion. source: oecd, TALIS Database. Teaching and Learning International Survey 2008.1 2 http://dx.doi.org/10.1787/888932648311
Table B.43 Model fit for latent profile analysis with different numbers of profiles of participation in professional learning communities for the slovak Republic
Number of profiles of teaching practices BIC AIC Entropy % in p 1 % in p 2 % in p 3 % in p 4 % in p 5 % in p 6
2 58 502 58 381 0.85 39.09 60.91
3 57 928 57 759 0.87 34.21 5.62 60.17
4 57 501 57 284 0.85 4.79 10.99 33.70 50.53
5 57 240 56 974 0.82 6.81 27.59 12.43 32.06 21.11
6 57 017 56 702 0.85 5.27 3.98 5.78 25.47 29.52 29.97
notes: aic refers to the akaike information criterion; Bic refers to the Bayesian information criterion. source: oecd, TALIS Database. Teaching and Learning International Survey 2008.1 2 http://dx.doi.org/10.1787/888932648292
Table B.42 Model fit for latent profile analysis with different numbers of profiles of participation in professional learning communities for Portugal
Number of profiles of teaching practices BIC AIC Entropy % in p 1 % in p 2 % in p 3 % in p 4 % in p 5 % in p 6
2 57 561 57 441 0.98 87.33 12.68
3 55 490 55 322 0.99 7.98 4.72 87.29
4 54 019 53 803 0.95 4.66 32.37 55.02 7.95
5 n.a. n.a. n.a. n.a. n.a. n.a. n.a. n.a.
6 n.a. n.a. n.a. n.a. n.a. n.a. n.a. n.a. n.a.
notes: aic refers to the akaike information criterion; Bic refers to the Bayesian information criterion. source: oecd, TALIS Database. Teaching and Learning International Survey 2008.1 2 http://dx.doi.org/10.1787/888932648273
Table B.41 Model fit for latent profile analysis with different numbers of profiles of participation in professional learning communities for Poland
Number of profiles of teaching practices BIC AIC Entropy % in p 1 % in p 2 % in p 3 % in p 4 % in p 5 % in p 6
2 59 639 59 518 0.83 32.85 67.16
3 58 938 58 769 0.80 23.71 49.05 27.24
4 57 969 57 751 0.85 19.92 25.24 25.33 29.50
5 n.a. n.a. n.a. n.a. n.a. n.a. n.a. n.a.
6 n.a. n.a. n.a. n.a. n.a. n.a. n.a. n.a. n.a.
notes: aic refers to the akaike information criterion; Bic refers to the Bayesian information criterion. source: oecd, TALIS Database. Teaching and Learning International Survey 2008.1 2 http://dx.doi.org/10.1787/888932648254
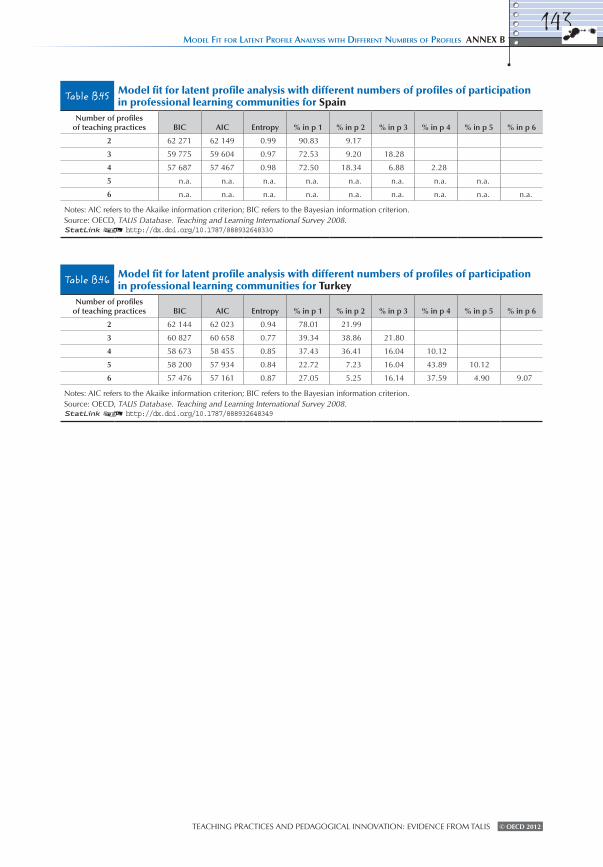
Teaching PracTices and Pedagogical innovaTion: evidence from Talis © OECD 2012
model fIt for latent ProfIle analysIs wIth dIfferent numbers of ProfIles annEx b143
Table B.46 Model fit for latent profile analysis with different numbers of profiles of participation in professional learning communities for Turkey
Number of profiles of teaching practices BIC AIC Entropy % in p 1 % in p 2 % in p 3 % in p 4 % in p 5 % in p 6
2 62 144 62 023 0.94 78.01 21.99
3 60 827 60 658 0.77 39.34 38.86 21.80
4 58 673 58 455 0.85 37.43 36.41 16.04 10.12
5 58 200 57 934 0.84 22.72 7.23 16.04 43.89 10.12
6 57 476 57 161 0.87 27.05 5.25 16.14 37.59 4.90 9.07
notes: aic refers to the akaike information criterion; Bic refers to the Bayesian information criterion. source: oecd, TALIS Database. Teaching and Learning International Survey 2008.1 2 http://dx.doi.org/10.1787/888932648349
Table B.45 Model fit for latent profile analysis with different numbers of profiles of participation in professional learning communities for spain
Number of profiles of teaching practices BIC AIC Entropy % in p 1 % in p 2 % in p 3 % in p 4 % in p 5 % in p 6
2 62 271 62 149 0.99 90.83 9.17
3 59 775 59 604 0.97 72.53 9.20 18.28
4 57 687 57 467 0.98 72.50 18.34 6.88 2.28
5 n.a. n.a. n.a. n.a. n.a. n.a. n.a. n.a.
6 n.a. n.a. n.a. n.a. n.a. n.a. n.a. n.a. n.a.
notes: aic refers to the akaike information criterion; Bic refers to the Bayesian information criterion. source: oecd, TALIS Database. Teaching and Learning International Survey 2008.1 2 http://dx.doi.org/10.1787/888932648330


145
Teaching PracTices and Pedagogical innovaTion: evidence from Talis © OECD 2012
Annex CResults of Multilevel Multinomial
Regression Analyses

Teaching PracTices and Pedagogical innovaTion: evidence from Talis© OECD 2012
annEx C results of multIlevel multInomIal regressIon analyses
146
for the multinomial regressions, the results are presented in terms of odds ratios. a straight-forward way to interpret the odds ratios is in terms of percentages above or below 1.0 (even odds).1 for example, if the effect of female on membership in Profile B vs. Profile a has an odds ratio of 1.50, this would mean that females are 50% more likely to be in Profile B vs. Profile a. similarly, an odds ratio of 0.65 would mean that females are 35% less likely to be in Profile B vs. Profile a. Profile a is always the profile with the lowest mean scores for most items/scales. This profile is compared with Profiles B and c respectively, which show higher means for most items/scales.
at the school level, log-odds are reported, because odds ratios are cumbersome to explain. To aid in interpretation, note that a logit coefficient (ß) of 0 corresponds to a probability of 0.5 and the odds are 1.0 (even odds). a positive logit coefficient refers to a probability greater than 0.5 and odds greater than 1.0. a negative logit coefficient refers to a probability less than 0.5 and odds less 1.0. Thus, the logit coefficient directly translates into probability (with 0.5 being chance) and odds (with 1.0 being even odds). for example, if the marginal effect of school size on school average teacher membership in Profile B vs. Profile a has an associated logit coefficient of 0.30, then a one unit change in average school size is associated with in-crease (greater than 1.0) in the school average odds and, similarly an increase in the probability of teachers being in Profile B vs. Profile a, holding all other variables constant. similarly, if the marginal effect of administrative leadership style on school average teacher membership in Profile B vs. Profile a has an associated logit coefficient of -0.20, then a unit change in administrative leadership style is associated with a decrease (less than 1.0) in the school average odds and similarly a decrease in the probability of teachers being in Profile B vs. Profile a.
1. an odds ratio of 1.0 corresponds to a logit slope of 0.

Teaching PracTices and Pedagogical innovaTion: evidence from Talis © OECD 2012
results of multIlevel multInomIal regressIon analyses annEx C147
Table C.2 Multilevel multinomial regression analysis for teaching practices for Austria
tEaChEr lEvEl analysIsProfile b Profile C
ß odds ß odds
var
iab
les Gender 0.51** 1.67 0.35 1.41
Level of education -0.55** 0.58 -0.99** 0.37Subject taught in target class: mathematics -0.82** 0.44 -1.16** 0.31Subject taught in target class: reading 0.89** 2.44 1.29** 3.64Subject taught in target class: other 0.41** 1.51 1.00** 2.73Teaching experience 0.09 1.09 0.50 1.65Participating in co-operative learning arrangements for PD 0.27** 1.30 0.39** 1.47Attending PD workshops and seminars 0.13* 1.14 0.30** 1.34Receiving feedback and appraisal for innovative teaching 0.52** 1.68 0.68** 1.96Constructivist beliefs about the nature of teaching and learning 0.22** 1.24 0.40** 1.50Teacher self-efficacy 0.40** 1.49 0.72** 2.06
sChOOl lEvEl analysIs Profile b Profile C
ß ß
var
iab
les Educational level of the student’s parents -0.09 -0.30
School size 0.01* 0.00Average hours of work 0.34** 0.47*School autonomy in curriculum 0.06 0.09School autonomy in hiring teachers and determining salaries 0.09 0.47**Administrative leadership style -0.09 -0.07Instructional leadership style -0.05 -0.10Percent of teachers reporting feedback and appraisal for innovative teaching 0.14 0.36*
notes: values that are statistically significant at the p < 0.05 level are indicated with *. values that are statistically significant at the p < 0.01 level are indicated with **. source: oecd, TALIS Database. Teaching and Learning International Survey 2008.1 2 http://dx.doi.org/10.1787/888932648387
Table C.1 Multilevel multinomial regression analysis for teaching practices for Australia
tEaChEr lEvEl analysIsProfile b Profile C
ß odds ß odds
var
iab
les Gender 0.40** 1.50 0.23 1.26
Level of education 0.34 1.40 0.60* 1.82Subject taught in target class: mathematics -0.41 0.66 -0.68 0.51Subject taught in target class: reading 1.61** 5.02 1.77** 5.88Subject taught in target class: other 1.08** 2.94 1.24** 3.45Teaching experience 0.29 1.33 0.48* 1.61Participating in co-operative learning arrangements for PD 0.41** 1.50 0.56** 1.74Attending PD workshops and seminars 0.04 1.04 0.07 1.08Receiving feedback and appraisal for innovative teaching 0.56** 1.75 0.42 1.52Constructivist beliefs about the nature of teaching and learning 0.24** 1.28 0.28 1.32Teacher self-efficacy 0.26** 1.29 0.55** 1.73
sChOOl lEvEl analysIs Profile b Profile C
ß ß
var
iab
les Educational level of the student’s parents -0.12 -0.38*
School size 0.01* 0.01*Average hours of work 0.01 -0.23School autonomy in curriculum 0.04 0.03School autonomy in hiring teachers and determining salaries -0.09 -0.06Administrative leadership style -0.21* -0.07Instructional leadership style 0.17* 0.09Percent of teachers reporting feedback and appraisal for innovative teaching -0.08 0.19
notes: values that are statistically significant at the p < 0.05 level are indicated with *. values that are statistically significant at the p < 0.01 level are indicated with **. source: oecd, TALIS Database. Teaching and Learning International Survey 2008.1 2 http://dx.doi.org/10.1787/888932648368
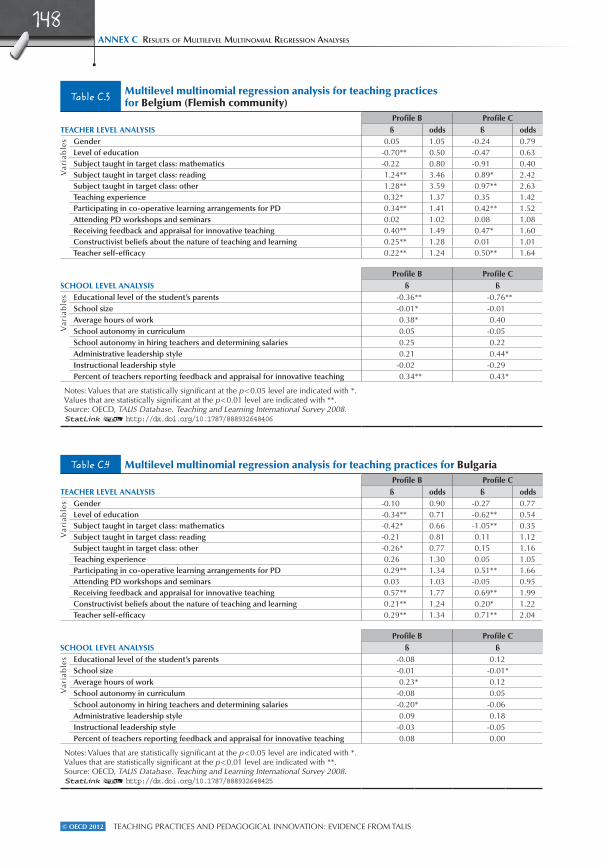
Teaching PracTices and Pedagogical innovaTion: evidence from Talis© OECD 2012
annEx C results of multIlevel multInomIal regressIon analyses
148
Table C.4 Multilevel multinomial regression analysis for teaching practices for Bulgaria
tEaChEr lEvEl analysIsProfile b Profile C
ß odds ß odds
var
iab
les Gender -0.10 0.90 -0.27 0.77
Level of education -0.34** 0.71 -0.62** 0.54Subject taught in target class: mathematics -0.42* 0.66 -1.05** 0.35Subject taught in target class: reading -0.21 0.81 0.11 1.12Subject taught in target class: other -0.26* 0.77 0.15 1.16Teaching experience 0.26 1.30 0.05 1.05Participating in co-operative learning arrangements for PD 0.29** 1.34 0.51** 1.66Attending PD workshops and seminars 0.03 1.03 -0.05 0.95Receiving feedback and appraisal for innovative teaching 0.57** 1.77 0.69** 1.99Constructivist beliefs about the nature of teaching and learning 0.21** 1.24 0.20* 1.22Teacher self-efficacy 0.29** 1.34 0.71** 2.04
sChOOl lEvEl analysIs Profile b Profile C
ß ß
var
iab
les Educational level of the student’s parents -0.08 0.12
School size -0.01 -0.01*Average hours of work 0.23* 0.12School autonomy in curriculum -0.08 0.05School autonomy in hiring teachers and determining salaries -0.20* -0.06Administrative leadership style 0.09 0.18Instructional leadership style -0.03 -0.05Percent of teachers reporting feedback and appraisal for innovative teaching 0.08 0.00
notes: values that are statistically significant at the p < 0.05 level are indicated with *. values that are statistically significant at the p < 0.01 level are indicated with **. source: oecd, TALIS Database. Teaching and Learning International Survey 2008.1 2 http://dx.doi.org/10.1787/888932648425
Table C.3 Multilevel multinomial regression analysis for teaching practices for Belgium (Flemish community)
tEaChEr lEvEl analysIsProfile b Profile C
ß odds ß odds
var
iab
les Gender 0.05 1.05 -0.24 0.79
Level of education -0.70** 0.50 -0.47 0.63Subject taught in target class: mathematics -0.22 0.80 -0.91 0.40Subject taught in target class: reading 1.24** 3.46 0.89* 2.42Subject taught in target class: other 1.28** 3.59 0.97** 2.63Teaching experience 0.32* 1.37 0.35 1.42Participating in co-operative learning arrangements for PD 0.34** 1.41 0.42** 1.52Attending PD workshops and seminars 0.02 1.02 0.08 1.08Receiving feedback and appraisal for innovative teaching 0.40** 1.49 0.47* 1.60Constructivist beliefs about the nature of teaching and learning 0.25** 1.28 0.01 1.01Teacher self-efficacy 0.22** 1.24 0.50** 1.64
sChOOl lEvEl analysIs Profile b Profile C
ß ß
var
iab
les Educational level of the student’s parents -0.36** -0.76**
School size -0.01* -0.01Average hours of work 0.38* 0.40School autonomy in curriculum 0.05 -0.05School autonomy in hiring teachers and determining salaries 0.25 0.22Administrative leadership style 0.21 0.44*Instructional leadership style -0.02 -0.29Percent of teachers reporting feedback and appraisal for innovative teaching 0.34** 0.43*
notes: values that are statistically significant at the p < 0.05 level are indicated with *. values that are statistically significant at the p < 0.01 level are indicated with **. source: oecd, TALIS Database. Teaching and Learning International Survey 2008.1 2 http://dx.doi.org/10.1787/888932648406
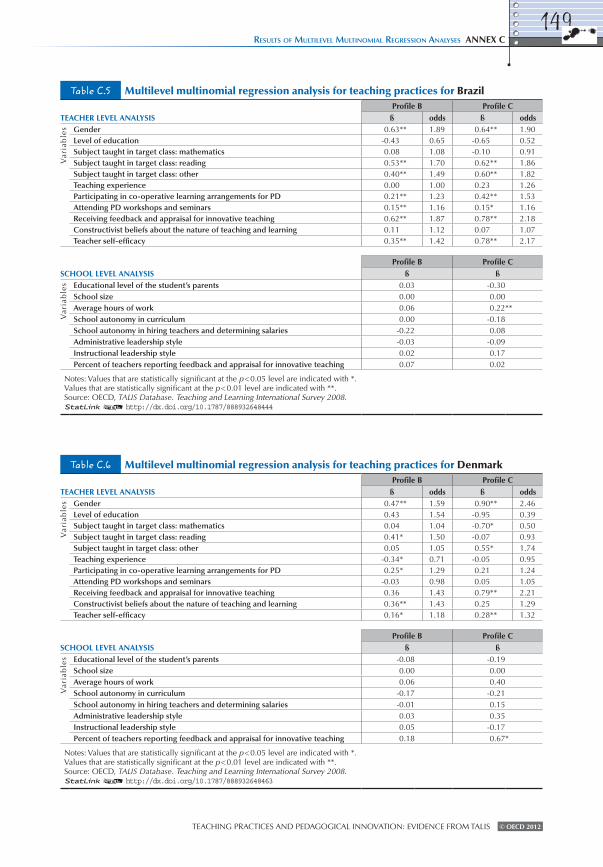
Teaching PracTices and Pedagogical innovaTion: evidence from Talis © OECD 2012
results of multIlevel multInomIal regressIon analyses annEx C149
Table C.6 Multilevel multinomial regression analysis for teaching practices for Denmark
tEaChEr lEvEl analysIsProfile b Profile C
ß odds ß odds
var
iab
les Gender 0.47** 1.59 0.90** 2.46
Level of education 0.43 1.54 -0.95 0.39Subject taught in target class: mathematics 0.04 1.04 -0.70* 0.50Subject taught in target class: reading 0.41* 1.50 -0.07 0.93Subject taught in target class: other 0.05 1.05 0.55* 1.74Teaching experience -0.34* 0.71 -0.05 0.95Participating in co-operative learning arrangements for PD 0.25* 1.29 0.21 1.24Attending PD workshops and seminars -0.03 0.98 0.05 1.05Receiving feedback and appraisal for innovative teaching 0.36 1.43 0.79** 2.21Constructivist beliefs about the nature of teaching and learning 0.36** 1.43 0.25 1.29Teacher self-efficacy 0.16* 1.18 0.28** 1.32
sChOOl lEvEl analysIs Profile b Profile C
ß ß
var
iab
les Educational level of the student’s parents -0.08 -0.19
School size 0.00 0.00Average hours of work 0.06 0.40School autonomy in curriculum -0.17 -0.21School autonomy in hiring teachers and determining salaries -0.01 0.15Administrative leadership style 0.03 0.35Instructional leadership style 0.05 -0.17Percent of teachers reporting feedback and appraisal for innovative teaching 0.18 0.67*
notes: values that are statistically significant at the p < 0.05 level are indicated with *. values that are statistically significant at the p < 0.01 level are indicated with **. source: oecd, TALIS Database. Teaching and Learning International Survey 2008.1 2 http://dx.doi.org/10.1787/888932648463
Table C.5 Multilevel multinomial regression analysis for teaching practices for Brazil
tEaChEr lEvEl analysIsProfile b Profile C
ß odds ß odds
var
iab
les Gender 0.63** 1.89 0.64** 1.90
Level of education -0.43 0.65 -0.65 0.52Subject taught in target class: mathematics 0.08 1.08 -0.10 0.91Subject taught in target class: reading 0.53** 1.70 0.62** 1.86Subject taught in target class: other 0.40** 1.49 0.60** 1.82Teaching experience 0.00 1.00 0.23 1.26Participating in co-operative learning arrangements for PD 0.21** 1.23 0.42** 1.53Attending PD workshops and seminars 0.15** 1.16 0.15* 1.16Receiving feedback and appraisal for innovative teaching 0.62** 1.87 0.78** 2.18Constructivist beliefs about the nature of teaching and learning 0.11 1.12 0.07 1.07Teacher self-efficacy 0.35** 1.42 0.78** 2.17
sChOOl lEvEl analysIs Profile b Profile C
ß ß
var
iab
les Educational level of the student’s parents 0.03 -0.30
School size 0.00 0.00Average hours of work 0.06 0.22**School autonomy in curriculum 0.00 -0.18School autonomy in hiring teachers and determining salaries -0.22 0.08Administrative leadership style -0.03 -0.09Instructional leadership style 0.02 0.17Percent of teachers reporting feedback and appraisal for innovative teaching 0.07 0.02
notes: values that are statistically significant at the p < 0.05 level are indicated with *. values that are statistically significant at the p < 0.01 level are indicated with **. source: oecd, TALIS Database. Teaching and Learning International Survey 2008.1 2 http://dx.doi.org/10.1787/888932648444

Teaching PracTices and Pedagogical innovaTion: evidence from Talis© OECD 2012
annEx C results of multIlevel multInomIal regressIon analyses
150
Table C.8 Multilevel multinomial regression analysis for teaching practices for Hungary
tEaChEr lEvEl analysIsProfile b Profile C
ß odds ß odds
var
iab
les Gender 0.27 1.31 -0.36 0.70
Level of education 0.13 1.14 0.28 1.32Subject taught in target class: mathematics -0.81** 0.44 -1.20** 0.30Subject taught in target class: reading 0.73** 2.06 1.11** 3.04Subject taught in target class: other 0.07 1.07 0.28 1.33Teaching experience 0.06 1.06 0.13 1.14Participating in co-operative learning arrangements for PD 0.21** 1.23 0.34** 1.40Attending PD workshops and seminars 0.21** 1.23 0.22* 1.25Receiving feedback and appraisal for innovative teaching 0.68** 1.97 0.96** 2.61Constructivist beliefs about the nature of teaching and learning 0.15* 1.16 0.11 1.12Teacher self-efficacy 0.45** 1.56 0.71** 2.03
sChOOl lEvEl analysIs Profile b Profile C
ß ß
var
iab
les Educational level of the student’s parents -0.04 -0.02
School size 0.00 -0.01Average hours of work 0.45** 0.20School autonomy in curriculum 0.16 0.15School autonomy in hiring teachers and determining salaries 0.01 -0.15Administrative leadership style -0.06 0.03Instructional leadership style 0.29** -0.13Percent of teachers reporting feedback and appraisal for innovative teaching 0.04 0.13
notes: values that are statistically significant at the p < 0.05 level are indicated with *. values that are statistically significant at the p < 0.01 level are indicated with **. source: oecd, TALIS Database. Teaching and Learning International Survey 2008.1 2 http://dx.doi.org/10.1787/888932648501
Table C.7 Multilevel multinomial regression analysis for teaching practices for Estonia
tEaChEr lEvEl analysIsProfile b Profile C
ß odds ß odds
var
iab
les Gender 0.08 1.08 -0.46* 0.63
Level of education -0.11 0.89 -0.11 0.90Subject taught in target class: mathematics -1.13** 0.32 -1.22** 0.30Subject taught in target class: reading 0.59** 1.79 0.92** 2.51Subject taught in target class: other -0.13 0.88 0.27 1.32Teaching experience -0.40* 0.67 -0.28 0.75Participating in co-operative learning arrangements for PD 0.26** 1.29 0.47** 1.59Attending PD workshops and seminars 0.21** 1.24 0.19 1.21Receiving feedback and appraisal for innovative teaching 0.70** 2.00 0.77** 2.16Constructivist beliefs about the nature of teaching and learning 0.18* 1.19 0.31** 1.36Teacher self-efficacy 0.46** 1.58 0.51** 1.66
sChOOl lEvEl analysIs Profile b Profile C
ß ß
var
iab
les Educational level of the student’s parents -0.29** -0.14
School size 0.00 0.01Average hours of work -0.25* -0.54*School autonomy in curriculum -0.09 -0.32School autonomy in hiring teachers and determining salaries -0.31 -0.29Administrative leadership style 0.17 0.19Instructional leadership style 0.01 0.10Percent of teachers reporting feedback and appraisal for innovative teaching 0.03 0.10
notes: values that are statistically significant at the p < 0.05 level are indicated with *. values that are statistically significant at the p < 0.01 level are indicated with **. source: oecd, TALIS Database. Teaching and Learning International Survey 2008.1 2 http://dx.doi.org/10.1787/888932648482

Teaching PracTices and Pedagogical innovaTion: evidence from Talis © OECD 2012
results of multIlevel multInomIal regressIon analyses annEx C151
Table C.10 Multilevel multinomial regression analysis for teaching practices for Ireland
tEaChEr lEvEl analysIsProfile b Profile C
ß odds ß odds
var
iab
les Gender 0.13 1.14 -0.88* 0.41
Level of education 0.24 1.27 -0.84 0.43Subject taught in target class: mathematics -1.08** 0.34 -1.32 0.27Subject taught in target class: reading 1.16** 3.20 0.72 2.05Subject taught in target class: other 1.20** 3.31 1.35* 3.87Teaching experience 0.40* 1.49 0.86* 2.37Participating in co-operative learning arrangements for PD 0.11 1.11 0.01 1.01Attending PD workshops and seminars 0.16* 1.17 0.12 1.13Receiving feedback and appraisal for innovative teaching 0.35* 1.42 0.99** 2.69Constructivist beliefs about the nature of teaching and learning 0.23** 1.25 0.02 1.02Teacher self-efficacy 0.18* 1.20 0.38* 1.46
sChOOl lEvEl analysIs Profile b Profile C
ß ß
var
iab
les Educational level of the student’s parents -0.01 -0.41
School size 0.00 0.00Average hours of work -0.22 0.37School autonomy in curriculum 0.01 0.38School autonomy in hiring teachers and determining salaries -0.12 0.72*Administrative leadership style 0.04 -0.44Instructional leadership style 0.20 0.29Percent of teachers reporting feedback and appraisal for innovative teaching -0.24 -0.03
notes: values that are statistically significant at the p < 0.05 level are indicated with *. values that are statistically significant at the p < 0.01 level are indicated with **. source: oecd, TALIS Database. Teaching and Learning International Survey 2008.1 2 http://dx.doi.org/10.1787/888932648539
Table C.9 Multilevel multinomial regression analysis for teaching practices for Iceland
tEaChEr lEvEl analysIsProfile b Profile C
ß odds ß odds
var
iab
les Gender 0.59 1.81 0.64 1.90
Level of education 0.50 1.66 1.22* 3.38Subject taught in target class: mathematics 0.44 1.55 -0.45 0.64Subject taught in target class: reading 1.48** 4.40 1.71** 5.53Subject taught in target class: other -0.32 0.73 -0.51 0.60Teaching experience -0.31 0.73 -0.46 0.63Participating in co-operative learning arrangements for PD 0.24 1.27 0.16 1.18Attending PD workshops and seminars 0.10 1.10 0.11 1.12Receiving feedback and appraisal for innovative teaching 0.69* 1.99 1.15* 3.15Constructivist beliefs about the nature of teaching and learning 0.32* 1.37 0.32 1.37Teacher self-efficacy 0.19 1.20 0.58** 1.78
sChOOl lEvEl analysIs Profile b Profile C
ß ß
var
iab
les Educational level of the student’s parents 0.03 -0.18
School size 0.00 -0.01Average hours of work -0.01 0.08School autonomy in curriculum -0.31 -0.46School autonomy in hiring teachers and determining salaries -0.01 0.32Administrative leadership style 0.00 0.13Instructional leadership style 0.23 0.15Percent of teachers reporting feedback and appraisal for innovative teaching -0.43 -0.36
notes: values that are statistically significant at the p < 0.05 level are indicated with *. values that are statistically significant at the p < 0.01 level are indicated with **. source: oecd, TALIS Database. Teaching and Learning International Survey 2008.1 2 http://dx.doi.org/10.1787/888932648520

Teaching PracTices and Pedagogical innovaTion: evidence from Talis© OECD 2012
annEx C results of multIlevel multInomIal regressIon analyses
152
Table C.12 Multilevel multinomial regression analysis for teaching practices for Korea
tEaChEr lEvEl analysIsProfile b Profile C
ß odds ß odds
var
iab
les Gender 0.06 1.06 0.17 1.19
Level of education 0.24 1.27 0.12 1.13Subject taught in target class: mathematics 0.55** 1.73 0.50 1.66Subject taught in target class: reading 0.40* 1.49 0.54 1.72Subject taught in target class: other 0.75** 2.11 1.20** 3.31Teaching experience 0.72** 2.06 0.45 1.57Participating in co-operative learning arrangements for PD 0.32** 1.38 0.30* 1.34Attending PD workshops and seminars 0.14* 1.15 0.11 1.12Receiving feedback and appraisal for innovative teaching 0.53** 1.70 0.49* 1.63Constructivist beliefs about the nature of teaching and learning 0.01 1.01 -0.19 0.82Teacher self-efficacy 0.61** 1.83 0.97** 2.65
sChOOl lEvEl analysIs Profile b Profile C
ß ß
var
iab
les Educational level of the student’s parents 0.04 0.14
School size -0.01** -0.01*Average hours of work 0.07 0.06School autonomy in curriculum -0.03 -0.03School autonomy in hiring teachers and determining salaries 0.11 0.04Administrative leadership style -0.07 -0.11Instructional leadership style 0.02 0.05Percent of teachers reporting feedback and appraisal for innovative teaching -0.23* 0.10
notes: values that are statistically significant at the p < 0.05 level are indicated with *. values that are statistically significant at the p < 0.01 level are indicated with **. source: oecd, TALIS Database. Teaching and Learning International Survey 2008.1 2 http://dx.doi.org/10.1787/888932648577
Table C.11 Multilevel multinomial regression analysis for teaching practices for Italy
tEaChEr lEvEl analysIsProfile b Profile C
ß odds ß odds
var
iab
les Gender 0.42** 1.53 0.09 1.09
Level of education -0.02 0.98 -0.31 0.73Subject taught in target class: mathematics 0.39* 1.48 0.06 1.06Subject taught in target class: reading 0.87** 2.38 1.03** 2.81Subject taught in target class: other 0.38** 1.46 0.61** 1.84Teaching experience -0.17 0.84 -0.24 0.79Participating in co-operative learning arrangements for PD 0.19** 1.21 0.29** 1.34Attending PD workshops and seminars 0.11* 1.12 0.18** 1.20Receiving feedback and appraisal for innovative teaching 0.27* 1.31 0.75** 2.11Constructivist beliefs about the nature of teaching and learning 0.33** 1.39 0.49** 1.63Teacher self-efficacy 0.27** 1.32 0.51** 1.67
sChOOl lEvEl analysIs Profile b Profile C
ß ß
var
iab
les Educational level of the student’s parents -0.35** -0.15
School size 0.00 -0.01Average hours of work -0.13 -0.05School autonomy in curriculum 0.33 0.47School autonomy in hiring teachers and determining salaries -0.03 0.13Administrative leadership style 0.01 -0.33*Instructional leadership style -0.05 0.15Percent of teachers reporting feedback and appraisal for innovative teaching 0.24** 0.29**
notes: values that are statistically significant at the p < 0.05 level are indicated with *. values that are statistically significant at the p < 0.01 level are indicated with **. source: oecd, TALIS Database. Teaching and Learning International Survey 2008.1 2 http://dx.doi.org/10.1787/888932648558

Teaching PracTices and Pedagogical innovaTion: evidence from Talis © OECD 2012
results of multIlevel multInomIal regressIon analyses annEx C153
Table C.14 Multilevel multinomial regression analysis for teaching practices for Malaysia
tEaChEr lEvEl analysIsProfile b Profile C
ß odds ß odds
var
iab
les Gender -0.11 0.89 0.09 1.09
Level of education -0.14 0.87 -0.26 0.77Subject taught in target class: mathematics -0.29 0.75 -0.71** 0.49Subject taught in target class: reading 0.23 1.25 0.67** 1.95Subject taught in target class: other 0.11 1.12 0.52** 1.67Teaching experience 0.39** 1.48 0.59** 1.79Participating in co-operative learning arrangements for PD 0.19** 1.21 0.31** 1.37Attending PD workshops and seminars 0.08 1.08 0.28** 1.32Receiving feedback and appraisal for innovative teaching 0.43** 1.54 1.23** 3.40Constructivist beliefs about the nature of teaching and learning 0.10 1.11 0.22** 1.24Teacher self-efficacy 0.34** 1.40 0.69** 1.99
sChOOl lEvEl analysIs Profile b Profile C
ß ß
var
iab
les Educational level of the student’s parents 0.12 0.42**
School size 0.00 0.00Average hours of work -0.02 0.07School autonomy in curriculum 0.01 -0.02School autonomy in hiring teachers and determining salaries -0.16 0.01Administrative leadership style -0.03 0.04Instructional leadership style -0.05 -0.10Percent of teachers reporting feedback and appraisal for innovative teaching -0.02 -0.52
notes: values that are statistically significant at the p < 0.05 level are indicated with *. values that are statistically significant at the p < 0.01 level are indicated with **. source: oecd, TALIS Database. Teaching and Learning International Survey 2008.1 2 http://dx.doi.org/10.1787/888932648615
Table C.13 Multilevel multinomial regression analysis for teaching practices for lithuania
tEaChEr lEvEl analysIsProfile b Profile C
ß odds ß odds
var
iab
les Gender 0.79** 2.19 0.38 1.46
Level of education -0.13 0.88 -0.42* 0.66Subject taught in target class: mathematics -1.21** 0.30 -1.27** 0.28Subject taught in target class: reading 0.39 1.47 0.50 1.65Subject taught in target class: other -0.17 0.85 0.32 1.38Teaching experience 0.36* 1.43 0.88** 2.41Participating in co-operative learning arrangements for PD 0.32** 1.37 0.62** 1.87Attending PD workshops and seminars 0.16* 1.17 0.03 1.03Receiving feedback and appraisal for innovative teaching 0.64** 1.89 0.80** 2.22Constructivist beliefs about the nature of teaching and learning 0.16 1.18 -0.06 0.95Teacher self-efficacy 0.20** 1.22 0.55** 1.74
sChOOl lEvEl analysIs Profile b Profile C
ß ß
var
iab
les Educational level of the student’s parents -0.17 -0.31
School size 0.00 0.00Average hours of work -0.03 -0.05School autonomy in curriculum 0.09 0.13School autonomy in hiring teachers and determining salaries -0.18 -0.71**Administrative leadership style 0.12 0.14Instructional leadership style 0.00 -0.11Percent of teachers reporting feedback and appraisal for innovative teaching 0.13 0.30
notes: values that are statistically significant at the p < 0.05 level are indicated with *. values that are statistically significant at the p < 0.01 level are indicated with **. source: oecd, TALIS Database. Teaching and Learning International Survey 2008.1 2 http://dx.doi.org/10.1787/888932648596

Teaching PracTices and Pedagogical innovaTion: evidence from Talis© OECD 2012
annEx C results of multIlevel multInomIal regressIon analyses
154
Table C.16 Multilevel multinomial regression analysis for teaching practices for Mexico
tEaChEr lEvEl analysIsProfile b Profile C
ß odds ß odds
var
iab
les Gender 0.33** 1.39 0.18 1.20
Level of education 0.04 1.04 -0.11 0.89Subject taught in target class: mathematics -0.63** 0.53 -0.48 0.62Subject taught in target class: reading 0.73** 2.08 1.32** 3.74Subject taught in target class: other 0.06 1.06 0.53** 1.70Teaching experience 0.10 1.11 -0.39* 0.68Participating in co-operative learning arrangements for PD 0.33** 1.39 0.54** 1.72Attending PD workshops and seminars 0.10 1.10 0.20* 1.23Receiving feedback and appraisal for innovative teaching 0.58** 1.79 0.67** 1.95Constructivist beliefs about the nature of teaching and learning 0.16* 1.17 0.29** 1.33Teacher self-efficacy 0.43** 1.53 0.70** 2.02
sChOOl lEvEl analysIs Profile b Profile C
ß ß
var
iab
les Educational level of the student’s parents -0.22* -0.41**
School size -0.01 -0.02**Average hours of work 0.17* 0.17School autonomy in curriculum 0.01 -0.04School autonomy in hiring teachers and determining salaries -0.06 0.13Administrative leadership style 0.07 -0.02Instructional leadership style -0.07 -0.13Percent of teachers reporting feedback and appraisal for innovative teaching 0.13 -0.03
notes: values that are statistically significant at the p < 0.05 level are indicated with *. values that are statistically significant at the p < 0.01 level are indicated with **. source: oecd, TALIS Database. Teaching and Learning International Survey 2008.1 2 http://dx.doi.org/10.1787/888932648653
Table C.15 Multilevel multinomial regression analysis for teaching practices for Malta
tEaChEr lEvEl analysIsProfile b Profile C
ß odds ß odds
var
iab
les Gender 0.33 1.39 0.17 1.18
Level of education 0.25 1.29 0.27 1.31Subject taught in target class: mathematics -0.54 0.58 -0.74 0.48Subject taught in target class: reading 0.62* 1.86 0.19 1.21Subject taught in target class: other 0.66** 1.93 1.11** 3.03Teaching experience 0.09 1.09 0.78** 2.18Participating in co-operative learning arrangements for PD 0.36** 1.43 0.64** 1.90Attending PD workshops and seminars -0.02 0.98 0.34* 1.41Receiving feedback and appraisal for innovative teaching 0.39* 1.47 0.34 1.40Constructivist beliefs about the nature of teaching and learning -0.04 0.96 0.27 1.31Teacher self-efficacy 0.13 1.14 0.32* 1.38
sChOOl lEvEl analysIs 1 Profile b Profile C
ß ß
var
iab
les Educational level of the student’s parents
School sizeAverage hours of workSchool autonomy in curriculumSchool autonomy in hiring teachers and determining salariesAdministrative leadership styleInstructional leadership stylePercent of teachers reporting feedback and appraisal for innovative teaching
notes: values that are statistically significant at the p < 0.05 level are indicated with *. values that are statistically significant at the p < 0.01 level are indicated with **. 1. The number of clusters is not sufficient for analysing the full multilevel model. school level analyses were not performed. source: oecd, TALIS Database. Teaching and Learning International Survey 2008.1 2 http://dx.doi.org/10.1787/888932648634

Teaching PracTices and Pedagogical innovaTion: evidence from Talis © OECD 2012
results of multIlevel multInomIal regressIon analyses annEx C155
Table C.18 Multilevel multinomial regression analysis for teaching practices for Poland
tEaChEr lEvEl analysIsProfile b Profile C
ß odds ß odds
var
iab
les Gender 0.76** 2.14 0.98** 2.66
Level of education -0.39 0.68 -0.45 0.64Subject taught in target class: mathematics -0.57** 0.57 -1.15** 0.32Subject taught in target class: reading 0.81** 2.25 1.23** 3.41Subject taught in target class: other -0.34* 0.71 -0.10 0.90Teaching experience -0.30* 0.74 0.05 1.06Participating in co-operative learning arrangements for PD 0.11 1.11 0.22** 1.25Attending PD workshops and seminars 0.39** 1.48 0.50** 1.65Receiving feedback and appraisal for innovative teaching 0.49** 1.63 0.92** 2.51Constructivist beliefs about the nature of teaching and learning 0.19** 1.21 0.38** 1.46Teacher self-efficacy 0.35** 1.42 0.62** 1.85
sChOOl lEvEl analysIs Profile b Profile C
ß ß
var
iab
les Educational level of the student’s parents -0.04 -0.07
School size -0.02** -0.01Average hours of work 0.15 0.25School autonomy in curriculum -0.12 -0.03School autonomy in hiring teachers and determining salaries 0.08 0.14Administrative leadership style 0.20 0.38**Instructional leadership style -0.14 -0.10Percent of teachers reporting feedback and appraisal for innovative teaching 0.16 0.19
notes: values that are statistically significant at the p < 0.05 level are indicated with *. values that are statistically significant at the p < 0.01 level are indicated with **. source: oecd, TALIS Database. Teaching and Learning International Survey 2008.1 2 http://dx.doi.org/10.1787/888932648691
Table C.17 Multilevel multinomial regression analysis for teaching practices for norway
tEaChEr lEvEl analysIsProfile b Profile C
ß odds ß odds
var
iab
les Gender 0.45** 1.57 0.40* 1.50
Level of education -0.14 0.87 -0.16 0.85Subject taught in target class: mathematics 0.21 1.23 -0.52 0.60Subject taught in target class: reading 0.20 1.23 -0.15 0.86Subject taught in target class: other 0.24 1.27 0.64** 1.89Teaching experience -0.12 0.88 -0.16 0.85Participating in co-operative learning arrangements for PD 0.07 1.07 0.26* 1.30Attending PD workshops and seminars -0.06 0.94 0.05 1.05Receiving feedback and appraisal for innovative teaching 0.51** 1.67 0.68** 1.97Constructivist beliefs about the nature of teaching and learning 0.37** 1.44 0.82** 2.26Teacher self-efficacy 0.25** 1.29 0.42** 1.53
sChOOl lEvEl analysIs Profile b Profile C
ß ß
var
iab
les Educational level of the student’s parents -0.17 -0.38**
School size 0.00 0.01Average hours of work 0.29 0.16School autonomy in curriculum -0.07 0.09School autonomy in hiring teachers and determining salaries -0.15 -0.16Administrative leadership style -0.10 -0.33*Instructional leadership style 0.16 0.18Percent of teachers reporting feedback and appraisal for innovative teaching 0.01 -0.10
notes: values that are statistically significant at the p < 0.05 level are indicated with *. values that are statistically significant at the p < 0.01 level are indicated with **. source: oecd, TALIS Database. Teaching and Learning International Survey 2008.1 2 http://dx.doi.org/10.1787/888932648672
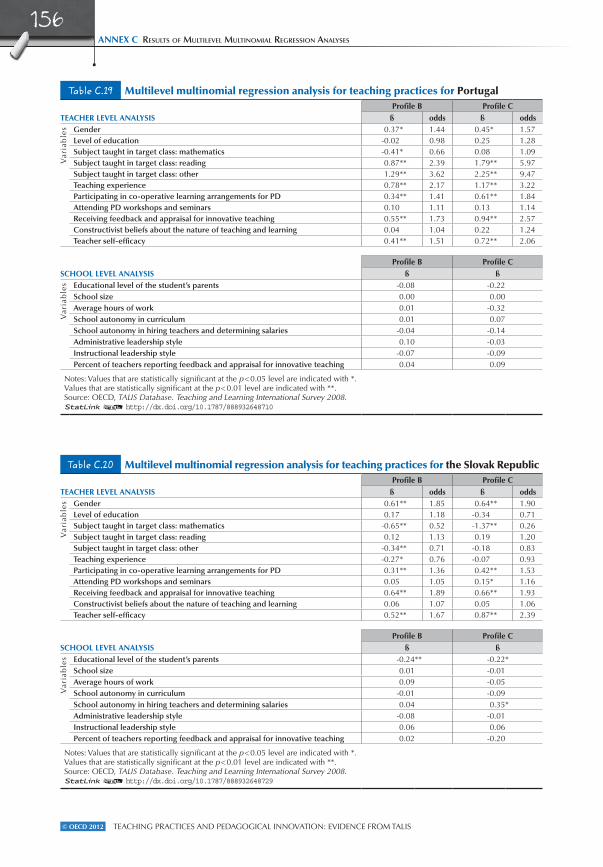
Teaching PracTices and Pedagogical innovaTion: evidence from Talis© OECD 2012
annEx C results of multIlevel multInomIal regressIon analyses
156
Table C.20 Multilevel multinomial regression analysis for teaching practices for the slovak Republic
tEaChEr lEvEl analysIsProfile b Profile C
ß odds ß odds
var
iab
les Gender 0.61** 1.85 0.64** 1.90
Level of education 0.17 1.18 -0.34 0.71Subject taught in target class: mathematics -0.65** 0.52 -1.37** 0.26Subject taught in target class: reading 0.12 1.13 0.19 1.20Subject taught in target class: other -0.34** 0.71 -0.18 0.83Teaching experience -0.27* 0.76 -0.07 0.93Participating in co-operative learning arrangements for PD 0.31** 1.36 0.42** 1.53Attending PD workshops and seminars 0.05 1.05 0.15* 1.16Receiving feedback and appraisal for innovative teaching 0.64** 1.89 0.66** 1.93Constructivist beliefs about the nature of teaching and learning 0.06 1.07 0.05 1.06Teacher self-efficacy 0.52** 1.67 0.87** 2.39
sChOOl lEvEl analysIs Profile b Profile C
ß ß
var
iab
les Educational level of the student’s parents -0.24** -0.22*
School size 0.01 -0.01Average hours of work 0.09 -0.05School autonomy in curriculum -0.01 -0.09School autonomy in hiring teachers and determining salaries 0.04 0.35*Administrative leadership style -0.08 -0.01Instructional leadership style 0.06 0.06Percent of teachers reporting feedback and appraisal for innovative teaching 0.02 -0.20
notes: values that are statistically significant at the p < 0.05 level are indicated with *. values that are statistically significant at the p < 0.01 level are indicated with **. source: oecd, TALIS Database. Teaching and Learning International Survey 2008.1 2 http://dx.doi.org/10.1787/888932648729
Table C.19 Multilevel multinomial regression analysis for teaching practices for Portugal
tEaChEr lEvEl analysIsProfile b Profile C
ß odds ß odds
var
iab
les Gender 0.37* 1.44 0.45* 1.57
Level of education -0.02 0.98 0.25 1.28Subject taught in target class: mathematics -0.41* 0.66 0.08 1.09Subject taught in target class: reading 0.87** 2.39 1.79** 5.97Subject taught in target class: other 1.29** 3.62 2.25** 9.47Teaching experience 0.78** 2.17 1.17** 3.22Participating in co-operative learning arrangements for PD 0.34** 1.41 0.61** 1.84Attending PD workshops and seminars 0.10 1.11 0.13 1.14Receiving feedback and appraisal for innovative teaching 0.55** 1.73 0.94** 2.57Constructivist beliefs about the nature of teaching and learning 0.04 1.04 0.22 1.24Teacher self-efficacy 0.41** 1.51 0.72** 2.06
sChOOl lEvEl analysIs Profile b Profile C
ß ß
var
iab
les Educational level of the student’s parents -0.08 -0.22
School size 0.00 0.00Average hours of work 0.01 -0.32School autonomy in curriculum 0.01 0.07School autonomy in hiring teachers and determining salaries -0.04 -0.14Administrative leadership style 0.10 -0.03Instructional leadership style -0.07 -0.09Percent of teachers reporting feedback and appraisal for innovative teaching 0.04 0.09
notes: values that are statistically significant at the p < 0.05 level are indicated with *. values that are statistically significant at the p < 0.01 level are indicated with **. source: oecd, TALIS Database. Teaching and Learning International Survey 2008.1 2 http://dx.doi.org/10.1787/888932648710

Teaching PracTices and Pedagogical innovaTion: evidence from Talis © OECD 2012
results of multIlevel multInomIal regressIon analyses annEx C157
Table C.22 Multilevel multinomial regression analysis for teaching practices for spain
tEaChEr lEvEl analysIsProfile b Profile C
ß odds ß odds
var
iab
les Gender 0.69** 1.99 0.50* 1.64
Level of education -0.14 0.87 -0.20 0.82Subject taught in target class: mathematics -0.48* 0.62 -0.70 0.49Subject taught in target class: reading 0.56** 1.75 0.78** 2.17Subject taught in target class: other 0.67** 1.96 1.15** 3.17Teaching experience 0.11 1.11 0.49* 1.64Participating in co-operative learning arrangements for PD 0.37** 1.44 0.41** 1.51Attending PD workshops and seminars 0.23** 1.26 0.40** 1.49Receiving feedback and appraisal for innovative teaching 0.63** 1.88 0.61** 1.84Constructivist beliefs about the nature of teaching and learning 0.30** 1.34 0.40** 1.49Teacher self-efficacy 0.31** 1.36 0.65** 1.91
sChOOl lEvEl analysIs Profile b Profile C
ß ß
var
iab
les Educational level of the student’s parents -0.10 -0.03
School size 0.00 0.00Average hours of work -0.08 -0.04School autonomy in curriculum -0.10 -0.26School autonomy in hiring teachers and determining salaries -0.10 -0.09Administrative leadership style 0.01 -0.13Instructional leadership style 0.03 0.04Percent of teachers reporting feedback and appraisal for innovative teaching 0.08 0.21
notes: values that are statistically significant at the p < 0.05 level are indicated with *. values that are statistically significant at the p < 0.01 level are indicated with **. source: oecd, TALIS Database. Teaching and Learning International Survey 2008.1 2 http://dx.doi.org/10.1787/888932648767
Table C.21 Multilevel multinomial regression analysis for teaching practices for slovenia
tEaChEr lEvEl analysIsProfile b Profile C
ß odds ß odds
var
iab
les Gender 0.43** 1.53 0.21 1.23
Level of education -0.12 0.89 1.15 3.15Subject taught in target class: mathematics -0.93** 0.40 -1.34* 0.26Subject taught in target class: reading 0.96** 2.60 1.72** 5.61Subject taught in target class: other -0.04 0.96 0.50 1.65Teaching experience 0.06 1.06 -0.38 0.68Participating in co-operative learning arrangements for PD 0.14* 1.15 0.37** 1.44Attending PD workshops and seminars 0.23** 1.26 0.30* 1.35Receiving feedback and appraisal for innovative teaching 0.69** 1.98 0.79** 2.21Constructivist beliefs about the nature of teaching and learning 0.35** 1.42 0.28 1.33Teacher self-efficacy 0.41** 1.51 0.67** 1.95
sChOOl lEvEl analysIs Profile b Profile C
ß ß
var
iab
les Educational level of the student’s parents -0.09 -0.17
School size 0.00 -0.01Average hours of work 0.28* 0.21School autonomy in curriculum 0.05 -0.09School autonomy in hiring teachers and determining salaries 0.15 0.10Administrative leadership style 0.15 0.19Instructional leadership style -0.08 -0.23Percent of teachers reporting feedback and appraisal for innovative teaching 0.09 0.20
notes: values that are statistically significant at the p < 0.05 level are indicated with *. values that are statistically significant at the p < 0.01 level are indicated with **. source: oecd, TALIS Database. Teaching and Learning International Survey 2008.1 2 http://dx.doi.org/10.1787/888932648748

Teaching PracTices and Pedagogical innovaTion: evidence from Talis© OECD 2012
annEx C results of multIlevel multInomIal regressIon analyses
158
Table C.24 Multilevel multinomial regression analysis for participation in professional learning communities for Australia
tEaChEr lEvEl analysIsProfile b Profile C Profile D
ß odds ß odds ß odds
var
iab
les Gender 0.20 1.23 0.27 1.31 0.20 1.22
Level of education 0.05 1.05 -0.14 0.87 0.06 1.06Subject taught in target class: mathematics 2.45** 11.57 2.44** 11.44 2.35* 10.50Subject taught in target class: reading 1.11* 3.02 1.31* 3.70 1.62** 5.05Subject taught in target class: other -0.20 0.82 0.24 1.27 0.64* 1.89Teaching experience 0.12 1.13 0.46 1.58 0.19 1.21Participating in co-operative learning arrangements for PD 0.37* 1.44 0.29 1.34 1.08** 2.94Attending PD workshops and seminars 0.10 1.10 0.21 1.23 0.47** 1.60Receiving feedback and appraisal for innovative teaching 0.49 1.62 0.52 1.68 1.36** 3.89Constructivist beliefs about the nature of teaching and learning 0.06 1.06 0.11 1.12 0.29 1.34Teacher self-efficacy 0.26 1.29 0.36** 1.43 0.40** 1.49
sChOOl lEvEl analysIs Profile b Profile C Profile D
ß ß ß
var
iab
les Educational level of the student’s parents -0.05 -0.12 -0.40*
School size 0.01* 0.01* 0.01*Average hours of work 0.43* 0.21 0.44*School autonomy in curriculum -0.22 -0.05 -0.48School autonomy in hiring teachers and determining salaries -0.04 -0.02 -0.05Administrative leadership style -0.31 -0.19 -0.16Instructional leadership style 0.46* 0.26 0.37Percent of teachers reporting feedback and appraisal for innovative teaching -0.25 -0.10 0.28
notes: values that are statistically significant at the p < 0.05 level are indicated with *. values that are statistically significant at the p < 0.01 level are indicated with **. source: oecd, TALIS Database. Teaching and Learning International Survey 2008.1 2 http://dx.doi.org/10.1787/888932648805
Table C.23 Multilevel multinomial regression analysis for teaching practices for Turkey
tEaChEr lEvEl analysIsProfile b Profile C
ß odds ß odds
var
iab
les Gender 0.50** 1.65 0.46** 1.59
Level of education -0.13 0.88 0.10 1.10Subject taught in target class: mathematics -0.64** 0.53 -0.70** 0.50Subject taught in target class: reading 0.30 1.34 0.49* 1.63Subject taught in target class: other -0.10 0.90 0.45** 1.57Teaching experience 0.22 1.25 0.18 1.20Participating in co-operative learning arrangements for PD 0.22** 1.25 0.39** 1.47Attending PD workshops and seminars 0.03 1.03 0.04 1.04Receiving feedback and appraisal for innovative teaching 0.14 1.15 0.50** 1.65Constructivist beliefs about the nature of teaching and learning 0.11 1.12 -0.05 0.95Teacher self-efficacy 0.41** 1.51 0.75** 2.11
sChOOl lEvEl analysIs Profile b Profile C
ß ß
var
iab
les Educational level of the student’s parents 0.06 -0.11
School size 0.00 0.00Average hours of work -0.07 -0.01School autonomy in curriculum -0.04 0.00School autonomy in hiring teachers and determining salaries 0.07 0.07Administrative leadership style -0.06 -0.13Instructional leadership style -0.04 -0.02Percent of teachers reporting feedback and appraisal for innovative teaching 0.02 0.02
notes: values that are statistically significant at the p < 0.05 level are indicated with *. values that are statistically significant at the p < 0.01 level are indicated with **. source: oecd, TALIS Database. Teaching and Learning International Survey 2008.1 2 http://dx.doi.org/10.1787/888932648786

Teaching PracTices and Pedagogical innovaTion: evidence from Talis © OECD 2012
results of multIlevel multInomIal regressIon analyses annEx C159
Table C.25 Multilevel multinomial regression analysis for participation in professional learning communities for Austria
tEaChEr lEvEl analysIsProfile b Profile C Profile D
ß odds ß odds ß odds
var
iab
les Gender 0.28** 1.33 0.06 1.07 0.23 1.26
Level of education -1.24** 0.29 -0.67* 0.51 -1.96** 0.14Subject taught in target class: mathematics 0.30* 1.35 0.25 1.29 0.33 1.39Subject taught in target class: reading -0.08 0.93 -0.09 0.92 0.24 1.27Subject taught in target class: other -0.20 0.82 0.09 1.10 0.24 1.27Teaching experience -0.16 0.85 0.46 1.58 0.23 1.26Participating in co-operative learning arrangements for PD 0.16* 1.18 0.62** 1.87 0.77** 2.15Attending PD workshops and seminars 0.12* 1.13 0.03 1.03 0.43** 1.53Receiving feedback and appraisal for innovative teaching 0.36** 1.43 0.65** 1.92 0.92** 2.51Constructivist beliefs about the nature of teaching and learning 0.09 1.09 0.03 1.03 -0.01 0.99Teacher self-efficacy 0.22** 1.25 0.27** 1.30 0.52** 1.69
sChOOl lEvEl analysIs Profile b Profile C Profile D
ß ß ß
var
iab
les Educational level of the student’s parents -0.28* -0.22 -0.30
School size 0.01 0.01** 0.00Average hours of work 0.29 0.46* 0.24School autonomy in curriculum 0.18 0.01 0.52School autonomy in hiring teachers and determining salaries 0.02 -0.03 0.80**Administrative leadership style 0.04 0.06 -0.06Instructional leadership style 0.11 0.02 -0.24Percent of teachers reporting feedback and appraisal for innovative teaching 0.20 -0.06 0.77*
notes: values that are statistically significant at the p < 0.05 level are indicated with *. values that are statistically significant at the p < 0.01 level are indicated with **. source: oecd, TALIS Database. Teaching and Learning International Survey 2008.1 2 http://dx.doi.org/10.1787/888932648824
Table C.26 Multilevel multinomial regression analysis for participation in professional learning communities for Belgium (Flemish community)
tEaChEr lEvEl analysIsProfile b Profile C
ß odds ß odds
var
iab
les Gender -0.34* 0.71 -0.29 0.75
Level of education -0.24 0.79 -0.49 0.61Subject taught in target class: mathematics -0.37 0.69 -0.16 0.86Subject taught in target class: reading -0.08 0.92 -0.04 0.97Subject taught in target class: other 0.22 1.24 0.78** 2.19Teaching experience 0.15 1.16 0.36* 1.44Participating in co-operative learning arrangements for PD 0.86** 2.36 0.14 1.15Attending PD workshops and seminars -0.09 0.91 -0.05 0.96Receiving feedback and appraisal for innovative teaching 0.21 1.23 0.44** 1.55Constructivist beliefs about the nature of teaching and learning -0.14 0.87 -0.11 0.89Teacher self-efficacy 0.21** 1.23 0.27** 1.32
sChOOl lEvEl analysIs Profile b Profile C
ß ß
var
iab
les Educational level of the student’s parents -0.35** -0.36**
School size 0.00 0.00Average hours of work 0.05 0.19School autonomy in curriculum -0.12 -0.02School autonomy in hiring teachers and determining salaries 0.35 0.36Administrative leadership style 0.21* 0.30*Instructional leadership style -0.14 -0.31*Percent of teachers reporting feedback and appraisal for innovative teaching 0.29* 0.11
notes: values that are statistically significant at the p < 0.05 level are indicated with *. values that are statistically significant at the p < 0.01 level are indicated with **. source: oecd, TALIS Database. Teaching and Learning International Survey 2008.1 2 http://dx.doi.org/10.1787/888932648843

Teaching PracTices and Pedagogical innovaTion: evidence from Talis© OECD 2012
annEx C results of multIlevel multInomIal regressIon analyses
160
Table C.27 Multilevel multinomial regression analysis for participation in professional learning communities for Brazil
tEaChEr lEvEl analysIsProfile b Profile C Profile D
ß odds ß odds ß odds
var
iab
les Gender 1.07** 2.92 0.16 1.17 0.28 1.32
Level of education 0.73 2.07 -0.54 0.58 -0.44 0.65Subject taught in target class: mathematics 0.60** 1.81 0.39 1.47 0.37 1.44Subject taught in target class: reading 0.29 1.33 0.00 1.00 0.13 1.14Subject taught in target class: other 0.10 1.11 0.02 1.02 0.36 1.43Teaching experience -0.09 0.92 0.03 1.03 0.49** 1.62Participating in co-operative learning arrangements for PD 0.41** 1.51 0.75** 2.12 0.73** 2.08Attending PD workshops and seminars 0.24** 1.28 0.17* 1.19 0.17 1.19Receiving feedback and appraisal for innovative teaching 0.99** 2.68 0.90** 2.45 1.45** 4.28Constructivist beliefs about the nature of teaching and learning 0.05 1.05 -0.15 0.86 -0.20 0.82Teacher self-efficacy 0.31** 1.36 0.38** 1.47 0.45** 1.57
sChOOl lEvEl analysIs Profile b Profile C Profile D
ß ß ß
var
iab
les Educational level of the student’s parents 0.47** 0.07 0.33
School size 0.00 0.00 0.00Average hours of work 0.29** 0.33** 0.37**School autonomy in curriculum 0.07 -0.06 -0.09School autonomy in hiring teachers and determining salaries -0.64** -0.26 -0.59*Administrative leadership style 0.11 0.03 0.03Instructional leadership style -0.05 0.07 0.09Percent of teachers reporting feedback and appraisal for innovative teaching 0.33** 0.32* 0.33*
notes: values that are statistically significant at the p < 0.05 level are indicated with *. values that are statistically significant at the p < 0.01 level are indicated with **. source: oecd, TALIS Database. Teaching and Learning International Survey 2008.1 2 http://dx.doi.org/10.1787/888932648862
Table C.28 Multilevel multinomial regression analysis for participation in professional learning communities for Bulgaria
tEaChEr lEvEl analysIsProfile b Profile C
ß odds ß odds
var
iab
les Gender -0.58** 0.56 -0.36* 0.70
Level of education -0.01 0.99 -0.41** 0.66Subject taught in target class: mathematics -0.23 0.80 -0.19 0.83Subject taught in target class: reading -0.09 0.91 -0.53* 0.59Subject taught in target class: other 0.36* 1.43 1.03** 2.80Teaching experience -0.25 0.78 -0.15 0.86Participating in co-operative learning arrangements for PD 0.26** 1.29 0.27** 1.31Attending PD workshops and seminars 0.03 1.03 -0.07 0.93Receiving feedback and appraisal for innovative teaching 0.52** 1.68 0.05 1.05Constructivist beliefs about the nature of teaching and learning 0.10 1.10 -0.03 0.97Teacher self-efficacy 0.15 1.16 0.20** 1.22
sChOOl lEvEl analysIs Profile b Profile C
ß ß
var
iab
les Educational level of the student’s parents 0.17 0.16
School size 0.00 0.01Average hours of work 0.19 -0.08School autonomy in curriculum -0.06 -0.11School autonomy in hiring teachers and determining salaries 0.06 0.00Administrative leadership style 0.01 -0.05Instructional leadership style 0.08 -0.11Percent of teachers reporting feedback and appraisal for innovative teaching 0.11 -0.18
notes: values that are statistically significant at the p < 0.05 level are indicated with *. values that are statistically significant at the p < 0.01 level are indicated with **. source: oecd, TALIS Database. Teaching and Learning International Survey 2008.1 2 http://dx.doi.org/10.1787/888932648881

Teaching PracTices and Pedagogical innovaTion: evidence from Talis © OECD 2012
results of multIlevel multInomIal regressIon analyses annEx C161
Table C.29 Multilevel multinomial regression analysis for participation in professional learning communities for Denmark
tEaChEr lEvEl analysIsProfile b Profile C Profile D
ß odds ß odds ß odds
var
iab
les Gender 0.40 1.48 -0.10 0.91 0.29 1.34
Level of education -0.45 0.64 0.14 1.15 -0.72 0.49Subject taught in target class: mathematics -0.07 0.94 0.14 1.15 0.16 1.17Subject taught in target class: reading 0.30 1.35 0.66 1.93 0.53 1.69Subject taught in target class: other -0.38 0.68 0.21 1.23 0.08 1.08Teaching experience -0.03 0.97 -0.31 0.73 0.12 1.12Participating in co-operative learning arrangements for PD 0.48* 1.62 0.95** 2.58 0.71** 2.04Attending PD workshops and seminars 0.12 1.13 0.28 1.33 0.19 1.21Receiving feedback and appraisal for innovative teaching 1.20** 3.33 1.39** 4.01 1.81** 6.13Constructivist beliefs about the nature of teaching and learning 0.06 1.06 -0.03 0.97 0.02 1.02Teacher self-efficacy 0.25* 1.28 0.20 1.22 0.24* 1.27
sChOOl lEvEl analysIs Profile b Profile C Profile D
ß ß ß
var
iab
les Educational level of the student’s parents -0.70** -0.76** -0.98**
School size 0.04** 0.04** 0.04**Average hours of work 0.42 0.23 0.58School autonomy in curriculum -1.41* -1.39* -1.56*School autonomy in hiring teachers and determining salaries -0.16 0.12 -0.30Administrative leadership style 0.48 0.82* 0.40Instructional leadership style 0.17 -0.23 0.35Percent of teachers reporting feedback and appraisal for innovative teaching 0.08 0.03 -0.04
notes: values that are statistically significant at the p < 0.05 level are indicated with *. values that are statistically significant at the p < 0.01 level are indicated with **. source: oecd, TALIS Database. Teaching and Learning International Survey 2008.1 2 http://dx.doi.org/10.1787/888932648900
Table C.30 Multilevel multinomial regression analysis for participation in professional learning communities for Estonia
tEaChEr lEvEl analysIsProfile b Profile C
ß odds ß odds
var
iab
les Gender 1.01** 2.74 1.09** 2.98
Level of education -0.10 0.91 -0.21 0.81Subject taught in target class: mathematics 0.20 1.22 0.11 1.12Subject taught in target class: reading 0.28 1.32 0.38 1.47Subject taught in target class: other -0.21 0.81 -0.01 0.99Teaching experience -0.21 0.81 -0.38 0.69Participating in co-operative learning arrangements for PD 0.65** 1.92 0.88** 2.41Attending PD workshops and seminars 0.46** 1.59 0.56** 1.74Receiving feedback and appraisal for innovative teaching 1.20** 3.30 1.31** 3.69Constructivist beliefs about the nature of teaching and learning 0.12 1.13 0.10 1.10Teacher self-efficacy 0.44* 1.55 0.60* 1.82
sChOOl lEvEl analysIs Profile b Profile C
ß ß
var
iab
les Educational level of the student’s parents 0.34 0.25
School size 0.01 0.01Average hours of work 0.39 0.38School autonomy in curriculum 0.11 -0.06School autonomy in hiring teachers and determining salaries 0.51 0.43Administrative leadership style -0.52* -0.20Instructional leadership style 0.25 0.19Percent of teachers reporting feedback and appraisal for innovative teaching -0.13 0.11
notes: values that are statistically significant at the p < 0.05 level are indicated with *. values that are statistically significant at the p < 0.01 level are indicated with **. source: oecd, TALIS Database. Teaching and Learning International Survey 2008.1 2 http://dx.doi.org/10.1787/888932648919

Teaching PracTices and Pedagogical innovaTion: evidence from Talis© OECD 2012
annEx C results of multIlevel multInomIal regressIon analyses
162
Table C.31 Multilevel multinomial regression analysis for participation in professional learning communities for Hungary
tEaChEr lEvEl analysIsProfile b Profile C
ß odds ß odds
var
iab
les Gender -0.20 0.82 -0.16 0.86
Level of education 0.32* 1.37 0.28 1.32Subject taught in target class: mathematics -0.55* 0.57 -0.39 0.68Subject taught in target class: reading -0.56* 0.57 -0.78* 0.46Subject taught in target class: other 0.24 1.27 0.45 1.56Teaching experience 0.06 1.06 -0.21 0.81Participating in co-operative learning arrangements for PD 0.20** 1.22 0.06 1.06Attending PD workshops and seminars 0.12 1.13 0.07 1.07Receiving feedback and appraisal for innovative teaching 0.43** 1.54 0.12 1.13Constructivist beliefs about the nature of teaching and learning -0.10 0.90 -0.22* 0.80Teacher self-efficacy 0.30** 1.35 0.37** 1.45
sChOOl lEvEl analysIs Profile b Profile C
ß ß
var
iab
les Educational level of the student’s parents 0.05 0.02
School size 0.00 -0.01Average hours of work 0.18 0.18School autonomy in curriculum 0.08 -0.25School autonomy in hiring teachers and determining salaries -0.02 0.07Administrative leadership style 0.13 0.10Instructional leadership style 0.08 0.29Percent of teachers reporting feedback and appraisal for innovative teaching 0.05 0.19
notes: values that are statistically significant at the p < 0.05 level are indicated with *. values that are statistically significant at the p < 0.01 level are indicated with **. source: oecd, TALIS Database. Teaching and Learning International Survey 2008.1 2 http://dx.doi.org/10.1787/888932648938
Table C.32 Multilevel multinomial regression analysis for participation in professional learning communities for Iceland
tEaChEr lEvEl analysIsProfile b Profile C
ß odds ß odds
var
iab
les Gender 0.36* 1.44 -0.16 0.85
Level of education -0.09 0.91 0.11 1.12Subject taught in target class: mathematics 0.06 1.06 0.25 1.28Subject taught in target class: reading -0.08 0.93 0.28 1.33Subject taught in target class: other -0.07 0.93 0.13 1.14Teaching experience 0.21 1.23 -0.14 0.87Participating in co-operative learning arrangements for PD 0.30** 1.35 0.47** 1.60Attending PD workshops and seminars 0.09 1.10 0.07 1.07Receiving feedback and appraisal for innovative teaching 0.43** 1.54 0.57* 1.77Constructivist beliefs about the nature of teaching and learning 0.06 1.06 -0.07 0.93Teacher self-efficacy 0.16* 1.17 0.41** 1.50
sChOOl lEvEl analysIs 1Profile b Profile C
ß ß
var
iab
les Educational level of the student’s parents
School sizeAverage hours of workSchool autonomy in curriculumSchool autonomy in hiring teachers and determining salariesAdministrative leadership styleInstructional leadership stylePercent of teachers reporting feedback and appraisal for innovative teaching
notes: values that are statistically significant at the p < 0.05 level are indicated with *. values that are statistically significant at the p < 0.01 level are indicated with **.1. The number of clusters is not sufficient for analysing the full multilevel model. school level analyses were not performed. source: oecd, TALIS Database. Teaching and Learning International Survey 2008.1 2 http://dx.doi.org/10.1787/888932648957

Teaching PracTices and Pedagogical innovaTion: evidence from Talis © OECD 2012
results of multIlevel multInomIal regressIon analyses annEx C163
Table C.33 Multilevel multinomial regression analysis for participation in professional learning communities for Ireland
tEaChEr lEvEl analysIsProfile b Profile C
ß odds ß odds
var
iab
les Gender 0.20 1.22 -0.79** 0.45
Level of education 0.02 1.02 -0.28 0.75Subject taught in target class: mathematics 0.42 1.53 0.31 1.36Subject taught in target class: reading 0.36 1.43 -0.13 0.88Subject taught in target class: other 0.26 1.30 -0.18 0.84Teaching experience 0.10 1.11 0.47 1.60Participating in co-operative learning arrangements for PD 0.27** 1.31 0.77** 2.16Attending PD workshops and seminars 0.13 1.14 0.22 1.24Receiving feedback and appraisal for innovative teaching 0.22 1.25 0.53* 1.70Constructivist beliefs about the nature of teaching and learning 0.02 1.02 0.00 1.00Teacher self-efficacy 0.05 1.06 0.15 1.16
sChOOl lEvEl analysIs Profile b Profile C
ß ß
var
iab
les Educational level of the student’s parents -0.31** -0.12
School size 0.01 0.03**Average hours of work 0.33 0.06School autonomy in curriculum 0.00 -1.00**School autonomy in hiring teachers and determining salaries 0.42* 0.50Administrative leadership style 0.27 0.15Instructional leadership style -0.07 0.74**Percent of teachers reporting feedback and appraisal for innovative teaching -0.06 0.29
notes: values that are statistically significant at the p < 0.05 level are indicated with *. values that are statistically significant at the p < 0.01 level are indicated with **. source: oecd, TALIS Database. Teaching and Learning International Survey 2008.1 2 http://dx.doi.org/10.1787/888932648976
Table C.34 Multilevel multinomial regression analysis for participation in professional learning communities for Italy
tEaChEr lEvEl analysIsProfile b Profile C
ß odds ß odds
var
iab
les Gender -0.30** 0.74 -0.46* 0.63
Level of education -0.41** 0.67 -0.11 0.90Subject taught in target class: mathematics 0.02 1.02 0.26 1.29Subject taught in target class: reading 0.37** 1.45 0.72** 2.06Subject taught in target class: other -0.10 0.90 0.53* 1.69Teaching experience -0.11 0.90 0.70** 2.00Participating in co-operative learning arrangements for PD 0.33** 1.40 0.30** 1.35Attending PD workshops and seminars 0.12** 1.13 0.21** 1.23Receiving feedback and appraisal for innovative teaching 0.60** 1.82 0.66** 1.94Constructivist beliefs about the nature of teaching and learning -0.06 0.94 0.01 1.01Teacher self-efficacy 0.09 1.09 0.16* 1.18
sChOOl lEvEl analysIs Profile b Profile C
ß ß
var
iab
les Educational level of the student’s parents -0.20* 0.05
School size 0.00 0.00Average hours of work -0.07 0.13School autonomy in curriculum 0.01 0.64*School autonomy in hiring teachers and determining salaries -0.16 -0.17Administrative leadership style -0.13 -0.08Instructional leadership style 0.06 -0.36*Percent of teachers reporting feedback and appraisal for innovative teaching 0.17 -0.09
notes: values that are statistically significant at the p < 0.05 level are indicated with *. values that are statistically significant at the p < 0.01 level are indicated with **. source: oecd, TALIS Database. Teaching and Learning International Survey 2008.1 2 http://dx.doi.org/10.1787/888932648995

Teaching PracTices and Pedagogical innovaTion: evidence from Talis© OECD 2012
annEx C results of multIlevel multInomIal regressIon analyses
164
Table C.36 Multilevel multinomial regression analysis for participation in professional learning communities for lithuania
tEaChEr lEvEl analysIsProfile b Profile C Profile D
ß odds ß odds ß odds
var
iab
les Gender 1.13** 3.08 0.33 1.39 0.66* 1.93
Level of education -0.51 0.60 -0.39 0.68 -0.35 0.71Subject taught in target class: mathematics 0.47 1.59 0.18 1.19 0.55 1.73Subject taught in target class: reading 1.19 3.30 1.00 2.72 1.21 3.36Subject taught in target class: other -0.15 0.86 -0.26 0.77 -0.55* 0.58Teaching experience -0.66 0.52 -1.16** 0.31 -0.82* 0.44Participating in co-operative learning arrangements for PD 0.46* 1.58 0.47* 1.59 1.11** 3.04Attending PD workshops and seminars 0.33 1.40 0.49** 1.64 0.68** 1.98Receiving feedback and appraisal for innovative teaching 0.93** 2.53 0.94** 2.57 1.89** 6.59Constructivist beliefs about the nature of teaching and learning 0.20 1.22 -0.03 0.97 0.15 1.16Teacher self-efficacy 0.33 1.39 0.19 1.21 0.52** 1.69
sChOOl lEvEl analysIs Profile b Profile C Profile D
ß ß ß
var
iab
les Educational level of the student’s parents 0.27 0.07 0.37
School size 0.02** 0.01 0.02**Average hours of work -0.03 -0.09 -0.04School autonomy in curriculum -0.21 -0.05 -0.21School autonomy in hiring teachers and determining salaries -0.08 0.13 -0.06Administrative leadership style 0.24 0.23* 0.29*Instructional leadership style -0.20 -0.37* -0.17Percent of teachers reporting feedback and appraisal for innovative teaching 0.08 0.13 0.24
notes: values that are statistically significant at the p < 0.05 level are indicated with *. values that are statistically significant at the p < 0.01 level are indicated with **. source: oecd, TALIS Database. Teaching and Learning International Survey 2008.1 2 http://dx.doi.org/10.1787/888932649033
Table C.35 Multilevel multinomial regression analysis for participation in professional learning communities for Korea
tEaChEr lEvEl analysIsProfile b Profile C Profile D
ß odds ß odds ß odds
var
iab
les Gender -0.48* 0.62 -0.17 0.84 -0.18 0.83
Level of education -0.23 0.80 0.06 1.06 0.32 1.38Subject taught in target class: mathematics 0.05 1.05 -0.18 0.84 0.05 1.05Subject taught in target class: reading 0.25 1.29 0.38 1.46 0.06 1.06Subject taught in target class: other 0.02 1.02 0.36* 1.43 0.10 1.11Teaching experience -0.40 0.67 -0.19 0.82 0.05 1.05Participating in co-operative learning arrangements for PD 0.11 1.12 -0.16* 0.86 0.48** 1.61Attending PD workshops and seminars 0.06 1.06 0.05 1.05 0.22* 1.25Receiving feedback and appraisal for innovative teaching 0.56** 1.74 0.34* 1.40 1.15** 3.14Constructivist beliefs about the nature of teaching and learning -0.16 0.85 0.02 1.02 -0.12 0.89Teacher self-efficacy 0.34** 1.41 0.15 1.17 0.77** 2.16
sChOOl lEvEl analysIs Profile b Profile C Profile D
ß ß ß
var
iab
les Educational level of the student’s parents 0.01 0.00 0.15
School size 0.00 0.01 0.00Average hours of work -0.16 -0.02 0.02School autonomy in curriculum 0.16 0.25** 0.26*School autonomy in hiring teachers and determining salaries -0.21 -0.01 -0.21Administrative leadership style -0.04 -0.07 -0.14Instructional leadership style -0.26 -0.11 -0.01Percent of teachers reporting feedback and appraisal for innovative teaching 0.24 0.06 0.16
notes: values that are statistically significant at the p < 0.05 level are indicated with *. values that are statistically significant at the p < 0.01 level are indicated with **. source: oecd, TALIS Database. Teaching and Learning International Survey 2008.1 2 http://dx.doi.org/10.1787/888932648995
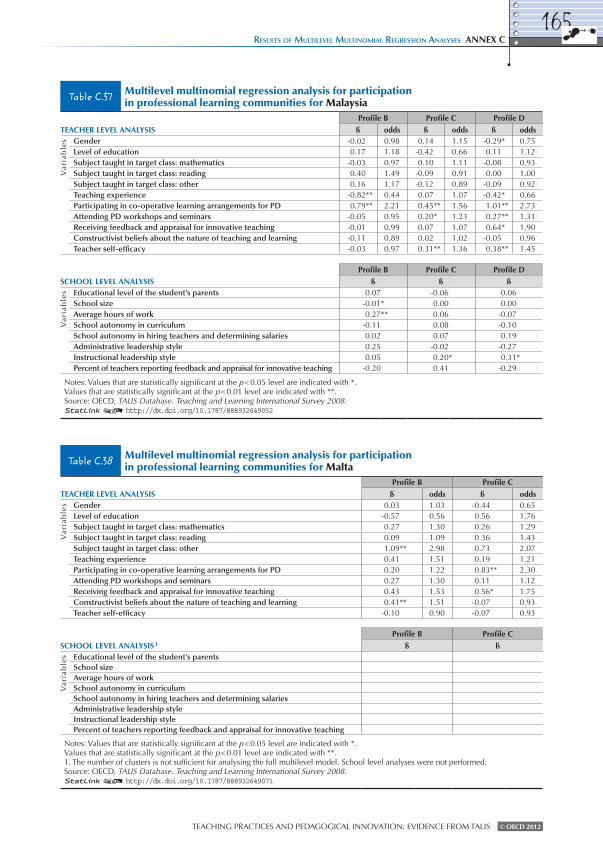
Teaching PracTices and Pedagogical innovaTion: evidence from Talis © OECD 2012
results of multIlevel multInomIal regressIon analyses annEx C165
Table C.37 Multilevel multinomial regression analysis for participation in professional learning communities for Malaysia
tEaChEr lEvEl analysIsProfile b Profile C Profile D
ß odds ß odds ß odds
var
iab
les Gender -0.02 0.98 0.14 1.15 -0.29* 0.75
Level of education 0.17 1.18 -0.42 0.66 0.11 1.12Subject taught in target class: mathematics -0.03 0.97 0.10 1.11 -0.08 0.93Subject taught in target class: reading 0.40 1.49 -0.09 0.91 0.00 1.00Subject taught in target class: other 0.16 1.17 -0.12 0.89 -0.09 0.92Teaching experience -0.82** 0.44 0.07 1.07 -0.42* 0.66Participating in co-operative learning arrangements for PD 0.79** 2.21 0.45** 1.56 1.01** 2.73Attending PD workshops and seminars -0.05 0.95 0.20* 1.23 0.27** 1.31Receiving feedback and appraisal for innovative teaching -0.01 0.99 0.07 1.07 0.64* 1.90Constructivist beliefs about the nature of teaching and learning -0.11 0.89 0.02 1.02 -0.05 0.96Teacher self-efficacy -0.03 0.97 0.31** 1.36 0.38** 1.45
sChOOl lEvEl analysIs Profile b Profile C Profile D
ß ß ß
var
iab
les Educational level of the student’s parents 0.07 -0.06 0.06
School size -0.01* 0.00 0.00Average hours of work 0.27** 0.06 -0.07School autonomy in curriculum -0.11 0.08 -0.10School autonomy in hiring teachers and determining salaries 0.02 0.07 0.19Administrative leadership style 0.25 -0.02 -0.27Instructional leadership style 0.05 0.20* 0.31*Percent of teachers reporting feedback and appraisal for innovative teaching -0.20 0.41 -0.29
notes: values that are statistically significant at the p < 0.05 level are indicated with *. values that are statistically significant at the p < 0.01 level are indicated with **. source: oecd, TALIS Database. Teaching and Learning International Survey 2008.1 2 http://dx.doi.org/10.1787/888932649052
Table C.38 Multilevel multinomial regression analysis for participation in professional learning communities for Malta
tEaChEr lEvEl analysIsProfile b Profile C
ß odds ß odds
var
iab
les Gender 0.03 1.03 -0.44 0.65
Level of education -0.57 0.56 0.56 1.76Subject taught in target class: mathematics 0.27 1.30 0.26 1.29Subject taught in target class: reading 0.09 1.09 0.36 1.43Subject taught in target class: other 1.09** 2.98 0.73 2.07Teaching experience 0.41 1.51 0.19 1.21Participating in co-operative learning arrangements for PD 0.20 1.22 0.83** 2.30Attending PD workshops and seminars 0.27 1.30 0.11 1.12Receiving feedback and appraisal for innovative teaching 0.43 1.53 0.56* 1.75Constructivist beliefs about the nature of teaching and learning 0.41** 1.51 -0.07 0.93Teacher self-efficacy -0.10 0.90 -0.07 0.93
sChOOl lEvEl analysIs 1Profile b Profile C
ß ß
var
iab
les Educational level of the student’s parents
School sizeAverage hours of workSchool autonomy in curriculumSchool autonomy in hiring teachers and determining salariesAdministrative leadership styleInstructional leadership stylePercent of teachers reporting feedback and appraisal for innovative teaching
notes: values that are statistically significant at the p < 0.05 level are indicated with *. values that are statistically significant at the p < 0.01 level are indicated with **.1. The number of clusters is not sufficient for analysing the full multilevel model. school level analyses were not performed. source: oecd, TALIS Database. Teaching and Learning International Survey 2008.1 2 http://dx.doi.org/10.1787/888932649071
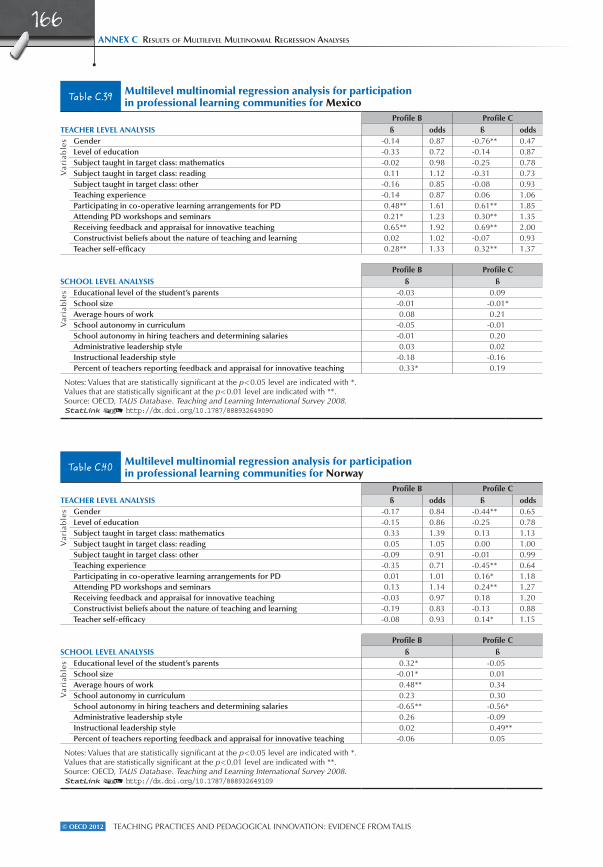
Teaching PracTices and Pedagogical innovaTion: evidence from Talis© OECD 2012
annEx C results of multIlevel multInomIal regressIon analyses
166
Table C.39 Multilevel multinomial regression analysis for participation in professional learning communities for Mexico
tEaChEr lEvEl analysIsProfile b Profile C
ß odds ß odds
var
iab
les Gender -0.14 0.87 -0.76** 0.47
Level of education -0.33 0.72 -0.14 0.87Subject taught in target class: mathematics -0.02 0.98 -0.25 0.78Subject taught in target class: reading 0.11 1.12 -0.31 0.73Subject taught in target class: other -0.16 0.85 -0.08 0.93Teaching experience -0.14 0.87 0.06 1.06Participating in co-operative learning arrangements for PD 0.48** 1.61 0.61** 1.85Attending PD workshops and seminars 0.21* 1.23 0.30** 1.35Receiving feedback and appraisal for innovative teaching 0.65** 1.92 0.69** 2.00Constructivist beliefs about the nature of teaching and learning 0.02 1.02 -0.07 0.93Teacher self-efficacy 0.28** 1.33 0.32** 1.37
sChOOl lEvEl analysIs Profile b Profile C
ß ß
var
iab
les Educational level of the student’s parents -0.03 0.09
School size -0.01 -0.01*Average hours of work 0.08 0.21School autonomy in curriculum -0.05 -0.01School autonomy in hiring teachers and determining salaries -0.01 0.20Administrative leadership style 0.03 0.02Instructional leadership style -0.18 -0.16Percent of teachers reporting feedback and appraisal for innovative teaching 0.33* 0.19
notes: values that are statistically significant at the p < 0.05 level are indicated with *. values that are statistically significant at the p < 0.01 level are indicated with **. source: oecd, TALIS Database. Teaching and Learning International Survey 2008.1 2 http://dx.doi.org/10.1787/888932649090
Table C.40 Multilevel multinomial regression analysis for participation in professional learning communities for norway
tEaChEr lEvEl analysIsProfile b Profile C
ß odds ß odds
var
iab
les Gender -0.17 0.84 -0.44** 0.65
Level of education -0.15 0.86 -0.25 0.78Subject taught in target class: mathematics 0.33 1.39 0.13 1.13Subject taught in target class: reading 0.05 1.05 0.00 1.00Subject taught in target class: other -0.09 0.91 -0.01 0.99Teaching experience -0.35 0.71 -0.45** 0.64Participating in co-operative learning arrangements for PD 0.01 1.01 0.16* 1.18Attending PD workshops and seminars 0.13 1.14 0.24** 1.27Receiving feedback and appraisal for innovative teaching -0.03 0.97 0.18 1.20Constructivist beliefs about the nature of teaching and learning -0.19 0.83 -0.13 0.88Teacher self-efficacy -0.08 0.93 0.14* 1.15
sChOOl lEvEl analysIs Profile b Profile C
ß ß
var
iab
les Educational level of the student’s parents 0.32* -0.05
School size -0.01* 0.01Average hours of work 0.48** 0.34School autonomy in curriculum 0.23 0.30School autonomy in hiring teachers and determining salaries -0.65** -0.56*Administrative leadership style 0.26 -0.09Instructional leadership style 0.02 0.49**Percent of teachers reporting feedback and appraisal for innovative teaching -0.06 0.05
notes: values that are statistically significant at the p < 0.05 level are indicated with *. values that are statistically significant at the p < 0.01 level are indicated with **. source: oecd, TALIS Database. Teaching and Learning International Survey 2008.1 2 http://dx.doi.org/10.1787/888932649109
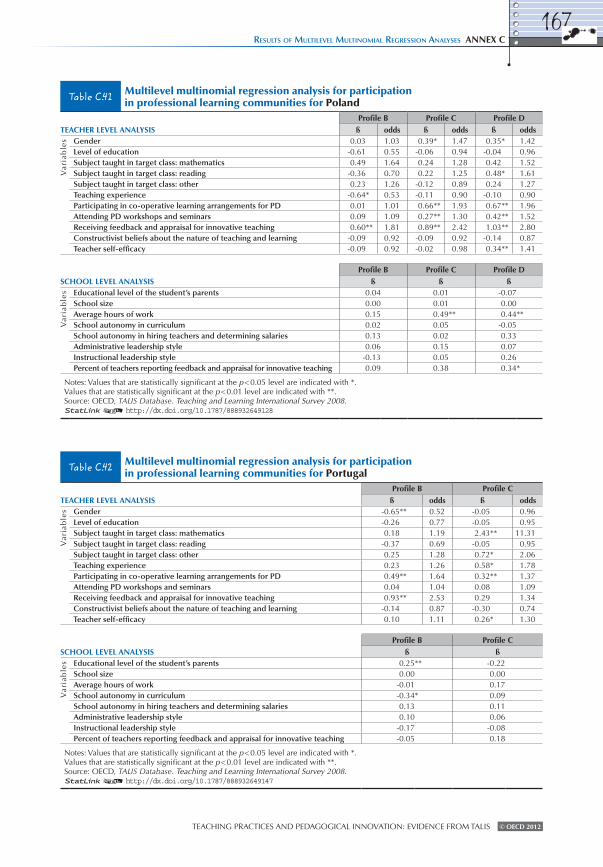
Teaching PracTices and Pedagogical innovaTion: evidence from Talis © OECD 2012
results of multIlevel multInomIal regressIon analyses annEx C167
Table C.41 Multilevel multinomial regression analysis for participation in professional learning communities for Poland
tEaChEr lEvEl analysIsProfile b Profile C Profile D
ß odds ß odds ß odds
var
iab
les Gender 0.03 1.03 0.39* 1.47 0.35* 1.42
Level of education -0.61 0.55 -0.06 0.94 -0.04 0.96Subject taught in target class: mathematics 0.49 1.64 0.24 1.28 0.42 1.52Subject taught in target class: reading -0.36 0.70 0.22 1.25 0.48* 1.61Subject taught in target class: other 0.23 1.26 -0.12 0.89 0.24 1.27Teaching experience -0.64* 0.53 -0.11 0.90 -0.10 0.90Participating in co-operative learning arrangements for PD 0.01 1.01 0.66** 1.93 0.67** 1.96Attending PD workshops and seminars 0.09 1.09 0.27** 1.30 0.42** 1.52Receiving feedback and appraisal for innovative teaching 0.60** 1.81 0.89** 2.42 1.03** 2.80Constructivist beliefs about the nature of teaching and learning -0.09 0.92 -0.09 0.92 -0.14 0.87Teacher self-efficacy -0.09 0.92 -0.02 0.98 0.34** 1.41
sChOOl lEvEl analysIs Profile b Profile C Profile D
ß ß ß
var
iab
les Educational level of the student’s parents 0.04 0.01 -0.07
School size 0.00 0.01 0.00Average hours of work 0.15 0.49** 0.44**School autonomy in curriculum 0.02 0.05 -0.05School autonomy in hiring teachers and determining salaries 0.13 0.02 0.33Administrative leadership style 0.06 0.15 0.07Instructional leadership style -0.13 0.05 0.26Percent of teachers reporting feedback and appraisal for innovative teaching 0.09 0.38 0.34*
notes: values that are statistically significant at the p < 0.05 level are indicated with *. values that are statistically significant at the p < 0.01 level are indicated with **. source: oecd, TALIS Database. Teaching and Learning International Survey 2008.1 2 http://dx.doi.org/10.1787/888932649128
Table C.42 Multilevel multinomial regression analysis for participation in professional learning communities for Portugal
tEaChEr lEvEl analysIsProfile b Profile C
ß odds ß odds
var
iab
les Gender -0.65** 0.52 -0.05 0.96
Level of education -0.26 0.77 -0.05 0.95Subject taught in target class: mathematics 0.18 1.19 2.43** 11.31Subject taught in target class: reading -0.37 0.69 -0.05 0.95Subject taught in target class: other 0.25 1.28 0.72* 2.06Teaching experience 0.23 1.26 0.58* 1.78Participating in co-operative learning arrangements for PD 0.49** 1.64 0.32** 1.37Attending PD workshops and seminars 0.04 1.04 0.08 1.09Receiving feedback and appraisal for innovative teaching 0.93** 2.53 0.29 1.34Constructivist beliefs about the nature of teaching and learning -0.14 0.87 -0.30 0.74Teacher self-efficacy 0.10 1.11 0.26* 1.30
sChOOl lEvEl analysIs Profile b Profile C
ß ß
var
iab
les Educational level of the student’s parents 0.25** -0.22
School size 0.00 0.00Average hours of work -0.01 0.17School autonomy in curriculum -0.34* 0.09School autonomy in hiring teachers and determining salaries 0.13 0.11Administrative leadership style 0.10 0.06Instructional leadership style -0.17 -0.08Percent of teachers reporting feedback and appraisal for innovative teaching -0.05 0.18
notes: values that are statistically significant at the p < 0.05 level are indicated with *. values that are statistically significant at the p < 0.01 level are indicated with **. source: oecd, TALIS Database. Teaching and Learning International Survey 2008.1 2 http://dx.doi.org/10.1787/888932649147

Teaching PracTices and Pedagogical innovaTion: evidence from Talis© OECD 2012
annEx C results of multIlevel multInomIal regressIon analyses
168
Table C.44 Multilevel multinomial regression analysis for participation in professional learning communities for slovenia
tEaChEr lEvEl analysIsProfile b Profile C Profile D
ß odds ß odds ß odds
var
iab
les Gender 0.33 1.39 0.04 1.04 0.46 1.59
Level of education -0.17 0.85 -0.20 0.82 0.15 1.16Subject taught in target class: mathematics 1.19** 3.29 1.05** 2.84 1.23** 3.42Subject taught in target class: reading 0.92** 2.50 0.68 1.98 1.65** 5.22Subject taught in target class: other -1.39** 0.25 -0.90** 0.41 -1.08** 0.34Teaching experience -0.01 0.99 -0.32 0.73 0.10 1.11Participating in co-operative learning arrangements for PD 0.28* 1.32 0.48** 1.62 0.67** 1.95Attending PD workshops and seminars 0.25** 1.28 0.33** 1.39 0.31* 1.36Receiving feedback and appraisal for innovative teaching 0.34* 1.41 0.75** 2.11 1.16** 3.20Constructivist beliefs about the nature of teaching and learning 0.25* 1.28 -0.03 0.97 0.00 1.00Teacher self-efficacy 0.04 1.04 0.09 1.09 0.27 1.31
sChOOl lEvEl analysIs Profile b Profile C Profile D
ß ß ß
var
iab
les Educational level of the student’s parents -0.12 -0.13 -0.23
School size 0.02** 0.02** 0.03**Average hours of work 0.12 -0.06 0.42School autonomy in curriculum 0.06 -0.02 0.17School autonomy in hiring teachers and determining salaries -0.24 -0.16 -0.12Administrative leadership style 0.46** 0.32 0.44Instructional leadership style -0.28 -0.24 -0.28Percent of teachers reporting feedback and appraisal for innovative teaching 0.12 0.15 0.25
notes: values that are statistically significant at the p < 0.05 level are indicated with *. values that are statistically significant at the p < 0.01 level are indicated with **. source: oecd, TALIS Database. Teaching and Learning International Survey 2008.1 2 http://dx.doi.org/10.1787/888932649185
Table C.43 Multilevel multinomial regression analysis for participation in professional learning communities for the slovak Republic
tEaChEr lEvEl analysIsProfile b Profile C
ß odds ß odds
var
iab
les Gender 0.80** 2.23 1.01** 2.75
Level of education 0.31 1.36 0.13 1.14Subject taught in target class: mathematics 0.22 1.24 0.15 1.17Subject taught in target class: reading 0.22 1.25 0.42 1.53Subject taught in target class: other -0.90** 0.41 -0.53** 0.59Teaching experience 0.25 1.29 -0.58** 0.56Participating in co-operative learning arrangements for PD 0.20 1.22 0.49** 1.62Attending PD workshops and seminars 0.06 1.07 0.05 1.05Receiving feedback and appraisal for innovative teaching 1.08** 2.95 1.62** 5.07Constructivist beliefs about the nature of teaching and learning 0.37 1.45 0.15 1.17Teacher self-efficacy 0.25 1.28 0.57** 1.76
sChOOl lEvEl analysIs Profile b Profile C
ß ß
var
iab
les Educational level of the student’s parents -0.11 -0.15
School size 0.01 -0.01Average hours of work 0.02 0.16School autonomy in curriculum 0.21 0.17School autonomy in hiring teachers and determining salaries -0.31 -0.28Administrative leadership style 0.26 0.21Instructional leadership style -0.16 0.02Percent of teachers reporting feedback and appraisal for innovative teaching 0.20 0.21
notes: values that are statistically significant at the p < 0.05 level are indicated with *. values that are statistically significant at the p < 0.01 level are indicated with **. source: oecd, TALIS Database. Teaching and Learning International Survey 2008.1 2 http://dx.doi.org/10.1787/888932649166
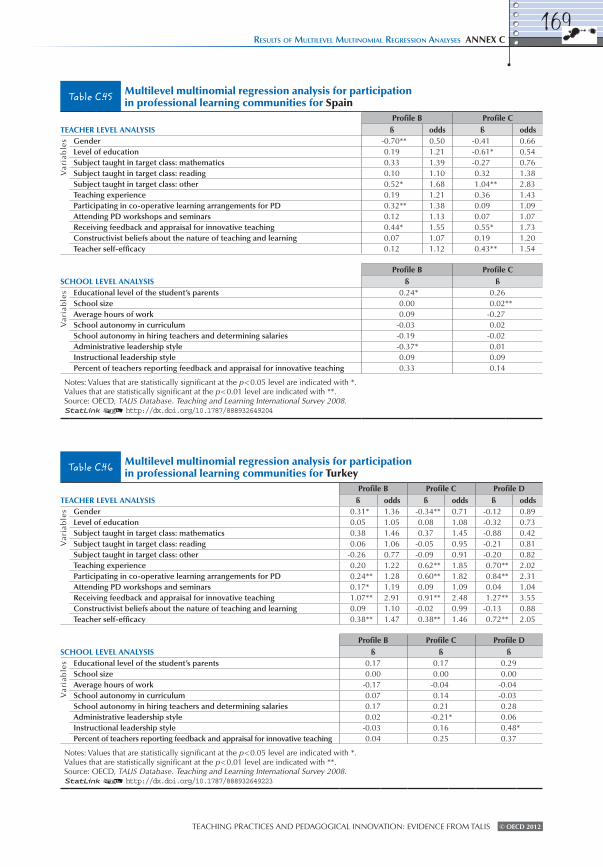
Teaching PracTices and Pedagogical innovaTion: evidence from Talis © OECD 2012
results of multIlevel multInomIal regressIon analyses annEx C169
Table C.46 Multilevel multinomial regression analysis for participation in professional learning communities for Turkey
tEaChEr lEvEl analysIsProfile b Profile C Profile D
ß odds ß odds ß odds
var
iab
les Gender 0.31* 1.36 -0.34** 0.71 -0.12 0.89
Level of education 0.05 1.05 0.08 1.08 -0.32 0.73Subject taught in target class: mathematics 0.38 1.46 0.37 1.45 -0.88 0.42Subject taught in target class: reading 0.06 1.06 -0.05 0.95 -0.21 0.81Subject taught in target class: other -0.26 0.77 -0.09 0.91 -0.20 0.82Teaching experience 0.20 1.22 0.62** 1.85 0.70** 2.02Participating in co-operative learning arrangements for PD 0.24** 1.28 0.60** 1.82 0.84** 2.31Attending PD workshops and seminars 0.17* 1.19 0.09 1.09 0.04 1.04Receiving feedback and appraisal for innovative teaching 1.07** 2.91 0.91** 2.48 1.27** 3.55Constructivist beliefs about the nature of teaching and learning 0.09 1.10 -0.02 0.99 -0.13 0.88Teacher self-efficacy 0.38** 1.47 0.38** 1.46 0.72** 2.05
sChOOl lEvEl analysIs Profile b Profile C Profile D
ß ß ß
var
iab
les Educational level of the student’s parents 0.17 0.17 0.29
School size 0.00 0.00 0.00Average hours of work -0.17 -0.04 -0.04School autonomy in curriculum 0.07 0.14 -0.03School autonomy in hiring teachers and determining salaries 0.17 0.21 0.28Administrative leadership style 0.02 -0.21* 0.06Instructional leadership style -0.03 0.16 0.48*Percent of teachers reporting feedback and appraisal for innovative teaching 0.04 0.25 0.37
notes: values that are statistically significant at the p < 0.05 level are indicated with *. values that are statistically significant at the p < 0.01 level are indicated with **. source: oecd, TALIS Database. Teaching and Learning International Survey 2008.1 2 http://dx.doi.org/10.1787/888932649223
Table C.45 Multilevel multinomial regression analysis for participation in professional learning communities for spain
tEaChEr lEvEl analysIsProfile b Profile C
ß odds ß odds
var
iab
les Gender -0.70** 0.50 -0.41 0.66
Level of education 0.19 1.21 -0.61* 0.54Subject taught in target class: mathematics 0.33 1.39 -0.27 0.76Subject taught in target class: reading 0.10 1.10 0.32 1.38Subject taught in target class: other 0.52* 1.68 1.04** 2.83Teaching experience 0.19 1.21 0.36 1.43Participating in co-operative learning arrangements for PD 0.32** 1.38 0.09 1.09Attending PD workshops and seminars 0.12 1.13 0.07 1.07Receiving feedback and appraisal for innovative teaching 0.44* 1.55 0.55* 1.73Constructivist beliefs about the nature of teaching and learning 0.07 1.07 0.19 1.20Teacher self-efficacy 0.12 1.12 0.43** 1.54
sChOOl lEvEl analysIs Profile b Profile C
ß ß
var
iab
les Educational level of the student’s parents 0.24* 0.26
School size 0.00 0.02**Average hours of work 0.09 -0.27School autonomy in curriculum -0.03 0.02School autonomy in hiring teachers and determining salaries -0.19 -0.02Administrative leadership style -0.37* 0.01Instructional leadership style 0.09 0.09Percent of teachers reporting feedback and appraisal for innovative teaching 0.33 0.14
notes: values that are statistically significant at the p < 0.05 level are indicated with *. values that are statistically significant at the p < 0.01 level are indicated with **. source: oecd, TALIS Database. Teaching and Learning International Survey 2008.1 2 http://dx.doi.org/10.1787/888932649204


OECD PUBLISHING, 2, rue André-Pascal, 75775 PARIS CEDEX 16
(87 2012 02 1P) ISBN 978-92-64-12328-1 – No. 60197 2012
ORGANISATION FOR ECONOMIC CO-OPERATIONAND DEVELOPMENT
The OECD is a unique forum where governments work together to address the economic, social and environmental challenges of globalisation. The OECD is also at the forefront of efforts to understand and to help governments respond to new developments and concerns, such as corporate governance, the information economy and the challenges of an ageing population. The Organisation provides a setting where governments can compare policy experiences, seek answers to common problems, identify good practice and work to co-ordinate domestic and international policies.
The OECD member countries are: Australia, Austria, Belgium, Canada, Chile, the Czech Republic, Denmark, Estonia, Finland, France, Germany, Greece, Hungary, Iceland, Ireland, Israel, Italy, Japan, Korea, Luxembourg, Mexico, the Netherlands, New Zealand, Norway, Poland, Portugal, the Slovak Republic, Slovenia, Spain, Sweden, Switzerland, Turkey, the United Kingdom and the United States. The European Union takes part in the work of the OECD.
OECD Publishing disseminates widely the results of the Organisation’s statistics gathering and research on economic, social and environmental issues, as well as the conventions, guidelines and standards agreed by its members.

2012
Teaching Practices and Pedagogical InnovationsEvidEncE from TALiS
fortunately, teaching practices help shape the learning experiences and increase motivation and achievement for students. in addition, it has been revealed that when teachers collaborate well together they also tend to work better with students. This new informative publication clearly identifies and arranges profiles in relation to two connected areas of professional teacher practices: classroom teaching practices and participation in professional learning communities.
This practical book enables a more comprehensive understanding of teaching practice and participation in professional learning communities nationally and internationally. it provides policy makers and other key stakeholders with the relevant information they need for educational system monitoring.
Contents
chapter 1. introduction
chapter 2. Teachers’ Professional Practices
chapter 3. Analysing Teachers’ Professional Practices with TALiS data
chapter 4. Profiles of Teachers’ Professional Practices
chapter 5. Profiles of Participation in Professional Learning communities
chapter 6. Key findings and Policy implications
ISBN 978-92-64-12328-1 87 2012 02 1P
Please cite this publication as:Vieluf S., et al. (2012), Teaching Practices and Pedagogical Innovations: Evidence from TALIS, OECD Publishing.http://dx.doi.org/10.1787/9789264123540-en
This work is published on the OECD iLibrary, which gathers all OECD books, periodicals and statistical databases. Visit www.oecd-ilibrary.org and do not hesitate to contact us for more information.