teaching practices of graduate teaching assistants · teaching practices of graduate teaching...
TRANSCRIPT
SAN JOSE STATE UNIVERSITY
DEPARTMENT OF PHYSICS AND ASTRONOMY
Teaching practices of graduate teaching assistants
A Master’s Project
SUBMITTED TO THE DEPARTMENT OF PHYSICS AND ASTRONOMY
in partial fulfillment of the requirements for the
degree of
MASTER OF SCIENCE
By
Eric Matthew Hickok
San Jose, California
2015
arX
iv:1
602.
0774
0v1
[ph
ysic
s.ed
-ph]
24
Feb
2016

Teaching practices of graduate teaching assistants
A MASTER’S PROJECT APPROVED FOR THEDEPARTMENT OF PHYSICS AND ASTRONOMY
Approved by
Cassandra Paul
Michael Kaufman
Monika Kress
c© by Eric Matthew Hickok 2015All Rights Reserved.

Contents
List Of Tables vi
List Of Figures vii
Abstract viii
Introduction ix
1 Background 11.1 Motivation . . . . . . . . . . . . . . . . . . . . . . . . . . . . . . . . . 11.2 Guiding questions . . . . . . . . . . . . . . . . . . . . . . . . . . . . . 21.3 Observational tools . . . . . . . . . . . . . . . . . . . . . . . . . . . . 31.4 Sample and Environment . . . . . . . . . . . . . . . . . . . . . . . . . 41.5 Targeted questions . . . . . . . . . . . . . . . . . . . . . . . . . . . . 7
2 Methods 102.1 Observations . . . . . . . . . . . . . . . . . . . . . . . . . . . . . . . . 102.2 Validity of measurements . . . . . . . . . . . . . . . . . . . . . . . . . 11
2.2.1 Cohen’s kappa . . . . . . . . . . . . . . . . . . . . . . . . . . . 11
3 A breakdown of the interactions used overall 14
4 Comparison of Physics 50 and Physics 50W 164.1 Physics 50 . . . . . . . . . . . . . . . . . . . . . . . . . . . . . . . . . 164.2 Physics 50W . . . . . . . . . . . . . . . . . . . . . . . . . . . . . . . . 194.3 A look at “problem solving” days . . . . . . . . . . . . . . . . . . . . 22
5 Comparison to UC Davis 24
6 Alignment with PER-based best practices 276.1 Lessons from Peer Instruction . . . . . . . . . . . . . . . . . . . . . . 276.2 Looking at our practices . . . . . . . . . . . . . . . . . . . . . . . . . 296.3 Lessons from Modeling Discourse Management . . . . . . . . . . . . . 29
iv
7 Conclusions 317.1 A Summary of Results . . . . . . . . . . . . . . . . . . . . . . . . . . 31
7.1.1 What TA-student interactions do our TAs employ in theirteaching assignments? . . . . . . . . . . . . . . . . . . . . . . 31
7.1.2 How do these interactions differ in Physics 50 and Physics 50W? 317.1.2.a How do Physics 50 “problem solving days” compare
to regular lab days and Physics 50W observations? . 327.1.3 How do our TAs’ implementations of Physics 50 and Physics 50W
compare with available RIOT data from courses at UC Davis? 327.1.4 How do our TAs’ implementations of Physics 50 and Physics 50W
compare with PER-based best practices? . . . . . . . . . . . . 337.2 Future Work . . . . . . . . . . . . . . . . . . . . . . . . . . . . . . . . 33
Reference List 34
v

List Of Tables
1.1 A list of Instructor-Student interactions captured by the RIOT . . . . 5
2.1 Observation counts by TA and course . . . . . . . . . . . . . . . . . . 102.2 A sample matrix used to calculate Cohen’s kappa . . . . . . . . . . . 12
6.1 Scientific practices emphasized through the use of Peer Instruction . . 286.2 Components of Modeling Discourse Management . . . . . . . . . . . . 30
vi
List Of Figures
3.1 TA-student interactions in four different courses . . . . . . . . . . . . 15
4.1 TA-student interactions in the Physics 50 lab classroom . . . . . . . . 174.2 Box-and-whisker plots of Physics 50 interactions . . . . . . . . . . . . 184.3 TA-student interactions in the Physics 50W classroom . . . . . . . . 194.4 Box-and-whisker plots of Physics 50W interactions . . . . . . . . . . 204.5 Interactions that directly followed Observations in Physics 50W . . . 214.6 Box-and-whisker plot comparing Physics 50 lab days, Physics 50 prob-
lem solving days, and Physics 50W . . . . . . . . . . . . . . . . . . . 22
5.1 Box-and-whisker plot comparing “Small Group” time in SJSU andUC Davis courses . . . . . . . . . . . . . . . . . . . . . . . . . . . . . 25
5.2 Box-and-whisker plot comparing “Whole Class” time in SJSU andUC Davis courses . . . . . . . . . . . . . . . . . . . . . . . . . . . . . 25
vii
Abstract
Physics education research has consistently shown that students have higher
learning outcomes when enrolled in interactive-engagement courses. Consequently,
many schools are actively reforming their introductory curricula. For courses where
the interactive sections (labs, tutorials, and/or workshops) are mostly taught by
graduate student teaching assistants (TAs), good TAs are instrumental to the suc-
cess of the reform. Many studies have investigated specific interactions between
TAs and students, but more can be learned through a holistic examination of TA-
student interactions. Over the course of one semester, I observed TAs in their various
teaching roles using the Real-time Instructor Observation Tool (RIOT). These ob-
servations serve to show what TAs may “default to” with little to no intervention.
I present a snapshot of a department in the early stages of reform and discuss the
implications of my findings as they relate to the professional development of our
TAs.
viii
Introduction
A common theme in physics education research is the overwhelming evidence
that students tend to learn more when they are actively engaged in the learning
process [1,2]. Students enrolled in interactive-engagement (IE) courses show greater
normalized gains in conceptual understanding (as measured by tests like the Force
Concept Inventory [3]) than their peers enrolled in traditional courses [1]. Arguments
have been made that IE students have better retention of material [4] while achieving
the same, if not better, problem solving skills [5]. Indeed, the results have been
so convincing that high schools and universities across the country have already
adopted, or are moving to adopt, their own version of an IE course [2, 6–11].
The Department of Physics and Astronomy at San Jose State University (SJSU)
is engaged in the preliminary stages of adopting an IE curriculum for its introductory
physics courses. Like most universities, many of SJSU’s laboratory sections of these
courses are currently taught by graduate student teaching assistants (TAs). Being a
terminal master’s program, the pool of available TAs is generally in flux, providing
approximately three years of teaching experience for any given TA. Although much
has been studied examining TAs in an IE environment [12–15] there has been little
study of graduate students in a laboratory teaching environment such as ours. Ad-
ditionally, while much has been written about how best to train and prepare TAs for
their teaching duties [14, 16–19], remarkably little research has been to see exactly
what they are in fact doing during their teaching assignments in more traditional
laboratory settings.
Much work has been done studying effective methods of preparation for TAs
(and undergraduate learning assistants) in a Studio Physics environment [18–20].
However, our labs are not of the “studio” nature. In the case of our calculus-based
freshman mechanics course, the lab section is largely traditional. Students work from
a lab manual with a prescribed procedure, the result of which “validates” concepts
ix
or values described or derived in lecture. Students also attend a weekly problem-
solving session. These “workshops” are meant to be time for students to work
collaboratively in small groups to solve end-of-the-chapter-style physics problems.
Study of lab and workshop sections of this introductory course shows the state
of a department in the very early stages of reform. The aim of this project is to
develop this baseline of data showing what our TAs may “default to” with little
to no intervention. This information will be analyzed by class format and then be
compared to best practices from current literature.
x
Chapter 1
Background
1.1 Motivation
Some teachers advocate for the practice of asking students how they think they
learn best and trying to adapt their teaching methods to suit student preferences.
Unfortunately, students tend to prefer a passive learning environment and even think
they learn better in it [12]. Despite this preference, Koenig, et al. found that students
performed significantly better on post-tests in an IE setting lead by a TA than in a
lecture delivered by a professor. This result is so prevalent that the majority of the
literature involving the study of TAs occurs in an IE setting [8, 13, 20–22]. Despite
varying beliefs about teaching, TAs tend toward similar teaching behaviors in the
classroom [15].
Goertzen, et al. suggest that TA “buy-in” to reformed instruction is a necessary
component of effective curriculum implementation and that detailed understanding
of TA beliefs and motivations can only improve TA professional development [14]. It
is important for any department employing TAs, regardless of what stage of reform
they are in, to tailor their professional development to meet the needs of their TAs.
Providing TAs the opportunity to express their beliefs and opinions about teaching
allows for responsive professional development [23]. Much as we hope to build on
productive seeds of physics knowledge in our students, we should be observing our
TAs’ teaching so that we can see and encourage beliefs and practices that are more
aligned with reformed physics instruction.
1
Studies have found considerable variation in how TAs interact with their stu-
dents [14, 24], even when the TAs are provided with extensive notes about the
curriculum [25]. Even different instructors’ implementations of the same reform
strategies have shown striking differences [26, 27]. Not only is it important then to
observe the TAs to improve professional development offerings, but also to examine
how a curriculum is being interpreted by the TAs and deployed to the students.
Observations of TAs provides an opportunity for the department to examine cur-
riculum and make any needed improvements, from use of equipment to lessons as a
whole.
1.2 Guiding questions
For courses where the interactive sections (labs, tutorials, and/or workshops) are
mostly taught by graduate student teaching assistants, good TAs are instrumental
to the success of the reform [12]. Consequently, TA professional development is
crucial to successful reform.
Before developing a robust professional development program that is targeted to
the needs of our TAs, we first need to know where they are starting out. Therefore,
it is imperative to observe their interactions in their teaching assignments. These
observations will serve to show what practices TAs may “default to” with little to no
intervention, providing a snapshot of the department in the early stages of reform.
This study was envisioned to answer the following questions.
• What teaching practices are currently being used by our TAs?
• How are the current teaching practices split by format?
• How do these practices compare to what is currently being done by similar
departments and institutions?
• How do these practices compare to what physics education research tells us
are the most effective practices?
2
I will compare the teaching practices in use in our different lab and workshop courses.
Answers to these questions will provide a baseline of information to further the ongo-
ing conversation in the department about improving instruction in the introductory
physics series.
1.3 Observational tools
Education research has yielded a number of tools for measuring the degree to which
a course or instructor utilizes interactive and student-centered techniques. One such
tool for this is the Reformed Teaching Observation Protocol (RTOP) [28].
With sufficient training, an RTOP observer rates the instruction of a given lesson
on the topics of lesson design, content, and classroom culture using a Likert Scale.
In our case, the TAs teach from a prescribed lab manual without the freedom to
design the labs according to the specific needs of their students. Only the prompts
concerning classroom culture would provide insight into the TA’s role in the class-
room. These prompts account for only ten of the twenty-five items, with only five
directly concerning TA-student interactions. How TAs choose to interact with their
students is the most overt choice of teaching practice available to them. And while
the RTOP encourages documenting events to justify the ratings, as a tool, it doesn’t
provide the level of resolution for our needs, with only five of the twenty-five items
offering insight into TA-student interactions.
For our needs, a more useful observational protocol would provide detail into
how TAs and students are spending their time in the classroom without judging the
effectiveness of any specific pedagogic strategy. A team at the University of Maine
and the University of British Columbia developed the Classroom Observation Pro-
tocol for Undergraduate STEM (COPUS) to do just this [29]. The COPUS was
developed as a modified version of the Teaching Dimensions Observation Protocol
(TDOP) [30]. The team found that the TDOP required too much training and of-
fered too many codes to fit their specific needs. The COPUS is simplified to code
what both the students and the instructor are doing at two-minute intervals into 25
possible activities and interactions, twelve for students and thirteen for instructors.
Completed analysis of an observation yields two pie charts showing the prevalence
3
of each code for both students and instructors. The individual codes of the CO-
PUS reveal that the protocol is designed to code nonlaboratory-style courses. The
majority of the codes would be of little use in a laboratory or workshop setting.
Researchers at UC Davis originally developed a tool for monitoring and classify-
ing instructor-student interactions [25]. Later made publicly available by a team at
San Jose State University, this Real-time Instructor Observing Tool (RIOT) quanti-
fies and times these interactions, providing a more illustrative view of what actually
takes place in a given TA’s classroom. The RIOT enables categorization and record-
ing of instructor actions continuously in real time. Interactions are categorized into
four major groups: talking at students, shared instructor-student dialogue, observ-
ing students, and not interacting. Each of these major categories contains useful
subdivisions of several descriptive categories as shown on Table 1.1, adapted from
West, et al. 2013 [25]. The instructor can perform each subcategory of interac-
tion with an individual student, a small group of students, or with the whole class.
Interaction-type, start time of the interaction, and duration of the interaction are
all logged in real time, providing a full picture of TA-student interactions for the
duration of the class period.
1.4 Sample and Environment
For this study, observations took place in two distinct TA-led course types: in-
troductory physics labs and introductory physics workshops. The lab sections are
fairly traditional, with students following a prescribed procedure to achieve a result
that is then compared with the theory developed in the lecture course. Workshops
were instituted to provide students an opportunity to work in small groups to solve
end-of-chapter style problems and present their solutions to their classmates.
Learning outcomes for the laboratory section include the ability to “solve rela-
tively complex mechanics problems in a systematic manner by applying the laws of
physics and calculus” and “qualitatively describe the motion of objects using physics
terminology and concepts.” Each lab session meets once a week for two hours and
fifty minutes. In lab, students work in small groups to complete an experiment and
report their findings. Some of the courses require students to take periodic quizzes
4
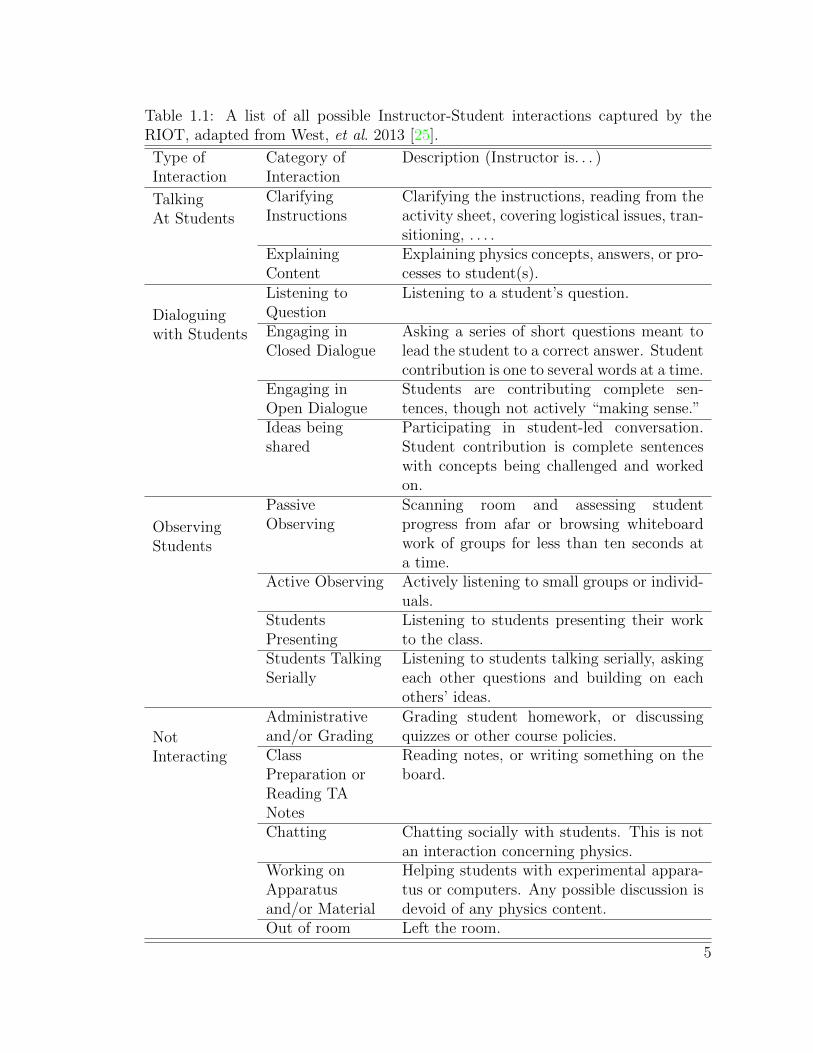
Table 1.1: A list of all possible Instructor-Student interactions captured by theRIOT, adapted from West, et al. 2013 [25].
Type ofInteraction
Category ofInteraction
Description (Instructor is. . . )
TalkingAt Students
ClarifyingInstructions
Clarifying the instructions, reading from theactivity sheet, covering logistical issues, tran-sitioning, . . . .
ExplainingContent
Explaining physics concepts, answers, or pro-cesses to student(s).
Dialoguingwith Students
Listening toQuestion
Listening to a student’s question.
Engaging inClosed Dialogue
Asking a series of short questions meant tolead the student to a correct answer. Studentcontribution is one to several words at a time.
Engaging inOpen Dialogue
Students are contributing complete sen-tences, though not actively “making sense.”
Ideas beingshared
Participating in student-led conversation.Student contribution is complete sentenceswith concepts being challenged and workedon.
ObservingStudents
PassiveObserving
Scanning room and assessing studentprogress from afar or browsing whiteboardwork of groups for less than ten seconds ata time.
Active Observing Actively listening to small groups or individ-uals.
StudentsPresenting
Listening to students presenting their workto the class.
Students TalkingSerially
Listening to students talking serially, askingeach other questions and building on eachothers’ ideas.
NotInteracting
Administrativeand/or Grading
Grading student homework, or discussingquizzes or other course policies.
ClassPreparation orReading TANotes
Reading notes, or writing something on theboard.
Chatting Chatting socially with students. This is notan interaction concerning physics.
Working onApparatusand/or Material
Helping students with experimental appara-tus or computers. Any possible discussion isdevoid of any physics content.
Out of room Left the room.
5
during lab time to make sure they are keeping up with the material. Labs are taught
by either faculty or graduate TAs. The lab instructor is responsible for providing
brief background information the day’s activity, demonstrating the materials to be
used as needed, troubleshooting student difficulties and finicky equipment, and grad-
ing lab reports and any quizzes. Laboratory sections are limited to 20 students per
section.
The introductory, calculus-based mechanics course at SJSU (Physics 50) has an
optional-but-strongly-encouraged “workshop” component (Physics 50W). The work-
shops are modeled after workshops that have been used successfully in the Calculus 1
courses at SJSU as well as in physics courses at other universities. Students taking
those workshops experienced a significant rise in course grades, and a significant
decrease in the probability of failing, compared to those who did not take the work-
shops.
Workshops meet one a week for one hour and fifty minutes. Students work in
small groups to complete a packet of physics problems. The intention is that students
work together collaboratively to solve these problems on whiteboards, taking turns
solving the problems and leading small-group discussions. The role of the TA in
workshop is that of a facilitator: take attendance and help students solve the problem
sets through hints and guiding questions. The TAs are provided with solutions to
the problem sets, but problems are not graded. The TA merely notes that groups
are making satisfactory progress. Workshops are limited to 24 students per section.
Roughly one-third of the Physics 50 lab meetings consisted of “problem solving
sessions” wherein students were given a packet of physics problems to solve rather
completing a laboratory exercise. These problem solving sessions are meant to be
run in a similar manner to the workshop sessions. Students work with the usual
lab group, working through a packet of physics problems. Typically, one or two
problems of the set are turned in to be graded while the rest are offered simple as
additional practice.
In order to teach a lab or workshop section, prospective TAs must complete an
application with the department. They must also be a current Masters student in
the Department of Physics and Astronomy with classified standing, must have an
overall GPA of 3.0 or higher, and must be enrolled in three units or more at SJSU.
6
Prior to the first day of classes, TAs attend a one-day training touching on classroom
management and grading policies as well as a brief overview of physics education
research findings regarding pedagogy. During the training, TAs are instructed to ask
the students leading questions about their reasoning rather than provide them with
solutions or merely correct answers. TAs are assigned sections to teach according to
departmental need and their own course schedule, at the discretion of the department
chair.
The TAs that were observed were in their first or second year of graduate school.
For the most part, their teaching experience was limited to tutoring and previous
lab or workshop teaching at SJSU.
As is common in many universities, students register for separate lecture and
lab sections. A given lab section can therefore have students from multiple lecture
sections taught by multiple lecture instructors. In the interest of consistency, TAs
teach from a prescribed Lab Manual so that every lab section of a given course
conducts the same experiment each week. Thus, some students entering their lab
course on a given day may not have seen the material in their lecture section while
other students may have. It is left to the TA to describe the requisite material for the
day’s activity as well as teach the students how to safely use the equipment to make
adequate measurements. The TAs are also responsible for teaching sufficient data
analysis methods for the students to make sense of the data they collect. This is often
taught directly, in the form of a short lecture. During the course of the semester,
TAs are observed at least once by the professor in charge of a given course’s lab
sections and provided with written feedback about their teaching.
1.5 Targeted questions
Working within the limitations of the RIOT, teaching assignments, and observation
scheduling, the guiding questions laid out in Section 1.2 require some refinement.
The choice of the RIOT as my observational tool limits my observations to only
things done by or with the TAs. My observations will completely bypass any work
done by the students that does not directly involve the TA. It comes to a question
of the intent of the course or TA: If the course is designed such that students work
7
quietly in groups with little to no intervention from the TA (or if the TA structures
the learning environment this way), the only way to capture this using the RIOT is
through notes. The RIOT would log this time as Not Interacting for the TA even
though the students are actively working and possibly learning. With that in mind,
I can only effectively log the TA-student interactions listed in Table 1.1. This leads
to the first question I intend this study to address.
1. What TA-student interactions (as identified by the RIOT) do our TAs employ
in their teaching assignments?
For the semester in question, Spring 2015, the majority of our TAs were as-
signed to teach at least the laboratory section of Physics 50 or the workshop section,
Physics 50W. Some were also assigned to the laboratory sections of the algebra-based
freshman mechanics course or the calculus-based freshmen E&M course, Physics 2A
and Physics 51 respectively.
My own schedule, coupled with the teaching assignments, allowed me to make
very few observations in Physics 2A and Physics 51. These two courses are included
in my overall results for completeness in answering the above question. Lacking
a significant number of observations, I instead focused my analysis on the physics
courses “for majors.” Having observed the majority of the TAs assigned to both
Physics 50 and 50W, it is apposite to examine these courses in more detail, leading
us to ask the following.
2. How do these interactions differ in Physics 50 and Physics 50W?
A small number of my observations in Physics 50 were of “problem solving days.”
Considering that on these days students were not working an actual experiment but
rather working problem sets, one might assume these observations to be indistin-
guishable from an observation of Physics 50W. A subquestion to Question 2 is worth
consideration.
2a. How do Physics 50 “problem solving days” compare to regular lab days and
Physics 50W observations?
8

Research using the RIOT is not yet widespread. Still we can compare our results
to similar studies at other institutions to gain insight into the level of interactivity
our labs and workshops provide.
3. How do our TAs’ implementations of Physics 50 and Physics 50W compare
with available RIOT data from courses at UC Davis?
As instructors, we should always strive to make our courses the most effective
they can be. With that in mind, we ask the following question.
4. How do our TAs’ implementations of Physics 50 and Physics 50W compare
with PER-based best practices?
9

Chapter 2
Methods
2.1 Observations
This study focused on the interactive nature of the introductory physics laboratories
and workshops taught by TAs at SJSU. Observations took place throughout the
spring semester of 2015. Of the eight physics TAs employed by the department,
I observed a total of five. There were a total of sixteen laboratory or workshop
sections taught by TAs of which I observed nine. Each section was observed at least
twice.
Eight sections of the Physics 50 lab were taught by a total of five TAs. I observed
three of these TAs teaching four of these sections. Five sections of the Physics 50
Workshop were taught by four TAs. I observed three of these TAs teaching three of
these sections. Only one TA was observed in both Physics 50 and 50W. A breakdown
of these numbers is shown in Table 2.1.
Table 2.1: Observation counts by TA and course
Physics 50 Physics 50W Total†
Observed Out of Observed Out of Observed Out ofTAs 3 5 3 4 5 8
Sections 4 8 3 5 9 16† It should be noted that I observed a single TA teaching the Physics 2A lab and
another teaching the Physics 51 lab. To maintain anonymity, these observations
are only included here and in the overall results (Section 3) and not discussed
on their own. Also, there was some overlap by individual TAs teaching multiple
courses so the “Total” numbers are not the sums of the course numbers.
10
Observations took place for the first hour of instruction. For those sessions that
a quiz was administered at the beginning of the class, I extended my observation
to include the hour of teaching time after the quiz had taken place. Aside from
introducing myself and describing why I was present when asked, I did not interact
with the instructor or the student during the course of the observation and no
feedback was provided to the instructors about their teaching practice until the end
of the semester when all my observations had been completed.
To maintain anonymity, each TA was assigned a pseudonym and all data were
logged under these pseudonyms. I coded the observations using the RIOT.
2.2 Validity of measurements
Before beginning my official observations, I observed three classes with another re-
searcher familiar with the RIOT. After each of the three sessions, we discussed the
differences in our observations at length resulting in a near match for our third ob-
servation. After the third session, our observations showed an agreement of 88.5%.
Accounting for chance agreements, we saw a Cohen’s kappa value of 82.5% [31].
Even by conservative measures, these values are sufficient to establish the validity
of my measurements.
2.2.1 Cohen’s kappa
To determine these values, I wrote a python script to compare observations of a
single class session taken by two different observers. For each observed interaction,
the RIOT notes the start time and a duration, each with one second resolution. Using
these, my script builds a time series of each observation show the clock time and
interaction for each second of the observation. It then compares the two observations
to find temporal overlap in the two. This way, the observers don’t need to exactly
synchronize the first interactions noted by their RIOT instance.
With a common start time established, the script goes through every second of
the observations and constructs a matrix of what interaction each observer marked
for every second, an example of which is shown in Table 2.2. The diagonal of this
matrix shows when the observations agree, with off-diagonals showing disagreement.
11
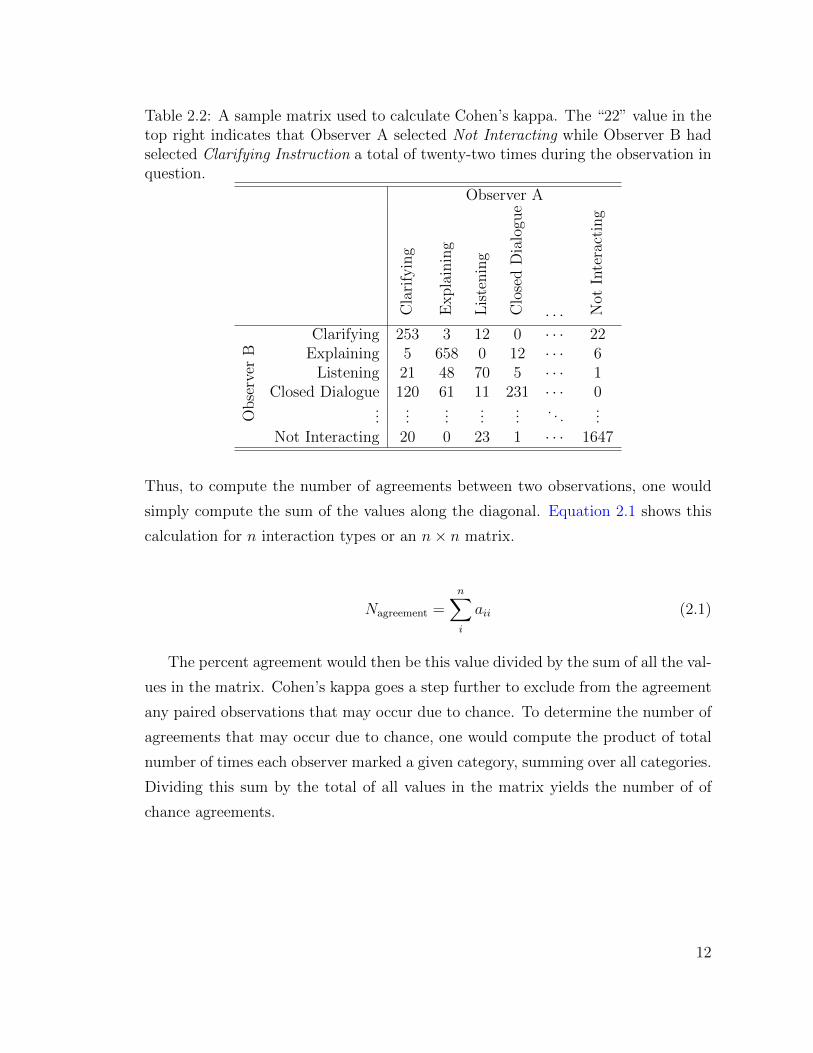
Table 2.2: A sample matrix used to calculate Cohen’s kappa. The “22” value in thetop right indicates that Observer A selected Not Interacting while Observer B hadselected Clarifying Instruction a total of twenty-two times during the observation inquestion.
Observer A
Cla
rify
ing
Expla
inin
g
Lis
tenin
g
Clo
sed
Dia
logu
e
· · · Not
Inte
ract
ing
Obse
rver
B
Clarifying 253 3 12 0 · · · 22Explaining 5 658 0 12 · · · 6
Listening 21 48 70 5 · · · 1Closed Dialogue 120 61 11 231 · · · 0
......
......
.... . .
...Not Interacting 20 0 23 1 · · · 1647
Thus, to compute the number of agreements between two observations, one would
simply compute the sum of the values along the diagonal. Equation 2.1 shows this
calculation for n interaction types or an n× n matrix.
Nagreement =n∑i
aii (2.1)
The percent agreement would then be this value divided by the sum of all the val-
ues in the matrix. Cohen’s kappa goes a step further to exclude from the agreement
any paired observations that may occur due to chance. To determine the number of
agreements that may occur due to chance, one would compute the product of total
number of times each observer marked a given category, summing over all categories.
Dividing this sum by the total of all values in the matrix yields the number of of
chance agreements.
12
Nchance =
n∑i
(n∑j
aijn∑j
aji
)n∑i
n∑j
aij
(2.2)
Cohen’s kappa is then determined by the difference of the numbers of agreement
and chance divided by the difference of the total number of interactions and the
number of chance agreements.
κ =Nagreement −Nchancen∑i
n∑j
aij −Nchance
(2.3)
It is important to remember that measurements of human interactions is inher-
ently “noisier” than standard measurements in a physics laboratory environment.
Values for Cohen’s kappa range from −1 to 1, with 1 indicating perfect agreement
and a value of 0 indicating chance agreement. Arbitrary guidelines have been sug-
gested to categorize kappa values from 0.61 to 0.80 as substantial and 0.81 to 1
as almost perfect agreement [32]. Another equally arbitrary guideline characterizes
kappas over 0.75 as excellent and 0.40 to 0.75 as fair to good [33]. By either of these
standards, my value of 0.825 is more than acceptable.
13
Chapter 3
A breakdown of the interactions used overall
Ultimately, I made observations in four different courses: Physics 50 and 50W
(described in Section 1.4) as well as the algebra-based freshman mechanics lab
(Physics 2A) and the calculus-based freshmen electricity and magnetism lab (Physics 51).
Figure 3.1 shows the net result of these observations. The four pie charts shows the
sum of the interactions for “Small Group” time, “Whole Class” time, “Small Group
and Whole Class” time, and a breakdown of “Time Spent by Group.”
Looking at the sum total of my observations, the TAs spent just under a third
of the time talking at their students: either Clarifying Instruction or Explaining
Content. Less than a fifth of the total time was spent talking with or observing
their students. TAs spent nearly 45% of the total time Not Interacting with their
students.
For my observations, I found it useful to note when the TAs administered a
formal quiz. I used the comment section of the RIOT to note when the quiz began
and ended. Later, I manually went through the csv file for each observation and
manually changed the codes between the times noted by my comments to a new
Quiz code. TAs and students had few interactions during this time, with individuals
occasionally asking questions. While Not Interacting may have been an accurate
description of what was happening during this time, it seemed unfair to weight this
time as Not Interacting when Quiz was more fitting.
TAs tended to use this time to grade, prepare notes on the whiteboard for a
lecture on the coming lab, and a negligible amount of passive observation. Using the
original codes instead of my own Quiz code on the “SG & WC Time” chart, the Not
14
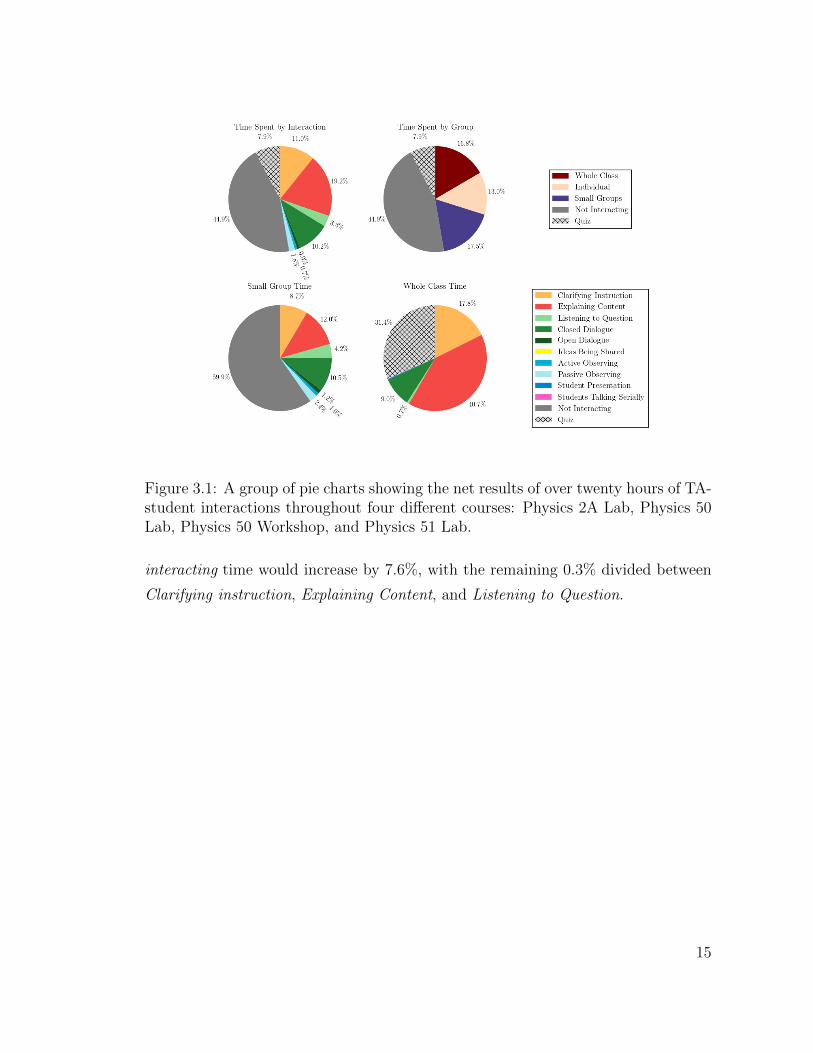
Figure 3.1: A group of pie charts showing the net results of over twenty hours of TA-student interactions throughout four different courses: Physics 2A Lab, Physics 50Lab, Physics 50 Workshop, and Physics 51 Lab.
interacting time would increase by 7.6%, with the remaining 0.3% divided between
Clarifying instruction, Explaining Content, and Listening to Question.
15
Chapter 4
Comparison of Physics 50 and Physics 50W
4.1 Physics 50
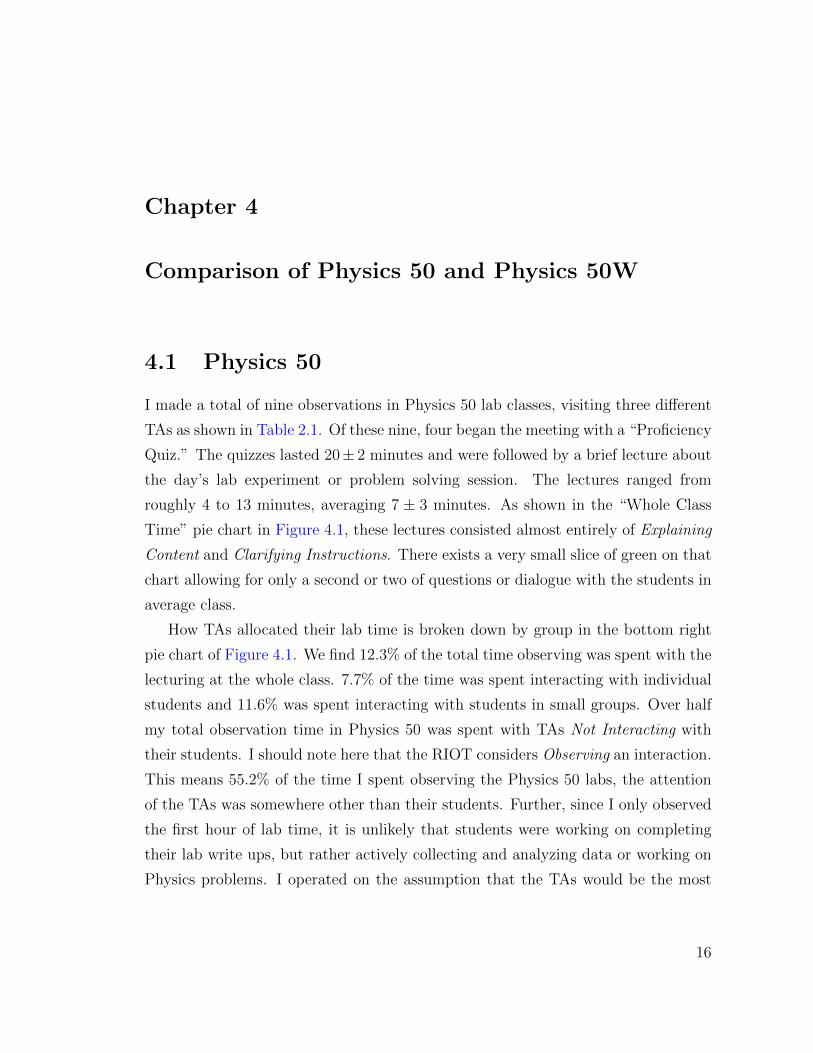
I made a total of nine observations in Physics 50 lab classes, visiting three different
TAs as shown in Table 2.1. Of these nine, four began the meeting with a “Proficiency
Quiz.” The quizzes lasted 20± 2 minutes and were followed by a brief lecture about
the day’s lab experiment or problem solving session. The lectures ranged from
roughly 4 to 13 minutes, averaging 7 ± 3 minutes. As shown in the “Whole Class
Time” pie chart in Figure 4.1, these lectures consisted almost entirely of Explaining
Content and Clarifying Instructions. There exists a very small slice of green on that
chart allowing for only a second or two of questions or dialogue with the students in
average class.
How TAs allocated their lab time is broken down by group in the bottom right
pie chart of Figure 4.1. We find 12.3% of the total time observing was spent with the
lecturing at the whole class. 7.7% of the time was spent interacting with individual
students and 11.6% was spent interacting with students in small groups. Over half
my total observation time in Physics 50 was spent with TAs Not Interacting with
their students. I should note here that the RIOT considers Observing an interaction.
This means 55.2% of the time I spent observing the Physics 50 labs, the attention
of the TAs was somewhere other than their students. Further, since I only observed
the first hour of lab time, it is unlikely that students were working on completing
their lab write ups, but rather actively collecting and analyzing data or working on
Physics problems. I operated on the assumption that the TAs would be the most
16
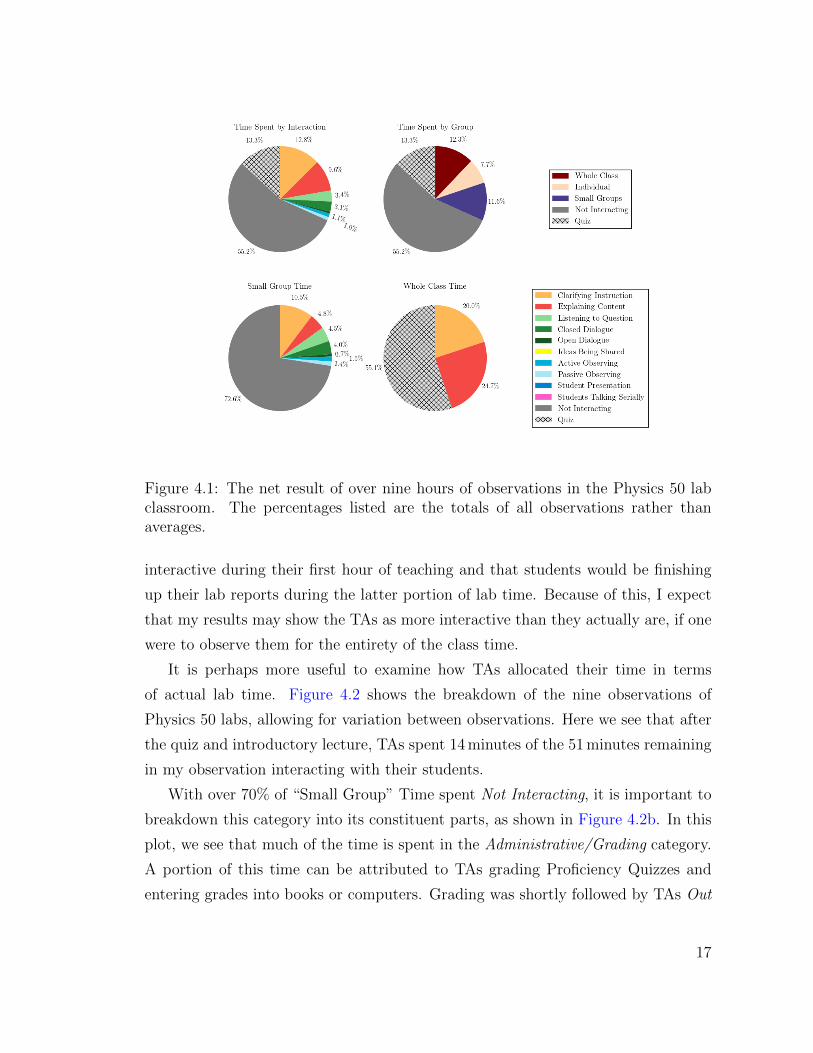
Figure 4.1: The net result of over nine hours of observations in the Physics 50 labclassroom. The percentages listed are the totals of all observations rather thanaverages.
interactive during their first hour of teaching and that students would be finishing
up their lab reports during the latter portion of lab time. Because of this, I expect
that my results may show the TAs as more interactive than they actually are, if one
were to observe them for the entirety of the class time.
It is perhaps more useful to examine how TAs allocated their time in terms
of actual lab time. Figure 4.2 shows the breakdown of the nine observations of
Physics 50 labs, allowing for variation between observations. Here we see that after
the quiz and introductory lecture, TAs spent 14 minutes of the 51 minutes remaining
in my observation interacting with their students.
With over 70% of “Small Group” Time spent Not Interacting, it is important to
breakdown this category into its constituent parts, as shown in Figure 4.2b. In this
plot, we see that much of the time is spent in the Administrative/Grading category.
A portion of this time can be attributed to TAs grading Proficiency Quizzes and
entering grades into books or computers. Grading was shortly followed by TAs Out
17
(a) Time spent by Group Type (b) Not Interacting (c) “Small Group Time”
Figure 4.2: The breakdowns of time spent between “Whole Class Discussion” and“Small Group Time” (left), Not Interacting (center), and “Small Group Time”(right) in the nine observations of Physics 50 labs. The heavy bar across the middleof each box shows the median value for that category while the × marks the meanvalue and outliers are marked with + signs. Mean values and standard deviationsfor each category are also printed. All numeric values are printed in minutes.
of Room to scan the graded quizzes on the computer in the adjoining prep room.
The total amount of time spent Out of Room is as expected and unremarkable.
Class Prep time is reasonably low. This too can be partly attributed to the
Proficiency Quizzes. TAs tended to use Quiz time to prepare their lecture notes
on the whiteboard. The Working on Apparatus/Material category appears to be
reasonable at first glance. It should be pointed out that two or three of the nine
observations took place during “Problem Solving Sessions.” Since TAs are provided
complete solutions to the problems and there is no equipment to malfunction during
these meetings, it is possible that these sessions weigh the category lower than it
would be for a pure laboratory observations.
It should be noted that the Proficiency Quizzes are designed to be quick and
easy to grade, consisting of a single problem with upwards of four parts. TAs are
provided with complete solutions. Judging by my observation notes, quiz grading
can account for roughly five minutes the Administrative/Grading category.
After dissecting Not Interacting time, it is also instructive to examine the break-
down of “Small Group Time” in terms of actual lab time, as shown in Figure 4.2c.
Here we see that, on average, TAs spent 7.9 minutes talking at students (Clarifying
Instructions and Explaining Content). On the other hand, they spent only 4.8 min-
utes talking with students (Listening to Questions and Closed or Open Dialogue)
18
and only 1.5 minutes Observing students working. The standard deviations in all
the times spent interacting with students are comparable to the mean values.
4.2 Physics 50W
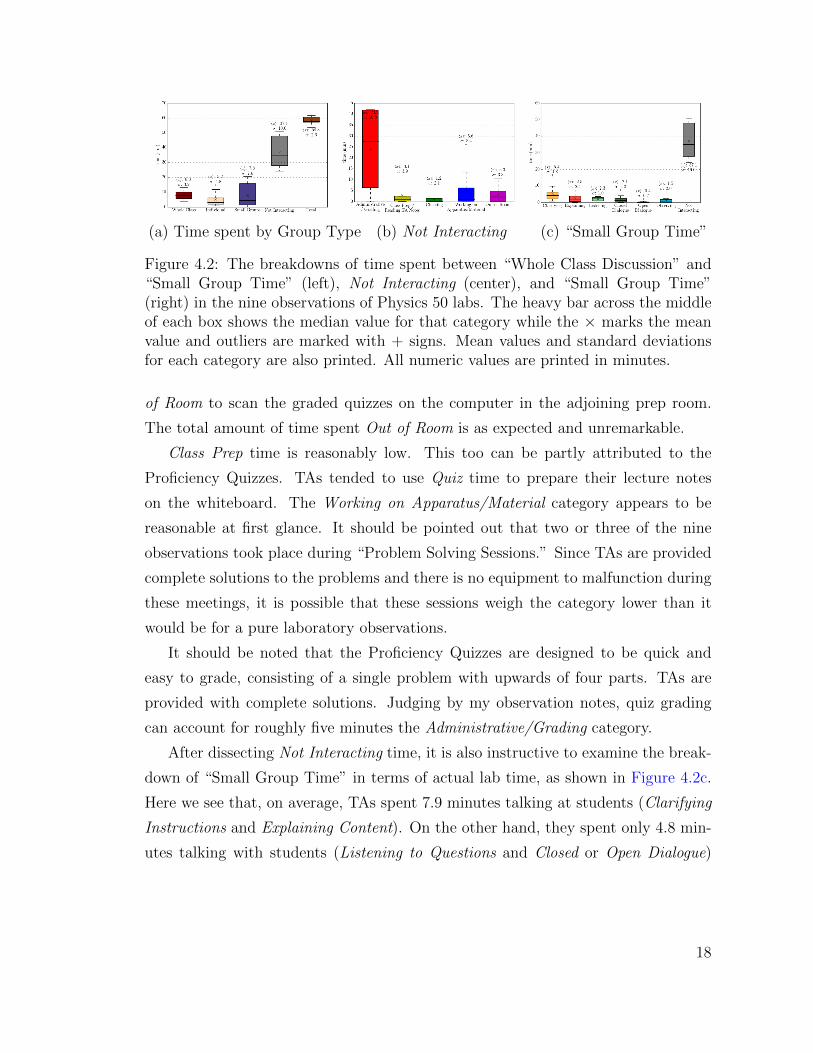
Figure 4.3: The net result of roughly seven hours of observations in the Physics 50Workshops. The percentages listed are the totals of all observations rather thanaverages.
I made a total of seven observations in Physics 50 Workshop classes, visiting three
different TAs as shown in Table 2.1. Students in these classes saw a wider range of
interactions than those in the lab class. In fact, the pie charts in Figure 4.3 contain
all of the RIOT interactions to some extent except Ideas Being Shared. Starting
with the “Time Spent by Group” pie chart, it seems that when viewed as a whole
TAs split their time nearly evenly between working with the whole class, individual
students, small groups, and not interacting. The Not Interacting portion is 29.8%
of the total time, followed by Small Groups, Whole Class, and Individual at 26.0%,
23.3%, and 20.9%, respectively.
19

(a) Time spent by Group Type (b) Time spent by Interaction (c) Not Interacting
Figure 4.4: The breakdowns of time spent between “Whole Class Discussion” and“Small Group Time” (left), by interaction time in both “Whole Class” and “SmallGroup” (center), and Not Interacting (right) in the seven observations of Physics 50Workshops. The heavy bar across the middle of each box shows the median valuefor that category while the × marks the mean value and outliers are marked with+ signs. Mean values and standard deviations for each category are also printed.All numeric values are printed in minutes.
Not only was there a wider range of interactions for the workshops, but how
TAs divided up their time in class was also more widely varied, as shown by the
larger spreads in Figure 4.4a. Where one TA spent the majority of his class time
interacting with the “Whole Class,” another TA spent none, going so far as not even
greeting the class at the beginning of the session. Of the two TAs who did interact
with the “Whole Class,” they both started each day with a short talk discussing the
topic of the day. The format of the talk varied by day and by TA (Clarify, Explain,
and Dialogue were all used) and ranged from two to eight minutes.
Figure 4.4b shows the spreads of each interaction in both “Whole Class” and
“Small Group” time. Since there is such a large variation in how TAs split their
time between “Whole Class” and “Small Group,” it makes more sense in this case to
ignore this distinction and look at how they interacted with their students regardless
of setting.
At first glance, there appeared to be far more Clarifying Instruction than I was
expecting. Reading through the time series graphs and my notes for each observa-
tion, it became evident that the majority of this time was due to a single observation
early in the semester. During that time, the TA was discussing the goals of the course
and how it would be run, as per the syllabus. The rest came as incidentals, but more
so from one TA than the other two.
20
The timing of the first “Small Group” interactions varied slightly by TA. One TA
began interacting with her groups immediately following the session’s introductory
lecture, roughly ten to fifteen minutes in. She employed some Active Observing and
roughly equal parts Closed Dialogue and Explaining Content. The other two TAs
typically began interacting with their students twenty-five to thirty minutes into
their sessions and even then generally only interacted with students individually.
They employed short spots of Observation and tended Explain Content only slightly
more often than Dialoguing with their students. A single TA spent much of each
session Explaining Content to the “Whole Class.” He tended to spend more of his
time discussing how to solve the problems on the worksheet than he did allowing his
students time to work on them.
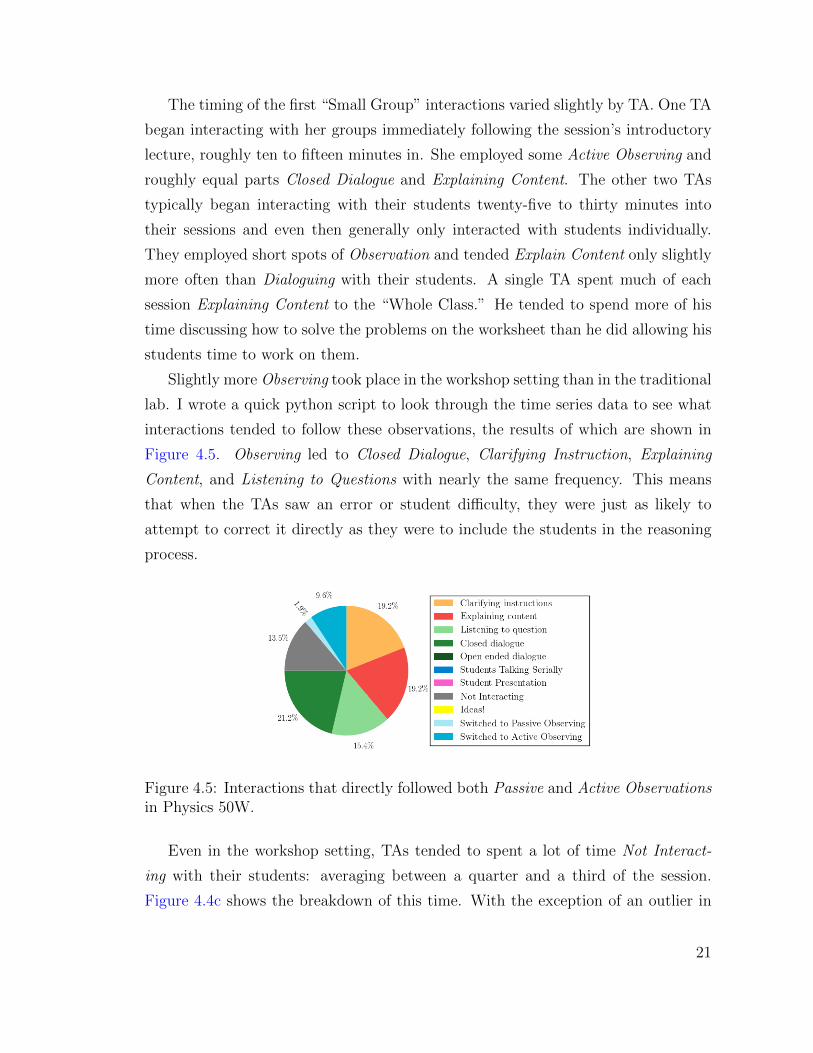
Slightly more Observing took place in the workshop setting than in the traditional
lab. I wrote a quick python script to look through the time series data to see what
interactions tended to follow these observations, the results of which are shown in
Figure 4.5. Observing led to Closed Dialogue, Clarifying Instruction, Explaining
Content, and Listening to Questions with nearly the same frequency. This means
that when the TAs saw an error or student difficulty, they were just as likely to
attempt to correct it directly as they were to include the students in the reasoning
process.
Figure 4.5: Interactions that directly followed both Passive and Active Observationsin Physics 50W.
Even in the workshop setting, TAs tended to spent a lot of time Not Interact-
ing with their students: averaging between a quarter and a third of the session.
Figure 4.4c shows the breakdown of this time. With the exception of an outlier in
21

Administrative/Grading that likely would have been better categorized as “off task,”
TAs spent the majority of their time doing Class Prep/Reading TA Notes. Reading
through my observation notes, this appears to be time the TA spent reading through
the provided solution set. The remaining Working on Apparatus/Material is when
the TA was likely working out steps in the solution set for themselves.
4.3 A look at “problem solving” days
Only two of my Physics 50 observations were of “problem solving sessions” as op-
posed to the standard lab sessions. Consequently, I cannot make any generalizations
comparing these sessions to the regular sessions or even to a typical Physics 50W
session – especially considering that both of these observations were of the same TA.
Even without generalizability, the comparison is an interesting one to look at. Fig-
ure 4.6 shows the majority of the interactions logged by the RIOT divided into three
groups: Standard Physics 50 lab sessions, Physics 50 problem solving sessions, and
Physics 50W sessions. The interactions Students Presenting and Students Talking
Serially were excluded because the values for all three session types were essentially
zero.
Figure 4.6: Interactions on regular lab days and problem solving days in Physics 50compared with Physics 50W
Over nearly all interactions, it would appear that the problem solving sessions
are being run similar to lab sessions. With the exception of Explaining Content, all
the problem solving session interactions fall within or very near the middle 50% of
the spreads for the lab sessions. Explaining Content on the problem solving sessions
22
is above the upper limit of the regular lab sessions and in the lower portion of the
Physics 50W sessions.
Interestingly, there was no Observing taking place during the problem solving
sessions. Looking over the time series data for these two observations, it appears
the TA gave a short lecture on the basic physics involved and a few problem solving
strategies lasting seven to fourteen minutes and then proceeded to only interact with
individual students when they approached with questions.
Having only observed one TA for two problem solving sessions, I seriously doubt
these observations would hold for the group of TAs as a whole. It follows then that
more data needs to be collected here before we can attempt any generalization.
23
Chapter 5
Comparison to UC Davis
The body of research utilizing the RIOT is still in its infancy. As of yet, there
exist few holistic studies examining graduate student TAs interacting with their
students [24, 25]. Consequently, we have very few opportunities to compare data at
our own institution to similar data at similar institutions.
A study at UC Davis examined their model-based CLASP course [7, 25]. The
course is their “nominally calculus-based” introductory physics course. The interac-
tive portion of the course, called “Discussion/Lab” (DL), has students work together
in small groups to answer a series of activity prompts followed by a whole class dis-
cussion of the major points of the activity and explore general implications of the
phenomena. Instructors, largely graduate students and a few faculty, are coached to
guide students toward correct usage of the models rather than provide immediate
answers. Effectively, the CLASP course is designed to be a more interactive hybrid
of both the Physics 50 lab and workshop courses at SJSU. As such, we might expect
some similarities in the spreads of interaction types.
The observations from West, et al. lasted around 140 minutes whereas my own
were less than half of that. The following comparisons are normalized by total time
in a specific mode. For example, Figure 5.1 shows the range of “Small Group” in-
teractions normalized by the total amount of time spent in “Small Group” mode
for each individual observation. Figure 5.2 shows the range of “Whole Class” inter-
actions normalized by the total amount of time each observation spent in “Whole
Class” mode.
Looking at “Small Group” time, it is clear that for both of the SJSU courses, the
percentage of time spent Not Interacting is much higher than the Davis course. The
24
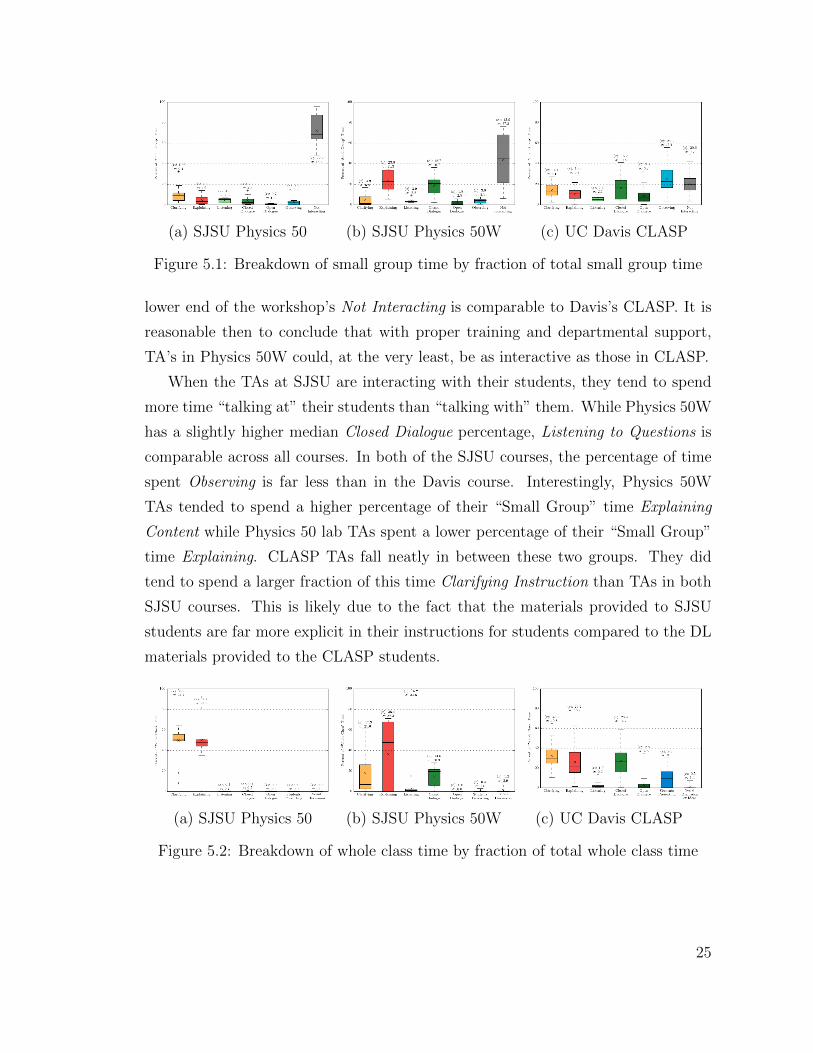
(a) SJSU Physics 50 (b) SJSU Physics 50W (c) UC Davis CLASP
Figure 5.1: Breakdown of small group time by fraction of total small group time
lower end of the workshop’s Not Interacting is comparable to Davis’s CLASP. It is
reasonable then to conclude that with proper training and departmental support,
TA’s in Physics 50W could, at the very least, be as interactive as those in CLASP.
When the TAs at SJSU are interacting with their students, they tend to spend
more time “talking at” their students than “talking with” them. While Physics 50W
has a slightly higher median Closed Dialogue percentage, Listening to Questions is
comparable across all courses. In both of the SJSU courses, the percentage of time
spent Observing is far less than in the Davis course. Interestingly, Physics 50W
TAs tended to spend a higher percentage of their “Small Group” time Explaining
Content while Physics 50 lab TAs spent a lower percentage of their “Small Group”
time Explaining. CLASP TAs fall neatly in between these two groups. They did
tend to spend a larger fraction of this time Clarifying Instruction than TAs in both
SJSU courses. This is likely due to the fact that the materials provided to SJSU
students are far more explicit in their instructions for students compared to the DL
materials provided to the CLASP students.
(a) SJSU Physics 50 (b) SJSU Physics 50W (c) UC Davis CLASP
Figure 5.2: Breakdown of whole class time by fraction of total whole class time
25
The use of “Whole Class” time varied significantly by course. With the exception
of a small number of my Physics 50W observations, all courses began with a short
talk from the TA to the “Whole Class.” For the Physics 50 labs, the interaction mode
ended there as students broke up into their lab groups to conduct the experiment of
the day. The same thing occurred for some of the TAs in the Physics 50W course.
In the CLASP course, students frequently return to “Whole Class” mode to present
and discuss worked problems and lab results. Looking at Figure 5.2, we again see
only slight similarities between Physics 50W and CLASP. Clarifying Instruction and
Explaining Content show similar ranges in both courses, likely due to variation in
teaching style by TA. Closed Dialogue in Physics 50W is, at best, half that of CLASP
while Listening to Questions is comparable for both courses.
The similarities end there. Students in both SJSU courses were never provided
the opportunity to Share their Ideas, leading the conversation to collectively chal-
lenge their own ideas regarding physics concepts. They also never Presented their
lab findings and rarely Presented to each other or Talked Serially to build each oth-
ers’ ideas. These interactions all show up in the CLASP observations, as Ideas and
Present. While Sharing Ideas was mostly left to outliers, the opportunity for Stu-
dent Presentations plays a fairly important role in the CLASP material and student
sense-making in general.
Based on my observations, the Physics 50W course more closely aligns with UC
Davis’s CLASP course than the Physics 50 lab. Even so, the alignment shows more
differences than similarities. While students in both courses at SJSU are engaged
in their prescribed activities, they are rarely encouraged communicate their ideas
through discussion with their peers or instructors, as evidenced by the small amount
of time spent in Dialogue, even smaller amount of time spent Presenting, and the
entire lack of Sharing Ideas. It seems fair to conclude that neither of the SJSU
courses as they currently stand could fairly be classified as interactive courses.
TAs will require significantly more training and departmental support before
either course will become more interactive. The data presented here illuminate
many areas for potential growth. Future interventions and subsequent observations
could easily be designed to target any specific deficiency already discussed.
26
Chapter 6
Alignment with PER-based best practices
The refrain common to much of PER is that IE classes are “better.” Students
tend to achieve significantly higher gains on common conceptual tests like the Force
Concept Inventory (FCI) [3], the Force and Motion Conceptual Evaluation (FMCE),
and the Mechanics Baseline Test (MBT) [34]. A paper by Hake is frequently cited
to show this is [1]. Looking closely at the data he provides reveals that there is a
larger variation in the normalized FCI gains achieved in IE classes, ranging as low
as the gains achieved in unreformed courses to much higher. Hake hypothesized
that these variations may be due to variations in effectiveness of pedagogy and/or
implementation. Subsequent research has examined implementations of a specific
curriculum and found a similar range of gains [35].
6.1 Lessons from Peer Instruction
In seeking to learn more about what variations in teaching practices exist and what
effect they may have on student learning, a team at the University of Colorado
at Boulder observed six of their faculty teaching six different introductory physics
courses [27] using Peer Instruction (PI) [36]. Through their observations, they iden-
tified 13 different dimensions of practice (DoP) and measured significant variation
in faculty application of these DoPs.
The DoPs are divided into two main groups, one for how the professor defines an
academic task and another for student-professor interactions during the task. They
noted little variation in how the six professors applied the first set of DoPs, citing
similar choices in clicker question types (mostly conceptual questions) and approach
27
to having students answer the clicker questions (allowing some quiet time for students
to reflect on the question before discussing with their peers). They did however find
significant variation in how the professors interacted with their students during the
administration of the clicker questions. Only half of the professors “left the stage”
while students worked on and discussed the questions. There was a large amount
of variation in the professors answering student-initiated questions and engaging
in discussion with the students. There was also a large variation in the amount
of time allotted for students to answer clicker questions and how the answers to
the clicker questions were discussed. Some instructors frequently asked for student
explanations while other did so rarely. Similarly, some instructors discussed wrong
answers occasionally while others did so rarely.
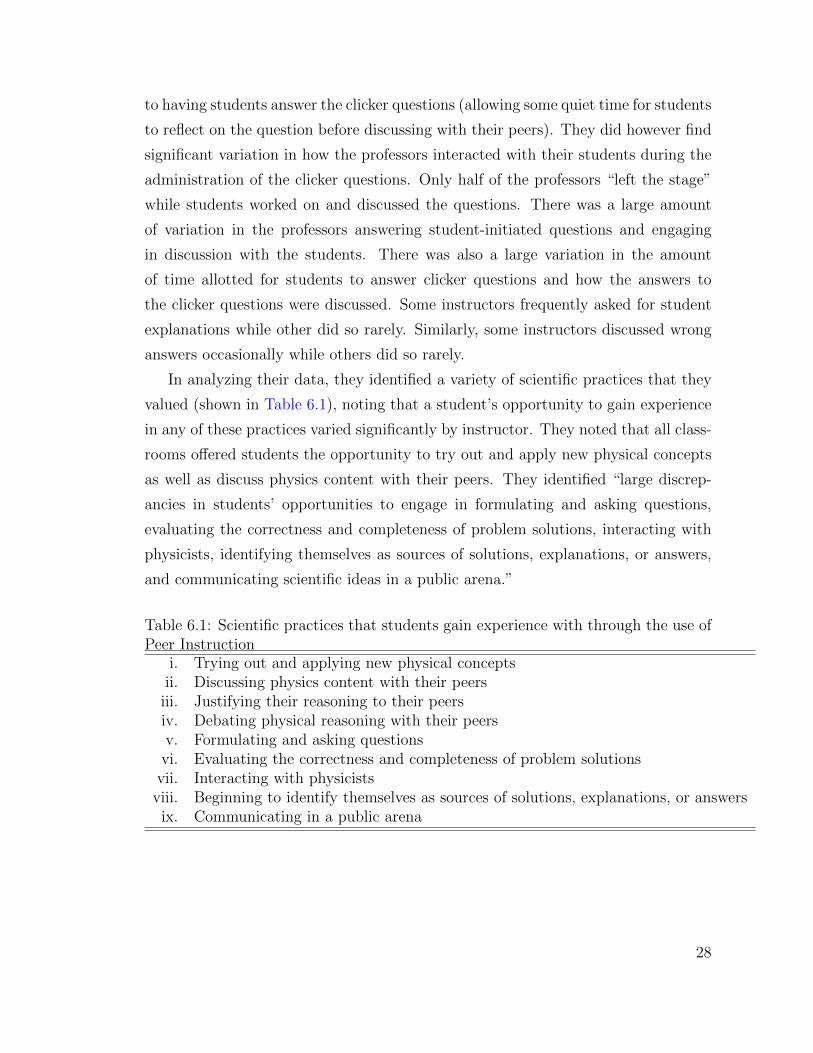
In analyzing their data, they identified a variety of scientific practices that they
valued (shown in Table 6.1), noting that a student’s opportunity to gain experience
in any of these practices varied significantly by instructor. They noted that all class-
rooms offered students the opportunity to try out and apply new physical concepts
as well as discuss physics content with their peers. They identified “large discrep-
ancies in students’ opportunities to engage in formulating and asking questions,
evaluating the correctness and completeness of problem solutions, interacting with
physicists, identifying themselves as sources of solutions, explanations, or answers,
and communicating scientific ideas in a public arena.”
Table 6.1: Scientific practices that students gain experience with through the use ofPeer Instruction
i. Trying out and applying new physical conceptsii. Discussing physics content with their peers
iii. Justifying their reasoning to their peersiv. Debating physical reasoning with their peersv. Formulating and asking questionsvi. Evaluating the correctness and completeness of problem solutions
vii. Interacting with physicistsviii. Beginning to identify themselves as sources of solutions, explanations, or answersix. Communicating in a public arena
28

6.2 Looking at our practices
While some of the scientific practices outlined in Table 6.1 are not directly mea-
surable by the RIOT, TA-student interactions can shed light on others. TAs are
spending little time with student questions and discussions, opting to talk at their
students more often than with them. This leads to few opportunities for students
to “formulate and ask questions.” Even in Physics 50W, students rarely presented
their solutions to each other, leading to few opportunities for “evaluating the cor-
rectness and completeness of problem solutions,” “beginning to identify themselves
as sources of solutions, explanations, or answers,” and “communicating in a public
arena.” Additionally, my observations have shown that students are not offered as
much time to “interact with a physicist” as we might have assumed.
If nothing else, my observations may serve to inform our department and those
at a similar stage of development. It is easy to assume that laboratory courses and
workshops/tutorials are intrinsically interactive. Without proper training as well as
departmental and curricular support, TAs run the risk of defaulting to “teaching
how they were taught.” As my data show, their teaching may lack the degree of
interactivity desired.
6.3 Lessons from Modeling Discourse Management
In seeking a more student-centered classroom discourse, a two-year college teacher
and PhD candidate at ASU developed Modeling Discourse Management for his PhD
dissertation [37]. Much of his work is not directly applicable to our labs and work-
shops in their current state, but there is something to gain from examining the
components of his discourse management style. Table 6.2 shows the components of
Modeling Discourse Management.
Extensive reorganization of the courses and TA training would be required to
address many of the components and, even still, the majority of these components are
not directly measurable by the RIOT. Instead, we focus on those aspects that could
be readily adopted into our own practices: seeding and inter-student discussion.
In a modeling classroom, new ideas are “seeded” by the instructor during small
group time, often in the form of a question or a hint. Early in small group time,
29
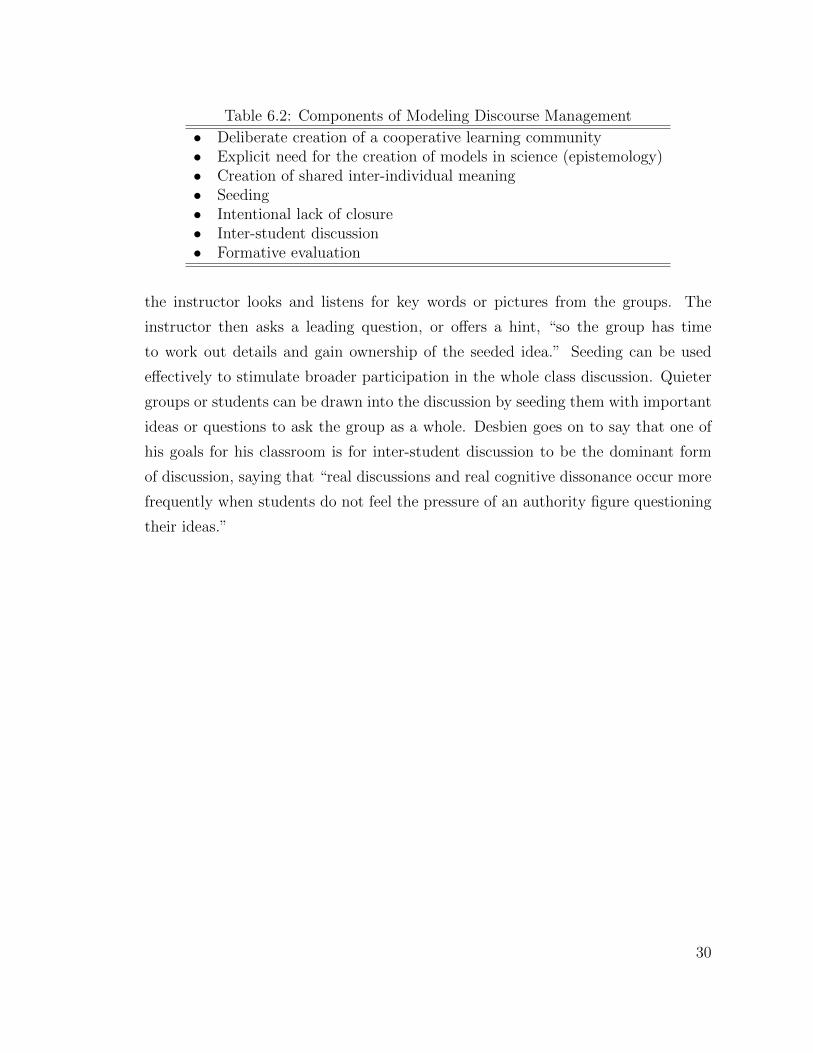
Table 6.2: Components of Modeling Discourse Management
• Deliberate creation of a cooperative learning community• Explicit need for the creation of models in science (epistemology)• Creation of shared inter-individual meaning• Seeding• Intentional lack of closure• Inter-student discussion• Formative evaluation
the instructor looks and listens for key words or pictures from the groups. The
instructor then asks a leading question, or offers a hint, “so the group has time
to work out details and gain ownership of the seeded idea.” Seeding can be used
effectively to stimulate broader participation in the whole class discussion. Quieter
groups or students can be drawn into the discussion by seeding them with important
ideas or questions to ask the group as a whole. Desbien goes on to say that one of
his goals for his classroom is for inter-student discussion to be the dominant form
of discussion, saying that “real discussions and real cognitive dissonance occur more
frequently when students do not feel the pressure of an authority figure questioning
their ideas.”
30

Chapter 7
Conclusions
7.1 A Summary of Results
What follows is a short summary of my findings, organized by the appropriate re-
search question. References to the original figures are included as well as a brief
discussion of their implications and important points for future TA professional de-
velopment.
7.1.1 What TA-student interactions do our TAs employ in
their teaching assignments?
Looking at Figure 3.1, we can see that the TAs spent just over 30% of the time
“talking at” their students. About 17% of the total time was spent “talking with”
or observing their students. TAs spent 45% of the total time Not Interacting with
their students. They spent comparable amounts of time interacting with the Whole
Class as they did with Small Groups and only slightly less time interacting with
students Individually.
7.1.2 How do these interactions differ in Physics 50 and
Physics 50W?
Figure 4.2 shows relatively small spreads in the interactions used by TAs teaching
Physics 50. There is a larger amount of spread in how they spent Small Group time
and Not Interacting time. This is more likely due to variation by TA than any other
31
factor. On the whole, TAs tended to spend nearly the same amount of time in any
given interaction type, possibly due to similar thoughts and beliefs about how a lab
course should be run.
Figure 4.4 shows much greater variation, not only in how TAs divide their time
by group type, but also by interaction type. There appears to be less of a consensus
about how to run a workshop course. This leads to a varying student experiences
in Physics 50W that depends on which TA leads their workshop. In the interest
of a homogenized workshop experience, more training and departmental support is
needed. Here, TAs could become more interactive with useful, clear-cut examples
and guidance from more-experienced instructors. Observations of others teaching
the same course would be beneficial to their professional development, as would time
to reflect on their own teaching practices.
7.1.2.a How do Physics 50 “problem solving days” compare to regular
lab days and Physics 50W observations?
The results for the problem solving days appear to more closely align with Physics 50W
than they do with lab days in Physics 50. The data set consists of only two obser-
vations of a single TA unfortunately. More data is needed before we can make any
real conclusions.
7.1.3 How do our TAs’ implementations of Physics 50 and
Physics 50W compare with available RIOT data from
courses at UC Davis?
As seen in Figures 5.1 and 5.2, TAs at SJSU have a stronger tendency to “talk
at” their students than their UC Davis counterparts. They also spend more time
Not Interacting. Our TAs will require significantly more training and curricu-
lar/departmental support to become more interactive. We should present them
with professional development opportunities that emphasize the need for both Ob-
servation and Dialogue between TAs and their students.
32
7.1.4 How do our TAs’ implementations of Physics 50 and
Physics 50W compare with PER-based best practices?
Part of Hake’s definition of Interactive Engagement called for “immediate feedback
through discussion with . . . instructors” [1]. Looking at the results of my observa-
tions, it appears that our TAs may not be providing this immediate feedback due
to the little amount of time spent Observing and the large amount of time spent
Not Interacting. Koenig, et al. showed that students learn better working in small
groups followed by Dialogue with a TA [12]. Again, in preparing professional devel-
opment for our TAs, we would do well to focus on the need for both Observation
and Dialogue between TAs and their students.
7.2 Future Work
I expected to see a fair amount of Not Interacting time, but I was still somewhat
surprised at the amount I saw. To combat this, Dr. Paul and I planned a three
hour “boot camp” for all TAs planning to teach in the semester of Fall 2015. For
activities, the group compared and contrasted science and science teaching practices,
read and discussed a paper from PER literature [12], had a brief overview of some
PER data (including some of the data from this study), and watched and discussed
a pair of videos designed for physics pedagogy courses [38]. While that amount of
time is by no means exhaustive, we tried to continually return the discussion to the
importance of asking students questions to find out what they know as a means of
interaction.
My main goal of the training session was to decrease the amount of time TAs
spent not interacting with their students while simultaneously increasing the amount
of time they spent both observing and engaging in dialogue. A simple follow up study
conducting RIOT-based observations this and next semester could be done to see if
this occurred.
It may also be beneficial to both TAs and the department to continue these ob-
servations. My biggest disappointment with this study is that I was never observed.
I imagine the data from a pair or even a single observation would be invaluable to the
33
professional development of both new and experienced teachers. Further, the obser-
vations can continue to be used to guide the development of future TA training and
pedagogy courses. These courses will be the most effective when they specifically
target the needs as seen in the data.
34
Reference List
[1] R. R. Hake. Interactive-engagement versus traditional methods: A six-
thousand-student survey of mechanics test data for introductory physics
courses. American Journal of Physics, 66(1):64–74, January 1998.
[2] C. H. Crouch and E. Mazur. Peer instruction: Ten years of experience and
results. In American Journal of Physics, pages 970–977, 2001.
[3] D. Hestenes, M. Wells, and G. Swackhamer. Force concept inventory. The
Physics Teacher, 30(3):141–158, March 1992.
[4] G. E. Francis. Do they stay fixed? The Physics Teacher, 36(8):488+, 1998.
[5] C. Hoellwarth, M. J. Moelter, and R. D. Knight. A direct comparison of con-
ceptual learning and problem solving ability in traditional and studio style
classrooms. American Journal of Physics, 73(5):459–462, April 2005.
[6] N. D. Finkelstein and S. J. Pollock. Replicating and understanding successful
innovations: Implementing tutorials in introductory physics. Phys. Rev. ST
Phys. Educ. Res., 1:010101+, September 2005.
[7] W. H. Potter, D. Webb, E. A. West, C. A. Paul, M. Bowen, B. Weiss, L. Cole-
man, and C. De Leone. Sixteen years of collaborative learning through active
sense-making in physics (CLASP) at UC Davis, May 2013.
[8] R. M. Goertzen, E. Brewe, L. H. Kramer, L. Wells, and D. Jones. Moving to-
ward change: Institutionalizing reform through implementation of the Learning
Assistant model and Open Source Tutorials. Physical Review Special Topics -
Physics Education Research, 7(2):020105+, September 2011.
35
[9] P. B. Kohl and H. V. Kuo. Chronicling a successful secondary implementation
of Studio Physics. American Journal of Physics, 80(9):832+, September 2012.
[10] D. Hestenes, C. Megowan-Romanowicz, S. E. Osborn Popp, J. Jackson, and
R. J. Culbertson. A graduate program for high school physics and physical
science teachers. American Journal of Physics, 79(9):971+, 2011.
[11] L. C. McDermott, P. S. Shaffer, and C. P. Constantinou. Preparing teachers to
teach physics and physical science by inquiry. Physics Education, 35(6):411+,
November 2000.
[12] K. M. Koenig, R. J. Endorf, and G. A. Braun. Effectiveness of different tutorial
recitation teaching methods and its implications for TA training. Phys. Rev.
ST Phys. Educ. Res., 3:010104+, May 2007.
[13] R. M. Goertzen, R. E. Scherr, and A. Elby. Indicators of Understanding: What
TAs Listen for in Student Responses. volume 1064, pages 119–122. AIP, 2008.
[14] R. M. Goertzen, R. E. Scherr, and A. Elby. Accounting for tutorial teach-
ing assistants’ buy-in to reform instruction. Phys. Rev. ST Phys. Educ. Res.,
5(2):020109+, December 2009.
[15] R. M. Goertzen, R. E. Scherr, and A. Elby. Tutorial teaching assistants in the
classroom: Similar teaching behaviors are supported by varied beliefs about
teaching and learning. Physical Review Special Topics - Physics Education
Research, 6(1):010105+, April 2010.
[16] J. B. Robinson. New Teaching Assistants Facilitate Active Learning in Chem-
istry Laboratories: Promoting Teaching Assistant Learning through Formative
Assessment and Peer Review. Journal of Graduate Teaching Assistant Devel-
opment, 7(3):147–62, 2000.
[17] J. A. Luft, J. P. Kurdziel, G. H. Roehrig, and J. Turner. Growing a garden
without water: Graduate teaching assistants in introductory science laborato-
ries at a doctoral/research university. J. Res. Sci. Teach., 41(3):211–233, March
2004.
36
[18] E. Price and N. D. Finkelstein. Preparing physics graduate students to be
educators. American Journal of Physics, 76:684–690, July 2008.
[19] B. T. Spike and N. D. Finkelstein. Preparing tutorial and recitation instructors:
A pedagogical approach to focusing attention on content and student reasoning.
American Journal of Physics, 80(11):1020+, 2012.
[20] B. T. Spike and N. D. Finkelstein. Toward an Analytic Framework of Physics
Teaching Assistants’ Pedagogical Knowledge. In N. Sanjay Rebello, Paula V.
Engelhardt, and Chandralekha Singh, editors, 2011 PER Conference Proceed-
ings - AIP Conference Proceedings 1413, Physics Education Research Con-
ferences, pages 363–366, Omaha, NE, 2012. American Association of Physics
Teachers, American Institute of Physics, Melville, NY.
[21] K. E. Gray and V. K. Otero. Analysis of Former Learning Assistants’ Views
on Cooperative Learning. In Mel Sabella, Chandralekha Singh, and Charles
Henderson, editors, 2009 PER Conference Proceedings - AIP Conference Pro-
ceedings 1179, Physics Education Research Conferences, pages 149–152, Ann
Arbor, MI, 2009. American Association of Physics Teachers, American Insti-
tute of Physics, Melville, NY.
[22] B. T. Spike and N. D. Finkelstein. Examining the Beliefs and Practice of
Teaching Assistants: Two Case Studies. In C. Singh, Rebello, and Mel
Sabella, editors, 2010 PER Conference Proceedings - AIP Conference Proceed-
ings 1289, Physics Education Research Conferences, pages 309–312, Portland,
OR, 2010. American Association of Physics Teachers, American Institute of
Physics, Melville, NY.
[23] R. M. Goertzen, R. E. Scherr, and A. Elby. Respecting tutorial instructors’
beliefs and experiences: A case study of a physics teaching assistant. Phys.
Rev. ST Phys. Educ. Res., 6(2):020125+, December 2010.
[24] M. Wilcox, C. C. Kasprzyk, and J. J. Chini. Observing teaching assistant
differences in tutorials and inquiry-based labs. In 2015 PERC Proceedings.
37
[25] E. A. West, C. A. Paul, D. Webb, and W. H. Potter. Variation of instructor-
student interactions in an introductory interactive physics course. Phys. Rev.
ST Phys. Educ. Res., 9:010109+, March 2013.
[26] C. Turpen and N. D. Finkelstein. Not all interactive engagement is the same:
Variations in physics professors’ implementation of Peer Instruction. Physi-
cal Review Special Topics - Physics Education Research, 5(2):020101+, August
2009.
[27] C. Turpen and N. D. Finkelstein. The construction of different classroom norms
during Peer Instruction: Students perceive differences. Physical Review Special
Topics - Physics Education Research, 6(2):020123+, November 2010.
[28] D. Sawada, M. D. Piburn, E. Judson, J. Turley, K. Falconer, R. Benford, and
I. Bloom. Measuring Reform Practices in Science and Mathematics Classrooms:
The Reformed Teaching Observation Protocol. School Science and Mathemat-
ics, 102(6):245–253, October 2002.
[29] M. K. Smith, F. H. M. Jones, S. L. Gilbert, and C. E. Wieman. The Classroom
Observation Protocol for Undergraduate STEM (COPUS): A New Instrument
to Characterize University STEM Classroom Practices. CBE-Life Sciences Ed-
ucation, 12(4):618–627, December 2013.
[30] M. T. Hora, A. Oleson, and J. J. Ferrare. Teaching Dimensions Observation
Protocol (TDOP) User’s Manual. Madison: Wisconsin Center for Education
Research, 2013.
[31] J. Cohen. A Coefficient of Agreement for Nominal Scales. Educational and
Psychological Measurement, 20(1):37–46, April 1960.
[32] Gary G. Koch J. Richard Landis. The measurement of observer agreement for
categorical data. Biometrics, 33(1):159–174, 1977.
[33] Joseph Fleiss. Statistical methods for rates and proportions. Wiley, New York,
2nd edition, 1981.
38
[34] D. Hestenes and M. Wells. A mechanics baseline test. The Physics Teacher,
30(3):159–166, 1992.
[35] S. J. Pollock and N. D. Finkelstein. Sustaining educational reforms in intro-
ductory physics. Phys. Rev. ST Phys. Educ. Res., 4:010110, Jun 2008.
[36] E. Mazur. Peer Instruction: A User’s Manual. Prentice Hall, 1997.
[37] D. M. Desbien. Modeling Discourse Management. PhD thesis, Arizona State
University, 2002.
[38] R. E. Scherr and R. M. Goertzen. Periscope: Looking into learning in best-
practices physics classrooms. In APS April Meeting, volume 1. American Phys-
ical Society, April 2015.
39