team effectiveness and project management in a student
TRANSCRIPT

Minnesota State University, Mankato Minnesota State University, Mankato
Cornerstone: A Collection of Scholarly Cornerstone: A Collection of Scholarly
and Creative Works for Minnesota and Creative Works for Minnesota
State University, Mankato State University, Mankato
All Graduate Theses, Dissertations, and Other Capstone Projects
Graduate Theses, Dissertations, and Other Capstone Projects
2013
Team Effectiveness and Project Management in a Student Team Team Effectiveness and Project Management in a Student Team
Environment Environment
Rahul Girish Patel Minnesota State University - Mankato
Follow this and additional works at: https://cornerstone.lib.mnsu.edu/etds
Part of the Automotive Engineering Commons
Recommended Citation Recommended Citation Patel, R. G. (2013). Team Effectiveness and Project Management in a Student Team Environment [Master’s thesis, Minnesota State University, Mankato]. Cornerstone: A Collection of Scholarly and Creative Works for Minnesota State University, Mankato. https://cornerstone.lib.mnsu.edu/etds/177/
This Thesis is brought to you for free and open access by the Graduate Theses, Dissertations, and Other Capstone Projects at Cornerstone: A Collection of Scholarly and Creative Works for Minnesota State University, Mankato. It has been accepted for inclusion in All Graduate Theses, Dissertations, and Other Capstone Projects by an authorized administrator of Cornerstone: A Collection of Scholarly and Creative Works for Minnesota State University, Mankato.

Team Effectiveness and Project Management in a Student Team Environment
By
Rahul Patel
A Thesis Submitted in Partial Fulfillment of the
Requirements for the Degree of
Master of Science
In
Manufacturing Engineering Technology
Minnesota State University, Mankato
Mankato, Minnesota
November 2012

Team Effectiveness and Project Management in a Student Team Environment
Rahul Patel
This thesis has been examined and approved by the following members of the thesis
committee.
____________________________________
Dr. Craig Evers, Advisor
____________________________________
Dr. Harry Petersen
____________________________________
Dr. Kuldeep Agarwal

Table of Contents
Abstract ................................................................................................................................ i
Acknowledgement .............................................................................................................. ii
List of Figures .................................................................................................................... iii
List of Tables ...................................................................................................................... v
Introduction ....................................................................................................................... 1
Problem Statement .......................................................................................................... 1
Significance .................................................................................................................... 1
Deliverables .................................................................................................................... 3
Limitations ...................................................................................................................... 4
Methodology ...................................................................................................................... 6
Data Collection Tool ....................................................................................................... 6
Survey Instrument Design .............................................................................................. 7
Survey Sampling Frame and Survey Timeline ............................................................... 9
Final Survey Instruments .............................................................................................. 11
Survey Approval and Implementation .......................................................................... 12
Analysis of Results .......................................................................................................... 14
Demographic Information ............................................................................................. 14
Normal Probability Plots .............................................................................................. 15
One Proportion Hypothesis Test for Statistical Significance ....................................... 16
Pearson’s Correlation Coefficient “r” ........................................................................... 19
Somers’ Dyx Test of Association between Ordinal Variables ....................................... 23
Descriptive Statistics ..................................................................................................... 26
Major Findings .............................................................................................................. 31
Discussion......................................................................................................................... 39
Restatement of the Problem .......................................................................................... 39
Methods and Procedures ............................................................................................... 39
Summary of Major Findings ......................................................................................... 41

Limitations to the Findings of this Research Study ...................................................... 41
Recommendations for the AMET Department Faculty ................................................ 42
Recommendations for Further Research ....................................................................... 44
References ........................................................................................................................ 46
Appendix A ...................................................................................................................... 49
Appendix B ...................................................................................................................... 52
Appendix C ...................................................................................................................... 54
Appendix D ...................................................................................................................... 56
Appendix E ...................................................................................................................... 59
Appendix F ...................................................................................................................... 60
Appendix G ...................................................................................................................... 61
Appendix H ...................................................................................................................... 62
Appendix I ..................................................................................................................... 102
Appendix J ..................................................................................................................... 126
Appendix K .................................................................................................................... 128
Appendix L .................................................................................................................... 129
Appendix M ................................................................................................................... 143
Appendix N .................................................................................................................... 146
Appendix O .................................................................................................................... 149

Team Effectiveness and Project Management in a Student Team Environment i
Abstract
The objective of this research study was to assess if students enrolled in MSU –
Mankato’s Automotive Engineering Technology (AET) program required a project
management course. At present, a project management course is not included in the AET
program. A survey instrument based on “The Team Effectiveness Critique” by Susan
Trimble was developed to answer the research question. AET students enrolled in Senior
Design courses were the main focus of this study. Survey results indicated that AET
Senior Design students who had taken a project management course prior to a Senior
Design course had good ratings in survey categories of Trust and Conflict, Goals and
Objectives, and Communication. Findings of this research study indicated that a project
management course might help enhance the overall experience of an AET Senior Design
project.

Team Effectiveness and Project Management in a Student Team Environment ii
Acknowledgement
I would like to thank my academic adviser and committee chair, Dr. Craig Evers
for providing useful guidance throughout this research study. His expertise in research
methods and statistical analysis has been very valuable to me. Special thanks to Dr.
William Peterson for giving me initial guidance to come up with a meaningful research
topic and Dr. Mezbahur Rahman for helping me with hypothesis testing. I am thankful to
Dr. Kuldeep Agarwal and Dr. William Petersen for serving on my committee. The
AMET faculty’s willingness to assist in conducting the student surveys for this research
study is greatly appreciated.
I would like to thank Dr. Susan Trimble for allowing me to use her survey
instrument, “The Team Effectiveness Critique”. I am grateful to Kimberly Berns and
other staff members of the creative writing center for reading my paper. My gratitude is
also extended to my peers Harshdeep Bhasin, Rahul Sharma, and Madhur Jain for
providing encouragement and advice when needed. Finally, I would like to thank my
parents Girish and Meena Patel, and sisters Rupa and Khyati for having faith in me and
encouraging me to achieve my academic goals.

Team Effectiveness and Project Management in a Student Team Environment iii
List of Figures
Figure 1. Pairs of critically significant variables that were tested for correlation – AET
Senior Design Students ..................................................................................................... 20
Figure 2. Pairs of critically significant variables that were tested for correlation – MET
Senior Design Students ..................................................................................................... 20
Figure 3. Range of values “r” and the strength of correlation that it indicates ................ 21
Figure 4. Pearson’s Correlation Test Results for AET Senior Design Students .............. 22
Figure 5. Results for Somers’ Dyx Analysis – AET Senior Design Students ................... 24
Figure 6. Results for Somers’ Dyx Analysis – MET Senior Design Students .................. 25
Figure 7. Question 10 - Introduced During Trial 3 - Spring ’12 End ............................... 29
Figure 8. Total Number of Votes Received for Survey Question 10 – AET Senior Design
Students – Spring ’12 End ................................................................................................ 29
Figure 9. Rating Pattern for Survey Question 10 – AET Senior Design Students – Spring
’12 End - Top Three Categories........................................................................................ 30
Figure 10. Student Rating Pattern for Q3 – Trust and Conflict – AET Senior Design
Students ............................................................................................................................. 31
Figure 11. Student Rating Pattern for Q8 – Creativity – AET Senior Design Students ... 33
Figure 12. Student Rating Pattern for Q1 – Goals and Objectives – AET Senior Design
Students ............................................................................................................................. 34
Figure 13. Student Rating Pattern for Q6 – Communication – AET Senior Design
Students ............................................................................................................................. 34
Figure 14. Student Rating Pattern for Q2 – Utilization of Talent – AET Senior Design
Students ............................................................................................................................. 35
Figure 15. Q2 – Utilization of Talents.............................................................................. 36
Figure 16. Student Rating Pattern for Q1 – Goals and Objectives – MET Senior Design
Students ............................................................................................................................. 37

Team Effectiveness and Project Management in a Student Team Environment iv
Figure 17. Student Rating Pattern for Problem Solving – MET Senior Design Students 37

Team Effectiveness and Project Management in a Student Team Environment v
List of Tables
Table 1. Comparison of the Nine Survey Questions to Relevant Group Theories ............. 9
Table 2. Survey Timeline .................................................................................................. 10
Table 3. Information Regarding the Survey Sample Population ...................................... 15
Table 4. One Proportion Hypothesis Test of Statistical Significance at Three Different
Levels of Proportion (p) – AET Senior Design Students ................................................. 18
Table 5. One Proportion Hypothesis Test of Statistical Significance at Three Different
Levels of Proportion (p) – MET Senior Design Students ................................................. 19

Team Effectiveness and Project Management in a Student Team Environment 1
Introduction
Problem Statement
Minnesota State University - Mankato AET Students Require a Project Management
Course
According to the Automotive Engineering Technology (AET) department website
(http://cset.mnsu.edu/aet/outcomes.html) one of the program outcomes mentions that
upon graduation the student will be able to manage and lead a team. Effective teams and
effective project management are directly related (Kliem, 2004, p. 160). The purpose of
this research is to assess if students enrolled in the AET program need a project
management course to effectively manage their capstone projects.
According to the 2012-2013 Minnesota State University – Mankato (MSU –
Mankato) undergraduate course bulletin, during the senior year AET students must
complete a capstone project as a requirement for graduation (AET Department, n.d.).
“Capstone” refers to a senior level design course in which students learn to apply their
engineering skills to real-world engineering projects (Todd, Magleby, Sorensen, Swan, &
Anthony, 1995, p. 165).
Significance
Shenhar and Dvir (2007) mention that one of the fastest growing disciplines in
organizations today is project management (p. 93). Project management is gaining
increasing attention in both academia and industry, but problems such as missing dates,
exceeding budgets and producing poor quality still exist (Kliem, 2004, p. 9). At present, a
formal project management course is not included in the AET curriculum (AET

Team Effectiveness and Project Management in a Student Team Environment 2
Department, n.d.). However, for students enrolled in the Manufacturing Engineering
Technology1 (MET) program, a project management course is a requirement for
graduation (MET Department, n.d.).
Nevertheless, current AET students do have the option of taking the project
management course MET 425 (Project Valuation and Management) as an elective.
According to the 2012-2013 MSU - Mankato undergraduate course bulletin, the MET
425 course teaches students the skills required to plan and manage a project, as well as to
perform economic justification for a project (MET Department, n.d.). Furthermore, some
basic team building skills are taught through MET 144 (Product Development and
Design), a required course for both AET and MET students.
According to Rooji (2009), “Project Management Institute (PMI) describes
project management as the application of a body of knowledge, skills, tools, and
techniques to project activities to meet project requirements” (p. 854). Kerzner (2009)
defines successful project management as being able to achieve the project within time
and cost and at the desired performance level (p. 3). Engineers spend most of their formal
education in learning the engineering discipline, and not methods that help them manage
people and projects (Powers and Summers, 2009, p. 5). This particular deficiency
suggests that there is a need for project management to be formally taught in universities
offering engineering or technical degrees. Further, standard project management tools can
be used to improve the structure of student projects (Moor and Drake, 2001, p.395).
1 Note: AET and MET are two programs offered at MSU - Mankato by the
Automotive and Manufacturing Technology (AMET) Department.

Team Effectiveness and Project Management in a Student Team Environment 3
According to Kapp (2009), employers are often looking for graduates who can
work effectively in a team based environment. Moreover, Thamhain (2004) states that the
process of team building has become more complex and requires individuals to have
more sophisticated management skills. Inexperienced students struggling with technical
as well as program management and team building issues, may find it challenging to
meet the requirements of a senior design project (Massie and Massie, 2006, p.36). It is
important for AET graduates to possess the skills required to successfully implement
project management.
As previously mentioned, AET students at MSU - Mankato are required to
complete a capstone project successfully in order to graduate. Moor and Drake (2001)
mention that students often work on the wrong task, or manage their effort poorly due to
lack of experience in managing a project (p. 389). This can result in loss of valuable time
and resources. If the department’s budget is limited, this unintentional misuse of
resources can be harmful to the department. Moreover, the assigned project may not be
accomplished within the established deadline, which as mentioned earlier, is a common
problem.
Deliverables
1. Identify an appropriate survey instrument to measure performance of the Senior
Design teams
2. Conduct a survey of the AET Junior and Senior Design students2
2 The Junior Design course is a pre-requisite for the AET Senior Design course

Team Effectiveness and Project Management in a Student Team Environment 4
i. Junior Design students will be surveyed to evaluate the difference in
opinion between the two groups
3. Conduct a survey of the MET Senior Design students3
i. Draw a comparison between AET and MET students
4. Document results of the survey and give demographic information
5. Analyze the survey results
i. An analysis of the survey results will be done to aid the AMET faculty in
making appropriate adjustments to the curriculum
ii. The analysis will also help the department to identify the needs of project
teams
Limitations
This study was limited to only the AET Junior and Senior Design students and MET
Senior Design students. In the Junior Design course, students formulate their teams and
develop proposals for their final projects. The projects are officially initiated in the Senior
Design course4. During Junior and Senior Design courses a student’s project management
skills are thoroughly tested. Therefore, this research study examined students enrolled in
the Junior and Senior Design courses only. Moreover, only students who were present in-
3 The MET program does not offer a Junior Design course and as a result only
MET Senior Design students were surveyed.
4 For both the MET and AET students the Senior Design course requirement is
split into two courses – Senior Design 1 (typically offered in the Fall semester) and
Senior Design 2 (typically offered in the Spring semester).

Team Effectiveness and Project Management in a Student Team Environment 5
class at the time of the survey were surveyed. No attempt was made to contact students
externally.

Team Effectiveness and Project Management in a Student Team Environment 6
Methodology
The methodology section aims to explain the data collection tool, survey
instrument design, selection criteria for survey participants (sampling frame), survey
timeline, survey approval process, and survey implementation. Primary data for this
research study was collected by conducting surveys. The Data Collection Tool segment
of this section explains why a survey instrument was an appropriate data collection tool
for this research study.
Data Collection Tool
A survey design provides a quantitative or numerical description of trends,
attitudes, or opinions of a population by studying a sample of the population (Creswell,
2003, p.153). The goal of this research study was to assess whether or not students
enrolling in the AET program at MSU – Mankato need a project management course. To
answer the abovementioned research question, a data collection tool that could estimate
the performance of a team based on project management parameters was required.
A survey can be used for evaluating programs and conducting research when the
information has to come directly from humans (Fink, 2009, p.4). According to Rea and
Parker (1997), the three main methods used to collect primary data are survey research,
direct measurement, and observation (p. 2). Given the time and resources available, both
direct measurement and observation were not suitable for this research study.
For the purpose of comparisons among individuals, the survey offers an additional
advantage of being repeatable (Rea and Parker, 1997, p. 5). Since the intention of this
research study was to collect sample data multiple times during the academic year, it was

Team Effectiveness and Project Management in a Student Team Environment 7
important to select a data collection tool that would be repeatable and consistent. Owing
to the advantageous reasons mentioned above, it was decided that a suitable survey
instrument had to either be designed or identified for the purpose of this research study.
The Survey Instrument Design segment of this section will describe how the survey
instrument used in this research study was developed.
Survey Instrument Design
The survey instrument used in this research study was derived from the “Team
Effectiveness Critique” found in the article, Assessing Team Performance, written by Dr.
Susan Trimble5. The “Team Effectiveness Critique” can be found in Appendix A. Dr.
Trimble’s approval was acquired for the usage of “Team Effectiveness Critique” in this
research study. According to (Trimble and Rottier, 1998) the Team Effectiveness
Critique is a short ten item form to gauge team members’ perceptions regarding the ten
dimensions of teaming6 (p. 6). Another instrument evaluated for this research study with
“Team Effectiveness Critique” was the “Collective Effort Classroom Technique”
(CECAT) developed by Dr. Charles Walker and Thomas Angelo (Appendix A).
According to Walker and Angelo (1998) the CECAT instrument’s purpose is to
stimulate the healthy development of student groups (p. 103). The CECAT instrument
contains twenty questions that can help monitor student groups. These twenty questions
5 Dr. Trimble is currently a professor at Georgia Southern University for the
Department of Teaching and Learning
6 Note – Only nine questions relevant to project management were used in final
survey instruments for this research study

Team Effectiveness and Project Management in a Student Team Environment 8
can be grouped into six categories related to group structure and group process (Walker
and Angelo, 1998, p.107). The “Team Effectiveness Critique: contains questions that
relate to ten different aspects of teamwork out of which, nine questions are related to
project management. Since the “Team Effectiveness Critique” contained more questions
that can be easily related to project management, it was considered a suitable instrument
of data collection for this research study. The next two paragraphs describe how the
questions contained in the “Team Effectiveness Critique” relate to both project
management and team effectiveness.
The nine survey questions derived from the “Team Effectiveness Critique” for
this research study can be found in Appendix B. These nine selected questions were
compared to three group theories to verify if they were related to team effectiveness. The
three group theories used for comparison are as follows:
The GRPI7 Model of Team Effectiveness – Developed by Irwin Rubin,
Martin Plovnick and Ron Fry - 1977
The Discipline of Teams – Developed by Jon Katzenbach and Douglas
Smith – 1993
Social Loafing Theory – Developed by Steven Karau and Kipling
Williams – 1993
The fourth edition of Project Management Body of Knowledge (PMBOK) was
referenced to check conformity of these nine questions to known project management
7 GRPI stands for Goals, Roles, Processes and Workflow, and Interpersonal
Relationships

Team Effectiveness and Project Management in a Student Team Environment 9
practices. Table 1 summarizes how each of the nine questions are related to one or more
abovementioned group theories. After validity of the nine chosen questions was
established for this research study, the next task was to identify a sampling frame and a
survey timeline that satisfied the goals of this research.
Table 1
Comparison of the Nine Survey Questions to Relevant Group Theories
Group Theories that Mention if the Question is
Related to Team Effectiveness
Survey Question GRPI
Model
Discipline of
Teams
Social
Loafing
Theory
Q1 - Goals and Objectives x x
Q2 - Utilization of Talent x
Q3 - Trust and Conflict x
Q4 - Leadership x
Q5 - Team Procedures x x
Q6 - Communication x x
Q7 - Problem Solving x x
Q8 - Creativity
x
Q9 - Evaluation x
Note. GRPI = Goals, Roles, Processes and Workflow, and Interpersonal Relationships
Survey Sampling Frame and Survey Timeline
The survey sampling frame for this research study consisted of students enrolled
in the following courses at MSU – Mankato:
AET 387 – Junior Design Project
AET 488 – Senior Design Project I
AET 489 – Senior Design Project II
MET 488 – Senior Design Project I
MET 489 – Senior Design Project II

Team Effectiveness and Project Management in a Student Team Environment 10
The purpose of the Junior Design course is to help students form a team and allow them
to develop a proposal for their capstone projects. The capstone project is officially
initiated during Senior Design I. Senior Design II is the final phase of the project, and at
the end of this course students are expected to present their final product. Typically, AET
and MET capstone projects at MSU – Mankato involve working in teams. Therefore,
students enrolled in the Junior and Senior Design courses were a suitable target
population for this study.
MET students were intentionally included in this study because they are required
to take MET 425 prior to registering for Senior Design I. The researcher wanted to find
out if the MET students who possess prior project management knowledge performed
better as a team compared to the AET students. After the sampling frame was finalized,
the next step in the research process was to establish a survey timeline. The timeline
established for this research study is shown in Table 2.
Table 2
Survey Timeline
Semester During Which the Survey was
Conducted
Survey Sample Group Fall '11
(Trial 1)
Spring '12 –
Start
(Trial 2)
Spring '12 –
End
(Trial 3)
AET Junior Design
x x
AET Senior Design I x
AET Senior Design II
x x
MET Senior Design I x
MET Senior Design II x x
Note. AET = Automotive Engineering Technology; MET = Manufacturing
Engineering Technology.

Team Effectiveness and Project Management in a Student Team Environment 11
AET and MET Senior Design II and AET Junior Design courses are typically
offered during the Spring semester. Students enrolled in these courses were surveyed
twice, once during the start and once during the end of the Spring ’12 semester. This was
done to capture changes in student perception regarding a particular question over the
course of a semester. In the case of AET and MET Senior Design I courses, it was only
possible to survey the students once late in the Fall ’11 semester.
Final Survey Instruments
For the purpose of this research study two survey instruments were formulated,
namely, Survey Instrument - I (Appendix C) and Survey Instrument - II (Appendix D).
Survey Instrument - II was used only for surveying the AET and MET Senior Design II
students during the end of Spring ’12 semester. During all other occasions Survey
Instrument - I was used.
Both Survey Instrument - I and Survey Instrument - II contain two sections. The
first section, which is the same for both survey instruments, contains questions aimed at
collecting demographic information. The second sections of Survey Instrument – I and
Survey Instrument - II contains nine questions (Q.1 –Q.9). These nine questions related to
project management and team effectiveness8 are derived directly from the “Team
Effectiveness Critique”.
Survey Instrument – II has an additional question (Q.10), which was specifically
designed for the students enrolled in the AET and MET Senior Design II courses. As
8 Henceforth these nine questions will be referred to as the “nine survey
categories”

Team Effectiveness and Project Management in a Student Team Environment 12
mentioned before Senior Design II is the final phase of the capstone project. Question 10
was designed to reveal any survey categories that might need improvement at the end of a
capstone project9. The next phase of this research study involved acquiring the
appropriate approval for research involving human subjects at MSU – Mankato.
Survey Approval and Implementation
The Institutional Review Board (IRB) at MSU – Mankato requires that all
research involving human subjects conducted at or through the university have IRB
approval (IRB, n.d.). Since this research study involved human subjects, IRB approval
was required prior to conducting any survey. The document indicating IRB approval for
Survey Instrument - I can be found in Appendix E. For Survey Instrument – II it can be
found in Appendix F. The IRB also required survey participants to fill out an informed
consent form prior to taking the survey. The consent form is located in Appendix G10
.
After getting approval from the IRB for survey research, a protocol for
conducting surveys was established. This protocol is as follows:
1. Acquire instructor approval for surveying the students of his/her class
2. Address the purpose of the research to students who will be taking the
survey
3. Hand out the surveys, consent forms, and two envelopes
4. Request the students to fill the consent form prior to completing the survey
9 Question 10 was designed by partnering with Principal Investigator, Dr. Craig
Evers
10 Same consent form was used for Survey Instrument I and Survey Instrument II

Team Effectiveness and Project Management in a Student Team Environment 13
5. After completing the surveys, request the students to store the consent
forms and surveys in separate envelopes that were provided earlier
6. Wait outside the classroom while the students complete the survey
7. Collect the completed surveys for data analyses, and hand over the
envelope containing consent forms to Dr. Craig Evers11
(Principal
Investigator)
11
The IRB requires that the consent forms be stored with the Principal
Investigator in a lockbox.

Team Effectiveness and Project Management in a Student Team Environment 14
Analysis of Results
The Analysis of Results section will explain the various methods used to analyze
survey sample data and how to interpret the results achieved by implementing these
methods. A comprehensive list of major findings and methods that validate the findings
will be provided as well. Basic demographic information regarding the survey sample
population will be provided in the Demographic Information segment of this section.
Demographic Information
Table 2, shown in the Methodology section of this paper, gives information
regarding the five groups (survey sample groups) that were surveyed for this research
study. AET Senior Design I and II survey groups had the most number of respondents.
This was beneficial since AET Senior Design group is the main focus of this research
study. Table 3, shown below, summarizes sample population information for the five
survey sample groups.
The final data set used for statistical analysis did not contain data from invalid
surveys. As a result, the sample population data in Table 3 reflects only those respondents
whose survey was valid. Incomplete surveys were considered invalid. Number of
respondents for the AET Junior Design group was especially low during the start of the
Spring ‘12 semester.
In AET 387 (Junior Design Project), students form teams toward the end of the
course. When a survey was conducted during the start of the Spring ‘12 semester, AET
Junior Design students were asked to predict how their Senior Design team would
perform in each of the nine survey categories. Since AET Junior Design students had

Team Effectiveness and Project Management in a Student Team Environment 15
difficulty in answering some of the survey questions, the data set for AET Junior Design
students contained many invalid surveys. Thus, AET Junior Design data set was used to
only gauge student perception regarding the nine survey categories prior to a Senior
Design project. No conclusive inference could be made from this particular data set.
Table 3
Information Regarding the Survey Sample Population
Number of Valid Survey Participants
Survey Sample Group
Fall '11 Single
Survey
(Trial 1)
Spring '12
Start
(Trial 2)
Spring '12
End
(Trial 3)
AET Senior Design I 34
50a
AET Senior Design II
34 30
50a 53.3a
MET Senior Design I 18
88.9a MET Senior Design II
16 15
81.3a 86.7a
AET Junior Design 12 19
50a 52.6a
Note. AET Junior Design is offered only during the Spring semesters hence, no data is
available for this survey group during the Fall’ 11 survey trials.
aThis number represents the proportion of survey participants who had successfully
completed MET 32512
(Project Management) course prior to taking the survey.
Normal Probability Plots
12
When the survey was originally composed the AMET Department offered two
separate courses, MET 325 – Project Management and MET 421 – Project Valuation and
Justification. The AMET department now offers a combined course MET 425, known as
Project Valuation and Management (H. Petersen, personal communication, 2011).

Team Effectiveness and Project Management in a Student Team Environment 16
Some statistical methods used to analyze survey sample data required sample data
to be derived from a normal population distribution. Therefore, before any analysis of
data could be initiated, it was important to conduct a normal probability analysis of the
survey sample data. Normal probability plots were constructed for each of the nine
survey categories. This was repeated for all three survey trials, namely Fall ’11 Single
Survey (Trial 1), Spring ’12 – Start (Trial 2), and Spring ’12 – End (Trial 3). Minitab 15,
a statistical analysis software, was used to construct the normal probability plots.
A 95% confidence interval was used to estimate if data points for each of the nine
survey categories were normal. Triola (2004) suggests that if data points of a normal
probability plot follow a straight line, then the data set is considered to be normal and at
most, two outliers are considered acceptable. Normal probability plots for data collected
from surveys of the five survey sample groups can be found in Appendix H. The normal
probability plots confirmed that all data sets used in this research study were normal.
Hence, it can be said that the sample data for this research study was collected from a
population that was normally distributed. Once the normality of the population
distribution was established, the next task was to perform hypothesis tests of statistical
significance.
One Proportion Hypothesis Test for Statistical Significance
According to Triola (2004), “A hypothesis test (or test of significance) is a
standard procedure for testing a claim about a property of a population” (p. 368). A one
proportion (p) hypothesis test was used in this research study to determine which of the

Team Effectiveness and Project Management in a Student Team Environment 17
nine survey categories were statistically significant13
. The researcher partnered with Dr.
Mezbahur Rahman14
(Technical Adviser) to formulate a hypothesis test of statistical
significance. The null (H0) and alternate hypothesis (H1) for the one proportion (p)
hypothesis test of statistical significance used in this research study is as follows:
H0 = Proportion of students who rated the survey question between the scores of
5-7 is less than or equal to p.
H1 = Proportion of students who rated the survey question between the scores of
5-7 is greater than p.
A significance level (α) of 0.05 was used for all hypothesis tests. If the exact p-
value obtained from the hypothesis test was less than significance level (α), the survey
category was considered to be statistically significant. If the exact p-value was greater
than significance level (α) the survey category was not considered to be statistically
significant. The hypothesis tests were performed at proportion (p) levels of 0.50, 0.48,
and 0.46 to detect changes in significance for any of the nine survey categories. If a
survey category was found to be significant at all three proportion levels and during all
three trials (trial 1, trial 2, and trial 3), then it was considered to be a critically significant
survey category. Critically significant survey categories were then selected for further
specialized statistical analyses.
13
Statistically significant results are interpreted in this research study as findings
that are highly unlikely to occur by chance (Triola, 2004).
14 Dr. Rahman is currently a professor at MSU – Mankato for the Department of
Mathematics and Statistics.

Team Effectiveness and Project Management in a Student Team Environment 18
Results of the one proportion hypothesis tests for AET Senior Design students is
shown in Table 4 and results for MET Senior Design students is shown in Table 5 below.
For AET Senior Design students, a total of six survey categories were found to be
critically significant. On the other hand, only three survey categories were found to be
critically significant for the MET Senior Design group. Hypothesis test results with exact
p-values for all five survey sample groups can be found in Appendix I.
Table 4
One Proportion Hypothesis Test of Statistical Significance at Three Different Levels of
Proportion (p) – AET Senior Design Students
Results for
Fall '11 Single
Survey (Trial 1)
Results for
Spring '12 – Start
(Trial 2)
Results for
Spring '12 – End
(Trial 3)
Survey Category 0.50
(p)
0.48
(p)
0.46
(p)
0.50
(p)
0.48
(p)
0.46
(p)
0.50
(p)
0.48
(p)
0.46
(p)
Q1 - Goals and Objectivesa 1 1 1 1 1 1 1 1 1
Q2 - Utilization of Talenta 1 1 1
1 1 1
1 1 1
Q3 - Trust and Conflicta 1 1 1
1 1 1
1 1 1
Q4 - Leadership 0 0 0
0 0 0
0 0 0
Q5 - Team Procedures 0 0 0
1 1 1
0 0 0
Q6 - Communicationa 1 1 1
1 1 1
1 1 1
Q7 - Problem Solvinga 1 1 1
1 1 1
1 1 1
Q8 - Creativitya 1 1 1
1 1 1
1 1 1
Q9 - Evaluation 0 1 1 1 1 1 0 0 0
Note. The number “1” indicates that the question was found to be significant and the number “0”
indicates that the question was not found to be significant. Q = Question. aIndicates that the question was found to be significant during all three trials and at all three levels
of proportion. These questions were considered to be critically significant.

Team Effectiveness and Project Management in a Student Team Environment 19
Table 5
One Proportion Hypothesis Test of Statistical Significance at Three Different Levels of
Proportion (p) – MET Senior Design Students
Results for
Fall '11 Single
Survey (Trial 1)
Results for
Spring '12 – Start
(Trial 2)
Results for
Spring '12 – End
(Trial 3)
Survey Category 0.50
(p)
0.48
(p)
0.46
(p)
0.50
(p)
0.48
(p)
0.46
(p)
0.50
(p)
0.48
(p)
0.46
(p)
Q1 - Goals and Objectivesa
1 1 1 1 1 1 1 1 1
Q2 - Utilization of Talent 0 0 0
0 0 0
1 1 1
Q3 - Trust and Conflicta 1 1 1
1 1 1
1 1 1
Q4 - Leadership 0 0 0
0 0 0
0 1 1
Q5 - Team Procedures 0 0 0
0 0 0
0 0 0
Q6 - Communication 1 1 1
1 1 1
0 0 0
Q7 - Problem Solvinga 1 1 1
1 1 1
1 1 1
Q8 - Creativity 0 0 0
1 1 1
0 0 0
Q9 - Evaluation 0 0 0 0 0 0 0 0 0
Note. The number “1” indicates that the question was found to be significant and the number “0”
indicates that the question was not found to be significant. Q = Question. aIndicates that the question was found to be significant during all three trials and at all three levels
of proportion. These questions were considered to be critically significant.
Pearson’s Correlation Coefficient “r”
After critically significant survey categories were identified, the next step was to
identify existence of correlation between the critically significant survey categories.
According to Levin, Fox, & Forde (2010), “Correlation coefficients numerically express
strength and direction of a straight line correlation” (pg. 348-349). Minitab 15 was used
to perform Pearson’s correlation test among critically significant survey categories for the
AET and MET Senior Design students. Figure 1 indicates fifteen possible pairs of
critically significant survey categories for the AET Senior Design students that were

Team Effectiveness and Project Management in a Student Team Environment 20
tested for correlation. Figure 2 indicates three possible pairs of critically significant
survey categories for the MET Senior Design students that were tested for correlation.
Figure 1. Pairs of critically significant survey categories tested for correlation – AET
Senior Design Students.
Figure 2. Pairs of critically significant survey categories tested for correlation – MET
Senior Design Students.
All pairs of critically significant survey categories shown in Figure 1 and Figure 2
were tested for correlation during all three trials. A significance level (α) of 0.05 was
used for the correlation analysis. By default, Minitab 15 gives the user a p-value and a
value for Pearson’s correlation coefficient “r”. If the p-value for a pair of critically
Pair 9
Utilization of Talent
Creativity
Pair 5
Goals and Objectives
Communication
Pair 4
Goals and Objectives
Problem Solving
Pair 3
Goals and Objectives
Creativity
Problem Solving
Pair 12
Trust and ConflictUtilization of Talent
Problem Solving
Communication
Pair 8
Pair 15
Problem Solving
Creativity
Creativity
Pair 13
Communication
Problem Solving
Pair 14
Communication
Creativity
Pair 10
Trust and Conflict
Communication
Pair 11
Trust and Conflict
Pair 6
Utilization of Talent
Trust and Conflict
Pair 7
Utilization of Talent
Trust and Conflict
Pair 1
Goals and Objectives
Utilization of Talent
Pair 2
Goals and Objectives
Pair 2
Trust and Conflict
Problem Solving
Goals and Objectives
Problem Solving
Trust and Conflict
Pair 1 Pair 3
Goals and Objectives

Team Effectiveness and Project Management in a Student Team Environment 21
significant survey categories was less than α, then the correlation between the pair was
considered to be statistically significant.
Figure 3 below indicates how “r” value can be used to indicate the strength and
direction of correlation between two variables. A positive correlation indicates that
students who had high scores for survey category (x) also had high scores for survey
category (y). A negative correlation indicates that students who had low scores for survey
category (x) also had low scores for survey category (y) (Levin, Fox, & Forde, 2010, pg.
347).
Figure 3. Range of values “r” and the strength of correlation that it indicates. Adapted
from “Elementary Statistics in Social Research,” by J. Levin, J. Fox, and D. Forde, 2010,
p.349. Copyright 2010 by Allyn and Bacon Pearson.
If a pair of survey categories (Figure 1 and Figure 2) was found to be significant
at α of 0.05 during all three trials, then correlation between the pair was considered to be
critically significant. For AET Senior Design students seven critically significant pairs of
-1.00 Perfect Negative Correlation…
-0.60 Strong Negative Correlation…
-0.30 Moderate Negative Correlation…
-0.10 Weak Negative Correlation…
0.00 No Correlation…+0.10 Weak Positive Correlation…
+0.30 Moderate Positive Correlation…
+0.60 Strong Positive Correlation…
+1.00 Perfect Positive Correlation

Team Effectiveness and Project Management in a Student Team Environment 22
survey categories were identified. Figure 4, shown below, summarizes this information.
No critically significant pairs of survey categories were identified for MET Senior Design
students. Complete correlation tables for the AET and MET Senior Design groups can be
found in Appendix J.
Figure 4. Pearson’s Correlation Test Results for AET Senior Design Students. All pairs
of variables were found to be statistically significant at α = 0.05. Scale for Pearson’s
correlation coefficient is shown to the left, alongside the y-axis.
AET Senior Design students with good ratings in the survey category of
Utilization of Talent might also achieve good ratings in the survey categories of Trust and
Conflict, Problem Solving, and Creativity (Figure 4). Categories of Trust and Conflict
and Communication had strong correlation during Trial 1 and Trial 2, which suggests,
AET Senior Design students with good communication skills are more likely to do well
in the survey category of Trust and Conflict. The next segment of this section will give
information regarding Somer’s Dyx association test.
NC
.
.
.
.
.
.
.
.
0.000
0.100
0.200
0.300
0.400
0.500
0.600
0.700
GO - TC UT - TC UT - PS UT - CR TC - CM CM - PS PS - CR
Pairs of Critically Significant Survey Categories
Pearson's Correlation Test Results for AET Senior Design Students
Fall '11 Single Survey (N = 34) Spring '12 - Start (N=34) Spring '12 - End (N=30)
SPC
MPC
.WPC
Pears
on's
C
orr
ela
tion C
oeff
icie
nt
(r)
CM Communication PS Problem Solving
CR Creativity SPC Strong Positive Correlation
GO Goals and Objectives TC Trust and Conflict
MPC Moderate Positive Correlation UT Utilization of Talent
NC No Correlation WPC Weak Positive Correlation

Team Effectiveness and Project Management in a Student Team Environment 23
Somers’ Dyx Test of Association between Ordinal Variables
An association test was required to assess if students with prior formal project
management (PM) knowledge15
had better survey ratings compared to students without
prior formal PM knowledge. The Somers’ Dyx association test is one such tool used to
find out if there is an association between any two ordinal variables (Fox, 2002, pg. 159).
A variable whose values can be rank-ordered is known as ordinal (Fox, 2002, pg. 10).
Only critically significant survey categories (Table 5) were analyzed using Somers’ Dyx
method to detect if they were associated to project management.
Both variables used for Somer’s Dyx analysis in this research study, are ordinal
variables that can be rank ordered. These ordinal variables are:
Formal project management coursework
o MET 325 not taken
o MET 325 taken
Survey scores
o 5-7
o 1-3
A survey score of four was considered as a response that indicated a student’s uncertainty
regarding his/her team’s performance in a particular survey category. Hence, these
15
For the purpose of this research study, students who had taken the MET 325
(Project Management) course prior to the survey were considered to have formal project
management knowledge.
Rank Order
Rank Order

Team Effectiveness and Project Management in a Student Team Environment 24
responses were omitted from the Somers’ Dyx analysis. The logic behind Somers’ Dyx
association test is shown in Appendix K. Formula for Somers’ “Dyx” is shown below:
Dyx = (Same - Opposite) / (Same – Opposite + Ty)16
The denominator in the formula for “Dyx” ties in the value of “Ty”, which is the
sum of pairs that are tied to the dependent variable “x” (survey scores). As a result, the
Somers’ Dyx method takes into account all possible combinations of pairs in its formula.
For the purpose of Somers’ Dyx analysis in this research study, the dependent variable “x”
is always survey scores and the independent variable “y” is always project management
coursework. Somers’ Dyx analysis results for AET Senior Design students are shown in
Figure 5 below.
Figure 5. Results for Somers’ Dyx Analysis – AET Senior Design Students. Q = Question.
16
Appendix K gives definitions for the terms “same”, “opposite”, and “Ty”
-15.00
-10.00
-5.00
0.00
5.00
10.00
15.00
20.00
Q1 Q2 Q3 Q6 Q7 Q8
Som
ers
' D
yx
Valu
e (
%)
Critically Significant Survey Categories
Results for Somer's Dyx Analysis - AET Senior Design Students
Fall '11 Single Survey (N=34) Spring '12 - Start (N=34) Spring '12 - End (N=30)
Q1 Goals and Objectives Q6 Communication
Q2 Utilization of Talent Q7 Problem Solving
Q3 Trust and Conflict Q8 Creativity

Team Effectiveness and Project Management in a Student Team Environment 25
Moderate association was detected between project management and survey
category Trust and Conflict during Trial 2. Therefore, during Trial 2, AET Senior Design
students with formal project management knowledge might have had higher scores for
the survey category of Trust and Conflict. During Trials 1 and 2 a mild association was
detected between the survey category of Creativity and project management.
Project management had no impact on the survey category of Problem Solving.
There was a mild association between the survey category of Goals and Objectives and
project management during all three survey trials. Categories of Utilization of Talents
and Communication had a minimal association to project management for the AET
Senior Design students. Somers’ Dyx analysis results for MET Senior Design students are
shown in Figure 6 below.
Figure 6. Results for Somers’ Dyx Analysis – MET Senior Design Students.
Q = Question.
Q1 Goals and Objectives Q7 Problem Solving
Q3 Trust and Conflict - -
-25.00
-20.00
-15.00
-10.00
-5.00
0.00
5.00
10.00
15.00
20.00
25.00
30.00
Q1 Q3 Q7
Som
ers
' D
yx
Valu
e (
%)
Critically Significant Survey Categories
Results for Somer's Dyx Analysis -
MET Senior Design Students
Fall '11 Single Survey (N=18) Spring '12 - Start (N=16) Spring '12 - End (N=15)

Team Effectiveness and Project Management in a Student Team Environment 26
For MET Senior Design students, moderate association was detected between
project management and survey categories of Goals and Objectives, and Problem Solving
during Trial 2. No survey category was associated to project management during Trials 1
and 3 for the MET Senior Design students. Complete tables of Somers’ Dyx analysis for
the AET and MET Senior Design students can be found in Appendix L.
Next, the Descriptive Statistics segment of this section will give brief information
regarding specialized percentage graphs and percentage tables created to identify initial
trends in survey sample data. Results for Question 10, which was included in Trial 3 for
AET and MET Senior Design students, will also be discussed in this segment.
Descriptive Statistics
The researcher collaborated with Principal Investigator, Dr. Craig Evers to design
specialized percentage graphs with the following capability:
Show percentages for students who rated the nine survey categories
between the scores of 5-7 (high scores)
Show percentages for students who rated the nine survey categories
between the scores of 1-3 (low scores)
High and low scores for each of the nine survey categories were shown for all three trials
on one graph (Appendix M). This made it relatively easy to identify survey categories
with exceptionally high or low scores. The percentage tables will be described next.
According to Fox (2002), when comparison of two or more distributions with
different number of cases is required, the distributions can be standardized by using
percentages instead of frequencies (pg. 31-32). Therefore, percentages are used in this

Team Effectiveness and Project Management in a Student Team Environment 27
research study since the number of participants was not the same for the five survey
sample groups. Grouped percentage tables were created to draw a comparison between
students who took MET 325 (Project Management) prior to the survey and those who did
not take MET 325 prior to the survey. Grouped percentage table for AET and MET
Senior Design Students is shown below (Table 6 and Table 7).
Table 6
Comparison of Scores – Students who Took MET 325 vs. Students who Did Not
Take MET 325 Prior to the Survey – AET Senior Design Students
Note.
aThese are variables that were found to be critically significant using one
proportion hypothesis test of significance. Q = Question; MET 325 = Project Management.
Scores
1-3
Scores
5-7
Scores
1-3
Scores
5-7
Fall '11 Single Survey
Q1 - Goals and Objectives 6 94 12 76
Q2 - Utilization of Talent 6 59 6 76
Q3 - Trust and Conflict 0 76 6 88
Q6 - Communication 6 76 12 65
Q7 - Problem Solving 6 76 6 65
Q8 - Creativity 0 65 12 71
Spring '12 - Start
Q1 - Goals and Objectives 0 94 12 82
Q2 - Utilization of Talent 6 65 18 82
Q3 - Trust and Conflict 0 88 18 71
Q6 - Communication 12 76 12 59
Q7 - Problem Solving 18 65 6 82
Q8 - Creativity 6 82 12 65
Spring '12 - End
Q1 - Goals and Objectives 6 94 14 79
Q2 - Utilization of Talent 6 75 7 86
Q3 - Trust and Conflict 0 88 7 57
Q6 - Communication 6 75 7 71
Q7 - Problem Solving 13 69 7 64
Q8 - Creativity 6 69 0 71
(N) = (16) (N) = (14)
Variablea
MET 325 Taken MET 325 Not Taken
(N) = (17) (N) = (17)
(N) = (17) (N) = (17)

Team Effectiveness and Project Management in a Student Team Environment 28
Table 7
Comparison of Scores – Students who Took MET 325 vs. Students who
Did Not Take MET 325 Prior to the Survey – MET Senior Design Students
Note.
aThese are variables that were found to be critically significant using one
proportion hypothesis test of significance. Q = Question; MET 325 = Project Management.
For complete grouped percentage tables with non-critically significant survey categories
included, please refer to Appendix N. A grouped percentage table for AET Junior Design
students is also available in Appendix N.
The following paragraph will discuss results for survey Question 10, which was
introduced in Survey Instrument - II during survey Trial 3. Only AET and MET Senior
Design students were requested to answer this question. Surveys designed for AET Junior
Design students did not contain this question. Figure 7, shown below, gives an overview
of survey Question 10.
Scores
1-3
Scores
5-7
Scores
1-3
Scores
5-7
Fall '11 Single Survey
Q1 - Goals and Objectives 6 88 0 100
Q3 - Trust and Conflict 6 88 0 50
Q7 - Problem Solving 19 69 0 100
Spring '12 - Start
Q1 - Goals and Objectives 8 92 33 67
Q3 - Trust and Conflict 0 85 0 67
Q7 - Problem Solving 8 77 33 67
Spring '12 - End
Q1 - Goals and Objectives 8 77 0 100
Q3 - Trust and Conflict 0 92 0 100
Q7 - Problem Solving 0 85 0 50
(N) = (13) (N) = (3)
(N) = (13) (N) = (2)
Variablea
MET 325 Taken MET 325 Not Taken
(N) = (16) (N) = (2)

Team Effectiveness and Project Management in a Student Team Environment 29
Figure 7. Question 10 - Introduced During Trial 3 - Spring ’12 End.
For AET Senior Design students, the survey categories of Goals and Objectives,
and Trust and Conflict received the most number of votes for a need for improvement
score of 1 (Appendix O). Cumulatively, survey category of Communication received the
most number of votes (total 15 votes) for Question 10 (Figure 8). It should also be noted
that 57.70% of valid AET Senior Design respondents felt the survey category of
Communication needed improvement.
Figure 8. Total Number of Votes Received for Survey Question 10 – AET Senior Design
Students – Spring ’12 End. N = Number of valid respondents.
0 2 4 6 8 10 12 14 16
Goals and Objectives
Utilization of Talents
Trust and Conflict
Leadership
Team Procedures
Communication
Problem Solving
Creativity
Evaluation
Number of Votes
Th
e N
ine
Su
rvey
Cate
gori
es
Total Number of Votes Received for Survey Question 10 (Need for
Improvement) - AET Senior Design Students - Spring '12 End (N = 26)

Team Effectiveness and Project Management in a Student Team Environment 30
For AET Senior Design students, the top three categories requiring improvement
were Goals and Objectives, Communication, and Evaluation (Figure 8). A bar chart was
constructed, using the top three survey categories needing improvement17
, to detect if an
AET Senior Design student’s formal PM knowledge had an impact on the number of
votes for Question 10 (Figure 9).
Figure 9. Rating Pattern for Survey Question 10 – AET Senior Design Students
– Spring ’12 End - Top Three Categories.
Nine of the twelve votes (75%) for the survey category of Goals and Objectives
came from AET Senior Design students with formal project management knowledge.
AET Senior Design students with formal PM knowledge had a different perception
regarding their teams’ goals and objectives. AET Senior Design students with formal PM
knowledge might have been aware of the advantages of having well defined project goals
17
Votes for other survey categories were low. Hence, only top three categories
were selected for bar chart analysis shown in Figure 9.
3
6
6
9
9
8
0 3 6 9 12 15
Goals and Objectives
Communication
Evaluation
Number of Votes
Su
rve
y C
ate
go
ries
Rating Pattern for Survey Question 10 - AET Senior Design
Students - Spring '12 End (Top Three Survey Categories)
Students without MET 325 Knowledge Students with MET 325 Knowledge
MET 325 Project Management

Team Effectiveness and Project Management in a Student Team Environment 31
and objectives. As a result, at the end of their capstone projects, many AET Senior
Design students with formal PM knowledge felt the survey category of Goals and
Objectives needed more improvement.
There were only thirteen valid MET Senior Design respondents for survey
Question 10. Therefore, conclusive inferences could not be made for MET Senior Design
students. Appendix O contains individual bar charts that show the number of votes each
category received, for a need for improvement score of 1, 2, and 3 respectively.
Major Findings
Major Finding 1 – AET Senior Design students with formal project management
knowledge had good ratings for the survey category of Trust and Conflict.
The percentage graph shown in Figure 10 below indicates that 88% of AET
Senior Design students with formal project management (PM) knowledge gave Trust and
Conflict a rating of 5 or higher during Trials 2 and 3.
Figure 10. Student Rating Pattern for Question 3 – Trust
and Conflict – AET Senior Design Students.
76
88 8888
71
57
0
20
40
60
80
100
Fall '11 Single
Survey (N=34)
Spring '12 Start
(N=34)
Spring '12 End
(N=30)Stu
den
ts W
ho R
ate
d Q
3 b
etw
een
th
e
Sco
re o
f 5
-7 (
%)
Student Rating Pattern for Question 3 - Trust and
Conflict - AET Senior Design Students
Students with MET 325 Knowledge
Students without MET 325 Knowledge
MET 325 Project Management

Team Effectiveness and Project Management in a Student Team Environment 32
On the other hand, ratings for AET Senior Design students without formal PM
knowledge were satisfactory (88%) during Trial 1 but, dropped to 57% during Trial 3. It
should also be noted that 36% of AET Senior students without formal PM knowledge
gave this survey category a rating of four during Trial 3. A rating of four suggests these
AET Senior Design students were unsure as to how their team dealt with Trust and
Conflict.
Moderate association was detected between project management and the survey
category of Trust and Conflict during Trial 2 (Figure 5). A moderate association indicates
that project management might have helped AET Senior Design students with formal PM
knowledge achieve good ratings in the survey category of Trust and Conflict during Trial
2.
Major Finding 2 – AET Senior Design students with formal PM knowledge had good
ratings for the survey category of Creativity.
For AET Senior Design students with formal PM knowledge, the rating for
Creativity rose from 65% during Trial 1 to 82% during Trial 2 (Figure 11). Therefore,
AET Senior Design students with formal PM knowledge could have felt that members of
their team were not fully using their creative abilities during Trial 1.
AET Senior Design students at MSU – Mankato are required to present the final
product of their design projects by the end of the spring semester. Hence, AET Senior
Design students are under pressure to perform well during the spring semester (C. Evers,
personal communication, 2012). This pressure to perform might have triggered the high

Team Effectiveness and Project Management in a Student Team Environment 33
ratings for the survey category of Creativity amongst AET Senior Design students with
formal PM knowledge during Trial 2.
Figure 11. Student Rating Pattern for Question 8 – Creativity – AET Senior Design
Students. Please note – only one survey was conducted during Fall ‘11semester.
Major Finding 3 – AET Senior Design students with formal PM knowledge had strong,
consistent ratings in the survey category of Goals and Objectives during all three survey
trials.
Figure 12 below shows that, AET Senior Design students with formal PM
knowledge consistently had a rating of 94% for the survey category of Goals and
Objectives during all three survey trials. A project management approach in clearly
setting a team’s goals and objectives during the initiating phase of a project might have
been the reason for high ratings in this survey category by AET Senior Design students
who had formal PM knowledge.
65
82
697165
71
0
20
40
60
80
100
Fall '11 End (N=34) Spring '12 Start
(N=34)
Spring '12 End
(N=30)Stu
den
ts W
ho
Rat
ed Q
3 be
twee
n t
he
Sco
re o
f 5-
7 (%
)
Student Rating Pattern for Question 8 -
Creativity - AET Senior Design Students
Students with MET 325 Knowledge
Students without MET 325 Knowledge
MET 325 Project Management

Team Effectiveness and Project Management in a Student Team Environment 34
Figure 12. Student Rating Pattern for Question1 – Goals and Objectives –
AET Senior Design Students.
Major Finding 4 – AET Senior Design students with prior formal PM knowledge
demonstrated good consistent ratings in the survey category of Communication.
Figure 13. Student Rating Pattern for Question 6 – Communication – AET
Senior Design Students.
94 94 94
7682 79
0
20
40
60
80
100
Fall '11 Single
Survey (N=34)
Spring '12 Start
(N=34)
Spring '12 End
(N=30)Stu
den
ts W
ho
Rat
ed Q
3 be
twee
n t
he
Sco
re o
f 5-
7 (%
)
Student Rating Pattern for Question 1 - Goals
and Objectives - AET Senior Design Students
Students with MET 325 Knowledge
Students without MET 325 Knowledge
MET 325 Project Management
76 76 7565
59
71
0
20
40
60
80
100
Fall '11 Single
Survey (N=34)
Spring '12 Start
(N=34)
Spring '12 End
(N=30)Stu
den
ts W
ho
Rat
ed Q
3 be
twee
n t
he
Sco
re o
f 5-
7 (%
)
Student Rating Pattern for Question 6 -
Communication - AET Senior Design Students
Students with MET 325 Knowledge
Students without MET 325 Knowledge
MET 325 Project Management

Team Effectiveness and Project Management in a Student Team Environment 35
AET Senior Design students with formal PM knowledge had consistent ratings
(above or equal to 75%) during all three survey trials for the category of Communication.
During Trial 2 the rating for AET Senior Design students without formal PM knowledge
was 17% lower than AET Senior Design students with formal PM knowledge. Figure 13,
shown above, summarizes these findings.
Major Finding 5 – AET Senior Design students with formal PM knowledge had lower
ratings during all three trials for the survey category of Utilization of Talent compared to
AET Senior Design students without formal PM knowledge.
Ratings for AET Senior Design students with formal PM knowledge were at least
11% lower compared to AET Senior Design students without formal PM knowledge
during all three survey trials (Refer to Figure 14 below). Figure 15 below shows the
actual wording for Question 2 as it appeared on both Survey Instrument I & II.
Figure 14. Student Rating Pattern for Question 2 – Utilization of Talent
– AET Senior Design Students.
5965
757682 86
0
20
40
60
80
100
Fall '11 Single
Survey (N=34)
Spring '12 Start
(N=34)
Spring '12 End
(N=30)Stu
den
ts W
ho
Rat
ed Q
3 be
twee
n t
he
Sco
re o
f 5-
7 (%
)
Student Rating Pattern for Question 2 -
Utilization of Talent - AET Senior Design
Students
Students with MET 325 Knowledge
Students without MET 325 Knowledge
MET 325 Project Management

Team Effectiveness and Project Management in a Student Team Environment 36
It is clear from Figure 14 that during all three survey trials AET Senior Design students
with formal PM knowledge felt their team’s talent pool was not fully utilized. In contrast,
AET Senior Design students without formal PM knowledge felt their team’s performance
in this survey category was satisfactory.
Figure 15. Q2 – Utilization of Talents.
Major Finding 6 – MET Senior Design students with formal PM knowledge had strong,
consistent ratings in the survey category of Goals and Objectives.
According to Somers’s Dyx results presented in Figure 6, association between PM
and survey category of Goals and Objectives rose 18.97 percentage points during Trial 2
for MET Senior Design students. This might indicate that a structured project
management approach could have helped MET Senior Design students with formal PM
knowledge achieve a 92% rating level during survey Trial 2.
It should also be noted that the sample size of MET Senior Design students with
formal PM knowledge was low during all three trials18
(13-16). As a result, inference
from this dataset should not be considered conclusive. Nevertheless, both MET and AET
Senior Design students with formal PM knowledge had good ratings in the category of
18
There were at least two respondents during all three survey trials in the MET
Senior Design group who had not taken MET 325. This further reduced the sample size
of MET Senior Design students with formal PM knowledge.

Team Effectiveness and Project Management in a Student Team Environment 37
Goals and Objectives. Figure 16 shown below highlights the percentage ratings discussed
above.
Figure 16. Student Rating Pattern for Question 1 – Goals and
Objectives – MET Senior Design Students.
Major Finding 7 – Ratings for the Survey Category of Problem Solving increased
progressively for MET Senior Design Students with formal PM knowledge.
Figure 17. Student Rating Pattern for Question 7 - Problem Solving –
MET Senior Design Students.
88 92
77
0
20
40
60
80
100
Fall '11 Single Survey
(N=16)
Spring '12 Start
(N=13)
Spring '12 End
(N=13)
Stu
den
ts W
ho
Rat
ed Q
1 be
twee
n t
he
Sco
res
of 5
-7 (
%)
Student Rating Pattern for Question 1 - Goals and
Objectives - MET Senior Design Students
Students with MET 325 Knowledge
MET 325 Project Management
N Number of Students with MET 325 Knowledge
6977
85
0
20
40
60
80
100
Fall '11 Single Survey
(N=16)
Spring '12 Start
(N=13)
Spring '12 End
(N=13)
Stu
den
ts W
ho
Rat
ed Q
1 be
twee
n t
he
Sco
res
of 5
-7 (
%)
Student Rating Pattern for Question 7 - Problem
Solving - MET Senior Design Students
Students with MET 325 Knowledge
MET 325 Project Management
N Number of Students with MET 325 Knowledge

Team Effectiveness and Project Management in a Student Team Environment 38
Rating for survey category of Problem Solving rose 8 percentage points during
both Trial 1 and Trial 2 (Figure17) for MET Senior Design students with formal PM
knowledge. A moderate association was detected between project management and the
survey category of Problem Solving during Trial 2 for MET Senior Design students with
formal PM knowledge (Refer to Figure 6).
Figure 6 shows that Somers’ Dyx value for the survey category of Problem
Solving rose 45.67 percentage points during Trial 2. The teams for MET Senior Design
projects are typically small (3- 4 members). This combined with the fact that most MET
Senior Design students have formal project management knowledge might have made the
task of problem solving easier for MET Senior Design students.

Team Effectiveness and Project Management in a Student Team Environment 39
Discussion
The discussion section of this research paper will briefly restate the problem,
methods and procedures used for data collection, and the major findings. Limitations to
the findings of this study will also be stated. Finally, a comprehensive list of
recommendations for the AMET faculty and recommendations for future research will be
provided.
Restatement of the Problem
Over the years, AET Senior Design projects at MSU – Mankato have become
more complex and technology intensive. The number of members in an AET Senior
Design team has also grown, with each team having a minimum of at least four members.
These factors suggest there might be a need for AET students to acquire formal project
management knowledge to perform well in Senior Design courses (Senior Design Project
I and Senior Design Project II).
Since AET students are not required to take a project management course to
complete the program, the researcher felt it was important to assess if AET students were
in need of a project management course. To answer this question, the researcher
formulated a research methodology, briefly described in the Methods and Procedures
segment below.
Methods and Procedures
Data collection for this research study was done by conducting surveys. Survey
instruments developed for this research study (Survey Instrument – I and Survey
Instrument – II) were based on the “Team Effectiveness Critique” written by Dr. Susan

Team Effectiveness and Project Management in a Student Team Environment 40
Trimble. The “Team Effectiveness Critique” contains nine questions which directly relate
to team effectiveness and project management. These nine questions (also known as the
nine survey categories) were used in the final survey instruments designed for this
research study.
Students enrolled in the AET and MET Senior Design courses, and AET Junior
Design courses were surveyed to collect information regarding the effect of project
management on the nine survey categories. The nine survey categories are as follows:
Goals and Objectives, Utilization of Talents, Trust and Conflict, Leadership, Team
Procedures, Communication, Problem Solving, Creativity, and Evaluation.
The AET Junior Design group was surveyed twice, once during the start of the
Spring ’12 semester and once during the end of the Spring ’12 semester. AET and MET
Senior Design groups were surveyed thrice. Once during the Fall ’11 semester (Senior
Design Project I) and twice during the Spring ’12 semester (Senior Design Project II).
The surveys for AET Junior Design and MET Senior Design students were conducted in-
class. On the other hand, surveys for AET Senior Design students were conducted during
individual team meetings19
. Next, a summary of the major findings of this research study
will be provided.
19
Students enrolled in AET Senior Design Project I and Senior Design Project II
courses formally meet in a classroom only for presentations and project updates. The
instructors of these courses had requested these student gatherings be devoted to
presentations and project updates only. As a result, the researcher surveyed AET Senior
Design students during individual team meetings.

Team Effectiveness and Project Management in a Student Team Environment 41
Summary of Major Findings
Major Finding 1 – AET Senior Design students with formal project management
knowledge had good ratings for the survey category of Trust and Conflict
Major Finding 2 – AET Senior Design students with formal PM knowledge had
good ratings for the survey category of Creativity
Major Finding 3 – AET Senior Design students with formal PM knowledge had
strong, consistent ratings in the survey category of Goals and Objectives during
all three survey trials
Major Finding 4 – AET Senior Design students with prior formal PM knowledge
demonstrated good consistent ratings in the survey category of Communication
Major Finding 5 – AET Senior Design students with formal PM knowledge had
lower ratings during all three trials for the survey category of Utilization of Talent
compared to AET Senior Design students without formal PM knowledge
Major Finding 6 – MET Senior Design students with formal PM knowledge had
strong, consistent ratings in the survey category of Goals and Objectives
Major Finding 7 – Ratings for the Survey Category of Problem Solving increased
progressively for MET Senior Design Students with formal PM knowledge
Limitations to the Findings of this Research Study
The five survey sample groups had unequal sample sizes. Further, only the
AET Senior Design group (Senior Design I and Senior Design II) had
thirty or more valid respondents during the three survey trials. Sample size

Team Effectiveness and Project Management in a Student Team Environment 42
for the AET Junior Design and the MET Senior Design group was rather
small, less than 20 valid respondents
Five AET Senior Design teams were surveyed during Trial 1, but an
additional team was surveyed during Trial 2 and Trial 3. During Trial 1,
the researcher was under the assumption that only five AET Senior Design
teams were in existence
AET Senior Design groups were surveyed during team meetings for all
three survey trials, but the AET Junior Design and MET Senior Design
groups were surveyed in-class
Some AET Senior Design teams were surveyed before the team meeting
and some teams were surveyed after the team meeting. Perceptions of
teams surveyed prior to the team meeting can be different from those
surveyed after the team meeting
Next, recommendations based on the findings of this research study will be discussed.
Recommendations for the AMET Department Faculty
Based on the findings of this research it is recommended that the AMET faculty
modify AET Junior Design and AET Senior Design (Senior Design Project I and Senior
Design Project II) courses. At present, the AET Junior Design course (AET 387) is
offered as a half semester course. AET students are expected to form teams and select a
research topic at the end of the Junior Design course. The AET Junior Design course
should be converted into a full semester course. The second half of the course should be
focused on the following project management concepts:

Team Effectiveness and Project Management in a Student Team Environment 43
Project Definition – Students should be taught to properly identify the
scope, goals and objectives, and expectations of a project
Project Scheduling – Students should be trained in scheduling project
activities using a Gantt chart
Project Analysis – Useful tools like the Critical Path Method (CPM), and
Program Evaluation and Review Technique (PERT) which help in
analyzing a project should be taught
AET Junior Design students can internalize some of these concepts if they are asked to
do related activities in the form of class assignments (Pimmel, 2001, p. 413). Therefore,
after the abovementioned project management concepts have been taught, student teams
should create a plan for their capstone project. Next, students should be asked to evaluate
other teams’ project plans. In doing so, students will gain additional communication skills
and useful suggestions regarding their team’s project plan. It is also recommended that
team leaders of AET Senior Design teams give presentations to AET Junior Design
students on some of the lessons they learned. Recommendations for AET Senior Design
courses will be discussed in the following paragraph.
During survey Trial 3 (final phase of an AET Senior Design project), at least fifty
seven percent of AET Senior Design students felt their team needed improvement in the
survey category of Communication (Figure 9). To help AET Senior Design students
communicate more effectively the AMET faculty should incorporate a formalized
approach to team meetings. The following ideas should be incorporated in the weekly
meetings of AET Senior Design teams:

Team Effectiveness and Project Management in a Student Team Environment 44
During AET Senior Design Project I, project teams should be asked to
design a suitable template for a team meeting agenda. This will help in
incorporating a structured approach towards team meetings
Responsibility of creating an agenda and conducting team meeting should
be rotated weekly among team members
The agenda should be submitted to the faculty adviser at least a day before
each team meeting
In the near future, a formal project management course should be incorporated into the
AET curriculum. Prior to that, experimentation can be done at the Junior Design level.
Recommendations for Further Research
This research study was specifically designed to assess if students of the AET
program needed a project management course. There are additional research topics
related to this research study that need further attention. These additional topics are as
follows:
Ratings for survey categories of Leadership and Team Procedures had
considerable variability for both AET and MET Senior Design students
during all three survey trials (Appendix M). But, these categories were
not statistically significant (Table 4 and Table 5). Nevertheless, research
can be done to identify why these two survey categories had variability
for the AET and MET Senior Design groups
AET Senior Design students with formal PM knowledge had consistently
lower ratings in the survey category of Utilization of Talent compared to

Team Effectiveness and Project Management in a Student Team Environment 45
students without formal PM knowledge. Further research should be
conducted to explain this distinct difference of opinion
If this research was to be repeated, it is recommended that the same group
of students be surveyed from the Junior Design to the Senior Design
courses. Owing to schedule challenges at the time of this research study, it
was not possible to survey the same group of students

Team Effectiveness and Project Management in a Student Team Environment 46
References
AET Department (n.d.). AET Curriculum. Retrieved from
http://www.mnsu.edu/supersite/academics/bulletins/undergraduate/2012-
2013/autoengtech.pdf.
Creswell, J. W. (2003). Research design: qualitative, quantitative, and mixed method
approaches. (2. ed.). Thousand Oaks, Calif.: Sage Publications.
De Meuse, K. P. (n.d.). Driving Team Effectiveness. Retrieved from
http://www.lominger.com/pdf/teamswhitepaper080409.pdf.
Fink, A. (2009). How to conduct surveys: a step-by-step guide (4th ed.). Los Angeles:
SAGE.
Fox, W. (2002). Social Statistics: A Text Using MicroCase (4th ed.). Belmont, Calif.:
Wadsworth.
IRB (n.d.). Information for Investigators Intending to Involve Human Participants in
Research. Retrieved from http://grad.mnsu.edu/irb/irbinfo2012.pdf.
Kapp, E. (2009). Improving Student Teamwork in a Collaborative Project-Based Course.
College Teaching, 57(3), 139-143. Retrieved from EBSCOhost.
Karau, S., & Williams, K. (1993). Social Loafing: A Meta-Analytical Review and
Theoretical. Journal of Personality and Social Psychology, 65(4), 681-706.
Katzenbach, J. R., & Smith, D. K. (2005). The Discipline of Teams. (cover story).
Harvard Business Review, 83(7/8), 162-171. Retrieved from EBSCOhost
Kerzner, H. (2009). Project management: a systems approach to planning, scheduling,
and controlling. 10th ed. Hoboken, N.J.: John Wiley & Sons.

Team Effectiveness and Project Management in a Student Team Environment 47
Kliem, R. (2004). Leading high performance projects. Boca Raton, FL: J. Ross
Publishing.
Levin, J., Fox, J. A., & Forde, D. R. (2010). Elementary statistics in social research (11th
ed.). Boston: Allyn & Bacon Pearson.
Massie, D. D., & Massie, C. A. (2006). Framework for Organization and Control of
Capstone Design/Build Projects. Journal Of STEM Education: Innovations &
Research, 7(3/4), 36-43.
MET Department (n.d.). MET Curriculum. Retrieved from
http://www.mnsu.edu/supersite/academics/bulletins/undergraduate/2012-
2013/manengtech.pdf.
Moor, S.S., & Drake, B.D. (2001). Addressing common problems in engineering design
projects: a project management approach. Journal of Engineering Education, 90,
389-395.
Pimmel, R. (2001). Cooperative Learning Instructional Activities in a Capstone Design
Course. Journal Of Engineering Education, 90(3), 413-421.
Powers, L., & Summers, J. (2009). Integrating graduate design coaches in undergraduate
design project teams. International Journal of Mechanical Engineering
Education, 37(1), 3-20. Retrieved from Academic Search Premier database.
Rea, L. M., & Parker, R. A. (1997). Designing and conducting survey research: a
comprehensive guide (2nd ed.). San Francisco: Jossey-Bass Publishers.

Team Effectiveness and Project Management in a Student Team Environment 48
Shenhar, A., & Dvir, D. (2007). Project Management Research— the Challenge and
Opportunity. Project Management Journal, 38(2), 93-9. Retrieved from OmniFile
Full Text Mega database.
Thamhain, H. (2004). Leading Technology-Based Project Teams. Engineering
Management Journal, 16(2), 35-42. Retrieved from Academic Search Premier
database.
Todd, R., Magleby, S., Sorensen, C., Swan, B., & Anthony, D. (1995). A Survey of
Capstone Engineering Courses in North America. Journal of Engineering
Education, 85(2), 165-174. Retrieved October 11, 2011, from
http://www.jee.org/1995/april/29.pdf.
Trimble, S., & Rottier, J. (1998). Assessing Team Performance.
Triola, M. F. (2004). Elementary Statistics(9th ed.). Boston: Pearson/Addison-Wesley.
Walker, C., & Angelo, T. (1998). A Collective Effort Classroom Assessment Technique:
Promoting High Performance in Student Teams. New Directions for Teaching and
Learning, (75), 101-12. Retrieved from EBSCOhost.
Van Rooij, S. (2010). Project management in instructional design: ADDIE is not enough.
British Journal of Educational Technology, 41(5), 852-864. doi:10.1111/j.1467-
8535.2009.00982.x.

Team Effectiveness and Project Management in a Student Team Environment 49
Appendix A
Figure A1. The Team Effectiveness Critique (Page 1) – By Susan Trimble.

Team Effectiveness and Project Management in a Student Team Environment 50
Appendix A
Figure A2. The Team Effectiveness Critique (Page 2) – By Susan Trimble.

Team Effectiveness and Project Management in a Student Team Environment 51
Appendix A
Figure A3. The CECAT Instrument – By Charles Walker and Thomas Angelo.

Team Effectiveness and Project Management in a Student Team Environment 52
Appendix B
1. Goals and Objectives
There is a lack of commonly
understood goals and objectives.
2. Utilization of Talents
All team members’ talents are not
recognized and/or utilized.
3. Trust and Conflict
There is little trust among members,
and conflict is evident.
4. Leadership
One person dominates, and
leadership roles are not carried
out or shared.
5. Team Procedures
There is a lack of procedures, and
time is wasted in team meetings
and other team activities.
Figure B1. The Nine Survey Questions Derived from the Team Effectiveness Critique – Page 1.
1 2 3 4 5 6 7
There is a high degree of trust
among members, and conflict is
resolved openly.
1 2 3 4 5 6 7
1 2 3 4 5 6 7
1 2 3 4 5 6 7
1 2 3 4 5 6 7
There are effective procedures to guide
team functioning; team members support
these procedures and regulate themselves.
Team members’ talents are fully
recognized and utilized.
Team members understand and
agree on team goals and objectives.
There is full participation in leadership;
leadership roles are shared by
members.

Team Effectiveness and Project Management in a Student Team Environment 53
Appendix B
6. Interpersonal Communication
Communication among members
is closed and guarded.
7. Problem Solving/Decision Making
Decisions are made in a haphazard
fashion leaving some members feeling
left out.
8. Experimentation/Creativity
The team is rigid and does
not experiment with how
things are done.
9. Evaluation
The group never evaluates its
functioning or process.
Figure B2. The Nine Survey Questions Derived from the Team Effectiveness Critique – Page 2.
The team has well-established and
agreed upon approaches to problem
solving and decision making wherein
everyone participates.
1 2 3 4 5 6 7
1 2 3 4 5 6 7
1 2 3 4 5 6 7
1 2 3 4 5 6 7
Communication among members is
open, participative.
The team experiments with different
ways of doing things and is creative
in its approach.
The group often evaluates its
functioning and process.

Team Effectiveness and Project Management in a Student Team Environment 54
Appendix C
Figure C1. Survey Instrument I – Page 1.

Team Effectiveness and Project Management in a Student Team Environment 55
Appendix C
Figure C2. Survey Instrument I – Page 2.

Team Effectiveness and Project Management in a Student Team Environment 56
Appendix D
Figure D1. Survey Instrument II – Page 1.

Team Effectiveness and Project Management in a Student Team Environment 57
Appendix D
Figure D2. Survey Instrument II – Page 2.

Team Effectiveness and Project Management in a Student Team Environment 58
Appendix D
Figure D3. Survey Instrument II – Page 3.

Team Effectiveness and Project Management in a Student Team Environment 59
Appendix E
Figure E1. IRB Approval for Survey Instrument – I.

Team Effectiveness and Project Management in a Student Team Environment 60
Appendix F
Figure F1. IRB Approval for Survey Instrument – II.

Team Effectiveness and Project Management in a Student Team Environment 61
Appendix G
Figure G1. Consent form for Survey Instrument I and II.

Team Effectiveness and Project Management in a Student Team Environment 62
Appendix H
Figure H1. Normal probability plot of Question 1 – Goals and Objectives. AET
Senior Design students – Fall ’11 Single Survey.
Figure H2. Normal probability plot of Question 2 – Utilization of Talents. AET
Senior Design students – Fall ’11 Single Survey.

Team Effectiveness and Project Management in a Student Team Environment 63
Appendix H
Figure H3. Normal probability plot of Question 3 – Trust and Conflict. AET
Senior Design students – Fall ’11 Single Survey.
Figure H4. Normal probability plot of Question 4 – Leadership. AET Senior
Design students – Fall ’11 Single Survey.

Team Effectiveness and Project Management in a Student Team Environment 64
Appendix H
Figure H5. Normal probability plot of Question 5 – Team Procedures. AET
Senior Design students – Fall ’11 Single Survey.
Figure H6. Normal probability plot of Question 6 – Communication. AET
Senior Design students – Fall ’11 Single Survey.

Team Effectiveness and Project Management in a Student Team Environment 65
Appendix H
Figure H7. Normal probability plot of Question 7 – Problem Solving. AET
Senior Design students – Fall ’11 Single Survey.
Figure H8. Normal probability plot of Question 8 – Creativity. AET Senior
Design students – Fall ’11 Single Survey.

Team Effectiveness and Project Management in a Student Team Environment 66
Appendix H
Figure H9. Normal probability plot of Question 9 – Evaluation. AET Senior
Design students – Fall ’11 Single Survey.

Team Effectiveness and Project Management in a Student Team Environment 67
Appendix H
Figure H10. Normal probability plot of Question 1 – Goals and Objectives. AET
Senior Design students – Spring ‘12 - Start.
Figure H11. Normal probability plot of Question 2 – Utilization of Talents. AET
Senior Design students – Spring ‘12 - Start.

Team Effectiveness and Project Management in a Student Team Environment 68
Appendix H
Figure H12. Normal probability plot of Question 3 – Trust and Conflict. AET
Senior Design students – Spring ‘12 - Start.
Figure H13. Normal probability plot of Question 4 – Leadership. AET Senior
Design students – Spring ‘12 - Start.

Team Effectiveness and Project Management in a Student Team Environment 69
Appendix H
Figure H14. Normal probability plot of Question 5 – Team Procedures. AET
Senior Design students – Spring ‘12 - Start.
Figure H15. Normal probability plot of Question 7 – Problem Solving. AET
Senior Design students – Spring ‘12 - Start.

Team Effectiveness and Project Management in a Student Team Environment 70
Appendix H
Figure H16. Normal probability plot of Question 7 – Problem Solving. AET
Senior Design students – Spring ‘12 - Start.
Figure H17. Normal probability plot of Question 8 – Creativity. AET Senior
Design students – Spring ‘12 - Start.

Team Effectiveness and Project Management in a Student Team Environment 71
Appendix H
Figure H18. Normal probability plot of Question 9 – Evaluation. AET Senior
Design students – Spring ‘12 - Start.

Team Effectiveness and Project Management in a Student Team Environment 72
Appendix H
Figure H19. Normal probability plot of Question 1 – Goals and Objectives. AET
Senior Design students – Spring ‘12 - End.
Figure H20. Normal probability plot of Question 2 – Utilization of Talents. AET
Senior Design students – Spring ‘12 - End.

Team Effectiveness and Project Management in a Student Team Environment 73
Appendix H
Figure H21. Normal probability plot of Question 3 – Trust and Conflict. AET
Senior Design students – Spring ‘12 - End.
Figure H22. Normal probability plot of Question 4 – Leadership. AET Senior
Design students – Spring ‘12 - End.

Team Effectiveness and Project Management in a Student Team Environment 74
Appendix H
Figure H23. Normal probability plot of Question 5 – Team Procedures. AET
Senior Design students – Spring ‘12 - End.
Figure H24. Normal probability plot of Question 6 – Communication. AET
Senior Design students – Spring ‘12 - End.

Team Effectiveness and Project Management in a Student Team Environment 75
Appendix H
Figure H25. Normal probability plot of Question 7 – Problem Solving. AET
Senior Design students – Spring ‘12 - End.
Figure H26. Normal probability plot of Question 8 – Creativity. AET Senior
Design students – Spring ‘12 - End.

Team Effectiveness and Project Management in a Student Team Environment 76
Appendix H
Figure H27. Normal probability plot of Question 9 – Evaluation. AET Senior
Design students – Spring ‘12 - End.

Team Effectiveness and Project Management in a Student Team Environment 77
Appendix H
Figure H28. Normal probability plot of Question 1 – Goals and Objectives. MET
Senior Design students – Fall ’11 Single Survey.
Figure H29. Normal probability plot of Question 2 – Utilization of Talents. MET
Senior Design students – Fall ’11 Single Survey.

Team Effectiveness and Project Management in a Student Team Environment 78
Appendix H
Figure H30. Normal probability plot of Question 3 – Trust and Conflict. MET
Senior Design students – Fall ’11 Single Survey.
Figure H31. Normal probability plot of Question 4 – Leadership. MET Senior
Design students – Fall ’11 Single Survey.

Team Effectiveness and Project Management in a Student Team Environment 79
Appendix H
Figure H32. Normal probability plot of Question 5 – Team Procedures. MET
Senior Design students – Fall ’11 Single Survey.
Figure H33. Normal probability plot of Question 6 – Communication. MET
Senior Design students – Fall ’11 Single Survey.

Team Effectiveness and Project Management in a Student Team Environment 80
Appendix H
Figure H34. Normal probability plot of Question 7 – Problem Solving. MET
Senior Design students – Fall ’11 Single Survey.
Figure H35. Normal probability plot of Question 8 – Creativity. MET Senior
Design students – Fall ’11 Single Survey.

Team Effectiveness and Project Management in a Student Team Environment 81
Appendix H
Figure H36. Normal probability plot of Question 9 – Evaluation. MET Senior
Design students – Fall ’11 Single Survey.

Team Effectiveness and Project Management in a Student Team Environment 82
Appendix H
Figure H37. Normal probability plot of Question 1 – Goals and Objectives. MET
Senior Design students – Spring ‘12 - Start.
Figure H47. Normal probability plot of Question 2 – Utilization of Talents. MET
Senior Design students – Spring ‘12 - Start.

Team Effectiveness and Project Management in a Student Team Environment 83
Appendix H
Figure H39. Normal probability plot of Question 3 – Trust and Conflict. MET
Senior Design students – Spring ‘12 - Start.
Figure H40. Normal probability plot of Question 4 – Leadership. MET Senior
Design students – Spring ‘12 - Start.

Team Effectiveness and Project Management in a Student Team Environment 84
Appendix H
Figure H41. Normal probability plot of Question 5 – Team Procedures. MET
Senior Design students – Spring ‘12 - Start.
Figure H42. Normal probability plot of Question 6 – Communication. MET
Senior Design students – Spring ‘12 - Start.

Team Effectiveness and Project Management in a Student Team Environment 85
Appendix H
Figure H43. Normal probability plot of Question 7 – Problem Solving. MET
Senior Design students – Spring ‘12 - Start.
Figure H44. Normal probability plot of Question 8 – Creativity. MET Senior
Design students – Spring ‘12 - Start.

Team Effectiveness and Project Management in a Student Team Environment 86
Appendix H
Figure H45. Normal probability plot of Question 9 – Evaluation. MET Senior
Design students – Spring ‘12 - Start.

Team Effectiveness and Project Management in a Student Team Environment 87
Appendix H
Figure H46. Normal probability plot of Question 1 – Goals and Objectives. MET
Senior Design students – Spring ‘12 - End.
Figure H47. Normal probability plot of Question 2 – Utilization of Talents. MET
Senior Design students – Spring ‘12 - End.

Team Effectiveness and Project Management in a Student Team Environment 88
Appendix H
Figure H48. Normal probability plot of Question 3 – Trust and Conflict. MET
Senior Design students – Spring ‘12 - End.
Figure H49. Normal probability plot of Question 4 – Leadership. MET Senior
Design students – Spring ‘12 - End.

Team Effectiveness and Project Management in a Student Team Environment 89
Appendix H
Figure H50. Normal probability plot of Question 5 – Team Procedures. MET
Senior Design students – Spring ‘12 - End.
Figure H51. Normal probability plot of Question 6 – Communication. MET
Senior Design students – Spring ‘12 - End.

Team Effectiveness and Project Management in a Student Team Environment 90
Appendix H
Figure H52. Normal probability plot of Question 7 – Problem Solving. MET
Senior Design students – Spring ‘12 - End.
Figure H53. Normal probability plot of Question 8 – Creativity. MET Senior
Design students – Spring ‘12 - End.

Team Effectiveness and Project Management in a Student Team Environment 91
Appendix H
Figure H54. Normal probability plot of Question 9 – Evaluation. MET Senior
Design students – Spring ‘12 - End.

Team Effectiveness and Project Management in a Student Team Environment 92
Appendix H
Figure H55. Normal probability plot of Question 1 – Goals and Objectives. AET
Junior Design students – Spring ‘12 - Start.
Figure H56. Normal probability plot of Question 2 – Utilization of Talents. AET
Junior Design students – Spring ‘12 - Start.

Team Effectiveness and Project Management in a Student Team Environment 93
Appendix H
Figure H57. Normal probability plot of Question 3 – Trust and Conflict. AET
Junior Design students – Spring ‘12 - Start.
Figure H58. Normal probability plot of Question 4 – Leadership. AET Junior
Design students – Spring ‘12 - Start.

Team Effectiveness and Project Management in a Student Team Environment 94
Appendix H
Figure H59. Normal probability plot of Question 5 – Team Procedures. AET
Junior Design students – Spring ‘12 - Start.
Figure H60. Normal probability plot of Question 6 – Communication. AET
Junior Design students – Spring ‘12 - Start.

Team Effectiveness and Project Management in a Student Team Environment 95
Appendix H
Figure H61. Normal probability plot of Question 7 – Problem Solving. AET
Junior Design students – Spring ‘12 - Start.
Figure H62. Normal probability plot of Question 8 – Creativity. AET Junior
Design students – Spring ‘12 - Start.

Team Effectiveness and Project Management in a Student Team Environment 96
Appendix H
Figure H63. Normal probability plot of Question 9 – Evaluation. AET Junior
Design students – Spring ‘12 - Start.

Team Effectiveness and Project Management in a Student Team Environment 97
Appendix H
Figure H64. Normal probability plot of Question 1 – Goals and Objectives. AET
Junior Design students – Spring ‘12 - End.
Figure H65. Normal probability plot of Question 2 – Utilization of Talents. AET
Junior Design students – Spring ‘12 - End.

Team Effectiveness and Project Management in a Student Team Environment 98
Appendix H
Figure H66. Normal probability plot of Question 3 – Trust and Conflict. AET
Junior Design students – Spring ‘12 - End.
Figure H67. Normal probability plot of Question 4 – Leadership. AET Junior
Design students – Spring ‘12 - End.

Team Effectiveness and Project Management in a Student Team Environment 99
Appendix H
Figure H68. Normal probability plot of Question 5 – Team Procedures. AET
Junior Design students – Spring ‘12 - End.
Figure H69. Normal probability plot of Question 6 – Communication. AET
Junior Design students – Spring ‘12 - End.

Team Effectiveness and Project Management in a Student Team Environment 100
Appendix H
Figure H70. Normal probability plot of Question 7 – Problem Solving. AET
Junior Design students – Spring ‘12 - End.
Figure H71. Normal probability plot of Question 8 – Creativity. AET Junior
Design students – Spring ‘12 - End.

Team Effectiveness and Project Management in a Student Team Environment 101
Appendix H
Figure H72. Normal probability plot of Question 9 – Evaluation. AET Junior
Design students – Spring ‘12 - End.

Team Effectiveness and Project Management in a Student Team Environment 102
Appendix I
Table I1
One Proportion Hypothesis Test of Statistical Significance
AET Senior Design Students – Fall ’11 Single Survey (H0 ≤ 0.50 | H1 > 0.50 | α = 0.05)
Variablea X N Sample p
Exact
p-
valueb
Reject
Null
Significant
Q1 - Goals and Objectives 29 34 0.853 0 Yes Yes
Q2 - Utilization of Talent 23 34 0.676 0.029 Yes Yes
Q3 - Trust and Conflict 28 34 0.824 0 Yes Yes
Q4 - Leadership 19 34 0.559 0.304 No No
Q5 - Team Procedures 18 34 0.529 0.432 No No
Q6 - Communication 24 34 0.706 0.012 Yes Yes
Q7 - Problem Solving 24 34 0.706 0.012 Yes Yes
Q8 - Creativity 23 34 0.676 0.029 Yes Yes
Q9 - Evaluation 22 34 0.647 0.061 No No Note. H0 = Proportion of students who rated the survey question between the scores of 5-7 is less
than or equal to 50 %. H1 = Proportion of students who rated the survey question between the
scores of 5-7 is greater than 50 %. Q = Question. aThis column represents the 9 survey questions.
bIf the exact p-value was less than the α of 0.05
then H0 was rejected and the variable was considered significant, but if the exact p-value was
more than the α of 0.05 then H0 was not rejected and the variable was not considered significant.

Team Effectiveness and Project Management in a Student Team Environment 103
Appendix I
Table I2
One Proportion Hypothesis Test of Statistical Significance
AET Senior Design Students – Fall ’11 Single Survey (H0 ≤ 0.48 | H1 > 0.48 | α = 0.05)
Variablea X N Sample p
Exact
p-
valueb
Reject
Null
Significant
Q1 - Goals and Objectives 29 34 0.853 0 Yes Yes
Q2 - Utilization of Talent 23 34 0.676 0.017 Yes Yes
Q3 - Trust and Conflict 28 34 0.824 0 Yes Yes
Q4 - Leadership 19 34 0.559 0.227 No No
Q5 - Team Procedures 18 34 0.529 0.342 No No
Q6 - Communication 24 34 0.706 0.006 Yes Yes
Q7 - Problem Solving 24 34 0.706 0.006 Yes Yes
Q8 - Creativity 23 34 0.676 0.017 Yes Yes
Q9 - Evaluation 22 34 0.647 0.037 Yes Yes Note. H0 = Proportion of students who rated the survey question between the scores of 5-7 is less
than or equal to 48 %. H1 = Proportion of students who rated the survey question between the
scores of 5-7 is greater than 48 %. Q = Question. aThis column represents the 9 survey questions.
bIf the exact p-value was less than the α of 0.05
then H0 was rejected and the variable was considered significant, but if the exact p-value was
more than the α of 0.05 then H0 was not rejected and the variable was not considered significant.

Team Effectiveness and Project Management in a Student Team Environment 104
Appendix I
Table I3
One Proportion Hypothesis Test of Statistical Significance
AET Senior Design Students – Fall ’11 Single Survey (H0 ≤ 0.46 | H1 > 0.46 | α = 0.05)
Variablea X N Sample p
Exact
p-
valueb
Reject
Null
Significant
Q1 - Goals and Objectives 29 34 0.853 0 Yes Yes
Q2 - Utilization of Talent 23 34 0.676 0.009 Yes Yes
Q3 - Trust and Conflict 28 34 0.824 0 Yes Yes
Q4 - Leadership 19 34 0.559 0.163 No No
Q5 - Team Procedures 18 34 0.529 0.26 No No
Q6 - Communication 24 34 0.706 0.003 Yes Yes
Q7 - Problem Solving 24 34 0.706 0.003 Yes Yes
Q8 - Creativity 23 34 0.676 0.009 Yes Yes
Q9 - Evaluation 22 34 0.647 0.022 Yes Yes Note. H0 = Proportion of students who rated the survey question between the scores of 5-7 is less
than or equal to 46 %. H1 = Proportion of students who rated the survey question between the
scores of 5-7 is greater than 46 %. Q = Question. aThis column represents the 9 survey questions.
bIf the exact p-value was less than the α of 0.05
then H0 was rejected and the variable was considered significant, but if the exact p-value was
more than the α of 0.05 then H0 was not rejected and the variable was not considered significant.

Team Effectiveness and Project Management in a Student Team Environment 105
Appendix I
Table I4
One Proportion Hypothesis Test of Statistical Significance
AET Senior Design Students – Spring ‘12 Start (H0 ≤ 0.50 | H1 > 0.50 | α = 0.05)
Variablea X N Sample p
Exact
p-
valueb
Reject
Null
Significant
Q1 - Goals and Objectives 30 34 0.882 0.000 Yes Yes
Q2 - Utilization of Talent 25 34 0.735 0.005 Yes Yes
Q3 - Trust and Conflict 27 34 0.794 0.000 Yes Yes
Q4 - Leadership 17 34 0.500 0.568 No No
Q5 - Team Procedures 24 34 0.706 0.012 Yes Yes
Q6 - Communication 23 34 0.676 0.029 Yes Yes
Q7 - Problem Solving 25 34 0.735 0.005 Yes Yes
Q8 - Creativity 25 34 0.735 0.005 Yes Yes
Q9 - Evaluation 23 34 0.676 0.029 Yes Yes Note. H0 = Proportion of students who rated the survey question between the scores of 5-7 is less
than or equal to 50 %. H1 = Proportion of students who rated the survey question between the
scores of 5-7 is greater than 50 %. Q = Question. aThis column represents the 9 survey questions.
bIf the exact p-value was less than the α of 0.05
then H0 was rejected and the variable was considered significant, but if the exact p-value was
more than the α of 0.05 then H0 was not rejected and the variable was not considered significant.

Team Effectiveness and Project Management in a Student Team Environment 106
Appendix I
Table I5
One Proportion Hypothesis Test of Statistical Significance
AET Senior Design Students – Spring ‘12 Start (H0 ≤ 0.48 | H1 > 0.48 | α = 0.05)
Variablea X N Sample p
Exact
p-
valueb
Reject
Null
Significant
Q1 - Goals and Objectives 30 34 0.882 0.000 Yes Yes
Q2 - Utilization of Talent 25 34 0.735 0.002 Yes Yes
Q3 - Trust and Conflict 27 34 0.794 0.000 Yes Yes
Q4 - Leadership 17 34 0.500 0.475 No No
Q5 - Team Procedures 24 34 0.706 0.006 Yes Yes
Q6 - Communication 23 34 0.676 0.017 Yes Yes
Q7 - Problem Solving 25 34 0.735 0.002 Yes Yes
Q8 - Creativity 25 34 0.735 0.002 Yes Yes
Q9 - Evaluation 23 34 0.676 0.017 Yes Yes Note. H0 = Proportion of students who rated the survey question between the scores of 5-7 is less
than or equal to 48 %. H1 = Proportion of students who rated the survey question between the
scores of 5-7 is greater than 48 %. Q = Question. aThis column represents the 9 survey questions.
bIf the exact p-value was less than the α of 0.05
then H0 was rejected and the variable was considered significant, but if the exact p-value was
more than the α of 0.05 then H0 was not rejected and the variable was not considered significant.

Team Effectiveness and Project Management in a Student Team Environment 107
Appendix I
Table I6
One Proportion Hypothesis Test of Statistical Significance
AET Senior Design Students – Spring ‘12 Start (H0 ≤ 0.46 | H1 > 0.46 | α = 0.05)
Variablea X N Sample p
Exact
p-
valueb
Reject
Null
Significant
Q1 - Goals and Objectives 30 34 0.882 0.000 Yes Yes
Q2 - Utilization of Talent 25 34 0.735 0.001 Yes Yes
Q3 - Trust and Conflict 27 34 0.794 0.000 Yes Yes
Q4 - Leadership 17 34 0.500 0.382 No No
Q5 - Team Procedures 24 34 0.706 0.003 Yes Yes
Q6 - Communication 23 34 0.676 0.009 Yes Yes
Q7 - Problem Solving 25 34 0.735 0.001 Yes Yes
Q8 - Creativity 25 34 0.735 0.001 Yes Yes
Q9 - Evaluation 23 34 0.676 0.009 Yes Yes Note. H0 = Proportion of students who rated the survey question between the scores of 5-7 is less
than or equal to 46 %. H1 = Proportion of students who rated the survey question between the
scores of 5-7 is greater than 46 %. Q = Question. aThis column represents the 9 survey questions.
bIf the exact p-value was less than the α of 0.05
then H0 was rejected and the variable was considered significant, but if the exact p-value was
more than the α of 0.05 then H0 was not rejected and the variable was not considered significant.

Team Effectiveness and Project Management in a Student Team Environment 108
Appendix I
Table I7
One Proportion Hypothesis Test of Statistical Significance
AET Senior Design Students – Spring ‘12 End (H0 ≤ 0.50 | H1 > 0.50 | α = 0.05)
Variablea X N Sample p
Exact
p-
valueb
Reject
Null
Significant
Q1 - Goals and Objectives 26 30 0.867 0.000 Yes Yes
Q2 - Utilization of Talent 24 30 0.800 0.001 Yes Yes
Q3 - Trust and Conflict 22 30 0.733 0.008 Yes Yes
Q4 - Leadership 14 30 0.467 0.708 No No
Q5 - Team Procedures 18 30 0.600 0.181 No No
Q6 - Communication 22 30 0.733 0.008 Yes Yes
Q7 - Problem Solving 20 30 0.667 0.049 Yes Yes
Q8 - Creativity 21 30 0.700 0.021 Yes Yes
Q9 - Evaluation 16 30 0.533 0.428 No No Note. H0 = Proportion of students who rated the survey question between the scores of 5-7 is less
than or equal to 50 %. H1 = Proportion of students who rated the survey question between the
scores of 5-7 is greater than 50 %. Q = Question. aThis column represents the 9 survey questions.
bIf the exact p-value was less than the α of 0.05
then H0 was rejected and the variable was considered significant, but if the exact p-value was
more than the α of 0.05 then H0 was not rejected and the variable was not considered significant.

Team Effectiveness and Project Management in a Student Team Environment 109
Appendix I
Table I8
One Proportion Hypothesis Test of Statistical Significance
AET Senior Design Students – Spring ‘12 End (H0 ≤ 0.48 | H1 > 0.48 | α = 0.05)
Variablea X N Sample p
Exact
p-
valueb
Reject
Null
Significant
Q1 - Goals and Objectives 26 30 0.867 0.000 Yes Yes
Q2 - Utilization of Talent 24 30 0.800 0.000 Yes Yes
Q3 - Trust and Conflict 22 30 0.733 0.004 Yes Yes
Q4 - Leadership 14 30 0.467 0.628 No No
Q5 - Team Procedures 18 30 0.600 0.129 No No
Q6 - Communication 22 30 0.733 0.004 Yes Yes
Q7 - Problem Solving 20 30 0.667 0.031 Yes Yes
Q8 - Creativity 21 30 0.700 0.012 Yes Yes
Q9 - Evaluation 16 30 0.533 0.343 No No Note. H0 = Proportion of students who rated the survey question between the scores of 5-7 is less
than or equal to 48 %. H1 = Proportion of students who rated the survey question between the
scores of 5-7 is greater than 48 %. Q = Question. aThis column represents the 9 survey questions.
bIf the exact p-value was less than the α of 0.05
then H0 was rejected and the variable was considered significant, but if the exact p-value was
more than the α of 0.05 then H0 was not rejected and the variable was not considered significant.

Team Effectiveness and Project Management in a Student Team Environment 110
Appendix I
Table I9
One Proportion Hypothesis Test of Statistical Significance
AET Senior Design Students – Spring ‘12 End (H0 ≤ 0.46 | H1 > 0.46 | α = 0.05)
Variablea X N Sample p
Exact
p-
valueb
Reject
Null
Significant
Q1 - Goals and Objectives 26 30 0.867 0.000 Yes Yes
Q2 - Utilization of Talent 24 30 0.800 0.000 Yes Yes
Q3 - Trust and Conflict 22 30 0.733 0.002 Yes Yes
Q4 - Leadership 14 30 0.467 0.542 No No
Q5 - Team Procedures 18 30 0.600 0.088 No No
Q6 - Communication 22 30 0.733 0.002 Yes Yes
Q7 - Problem Solving 20 30 0.667 0.018 Yes Yes
Q8 - Creativity 21 30 0.700 0.007 Yes Yes
Q9 - Evaluation 16 30 0.533 0.266 No No Note. H0 = Proportion of students who rated the survey question between the scores of 5-7 is less
than or equal to 46 %. H1 = Proportion of students who rated the survey question between the
scores of 5-7 is greater than 46 %. Q = Question. aThis column represents the 9 survey questions.
bIf the exact p-value was less than the α of 0.05
then H0 was rejected and the variable was considered significant, but if the exact p-value was
more than the α of 0.05 then H0 was not rejected and the variable was not considered significant.

Team Effectiveness and Project Management in a Student Team Environment 111
Appendix I
Table I10
One Proportion Hypothesis Test of Statistical Significance
MET Senior Design Students – Fall ’11 Single Survey (H0 ≤ 0.50 | H1 > 0.50 | α = 0.05)
Variablea X N Sample p
Exact
p-
valueb
Reject
Null
Significant
Q1 - Goals and Objectives 16 18 0.889 0.001 Yes Yes
Q2 - Utilization of Talent 12 18 0.667 0.119 No No
Q3 - Trust and Conflict 15 18 0.833 0.004 Yes Yes
Q4 - Leadership 6 18 0.333 0.952 No No
Q5 - Team Procedures 6 18 0.333 0.952 No No
Q6 - Communication 14 18 0.778 0.015 Yes Yes
Q7 - Problem Solving 13 18 0.722 0.048 Yes Yes
Q8 - Creativity 10 18 0.556 0.407 No No
Q9 - Evaluation 7 18 0.389 0.881 No No Note. H0 = Proportion of students who rated the survey question between the scores of 5-7 is less
than or equal to 50 %. H1 = Proportion of students who rated the survey question between the
scores of 5-7 is greater than 50 %. Q = Question. aThis column represents the 9 survey questions.
bIf the exact p-value was less than the α of 0.05
then H0 was rejected and the variable was considered significant, but if the exact p-value was
more than the α of 0.05 then H0 was not rejected and the variable was not considered significant.

Team Effectiveness and Project Management in a Student Team Environment 112
Appendix I
Table I11
One Proportion Hypothesis Test of Statistical Significance
MET Senior Design Students – Fall ’11 Single Survey (H0 ≤ 0.48 | H1 > 0.48 | α = 0.05)
Variablea X N Sample p
Exact
p-
valueb
Reject
Null
Significant
Q1 - Goals and Objectives 16 18 0.889 0.000 Yes Yes
Q2 - Utilization of Talent 12 18 0.667 0.088 No No
Q3 - Trust and Conflict 15 18 0.833 0.002 Yes Yes
Q4 - Leadership 6 18 0.333 0.932 No No
Q5 - Team Procedures 6 18 0.333 0.932 No No
Q6 - Communication 14 18 0.778 0.010 Yes Yes
Q7 - Problem Solving 13 18 0.722 0.033 Yes Yes
Q8 - Creativity 10 18 0.556 0.342 No No
Q9 - Evaluation 7 18 0.389 0.844 No No Note. H0 = Proportion of students who rated the survey question between the scores of 5-7 is less
than or equal to 48 %. H1 = Proportion of students who rated the survey question between the
scores of 5-7 is greater than 48 %. Q = Question. aThis column represents the 9 survey questions.
bIf the exact p-value was less than the α of 0.05
then H0 was rejected and the variable was considered significant, but if the exact p-value was
more than the α of 0.05 then H0 was not rejected and the variable was not considered significant.

Team Effectiveness and Project Management in a Student Team Environment 113
Appendix I
Table I12
One Proportion Hypothesis Test of Statistical Significance
MET Senior Design Students – Fall ’11 Single Survey (H0 ≤ 0.46 | H1 > 0.46 | α = 0.05)
Variablea X N Sample p
Exact
p-
valueb
Reject
Null
Significant
Q1 - Goals and Objectives 16 18 0.889 0.000 Yes Yes
Q2 - Utilization of Talent 12 18 0.667 0.064 Yes Yes
Q3 - Trust and Conflict 15 18 0.833 0.001 Yes Yes
Q4 - Leadership 6 18 0.333 0.907 No No
Q5 - Team Procedures 6 18 0.333 0.907 No No
Q6 - Communication 14 18 0.778 0.006 Yes Yes
Q7 - Problem Solving 13 18 0.722 0.023 No No
Q8 - Creativity 10 18 0.556 0.281 Yes Yes
Q9 - Evaluation 7 18 0.389 0.799 Yes Yes Note. H0 = Proportion of students who rated the survey question between the scores of 5-7 is less
than or equal to 46 %. H1 = Proportion of students who rated the survey question between the
scores of 5-7 is greater than 46 %. Q = Question. aThis column represents the 9 survey questions.
bIf the exact p-value was less than the α of 0.05
then H0 was rejected and the variable was considered significant, but if the exact p-value was
more than the α of 0.05 then H0 was not rejected and the variable was not considered significant.
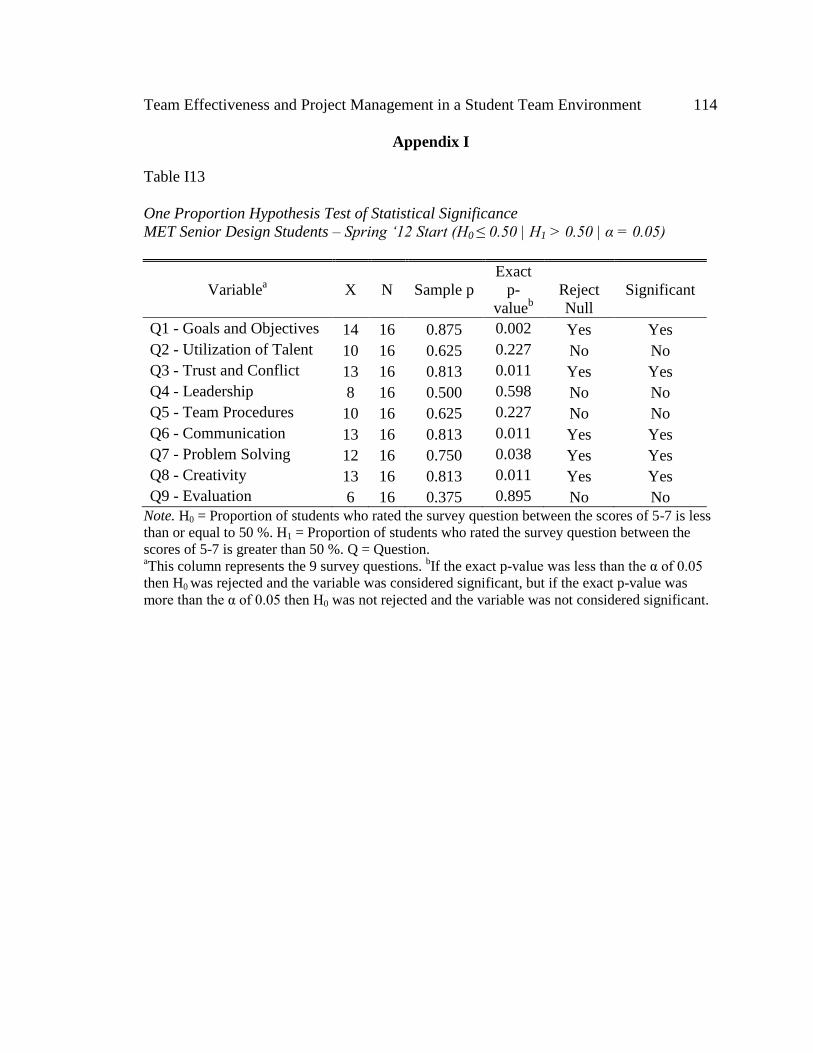
Team Effectiveness and Project Management in a Student Team Environment 114
Appendix I
Table I13
One Proportion Hypothesis Test of Statistical Significance
MET Senior Design Students – Spring ‘12 Start (H0 ≤ 0.50 | H1 > 0.50 | α = 0.05)
Variablea X N Sample p
Exact
p-
valueb
Reject
Null
Significant
Q1 - Goals and Objectives 14 16 0.875 0.002 Yes Yes
Q2 - Utilization of Talent 10 16 0.625 0.227 No No
Q3 - Trust and Conflict 13 16 0.813 0.011 Yes Yes
Q4 - Leadership 8 16 0.500 0.598 No No
Q5 - Team Procedures 10 16 0.625 0.227 No No
Q6 - Communication 13 16 0.813 0.011 Yes Yes
Q7 - Problem Solving 12 16 0.750 0.038 Yes Yes
Q8 - Creativity 13 16 0.813 0.011 Yes Yes
Q9 - Evaluation 6 16 0.375 0.895 No No Note. H0 = Proportion of students who rated the survey question between the scores of 5-7 is less
than or equal to 50 %. H1 = Proportion of students who rated the survey question between the
scores of 5-7 is greater than 50 %. Q = Question. aThis column represents the 9 survey questions.
bIf the exact p-value was less than the α of 0.05
then H0 was rejected and the variable was considered significant, but if the exact p-value was
more than the α of 0.05 then H0 was not rejected and the variable was not considered significant.

Team Effectiveness and Project Management in a Student Team Environment 115
Appendix I
Table I14
One Proportion Hypothesis Test of Statistical Significance
MET Senior Design Students – Spring ‘12 Start (H0 ≤ 0.50 | H1 > 0.50 | α = 0.05)
Variablea X N Sample p
Exact
p-
valueb
Reject
Null
Significant
Q1 - Goals and Objectives 14 16 0.875 0.002 Yes Yes
Q2 - Utilization of Talent 10 16 0.625 0.227 No No
Q3 - Trust and Conflict 13 16 0.813 0.011 Yes Yes
Q4 - Leadership 8 16 0.500 0.598 No No
Q5 - Team Procedures 10 16 0.625 0.227 No No
Q6 - Communication 13 16 0.813 0.011 Yes Yes
Q7 - Problem Solving 12 16 0.750 0.038 Yes Yes
Q8 - Creativity 13 16 0.813 0.011 Yes Yes
Q9 - Evaluation 6 16 0.375 0.895 No No Note. H0 = Proportion of students who rated the survey question between the scores of 5-7 is less
than or equal to 50 %. H1 = Proportion of students who rated the survey question between the
scores of 5-7 is greater than 50 %. Q = Question. aThis column represents the 9 survey questions.
bIf the exact p-value was less than the α of 0.05
then H0 was rejected and the variable was considered significant, but if the exact p-value was
more than the α of 0.05 then H0 was not rejected and the variable was not considered significant.

Team Effectiveness and Project Management in a Student Team Environment 116
Appendix I
Table I15
One Proportion Hypothesis Test of Statistical Significance
MET Senior Design Students – Spring ‘12 Start (H0 ≤ 0.46 | H1 > 0.46 | α = 0.05)
Variablea X N Sample p
Exact
p-
valueb
Reject
Null
Significant
Q1 - Goals and Objectives 14 16 0.875 0.001 Yes Yes
Q2 - Utilization of Talent 10 16 0.625 0.142 No No
Q3 - Trust and Conflict 13 16 0.813 0.004 Yes Yes
Q4 - Leadership 8 16 0.500 0.469 No No
Q5 - Team Procedures 10 16 0.625 0.142 No No
Q6 - Communication 13 16 0.813 0.004 Yes Yes
Q7 - Problem Solving 12 16 0.750 0.018 Yes Yes
Q8 - Creativity 13 16 0.813 0.004 Yes Yes
Q9 - Evaluation 6 16 0.375 0.824 No No Note. H0 = Proportion of students who rated the survey question between the scores of 5-7 is less
than or equal to 46 %. H1 = Proportion of students who rated the survey question between the
scores of 5-7 is greater than 46 %. Q = Question. aThis column represents the 9 survey questions.
bIf the exact p-value was less than the α of 0.05
then H0 was rejected and the variable was considered significant, but if the exact p-value was
more than the α of 0.05 then H0 was not rejected and the variable was not considered significant.

Team Effectiveness and Project Management in a Student Team Environment 117
Appendix I
Table I16
One Proportion Hypothesis Test of Statistical Significance
MET Senior Design Students – Spring ‘12 End (H0 ≤ 0.50 | H1 > 0.50 | α = 0.05)
Variablea X N Sample p
Exact
p-
valueb
Reject
Null
Significant
Q1 - Goals and Objectives 12 15 0.800 0.018 Yes Yes
Q2 - Utilization of Talent 14 15 0.933 0.000 Yes Yes
Q3 - Trust and Conflict 14 15 0.933 0.000 Yes Yes
Q4 - Leadership 11 15 0.733 0.059 No No
Q5 - Team Procedures 9 15 0.600 0.304 No No
Q6 - Communication 10 15 0.667 0.151 No No
Q7 - Problem Solving 12 15 0.800 0.018 Yes Yes
Q8 - Creativity 9 15 0.600 0.304 No No
Q9 - Evaluation 6 15 0.400 0.849 No No
Note. H0 = Proportion of students who rated the survey question between the scores of 5-7 is less
than or equal to 50 %. H1 = Proportion of students who rated the survey question between the
scores of 5-7 is greater than 50 %. Q = Question. aThis column represents the 9 survey questions.
bIf the exact p-value was less than the α of 0.05
then H0 was rejected and the variable was considered significant, but if the exact p-value was
more than the α of 0.05 then H0 was not rejected and the variable was not considered significant.

Team Effectiveness and Project Management in a Student Team Environment 118
Appendix I
Table I17
One Proportion Hypothesis Test of Statistical Significance
MET Senior Design Students – Spring ‘12 End (H0 ≤ 0.48 | H1 > 0.48 | α = 0.05)
Variablea X N Sample p
Exact
p-
valueb
Reject
Null
Significant
Q1 - Goals and Objectives 12 15 0.800 0.012 Yes Yes
Q2 - Utilization of Talent 14 15 0.933 0.000 Yes Yes
Q3 - Trust and Conflict 14 15 0.933 0.000 Yes Yes
Q4 - Leadership 11 15 0.733 0.043 Yes Yes
Q5 - Team Procedures 9 15 0.600 0.251 No No
Q6 - Communication 10 15 0.667 0.117 No No
Q7 - Problem Solving 12 15 0.800 0.012 Yes Yes
Q8 - Creativity 9 15 0.600 0.251 No No
Q9 - Evaluation 6 15 0.400 0.810 No No
Note. H0 = Proportion of students who rated the survey question between the scores of 5-7 is less
than or equal to 48 %. H1 = Proportion of students who rated the survey question between the
scores of 5-7 is greater than 48 %. Q = Question. aThis column represents the 9 survey questions.
bIf the exact p-value was less than the α of 0.05
then H0 was rejected and the variable was considered significant, but if the exact p-value was
more than the α of 0.05 then H0 was not rejected and the variable was not considered significant.

Team Effectiveness and Project Management in a Student Team Environment 119
Appendix I
Table I18
One Proportion Hypothesis Test of Statistical Significance
MET Senior Design Students – Spring ‘12 End (H0 ≤ 0.46 | H1 > 0.46 | α = 0.05)
Variablea X N Sample p
Exact
p-
valueb
Reject
Null
Significant
Q1 - Goals and Objectives 12 15 0.800 0.008 Yes Yes
Q2 - Utilization of Talent 14 15 0.933 0.000 Yes Yes
Q3 - Trust and Conflict 14 15 0.933 0.000 Yes Yes
Q4 - Leadership 11 15 0.733 0.031 Yes Yes
Q5 - Team Procedures 9 15 0.600 0.203 No No
Q6 - Communication 10 15 0.667 0.089 No No
Q7 - Problem Solving 12 15 0.800 0.008 Yes Yes
Q8 - Creativity 9 15 0.600 0.203 No No
Q9 - Evaluation 6 15 0.400 0.764 No No
Note. H0 = Proportion of students who rated the survey question between the scores of 5-7 is less
than or equal to 46 %. H1 = Proportion of students who rated the survey question between the
scores of 5-7 is greater than 46 %. Q = Question. aThis column represents the 9 survey questions.
bIf the exact p-value was less than the α of 0.05
then H0 was rejected and the variable was considered significant, but if the exact p-value was
more than the α of 0.05 then H0 was not rejected and the variable was not considered significant.

Team Effectiveness and Project Management in a Student Team Environment 120
Appendix I
Table I19
One Proportion Hypothesis Test of Statistical Significance
AET Junior Design Students – Spring ‘12 Start (H0 ≤ 0.50 | H1 > 0.50 | α = 0.05)
Variablea X N Sample p
Exact
p-
valueb
Reject
Null
Significant
Q1 - Goals and Objectives 11 12 0.917 0.003 Yes Yes
Q2 - Utilization of Talent 10 12 0.833 0.019 Yes Yes
Q3 - Trust and Conflict 10 12 0.833 0.019 Yes Yes
Q4 - Leadership 6 12 0.500 0.613 No No
Q5 - Team Procedures 8 12 0.667 0.194 No No
Q6 - Communication 9 12 0.750 0.073 No No
Q7 - Problem Solving 8 12 0.667 0.194 No No
Q8 - Creativity 10 12 0.833 0.019 Yes Yes
Q9 - Evaluation 9 12 0.750 0.073 No No Note. H0 = Proportion of students who rated the survey question between the scores of 5-7 is less
than or equal to 50 %. H1 = Proportion of students who rated the survey question between the
scores of 5-7 is greater than 50 %. Q = Question. aThis column represents the 9 survey questions.
bIf the exact p-value was less than the α of 0.05
then H0 was rejected and the variable was considered significant, but if the exact p-value was
more than the α of 0.05 then H0 was not rejected and the variable was not considered significant.

Team Effectiveness and Project Management in a Student Team Environment 121
Appendix I
Table I20
One Proportion Hypothesis Test of Statistical Significance
AET Junior Design Students – Spring ‘12 Start (H0 ≤ 0.48 | H1 > 0.48 | α = 0.05)
Variablea X N Sample p
Exact
p-
valueb
Reject
Null
Significant
Q1 - Goals and Objectives 11 12 0.917 0.002 Yes Yes
Q2 - Utilization of Talent 10 12 0.833 0.014 Yes Yes
Q3 - Trust and Conflict 10 12 0.833 0.014 Yes Yes
Q4 - Leadership 6 12 0.500 0.558 No No
Q5 - Team Procedures 8 12 0.667 0.158 No No
Q6 - Communication 9 12 0.750 0.056 No No
Q7 - Problem Solving 8 12 0.667 0.158 No No
Q8 - Creativity 10 12 0.833 0.014 Yes Yes
Q9 - Evaluation 9 12 0.750 0.056 No No Note. H0 = Proportion of students who rated the survey question between the scores of 5-7 is less
than or equal to 48 %. H1 = Proportion of students who rated the survey question between the
scores of 5-7 is greater than 48 %. Q = Question. aThis column represents the 9 survey questions.
bIf the exact p-value was less than the α of 0.05
then H0 was rejected and the variable was considered significant, but if the exact p-value was
more than the α of 0.05 then H0 was not rejected and the variable was not considered significant.

Team Effectiveness and Project Management in a Student Team Environment 122
Appendix I
Table I21
One Proportion Hypothesis Test of Statistical Significance
AET Junior Design Students – Spring ‘12 Start (H0 ≤ 0.46 | H1 > 0.46 | α = 0.05)
Variablea X N Sample p
Exact
p-
valueb
Reject
Null
Significant
Q1 - Goals and Objectives 11 12 0.917 0.001 Yes Yes
Q2 - Utilization of Talent 10 12 0.833 0.010 Yes Yes
Q3 - Trust and Conflict 10 12 0.833 0.010 Yes Yes
Q4 - Leadership 6 12 0.500 0.501 No No
Q5 - Team Procedures 8 12 0.667 0.126 No No
Q6 - Communication 9 12 0.750 0.041 Yes Yes
Q7 - Problem Solving 8 12 0.667 0.126 No No
Q8 - Creativity 10 12 0.833 0.010 Yes Yes
Q9 - Evaluation 9 12 0.750 0.041 Yes Yes Note. H0 = Proportion of students who rated the survey question between the scores of 5-7 is less
than or equal to 46 %. H1 = Proportion of students who rated the survey question between the
scores of 5-7 is greater than 46 %. Q = Question. aThis column represents the 9 survey questions.
bIf the exact p-value was less than the α of 0.05
then H0 was rejected and the variable was considered significant, but if the exact p-value was
more than the α of 0.05 then H0 was not rejected and the variable was not considered significant.

Team Effectiveness and Project Management in a Student Team Environment 123
Appendix I
Table I22
One Proportion Hypothesis Test of Statistical Significance
AET Junior Design Students – Spring ‘12 End (H0 ≤ 0.50 | H1 > 0.50 | α = 0.05)
Variablea X N Sample p
Exact
p-
valueb
Reject
Null
Significant
Q1 - Goals and Objectives 16 19 0.842 0.002 Yes Yes
Q2 - Utilization of Talent 14 19 0.737 0.032 Yes Yes
Q3 - Trust and Conflict 16 19 0.842 0.002 Yes Yes
Q4 - Leadership 15 19 0.789 0.010 Yes Yes
Q5 - Team Procedures 15 19 0.789 0.010 Yes Yes
Q6 - Communication 11 19 0.579 0.324 No No
Q7 - Problem Solving 14 19 0.737 0.032 Yes Yes
Q8 - Creativity 17 19 0.895 0.000 Yes Yes
Q9 - Evaluation 14 19 0.737 0.032 Yes Yes Note. H0 = Proportion of students who rated the survey question between the scores of 5-7 is less
than or equal to 50 %. H1 = Proportion of students who rated the survey question between the
scores of 5-7 is greater than 50 %. Q = Question. aThis column represents the 9 survey questions.
bIf the exact p-value was less than the α of 0.05
then H0 was rejected and the variable was considered significant, but if the exact p-value was
more than the α of 0.05 then H0 was not rejected and the variable was not considered significant.

Team Effectiveness and Project Management in a Student Team Environment 124
Appendix I
Table I23
One Proportion Hypothesis Test of Statistical Significance
AET Junior Design Students – Spring ‘12 End (H0 ≤ 0.50 | H1 > 0.50 | α = 0.05)
Variablea X N Sample p
Exact
p-
valueb
Reject
Null
Significant
Q1 - Goals and Objectives 16 19 0.842 0.002 Yes Yes
Q2 - Utilization of Talent 14 19 0.737 0.032 Yes Yes
Q3 - Trust and Conflict 16 19 0.842 0.002 Yes Yes
Q4 - Leadership 15 19 0.789 0.010 Yes Yes
Q5 - Team Procedures 15 19 0.789 0.010 Yes Yes
Q6 - Communication 11 19 0.579 0.324 No No
Q7 - Problem Solving 14 19 0.737 0.032 Yes Yes
Q8 - Creativity 17 19 0.895 0.000 Yes Yes
Q9 - Evaluation 14 19 0.737 0.032 Yes Yes Note. H0 = Proportion of students who rated the survey question between the scores of 5-7 is less
than or equal to 50 %. H1 = Proportion of students who rated the survey question between the
scores of 5-7 is greater than 50 %. Q = Question. aThis column represents the 9 survey questions.
bIf the exact p-value was less than the α of 0.05
then H0 was rejected and the variable was considered significant, but if the exact p-value was
more than the α of 0.05 then H0 was not rejected and the variable was not considered significant.

Team Effectiveness and Project Management in a Student Team Environment 125
Appendix I
Table I24
One Proportion Hypothesis Test of Statistical Significance
AET Junior Design Students – Spring ‘12 End (H0 ≤ 0.46 | H1 > 0.46 | α = 0.05)
Variablea X N Sample p
Exact
p-
valueb
Reject
Null
Significant
Q1 - Goals and Objectives 16 19 0.842 0.001 Yes Yes
Q2 - Utilization of Talent 14 19 0.737 0.014 Yes Yes
Q3 - Trust and Conflict 16 19 0.842 0.001 Yes Yes
Q4 - Leadership 15 19 0.789 0.004 Yes Yes
Q5 - Team Procedures 15 19 0.789 0.004 Yes Yes
Q6 - Communication 11 19 0.579 0.209 No No
Q7 - Problem Solving 14 19 0.737 0.014 Yes Yes
Q8 - Creativity 17 19 0.895 0.000 Yes Yes
Q9 - Evaluation 14 19 0.737 0.014 Yes Yes Note. H0 = Proportion of students who rated the survey question between the scores of 5-7 is less
than or equal to 46 %. H1 = Proportion of students who rated the survey question between the
scores of 5-7 is greater than 46 %. Q = Question. aThis column represents the 9 survey questions.
bIf the exact p-value was less than the α of 0.05
then H0 was rejected and the variable was considered significant, but if the exact p-value was
more than the α of 0.05 then H0 was not rejected and the variable was not considered significant.

Team Effectiveness and Project Management in a Student Team Environment 126
Appendix J
Table J1
Results for Pearson’s Correlation Test – AET Senior Design Students
Note. The correlation analysis was performed using Minitab 15 statistical analysis software. A
level of significance α = 0.05 was used for this correlation analysis. If the p-value for the pair of
variables was greater than 0.05 then the pair was considered statistically significant. If a pair of
variables was statistically significant during all three trials then, it was considered a critically
significant pair. All the variables shown in this table were considered critically significant via a
one proportion hypothesis test of statistical significance. aRepresents those pairs of variables which are considered critically significant.
r p-value r p-value r p-value
Goals and Objectives - Utilization of Talents 0.518 0.002 0.278 0.112 0.522 0.003
Goals and Objectives - Trust and Conflicta 0.410 0.016 0.376 0.029 0.602 0.000
Goals and Objectives - Communication 0.314 0.070 0.327 0.059 0.230 0.221
Goals and Objectives - Problem Solving 0.553 0.001 0.231 0.188 0.647 0.000
Goals and Objectives - Creativity 0.576 0.000 0.428 0.012 0.104 0.585
Utilization of Talents - Trust and Conflicta 0.558 0.001 0.465 0.006 0.616 0.000
Utilization of Talents - Communication 0.304 0.081 0.404 0.018 0.316 0.088
Utilization of Talents - Problem Solvinga 0.407 0.017 0.514 0.002 0.656 0.000
Utilization of Talents - Creativitya 0.390 0.023 0.363 0.035 0.570 0.001
Trust and Conflict - Communicationa 0.675 0.000 0.662 0.000 0.582 0.001
Trust and Conflict - Problem Solving 0.537 0.001 0.332 0.055 0.624 0.000
Trust and Conflict - Creativity 0.494 0.003 0.584 0.000 0.224 0.234
Communication - Problem Solvinga 0.515 0.002 0.519 0.002 0.431 0.017
Communication - Creativity 0.353 0.041 0.492 0.003 0.119 0.530
Problem Solving - Creativitya 0.607 0.000 0.376 0.028 0.428 0.018
Pairs of Variables
Results for Fall '11
Single Survey - Trial
1 (N = 34)
Results for Spring
'12 Start - Trial 2
(N = 34)
Results for Spring
'12 End - Trial 3
(N = 30)

Team Effectiveness and Project Management in a Student Team Environment 127
Appendix J
Table J2
Results for Pearson’s Correlation Test – MET Senior Design Students
Note. The correlation analysis was performed using Minitab 15 statistical analysis software. A
level of significance α = 0.05 was used for this correlation analysis.
r p-value r p-value r p-value
Goals and Objectives - Trust and Conflict 0.030 0.906 0.669 0.005 0.078 0.468
Goals and Objectives - Problem Solving 0.416 0.086 0.446 0.084 0.054 0.507
Trust and Conflict - Problem Solving 0.314 0.205 0.361 0.170 0.038 0.539
Results for Spring Results for Spring Pairs of Variables
Results for Fall '11

Team Effectiveness and Project Management in a Student Team Environment 128
Appendix K
Figure K. An example showing how to perform Somers’ Dyx analysis. Adapted from
“Social Statistics: A Test Using MicroCase,” by W. Fox, 2002, pg. 165. Copyright 2002
by the Wadsworth Group.
ScoreMET 325
Not Taken
MET 325
TakenTotal
5-7 13 16 29
1-3 2 1 3
ScoreMET 325
Not Taken
MET 325
TakenScore
MET 325
Not Taken
MET 325
Taken
5-7 13 16 5-7 13 16
1-3 2 1 1-3 2 1
210
ScoreMET 325
Not Taken
MET 325
TakenScore
MET 325
Not Taken
MET 325
Taken
5-7 13 16 5-7 13 16
1-3 2 1 1-3 2 1
32 13
Dyx = 7.5%
Somers' Dyx Interpretation
A value of +0.075 suggests that 7.5% or more pairs of cases are ordered in the same direction
Pair in Same Direction: MET 325 not taken = Lower survey scores or MET 325 taken = Higher survey scoress
Definitions of Commonly Used Terms
Variable (x): Independent Variable (column variable) - Project management coursework (MET 325)
Prediction: Those students who have previously taken the MET 325 course have higher survey scores
Variable (y): Dependent Variable (row variable) - Survey scores (1-3 and 5-7)
Pair in Opposite Direction: MET 325 not taken = Higher survey scores or MET 325 taken = Lower survey scores
Goals and Objectives Fall '11 Single Survey
(AET Senior Design Students)
Ty = [(16*13) + (1*2)] =
Ty Calculation Steps
Sample Bi-Variate Frequency Table
Same = (2*16) = Opposite = (13*1) =
Same - Opposite
Somers' Dyx Formula and Calculation
Pairs in the Same and Opposite Direction
Same + Opposite + Ty
Dyx =
Dyx value is usually expressed in terms of percentage of cases
A value of -0.075 suggests that 7.5% or more pairs of cases are ordered in the opposite direction
The value for Dyx falls between -1.00 to +1.00

Team Effectiveness and Project Management in a Student Team Environment 129
Appendix L
Table L1
Somers’ Dyx Analysis for Q1 – Goals and Objectives
AET Senior Design Students – Fall ’11 Single Survey
Score
MET 325 Not
Taken
(f)
MET 325 Taken
(f)
5-7 13 16
1-3 2 1
Total 15 17
Number of pairs in same direction 32
Number of pairs in opposite direction 13
Ty 210
Dyx (%) 7.45 Note. A positive Dyx value indicates that more pairs are ordered
in the same direction whereas a negative Dyx value indicates that
more pairs are ordered in the opposite direction.
Table L2
Somers’ Dyx Analysis for Q2 – Utilization of Talent
AET Senior Design Students – Fall ’11 Single Survey
Score
MET 325 Not
Taken
(f)
MET 325 Taken
(f)
5-7 13 10
1-3 1 1
Total 14 11
Number of pairs in same direction 10
Number of pairs in opposite direction 13
Ty 131
Dyx (%) -1.95 Note. A positive Dyx value indicates that more pairs are ordered
in the same direction whereas a negative Dyx value indicates that
more pairs are ordered in the opposite direction.

Team Effectiveness and Project Management in a Student Team Environment 130
Appendix L
Table L3
Somers’ Dyx Analysis for Q3 – Trust and Conflict
AET Senior Design Students – Fall ’11 Single Survey
Score
MET 325 Not
Taken
(f)
MET 325 Taken
(f)
5-7 15 13
1-3 1 0
Total 16 13
Number of pairs in same direction 13
Number of pairs in opposite direction 0
Ty 195
Dyx (%) 6.25 Note. A positive Dyx value indicates that more pairs are ordered
in the same direction whereas a negative Dyx value indicates that
more pairs are ordered in the opposite direction.
Table L4
Somers’ Dyx Analysis for Q6 – Communication
AET Senior Design Students – Fall ’11 Single Survey
Score
MET 325 Not
Taken
(f)
MET 325 Taken
(f)
5-7 11 13
1-3 2 1
Total 13 14
Number of pairs in same direction 26
Number of pairs in opposite direction 11
Ty 145
Dyx (%) 8.24 Note. A positive Dyx value indicates that more pairs are ordered
in the same direction whereas a negative Dyx value indicates that
more pairs are ordered in the opposite direction.

Team Effectiveness and Project Management in a Student Team Environment 131
Appendix L
Table L5
Somers’ Dyx Analysis for Q7 – Problem Solving
AET Senior Design Students – Fall ’11 Single Survey
Score
MET 325 Not
Taken
(f)
MET 325 Taken
(f)
5-7 11 13
1-3 1 1
Total 12 14
Number of pairs in same direction 13
Number of pairs in opposite direction 11
Ty 144
Dyx (%) 1.19 Note. A positive Dyx value indicates that more pairs are ordered
in the same direction whereas a negative Dyx value indicates that
more pairs are ordered in the opposite direction.
Table L6
Somers’ Dyx Analysis for Q8 – Creativity
AET Senior Design Students – Fall ’11 Single Survey
Score
MET 325 Not
Taken
(f)
MET 325 Taken
(f)
5-7 12 11
1-3 2 0
Total 14 11
Number of pairs in same direction 22
Number of pairs in opposite direction 0
Ty 132
Dyx (%) 14.29 Note. A positive Dyx value indicates that more pairs are ordered
in the same direction whereas a negative Dyx value indicates that
more pairs are ordered in the opposite direction.

Team Effectiveness and Project Management in a Student Team Environment 132
Appendix L
Table L7
Somers’ Dyx Analysis for Q1 – Goals and Objectives
AET Senior Design Students – Spring ’12 Start
Score
MET 325 Not
Taken
(f)
MET 325 Taken
(f)
5-7 14 16
1-3 2 0
Total 16 16
Number of pairs in same direction 32
Number of pairs in opposite direction 0
Ty 224
Dyx (%) 12.50 Note. A positive Dyx value indicates that more pairs are ordered
in the same direction whereas a negative Dyx value indicates that
more pairs are ordered in the opposite direction.
Table L8
Somers’ Dyx Analysis for Q2 – Utilization of Talent
AET Senior Design Students – Spring ’12 Start
Score
MET 325 Not
Taken
(f)
MET 325 Taken
(f)
5-7 14 11
1-3 3 1
Total 17 12
Number of pairs in same direction 33
Number of pairs in opposite direction 14
Ty 157
Dyx (%) 9.31 Note. A positive Dyx value indicates that more pairs are ordered
in the same direction whereas a negative Dyx value indicates that
more pairs are ordered in the opposite direction.

Team Effectiveness and Project Management in a Student Team Environment 133
Appendix L
Table L9
Somers’ Dyx Analysis for Q3 – Trust and Conflict
AET Senior Design Students – Spring ’12 Start
Score
MET 325 Not
Taken
(f)
MET 325 Taken
(f)
5-7 12 15
1-3 3 0
Total 15 15
Number of pairs in same direction 45
Number of pairs in opposite direction 0
Ty 180
Dyx (%) 20.00 Note. A positive Dyx value indicates that more pairs are ordered
in the same direction whereas a negative Dyx value indicates that
more pairs are ordered in the opposite direction.
Table L10
Somers’ Dyx Analysis for Q6 – Communication
AET Senior Design Students – Spring ’12 Start
Score
MET 325 Not
Taken
(f)
MET 325 Taken
(f)
5-7 10 13
1-3 2 2
Total 12 15
Number of pairs in same direction 26
Number of pairs in opposite direction 20
Ty 134
Dyx (%) 3.33 Note. A positive Dyx value indicates that more pairs are ordered
in the same direction whereas a negative Dyx value indicates that
more pairs are ordered in the opposite direction.

Team Effectiveness and Project Management in a Student Team Environment 134
Appendix L
Table L11
Somers’ Dyx Analysis for Q7 – Problem Solving
AET Senior Design Students – Spring ’12 Start
Score
MET 325 Not
Taken
(f)
MET 325 Taken
(f)
5-7 14 11
1-3 1 3
Total 15 14
Number of pairs in same direction 11
Number of pairs in opposite direction 42
Ty 157
Dyx (%) -14.76 Note. A positive Dyx value indicates that more pairs are ordered
in the same direction whereas a negative Dyx value indicates that
more pairs are ordered in the opposite direction.
Table L12
Somers’ Dyx Analysis for Q8 – Creativity
AET Senior Design Students – Spring ’12 Start
Score
MET 325 Not
Taken
(f)
MET 325 Taken
(f)
5-7 11 14
1-3 2 1
Total 13 15
Number of pairs in same direction 28
Number of pairs in opposite direction 11
Ty 156
Dyx (%) 8.72 Note. A positive Dyx value indicates that more pairs are ordered
in the same direction whereas a negative Dyx value indicates that
more pairs are ordered in the opposite direction.

Team Effectiveness and Project Management in a Student Team Environment 135
Appendix L
Table L13
Somers’ Dyx Analysis for Q1 – Goals and Objectives
AET Senior Design Students – Spring ’12 End
Score
MET 325 Not
Taken
(f)
MET 325 Taken
(f)
5-7 11 15
1-3 2 1
Total 13 16
Number of pairs in same direction 30
Number of pairs in opposite direction 11
Ty 167
Dyx (%) 9.13 Note. A positive Dyx value indicates that more pairs are ordered
in the same direction whereas a negative Dyx value indicates that
more pairs are ordered in the opposite direction.
Table L14
Somers’ Dyx Analysis for Q2 – Utilization of Talent
AET Senior Design Students – Spring ’12 End
Score
MET 325 Not
Taken
(f)
MET 325 Taken
(f)
5-7 12 12
1-3 1 1
Total 13 13
Number of pairs in same direction 12
Number of pairs in opposite direction 12
Ty 145
Dyx (%) 0.00 Note. A positive Dyx value indicates that more pairs are ordered
in the same direction whereas a negative Dyx value indicates that
more pairs are ordered in the opposite direction.

Team Effectiveness and Project Management in a Student Team Environment 136
Appendix L
Table L15
Somers’ Dyx Analysis for Q3 – Trust and Conflict
AET Senior Design Students – Spring ’12 End
Score
MET 325 Not
Taken
(f)
MET 325 Taken
(f)
5-7 8 14
1-3 1 0
Total 9 14
Number of pairs in same direction 14
Number of pairs in opposite direction 0
Ty 112
Dyx (%) 11.11 Note. A positive Dyx value indicates that more pairs are ordered
in the same direction whereas a negative Dyx value indicates that
more pairs are ordered in the opposite direction.
Table L16
Somers’ Dyx Analysis for Q6 – Communication
AET Senior Design Students – Spring ’12 End
Score
MET 325 Not
Taken
(f)
MET 325 Taken
(f)
5-7 10 12
1-3 1 1
Total 11 13
Number of pairs in same direction 12
Number of pairs in opposite direction 10
Ty 121
Dyx (%) 1.40 Note. A positive Dyx value indicates that more pairs are ordered
in the same direction whereas a negative Dyx value indicates that
more pairs are ordered in the opposite direction.

Team Effectiveness and Project Management in a Student Team Environment 137
Appendix L
Table L17
Somers’ Dyx Analysis for Q7 – Problem Solving
AET Senior Design Students – Spring ’12 End
Score
MET 325 Not
Taken
(f)
MET 325 Taken
(f)
5-7 9 11
1-3 1 2
Total 10 13
Number of pairs in same direction 11
Number of pairs in opposite direction 18
Ty 101
Dyx (%) -5.38 Note. A positive Dyx value indicates that more pairs are ordered
in the same direction whereas a negative Dyx value indicates that
more pairs are ordered in the opposite direction.
Table L18
Somers’ Dyx Analysis for Q8 – Creativity
AET Senior Design Students – Spring ’12 End
Score
MET 325 Not
Taken
(f)
MET 325 Taken
(f)
5-7 10 11
1-3 0 1
Total 10 12
Number of pairs in same direction 0
Number of pairs in opposite direction 10
Ty 110
Dyx (%) -8.33 Note. A positive Dyx value indicates that more pairs are ordered
in the same direction whereas a negative Dyx value indicates that
more pairs are ordered in the opposite direction.

Team Effectiveness and Project Management in a Student Team Environment 138
Appendix L
Table L19
Somers’ Dyx Analysis for Q1 – Goals and Objectives
MET Senior Design Students – Fall ’11 Single Survey
Score
MET 325 Not
Taken
(f)
MET 325 Taken
(f)
5-7 2 14
1-3 0 1
Total 2 15
Number of pairs in same direction 0
Number of pairs in opposite direction 2
Ty 28
Dyx (%) -6.67 Note. A positive Dyx value indicates that more pairs are ordered
in the same direction whereas a negative Dyx value indicates that
more pairs are ordered in the opposite direction.
Table L20
Somers’ Dyx Analysis for Q3 – Trust and Conflict
MET Senior Design Students – Fall ’11 Single Survey
Score
MET 325 Not
Taken
(f)
MET 325 Taken
(f)
5-7 1 14
1-3 0 1
Total 1 15
Number of pairs in same direction 0
Number of pairs in opposite direction 1
Ty 14
Dyx (%) -6.67 Note. A positive Dyx value indicates that more pairs are ordered
in the same direction whereas a negative Dyx value indicates that
more pairs are ordered in the opposite direction.

Team Effectiveness and Project Management in a Student Team Environment 139
Appendix L
Table L21
Somers’ Dyx Analysis for Q7 – Problem Solving
MET Senior Design Students – Fall ’11 Single Survey
Score
MET 325 Not
Taken
(f)
MET 325 Taken
(f)
5-7 2 11
1-3 0 3
Total 2 14
Number of pairs in same direction 0
Number of pairs in opposite direction 6
Ty 22
Dyx (%) -21.43 Note. A positive Dyx value indicates that more pairs are ordered
in the same direction whereas a negative Dyx value indicates that
more pairs are ordered in the opposite direction.
Table L22
Somers’ Dyx Analysis for Q1 – Goals and Objectives
MET Senior Design Students – Spring ’12 Start
Score
MET 325 Not
Taken
(f)
MET 325 Taken
(f)
5-7 2 12
1-3 1 1
Total 3 13
Number of pairs in same direction 12
Number of pairs in opposite direction 2
Ty 25
Dyx (%) 25.64 Note. A positive Dyx value indicates that more pairs are ordered
in the same direction whereas a negative Dyx value indicates that
more pairs are ordered in the opposite direction.

Team Effectiveness and Project Management in a Student Team Environment 140
Appendix L
Table L23
Somers’ Dyx Analysis for Q3 – Trust and Conflict
MET Senior Design Students – Spring ’12 Start
Score
MET 325 Not
Taken
(f)
MET 325 Taken
(f)
5-7 2 11
1-3 0 0
Total 2 11
Number of pairs in same direction 0
Number of pairs in opposite direction 0
Ty 22
Dyx (%) 0.00 Note. A positive Dyx value indicates that more pairs are ordered
in the same direction whereas a negative Dyx value indicates that
more pairs are ordered in the opposite direction.
Table L24
Somers’ Dyx Analysis for Q7 – Problem Solving
MET Senior Design Students – Spring ’12 Start
Score
MET 325 Not
Taken
(f)
MET 325 Taken
(f)
5-7 2 10
1-3 1 1
Total 3 11
Number of pairs in same direction 10
Number of pairs in opposite direction 2
Ty 21
Dyx (%) 24.24 Note. A positive Dyx value indicates that more pairs are ordered
in the same direction whereas a negative Dyx value indicates that
more pairs are ordered in the opposite direction.

Team Effectiveness and Project Management in a Student Team Environment 141
Appendix L
Table L25
Somers’ Dyx Analysis for Q1 – Goals and Objectives
MET Senior Design Students – Spring ’12 End
Score
MET 325 Not
Taken
(f)
MET 325 Taken
(f)
5-7 2 10
1-3 0 1
Total 2 11
Number of pairs in same direction 0
Number of pairs in opposite direction 2
Ty 20
Dyx (%) -9.09 Note. A positive Dyx value indicates that more pairs are ordered
in the same direction whereas a negative Dyx value indicates that
more pairs are ordered in the opposite direction.
Table L26
Somers’ Dyx Analysis for Q3 – Trust and Conflict
MET Senior Design Students – Spring ’12 End
Score
MET 325 Not
Taken
(f)
MET 325 Taken
(f)
5-7 2 12
1-3 0 0
Total 2 12
Number of pairs in same direction 0
Number of pairs in opposite direction 0
Ty 24
Dyx (%) 0.00 Note. A positive Dyx value indicates that more pairs are ordered
in the same direction whereas a negative Dyx value indicates that
more pairs are ordered in the opposite direction.

Team Effectiveness and Project Management in a Student Team Environment 142
Appendix L
Table L27
Somers’ Dyx Analysis for Q7 – Problem Solving
MET Senior Design Students – Spring ’12 End
Score
MET 325 Not
Taken
(f)
MET 325 Taken
(f)
5-7 1 11
1-3 0 0
Total 1 11
Number of pairs in same direction 0
Number of pairs in opposite direction 0
Ty 11
Dyx (%) 0.00 Note. A positive Dyx value indicates that more pairs are ordered
in the same direction whereas a negative Dyx value indicates that
more pairs are ordered in the opposite direction.

Team Effectiveness and Project Management in a Student Team Environment 143
Appendix M
Figure M1. Comparison of Student Rating Pattern for High (5-7) and Low (1-3) Scores Related to the Nine Survey Categories –
AET Senior Design Students.
0.0
10.0
20.0
30.0
40.0
50.0
60.0
70.0
80.0
90.0
100.0
Goals and
Objectives
Utilization of
Talents
Trust and
Conflict
Leadership Team
Procedures
Communication Problem
Solving
Creativity Evaluation
Sam
ple
Pop
ula
tion
(%
)
The Nine Survey Categories
N (Fall '11 Single Survey - 34, Spring '12 Start - 34, Spring '12 End - 30)
Student Rating Pattern for High (5-7) and Low (1-3) Scores - AET Senior Design Students
Fall '11 Single Survey (Score 5-7) Spring '12 - Start (Score 5-7) Spring '12 - End (Score 5-7)
Fall '11 Single Survey (Score 1-3) Spring '12 - Start (Score1-3) Spring '12 - End (Score 1-3)

Team Effectiveness and Project Management in a Student Team Environment 144
Appendix M
Figure M2. Comparison of Student Rating Pattern for High (5-7) and Low (1-3) Scores Related to the Nine Survey Categories – MET
Senior Design Students.
0.0
10.0
20.0
30.0
40.0
50.0
60.0
70.0
80.0
90.0
100.0
Goals and
Objectives
Utilization of
Talents
Trust and
Conflict
Leadership Team Procedures Communication Problem Solving Creativity Evaluation
Sa
mp
le P
op
ula
tio
n (
%)
The Nine Survey Categories
N (Fall '11 Single Survey - 18, Spring '11 Start - 16, Spring '12 End - 15)
Comparison of Student Rating Pattern for High (5-7) and Low (1-3) Scores - MET Senior Design Students
Fall '11 Single Survey (Score 5-7) Spring '12 - Start (Score 5-7) Spring '12 - End (Score 5-7)
Fall '11 Single Survey (Score 1-3) Spring '12 - Start (Score 1-3) Spring '12 - End (Score 1-3)

Team Effectiveness and Project Management in a Student Team Environment 145
Appendix M
Figure M3. Comparison of Student Rating Pattern for High (5-7) and Low (1-3) Scores Related to the Nine Survey Categories – AET
Junior Design Students.

Team Effectiveness and Project Management in a Student Team Environment 146
Appendix N
Table N1
Comparison of Scores – Students who Took MET 325 vs. Students who did
Not Take MET 325 Prior to the Survey – AET Senior Design Students
Note. Q = Question; MET 325 = Project Management.
Scores
1-3
Scores
5-7
Scores
1-3
Scores
5-7
Fall '11 Single Survey
Q1 - Goals and Objectives 6 94 12 76
Q2 - Utilization of Talent 6 59 6 76
Q3 - Trust and Conflict 0 76 6 88
Q4 - Leadership 12 59 18 53
Q5 - Team Procedures 6 65 24 41
Q6 - Communication 6 76 12 65
Q7 - Problem Solving 6 76 6 65
Q8 - Creativity 0 65 12 71
Q9 - Evaluation 12 71 18 59
Spring '12 - Start
Q1 - Goals and Objectives 0 94 12 82
Q2 - Utilization of Talent 6 65 18 82
Q3 - Trust and Conflict 0 88 18 71
Q4 - Leadership 29 47 29 53
Q5 - Team Procedures 6 65 12 76
Q6 - Communication 12 76 12 59
Q7 - Problem Solving 18 65 6 82
Q8 - Creativity 6 82 12 65
Q9 - Evaluation 12 76 12 59
Spring '12 - End
Q1 - Goals and Objectives 6 94 14 79
Q2 - Utilization of Talent 6 75 7 86
Q3 - Trust and Conflict 0 88 7 57
Q4 - Leadership 19 50 21 43
Q5 - Team Procedures 13 69 21 50
Q6 - Communication 6 75 7 71
Q7 - Problem Solving 13 69 7 64
Q8 - Creativity 6 69 0 71
Q9 - Evaluation 6 56 29 50
(N) = (17) (N) = (17)
(N) = (16) (N) = (14)
Variable
MET 325 Taken MET 325 Not Taken
(N) = (17) (N) = (17)

Team Effectiveness and Project Management in a Student Team Environment 147
Appendix N
Table N2
Comparison of Scores – Students who Took MET 325 vs. Students who
Did Not Take MET 325 Prior to the Survey – MET Senior Design Students
Note. Q = Question; MET 325 = Project Management.
Scores
1-3
Scores
5-7
Scores
1-3
Scores
5-7
Fall '11 Single Survey
Q1 - Goals and Objectives 6 88 0 100
Q2 - Utilization of Talent 19 63 0 100
Q3 - Trust and Conflict 6 88 0 50
Q4 - Leadership 44 25 0 100
Q5 - Team Procedures 31 31 0 50
Q6 - Communication 6 75 0 100
Q7 - Problem Solving 19 69 0 100
Q8 - Creativity 6 56 0 50
Q9 - Evaluation 19 31 0 100
Spring '12 - Start
Q1 - Goals and Objectives 8 92 33 67
Q2 - Utilization of Talent 23 69 0 33
Q3 - Trust and Conflict 0 85 0 67
Q4 - Leadership 31 46 33 67
Q5 - Team Procedures 31 62 33 67
Q6 - Communication 8 85 0 67
Q7 - Problem Solving 8 77 33 67
Q8 - Creativity 0 85 0 67
Q9 - Evaluation 38 38 33 33
Spring '12 - End
Q1 - Goals and Objectives 8 77 0 100
Q2 - Utilization of Talent 8 92 0 100
Q3 - Trust and Conflict 0 92 0 100
Q4 - Leadership 23 77 50 50
Q5 - Team Procedures 8 62 50 50
Q6 - Communication 8 69 0 50
Q7 - Problem Solving 0 85 0 50
Q8 - Creativity 15 62 50 50
Q9 - Evaluation 31 38 50 50
Variablea
(N) = (16) (N) = (2)
(N) = (13) (N) = (2)
(N) = (3)(N) = (13)
MET 325 Taken MET 325 Not Taken

Team Effectiveness and Project Management in a Student Team Environment 148
Appendix N
Table N3
Comparison of Scores – Students who Took MET 325 vs. Students who
Did Not Take MET 325 Prior to the Survey – AET Junior Design Students
Note. The AET Junior Design course is only offered during the Spring semester, as a
result no data is available for the Fall ’11 semester. Q = Question;
MET 325 = Project Management
Scores
1-3
Scores
5-7
Scores
1-3
Scores
5-7
Spring '12 - Start
Q1 - Goals and Objectives 0 83 0 100
Q2 - Utilization of Talent 0 83 17 83
Q3 - Trust and Conflict 0 100 17 67
Q4 - Leadership 50 33 33 67
Q5 - Team Procedures 17 50 17 83
Q6 - Communication 0 100 17 50
Q7 - Problem Solving 0 67 17 67
Q8 - Creativity 0 83 17 83
Q9 - Evaluation 33 67 17 83
Spring '12 - End
Q1 - Goals and Objectives 0 100 0 67
Q2 - Utilization of Talent 0 80 11 67
Q3 - Trust and Conflict 0 90 11 78
Q4 - Leadership 0 70 0 89
Q5 - Team Procedures 0 80 11 78
Q6 - Communication 0 50 0 67
Q7 - Problem Solving 0 90 11 56
Q8 - Creativity 0 100 11 78
Q9 - Evaluation 0 60 11 89
(N) = (9)(N) = (10)
(N) = (6)(N) = (6)
MET 325 Not TakenMET 325 Taken

Team Effectiveness and Project Management in a Student Team Environment 149
Appendix O
Figure O1. Student Rating Pattern for Survey Question 10 – AET Senior Design
Students – Spring ’12 End. N = Number of valid responses.
Figure O2. Student Rating Pattern for Survey Question 10 – AET Senior Design
Students – Spring ’12 End. N = Number of valid responses.
0 1 2 3 4 5 6
Goals and Objectives
Utilization of Talents
Trust and Conflict
Leadership
Team Procedures
Communication
Problem Solving
Creativity
Evaluation
Number of Votes
Th
e N
ine
Su
rvey
Ca
teg
ori
es
Survey Categories that Received a Need for Improvement Score
of 1 - AET Senior Design Students - Spring '12 End (N = 26)
0 1 2 3 4 5 6 7
Goals and Objectives
Utilization of Talents
Trust and Conflict
Leadership
Team Procedures
Communication
Problem Solving
Creativity
Evaluation
Number of Votes
Th
e N
ine
Su
rvey
Ca
teg
ori
es
Survey Categories that Received a Need for Improvement Score
of 2 - AET Senior Design Students - Spring '12 End (N = 26)

Team Effectiveness and Project Management in a Student Team Environment 150
Appendix O
Figure O3. Student Rating Pattern for Survey Question 10 – AET Senior Design
Students – Spring ’12 End. N = Number of valid responses.
0 1 2 3 4 5 6 7 8 9
Goals and Objectives
Utilization of Talents
Trust and Conflict
Leadership
Team Procedures
Communication
Problem Solving
Creativity
Evaluation
Number of Votes
Th
e N
ine
Su
rvey
Cate
gori
es
Survey Categories that Received a Need for Improvement Score
of 3 - AET Senior Design Students - Spring '12 End (N = 26)

Team Effectiveness and Project Management in a Student Team Environment 151
Appendix O
Figure O4. Student Rating Pattern for Survey Question 10 – MET Senior Design
Students – Spring ’12 End. N = Number of valid responses.
Figure O5. Student Rating Pattern for Survey Question 10 – MET Senior Design
Students – Spring ’12 End. N = Number of valid responses.
0 1 2 3 4
Goals and Objectives
Utilization of Talents
Trust and Conflict
Leadership
Team Procedures
Communication
Problem Solving
Creativity
Evaluation
Number of Votes
Th
e N
ine
Su
rvey
Cate
gori
es
Survey Categories that Received a Need for Improvement Score of 1 -
MET Senior Design Students - Spring '12 End (N = 13)
0 1 2 3 4
Goals and Objectives
Utilization of Talents
Trust and Conflict
Leadership
Team Procedures
Communication
Problem Solving
Creativity
Evaluation
Number of Votes
Th
e N
ine
Su
rvey
Ca
teg
ori
es
Survey Categories that Received a Need for Improvement Score of 2 -
MET Senior Design Students - Spring '12 End (N = 13)

Team Effectiveness and Project Management in a Student Team Environment 152
Appendix O
Figure O6. Student Rating Pattern for Survey Question 10 – MET Senior Design
Students – Spring ’12 End. N = Number of valid responses.
0 1 2 3 4
Goals and Objectives
Utilization of Talents
Trust and Conflict
Leadership
Team Procedures
Communication
Problem Solving
Creativity
Evaluation
Number of Votes
Th
e N
ine
Su
rvey
Cate
gori
es
Survey Categories that Received a Need for Improvement Score of 3 -
MET Senior Design Students - Spring '12 End (N = 13)