team gravitÉ graph visualization and interactive … activity report inria 2007 in response to this...
TRANSCRIPT

c t i v i t y
te p o r
2007
THEME COG
INSTITUT NATIONAL DE RECHERCHE EN INFORMATIQUE ET EN AUTOMATIQUE
Team GRAVITÉ
Graph Visualization and InteractiveExploration
Futurs


Table of contents
1. Team . . . . . . . . . . . . . . . . . . . . . . . . . . . . . . . . . . . . . . . . . . . . . . . . . . . . . . . . . . . . . . . . . . . . . . . . . . . . . . . . . . . . 12. Overall Objectives . . . . . . . . . . . . . . . . . . . . . . . . . . . . . . . . . . . . . . . . . . . . . . . . . . . . . . . . . . . . . . . . . . . . . . . . 1
2.1. Introduction 12.2. Highlights 2
3. Scientific Foundations . . . . . . . . . . . . . . . . . . . . . . . . . . . . . . . . . . . . . . . . . . . . . . . . . . . . . . . . . . . . . . . . . . . . .23.1. Introduction 23.2. Visual Graph Mining 33.3. Visual Analytics for Graphs 4
4. Application Domains . . . . . . . . . . . . . . . . . . . . . . . . . . . . . . . . . . . . . . . . . . . . . . . . . . . . . . . . . . . . . . . . . . . . . .54.1. Introduction 54.2. Social sciences 64.3. Biology and bio-informatics 64.4. Strategic watch 7
5. Software . . . . . . . . . . . . . . . . . . . . . . . . . . . . . . . . . . . . . . . . . . . . . . . . . . . . . . . . . . . . . . . . . . . . . . . . . . . . . . . . . 76. New Results . . . . . . . . . . . . . . . . . . . . . . . . . . . . . . . . . . . . . . . . . . . . . . . . . . . . . . . . . . . . . . . . . . . . . . . . . . . . . . 9
6.1. Graph Drawing 96.1.1. Improving Performances and Readbility of Force-Directed Layouts 96.1.2. Metabolic Networks 10
6.2. Graph statistics and graph clustering 116.3. Interactive graph mining 12
6.3.1. Grouse: navigating large graph hierarchies 136.3.2. Hierarchies 136.3.3. Navigating large databases 146.3.4. Applications 15
7. Contracts and Grants with Industry . . . . . . . . . . . . . . . . . . . . . . . . . . . . . . . . . . . . . . . . . . . . . . . . . . . . . . 178. Other Grants and Activities . . . . . . . . . . . . . . . . . . . . . . . . . . . . . . . . . . . . . . . . . . . . . . . . . . . . . . . . . . . . . . 17
8.1. ANR Systryp 178.2. ANR SPANGEO 18
9. Dissemination . . . . . . . . . . . . . . . . . . . . . . . . . . . . . . . . . . . . . . . . . . . . . . . . . . . . . . . . . . . . . . . . . . . . . . . . . . . 1910. Bibliography . . . . . . . . . . . . . . . . . . . . . . . . . . . . . . . . . . . . . . . . . . . . . . . . . . . . . . . . . . . . . . . . . . . . . . . . . . .19

1. TeamGRAVITÉ is a joint project with CNRS (UMR 5800 LaBRI), University Bordeaux I and ENSEIRB. The teamhas been initiated on April 2007 and is expected to be created as a project in the coming year.
Head of project-teamGuy Melançon [ University Professor, Université Bordeaux I, HdR ]
Administrative assistantLaetitia Grimaldi [ Secretary (SAR) Inria ]
Research scientistMaylis Delest [ University Professor, Université Bordeaux I, HdR ]David Auber [ Assistant Professor, Université Bordeaux I ]
Technical staffPatrick Mary [ Research Engineer, Université Bordeaux I ]Morgan Mathiaut [ (Non permanent staff) Research Engineer, Université Bordeaux I ]
Research scientists (external)Jean-Philippe Domenger [ University Professor, Université Bordeaux I, HdR ]
PhD studentsFanny Chevalier [ Université Bordeaux I ]Romain Bourqui [ Université Bordeaux I ]Pierre-Yves Koenig [ Université Montpellier 2 ]Trung Tien Phan Quang [ Université Bordeaux I ]Faraz Zaidi [ Université Bordeaux I ]Paolo Simonetto [ Université Bordeaux I ]
Visiting scientistsJames Abello [ DIMACS Research Center / Rutgers University, Piscataway, USA, from October 1st tillOctober 31 ]Alexandru C. Telea [ Universiteït van Gröningen, Pays-Bas, from October 1st till December 31 ]
2. Overall Objectives
2.1. IntroductionA recent U.S. report to the funding agencies NIH and NSF [31] provides strong arguments in favor of thedevelopment of visualization as a research field.
“Visualization is indispensable to the solution of complex problems in every sector, fromtraditional medical, science and engineering domains to such key areas as financial markets,national security, and public health. Advances in visualization enable researchers to analyzeand understand unprecedented amounts of experimental, simulated, and observational dataand through this understanding to address problems previously deemed intractable or beyondimagination.”
[from the Executive summary of [31]].
Visualization is becoming a critical issue in a number of areas. It is more and more seen as a complementaryapproach - not only as a tool - for data retrieval and exploration or strategic and competitive watch, forinstance, where the structure of data is typically unknown and must be discovered and understood. It is also areliable approach when navigating already known and structured information space such as large ontologies.Information Visualization usefully combines with Scientific Visualization to help expert users explore andunderstand complex models underlying large scale simulations.

2 Activity Report INRIA 2007
In response to this challenge, GRAVITÉ aims at designing interactive visualization methods and tools toanalyze and mine large datasets. Our emphasis is on the visualization of graph structures to help users gaininsights from large datasets and large-scale simulations, to understand the data and/or the underlying model,and ultimately, to identify intrinsic properties or emergent phenomenon.
More than just being able to deal with large volume and inhomogeneous data, we are required to deal withconstant changes in data, possibly making it ambiguous and uncertain. In the context of graph visualization,the challenge we face is thus to design methods and tools:
• to deal with large and dynamically changing graphs;
• to visually identify salient properties in changing substructures;
• identify the multiscale nature of data;
• to produce visual cues helping the user to track such changes in either one three different situationswhere dynamic graphs occur.
A clear priority for our research is to address the needs of expert users faced with interpreting dynamic data.Our agenda is based on the needs expressed by our research community [66] [31] [32]. Our collaborations withexperts of other scientific fields as well as with industry contribute to the overall organization of this researchagenda and serve a twofold objective:
• to build theoretical knowledge relevant to information visualization and visual analytics, and developa sound methodology for graph visualization and navigation;
• to target transfer opportunities favoring the adoption of our ideas and technology by other scientificcommunities and by the industry.
2.2. Highlights• i) Fanny Chevalier working under the supervision of Maylis Delest and Jean-Philippe Domenger has
been awarded the Best Student Paper Award [27] at the CBMI 2007 International Conference forher work on object retrieval in video content based on graph mining. CBMI is a yearly internationalconference bringing together the various communities involved in the different aspects of Content-Based Multimedia Indexing. It is the main international forum for the presentation and discussion ofthe latest technological advances, industrial needs and product developments in multimedia indexing,search, retrieval, navigation and browsing.
• ii) Guy Melançon was invited to participate to a one week Dagstuhl Information Visualization Sem-inar allowing a critical reflection on actual research efforts, the state of field, evaluation challenges,etc. See the web page http://www.dagstuhl.de/programm/kalender/semhp/?semid=30839. The out-come of the seminar will be published as a book that should document and extend the findings anddiscussions (Springer LNCS series).
3. Scientific Foundations
3.1. IntroductionThe visualization of data or information with the help of a computer, most often referred to as InformationVisualization, originated from ideas in fields as diverse as computer graphics, computer-human interaction,cognitive psychology, semiotics, graphics design, cartography and graphical arts. One of its early motivationswas to help users explore and analyze large quantities of data by developing software tools exploiting humanvisual capabilities according to [87], 40% of our cortical activities are dedicated to processing visual signals.

Team GRAVITÉ 3
The design of new visualization methods and tools becomes even more necessary with the continuouslyincreasing volume of available data, which poses a problem that obviously cannot be solved by relying solelyon the increase of CPU power. According to the « How much information » project developed at Berkeley,one exabyte of data (1 million terabytes) was produced in 2001, with 99,997as individual data productioncorresponded to 800 megabytes per person in one year on the whole planet [80]. This abundance of informationof course raises many questions and problems to solve. A number of research fields now contribute in their ownway to the design of methods and tools to exploit this richness of information, among which visual approachesexperience growing success.
3.2. Visual Graph MiningVisually mining data requires astutely combining data analysis with visual graphics and interaction. Miningitself draws not only on statistics but in a rather astute mixture of mathematical rigor and heuristic procedures.As David Hand puts it [62], [61] :
“To many, the essence of data mining is the possibility of serendipitous discovery of unsuspectedbut valuable information. This means the process is essentially exploratory.”
From Hands perspective, we see that visualization has much to share with data mining because visualizationoften comes as an aid to exploratory analysis. The analysis task we are concerned with however differs fromthat conducted by dataminers, in that we seek to be able to produce readable and interactive visualizationsrather than coming up with reasonable, arguable and final conclusions on the data. The perspective to adopt isa combination of (semi) automated data processing together with human analytical and perceptual capabilities.Although relying on technology, the analysis task remains in total control of the human user. The NVACresearch agenda [32] clearly states:
“[The] analysis process requires human judgment to make the best possible evaluation ofincomplete, inconsistent, and potentially deceptive information [...]”
later calling for the development of
[...] visually based methods to support the entire analytic reasoning process, [...].
That is, in ideal cases the visualization should be designed in order not only to assist the analysis but to alsoactively contribute to its progress. Visualization thus appears as a multi-disciplinary field embracing a largespectrum of competences. This partly comes from the need to cover all processes involved in the so-calledVisualization pipeline as depicted here:
Figure 1. Visualization pipeline (adapted from [92]).
A decade ago, Ben Shneiderman1 - who definitely helped Information Visualization to gain scientific visibility- suggested that visualization scenarios should obey his now celebrated mantra “Overview first, zoom and filter,then details on demand” [82]. The pipeline is coherent with Shneidermans mantra which actually provides an
1Ben Shneiderman is professor in the Department of Computer Science, and Founding Director (1983-2000) of the Human-ComputerInteraction Laboratory at the University of Maryland (USA).

4 Activity Report INRIA 2007
excellent framework applying to almost any visualization environment. The back arrows correspond to theuser interacting on the view, asking for details or zooming in on a particular subset of the data.
Daniel Keim has recently proposed a revised mantra, changing the focus towards data analysis2:
Analyse First - Show the Important - Zoom, Filter and Analyse Further - Details on Demand
Keims mantra is closer to our perspective, merging graph mining together with visualization resulting ineffective visual analytics for relational data. However, the visualization process is not a linear one as mightsuggest the plain reading of the mantras and pipeline. The analyst exercises its exploration cyclically iteratingthrough Shneiderman and Keims analysis/overview/zoom/details process. This is what makes visualization sodifferent from graphical statistics and presents a real challenge. The back arrows in Fig. 1 actually encapsulatea complex process through which the user gains insight and understanding on the visualized data. A moreuser-centred depiction of the same visualization process is given in the NVAC document:
More recently, van Wijk suggested how to measure the effectiveness and benefits of a visualization in termsof learning efforts and acquired knowledge [93].
3.3. Visual Analytics for GraphsGraphs offer a powerful and flexible mathematical tool to model real life phenomena. Biologists naturally usegraphs to infer relationships between subcellular components (proteins, peptides, genes, RNAs, molecules,...). Geographers have long used graphs to represent exchange networks (roads, air traffic, immigration, ).Sociologists heavily rely on the use of graphs to study social networks. In all cases, the visual inspection of anetwork supports the analysis of its community structure and helps to answer questions concerning prominentactors (proteins; cities; manager; logical entity) or subgroups (biological function; territory; team; logical unit).The identification of communities in a network is an essential step towards understanding the whole networkarchitecture. Once a subgroup has been identified, and when it appears as such within the visualization, itcan be zoomed in to allow a more detailed inspection of its own dynamics. Graphs also appear as a naturalmodelling tool in computer science itself (data structures, web graphs, workflows, etc.).
Graphs moreover become a profitable metaphor when studying data equipped with a similarity measure eitherinherited from the data or computed from semantic attributes. A graph can readily be constructed applying athreshold on similarities. The use of a correlation measure to infer similarities is a common approach bringingsimilarities into the picture when analyzing data.
The case of image classification/indexing is typical. Structural indicators such as the MPEG-7 colour structuredescriptors [73] [83] can be computed for each image; as a consequence, the similarity between any twoimages can be computed as a [0, 1] value. Images being highly similar can then be considered as neighboursin a (weighted) graph, enabling the analyst to exploit analytical tools borrowed from graph drawing, graphalgorithmics, graph theory and combinatorial mathematics.
Bio-informatics also provide other interesting examples. For instance, an important use of DNA microarraydata is to annotate genes by clustering them on the basis of their gene expression profiles across severalmicroarrays. Because the transcriptional response of cells to changing conditions involves the coordinated co-expression of genes encoding interacting proteins, studying co-expression patterns can provide insights into theunderlying cellular processes. In this context, the (Pearson) correlation coefficient is a standard dissimilaritymeasure used to infer network structure. On the assumption that genes and their protein products carry outcellular processes in the context of functional modules, it is natural to ask whether such modular organizationcan be revealed through the study of gene or protein interaction networks.
Graph Visualization is an active subfield of Information Visualization dealing with graph algorithms tofind patterns, test properties, embed graphs in particular geometries (most often 2D or 3D Euclidean) orinteractively manipulate their representations on the screen. Each year, a number of papers accepted at theIEEE InfoVis Symposium3, the IEEE/Eurographics EuroVis Conference4 or the IEEE London Information
2See the Event Summary of the Workshop on Visual Analytics held at Konstanz University in June 2005: http://infovis.uni-konstanz.de/index.php?region=events&event=VisAnalyticsWs05
3See the URL http://www.infovis.org

Team GRAVITÉ 5
Visualization Conference5 concern graph visualization. The Graph Drawing community, with its own annualinternational symposium also contributes to the development of the field6.
When focusing on relational data (graphs), combinatorial mathematics offer tools to exploit the topologyof graphs and other structural regularities either numerically or from an algorithmic standpoint. A typicalgraph drawing algorithm will assume or test specific topological conditions such as being a tree or beingbi-connected. Visualization techniques can benefit from combinatorial knowledge on particular graphs. Onegood example picked from our own results is the use of Strahler numbers (generalized to general directed orundirected graphs) to optimize the rendering of large graphs on a screen [36]. Other examples from our groupexploit the fact that combinatorial parameters in a tree can be approximated using a Gaussian distribution [65][37], folding or unfolding subtrees as the user navigates. Community identification methods based on using anode or edge dissimilarity measure in conjunction with a clustering method have proved fruitful.
The development and full exploitation of combinatorics to feed all subprocesses of the visualization pipeline(Fig. 1) with emphasis on the data analysis part is at the heart of our project. The core strength of our teamresides in the development of combinatorial mathematics and graph algorithmics to serve the aims of graphvisualization. We deploy our mathematical and algorithmic skills in Information Visualization to develop:
• Graph statistics: that capture key properties of the data, including scalable implementations;
• Clustering methods: that handle large datasets both visually and computationally;
• Graph hierarchies: that transform large graphs into a hierarchy of smaller, more readable and easier-to-manipulate sub-structures;
• Graph drawing algorithms: that lay out large datasets rapidly, enhancing scalability and addressingdomain-specific conventions and requirements;
• Interactions: that exploit graph hierarchies as a central mechanism for navigating large graphs, whiletaking domain-specific tasks into account;
• Evaluation methods: that generate artificial datasets (randomly) based on key properties of the targetdata.
4. Application Domains
4.1. Introduction“Collaborating with Application Domains. To achieve greater penetration of visualization intoapplication domains we must better integrate visualization capabilities with the requirementsand environments of these domains. To achieve this integration, we must allow application goals,domain knowledge, and domain-specific conventions and metaphors to shape visualizationmethods. Visualization methods must address the characteristics of real, rather than ideal,data, addressing among others the challenges of heterogeneity, change over time, error anduncertainty, very large scale, and data provenance.” [31]
Visualization is by nature fed by application domains. Questions are raised by and embodied in domain specificdatasets. Working close to our end users is mandatory the users we are concerned with are experts fromspecific scientific domains or industrial sectors. Following an iterative process, the analysis/hypotheses evolveand refine while the visualization becomes more focused and adapted to the users task. Put differently, thevisualization helps expert users refine their hypotheses on the data while at the same time they become able toexpress their needs for visualization more effectively.
4See the URL http://www.eurovis.org5See the URL http://www.graphicslink.co.uk6See the URL http://www.graphdrawing.org

6 Activity Report INRIA 2007
4.2. Social sciences“Visualization has thus far had less impact on the social sciences than the physical sciences, inpart because of a dearth of funding for such efforts, but it holds the promise of effecting similartransformations.” [31]
We have the opportunity to work in close collaboration with experts from quantitative geography through theANR SPANGEO 3-year project7. We plan to make this ANR project the start of a long-term collaboration withresearchers in social sciences. This project gives us the opportunity to enter social sciences and explore thepotentialities of interactive graph visualization and graph hierarchies for geographers. Our approach clearlyappears as complementary to classical cartography.
Quantitative geography also offers us the occasion to compare graph combinatorics with tools and approachesbased on graph theory developed by geographers. Cartographers and geographers, because they often stickto the usual geographical world map to depict statistical data, are limited by the size of the dataset theycan visualize and thus visually analyze. Graph visualization offers them the possibility of visualizing andnavigating whole datasets, at the price of leaving aside geographical constraints.
Multiscale models. Our methodology exploiting hierarchical graphs [4] [10] [17] moreover appears as a fruitfulstrategy to discover scales in datasets [1].
Identifying structural changes. The data we study with quantitative geographers typically is time-stamped.That is, we often have data on populations, companies, air traffic, etc., collected through public surveys or byprivate companies over several years or months. The issues we now address is to identify structural changes orevolving patterns in networks. The task here is of great interest : the answer does not solely rely on mathematicsor algorithms, but requires that experts link the identified pattern to real-life phenomenon and assess of itsexistence based on factual arguments (territorial policies, partnerships between companies, etc.).
4.3. Biology and bio-informaticsBecause post-genomic data is made available publicly and is easily accessible on the web, biological data oftenbecomes a target for visualization techniques we develop. Protein interaction networks nowadays are easy tofind on the web; authors publishing in bio-informatics journals even sometimes provide the datasets they usedas a benchmark.
Biology offers a fertile area for research in visualization because of massive data produced from experimenta-tion, and also from a strong demand on the side of biologists. Problems in biology and bio-informatics concernalmost all issues cited above:
• graph statistics enter the scene when inferring graph structures from biological data, or wheninterpreting measures/attributes associated with the data;
• the nested structure of metabolism naturally makes use of graph hierarchies.
Strong graphical conventions in biology (when drawing metabolic pathways or RNA secondary structures forinstance) turn the design of automatic graph drawing algorithms into a real challenge. Part of our researchwas developed through the ANR AReNa project8. RNA comparisons required the development of new graphdrawing algorithms and graph visualization software [57] [5]. The Bordeaux environment places us close tobiologists and bio-informatics researchers.
We have direct collaboration with biologists and bio-informatics researchers since the LaBRI team from whichour project stems is directly concerned with bio-informatics, placing us close to the actual users (as withSPANGEO). Team members interact with researchers of the INRIA MAGNOME project; these interactionsalready gave rise to the development of the software application ProViz [68].
7SPANGEO is a working group art of the S4 European initiative, see the URL http://s4.parisgeo.cnrs.fr/spangeo/spangeo.htm8See the URL http://www.lri.fr/~denise/AReNa/

Team GRAVITÉ 7
Two recently launched ANR projects, METAPROFILE and SysTryp, should give us the occasion to renew andreinforce collaborations with researchers from INRA Toulouse (Fabien Jourdan) and CBiB in Bordeaux (An-toine de Daruvar). METAPROFILE is concerned with the identification of markers for metabolic perturbationsassociated with overweight; this type of problems clearly should raise questions related to graph clustering,requiring the use of graph hierarchies in order to deal with the considered datasets. SysTryp focuses on therelationship between metabolism and cellular differentiation in the protozoan Trypanosoma brucei, by collect-ing high resolution mass spectrometry data and reconstructing networks based on this data (see section 8.1).
We also have contributed to the study of metabolism, more recently together with researchers from the INRIAHELIX project in Lyon [13]. The questions addressed through this starting collaboration this time concern theidentification of biological patterns in metabolic or signal networks.
4.4. Strategic watchAll actors from the industry and from public domain are now forced to store and filter huge amounts ofinformation in digital formats on subjects concerning their domain of activity. This state of affairs calls forthe development of technologies capable of helping human users to explore, filter and organize informationand moreover discover concepts from non-structured or semi-structured data. After we had recognized herea situation where graph visualization could help, we grouped with industrial actors in a technology transfereffort. Although the industry can certainly benefit from our actual expertise, the project nevertheless requiresgenuine research.
Our research in this field is conducted in close collaboration with the industry and focuses on developingtechniques and tools devoted to competitive and strategic watch. We actually work within the framework ofa 2-year project funded by the ANR (RNTL program). This project will be concerned with processing on-line streamed data. Our work builds on top of the AMI Intelligence software from AMI Software9 processinghuge amounts of digital, numerical and textual data we still need to sort, classify, induce a topology on andcluster. The development of visualization software components is accomplished in collaboration with PIKKOSoftware10.
The goal is to propose incremental statistics and adjusting visualizations to support competitive and strategicwatch. Ultimately, analysts want to be able to identify pieces of information that might act as an outlierat a given moment, but that will confirm tendencies to come. These pieces of information are what Ansoffcalled weak signals [33]. We are here out of the reach of classical statistics: analysts need to inject theirknowledge and intuition in the system to help judge of anecdotic situation and put pieces of information undersurveillance.
We plan to focus our efforts on graph visualization, since most of the processed data can naturally be equippedwith relations. Thus the project requires the design of astute graph statistics and adaptative algorithms that canadjust with a highly changing environment.
We see in this project a real opportunity to address issues raised by the processing of on-line streamed data.Most certainly the project will encounter questions that will have to be put aside (because of the nature ofthe research contract with the industry) and be studied later from a purely theoretical standpoint. In a sense,the project will bring substance from which we plan to gain expertise on the processing and visualization ofdynamic data.
5. Software5.1. Tulip: a scalable Graph Visualization Framework
Keywords: Framework, Graph Library, Graph Visualization, OpenSource.
9See the URL http://www.amisw.com10See the URL http://www.pikko-software.com
8 Activity Report INRIA 2007
Participants: David Auber [correspondant], Patrick Mary.
See also the web page http://www.tulip-software.org.
Most of our work requires experimentation and validation. To this end, our group uses the Tulip graphvisualization framework designed and developed by David Auber [3]. Tulip offers a C++ plug-in mechanismeasing the development and adjunction of new algorithms (computing graph statistics, graph drawing or graphclustering). This actually is a main feature of the Tulip platform [40]. We do however experiment with otherinformation visualization platforms such as the InfoVis Toolkit developed at INRIA [51] and prefuse [63] bothbased on Java technology.
Tulip implements astute data structures, data management and filtering/inheritance mechanisms. Its renderingengine relies on OpenGL, while its GUI rests on Trolltechs QT library. The main interaction paradigm offeredby Tulip is the computation and direct manipulation of graph hierarchies, making it unique among all availablegraph visualization platforms such as Pajek [45] [91], [59] [49], [50] and others.
Tulips architecture eases the construction of stand-alone and specialized applications. An application targetedat domain specific data can be realized through the selection of building blocks (data structures, existing plug-ins), customization/development of a QT-based GUI, and adjunction of specific plug-ins. Tulips popularity isconfirmed by its (approximately) 1000 downloads / month since it was ported on sourceforge. Tulip is alsoshipped with several Linux releases. Its unique C++/Linux plug-in mechanism has recently been the focus ofa short article in a wide audience French magazine [40].
We can list several applications that were built from Tulip:
• EVAT was explicitly designed for the navigation and comparisons of huge trees (file systems,classification of species) and won our team a second place at the InfoVis Annual Contest [6];
• SWViz implemented a specific hierarchical clustering algorithm for multilevel visualization andnavigation of small world networks (social networks, software re-engineering graphs, etc.) [4];
• ARNa implements an astute planar graph drawing algorithm capable of producing drawing of RNAsecondary (2D) structures that mimics hand made drawing by biologists; the software is moreoverdesigned to support the visual comparison of two RNA structures, finding the most commonsubstructures and deciding of a best viewpoint on the drawings [56];
• Tulip again was second place at the InfoVis Annual Contest in 2004, helping to explore andunderstand the organization and evolution of an information space made from InfoVis publications,author, topics, over the past ten years [11].
We should also mention the use of Tulip framework without declining it into a specific application byother research teams. The Sorenson Molecular Genealogy Foundation studies population genealogy from amolecular biology perspective [79], where graph clustering is astutely used to trace back genealogy fromDNA data. Roman et al. use Tulip to support their work on many-assets market modelling. Because of itsplug-in mechanism, and of its openness, Tulip has been adopted by quite a large part of the Linux community- it is actually distributed in several Linux releases.
Additionally, although Tulip was originally intended to be used by a single user on a desktop workstation, itsmodular architecture allows us to explore its use in a collaborative setting [43] [42] [41]
5.1.1. PerspectivesOur team develops and uses Tulip for its own needs. Tulip is more than just a visualisation application,although the framework is shipped with an already usable user interface. Tulip has received much attentionfrom the scientific community [35] [3].
Software modules from Tulip can be used separately to build customized applications requiring acute graphdata management or basic graph visualization algorithms. Based on C++, OpenGL and QT from Trolltech,it makes use of the full capabilities of standard desktop computers now equipped with high-end graphicshardware.
Team GRAVITÉ 9
We already have listed applications that were built from Tulip. Our work with geographers within the ANRproject SPANGEO should lead to the development of a specific application dedicated to the visualization andnavigation of spatial graphs in quantitative geography. This should allow us to enter the scene in the field ofsocial network analysis, competing with Pajek [91], for instance.
Part of Tulips evolution will certainly rely on our ability to feed the framework with new algorithms andvisualization techniques, as it has been the case since now. But there is a more challenging evolution we wishto address.
At the moment, Tulip appears as a rich collection of algorithms easing experimentation with large graphs.The next step is the construction of a development kit « à la Eclipse », enabling users to switch betweenperspectives, going from a pure algorithmic perspective to a task-centered one. A perspective here must beunderstood as a collection of GUI tools and associated plug-ins just as what can be found for Eclipse.
Selecting a file system perspective could bring together specific graph drawing algorithms and graph statistics,graph clustering algorithms, relevant interactors, etc. Other perspectives are possible: social network analysis,RNA comparisons, software re-engineering or software visualization, etc. We are confident that our experiencein designing domain specific application from Tulip will help.
This subproject is a real challenge in itself in that it will most certainly require the adoption, developmentand/or adjustment of a taxonomy for data, tasks and/or application domains from which perspectives (« à laEclipse »11) can be defined [72] [48] [71] [82] [47] [44] [46] [64] [86] [52] [85] [69].
It will most certainly require the development of a more ambitious type of plug-in, that we might call “domainspecific” plug-in, or “task-oriented” plug-in, meaning that it combines proper algorithmics, drawing andinteraction relevant for a given application domain or given type of tasks offering, a kind of bouquet of moreelementary plug-ins combining into a visualization environment.
The actual architecture of Tulip, assembling independent modules, seems ready for this type of evolutionwithout requiring a total rewrite of the framework. A web service project (Tulip plugin manager web service12)has already been created on sourceforge with that mid and long-term evolution of Tulip in mind.
We also should underline the impact and benefit of such an approach for the industry, easing the adoptionor integration of Tulips technology into their own. The development of perspectives could also evolve intocommercial products some Eclipse perspectives already are.
6. New Results
6.1. Graph DrawingKeywords: Graph Drawing.
Participants: David Auber, Romain Bourqui, Patrick Mary.
6.1.1. Improving Performances and Readbility of Force-Directed LayoutsForce-directed layouts form a central graph drawing paradigm in Information Visualization because graphscoming from real-life applications rarely possess specific topological properties such as being trees, acyclicor planar, etc. Simulating physical systems induced from graphs, where nodes represent masses and edgescorrespond to springs, has proved to provide visually pleasant and structurally significant results. The basicversion of these algorithms however run in time O(N3) which doesn’t make them suitable for the drawing oflarge graphs.
11Eclipse is an open source SDK primarily developed and maintained by IBM, originally intended for the Java developer community.Its success basically emerges from its ability of integrating various plug-ins, offering services such as name completion and easy editing,code versioning, debug, etc.
12See the URL sourceforge.net/projects/tulip-plugin-ws/.

10 Activity Report INRIA 2007
The recent development and easy availability of graphics computing units, made it possible to implementthe simulation of forces directly on the GPU [19]. Both the NVIDIA GeForce GO 7400 and the NVIDIAGeForce 8800GTX were benchmarked. The improved performance makes it possible to deal with much largergraphs than what was possible solely usng the CPU. These results compare with those obtained by Frishmanand Tal [55] [54]. Munzner also implemented MDS embeddings on the GPU with similar results [67]. Thisimprovement is accomplished by astutely mapping node coordinates to graphics texture on the GPU. Computethe various forces in the drawing model then allows to fully benefit from the graphics engine.
Another important aspect of force-directed graph algorithm is the readability of the resulting drawings. Inother words, being able to draw larger graphs in reasonable time is not the sole issue, we also need to providereadable and thus easily interpretable diagrams.
Noack had brilliantly demonstrated [77] [78] how and why the force model is able to group nodes into denseclusters. However, it may sometimes be useful if not mandatory to identify clusters ahead of the layout phase.In that case, making explicit use of the clustering and rendering it graphically provides good visual cues andsupports the visual analysis of the clustering. We have designed an algorithm capable of dealing with such asituation, where clusters are forced to sit into Voronoï cells computed from the clustering itself [24].
Figure 2. Voronoï cells are displayed as semi-transparent convex hulls emphasizing the organization of components.
The main task performed by the algorithm is to embed nodes in Euclidean space in order to reflect distancesbetween data elements computed from attributes. However the challenge is to satisfy this constraint for nodesbelonging to a same cluster, as well as for nodes belonging to different clusters, while avoiding that convexhulls of clusters overlap. On the other hand, the algorithm uses a variation of the GRIP algorithm [58] toimprove on time complexity.
6.1.2. Metabolic NetworksAll biology textbooks use graphical node-link representations of metabolic networks following typical graph-ical conventions. Nowadays, the KEGG project offers clickable gif images of various predefined pathwaysdrawn as planar graphs – at the sake of duplicating nodes if unavoidable [34].
Team GRAVITÉ 11
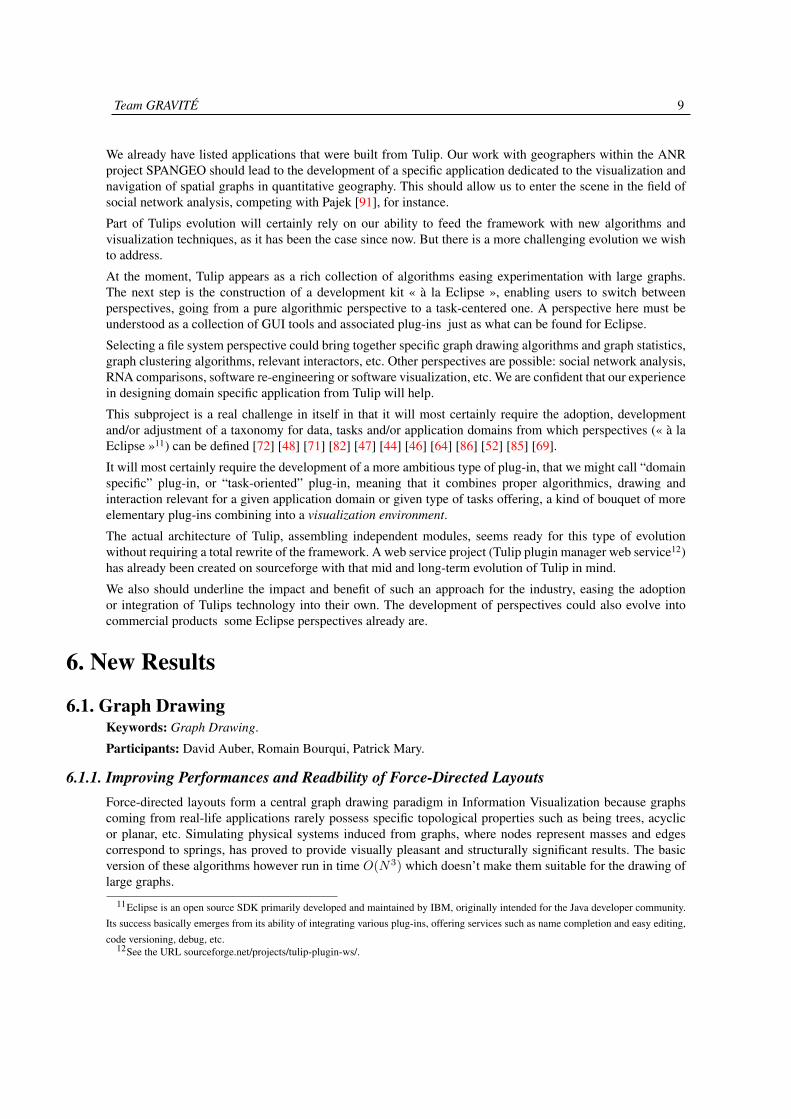
We have designed an algorithm capable of drawing pathways complying with most graphical conventionsfrom biology without introducing duplicate nodes [13] as with KEGG. Although the introduction of duplicatenodes improves the readability of the pathway (making it planar), it does impact on its interpretation since thetopology of the real network is altered.
Figure 3. Drawing of the metabolic network with zooms showing how information is organized into levels.
Hence, our first contribution is to provide a good quality drawing of metabolic networks that strictly reflectsthe topology of the studied network. Additionally, the usefulness of the algorithm comes from the fact thatit provides visual feedback on any given pathway – not only on predefined or generic pathways. Until now,when studying a given organism, biologists “borrow” pathways from another organism making the implicitassumption that their metabolism compare. Our algorithm makes it possible to readily use the available dataand build a representation of the studied pathway so the visual analysis can be conducted on the exact data.
The issues we address is that of measuring how much the drawing can follow usual graphical conventions,given that the metabolic network we need to draw might mix different pathways. Now, because pathwaysshare enzymes and/or metabolites and given that we avoid duplicating nodes, we need to decide whether agiven pathway can be drawn “as usual”. This decision is taken based on a graph coloring algorithm capable ofdetecting whether two pathways overlap or not. The algorithm can also be supervised to require that any givenpathway be drawn “as usual”.
6.2. Graph statistics and graph clusteringKeywords: Graph clustering, centrality measures, similarity measures.
Participants: Fanny Chevalier, Maylis Delest, Jean-Philippe Domenger, Guy Melançon.
One of the building block of our methodology is that of designing and studying graph statistics [37] [39] [38].The combination of these graph statistics together with graph clustering had provided a successful approach forthe interactive and multi-level exploration of small world networks [4]. The application of these techniques tothe worldwide air passenger traffic [1] was at the start of a fruitful collaboration with geographers (SPANGEOANR project 2006 – 2009).
Our approach to graph clustering based on graph statistics competes with that developed by others in the areaof research coined as “Network Science” [88] [90] [89] [76]. In a recent survey article [17], we proposed acomparative study between our approach and that by Newman and Girvan [60] [75].

12 Activity Report INRIA 2007
Figure 4. Image segments are organized into a graph further mapped onto a dag.
Although “network science” emerged from seminal papers in social network analysis (see [74] [53] and [81]),its underlying principles, heuristics and methodology proves to be relevant in many others areas such asspatial geography, economics, biology and bio-informatics, to name just a few. Combined expertise on imagesegmentation together with graph mining enabled our team to develop a proficient approach to retrieve objectsthat have been automatically extracted from video content [15] [14] [27].
Our method develops in the context of the “rough indexing paradigm”. In this context, the video data hasvery low spatial and temporal resolution because it comes from partially decoded MPEG compressed streams.Based on this paradigm, we perform object retrieving in near real time due to faster computation on rough datathan on original full resolution frames.
Image segmentation is used to infer a graph describing its structure. A sequence of images then transfers intotransformations onto the graph structure. Since data are rough, segmentation is inaccurate and the regionsfeatures (texture, color, shape) are not strongly relevant. In this way, the structure of the objects, that shouldremains stable over time, must be considered in order to improve the robustness of the matching of regions.A fast heuristic aiming at the identification of salient properties in the graph then enables the identificationof features in the video. Incidentally, these result bring us on the road to the identification of changingsubstructures in dynamic graphs.
These ideas naturally extend to other application domains, sometimes requiring specific visualization. Forinstance, we have been able to apply our graph matching approach to study the evolution of source code fromCVS archive [26]. Our process enables the extraction of the complete annotated syntactic tree (AST) from thecode. Our method aims at finding code blocks that remained stable between two successive versions of a file(e.g. similar sub-trees into the ASTs). Small changes in the source code are not very important and the findingof similar patterns between the trees is appropriate here because of its ability to find code blocks based onsimilarity instead of being strictly identical.
6.3. Interactive graph mining

Team GRAVITÉ 13
Participants: David Auber, Romain Bourqui, Fanny Chevalier, Maylis Delest, Jean-Philippe Domenger,Pierre-Yves Koenig, Guy Melançon.
Interactive graph mining is what we aim at designing and realize. Efficient visual analytics requires to astutelycombine interaction with together with graph statistics and graph drawing.
6.3.1. Grouse: navigating large graph hierarchiesThe Grouse visualization system [18], designed with collaborators from the University of British Columbia(Canada), provides the user with the possibility of navigating large graphs. To simplify the graph, we run apipelined feature detection algorithm first searching for structures such as subtrees and biconnected compo-nents. Subtree“tree of biconnected components” as quotient. The identification of specific sub-structures ispursued and each biconnected component is then compared to a grid or a cliques.
At its last stage, the pipeline is left with subgraphs not showing any particular structure but being dense (non-tree, denser than biconnected). Such cases are dealt with by applying the algorithm designed in [4] whichproved to be efficient with graphs having high clustering coefficient. This pipelined decomposition has beenpublished independently [12].
Figure 5. Grouse enables the user to interactively enter components as they unfold.
The pipeline results into a hierarchy of subgraphs that can be used to navigate the whole dataset. However,the hierarchy also contributes into defining well suited interaction and is unfolded/folded as the user zooms inand out. Together with search widgets to rapidly go to a target component, the method proves to be extremelyuseful.
6.3.2. Hierarchies

14 Activity Report INRIA 2007
Figure 6. The DagMap comes equipped with adapted interaction to help gain details on lower levels and yetrecover structure from upper levels.
Hierarchies appear as a natural and important structures encoding information. Although they classically mapto trees, they also encode inheritance relations where nodes have multiple direct ancestors (parents). Theseinheritance relations are described with acyclic directed graphs (DAGs).
We had the opportunity to study large hierarchies describing how world companies relates with their sub-sidiaries, and subsidiaries of these subsidiaries, and so on and so forth. Because classical node-link diagramshave limitations, we designed an extension of Treemaps to fit DAGs into these space-filling representations(or mosaic displays) [28]. The basic idea is to deploy a DAG into a tree by duplicating nodes with multipleancestors. The dagmap as we call it, comes equipped with a set of possible interactions that help recoverthe DAG structure. Selecting a node, for instance, higlights its occurences at various levels in the Treemaprepresentation.
The application of the dagmap within the SPANGEO project helped geographers identify and compare thestrategies companies develop when developing part of their activity abroad [23].
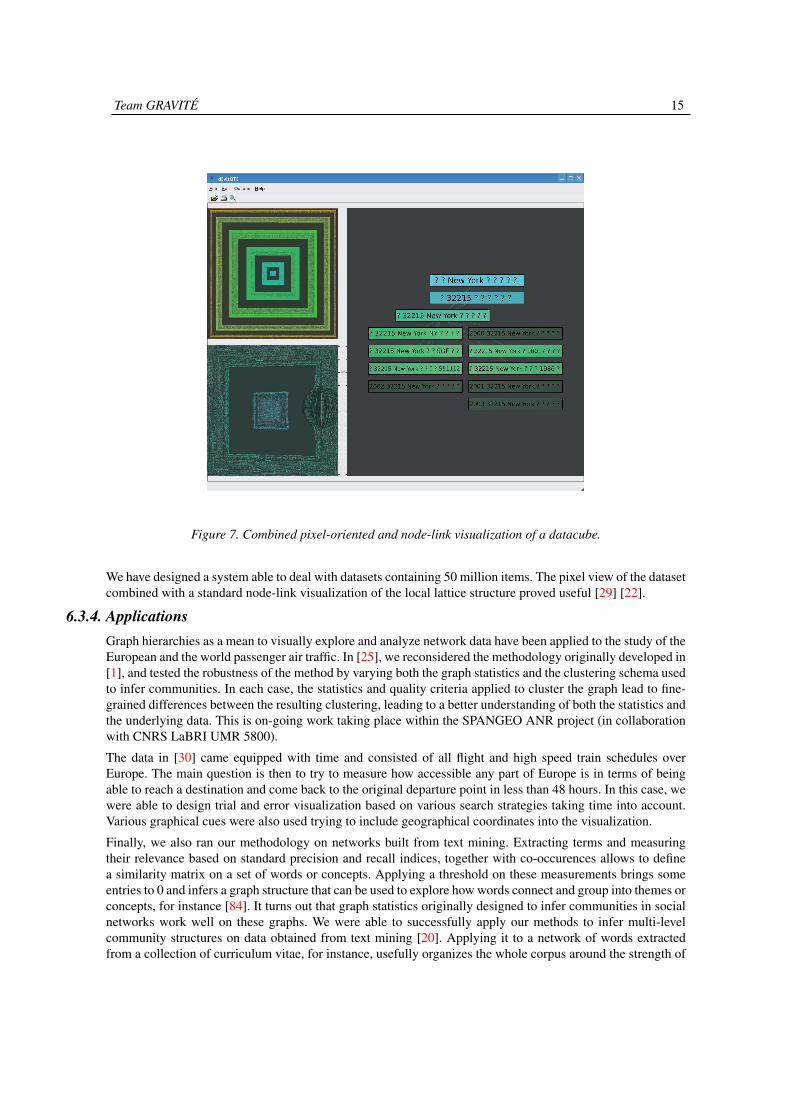
6.3.3. Navigating large databasesWe also investigated pixel-oriented paradigms in order to push the limits of scalability and navigate datacubes.Datacubes more or less give rise to lattices describing how data elements merge into “cuboids” according tovarious aggregation criteria. The visualization of this lattice then provide feed back on how the aggregatesdistributes over the lattice. The lattice however cannot be visualized through the usual Hasse diagram becauseof its size.
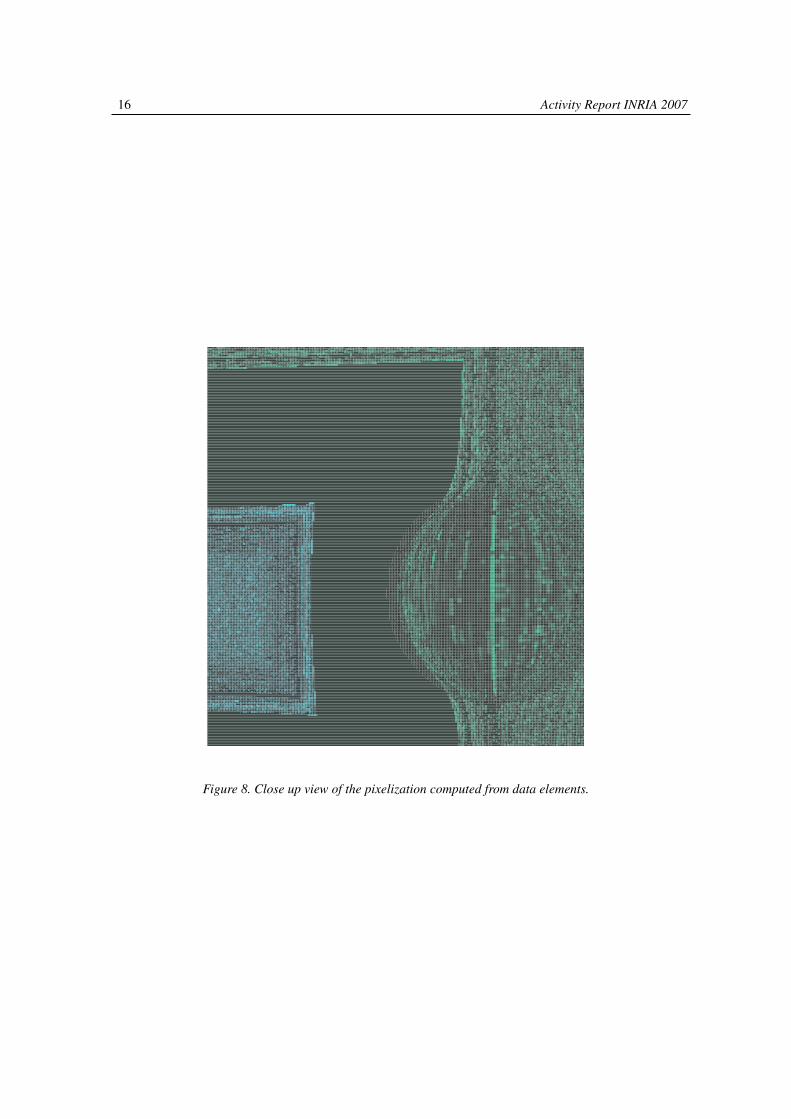
Recursive patterns defining space filling curves provide a good way to map elements to pixels allowingthe visualization of very large collection [70]. The recursive patterns makes it so that elements mapped tonearby pixels are indeed semantically close to each other. Patterns formed by nearby pixels together with theirvariations over the whole space provide useful feedback to further guide the navigation and analysis of thedata.
Team GRAVITÉ 15
Figure 7. Combined pixel-oriented and node-link visualization of a datacube.
We have designed a system able to deal with datasets containing 50 million items. The pixel view of the datasetcombined with a standard node-link visualization of the local lattice structure proved useful [29] [22].
6.3.4. ApplicationsGraph hierarchies as a mean to visually explore and analyze network data have been applied to the study of theEuropean and the world passenger air traffic. In [25], we reconsidered the methodology originally developed in[1], and tested the robustness of the method by varying both the graph statistics and the clustering schema usedto infer communities. In each case, the statistics and quality criteria applied to cluster the graph lead to fine-grained differences between the resulting clustering, leading to a better understanding of both the statistics andthe underlying data. This is on-going work taking place within the SPANGEO ANR project (in collaborationwith CNRS LaBRI UMR 5800).
The data in [30] came equipped with time and consisted of all flight and high speed train schedules overEurope. The main question is then to try to measure how accessible any part of Europe is in terms of beingable to reach a destination and come back to the original departure point in less than 48 hours. In this case, wewere able to design trial and error visualization based on various search strategies taking time into account.Various graphical cues were also used trying to include geographical coordinates into the visualization.
Finally, we also ran our methodology on networks built from text mining. Extracting terms and measuringtheir relevance based on standard precision and recall indices, together with co-occurences allows to definea similarity matrix on a set of words or concepts. Applying a threshold on these measurements brings someentries to 0 and infers a graph structure that can be used to explore how words connect and group into themes orconcepts, for instance [84]. It turns out that graph statistics originally designed to infer communities in socialnetworks work well on these graphs. We were able to successfully apply our methods to infer multi-levelcommunity structures on data obtained from text mining [20]. Applying it to a network of words extractedfrom a collection of curriculum vitae, for instance, usefully organizes the whole corpus around the strength of
16 Activity Report INRIA 2007
Figure 8. Close up view of the pixelization computed from data elements.

Team GRAVITÉ 17
the applicants. This work also provide us the opportunity to collaborate with software companies interested indeveloping decision support software [16] [21] based on visual analytics.
7. Contracts and Grants with Industry
7.1. Strategic WatchParticipants: Guy Melançon, Maylis Delest, David Auber, Jean-Philippe Domenger, Patrick Mary, FarazZaidi.
• Project: FIVE Fouille Interactive, Veille, Visualisation et Exploration
• Call: ANR Software Technology (RNTL)
• start/end April 2007 – April 2009
• Budget: 964 970 euros (total) / 390 360 euros (grant) / 25 970 euros (INRIA)
We are involved in a project with two small size companies, AMI Software developing text lining software andPIKKO Software developing visualization software components. This project is funded through the nationalANR RNTL FIVE (Software Technology 2007 call).
The project emerged from the need for companies to deal with large volume of new, inhomogeneousinformation on a daily basis with the aim of exploiting this information through their decision making process.This state of fact is not new: this is partly what risk management and strategic watch are concerned with.Collecting and analyzing this information has but a few things to share with information retrieval as it wasclassically designed. The surveillance and the collection of information is now performed on implicit domainsand no standard methodology or tool has yet established as a standard.
The FIVE project aims at developing visual approaches to support information collection through graphicalrepresentations and interaction well suited to tasks conducted by information analysts.
AMI Software (http://www.amisw.com) develops software tools to enhance decision making. AMI’s technol-ogy supports text mining, entity and concept identification in open and non structured information. PIKKOdevelops visualization components that can be easily integrated into existing information systems.
We bring in our expertise in data (graphs) analysis and graph visualization and navigation. The project requiresthat we conduct a fine-grained study of potential visualization in the context of text analysis and visualization.
8. Other Grants and Activities
8.1. ANR SystrypParticipants: Guy Melançon, David Auber, Paolo Simonetto.
• Project: SysTryp (Metabolomic systems biology analysis of differentiation in trypanosomes)
• Call: ANR Systems Biology (bilateral FR-UK)
• start/end December 2007 – December 2010
• Budget: 299 980 euros (grant French partners) / 89 338 euros (INRIA)
The project focuses on the study of the relationship between metabolism and cellular differentiation in the pro-tozoan Trypanosoma brucei, by collecting high resolution mass spectrometry data and reconstructing networksbased on this data. Relationships between static and dynamic networks will be determined and hypothesesgenerated by seeking and visualizing metabolic network modules that associate with differentiation.

18 Activity Report INRIA 2007
A limitation in modelling of biochemical networks relates to a lack of general compatibility between staticand dynamic modelling. Here we aim to reduce this gap and provide the means by which biochemistsmove seamlessly from the global view of metabolism within a model system, provided by static modelling,to a detailed representation derived from dynamic modelling. To do so, we will design and evaluate newcombinatory and visual means to detect, within large networks, modules corresponding to key pathwaysinvolved in the system under study. To validate these graph mining methods we will model one selectedpathway using dynamic modelling and then check it experimentally. We will focus on the protozoan,Trypanosoma brucei, an extraordinary model system. These single celled organisms undergo a complex lifecycle that takes them through the divergent environments of the mammalian bloodstream through variousdevelopmental stages within the tsetse fly. As a consequence the trypanosome remodels its cellular structure,and its metabolism, to adapt to these incongruent conditions.
Once within those environments, however, they enjoy relative stability, thus their capacity to retain homeostasisis apparently pre-programmed and their metabolic network less plastic than those seen in free living organismslike yeast. Here we propose to make comprehensive measurements of the trypanosomes metabolome asthe parasites transform. Ab initio networks, where individual metabolites are linked based on chemicaltransformations between them, will be constructed along with a second set of networks of metabolites whoseabundance changes in a coordinated fashion. The various networks will be used to assist in validating theaccuracy of the overall network. Modules, comprising connected metabolites whose abundance changes in acoordinated fashion throughout the differentiation process will be identified and the components of a selectedmodule will be subject to dynamic modelling. Predictions based on the modelling will then guide reversegenetics based experiments (using gene knockout and RNA interference) to remove genes encoding enzymescentral to the modules predicted to be critical to differentiation. The impact of these genetic perturbations onthe differentiation process and on the metabolome will be assessed experimentally.
In summary, the project aims:
• (a) To use high resolution mass spectrometry to identify the metabolite composition of trypanosomesand see how the metabolome changes during the differentiation process;
• (b) To use advanced bioinformatic techniques (based on metabolic connectivity and responsecorrelation) to build metabolite networks from these cells;
• (c) To follow perturbations, and use static modelling to identify those parts of the network that areunchanged through the differentiation processes and those which respond, in a coordinated fashion,to changes during differentiation;
• (d) To use modularity properties to derive visualisation methods that allow identification of oneor more modules associated with cellular differentiation, then use them in dynamic flux modellingstudies to evaluate their cellular roles;
• (e) To use a functional genomics approach to find whether loss, or inappropriate expression of keyenzymes involved in differentiation-response pathways have a predictable impact on this process.
8.2. ANR SPANGEOParticipants: Guy Melançon, David Auber, Romain Bourqui, Maylis Delest, Trung Tien Phan Quang, FannyChevalier, Pierre-Yves Koenig.
• Project: SPANGEO (Multi-level modeling of Spatial Networks in Geography)
• Call: ANR Massive Data
• start/end January 2006 – January 2009
• Budget: 2 420 000 euros (grant all partners)
Although it started even before the team was created, we mention this project as part of our activities becauseall members are involved in its development. The project gave us the opportunity to develop deep and long-lasting relationships with colleagues working in geography.
Team GRAVITÉ 19
Geographers studying transportation and communication systems, economical and social networks or urbansystems, are confronted with matrices of increasing size that are more and more difficult to process andrepresent. The increased complexity of these networks, on various space scales, makes it hard to deal withthe entirety of the networks. Their multilevel nature is thus hard to identify leaving the analyst with anincomplete comprehension of the systems. The project aims at designing and developing operational methodsfor modeling and representing networks as multilevel spaces. A first collaboration looking at the multilevelrepresentation of the air passenger traffic worldwide network, had brought significant results, helping to modeland visualize spatial networks [1]. However, many aspects had to be carefully re-examined and developedbefore extending the methodology and tools to other issues in spatial geography.
The project thus requires the extension of graph multi-level clustering and to various geographical problems.In particular, extensions to weighted or directed graphs, or hypergraphs must be studied. Moreover, graphicalconventions were for a long time developed in cartography. It is mandatory to see how those conventionscan be taken into account when representing spatial networks because of their strong semantics (proportionalsize of the nodes, of the edges, distances between nodes, colors of nodes and colors of edges, for instance).The cooperation between geographers and computer scientists aims at producing methods, algorithms andtools able to deal with large geographical matrices and to implement a set of approaches for modeling andrepresenting these graphs. It is necessary to work collectively at the development of methods and softwaretools offering a multilevel treatment of the graphs dedicated to the fields of geography and related disciplines.The dissemination of these methods and tools in the geographical scientific community will allow a betteroperational treatment of spatial networks and a better definition of social and territorial consequences of theirevolutions.
9. Dissemination
9.1. Program committees and related activitiesMembers of GRAVITÉ are in charge of courses on Information Visualization as part of Université BordeauxI Master’s degree in Computer Science (Master recherche).
GRAVITÉ’s members have been and will be involved in program or reviewing committees of major interna-tional and national scientific events, such as:
• EGC 2007 (French) Yearly conference on Data Mining and Knowledge Management (David Auber)
• ACM Symposium on Software Visualization SoftVis 2006 and SoftVis 2008 (David Auber)
• IEEE Information Visualization International Conference 2008 (Guy Melançon)
• Guy Melançon was appointed as member of the chief editorial board of the (French) national journalI3 (http://www.revue-i3.org/).
We also take part in the ANR’s evaluation process:
• Reviewer for the ANR Massive Data program 2006 – 2009 / 2007 – 2010
• President of the ANR Massive Data program 2006 – 2009 (Maylis Delest)
• Jury member for the ANR Massive Data program 2008 – 2011 (Guy Melançon)
10. BibliographyMajor publications by the team in recent years
[1] M. AMIEL, G. MELANÇON, C. ROZENBLAT. Réseaux multi-niveaux : l’exemple des échanges aériensmondiaux, in "M@ppemonde", vol. 79, no 3-2005, 2005, http://mappemonde.mgm.fr/num7/index.html.

20 Activity Report INRIA 2007
[2] D. ARCHAMBAULT, T. MUNZNER, D. AUBER. Smashing Peacocks Further: Drawing Quasi-Trees fromBiconnected components, in "IEEE Transactions on Visualization and Computer Graphics (Proc. Vis/InfoVis2006)", vol. 12, no 5, September-October 2006, p. 813–820.
[3] D. AUBER. Tulip - A huge graph visualization framework, in "Graph Drawing Software", P. MUTZEL, M.JÜNGER (editors), Mathematics and Visualization Series, Springer Verlag, 2003.
[4] D. AUBER, Y. CHIRICOTA, F. JOURDAN, G. MELANÇON. Multiscale navigation of Small World Networks, in"IEEE Symposium on Information Visualisation, Seattle, GA, USA", IEEE Computer Science Press, 2003,p. 75-81.
[5] D. AUBER, M. DELEST, J.-P. DOMENGER, S. DULUCQ. Efficient drawing and comparison of RNA secondarystructure, Journal of Graph Algorithms and Applications, in "Journal of Graph Algorithms and Applications",vol. 10, no 2, 2006, p. 329-351.
[6] D. AUBER, M. DELEST, J.-P. DOMENGER, P. FERRARO, R. STRANDH. EVAT: an Environment for theVisualization and Analysis of Trees (2nd place - InfoVis Contest), in "IEEE Symposium on InformationVisaulization", IEEE Computer Society, 2003, p. 124-126.
[7] R. BOURQUI, D. AUBER, V. LACROIX, F. JOURDAN. Metabolic network visualization using constraintplanar graph drawing Algorithm, in "IV 06: Proceedings of the 10 International Conference on InformationVisualisation (IV06)", IEEE Computer Society, 2006.
[8] F. CHEVALIER, M. DELEST, J.-P. DOMENGER. A heuristic for the retrieval of objects in video in the frameworkof the rough indexing paradigm, in "Signal Processing : Image Communication (SPIC)", vol. 22, 2007, p.622–634.
[9] M. DELEST, A. DON, J. BENOIS-PINEAU. DAG based visual interfaces for navigation in index vidéo content,in "Journal Multimedia Tools and Applications", vol. 31, no 1, Oct 2006, p. 51–72.
[10] M. DELEST, J.-M. FÉDOU, G. MELANÇON. A Quality Measure for Multi-Level Community Structure, in"Algorithms for Scientific Computing (SYNASC), Timisoara (Romania)", IEEE Computer Society, 2006, p.63-68.
[11] M. DELEST, T. MUNZNER, D. AUBER, J.-P. DOMENGER. Exploring InfoVis Publication History with Tulip(2nd place - InfoVis Contest), in "IEEE Symposium on Information Visaulization", IEEE Computer Society,2004, 110.
Year PublicationsArticles in refereed journals and book chapters
[12] D. ARCHAMBAULT, T. MUNZNER, D. AUBER. TopoLayout: Multi-Level Graph Layout by TopologicalFeatures, in "IEEE Transactions on Visualization and Computer Graphics", vol. 13, no 2, March/April 2007,p. 305–317.
[13] R. BOURQUI, L. COTTRET, V. LACROIX, D. AUBER, P. MARY, M.-F. SAGOT, F. JOURDAN. Metabolicnetwork visualization eliminating node redundance and preserving metabolic pathways, in "BMC SystemsBiology", vol. 1, no 29, july 2007.

Team GRAVITÉ 21
[14] F. CHEVALIER, M. DELEST, J.-P. DOMENGER. A heuristic for the retrieval of objects in low resolutionvideo, in "Signal Processing : Image Communication on Content-Based Multimedia Indexing (SPIC)",Manifestations daudience internationale avec comite de selection, vol. 22, 2007, p. 622-634.
[15] F. CHEVALIER, J.-P. DOMENGER, J. BENOIS-PINEAU, M. DELEST. Retrieval of objects in video bysimilarity based on graph matching,, in "Pattern Recognition Letter", vol. 28, no 8, jun 2007, p. 939–949.
[16] C. DOUY, G. MELANÇON. La visualisation d’information au service de la veille concurrentielle, de lafouille d’information et de la supervision de systèmes complexes, in "La sécurité globale : Réalité, enjeuxet perspectives", W. AKMOUCHE (editor), Société des électriciens et des électroniciens, 2007, p. 263-271.
[17] G. MELANÇON, Y. CHIRICOTA. Visually mining relational data, in "International Review on Computers andSoftware", 2007.
Publications in Conferences and Workshops
[18] D. ARCHAMBAULT, T. MUNZNER, D. AUBER. Grouse: Feature-Based, Steerable Graph Hierarchy Explo-ration, in "Eurographics/ IEEE-VGTC Symposium on Visualization", K. MUSETH, T. MÖLLER, A. YNNER-MAN (editors), Eurographics Association, Eurographics, 2007, p. 67–74.
[19] D. AUBER, Y. CHRIRICOTA. Improved Efficiency of Spring Embedders: Taking Advantage of GPU Program-ming, in "Visualization, Imaging, and Image Processing - 2007", J. VILLANEVA (editor), ACTA press, 2007,p. 169–175.
[20] D. AUBER, Y. CHRIRICOTA, M. DELEST, J.-P. DOMENGER, P. MARY, G. MELANÇON. Visualisation degraphes avec Tulip : exploration interactive de grandes masses données en appui à la fouille de données et àlextraction de connaissances, in "EGC 2007", M. NOIRHOMME-FRAITURE, G. VENTURINI (editors), Revuedes Nouvelles Technologies de l’Information, vol. 1, Cépaduès, 2007, p. 147–156.
[21] D. AUBER, M. DELEST, C. DOUY, A. GASNE, E. FOURBOUL, L. KHOUAS, G. MELANÇON. Explorationet visualisation interactive de données complexes : un appui décisif à la veille stratégique et concurrentielle,in "Workshop Inter-disciplinaire sur la Sécurité Globale, Troyes, France", 2007.
[22] D. AUBER, N. NOVELLI, G. MELANÇON. Visually Mining the Data Cube Using a Pixel-Oriented Technique,in "11th International Conference on Information Visualisation, IV 2007", 2007, p. 3–10.
[23] C. BOHAN, B. GAUTIER, C. ROZENBLAT, D. AUBER, P.-Y. KOENIG. Networks Cities Networks throughMultinational Firms Networks: A Multi-Level Graph Approach, in "15th European Colloquium on Theoreticaland Quantitative Geography, Zurich, CH", 2007.
[24] R. BOURQUI, D. AUBER, P. MARY. How to Draw ClusteredWeighted Graphs using a Multilevel Force-Directed Graph Drawing Algorithm, in "11th International Conference on Information Visualisation, IV2007", IEEE Computer Society, july 2007, p. 757-764.
[25] S. BOZZANI-FRANC, A. CONESA, A. L’HOSTIS, D. AUBER, C. ROZENBLAT, P. MARY, G. MELANÇON,P.-Y. KOENIG. Relating the organization of the cities network and the organization of the air transportnetwork: an approach through graph visualization, in "15th European Colloquium on Theoretical andQuantitative Geography, Zurich, CH", 2007.

22 Activity Report INRIA 2007
[26] F. CHEVALIER, D. AUBER, A. TELEA. Structural Analysis and Visualization of C++ Code Evolution usingSyntax Trees, in "International Workshop on Principles of Software Evolution (IWPSE)", to appear, 2007.
[27] F. CHEVALIER, M. DELEST, J.-P. DOMENGER. A heuristic for the retrieval of objects in low resolution video,in "5th International Workshop on Content-Based Multimedia Indexing (CBMI07)", J. BENOIS-PINEAU(editor), Best Student Paper Award, 2007.
[28] G. MELANÇON, P.-Y. KOENIG, C. BOHAN, B. GAUTIER. Combining DagMaps and Sugiyama Layout forthe Navigation of Hierarchical Data, in "IV’07: 11th International Conference on Information Visualisation,Zurich, Switzerland", IEEE Computer Society, 2007.
[29] N. NOVELLI, D. AUBER. Calcul et représentation efficace de cubes de données pour une visualisationorientée pixel, in "EGC 2007", M. NOIRHOMME-FRAITURE, G. VENTURINI (editors), vol. RNTI-E-9,Cépaduès-Éditions, 2007, p. 205–206.
[30] C. ROZENBLAT, P.-Y. KOENIG, G. MELANÇON. Territorial and Topological Levels in Worldwide AirTransport Networks, in "15th European Colloquium on Theoretical and Quantitative Geography, Zurich, CH",2007.
References in notes
[31] C. JOHNSON, R. MOORHEAD, T. MUNZNER, H. PFISTER, P. RHEINGANS, T. S. YOO (editors). NIH-NSFVisualization Research Challenges Report, IEEE Computer Society, 2006.
[32] J. J. THOMAS, K. A. COOK (editors). Illuminating the Path: The Research and Development Agenda forVisual Analytics, IEEE Computer Society, 2006.
[33] I. H. ANSOFF. Managing strategic surprise by response to weaks signals, in "California Management Review",vol. XVII, no 2, 1976, p. 21-33.
[34] K. ARAKAWA, N. KONO, Y. YAMADA, H. MORI, M. TOMITA. KEGG-based pathway visualization tool forcomplex omics data, vol. 5, no 0039, 2005.
[35] D. AUBER. Tulip, in "9th International Symposium on Graph Drawing, GD 2001, Vienna, Austria", P.MUTZEL, M. JÜNGER, S. LEIPERT (editors), Lecture Notes in Computer Science, vol. 2265, Springer-Verlag,2001, p. 335-337.
[36] D. AUBER. Using Strahler Numbers for Real-Time Visual Exploration of Huge Graphs, in "InternationalConference on Computer Vision and Graphics", Journal of WSCG, vol. 10/1-3, 2002, p. 56-69.
[37] D. AUBER, M. DELEST. A Clustering Algorithm for Huge Trees, in "Advances in Applied Mathematics", vol.31, no 1, 2003, p. 46-60.
[38] D. AUBER, M. DELEST, Y. CHIRICOTA. Strahler based Graph Clustering using Convolution, in "EighthInternational Conference on Information Visualisation (IV’04)", IEEE Computer Society, 2004, p. 44-51.

Team GRAVITÉ 23
[39] D. AUBER, M. DELEST, J. FEDOU, J. DOMENGER, P. DUCHON. New Strahler numbers for rooted planetrees, in "Third Colloquium on Mathematics and Computer Science, Trends in Mathematics, Wien, Austria",M. DRMOTA, P. FLAJOLET, D. GARDY, B. GITTENBERGER (editors), 2004, p. 203-215.
[40] D. AUBER, P. MARY. Mise en place d’un mécanisme de plugins en C++, in "Programmation sous linux", vol.5, no 5, 2006, p. 74-79.
[41] G. BAILLY, D. AUBER, L. NIGAY. 2m: un espace de conception pour i’interaction bi-manuelle, in "UbiMob’05: 2nd French-speaking conference on Mobility and uibquity computing", ACM Press, 2005, p. 177-184.
[42] G. BAILLY, D. AUBER, L. NIGAY. From visualization to manipulation of rna secondary and tertiarystructures, in "10th International Conference on Information Visualisation (IV’06)", IEEE Computer Society,2006, to appear.
[43] G. BAILLY, D. AUBER, L. NIGAY. Navrna: Visualization - exploration - edition of RNA, in "InternationalConference on Advanced Visual Interfaces (AVI ’06)", ACM, 2006, to appear.
[44] M. BALDONADO, Q. WANG, A. WOODRUFF, A. KUCHINSKY. Guidelines for Using Multiple Views inInformation Visualization, in "Advanced Visual Interfaces", 2000, p. 110-119.
[45] V. BATAGELJ, A. MRVAR. Pajek - Analysis and Visualization of Large Networks, in "Graph Drawing : 9thInternational Symposium, GD 2001, Vienna, Austria", Lecture Notes in Computer Science, vol. 2265, 2002,477.
[46] E. H. CHI. A Taxonomy of Visualization Techniques Using the Data State Reference Model, in "IEEESymposium on Information Vizualization", IEEE Computer Society, 2000, 69.
[47] E. CHI, J. RIEDL. An Operator Interaction Framework for Visualization Systems, in "IEEE Symposium onInformation Visualization (InfoVis 98)", IEEE Computer Society, 1998, p. 63-70.
[48] M. CHUAH, S. ROTH. On the Semantics of Interactive Visualizations, in "IEEE International SYmposium onInformation Visualization ’96", IEEE Computer Society, 1996, p. 29-36.
[49] J. ELLSON, E. GANSNER, L. KOUTSOFIOS, S. C. NORTH, G. WOODHULL. Graphviz - Open Source GraphDrawing Tools, in "Graph Drawing : 9th International Symposium, GD 2001, Vienna, Austria", Lecture Notesin Computer Science, vol. 2265, 2002, 483.
[50] J. ELLSON, E. GANSNER, L. KOUTSOFIOS, S. NORTH, G. WOODHULL. Graphviz and Dynagraph - Staticand Dynamic Graph Drawing Tools, in "Graph Drawing Software", M. JÜNGER, P. MUTZEL (editors),Springer-Verlag, 2003, p. 127-148.
[51] J.-D. FEKETE. The InfoVis Toolkit, in "10th IEEE Symposium on Information Visualization, Austin, TX",IEEE Press, 2004, p. 167-174.
[52] M. C. FERREIRA DE OLIVEIRA, H. LEVKOWITZ. From visual data exploration to visual data mining: asurvey, in "IEEE Transactions on Visualization and Computer Graphics", 1077-2626, vol. 9, no 3, 2003, p.378-394.

24 Activity Report INRIA 2007
[53] L. C. FREEMAN. A set of measures of centrality based upon betweeness, in "Sociometry", vol. 40, 1977,3541.
[54] Y. FRISHMAN, A. TAL. Multi-Level Graph Layout on the GPU, in "IEEE Transactions on Visualization andComputer Graphics", vol. 13, no 6, 2007, p. 1310-1317.
[55] Y. FRISHMAN, A. TAL. Online Dynamic Graph Drawing, in "EuroVis 2007", 2007, p. 75-82.
[56] G. GAINANT, D. AUBER. Arna: Interactive comparison and alignment of rna secondary structure, in "IEEESymposition on Information Visualisation", IEEE Computer Society, 2004, 8.
[57] G. GAINANT, D. AUBER. Arna: Interactive comparison and alignment of rna secondary structure, in "IEEESymposition on Information Visualisation", IEEE Computer Society, 2004, 8.
[58] P. GAJER, S. G. KOBOUROV. GRIP: Graph Drawing with Intelligent Placement, vol. 6, no 3, 2002, p.203-224.
[59] E. R. GANSNER, S. C. NORTH. An open graph visualization system and its applications to softwareengineering, in "Software Practice and Experience", vol. 30, no 11, 2000, p. 1203-1233.
[60] M. GIRVAN, M. E. J. NEWMAN. Community structure in social and biological networks, in "Proceedings ofthe National Academy Science USA", vol. 99, 2002, p. 7821-7826.
[61] D. J. HAND. Strength in Diversity: The Advance of Data Analysis, in "Proceedings of the 8th EuropeanConference on Principles and Practice of Knowledge Discovery in Databases PKDD 2004, Pisa, Italy", J.-F.BOULICAUT, F. ESPOSITO, F. GIANOTTI, D. PEDRESCHI (editors), Lecture Notes in Artificial Intelligence,vol. 3202, Springer-Verlag New York, Inc., 2004, p. 18-26.
[62] D. J. HAND. Statistics and data mining: intersecting disciplines, in "ACM SIGKDD Explorations Newsletter",vol. 1, no 1, 1999, p. 16-19.
[63] J. HEER, S. K. CARD, J. A. LANDAY. prefuse: a toolkit for interactive information visualization, in "SIGCHIconference on Human factors in computing systems, Portland, Oregon, USA", ACM Press, 2005, p. 421-430.
[64] I. HERMAN, M. S. MARSHALL, G. MELANÇON. Graph Visualisation and Navigation in InformationVisualisation: A Survey, in "IEEE Transactions on Visualization and Computer Graphics", vol. 6, no 1, 2000,p. 24-43.
[65] I. HERMAN, G. MELANÇON, M. DELEST. Tree Visualisation and Navigation Clues for Information Visuali-sation, in "Computer Graphics Forum", vol. 17, no 2, 1998, 153165.
[66] INRIA. Plan stratégique 2003-2007, 2003.
[67] S. INGRAM, T. MUNZNER, M. OLANO. Technical Report: Glimmer: Multilevel MDS on the GPU, Technicalreport, University of British Columbia (Canada), 2007.
[68] F. IRAGNE, M. NIKOLSKI, B. MATHIEU, D. AUBER, D. SHERMAN. Proviz: protein interaction visualizationand exploration, in "Bioinformatics", vol. 21, no 2, 2005, p. 272-274.

Team GRAVITÉ 25
[69] G. JAESCHKE, M. LEISSLER, M. HEMMJE. Modeling Interactive, 3-Dimensional Information VisualizationsSupporting Information Seeking Behaviors, Lecture Notes in Computer Science : Knowledge and InformationVisualization, 10.1007/11510154_7, 2005.
[70] D. A. KEIM. Visual exploration of large data sets, in "Communications of the ACM", vol. 44, no 8, 2001, p.38-44.
[71] D. KEIM, H.-P. KRIEGEL. Visualization Techniques for Mining Large Databases: A Comparison, in "IEEETransactions on Knowledge and Data Engineering", vol. 8, no 6, 1996, p. 923-936.
[72] G. LOHSE, K. BIOLSI, N. WALKER, H. RUETER. A classification of visual representations, in "Communi-cations of the ACM", vol. 37, no 12, 1994, p. 36-49.
[73] B. S. MANJUNATH, J.-R. OHM, V. V. VASUDEVAN, A. YAMADA. Color and Texture Descriptors, in "IEEETransactions on Circuits and Systems for Video Technology", vol. 11, no 6, 2001, p. 703-715.
[74] S. MILGRAM. The small world problem, in "Psychology today", vol. 1, no 61, 1967.
[75] M. E. J. NEWMAN, M. GIRVAN. Finding and evaluating community structure in networks, in "PhysicsReviews E", vol. 69, no 026113, 2004.
[76] M. E. J. NEWMAN. The structure and function of complex networks, in "SIAM Review", vol. 45, 2003,167256.
[77] A. NOACK. An Energy Model for Visual Graph Clustering, in "11th International Symposium on GraphDrawing (GD 2003), Perugia, Italy", Lecture Notes in Computer Science, vol. 2912, 2003, p. 425-436.
[78] A. NOACK. Energy Models for Drawing Clustered Small-World Graphs, Technical report, no I-07/2003,Computer Science Reports, Technical University Cottbus, 2003.
[79] U. A. PEREGO. The Power of DNA: Discovering Lost and Hidden Relationships. How DNA Analysistechniques are assisting in the great search for our ancestors., in "World Library and Information Congress:71th IFLA General Conference and Council, Oslo, Norway", 2005, p. 1-19.
[80] L. PETER, H. R. VARIAN. How Much Information, no March 2006, 2003.
[81] J. P. SCOTT. Social Network Analysis: A Handbook, 2nd, SAGE Publications, 2000.
[82] B. SHNEIDERMAN. The Eyes Have It: A Task by Data Type Taxonomy for Information Visualization, in "IEEEConference on Visual Languages (VL’96), Boulder, CO", IEEE CS Press, 1996, p. 336-343.
[83] T. SIKORA. The MPEG-7 Visual Standard for Content Description An Overview, in "IEEE Transactions onCircuits and Systems for Video Technology", vol. 11, no 6, 2001, p. 696-702.
[84] J. B. TENENBAUM, V. D. SILVA, J. C. LANGFORD. A Global Geometric Framework for NonlinearDimensionality Reduction, in "Science", vol. 290, 2000, p. 2319-2323.

26 Activity Report INRIA 2007
[85] M. TORY, T. MÖLLER. Rethinking Visualization: A High-Level Taxonomy, in "IEEE Symposium on Informa-tion Visualization 2004", 2004, p. 151-158.
[86] M. O. WARD. A taxonomy of glyph placement strategies for multidimensional data visualization, in "Infor-mation Visualization (Palgrave)", vol. 1, no 3/4, 2002, p. 194-210.
[87] C. WARE. Information Visualization: Perception for Design, Morgan Kaufmann Publishers, Orlando, FL,2000.
[88] D. WATTS, S. H. STROGATZ. Collective dynamics of "small-world" networks, in "Nature", vol. 393, 1998,p. 440-442.
[89] D. J. WATTS. Six Degrees: The Science of a Connected Age, 1st, W. W. Norton & Company, 2003.
[90] D. J. WATTS. Small Worlds: The Dynamics of Networks between Order and Randomness, Princeton UniversityPress, 1999.
[91] W. DE NOOY, A. MRVAR, V. BATAGELJ. Exploratory Social Network Analysis with Pajek, CambridgeUniversity Press, 2004.
[92] S. DOS SANTOS, K. BRODLIE. Gaining understanding of multivariate and multidimensional data throughvisualization, in "Computers & Graphics", vol. 28, no 3, 2004, p. 311-325.
[93] J. VAN WIJK. The Value of Visualization, in "IEEE Visualization", C. SILVA, E. GROELLER, H. RUSHMEIER(editors), IEEE Computer Society, 2005, p. 79-86.