tech 3354 - welcome to tech.ebu.ch · tech 3354 comparison of cie colour metrics for use in the...
TRANSCRIPT

TECH 3354
COMPARISON OF CIE COLOUR METRICS FOR USE IN THE TELEVISION LIGHTING CONSISTENCY INDEX (TLCI-2012)
Source: FTV-LED Geneva November 2012

* Page intentionally left blank. This document is paginated for two sided printing

Tech 3354 Comparison of CIE colour metrics
Contents
Introduction............................................................................................... 5
1. The Principle of the Television Lighting Consistency Index (TLCI-2012) ........... 5
2. Test setup ........................................................................................ 6
2.1 Test samples .......................................................................................................... 6
2.2 Test and Reference luminaires..................................................................................... 6
2.3 Camera responsivity curves......................................................................................... 6
2.4 Camera matrix ........................................................................................................ 7
2.5 Camera gamma-correction.......................................................................................... 7
2.6 Display gamma........................................................................................................ 7
2.7 Display primaries ..................................................................................................... 8
3. Test procedure .................................................................................. 8
4. Analysis of results ............................................................................ 11
4.1 Analysis for individual subjects ...................................................................................11
4.2 Analysis for all subjects ............................................................................................14
5. Bibliography.................................................................................... 16
Appendix 1: Reflectivities of Test luminaires ................................................... 17
Appendix 2: CIE1964.................................................................................. 19
Appendix 3: CIELUV ................................................................................... 21
Appendix 4: CIELAB ................................................................................... 23
Appendix 5: CMC....................................................................................... 25
Appendix 6: CIE1994.................................................................................. 27
Appendix 7: CIEDE2000............................................................................... 29
3
Comparison of CIE colour metrics Tech 3354
* Page intentionally left blank. This document is paginated for two sided printing
4

Tech 3354 Comparison of CIE colour metrics
Comparison of CIE colour metrics for the assessment of the colorimetric properties of luminaires, the Television Lighting Consistency Index (TLCI-2012)
EBU Committee First Issued Revised Re-issued
TC 2012
Keywords: TLCI-2012, Television Lighting Consistency Index, Colorimetry, Luminaire.
Introduction This document describes subjective tests conducted in order to establish the most appropriate colour metric for assessing colour differences, for use in the ‘Television Lighting Consistency Index-2012’ (TLCI-2012).
1. The Principle of the Television Lighting Consistency Index (TLCI-2012) The purpose of the TLCI-2012 is to provide a way to assess the colour-rendering performance of luminaires when used for television lighting. The mathematical simulation mimics a complete television camera and display, using only those parameters that affect colour performance. The method calculates the difference in the colour appearance of a set of test colour samples when separately lit by a test luminaire and a reference luminaire, and shown on a reference display.
Figure 1: TLCI-2012 functional block diagram
None of the parameters of the television channel are dealt with here: the TLCI-2012 software, further described in EBU Tech 3355, was used merely to generate sets of colour differences on-screen on a computer or video display for use in subjective testing.
Six different CIE algorithms are available for calculating the visual appearance of a colour-difference; details are given in the Appendices. The oldest, CIE1964, was used in both the CRI and in the TLCI work initiated by Sproson and Taylor. But the later metrics are claimed to be better, in that they ever-more closely represent the human visual experience.
5

Comparison of CIE colour metrics Tech 3354
2. Test setup
2.1 Test samples A mathematical representation of the ColorChecker® chart was used, since it is widely recognised and readily available as a test chart, even though it was not originally designed for television use. Reflectivity tables for the colour samples are given in EBU Tech 3355 document.
2.2 Test and Reference luminaires The test samples were notionally lit by three test sources, each the measured power distribution data of a real luminaire. They were chosen to represent good, poor, and indifferent performance. The spectral power distributions are given in the Appendixes.
In each case, the Correlated Colour Temperature (CCT) of the Test luminaire was calculated and used as the specification for the Reference luminaire. The method of calculating CCT and the spectral power distribution of the standard source is given in EBU Tech 3355.
2.3 Camera responsivity curves Rather than use data from any real camera, representative responsivity curves of Plumbicon®-type tubes were used, taken from tabulations in the Sproson/Taylor work. These were a best-estimate of the responsivities of real cameras at the time (1970 - 1990) and there was little reason to believe that data for more modern cameras would be different. Measurements on more recent cameras were being undertaken at the time, and the results can be seen in EBU Tech 3353.
Figure 2 shows that the precise choice of camera curves is not highly critical, and that even the curves from negative film stocks produce similar results. This test used the CIEDE2000 difference metric for measurements on a generic single-colour white LED luminaire.
Figure 2: Average ΔE* values for various camera-responsivity sets
The white balance level was set to 90%, which ensured that the video level for the peak white patch became 100% (since the reflectance of that patch is known to be 90.01%).
6

Tech 3354 Comparison of CIE colour metrics
2.4 Camera matrix The matrix values were taken from the final Taylor report (1988).
S
S
S
M
M
M
B
G
R
B
G
R
0910.10910.00000.0
0390.01510.11120.0
0370.01750.01380.1
Where RS, GS and BS are the linear signals from the sensor(s) and RM GM and BM are the camera-output linear signals. Since this matrix had been optimised for an overall-linear television system, it produced rather over-saturated colours when used in a more realistic system with display-gamma and camera gamma-correction. Therefore, a saturation control was set to 80% which produced colour performance which is much more typical of real systems.
2.5 Camera gamma-correction The gamma-correction was set in the equation of ITU-R BT.709, which is recommended for all HDTV or newer systems.
099.0099.1' 45.0 CC RR for , otherwise 018.0V CC RR 5.4'
The real-time output of the software was thus in R’ G’ B’ form, and fed from the computer via VGA, DVI, HDMI or Displayport to a television display. The software coded the video feed using ITU-R BT.709 quantisation, 8-bit, to form the RO’ GO’ and BO’ signals.
2.6 Display gamma For the purpose of calculating the colour-appearance, the display gamma was set to 2.4, thus:
4.2'CD VV
In practice, the choice of display gamma is relatively unimportant since the reported colour difference values change very little between display gamma of 2.2 and 2.8. Figure 3 shows the colour differences, measured using the CIEDE2000 difference metric, for a generic single-colour white LED luminaire.
Figure 3: ColorChecker® colour differences for a generic white LED luminaire
7

Comparison of CIE colour metrics Tech 3354
2.7 Display primaries ITU-R BT.709 primaries were chosen.
x y
R 0.64 0.33
G 0.30 0.60
B 0.15 0.06
White balance, D65 0.3127 0.3290
The display synthesis matrix, derived directly from these primaries and balance colour, is:
D
D
D
B
G
R
Z
Y
X
950532.0119195.0019331.0
072192.0715169.0212639.0
180481.0357584.0412391.0
and it is these tristimulus values, XT, YT, ZT and XR, YR, ZR for the Test and Reference luminaires respectively, which are used for the calculation of the difference in colour appearance and the formulation of the TLCI-2012 value Q.
3. Test procedure The test subjects were provided with a spreadsheet that contained all the instructions needed for the performance of the test, together with marking sheets for each individual test.
Each subject was asked to display the output of the TLCI-2012 software (EBU Tech 3355) on a conventional television display or monitor, rather than on a computer display. SMPTE colour bars were made available in the software to assist in correctly setting the display brightness and colour controls.
Figure 4: TLCI output screen for single-colour, white LED, CIEDE2000
8

Tech 3354 Comparison of CIE colour metrics
Figure 5: spreadsheet & marking sheet for Fluorescent (TV white), CIEDE2000
9

Comparison of CIE colour metrics Tech 3354
The TLCI-2102 software output was a representation of the ColorChecker® chart, processed through the software camera. Each patch contained the colour as analysed by the Reference luminaire, with an inset of the same colour as analysed by the Test luminaire. Below each patch, four numbers are given, the calculated colour differences ΔL*, ΔC*, ΔH* and ΔE*, from left to right, where only the ΔE* was used for the tests.
There were 15 rounds of tests; five for each of the three Test luminaires, each using all the CIE colour-difference metrics excluding CIE1964.
Referring to Figure 5 for all spreadsheet references, cell B1 identified the Test luminaire, cell I1 identified the Reference luminare (being a standard source of the same CCT as the Test luminaire). Cells B3 and I3 identified the relevant colour difference metric and parameter.
The subject was asked to give a verdict on the relationship between the ΔE* values reported for two adjacent colour patches at a time, in the orange-shaded cells (L23 is highlighted as an example). Below each colour patch the ΔE* value is given, and the subject is asked to select from a restricted table of verdicts, which is a subset of a 5-point scale:
Score Verdict
+2 Agree with numbers, or too close to tell
+1 Agree with direction but not with numbers
(0) (not assessed)
(-1) (not allowed)
-2 Disagree with direction
Score “+2” was to indicate that the subject agreed that the two ΔE* values correctly described the relationship between the two colour differences. Score “+1” was to indicate that the general sense of the numbers was correct in terms of the relationship of the difference, but that the numbers didn’t give an accurate feel for the magnitude. Score “-2” was to indicate that the sense of the numbers was wrong (e.g. for the two skin tones, that the difference for Dark Skin was more visible than that for Light Skin, in the example shown in Figures 4 and 5).
Scores “0” and “-1” were disallowed: “0” (actually a blank entry) was used to signify that a test had not yet been done, and “-1” would logically be associated with a verdict that the direction was wrong but the numbers correct, which cannot happen. It could be argued that a score of “0” could signify that it was too difficult to assign a score, but, in the event, forcing a polarised score did not prove difficult for any of the subjects.
The spreadsheet presented a total of all the scores in cell B26. Cells B27 and B28 recorded the maximum and minimum scores given, while cells H26 to H28 recorded the mean and the range of the ΔE* values for the test. In practice, only the total-score value (cell B26) was used in the analysis. The maximum total score-value for each test was thus 2 x (3 x 5 + 2 x 6) = 54.
When all 15 combinations of Test luminaire and colour-difference metric had been tested, the subject was then asked to perform a cross-check test.
Each of the three Test luminaires was used to create a TLCI-2012 software output (see Figure 6) but this time with the colour-difference error values suppressed. The subject was then asked to assign a number to the visibility of the colour difference within each colour patch. No guidance was given; the subject was free to use any scale and any precision. All that was asked was for the numbering to be as consistent as possible. The subjects were told that this was a cross-check, a source of data which could and would be used to establish the reliability of the test results.
Throughout all the tests, which were self-administered, the subject was free to repeat any test, changing results if necessary.
10

Tech 3354 Comparison of CIE colour metrics
Figure 6: TLCI-2012 output screen for single-colour, white LED, CIEDE2000, with no Δ error reports
4. Analysis of results
4.1 Analysis for individual subjects Separate analysis was made for each subject’s results, as shown in Figure 7.
Figure 7: Scoring analysis, subject ‘N’
Columns F to L record the statistics of the ΔE* errors, which were not used in further analysis. Columns M to O copy the score values from cell B26 in each score sheet. Column P totals the inter-patch scores for each CIE colour-difference metric.
It was expected that there would be a steady increase in these levels from CIELUV to CIEDE2000, and that is generally what happened, except that CILEUV performed significantly better than anticipated. Note that the highest inter-patch score for each luminaire did not necessarily coincide with that for the sum (e.g. the green high-lighted cells M6, N6 and O7).
Figure 8 shows this result graphically.
11

Comparison of CIE colour metrics Tech 3354
Figure 8: Inter-patch score distribution for subject ‘N’
It is evident that the inter-patch scores are almost random for the high-quality luminaire. This is almost inevitable since the individual colour-differences are almost all small, and therefore difficult to assess. The most reliable scoring comes with the generic single-colour white LED luminaire, which has the largest performance errors, and therefore the most visible colour differences. Nevertheless, the Sum inter-patch score shows a clear progression towards CIEDE2000. The big surprise is that CIELAB performs consistently poorly, and that CIELUV is consistently better. None of the metrics is perfect, or even nearly so.
The subject’s personal rating of the colour-differences (the cross-check test) was recorded in columns D, J and P, the pale blue highlighted cells in Figure 9. These values are treated as a separate metric, here called ‘Eyes’.
Figure 9: ‘Eyes’ ratings for subject ‘N’
Each column of ‘Eyes’ scoring was compared with the ΔE* values for each metric and the correlation coefficients were recorded in row 30. A positive value indicates a general agreement; a
12

Tech 3354 Comparison of CIE colour metrics
maximum possible value of 1 would indicate a perfect match. It is not yet clear what these results could imply, except that none of the metrics seems to correlate particularly well with the visual experience of subject ‘N’.
Figure 10: ‘Eyes’ correlation coefficients for subject ‘N’
Figure 11 shows further analysis, which is more revealing, however.
In Figure 11 the contents of cells R3 to T7 are copied from row 30 of each of the luminaires in Figure 9. Cells U3 to U7 are the correlation coefficients between the ‘Eyes’ values of columns D, J and P in Figure 9 and the ΔE* values for each metric, for all three luminaires taken together. Row 8 shows the correlation coefficients, for each luminaire, between the inter-patch scores (columns M to O) and the ‘Eyes’ correlation coefficients (columns R to T). This clearly reveals the difficulty of assessing the small colour-differences for the high-quality luminaire. Cell W8 shows the correlation coefficient for all luminaires (columns P and U). This single value indicates the quality of the observations.
Figure 11: ‘Eyes’ secondary correlation coefficients for subject ‘N’
13

Comparison of CIE colour metrics Tech 3354
However, analysis of the full group of subjects is necessary to reveal the underlying implications.
4.2 Analysis for all subjects Figure 12 shows the first part of the overall analysis. Cells B3 to T7 are values copied from cells P3 to P7 from the individual analysis sheets. Row 8 values are copied from cell W8 in the individual sheets. An arbitrary decision was taken, to rank subjects with correlation coefficients greater than +0.75 as ‘very good’, +0.5 to +0.75 as ‘good’, +0.25 to +0.5 as ‘medium’, and less than +0.25 (including all negative values) as poor. Cells are colour coded to make this clear.
Figure 12: All-subject analysis, inter-patch scores
Some of this ranking is due to the type of display used. Subjects A, B, C, H, I and K used consumer television displays; the others used professional broadcast monitors. A2 (subject A, second test) and D both score poorly on this basis, probably due to the inconsistent colouring experienced in consumer LCD displays due to their limited viewing angle. E to G, J, and L to P all used LED-backlit LCD professional broadcast monitors in controlled broadcast environments, the others were all in domestic environments.
Figure 13 shows the average inter-patch scores for all three luminaires and all subjects (cells W3 to W7) and for only those qualified as ‘medium’ to ‘very good’. The trend is obvious; CIEDE2000 outperforms the other metrics, with CIELAB worst.
0.0
0.2
0.4
0.6
0.8
1.0
1.2
1.4
1.6
CIELUV CIELAB CMC CIE1994 CIEDE2000
0.0
0.2
0.4
0.6
0.8
1.0
1.2
1.4
1.6
CIELUV CIELAB CMC CIE1994 CIEDE2000
all subjects medium or better subjects
Figure 13: Inter-Patch cores for all luminaires
Since it has already been established that assessment of the small ΔE* errors for the high-quality LED luminaire was difficult, it makes sense to exclude that luminaire from further analysis.
Figure 14 similarly shows the average inter-patch scores for the single-colour white LED and the fluorescent tube, for all subjects (cells W3 to W7) and for only those qualified as ‘medium’ to ‘very good’. Here it is very obvious that CIELAB does not perform well, although CIEDE2000 is only
14

Tech 3354 Comparison of CIE colour metrics
marginally better when the ΔE* errors are smaller, as for the fluorescent tube.
-0.1
0.0
0.1
0.2
0.3
0.4
0.5
0.6
CIELUV CIELAB CMC CIE 1994 CIEDE2000
-0.1
0.0
0.1
0.2
0.3
0.4
0.5
0.6
CIELUV CIELAB CMC CIE1994 CIEDE2000
Single-source LED, all subjects Single-source LED, medium or better subjects
0.0
0.1
0.2
0.3
0.4
0.5
CIELUV CIELAB CMC CIE1994 CIEDE2000
0.0
0.1
0.2
0.3
0.4
0.5
CIELUV CIELAB CMC CIE1994 CIEDE2000
Fluorescent (TV white), all subjects Fluorescent (TV white), medium or better subjects
Figure 14: Inter-patch scores for (top) single-source LED and (bottom) fluorescent (TV white)
Next, the correlation coefficients (cells B8 to T8) were used as weighting parameters for the inter-patch scores for all subjects and all luminaires.
0
10
20
30
40
50
CIELUV CIELAB CMC CIE1994 CIEDE2000
Figure 15: Inter-patch scores weighted by correlation coefficients, for all subjects and all luminaires
Again, CIEDE2000 performs best, CIELAB worst.
Next, the observations with the lowest correlation coefficient, below +0.25, were excluded, and Figure 16 shows the inter-patch scores, weighted by correlation coefficients, for the single-colour white LED and the fluorescent tube. Once more, CIEDE2000 performs best, although CIELUV performs surprisingly well for assessment of the largest ΔE* errors, the single-colour LED.
15

Comparison of CIE colour metrics Tech 3354
0.0
0.1
0.2
0.3
0.4
CIELUV CIELAB CMC CIE1994 CIEDE2000
0.0
0.1
0.2
0.3
CIELUV CIELAB CMC CIE1994 CIEDE2000
fluorescent (TV white) single-colour white LED
Figure 16: Inter-patch scores weighted by correlation coefficients, excluding ‘poor’ observations
Clearly it is difficult to displace CIEDE2000 from the top-scoring position and CIELAB from the bottom, however the data is processed. CIELUV performs better than expected when the visible errors are large, but not when they are smaller. Therefore, CIEDE2000 was chosen for use in the Television Lighting Consistency Index, TLCI-2012.
5. Bibliography Sproson, W. N. & Taylor, E. W. (1971)
A colour television illumination consistency index.
BBC Research Department Report 1971-45
Taylor, E. W. (1982) Rank order difference analysis applied to tests of the Television Consistency Index
BBC Research Department Report 1982-10
Taylor, E. W. (1988) The assessment of the colorimetric properties of light sources for use in television scene lighting
BBC Research Department Report 1988-2
CIE, 1995 Method of measuring and specifying colour rendering properties of light sources (Ed. 2)
Publication CIE No. 13.3 (TC-3.3), Bureau Central de la CIE, Paris, 1995.
Roberts, A., Emmett, J. & Böhler, P (2011)
A Television Lighting Consistency Index Proceedings, IBC 2011, Amsterdam
Roberts, A. (2011) Why does it take so long to get a new standard adopted?
The Iris, Creative Video Productions Ltd, 3rd Quarter 2011
CIE, 2004 Colorimetry Publication No. 15.3, Bureau Central de la CIE, Paris, 2004.
McCamy, C. S., Marcus, H. & Davidson, J. G.
A color-rendition chart Journal of Applied Photographic Engineering, Vol. 2, #3, Summer 1976.
CIE, 2001 Improvement to industrial colour-difference evaluation
CIE Publication No. 142-2001, Bureau Central de la CIE, Paris, 2001
EBU, 2012 Television Lighting Consistency Index-2012
EBU Tech 3355
Roberts, A. Circles of Confusion EBU, 2009
Wyszecki, G. & Styles, W. S. (1982)
Color Scence: Concepts and Methods, Quantitative Data and Formulae, (Ed. 2)
John Wiley & sons, 2008
Reinhard, E., Khan, E. A., Akyüz, A. O. & Johnson, G. M.
Color imaging, fundamentals and applications
A. K.Peters, 2008
16

Tech 3354 Comparison of CIE colour metrics
Appendix 1: Reflectivities of Test luminaires
380 420 460 500 540 580 620 660 700 740
Figure A1.1: Generic, single-colour, white LED luminaire
380 420 460 500 540 580 620 660 700 740
Figure A1.2: Fluorescent, ‘TV white’
380 420 460 500 540 580 620 660 700 740
Figure A1.3 High-quality, multi-source LED luminaire
17

Comparison of CIE colour metrics Tech 3354
*
* Page intentionally left blank. This document is paginated for two sided printing
18

Tech 3354 Comparison of CIE colour metrics
Appendix 2: CIE1964
This process was used in the original, 1971, BBC Report on the development of the Television Illumination Consistency Index, and is used in the Colour Rendering Index.
Note that in this method the values for XYZ are scaled to 100 (i.e. Y = 100 for peak white).
First derive CIE1960 chromaticity values for a test colour for illumination by the Test source (subscript T) and the Reference source (subscript R). Subscipt W refers to the white point.
TTT
TT ZYX
Xu
315
4
,
TTT
TT ZYX
Yv
315
6
rRR
RR ZYX
Xu
315
4
,
RRR
RR ZYX
Yv
315
6
Calculate CIE1964 values for the Test- and Reference-illuminated colour samples:
1725 3/1* TT YW , 1725 3/1* RR YW
WTTT uuWU ** , WRRR uuWU **
WTTT vvWV ** , WRRR vvWV **
Where uW and vW are the chromaticity coordinates of the display white point.
Calculate the overall colour difference for the test colour:
Overall difference: 22264 ****13**13* RTRTRT WWVVUUE
Note: CIE1964 does not calculate Chroma or Hue, both of which are required for use in the TLCI-2012 calculations.
19

Comparison of CIE colour metrics Tech 3354
*
* Page intentionally left blank. This document is paginated for two sided printing
20

Tech 3354 Comparison of CIE colour metrics
Appendix 3: CIELUV
Note that, in this method, the values for XYZ are scaled to 100 (i.e. Y = 100 for peak white).
First derive CIE1976 chromaticity values for a test colour for illumination by the Test source (subscript T) and the Reference source (subscript R). Subscipt W refers to the white point.
TTT
TT ZYX
Xu
315
4'
,
TTT
TT ZYX
Yv
315
9'
RRR
RR ZYX
Xu
315
4'
,
RRR
RR ZYX
Yv
315
9'
Calculate CIELUV values for the Test- and Reference-illuminated colour samples:
16116* WTT YYfL , 16116* WRR YYfL
Where 116
16
24
116
3
1
xxf for
3
116
24
, otherwise xxf 3
WTTT uuLu ''13 ** , WRRR uuLu ''13 **
WTTT vvLv ''13 ** , WRRR vvLv ''13 **
Where YW, u’W and v’W are the luminance and chromaticity coordinates of the display white point in CIE1976 values.
22 *** TTT vuC , 22 *** RRR vuC
T
TT u
vh
*
*arctan ,
R
RR u
vh
*
*arctan
Note: the hue angle h is measured in degrees.
Calculate the overall colour difference for the test colour:
222 ******* RTRTRTLUV vvuuLLE
Calculate individual Lightness, Chroma and Hue differences for the test colour:
RTLUV LLL ***
2222 ''''*''''*13* WTWRRWTWTTLUV vvuuLvvuuLC
RTRT
LUV CChh
H *.*2
sin2*
21

Comparison of CIE colour metrics Tech 3354
*
* Page intentionally left blank. This document is paginated for two sided printing
22

Tech 3354 Comparison of CIE colour metrics
Appendix 4: CIELAB
Developed and adopted by the CIE in 1976, this process provides the basis for all later developments in colour-difference measurement.
Calculate CIELAB values for the Test- and Reference-illuminated colour samples:
16116* WTT YYfL , 16116* WRR YYfL
Where 116
16
24
116
3
1
xxf for
3
116
24
, otherwise xxf 3
W
T
W
TT Y
Yf
X
Xfa 500* ,
W
R
W
RR Y
Yf
X
Xfa 500*
W
T
W
TT Z
Zf
Y
Yfb 200* ,
W
R
W
RR Z
Zf
Y
Yfb 200*
Where the Xw Yw Zw are the tristimulus values of the display white point.
22 *** TTT baC , 22 *** RRR baC
T
TT a
vh
*
*arctan ,
R
RR a
bh
*
*arctan
Note: the hue angle h is measured in degrees.
Calculate the overall colour difference for the test colour:
222 ******* RTRTRTLAB bbaaLLE
Calculate individual Lightness, Chroma and Hue differences for the test colour:
RTLAB LLL ***
RTLAB CCC ***
RTRT
LAB CChh
H *.*2
**sin2*
23

Comparison of CIE colour metrics Tech 3354
*
* Page intentionally left blank. This document is paginated for two sided printing
24

Tech 3354 Comparison of CIE colour metrics
Appendix 5: CMC
Developed by the Society of Dyers and Colourists and adopted by the CIE in 1988, this process is generally though to be an improvement on earlier methods. It subdivides the CIELAB colour space into an infinite set of ellipsoidal microspaces (one for each test colour considered), the axes of which are tilted and scaled to better match the perception of small colour differences.
Calculate CIELAB values for the Test- and Reference-illuminated colour samples:
16116* WTT YYfL , 16116* WRR YYfL
Where 116
16
24
116
3
1
xxf for
3
116
24
, otherwise xxf 3
W
T
W
TT Y
Yf
X
Xfa 500* ,
W
R
W
RR Y
Yf
X
Xfa 500*
W
T
W
TT Z
Zf
Y
Yfb 200* ,
W
R
W
RR Z
Zf
Y
Yfb 200*
Where the Xw Yw Zw are the tristimulus values of the display white point.
22 *** TTT baC , 22 *** RRR baC
T
TT a
vh
*
*arctan ,
R
RR a
bh
*
*arctan
Note: the hue angle h is measured in degrees.
Calculate individual Lightness, Chroma and Hue differences for the test colour:
RTLAB LLL ***
RTLAB CCC ***
RTRT
LAB CChh
H *.*2
**sin2*
Calculate scalers for the ellipsoid semi-axes for the colour under test, in each case, the values are those for the average colorimetric values:
*01765.01
*040975.0
L
LSL
, unless 16*L , when 511.0LS
638.0*0131.01
*0638.0
C
CSC
25

Comparison of CIE colour metrics Tech 3354
1900*
*4
4
C
CF
*35cos4.036.0 habsT unless and 164* h 345*h ,
when *2.0 168cos h56.0 absT
FFTSS CH 1
Calculate the resulting difference value:
Overall difference:
222***
*
H
LAB
c
LAB
L
LABCMC S
H
cS
C
lS
LE
Where the values l and c are weighting factors, usually both unity.
They can be varied to customise the metric, changing the effects of lightness and chroma respectively.
If they are varied from unity then their values should be included in the name of the system, e.g. CMC(2:1).
For the subjective tests, 1 cl .
26

Tech 3354 Comparison of CIE colour metrics
Appendix 6: CIE1994
This is an elaboration of the process defined in CMC. It is intended for D65 viewing, and therefore is appropriate for television use. The ΔE* value is intended to be matched to human vision, in that a value of 1 is the threshold of discriminability.
Calculate CIELAB values for the Test- and Reference-illuminated colour samples:
16116* WTT YYfL , 16116* WRR YYfL
Where 116
16
24
116
3
1
xxf for
3
116
24
, otherwise xxf 3
W
T
W
TT Y
Yf
X
Xfa 500* ,
W
R
W
RR Y
Yf
X
Xfa 500*
W
T
W
TT Z
Zf
Y
Yfb 200* ,
W
R
W
RR Z
Zf
Y
Yfb 200*
Where the Xw Yw Zw are the tristimulus values of the display white point.
22 *** TTT baC , 22 *** RRR baC
T
TT a
vh
*
*arctan ,
R
RR a
bh
*
*arctan
RTLAB LLL *
Note: the hue angle h is measured in degrees.
Calculate scalers for the ellipsoid semi-axes for the colour under test, in each case, the values are those for the average colorimetric values:
1LS
RTC CCS *.*045.01
RTH CCS *.*015.01
Calculate individual Lightness, Chroma and Hue differences for the test colour:
RT LLL ***94
RT CCC ***94
RTRT CC
hhH *.*
2
**sin2*94
27
Comparison of CIE colour metrics Tech 3354
Calculate the resulting difference value:
2
942
942
9494
****
HHcCLL Sk
H
Sk
C
Sk
LE
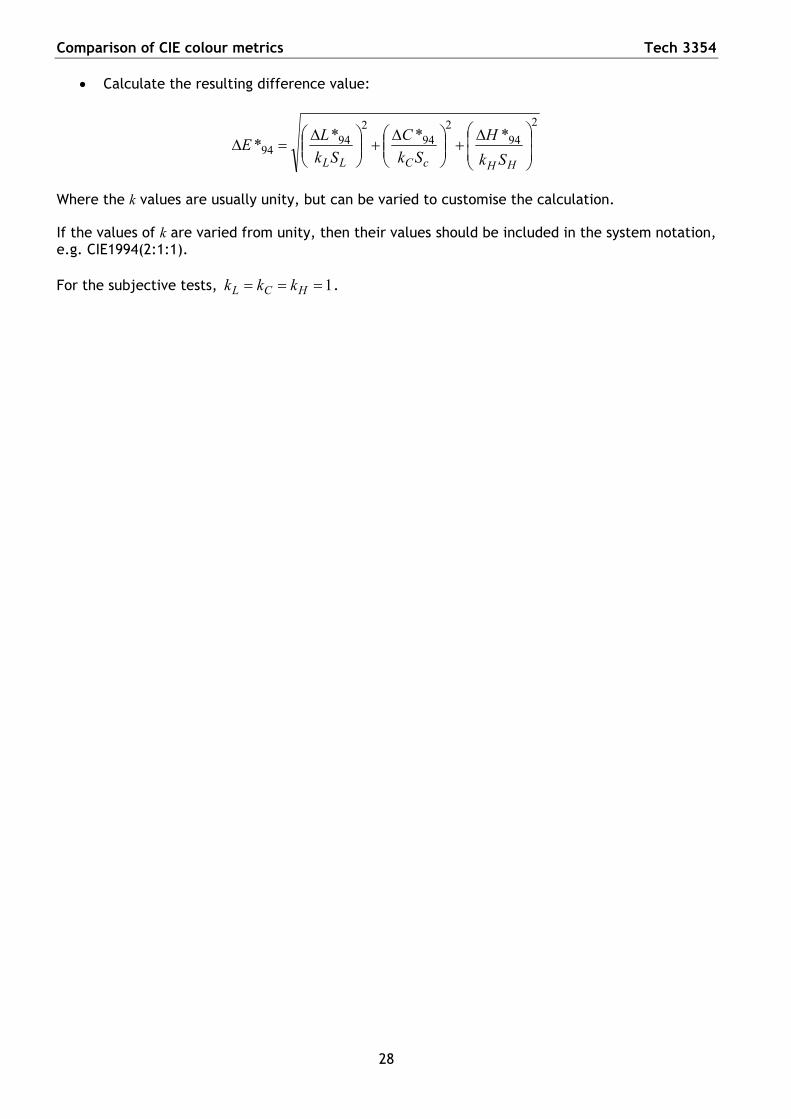
Where the k values are usually unity, but can be varied to customise the calculation.
If the values of k are varied from unity, then their values should be included in the system notation, e.g. CIE1994(2:1:1).
For the subjective tests, 1 HCL kkk .
28

Tech 3354 Comparison of CIE colour metrics
Appendix 7: CIEDE2000
This is a further refinement of CIELAB, intended to improve the correlation between the metric and human vision in the saturated blue and near neutral colour regions.
Calculate CIELAB values for the Test- and Reference-illuminated colour samples:
16116* WTT YYfL , 16116* WRR YYfL
Where 116
16
24
116
3
1
xxf for
3
116
24
, otherwise xxf 3
W
T
W
TT Y
Yf
X
Xfa 500* ,
W
R
W
RR Y
Yf
X
Xfa 500*
W
T
W
TT Z
Zf
Y
Yfb 200* ,
W
R
W
RR Z
Zf
Y
Yfb 200*
Where the Xw Yw Zw are the tristimulus values of the display white point.
22 *** TTT baC , 22 *** RRR baC
T
TT a
vh
*
*arctan ,
R
RR a
bh
*
*arctan
Note: the hue angle h is measured in degrees.
Calculate non-linear modifiers for the actual colour under test:
TT LL *' , RR LL *'
2
*** RT CC
C
77
7
25*
*1
2
1
C
Cg
22 **1' TTT bagC , 22 **1' RRR bagC
T
TT ag
bh
*1
*arctan' ,
R
RR ag
bh
*1
*arctan'
Note: h* is measured in degrees, not radians. The signs of a* and b* must be observed in order to generate an angle within the range 0 - 360 degrees.
29

Comparison of CIE colour metrics Tech 3354
2
''' RT LLL
,
2
''' RT CCC
,
2
''' RT hhh
77
7
25'
'2
C
CRC
2
25
275'exp30
h
2sinCT RR
63'4cos2.06'3cos32.0'2cos24.030'cos17.01 hhhhT
2
2
50'20
50'015.01
L
LSL
'045.01 CSC
TCSH '015.01
Calculate the lightness, chroma and hue differences for each colour:
RT LLL ''*2000
RT CCC ''*2000
RTRT CChh
H '.'2
''sin2*2000
Calculate the resulting difference value:
Overall difference:
HHCCT
HHCCLL Sk
H
Sk
CR
Sk
H
Sk
C
Sk
LE
''****
22000
22000
22000
2000
Where the k values are weighting factors, usually unity.
They can be varied to customise the metric, affecting lightness, saturation and hue, respectively.
If they are varied from unity, then their values should be included in the name of the system, e.g. CIEDE2000(2:1:1).
For the subjective tests, 1 HCL kkk .
30