tech report nwu-cs-04-34
TRANSCRIPT
8/6/2019 Tech Report NWU-CS-04-34
http://slidepdf.com/reader/full/tech-report-nwu-cs-04-34 1/14
Computer Science Department
Technical Report
NWU-CS-04-34
April 19, 2004
Characterizing and Predicting TCP Throughput on the Wide Area Network
Dong Lu Yi Qiao Peter A. Dinda Fabian E. Bustamante
Abstract
The packet pair mechanism has been shown to be a reliable method to measure the
bottleneck link capacity and available bandwidth on a network path, and has been widelydeployed in tools such as nettimer, IGI, and PTR. However, the available bandwidth is
different from the TCP throughput that an application can achieve and the difference can
be huge. TCP throughput benchmarking techniques are widely used to probe the TCP
throughput for applications, for example in the Network Weather Service (NWS).
Unfortunately recent research shows that these techniques often cannot predict TCP
throughput well for large transfers. This paper addresses this issue. We begin by
statistically characterizing the TCP throughput on the Internet, exploring the strong
correlation between TCP flow size and throughput, and the transient end-to-end
throughput distribution. We then analyze why benchmarking fails to predict large
transfers, and propose a novel yet simple prediction model based on our observations.
Our prototype, dualPats, is an application level TCP throughput prediction framework that combines our model with simple time series models and a dynamic probing rate
adjustment algorithm that relates intrusiveness to path dynamics. Our analysis and
evaluation is based on large scale Internet-based measurements and experiments
involving many sites distributed all over the world.
Effort sponsored by the National Science Foundation under Grants ANI-0093221, ACI-
0112891, ANI-0301108, EIA-0130869, and EIA-0224449. Any opinions, findings and
conclusions or recommendations expressed in this material are those of the author and do not
necessarily reflect the views of the National Science Foundation (NSF).

8/6/2019 Tech Report NWU-CS-04-34
http://slidepdf.com/reader/full/tech-report-nwu-cs-04-34 2/14
Keywords: Statistical TCP throughput characterization; TCP throughput prediction; TCP throughpu
monitoring;

8/6/2019 Tech Report NWU-CS-04-34
http://slidepdf.com/reader/full/tech-report-nwu-cs-04-34 3/14
Characterizing and Predicting TCP Throughput on the Wide Area Network
Dong Lu Yi Qiao Peter A. Dinda Fabian E. Bustamante
donglu,yqiao,pdinda,fabianb ¡ @cs.northwestern.edu
Department of Computer Science, Northwestern University
Abstract
The packet pair mechanism has been shown to be a
reliable method to measure the bottleneck link capacity
and available bandwidth on a network path, and has been
widely deployed in tools such as nettimer, IGI, and PTR.
However, the available bandwidth is different from the TCP
throughput that an application can achieve and the differ-ence can be huge. TCP throughput benchmarking tech-
niques are widely used to probe the TCP throughput for
applications, for example in the Network Weather Ser-
vice (NWS). Unfortunately recent research shows that these
techniques often cannot predict TCP throughput well for
large transfers. This paper addresses this issue. We begin
by statistically characterizing the TCP throughput on the
Internet, exploring the strong correlation between TCP flow
size and throughput, and the transient end-to-end through-
put distribution. We then analyze why benchmarking fails to
predict large transfers, and propose a novel yet simple pre-
diction model based on our observations. Our prototype,
dualPats, is an application level TCP throughput prediction framework that combines our model with simple time series
models and a dynamic probing rate adjustment algorithm
that relates intrusiveness to path dynamics. Our analysis
and evaluation is based on large scale Internet-based mea-
surements and experiments involving many sites distributed
all over the world.
1 Introduction
The concept of available bandwidth has been of centralimportance throughout the history of packet networks, and
researchers have been trying to create end-to-end measure-
ment algorithms for a long time. From Keshav’s packet
Effort sponsored by the National Science Foundation under Grants ANI-
0093221, ACI-0112891, ANI-0301108, EIA-0130869, and EIA-0224449.
Any opinions, findings and conclusions or recommendations expressed in
this material are those of the author and do not necessarily reflect the views
of the National Science Foundation (NSF).
pair [16], to Crovella’s cprobe [6], and the latest work, such
as IGI [12], the purpose is to measure the end-to-end avail-
able bandwidth accurately, quickly, and non-intrusively. To-
day’s definition of available bandwidth is “the maximum
rate that the path can provide to a flow, without reducing
the rate of the rest of the traffic.” [12, 13]. Other tools to
measure either the bottleneck link capacity or the available
bandwidth include nettimer [17], pathchar and pchar [11],pathload [13, 14], NCS and pipechar [15], pathrate [10],
spruce [26] and pathchirp [24], and Remos [18]. Most of
such tools used the packet pair or packet train techniques to
conduct the measurements.
The available bandwidth is different from the TCP
throughput that an application can achieve, and that dif-
ference can be huge. Lai’s Nettimer paper [17] showed
many cases where the TCP throughput is much lower than
the available bandwidth, while Jain’s pathload paper [13]
showed the bulk transfer capacity [19] of a path could even
be higher than the measured available bandwidth. Addition-
ally, most of these tools take a long time to run, which make
them unsuitable to be used in real time for applications and
services.
The most widely used TCP throughput prediction tool is
Network Weather Service [31] (NWS). NWS applies bench-
marking techniques and time series models to measure TCP
throughput and provide predictions to applications in real
time. NWS has been broadly applied. Allen, et al [3] ap-
plied NWS to address the so called Livny and Plank-Beck
problems. Swany, et al [28] applied NWS in the Grid infor-
mation service.
Unfortunately, recent work [30, 29] has argued that
NWS, and by implication, TCP benchmarking techniques
in general, are not good at predicting large file transfers onthe high speed Internet. Sudharshan, et al [30] proposed
and implemented predicting large file transfers from a log
of previous transfers and showed that it can produce reason-
able results. However, a pure log-based predictor is updated
at application-chosen times and thus neglects the dynamic
nature of the Internet. Hence, when a path changes dramati-
cally, the predictor will be unaware of it until after the appli-
cation begins to use the path. To take the dynamic changes
1
8/6/2019 Tech Report NWU-CS-04-34
http://slidepdf.com/reader/full/tech-report-nwu-cs-04-34 4/14
of Internet into consideration, Sudharshan, et al [29] and
Swany, et al [27] separately proposed regression and CDF
techniques to combine the log-based predictor with small
NWS probes, using the probes to estimate the current load
on the path and adjust the log-based predictor. These tech-
niques enhanced the accuracy of log based predictors.
These combined techniques are limited to those hostpairs that have logs of past transfers between them, and due
to the dynamic nature of Internet, which only shows certain
statistical stabilities, the logs can become invalid after some
time. Furthermore, due to the strong correlation between
TCP flow size and throughput [35], logs for certain ranges
of TCP flow (file) size are not useful for the prediction of
different TCP flow sizes.
The questions we address here are:
How can we explain the strong correlation between
TCP flow size and throughput, and what are its im-
plications for predicting TCP throughput?
How can we characterize the statistical stability of theInternet and TCP throughput, and what are its implica-
tions for predicting TCP throughput?
How can we predict the TCP throughput with different
TCP flow sizes without being intrusive?
The main contributions of this paper are:
We explored reasons for the observed strong correla-
tion between TCP flow size and throughput [36].
We characterized end-to-end TCP throughput stability
and distribution.
We proposed a novel yet simple TCP benchmark mechanism.
We proposed a dynamic sampling rate adjustment al-
gorithm to lower active probing overhead.
We described and evaluated dualPats, a TCP through-
put prediction service based on the preceding contri-
butions.
We define TCP throughput as¡
¢ where£
is the TCP
flow size and ¤ is the TCP flow duration, which starts at
TCP connection initialization and ends when data transfer
finishes. In some of our experiments using GridFTP [2] and
scp [33], we treat£
as equivalent to file size, neglecting thesmall messages exchanged for authentication. ¤ is equiv-
alent to file transfer time in our experiments with GridFTP
and scp. TCP throughput is directly experienced by appli-
cations and thus accurate predictions are very important for
the design and implementation of distributed applications.
We begin by describing our experimental setup and mea-
surements (Section 2). In Section 3, we use our measure-
ments to address the strong correlation between TCP flow
size and throughput, explaining the phenomenon and how
it can cause benchmarking to err, and develop a new pre-
dictive model that incorporates it. Next, we consider the
statistical stability of the Internet and how it affects the life-
time of measurements and predictions (Section 4). Finally,
we incorporate our results into dualPats and evaluate its per-
formance (Section 5).
2 Experiments
Our experimental testbed includes PlanetLab and several
additional machines located at Northwestern and Argonne
National Laboratories(ANL). PlanetLab [1] is an open plat-
form for developing, deploying, and accessing planetary-
scale services. It currently consists of 359 computers lo-
cated at 147 sites around the world.
We conducted S1 and S2 mainly to characterize the TCP
throughput on the Internet in which we implemented a sim-
ple C client-server program. S2 was also used to verify thenew TCP benchmarking mechanism we proposed. We con-
ducted S3 using GridFTP and scp to strengthen S1 and S2
with big TCP flows and with applications that require au-
thentication before transferring effective data. S3 was also
used to further verify the benchmarking mechanis. S4 was
conducted to evaluate dualPats, our TCP throughput predic-
tion framework.
Our experiments are summarized in Figure 1.
3 The strong correlation between TCP flow
size and throughput
A surprising finding in recent TCP connection charac-
terization is that TCP flow size and throughput are strongly
correlated. This section explains the phenomenon, provides
new additional explanations for it, explains why it can lead
to inaccurate TCP throughput predictions, and outlines a
new prediction approach.
3.1 Phenomenon
Yin Zhang, et al [35] analyzed the correlations between
the TCP flow characteristics of interest, including flow du-
ration and throughput, flow duration and size, and flow sizeand throughput. They pointed out that these correlations are
fairly consistent across all their traces, and show a slight
negative correlation between duration and throughput, a
slight positive correlation between size and duration, and a
strong correlation between throughput and flow size. They
pointed out that the strong correlation between flow size and
throughput is the most interesting one and explained it in
two ways:
2
8/6/2019 Tech Report NWU-CS-04-34
http://slidepdf.com/reader/full/tech-report-nwu-cs-04-34 5/14
Name Statistics Main Purpose Hosts, Paths, Repetitions Messages, Software, procedure
S11,620,000
TCP transfers
To evaluate TCP through-
put stability and transient
distributions
40 PlanetLab nodes in
North America, Europe,
Asia, and Australia. Re-
peat random pairing 3
times, 60 distinctive paths
total
Client/Server: 100 KB, 200 KB, 400
KB , 600 KB, 800 KB, 1 MB, 2
MB, 4 MB, 10 MB. Server sends a
file with specific size to client con-
tinuously for 3,000 times and then
start to send a another file of differ-ent size.
S2
2,430,000
TCP transfers;
270,000 runs
To study correlation be-
tween TCP throughput and
flow size, and evaluate
proposed TCP benchmark
mechanism.
40 PlanetLab nodes in
North America, Europe,
Asia, and Australia. Re-
peat random pairing 3
times, 60 distinctive paths
total
Client/Server: 100 KB, 200 KB, 400
KB , 600 KB, 800 KB, 1 MB, 2 MB,
4 MB, 10 MB. Server sends a se-
quence of files with increasing sizes
in order, start over after each run.
S34,800 TCP
transfers; 300
runs
To test proposed TCP
throughput benchmark
mechanism; To strengthen
S1 and S2 with large TCP
flow sizes and different
applications
20 PlanetLab nodes in
North America, Europe,
Asia, and Australia, one
node at Northwestern, one
node at ANL, 30 distinc-
tive paths total
GridFTP, scp: 5 KB to 1GB. Server
sends a sequence of files with in-
creasing sizes in order, start over af-
ter each run.
S42400 test
cases
To evaluate the dualPats
TCP throughput prediction
service.
20 PlanetLab nodes inNorth America, Europe,
Asia, and Australia, one
node at Northwestern, one
node at ANL, 20 distinc-
tive paths total
GridFTP, scp: randomly send a file
of size 40 MB or 160 MB. About 48
hours long
Figure 1. Summary of experiments. We define a run in S2 and S3 as a procedure conducting a
sequence of TCP transfers with increasing flow sizes between two hosts.
Slow start: TCP slow start could cause some corre-
lation between flow size and flow rate [35]. HariBalakrishnan, et al [4] showed that 85% of the web-
related TCP packets were transfered during slow start.
This implies that most web-related flows ended in slow
start, before TCP had fully opened its congestion win-
dow, leading to throughput much lower than would be
possible with a fully open window.
However, after eliminating the first one second of all
the flows, they found that the strong correlation be-
tween flow size and throughput remained strong.
User effect: The users are estimating the underlying
bandwidth, and thus transferring big files only whenthe estimated estimated bandwidth is correspondingly
large.
These are two valid reasons, but they may be insufficient.
We claim that most users do not estimate the available band-
width before transferring data. Furthermore, that the corre-
lation persists even when initial slow start is removed sug-
gests that there must be some other mechanisms at work.
Let’s consider the correlation between flow size and
throughput in our experiments. Figure 2 gives the cumu-lative distribution functions (CDFs) of the correlation co-
efficient (Pearson’s )1, where each individual value is
calculated from one run of S2 or S3. It is clear from the
graph that for the simple C server results in S2, over 80%
of all runs demonstrate strong or medium
s between flow
sizes and flow rates. Further, 64% of all runs have ¢ ¡ £ ¥ § .
The correlation is much stronger for the GridFTP and scp
results in S3: ¡ ¨ % of the runs shows strong correlation,
¡ ¨ % show ¡ £ ¥ .
3.2 Explanations
Now we consider additional explanations for the surpris-
ing correlation between flow size and transfer time.
1Both Pearson’s Correlation Coefficient
and Coefficient of Determi-
nation
are used in the analysis of the paper.
represents the percent
of the variation that can be explained by the regression equation, therefore
we use it to show how good a curve fitting is.
is widely used to mea-
sure the strength of a (linear) relationship, therefore we use
to show how
strong two random variables are linearly correlated.
3

8/6/2019 Tech Report NWU-CS-04-34
http://slidepdf.com/reader/full/tech-report-nwu-cs-04-34 6/14
0 0.2 0.4 0.6 0.8 10
0.1
0.2
0.3
0.4
0.5
0.6
0.7
0.8
0.9
1
Correlation Coefficient
C u m u l a t i v e P e r
c e n t a g e s
CDF of Correlation Coefficients between Flow Size and Flow Rate
The Simple ProgramGridFTP+SCP
Figure 2. CDF of correlation coefficients
be-tween flow sizes and throughput in experi-ments S2 and S3.
TCP flow size
0
2000
4000
6000
8000
10000
12000
0 20000 40000 60000 80000 100000
File size (KB)
T C P
t h r o u g h p u t ( K B / S e c )
Figure 3. TCP throughput versus flow size(file size) with GridFTP. Transfers are be-
tween Northwestern University and ArgonneNational Lab. Single TCP flow with TCP buffer
set.
Non-negligable startup overheads
Most applications have an initial message exchange. For
example, GridFTP and scp require certificate or public key
authentication before starting to send or receive data.
Figure 3 shows the TCP throughput as a function of TCPflow size, for transfers using GridFTP between Northwest-
ern university and ANL. The dotted line is the asymptotic
TCP throughput. We tried linear, logarithmic, order 2 poly-
nomial, power, and exponential curve fitting, but none of
them fit well.
We next considered the relationship between TCP flow
duration (transfer time) and flow size (file size). Figure 4
shows that this relationship can be well modeled with a sim-
y = 9E-05x + 0.7246
R2 = 0.9992
0
0.5
1
1.5
2
2.5
3
3.5
0 5000 10000 15000 20000 25000 30000 35000
File size (KB)
T i m e ( s e c )
α
β
γ γ
γ Noise area
Figure 4. Transfer time versus TCP flow sizewith GridFTP. Transfers are between North-
western University and Argonne NationalLab. Single TCP flow with TCP buffer set.
ple linear model with
close to 1. The majority of the
data-points missed by the linear model are located at thevery beginning of the curve, which we refer to as the noise
area in the figure. The noise area is due to startup costs and
the residual slow start effect, described below.
A closer look at Figure 4 shows that the total TCP flow
duration or file transfer time can be divided into two parts:
the startup overhead and the effective data transfer time. In
this case, the startup overhead is about 0.72 seconds. We
represent this as
¤¢
¤ ¥ § ©
(1)
where ¤ is the TCP flow duration, including both startup
overhead and data transfer time,§
is the TCP flow size or
file size, and
is the startup overhead, which includes au-
thentication time and the residual slow start effect as de-
scribed below.
equals Steady State TCP throughput,
which is the asymptotic TCP throughput as shown in Fig-
ure 3.
Given Equation 1, we can easily deduce the expression
for the TCP throughput in Figure 3 as
¤ ¢
§
¤
¢
§
¤ ¥ § © (2)
where ¤
is the TCP throughput, and§
,¤
,
are the same
as in Equation 1.
Residual slow start effect
Mathis, et al [20] pointed out that it takes TCP some time
before its throughput reaches equilibrium. Assuming se-
lective acknowledgments (SACK), TCP will send roughly
!
¥ " $ &
( )
!
packets in the unstable phase, where 1 is the
loss rate and2
is a constant3
4 5
. This number can be
significant given a low loss rate1
. This happens because
with SACK, slow start will overshoot and drive up the loss
4

8/6/2019 Tech Report NWU-CS-04-34
http://slidepdf.com/reader/full/tech-report-nwu-cs-04-34 7/14
0 0.5 1 1.5 20
0.1
0.2
0.3
0.4
0.5
0.6
0.7
0.8
0.9
1
Overhead (second)
C u m u l a t i v e P e r c e n t a g e s
CDF of Overhead for the Simple TCP Program and (GridFTP+SCP)
The Simple ProgramGridFTP+SCP
Figure 5. CDF of
, the startup overhead.Even for the simple client/server there is
startup overhead likely caused by the resid-
ual slow start effect. The startup overheadsof scp and GridFTP are much larger.
rate or run out of receiver window. Zhang, et al [36] showed
that the mean loss rate in their traces is between 0.006 and
0.0087. Assuming the loss rate is 0.006, and each packet
is 1.5 KB, roughly 800KB data has to be sent before TCP
throughput reaches equilibrium.
We examined hundreds of Linux machines on the North-
western University campus and on PlanetLab and found thatall of them were using SACK. Therefore, it is likely that
most TCP connections experience this slow start overshoot
effect, and because TCP in slow start doesn’t use bandwidth
well, this residual slow start effect can be treated as another
kind of startup overhead, incorporated in
as above. This
can also explain why in Figure 2 the
s for the scp and
GridFTP traces are much stronger than that of the simple
program.
To verify that this is the case in general for the simple
applications without other startup overheads, we used the
data collected in experiment S2. We did least square linear
curve fitting and calculated
for each set of data. Figure 5shows the CDF for these
s. The effect of residual slow
start is obvious in the CDF, where we see over 50% sim-
ple TCP transfers has a
value equal or larger than 0.1.
For comparison purpose, we also plot the CDF of
for
applications that require authentication in the same Figure,
namely GridFTP and SCP. As the CDF indicates, a typical
for such applications is much larger than that of the sim-
ple application.
Why simple TCP benchmarking fails
Now we can explain why current TCP benchmarking ap-
proaches, such as implemented in NWS, have difficulty pre-
dicting the performance of large transfers such as GridFTP
tests [29]:
The default probe used by NWS is too small. It willlikely end up in the noise area as shown in Figure 4.
The TCP throughput that the probe measures is only
useful to TCP flows of similar size because of the
strong correlation between throughput and flow size.
Given Equation 2, it is clear that
$ ¡ £ ¥ §
is the TCP
throughput for the file size 2000KB,
$ ¡ £ © §
is the TCP
throughput for the file size 30000KB and
$ ¡ £ §
is the
steady state TCP throughput. As file size increases¥
decreases, and when the file size is approaching infin-
ity, the throughput will approach
$ ¡ £ §
.
The TCP buffer is not set for NWS probes while theGridFTP tests were done with adjusted TCP buffer
size.
The usage of parallel TCP flows in GridFTP increased
its aggregated throughput.
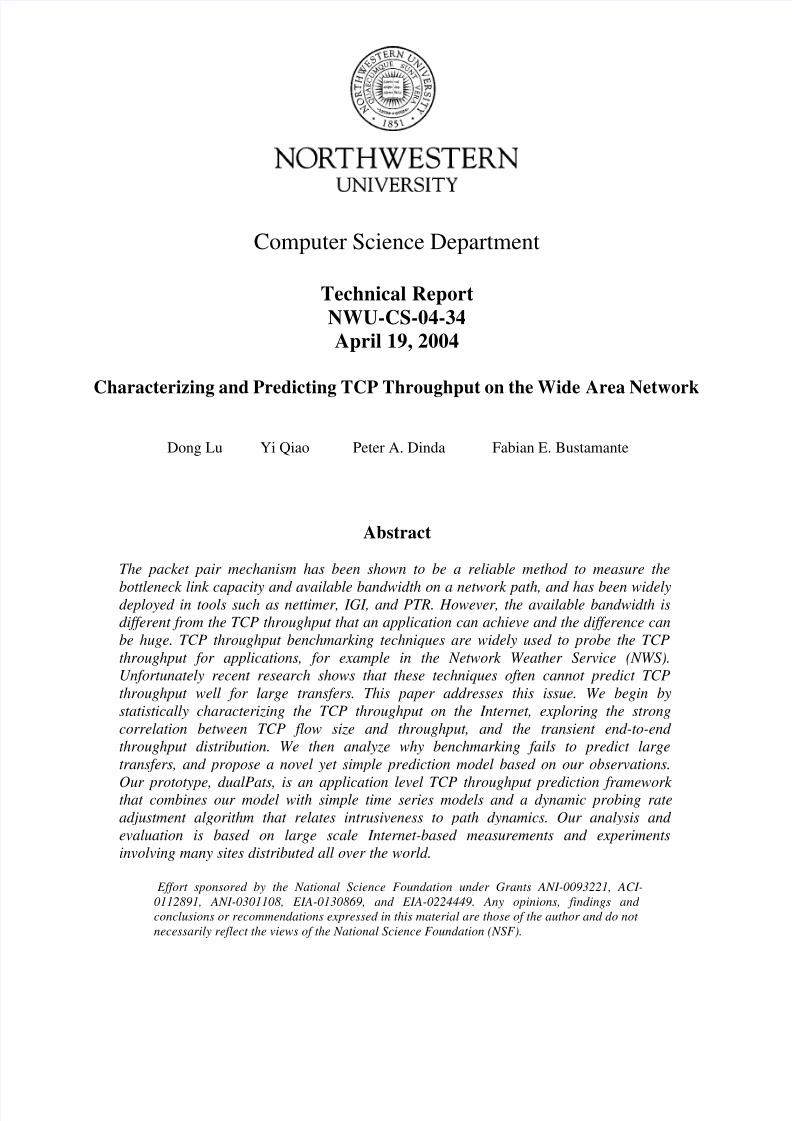
To verify that the linear model is true for most Internet
paths, Figure 6 shows the of the linear curve fitting for
the data in experiment S2 and S3. It is clear the model holds
for both our simple client and server, and applications such
as scp and GridFTP that require authentication.
3.3 A new TCP throughput benchmark mecha-nism and its verification
Based on the above observations, we developed a new
simple TCP benchmark mechanism. Instead of using
probes with the same size, we use two probes with different
sizes, chosen to be beyond the noise area. We then fit a line
between the two measurements, as shown in figure 4. Using
Equation 1 and 2, we can then calculate the TCP throughput
for other flow sizes (file sizes).
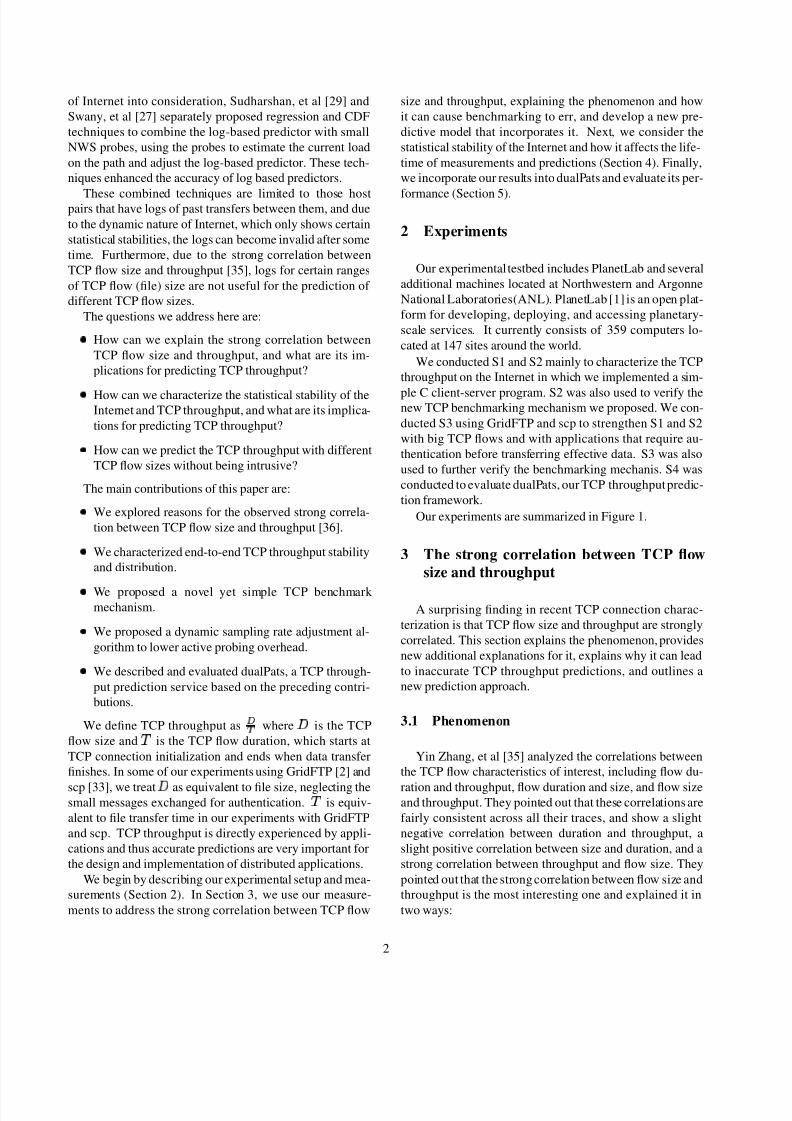
To verify that the new TCP benchmark works, we used
the trace data in experiment S2. We chose a small probe
with size 400KB and a bigger probe with size 800KB, and
predicted the throughput of the other TCP transfers in thetrace. Figure 7 shows the CDF of relative prediction error
for our results by flow size. ¡ £ % of the prediction errors
are below 20%.
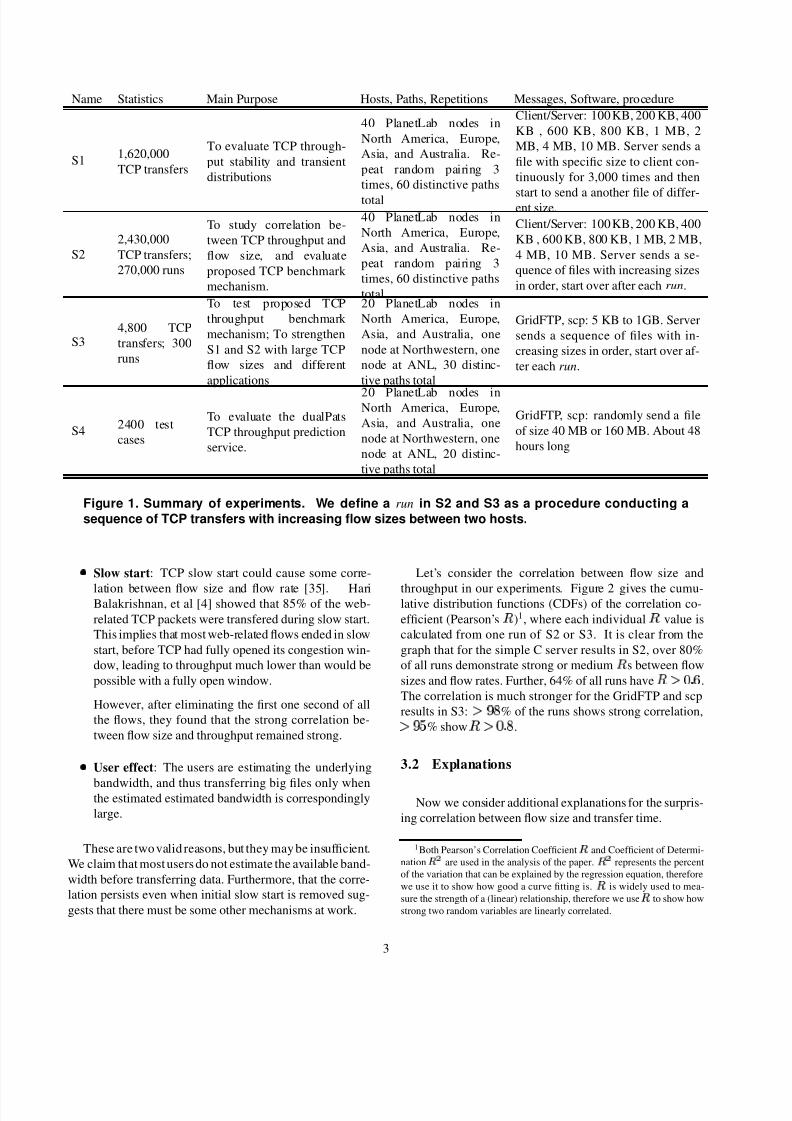
The CDFs look normal, so we used quantile-quantile
plots to test this. Figure 8 shows an example plot. In al-
most all cases, we can fit a straight line to these plots with
3 , which tells us that our relative error is almost al-
ways normal. Normality of prediction errors here is both
5
8/6/2019 Tech Report NWU-CS-04-34
http://slidepdf.com/reader/full/tech-report-nwu-cs-04-34 8/14

8/6/2019 Tech Report NWU-CS-04-34
http://slidepdf.com/reader/full/tech-report-nwu-cs-04-34 9/14
10−4
10−2
100
102
104
0
0.1
0.2
0.3
0.4
0.5
0.6
0.7
0.8
0.9
1
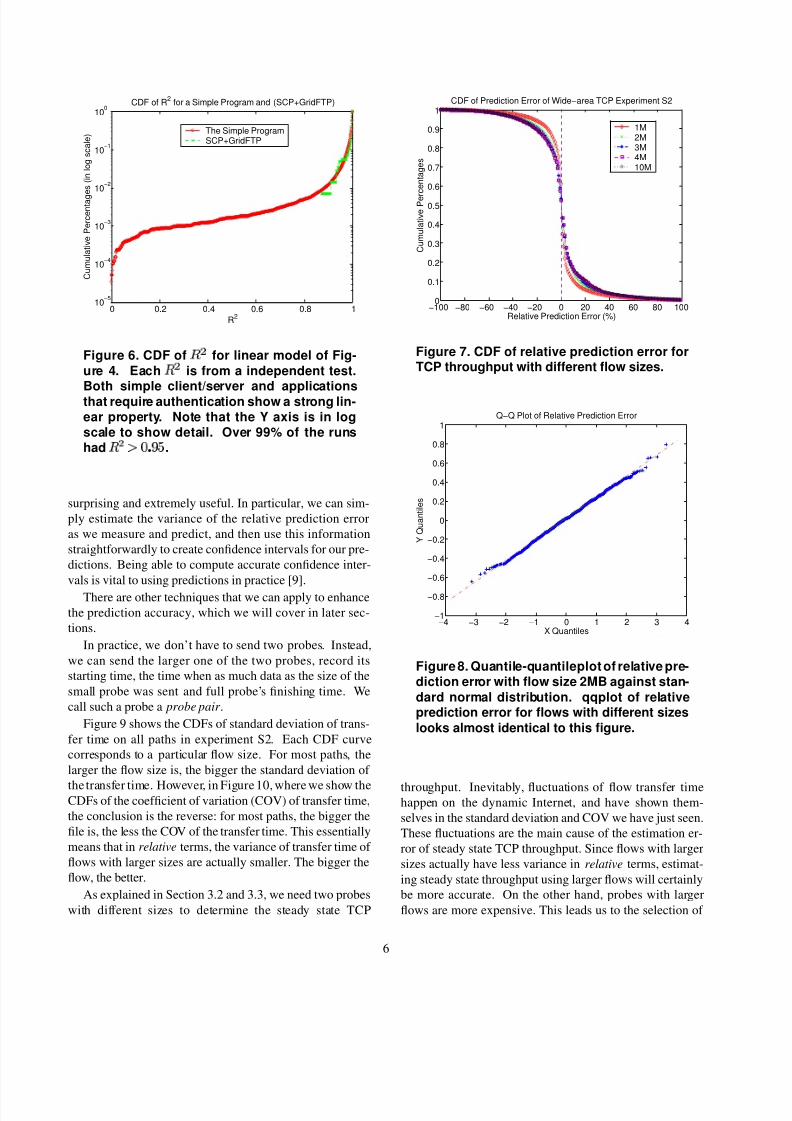
Standard Deviation (in log scale)
C u m u l a t i v e P e r c e n t a g e s
CDF of Standard Deviation of File Transfer Time
1M2M3M4M10M
Figure 9. CDF of standard deviation of trans-fer time at all Internet paths for 5 different flowsizes.
10−4
10−3
10−2
10−1
100
101
0
0.1
0.2
0.3
0.4
0.5
0.6
0.7
0.8
0.9
1
COV of File Transfer Time (in log scale)
C u m u l a t i v e P e r c e n t a g e s
CDF of COV (Coefficient of Variation) of File Transfer Time
1M2M3M4M10M
Figure 10. CDF of COV (coeffecient of varia-tion 2 ¡ ¡ ¢ ¢
£¤ ¦
¨©
) of transfer Time at all Inter-net paths for 5 different flow sizes.
two probe sizes of 400 KBytes and 800 KBytes as default
probes, which we feel is a reasonable tradeoff between esti-mation accuracy and probing cost.
4 Statistical stability of the Internet
Statistical stability or consistency is one of the most im-
portant characteristics of the Internet and is the basis that
makes it possible to predict TCP throughput on the wide
area network. A good understanding of stability will also
help us to make decisions about prediction strategies, such
as the frequency of active probing, and therefore to lower
the intrusiveness of the predictors.
Routing stability: Paxson [23, 22] proposed two met-
rics for route stability, prevalence and persistency. Preva-
lence, which is of particular interest to us here, is the prob-
ability of observing a given route over time. If a route isprevalent, than the observation of it allows us to predict that
it will be used again. Persistency is the frequency of route
changes. The two metrics are not closely correlated. Pax-
son’s conclusions are that Internet paths are heavily domi-
nated by a single route, but that the time periods over which
routes persist show wide variation, ranging from seconds
to days. However, 2/3 of the Internet paths Paxson studied
had routes that persisted for days to weeks. Chinoy found
that route changes tend to concentrate at the edges of the
network, not in its “backbone” [7].
Spatial locality and temporal locality: Balakrishnan,
et al analyzed statistical models for the observed end-to-end
network performance based on extensive packet-level traces
collected from the primary web site for the Atlanta Sum-
mer Olympic Games in 1996. They concluded that nearby
Internet hosts often have almost identical distributions of
observed throughput. Although the size of the clusters for
which the performance is identical varies as a function of
their location on the Internet, cluster sizes in the range of 2
to 4 hops work well for many regions. They also found that
end-to-end throughput to hosts often varied by less than a
factor of two over timescales on the order of many tens of
minutes, and that the throughput was piecewise stationary
over timescales of similar magnitude [5]. Myers, et al ex-
amined performance from a wide range of clients to a widerange of servers and found that bandwidth to the servers and
server rankings from the point of view of a client were re-
markably stable over time [21]. Seshan, et al applied these
findings in the development of the Shared Passive Network
Performance Discovery (SPAND) system [25], which col-
lected server performance information from the point of
view of a pool of clients and used that history to predict
the performance of new requests.
Zhang, et al [36] experimented by sending 1 MB files
every minute between pairs of hosts, and proposed an ef-
fective way to evaluate the temporal locality of end-to-end
TCP throughput of those flows. He looks at the length of
the period where the ratio between the maximum and mini-mum observed TCP throughput is less than a constant factor
. This is referred to as an Operational Constancy Region
(OCR). Instead of using OCR, we define a Statistically Sta-
ble Region (SSR) as the length of the period where the ratio
between the maximum and minimum estimated steady state
TCP throughput is less than a constant factor
. The differ-
ence between OCR and SSR is important because OCR is
only characterizing the throughput for flows with a specific
7

8/6/2019 Tech Report NWU-CS-04-34
http://slidepdf.com/reader/full/tech-report-nwu-cs-04-34 10/14
101
102
103
104
105
0
0.1
0.2
0.3
0.4
0.5
0.6
0.7
0.8
0.9
1
Time (seconds)
C u m u l a t i v e P e r c e n t a g e s
CDF of Statistical Stable Region Length at Different Factors
1.21.523510
Figure 11. CDF of statistically stable region(SSR) for steady-state TCP throughput withdifferent .
size, while SSR characterizes the steady state throughput
for all flows with different sizes. We used traces from ex-
periment S2 to characterize the SSR with steady-state TCP
throughput. That is, instead of looking at the TCP through-
put of a specific flow size, we applied least square linear
fitting to get Equation 1, and therefore the estimated steady-
state TCP throughput of the path.
Figure 11 gives the CDF of length of all SSRs modeled
by steady-state TCP throughput from experiment S2. Each
curve in the plot corresponds to a particular value of theconstant factor . Under all different values of , some de-
gree of temporal locality is exhibited. Moreover, the larger
is, the longer the SSRs tend to be.
For comparison purposes, we also calculated the CDF
of OCR with data from S1. The comparison between ours
and Zhang’s results [36] suggests that the temporal local-
ity in our test environment is much weaker. For instance,
Zhang found that3
§ £ % of OCRs are longer than 1 hour
when
¢ and ¡ £ % of all OCRs exceed 3 hours when
¢ £ . In our results, the two corresponding numbers
drop to 2% and 10% respectively. TCP throughput in our
testbed appears to be less stable. We suspect that this differ-
ence may largely due to the fact that Planetlab nodes oftenbecome CPU or bandwidth saturated, causing great fluctu-
ations of TCP throughput. It is challenging to predict TCP
throughput under a highly dynamic environment.
End-to-end TCP Throughput Distribution: An im-
portant question an application often poses is how the TCP
throughput varies, and, beyond that, whether an analytical
distribution model can be applied to characterize its distri-
bution. Balakrishman, et al [5] studied aggregated TCP
throughput distribution across all different flow sizes be-
tween each pair of Internet hosts. Their statistical analysis
suggests that end-to-end TCP throughput can be well mod-
eled as a log-normal distribution.
Since we have already seen earlier that there exists strong
correlation between TCP throughput and flow size, we are
therefore more interested in studying the TCP throughputdistribution of a particular flow size than in getting an aggre-
gated throughput distribution across all different flow sizes.
The data from experiment S1 lets us do this analysis.
Recall that in S1, for each client/server pair, we re-
peated the transfer of each file 3,000 times. We histogramed
throughput data for each flow size/path tuple. Almost in ev-
ery case, the throughput histrogram demonstrates a multi-
modal distribution. This suggests that it is probably not fea-
sible to model TCP throughput using simple distributions.
Because the collection of data for each client/server pair
lasted several hours or even longer, we suspect that the mul-
timodal feature may be partially due to the change in net-
work conditions during the measurement period. To ver-ify this hypothesis, we try to study throughput distribu-
tion using subsets of each dataset. A subset contains much
less data and covers shorter measurement length. In other
words, we hoped to find “subregions” in each dataset in
which the network conditions are relatively stable and the
throughput data can be better modelled unimodally.
It is very hard to predefine an optimal length or data size
for such “subregions” in the throughput data; in fact, the ap-
propriate length may vary from time to time. Therefore, we
believe it is necessary to adaptively change the subregion
length over time as we acquire data (or walk the dataset of-
fline). The purpose is to segment the whole dataset into
multiple subregions (or identify segement boundaries on-line). For each segment, we fit the data with several analyt-
ical distributions, and evaluate the goodness of fit using the
values of .
Our offline distribution fitting algorithm for TCP
throughput has the following steps:
1. Select a trace of TCP throughput (sequence of mea-
surements for a particular flow size on a particular In-
ternet path).
2. Initialize the subregion length, and set the start and end
point of the subregion to 1 and 100, respectively.
3. Fit the subregion data with an analytical distribution,
and calculate the value of .
4. Increase the subregion length by 100, that is, keep the
start point as from the previous step, but increase the
end point by 100. For this new subregion, fit the data
with the analytical distribution model again, get a new
value of
. Note that the granularity here, 100, can
also be changed.
8
8/6/2019 Tech Report NWU-CS-04-34
http://slidepdf.com/reader/full/tech-report-nwu-cs-04-34 11/14
0 0.2 0.4 0.6 0.8 10
0.1
0.2
0.3
0.4
0.5
0.6
0.7
0.8
0.9
1
R2
C u m u l a t i v e P e r c
e n t a g e s
CDF of R2
for Different Distributions
normaluniformparetolognormalexponential
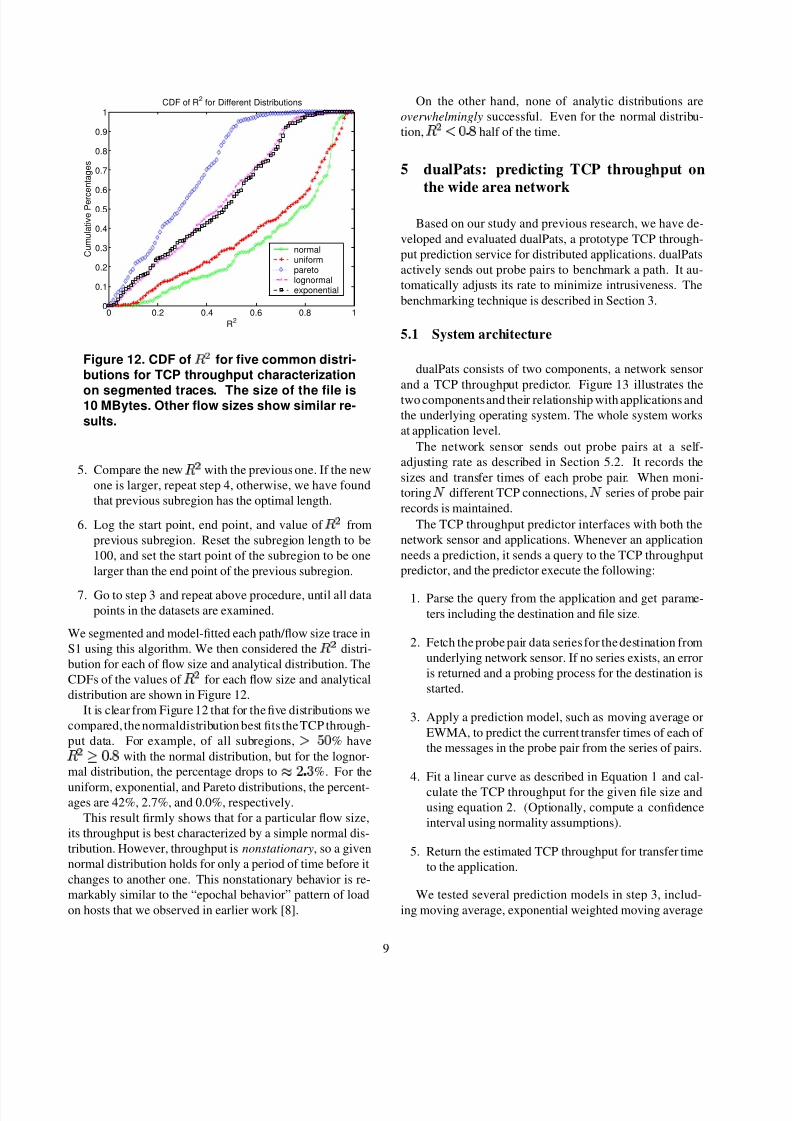
Figure 12. CDF of
for five common distri-butions for TCP throughput characterization
on segmented traces. The size of the file is10 MBytes. Other flow sizes show similar re-
sults.
5. Compare the new
with the previous one. If the new
one is larger, repeat step 4, otherwise, we have found
that previous subregion has the optimal length.
6. Log the start point, end point, and value of
from
previous subregion. Reset the subregion length to be
100, and set the start point of the subregion to be one
larger than the end point of the previous subregion.
7. Go to step 3 and repeat above procedure, until all data
points in the datasets are examined.
We segmented and model-fitted each path/flow size trace in
S1 using this algorithm. We then considered the distri-
bution for each of flow size and analytical distribution. The
CDFs of the values of
for each flow size and analytical
distribution are shown in Figure 12.
It is clear from Figure 12 that for the five distributions we
compared, the normaldistribution best fits the TCP through-
put data. For example, of all subregions,¡ £
% have
£ ¥ with the normal distribution, but for the lognor-
mal distribution, the percentage drops to3 ¥ ¢
%. For the
uniform, exponential, and Pareto distributions, the percent-ages are 42%, 2.7%, and 0.0%, respectively.
This result firmly shows that for a particular flow size,
its throughput is best characterized by a simple normal dis-
tribution. However, throughput is nonstationary, so a given
normal distribution holds for only a period of time before it
changes to another one. This nonstationary behavior is re-
markably similar to the “epochal behavior” pattern of load
on hosts that we observed in earlier work [8].
On the other hand, none of analytic distributions are
overwhelmingly successful. Even for the normal distribu-
tion, £ £ ¥ half of the time.
5 dualPats: predicting TCP throughput on
the wide area network
Based on our study and previous research, we have de-
veloped and evaluated dualPats, a prototype TCP through-
put prediction service for distributed applications. dualPats
actively sends out probe pairs to benchmark a path. It au-
tomatically adjusts its rate to minimize intrusiveness. The
benchmarking technique is described in Section 3.
5.1 System architecture
dualPats consists of two components, a network sensor
and a TCP throughput predictor. Figure 13 illustrates the
two components and their relationship with applications and
the underlying operating system. The whole system works
at application level.
The network sensor sends out probe pairs at a self-
adjusting rate as described in Section 5.2. It records the
sizes and transfer times of each probe pair. When moni-
toring¥
different TCP connections,¥
series of probe pair
records is maintained.
The TCP throughput predictor interfaces with both the
network sensor and applications. Whenever an application
needs a prediction, it sends a query to the TCP throughput
predictor, and the predictor execute the following:
1. Parse the query from the application and get parame-
ters including the destination and file size.
2. Fetch the probe pair data series for the destination from
underlying network sensor. If no series exists, an error
is returned and a probing process for the destination is
started.
3. Apply a prediction model, such as moving average or
EWMA, to predict the current transfer times of each of
the messages in the probe pair from the series of pairs.
4. Fit a linear curve as described in Equation 1 and cal-
culate the TCP throughput for the given file size and
using equation 2. (Optionally, compute a confidence
interval using normality assumptions).
5. Return the estimated TCP throughput for transfer time
to the application.
We tested several prediction models in step 3, includ-
ing moving average, exponential weighted moving average
9

8/6/2019 Tech Report NWU-CS-04-34
http://slidepdf.com/reader/full/tech-report-nwu-cs-04-34 12/14
Applications
TCP throughput predictor
Network Sensor
OS kernel NIC
Figure 13. System architecture of dualPats.
(EWMA) and simply using the last value. A moving aver-
age with window size 20 works best on average in our ex-
periments. We speculate that this is so because during each
SSR, the end-to-end TCP throughput is best modeled withnormal distribution. For a normal distribution with no serial
correlation, the mean is the best predictor possible, and the
windowed mean estimates this.
5.2 Dynamic sampling rate adjustment algorithm
There are two ways to decrease the overhead caused by
the probe pairs of dualPats: decrease the size of the probe
pair or decrease the sampling rate.
As we discussed in Section 4, each Internet path shows
statistical stability in TCP throughput. However, each path
is different in the length of its SSR. Therefore, we designed
a simple algorithm to dynamically adjust the sampling rateto the path’s SSR. The algorithm is as follows:
1. Set an upper bound
and a lower bound¡
for the
sampling interval. They were set as 20 and 1200 sec-
onds in our tests.
2. Set another two relative changing bounds,
,
, in
units of percentage. After sending each probe pair, es-
timate the current steady-state TCP throughput. If it
has changed less than
, increases the sampling in-
terval by a step of ¢
seconds; if it changes between
and
, keep the current interval; otherwise decrease
the interval. In experiment S4,
,
were set to be5% and 15%.
3. The interval must be between¡
and
.
We also want to minimize the size of probe pairs on the
condition that none of them will fall into the noise area as
shown in Figure 4. However, the noise area is different for
each Internet path, as discussed in Section 3. It is a func-
tion of loss rate and underlying bandwidth. We need an
algorithm that can detect it automatically. For now, the al-
gorithm uses feedback from application about its prediction
error.
1. We set a default value or staring value for the probe
pairs. In experiment S4, we used 400KB and 800KB.
Also set a upperbound ¢
for the probe pair.
2. If ¤
continuous prediction errors are bigger than a
threshold ¤¥
, and with the same sign, we increase the
probe pair by 200KB each.
3. The probe pair can’t exceed§ ¢
.
5.3 Evaluation
We evaluated dualPats using the data from experiment
S4, which we described in detail in Section 2. The primary
metric used was the relative prediction error:
¨ © ©
¢
© ¨
¢
"
¨
¨
"
¢
"
¨
¨
"
¢
"
¨
(3)
dualPats ran 3 ! £ £ predictions on the 20 paths 48 hours
long S4 experiments. Test cases are randomly chosen
40MB or 160MB files.
The prediction results are shown in Figure 14. Mean
error is calculated by averaging all of the relative errors.
For an unbiased predictor, this value should be close to zero
given enough test cases. We can see that in our evaluation it
is quite small in most cases, and we see an equal proportion
of positive and negative mean errors.The mean absolute error is the average of the absolute
value of all of the relative errors. We consider it the most
important metric in evaluating the predictions. Figure 14
shows that all 20 paths have a mean absolute error£ ¢ £
%,
17 out of 20 paths are£ £
%, and 13 out 20 paths are
£
%. As we commented in Section 4, PlanetLab is much
more heavily loaded and dynamic than the current Internet,
thus it is likely to be much harder to predict than on the
current Internet.
We studied the correlation between the error and sev-
eral known attributes. The results are shown in Figure 15.
Clearly, the mean error is not related to any of the attributes,
which further suggests that the predictions given by dual-Pats are unbiased. However, if the path is very dynamic
it is hard to predict. Figure 15 shows that the between
the mean absolute error and the sampling interval length
(and, indirectly, the SSR) is negative and pretty strong. This
implies that our algorithm captured the path dynamics and
tried to adjust to its changes.
Our conclusion is that dualPats does a effective job of
predicting TCP throughput.
10

8/6/2019 Tech Report NWU-CS-04-34
http://slidepdf.com/reader/full/tech-report-nwu-cs-04-34 13/14
Path Router Hops Mean RTT Mean err % Mean stderr Mean abs(err)% Mean abs(stderr) Mean Interval
1 20 55 -0.0073 0.11 0.069 0.13 641.97
2 18 60 0.10 0.17 0.17 0.18 29.44
3 17 33 -0.21 0.23 0.25 0.51 132.2
4 11 27.5 -0.03 0.19 0.13 0.25 71.56
5 13 31 -0.04 0.20 0.16 0.28 48.76
6 16 138 -0.079 0.19 0.14 0.29 58.18
7 16 120 0.048 0.355 0.28 0.42 21.87
8 14 51 0.021 0.12 0.095 0.168 512.64
9 18 207 -0.14 0.17 0.18 0.36 51.50
10 14 29 -0.11 0.19 0.14 0.31 180.17
11 19 110 -0.036 0.18 0.11 0.24 28.57
12 15 36 -0.038 0.14 0.078 0.18 258.16
13 17 59 0.035 0.208 0.16 0.24 32.23
14 12 23.5 -0.012 0.060 0.042 0.082 320.97
15 13 28 -0.095 0.186 0.14 0.31 511.33
16 18 100 -0.028 0.16 0.11 0.21 543.75
17 19 70 -0.083 0.030 0.083 0.17 543.63
18 14 81 -0.076 0.025 0.076 0.154 522.20
19 19 72 0.21 0.38 0.29 0.39 48.39
20 17 50 0.11 0.12 0.14 0.12 97.25
Figure 14. Prediction error statistics for experiment S4. RTT is the round trip time between the twosites in miliseconds, and Mean Interval is the average interval time between probe pairs in seconds.
Mean err is the average relative error while mean abs(err) is the average of the absolute relativeerrors.
Router Hops Mean RTT Mean Interval
Mean abs(err) 0.112 0.257 -0.62
Mean err 0.076 0.13 -0.13
Figure 15. Correlation coefficient
between
prediction error and known attributes.
6 Conclusions and future work
We have characterized the behavior of TCP throughput
in the wide area environment, providing additional expla-
nations for the correlation of throughput and flow size and
demonstrating how this correlation causes erroneous pre-
dictions to be made when using simple TCP benchmarking
to characterize a path. In response, we proposed and evalu-
ated a new benchmarking approach, probe pair, from which
TCP throughput for different messages sizes can be derived.We described and evaluated the performance of a new pre-
dictor, dualPats, implements this approach.
In this work, we do not consider parallel TCP flows,
which is a current subject for us. We also acknowledge
that, like all benchmarking-based systems, our approach has
scalability problems. We have addressed this to some ex-
tent with our dynamic sample rate adjustment algorithm.
However, we are also considering whether our ideas can
work within a passive measurement model such as that in
Wren [34], and the use of hierarchical decomposition as in
Remos [18] and NWS Clique [32]. We have assumed that
the network path is the bottleneck for file transfer. In some
cases, especially in high speed optical networks, this may
not be true, and transfer time prediction would also have
to take into account processor and memory system perfor-
mance.
References
[1] http://www.planet-lab.org.
[2] ALLCOCK, W., BESTER, J., BRESNAHAN, J., CERVENAK,
A., LIMING, L., AND TUECKE, S. GridFTP: Protocol ex-
tensions to ftp for the grid. Tech. rep., Argonne National
Laboratory, August 2001.
[3] ALLEN, M., AND WOLSKI, R . The livny and plank-beck
problems: Studies in data movement on the computationalgrid. In Supercomputing 2003 (November 2003).
[4] BALAKRISHNAN, H . , PADMANABHAN , V. N., SESHAN,
S., STEMM, M., AND KATZ, R. H. TCP behavior of a busy
internet server: Analysis and improvements. In INFOCOM
(1) (1998), pp. 252–262.
[5] BALAKRISHNAN, H . , SESHAN, S . , STEMM, M ., AND
KATZ, R. H. Analyzing Stability in Wide-Area Network
Performance. In ACM SIGMETRICS (June 1997).
11

8/6/2019 Tech Report NWU-CS-04-34
http://slidepdf.com/reader/full/tech-report-nwu-cs-04-34 14/14
[6] CARTER, R., AND CROVELLA, M. Measuring bottleneck
link speed in packet-switched networks. Performance Eval-
uation, 28 (1996), 297–318.
[7] CHINOY, B. Dynamics of internet routing information. In
SIGCOMM (1993), pp. 45–52.
[8] DINDA, P. A. The statistical properties of host load. Scien-
tific Programming 7 , 3,4 (1999). A version of this paperis also available as CMU Technical Report CMU-CS-TR-
98-175. A much earlier version appears in LCR ’98 and as
CMU-CS-TR-98-143.
[9] DINDA, P. A. Online prediction of the running time of tasks.
Cluster Computing 5, 3 (2002). Earlier version in HPDC
2001, summary in SIGMETRICS 2001.
[10] DOVROLIS, C., RAMANATHAN, P., AND MOORE, D. What
do packet dispersion techniques measure? In INFOCOM
(2001), pp. 905–914.
[11] DOWNEY, A. B. Using pathchar to estimate internet link
characteristics. In Measurement and Modeling of Computer
Systems (1999), pp. 222–223.
[12] HU, N., AND STEENKISTE , P. Evaluation and characteriza-
tion of available bandwidth probing techniques. IEEE JSAC
Special Issue in Internet and WWW Measurement, Mapping,
and Modeling 21, 6 (August 2003).
[13] JAIN, M., AND DOVROLIS, C. End-to-end available band-
width: Measurement methodolody, dynamics, and relation
with tcp throughput. In ACM SIGCOMM (2002).
[14] JAIN, M., AND DOVROLIS, C. Pathload: A measurement
tool for end-to-end available bandwidth. In Passive and Ac-
tive Measurement Workshop (2002).
[15] JIN , G . , YANG, G . , CROWLEY, B., AND AGARWAL, D.
Network characterization service (ncs). In 10th IEEE Sym-
posium on High Performance Distributed Computing, Aug.2001. (2001).
[16] KESHAV, S . A control-theoretic approach to flow control.
Proceedings of the conference on Communications architec-
ture and protocols (1993), 3–15.
[17] LAI , K., AND BAKER, M. Nettimer: A tool for measur-
ing bottleneck link bandwidth. In USENIX Symposium on
Internet Technologies and Systems (2001), pp. 123–134.
[18] LOWEKAMP, B., MILLER, N., SUTHERLAND , D., GROSS,
T., STEENKISTE , P., AND SUBHLOK, J. A resource moni-
toring system for network-aware applications. In Proceed-
ings of the 7th IEEE International Symposium on High
Performance Distributed Computing (HPDC) (July 1998),
IEEE, pp. 189–196.[19] MATHIS, M., AND ALLMAN, M. A framework for defining
empirical bulk transfer capacity metrics, rfc3148, July 2001.
[20] MATHIS, M., SEMKE, J., AND MAHDAVI, J. The macro-
scopic behavior of the tcp congestionavoidance algorithm.
Computer Communication Review 27 , 3 (1997).
[21] MYERS, A., DINDA, P. A., AND ZHANG, H. Performance
characteristics of mirror servers on the internet. In INFO-
COM (1) (1999), pp. 304–312.
[22] PAXSON, V. End-to-end routing behavior in the Inter-
net. In Proceedings of the ACM SIGCOMM Conference
on Applications, Technologies, Architectures, and Protocols
for Computer Communications (New York, August 1996),
vol. 26,4 of ACM SIGCOMM Computer Communication Re-
view, ACM Press, pp. 25–38.
[23] PAXSON, V. End-to-end routing behavior in the Internet.
IEEE/ACM Transactions on Networking 5, 5 (1997), 601–
615.
[24] RIBEIRO, V., RIEDI, R., BARANIUK, R. , NAVRATIL, J.,
AND COTTRELL, L. pathchirp: Efficient available band-
width estimation for network paths. In Passive and Active
Measurement Workshop (2003).
[25] SESHAN, S . , STEMM, M., AND KATZ, R. H. SPAND:
Shared passive network performance discovery. In USENIX
Symposium on Internet Technologies and Systems (1997).
[26] STRAUSS, J. , KATABI, D., AND KAASHOEK , F. A mea-
surement study of available bandwidth estimation tools. In
Internet Measurement Conference (2003).
[27] SWANY
, M.,AND
WOLSKI
, R . Multivariate resource per-formance forecasting in the network weather service. In
ACM/IEEE conference on Supercomputing (2002).
[28] SWANY, M., AND WOLSKI , R. Representing dynamic per-
formance information in grid environments with the network
weather service. In 2nd IEEE/ACM International Symposium
on Cluster Computing and the Grid (CCGRID’02) (2002).
[29] VAZHKUDAI , S . , AND SCHOPF, J. Predicting sporadic
grid data transfers. In 12th IEEE International Symposium
on High Performance Distributed Computing (HPDC-12)
(2002).
[30] VAZHKUDAI , S . , SCHOPF, J. , AND FOSTER, I. Predict-
ing the performance of wide area data transfers. In The
16th Int’l Parallel and Distributed Processing Symposium(IPDPS 2002). (2002).
[31] WOLSKI, R. Dynamically forecasting network performance
using the network weather service. Cluster Computing 1, 1
(1998), 119–132.
[32] WOLSKI, R., SPRING, N., AND HAYES, J. The network
weather service: A distributed resource performance fore-
casting service for metacomputing. Journal of Future Gen-
eration Computing Systems 15, 5-6 (1999), 757–768.
[33] YLONEN, T. SSH — secure login connections over the inter-
net. In Proceedings of the 6th USENIX Security Symposium
(1996), pp. 37–42.
[34] ZANGRILLI , M., AND LOWEKAMP, B. B. Comparing pas-
sive network monitoring of grid application traffic with ac-tive probes. In Fourth International Workshop on Grid Com-
puting (2003).
[35] ZHANG, Y., BRESLAU, L., PAXSON, V., AND SHENKER ,
S. On the Characteristics and Origins of Internet flow rates.
In ACM SIGCOMM (2002).
[36] ZHANG, Y., DUFFIELD, N., PAXSON, V., AND SHENKER ,
S. On the constancy of internet path properties. In ACM SIG-
COMM Internet Measurement Workshop (November 2001).
12