technical analysis: fibonacci - saxo bank
TRANSCRIPT
CHAPTER 4.2Technical Analysis: Fibonacci
1
TECHNICAL ANALYSIS: FIBONACCI Fibonacci analysis is the study of identifying potential support and resistance levels in the future based on past price trends and reversals. Fibonacci analysis is based on the mathematical discoveries of Leonardo Pisano—also known as Fibonacci. He is credited with discovering a sequence of numbers that now bears his name: the Fibonacci sequence.
The Fibonacci sequence is a series of numbers that progresses as follows, 0, 1, 1, 2, 3, 5, 8, 13, 21, 34, 55…. To arrive at each subsequent number in the sequence, you simply find the sum of the two preceding numbers in the sequence. For example, to find the number that follows 55 in the sequence, you find the sum of 55 + 34 (the two preceding numbers in the sequence). The sum of 55 + 34 is 89. This is therefore the next number in the sequence.
What intrigued Fibonacci about this sequence was not the numbers themselves but rather the relationships among the numbers, or the ratios created by various numbers in the sequence. Perhaps the most important ratio is 1.618—also known as the golden ratio, or golden mean. This number can be found throughout nature (in sea shells, growth rings, etc.) and throughout the Fibonacci sequence. Each number in the Fibonacci
sequence is 1.618 times larger than the preceding number. For example, 89 is 1.618 times larger than 55 (89 ÷ 55 = 1.618).
The golden ratio and the other ratios that exist within the Fibonacci sequence represent the natural ebb and flow of life. They also apply to the natural ebb and flow of stocks and CFDs.
In this section, you will learn how Fibonacci ratios can be applied to stocks and CFDs using the following analysis tools:
Contents
Fibonacci retracements
Fibonacci projections
Fibonacci fans
Cornèr Bank Ltd. // Cornèrtrader // Tödistrasse 27 // 8002 Zurich_SwitzerlandTel: +41 58 880 80 80 // Fax: +41 58 880 80 81 // [email protected] // cornertrader.ch 1
2
FIBONACCI RETRACEMENTS When a stock price reverses trend, stock and CFD traders naturally want to know how far the stock price is most likely to move in its new direction. Fibonacci retracement levels can help. Certain Fibonacci ratios are useful when you are trying to determine how far a stock price is going to retrace, or move against, a previous trend.
The ratios you will be using in your stock and CFD trading will help you find the following retracement levels:
61.8 percent—This level is found by dividing a number in the Fibonacci sequence by the number immediately following it in the sequence (55 ÷ 89 = 61.8%).
38.2 percent—This level is found by dividing a number in the Fibonacci sequence by the second number following it in the sequence (34 ÷ 89 = 38.2%).
23.6 percent—This level is found by dividing a number in the Fibonacci sequence by the third number following it in the sequence (21 ÷ 89 = 23.6%).
You will also use three other levels in your retracement analysis. Whilst the following levels are not calculated using numbers within the Fibonacci sequence, they are based on the Fibonacci levels above:
50 percent—This level is determined by finding the middle between 61.8 percent and 38.2 percent ((61.8% + 38.2%) ÷ 2 = 50%).
76.4 percent—This level is determined by finding the distance from 38.2 percent and 23.6 percent (38.2% - 23.6% = 14.6%) and adding it to 61.8 percent (61.8% + 14.6% = 76.4%).
100 percent—This level is determined simply by finding where the previous trend began.
Determining all six Fibonacci retracement levels provides you with potential support and resistance levels you can use in your stock and CFD trading.
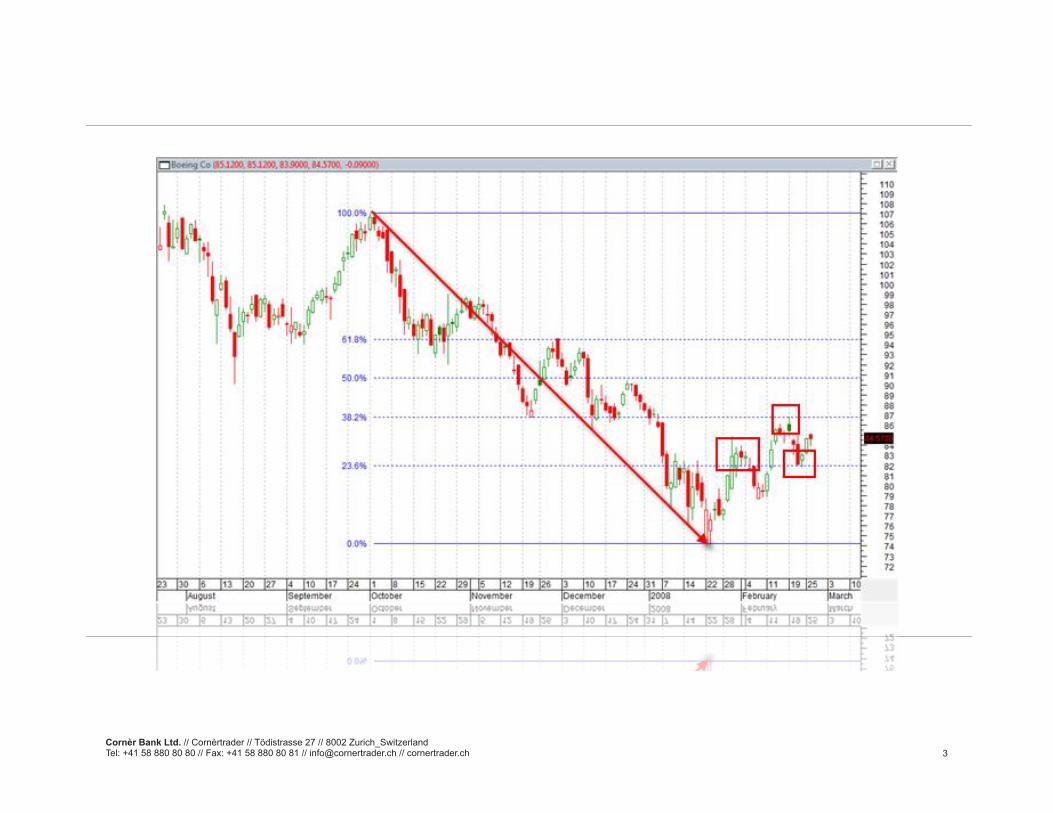
You can see these Fibonacci levels on the daily Boeing (BA:xnys) chart below. Each of the illustrated levels was calculated based on the trend highlighted by the red arrow. You could have used each level to help you determine when to enter and exit your investments as the stock price began to turn around and move higher.
Cornèr Bank Ltd. // Cornèrtrader // Tödistrasse 27 // 8002 Zurich_SwitzerlandTel: +41 58 880 80 80 // Fax: +41 58 880 80 81 // [email protected] // cornertrader.ch 2
3
Cornèr Bank Ltd. // Cornèrtrader // Tödistrasse 27 // 8002 Zurich_SwitzerlandTel: +41 58 880 80 80 // Fax: +41 58 880 80 81 // [email protected] // cornertrader.ch 3
4
Notice how the stock price moved back and forth, bouncing off both the 23.6 percent retracement level and the 38.2 percent retracement level.
FIBONACCI PROJECTIONS Trends never go straight up or straight down. Trends move in one direction initially, then they pull back and move in the opposite direction for a while, and then they turn around and resume moving in the previous direction. This is the natural ebb and flow of a trend.
When a stock price resumes its previous trend, stock and CFD traders naturally want to know how far the stock price is most likely to continue moving. Fibonacci projection levels can help. Certain Fibonacci ratios are useful when you are trying to determine how far the stock price is going to move once it resumes its previous trend.
The ratios you will be using in your stock and CFD trading will help you find the following projection levels:
161.8 percent—This level is found by dividing a number in the Fibonacci sequence by the number immediately preceding it in the sequence (89 ÷ 55 = 161.8%).
261.8 percent—This level is found by dividing a number in the Fibonacci sequence by the second number preceding it in the sequence (89 ÷ 34 = 261.8%).
423.8 percent—This level is found by dividing a number in the Fibonacci sequence by the third number preceding it in the sequence (89 ÷ 21 = 423.8%).
Determining all three Fibonacci projection levels provides you with potential support and resistance levels that you can use in your stock and CFD trading.
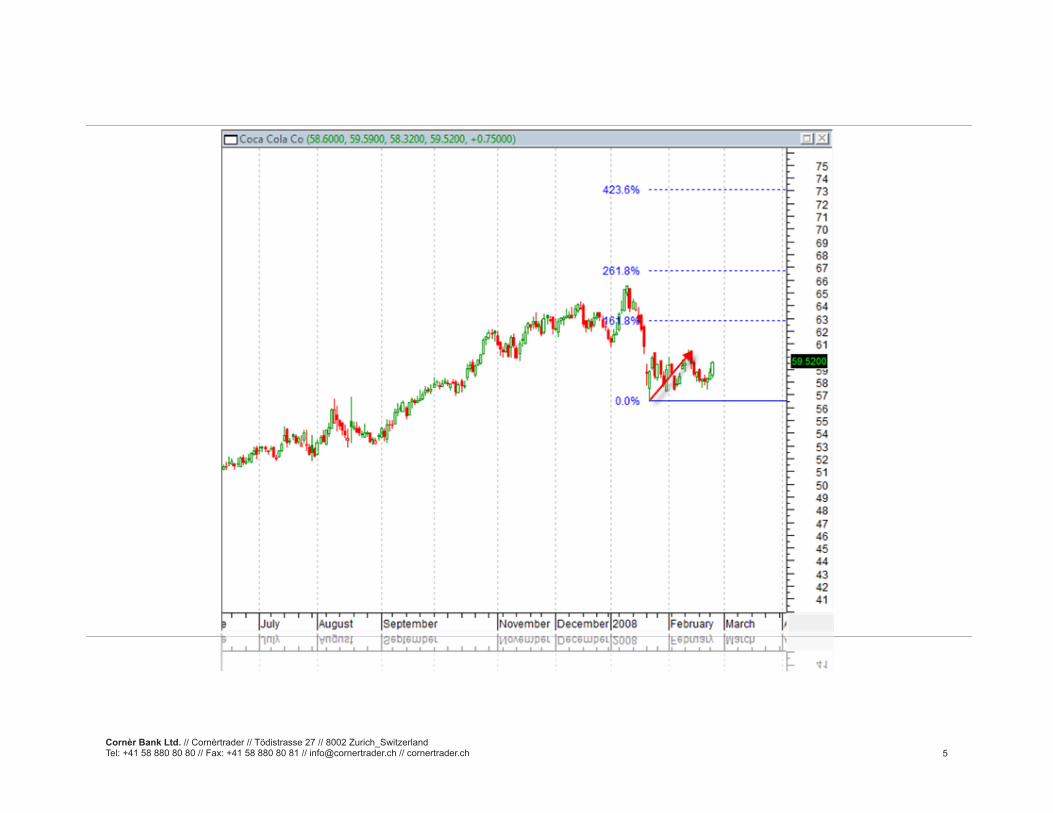
You can see these Fibonacci levels on the daily Coca Cola (KO:xnys) chart below . Each of the illustrated levels reflects the trend highlighted by the red arrow. If Coca Cola resumes its upward trend, you can use each level to help you determine where to set your profit targets (potential exit levels) if you buy the stock or CFD.
Cornèr Bank Ltd. // Cornèrtrader // Tödistrasse 27 // 8002 Zurich_SwitzerlandTel: +41 58 880 80 80 // Fax: +41 58 880 80 81 // [email protected] // cornertrader.ch 4
5
Cornèr Bank Ltd. // Cornèrtrader // Tödistrasse 27 // 8002 Zurich_SwitzerlandTel: +41 58 880 80 80 // Fax: +41 58 880 80 81 // [email protected] // cornertrader.ch 5
6
Notice that the stock price, based on the previous trend, has the potential to move up to the 161.8 percent projection level in the near future. If it reaches this level, you could set the 261.8 percent projection level as your next profit target level.
FIBONACCI FANS Fibonacci levels provide diagonal levels of support and resistance as well as horizontal levels of support and resistance. The diagonal levels of support and resistance are called Fibonacci fans.
Fibonacci fans are based on three Fibonacci retracement levels -61.8 percent, 50 percent and 38.2 percent. To construct a Fibonacci fan you have to do the following:
1. Identify a trend. 2. Identify the three horizontal Fibonacci levels (61.8 percent, 50
percent and 38.2 percent) as they relate to that trend.3. Draw a vertical line that crosses through these levels at the point
where the trend ended.4. Draw three lines, each one beginning where the trend began and
crossing through a separate point where the vertical line intersects one of the Fibonacci levels.
Now that you have your Fibonacci fans drawn you can use them to project potential support and resistance levels that you can use in your stock and CFD trading.
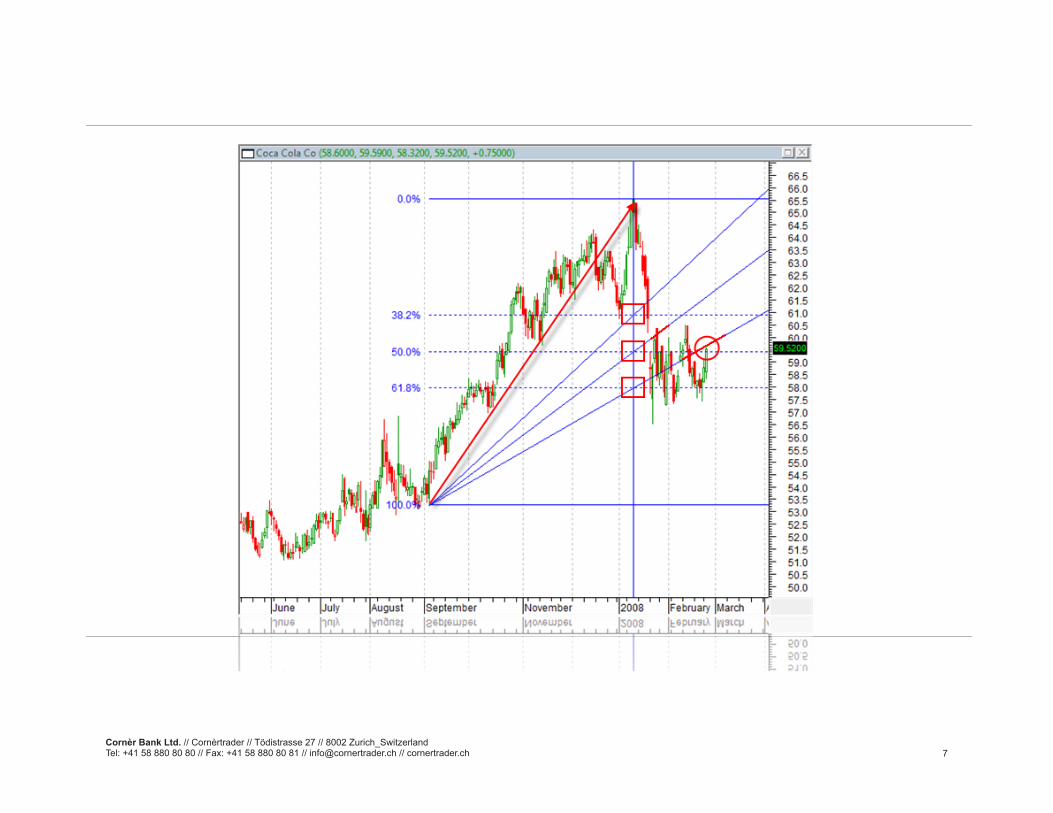
You can see a Fibonacci fan on the daily Coca Cola (KO:xnys) chart below. Each of the illustrated levels was calculated based on the trend highlighted by the red arrow. You could have used the rays from the fan to help you determine when to enter and exit your trades as the stock price began to turn around and move higher.
Notice how the stock price bounced off the middle ray of the Fibonacci fan in early January and is currently at the resistance level formed by the bottom ray of the fan.
Cornèr Bank Ltd. // Cornèrtrader // Tödistrasse 27 // 8002 Zurich_SwitzerlandTel: +41 58 880 80 80 // Fax: +41 58 880 80 81 // [email protected] // cornertrader.ch 6
7
Cornèr Bank Ltd. // Cornèrtrader // Tödistrasse 27 // 8002 Zurich_SwitzerlandTel: +41 58 880 80 80 // Fax: +41 58 880 80 81 // [email protected] // cornertrader.ch 7
� corner trader Trade Mentor
Disclaimer
The curriculum is produced for the purposes of general education.
None of the information contained herein constitutes an offer to purchase or sell a financial instrument or to make any investments. Cornertrader and / or Corner Bank do not take into account your personal investment objectives or financial situation and make no representation, and assume no liability to the accuracy or completeness of the information provided, nor for any loss arising from any investment based on a recommendation, forecast or other information supplied from any employee of Corner Bank, third party, or otherwise. Trades in accordance with the recommendations in an analysis, especially, but not limited to, leveraged investments such as foreign exchange trading and investment in derivatives, can be very speculative and may result in losses as well as profits. You should carefully consider your financial situation and consult your financial advisor(s) in order to understand the risks involved and ensure the suitability of your situation prior to making any investment or entering into any transactions. All expressions of opinion are subject to change without notice. Any opinions made may be personal to the author and may not reflect the opinions of Cornertrader and/ or Corner Bank. Furthermore, please refer to Corner Bank and Cornertrader full General Disclaimer.
6
Cornèr Bank Ltd. // Cornèrtrader // Tödistrasse 27 // 8002 Zurich_SwitzerlandTel: +41 58 880 80 80 // Fax: +41 58 880 80 81 // [email protected] // cornertrader.ch 8