technical analysis of automobile sector
TRANSCRIPT

8/3/2019 Technical Analysis of Automobile Sector
http://slidepdf.com/reader/full/technical-analysis-of-automobile-sector 1/15
Click to edit Master subtitle style
5 / 5 / 1 2
Technical Analysis of Automobile Sector
8/3/2019 Technical Analysis of Automobile Sector
http://slidepdf.com/reader/full/technical-analysis-of-automobile-sector 2/15
5 / 5 / 1 2 Objectives & Scope of the Study
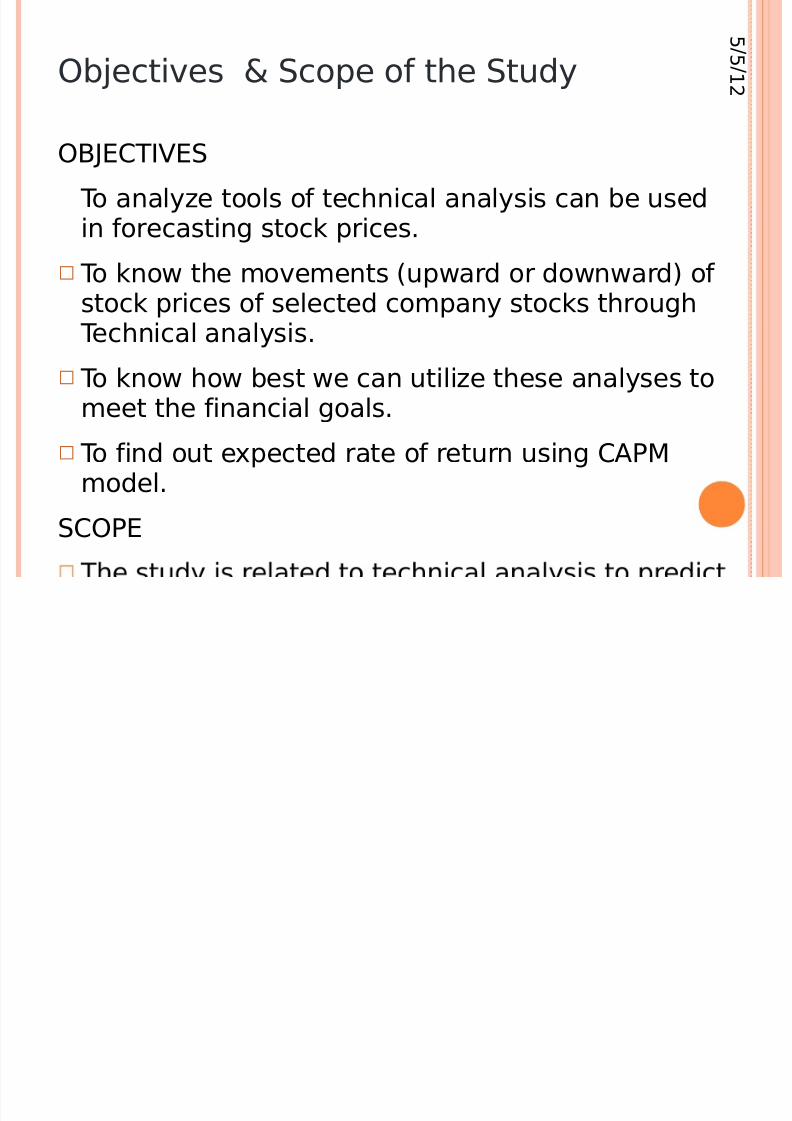
OBJECTIVES
To analyze tools of technical analysis can be usedin forecasting stock prices.
To know the movements (upward or downward) of stock prices of selected company stocks through
Technical analysis.
To know how best we can utilize these analyses to
meet the financial goals.
To find out expected rate of return using CAPMmodel.
SCOPE
8/3/2019 Technical Analysis of Automobile Sector
http://slidepdf.com/reader/full/technical-analysis-of-automobile-sector 3/15
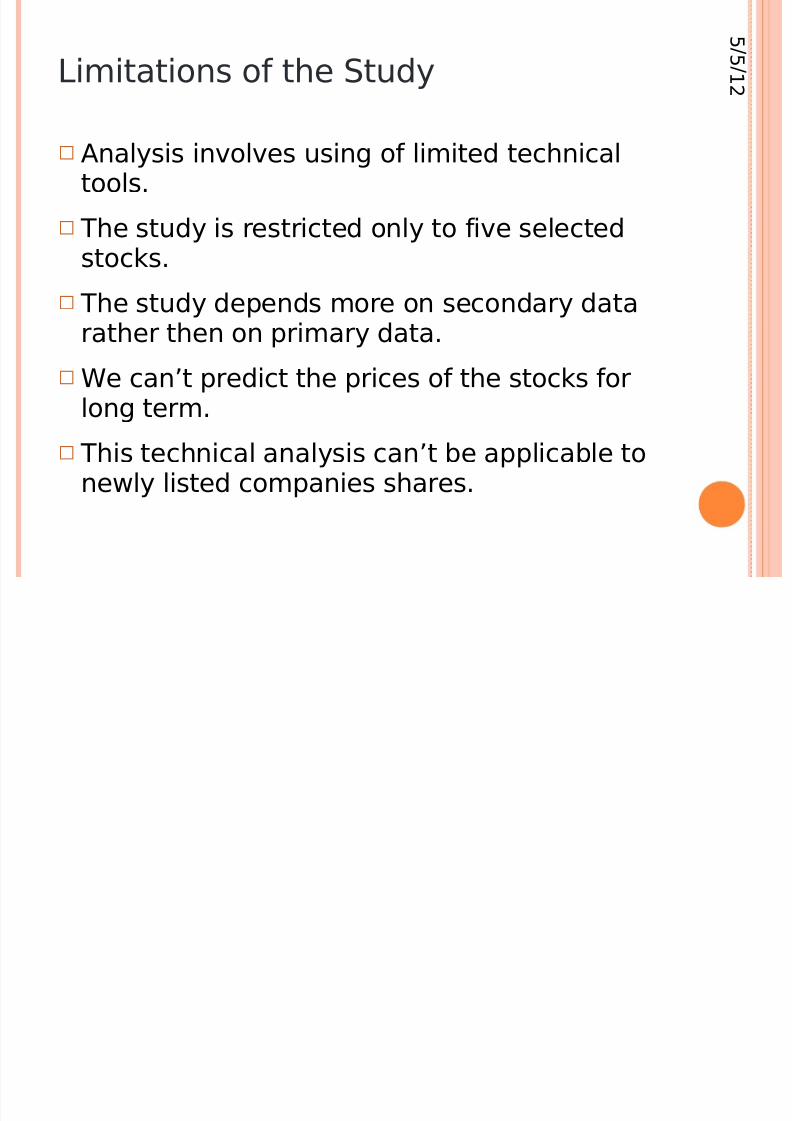
5 / 5 / 1 2 Limitations of the Study
Analysis involves using of limited technicaltools.
The study is restricted only to five selected
stocks. The study depends more on secondary data
rather then on primary data.
We can’t predict the prices of the stocks for
long term.
This technical analysis can’t be applicable tonewly listed companies shares.

8/3/2019 Technical Analysis of Automobile Sector
http://slidepdf.com/reader/full/technical-analysis-of-automobile-sector 4/15
5 / 5 / 1 2
The stocks so selected are as follows.
Bajaj Auto limited
Hero Honda Motors limited
Maruti Udyog limited
TVS Motors Company limited
Tata Motors limited
Chart patterns
Line charts
Japanese candlestick chart

8/3/2019 Technical Analysis of Automobile Sector
http://slidepdf.com/reader/full/technical-analysis-of-automobile-sector 5/15
5 / 5 / 1 2 DOW THEORY
Ripple
Wave
Tide Primary Phases of
Movements

8/3/2019 Technical Analysis of Automobile Sector
http://slidepdf.com/reader/full/technical-analysis-of-automobile-sector 6/15
5 / 5 / 1 2 MACD
Common, the “MACD” is a trend following,momentum indicator that shows therelationship between two moving averages of prices. To Calculate the MACD subtract the 26-
day EMA from a 12-day EMA. A 9-day dottedEMA of the MACD called the signal line is thenplotted on top of the MACD. There are 3common methods to interpret the MACD:
Crossover
Divergence
Overbought/Oversold

8/3/2019 Technical Analysis of Automobile Sector
http://slidepdf.com/reader/full/technical-analysis-of-automobile-sector 7/15
5 / 5 / 1 2 ROC – Rate of Change Indicator
It is a very popular oscillator which measuresthe rate of change of the current price ascompared to the price a certain number of days or weeks back. The ROC has to be used
along with price chart. The buying andselling signals indicated by the ROC shouldalso be confirmed by the price chart.
ROC = (Current Price / Price ‘n’ period ago) - 1
8/3/2019 Technical Analysis of Automobile Sector
http://slidepdf.com/reader/full/technical-analysis-of-automobile-sector 8/15
5 / 5 / 1 2 RSI
Relative strength index was developed byWells Wilder. It is one of the powerful andpopular indicators, which identifiesoverbought and oversold market conditions
along with the signals of buying and sellingopportunities in the market. It also shows thestrength and weakness of a particular scrip ormarket. If the share price is falling and RSI is
rising, a divergence is said to have occurred.Divergence indicates the turning point of themarket. If the RSI is rising in the overboughtzone, it would indicate the downfall of theprice. When the RSI is in the oversold region,
it generates the buy signal.

8/3/2019 Technical Analysis of Automobile Sector
http://slidepdf.com/reader/full/technical-analysis-of-automobile-sector 9/15
5 / 5 / 1 2 Findings
TECHNICAL
INDICATOR
BUY SIGNAL SELLING
SIGNAL
MACD March May
RSI January &February
April
ROC February &
May
January & April
1. BAJAJ AUTO LIMITED
TECHNICAL
INDICATOR
BUY SIGNAL SELLING
SIGNAL
MACD April January
RSI February April
ROC April January
2. HERO HONDA MOTORS LTD.

8/3/2019 Technical Analysis of Automobile Sector
http://slidepdf.com/reader/full/technical-analysis-of-automobile-sector 10/15
5 / 5 / 1 2 TECHNICAL
INDICATOR
BUY SIGNAL SELLING
SIGNAL
MACD April May
RSI Jan & Feb -ROC Mar, Apr Jan, May
3. MARUTI UDYOG LTD.
TECHNICAL
INDICATOR
BUY SIGNAL SELLING
SIGNAL
MACD Mar May
RSI Jan, Feb -
ROC Feb Apr, May
4. TVS MOTOR COMPANY
TECHNICAL
INDICATOR
BUY SIGNAL SELLING
SIGNAL
MACD March April
RSI February April
ROC February April
5. TATA MOTORS LTD.

8/3/2019 Technical Analysis of Automobile Sector
http://slidepdf.com/reader/full/technical-analysis-of-automobile-sector 11/15
5 / 5 / 1 2 CAPM Model
• Capital asset pricing model (CAPM) allows forthe calculation of the required rate of returnfor any risky asset based on the security’sbeta
An asset’s covariance with the marketportfolio is the relevant risk measure (helpsin beta calculation)
This can be used to determine anappropriate required rate of return on arisky asset

8/3/2019 Technical Analysis of Automobile Sector
http://slidepdf.com/reader/full/technical-analysis-of-automobile-sector 12/15
5 / 5 / 1 2 Determining the Expected Return
The expected rate of return of a risk asset is
determined by the RFR plus a risk premium for theindividual asset
The risk premium is determined by the systematicrisk of the asset (beta) and the prevailing market riskpremium (RM-RFR)
RFR)-(R RFR )E(R Mi iβ +=

8/3/2019 Technical Analysis of Automobile Sector
http://slidepdf.com/reader/full/technical-analysis-of-automobile-sector 13/15
5 / 5 / 1 2 The Security Market Line (SML)
The CAPM model is linear and when plotted on agraph paper gives a straight line called SML.
The graphical version of CAPM is Security Market Line.
8/3/2019 Technical Analysis of Automobile Sector
http://slidepdf.com/reader/full/technical-analysis-of-automobile-sector 14/15
5 / 5 / 1 2
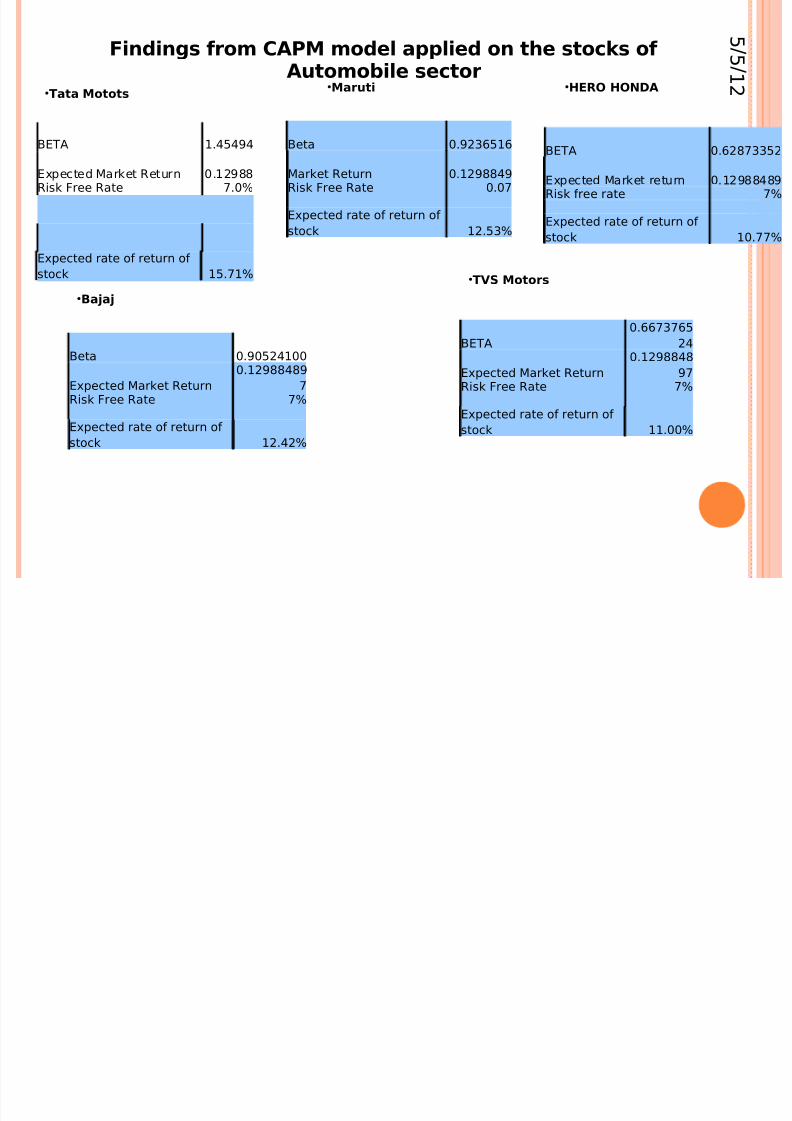
Findings from CAPM model applied on the stocks of Automobile sector
BETA 1.45494
Expected Market Return 0.12988Risk Free Rate 7.0%
Expected rate of return of
stock 15.71%
•Tata Motots
Beta 0.9236516
Market Return 0.1298849Risk Free Rate 0.07 Expected rate of return of
stock 12.53%
•Maruti
BETA 0.62873352
Expected Market return 0.12988489Risk free rate 7% Expected rate of return of
stock 10.77%
•HERO HONDA
Beta 0.90524100
Expected Market Return
0.12988489
7Risk Free Rate 7% Expected rate of return of
stock 12.42%
•Bajaj
BETA
0.6673765
24
Expected Market Return
0.1298848
97Risk Free Rate 7% Expected rate of return of
stock 11.00%
•TVS Motors

8/3/2019 Technical Analysis of Automobile Sector
http://slidepdf.com/reader/full/technical-analysis-of-automobile-sector 15/15
5 / 5 / 1 2
Thank
You