technical and economic feasibility of using steel fiber ... · matter, blended cement concrete with...
TRANSCRIPT


1
Technical and Economic Feasibility of Using Steel Fiber Reinforced
Concrete (SFRC) in Slap line of Railroads
Faculty of Civil and Industrial Engineering
Master Degree in Transport System Engineering
Course of Railway Engineering
Candidate:
SEYEDMOHAMMAD FATEMI
Student Number: 1729934
Advisor:
Prof. Stefano Ricci
A/Y 2018/2019

2
Acknowledgement
I would like to express my sincere gratitude to my advisor Prof. Stefano Ricci for
the continuous support of my Master study and research, for his patience,
motivation, enthusiasm, and immense knowledge. His guidance helped me in all the
time of research and writing of this thesis. I could not have imagined having a better
advisor and mentor for my Master study.
My deep and sincere gratitude to my parents for their continuous and unparalleled
love, help and support. I am grateful to my brothers for always being there for me as
best friends. I am forever indebted to my parents for giving me the opportunities and
experiences that have made me who I am. They selflessly encouraged me to explore
new directions in life and seek my own destiny.
Finally, it is a pleasure to thank my love Mozhgan for the wonderful times we shared,
and especially for the positive energy that always she sent me.
3
Abstract
Use of steel fiber in railroad is under consideration in some countries around the
world. The purposes of using these materials are, increase of freightage and crack
control in the slab line of subway and railroad line and also in developing countries,
usage of steel fiber-reinforced cementations composites is widely expanding in
structures, due to their high mechanical performance and flexibility (1).
Concrete is one of the world most widely used construction material. However, since
the early 1800’s, it has been known that concrete is weak in tension (2). Fibers are
commercially available and manufactured from steel, plastic, glass and other natural
materials. In many situations it is prudent to combine fiber reinforcement with
conventional steel reinforcement to improve performance (3). Because of the
properties of the material (concrete), computer simulations in the field of reinforced
concrete structures are pose a challenge.
There is always a search for concrete with higher strength and durability. In this
matter, blended cement concrete with the incorporation of fibers has been introduced
to suit the current requirements (4). The model describes three tension phases:
achieving elastic tensile concrete strength, material softening, and failure / cracking.
The model of concrete can be used for analysis of failure mechanism of reinforced
concrete structural elements (5). Although most of the current railway tracks are still
of a traditional ballasted type, recent applications tend more and more towards non-
ballasted track.
The major advantages of slab track are: low maintenance, high availability, low
structure height, and low weight. In addition, recent life cycle studies have shown,
that from the cost point of view, slab tracks might be very competitive (6). Slab track
designs have significant advantages comparing to ballasted tracks. The most
significant are the high stability of the track. Their disadvantages against the
ballasted tracks are mainly summarized in their higher construction costs (7).
Keywords: Steel Fiber in concrete, Crack Control, High Performance, High
Strength, Durability, Tension, Failure, Non-Ballast Track, Maintenance, Stability,
Cost.
4
Index
Abstract……………………………..………………………………………………3
Chapter 1…………………………………………………………………………..12
o 1.1 Introduction…………………………………………………………….13
o 1.2 Research Necessity…………………………………………………….14
o 1.3 Investigation Issue Form……………………………………………….17
o 1.4 Performance Method…………………………………………………...17
Chapter 2…………………………………………………………………………..18
o 2.1 Introduction…………………………………………………………….19
o 2.2 History of Fiber Utilization…………………………………………….19
o 2.3 Different Types of Fiber………………………………………………..19
2.3.1 Organic Fiber………………………………………………….20
2.3.2 Mineral Fiber………………………………………………….20
2.3.3 Steel Fiber……………………………………………………..20
2.3.4 Fibers Properties………………………………………………23
o 2.4 SFRC Benefits………………………………………………………….24
o 2.5 SFRC Application…………………………………...…………………25
2.5.1 Fiber Shotcrete………………………………………………...25
2.5.2 Hydraulic Structures…………………………………………..25
2.5.3 Highway and Air-Field Pavement…………………………….26
2.5.4 Structural Applications………………………………………..26
o 2.6 Mechanical Properties of Steel Fiber…………………………………...26
2.6.1 Compressive Strength…………………………………………27
2.6.2 Shear Strength…………………………………………………28
2.6.3 Tensile Strength……………………………………………….28
2.6.4 Durability……………………………………………………...29
o 2.7 Method of Fiber Perch………………………………………………….30
o 2.8 Important Factors in Design and Selection of Fiber…………………….30
2.8.1 Steel Fiber Making Method……………………………………31
o 2.9 Polypropylene FRC in Compression…………………………………...32
2.9.1 Literature on ASTM C1550…………………………………...33
o 2.10 Concrete with High Softness………………………………………….33
o 2.11 Effect of SFRC for Concrete Pavement Slab Replacement in
Transport…………………………………………………………………... 34

5
2.11.1 Concrete Pavement Slab Replacement Standards……………34
2.11.2 Project Objective……………………………………………..34
2.11.3 Construction Practices……………………………………….35
2.11.4 Shrinkage and Cracking Properties…………………………..35
o 2.12 Executive Notes on the Manufacture of Fiber Concrete………………37
2.12.1 Utilization of Fiber Concrete…………………………………37
2.12.2 Example of Use of Fiber Concrete in the Construction of Slab
Lines………………………………………………………………....37
o 2.13 Summary of Papers and Research in the Field of Fiber Concrete…….38
o 2.14 Experimental Program by Dr. Khaloo………………………………...44
2.14.1 Experimental Results and Discussion………………………..45
2.14.2 Ultimate Strength of Slabs and Energy Absorption
Characteristics……………………………………………………….46
2.14.3 Mode of Fiber………………………………………………...47
o 2.15 Conclusions…………………………………………………………...48
Chapter 3…………………………………………………………………………..49
o 3.1 Introduction…………………………………………………………….50
o 3.2 Design Method…………………………………………………………50
3.2.1 Allowed Stress Design………………………………………...50
3.2.2 Resistance Design Method…………………………………….50
3.2.3 design in Limit State…………………………………………..50
o 3.3 Fiber Concrete design…………………………………………………..52
o 3.4 Design of Fiber Reinforcement Concrete Beams in RILEM Regulation..52
3.4.1 Determination of Flexural Tensile Strength……………………52
3.4.2 Flexural Capacity Calculation in RILEM……………………...53
3.4.3 Anchor Cracking ………………………………………………55
3.4.4 Surrender Moment Calculation………………………………...55
3.4.5 Calculate the Final Moment……………………………………56
3.4.6 Fiber Concrete Beams Design without Ordinary Armature……56
3.4.7 Shear Capacity in RILEM Regulation…………………………56
3.4.8 Calculate of crack Width……………………………………….58
3.4.9 Fiber Crack Width Calculation without Armature in RILEM
Regulation………………………………………………………….. 58
o 3.5 Design of Fiber Reinforced Concrete Beams in FIB Regulation………58
3.5.1 Determination of Tensile-Flexural strength……………………59
3.5.2 Bending Strength………………………………………………61
6
3.5.3 Anchor Cracking………………………………………………62
o 3.6 Fiber Concrete Beams Design without Armature…………..…………..63
3.6.1 Flexibility…………………………………………………….. 63
3.6.2 Shear Capacity…………………………………………………64
3.6.3 Concrete Shear Capacity with Different Percentage of Fiber with
Armature……………………………………………………………. 64
3.6.4 Crack Width Calculation in FIB Regulation………………...…64
o 3.7 Fiber Concrete Beams Design in ACI544 Regulation………………….65
3.7.1 Bending Analysis of the Beam Containing Fibers and Reins….65
3.7.2 Bending Strength of Fiber Concrete Beams in the First Crack…65
3.7.3 Final Bending Resistance of Fiber Concrete Beams…………...66
3.7.4 Fiber Concrete Slabs Design in FIB regulation………………..66
3.7.5 ultimate Bending Strength of Fiber Concrete Slab…………….66
o 3.8 Conclusion……………………………………………………………..67
Chapter 4…………………………………………………………………………..68
o 4.1 Introduction……………… …………………………………………….69
o 4.2 Concrete Behavior Model………………………………………………70
4.2.1 ABAQUS Damaged Plasticity Model………………………….70
o 4.3 Strength Hypothesis and Its Parameters………………………………...71
o 4.4 Stress-Strain Curve for Uniaxial Compression…………………………74
4.4.1 Plotting Stress-Strain Curve without Detailed Laboratory Test
Results……………………………………………………………….75
o 4.5 Stress-Strain Curve for Uniaxial Tension……………………………….78
o 4.6 Development of Numerical Model of Finite Element for Analysis of Fiber
Concrete…………………………………………………………………… 79
4.6.1 Limited Component Model of Laboratory Work………………81
4.6.2 Concrete Behavior Model……………………………………...82
4.6.3 Steel Behavior Model………………………………………….83
4.6.4 Mesh Dependency…………………………………………….. 83
4.6.5 Meshing………………………………………………………..84
o 4.7 Examining and Analyzing Test Results and Comparison of Laboratory
Results with Numerical Modeling result……………………………………86
4.7.1 Slab Failure Mode.……………………………………………..86
4.7.2 Steel Fiber Stress-Strain Graph in Fiber Concrete Slab………..87

7
4.7.3 Comparison of Laboratory Results with Numerical Modeling
Results……………………………………………………………….88
o 4.8 Conclusion……………………………………………………………...89
Chapter 5…………………………………………………………………………..90
o 5.1 Introduction……………………………………………………………. 91
o 5.2 Appropriate Length of Slab Line Model Investigation………………….92
5.2.1 Slab Line Modeling Different Lengths………………………... 92
5.2.2 Fiber Concrete Slab Line Modeling in ABAQUS……………...92
5.2.3 Results Comparison of Slab Lines Numerical Modeling in
Concrete with and without Fiber in ABAQUS……………………….94
o 5.3 Conclusion……………………………………………...………………97
o 5.4 Rail Slab Line Analysis and Obtaining Flexural and Shear Forces…….97
5.4.1 Characteristics of the Denoted Slab Line and Introduction of
Applied Loads……………………………………………………….97
5.4.2 Impact Coefficient……………………………………………. 98
5.4.3 Load Combine… ………………………………………………99
5.4.4 instruments Specification and Pavements Materials………….100
5.4.5 Modeling……………………………………………………. .101
5.4.6 Analysis of Results and Determine Shear and Bending Forces on
Slab Line…………………………………………………………... 102
o 5.5 Result Representation and Designed Graph in Order to Utilization of Slab
Lines ... ……………………………………………………………………104
5.5.1 Investigation of Using Fiber Concrete without Armature in
Railway Slab Line………………………… ……………………….104
5.5.2 Example of Flexural Design of Fiber Concrete Slab with
Armature…………………………………………………………... 104
5.5.3 Shear Design of Fiber Concrete Slab in Combination with
Armature…………………………………………………………... 106
o 5.6 Technical and Economic Comparison of Armature’s Weight and the
Weight of Armature and Fiber Combination………………………………107
Chapter 6…………………………………………………………………………108
o 6.1 Introduction…………………………………………………………... 109
o 6.2 Conclusions………………………………………………………....... 109
o 6.3 Advantages and Disadvantages………………………………………..111
8
6.3.1 How Save Time and Money…………………………………..111
6.3.2 Technical and User Benefits………………………………….112
6.3.3 Advantages ...………………………………………………...112
6.3.4 Disadvantages... ……………………………………………...112
o 6.4 Proposal. ..…………………………………………………………….113
6.4.1 Numerical Study……………………………………………...113
6.4.2 Laboratory and Executive Study……………………………...113
References…… ………………………………………………………………….114
9
Abbreviations
FRC………………………………………………...……Fiber Reinforced Concrete
SFRC……………………………………………....Steel Fiber Reinforced Concrete
FEM…………………………………………………….. …..Finite Element Method
EPS……………………………………………………...…..Expanded Poly-Styrene
FEA…………………………………………... ……………Finite Element Analysis
SAP……………………………………………….System Application and Products
MOR……………………………...…………….Mathematic of Operation Research
SF…………………………………...……………………………... …….Steel Fiber
SIFCON………………………………………..….Slurry Infiltrated Fiber Concrete
SIMCON…………………………………….. ….…Slurry Infiltrated Mat Concrete
RC…………………………...…………………………………Reinforced Concrete
FRP………………………………………………...……..Fiber Reinforced Polymer
TRIS………………………….. ….…Transportation Research Information Service
ASTM………………………………….American Society for Testing and Materials
EFNARC……..European Federation of National Associations Representing for
Concrete
FDOT……………………………….. ..…….Florida Department of Transportation
ACI…… ………………………………………….……American Concrete Institute
LSD…………………………………………………..…………..Limit State Design
LRFD……………………………………..……Load and Resistance Factor Design
FIB……………………………………………………………..…Focused ion Beam
RILEM……..Regulation of International Union of Laboratories and Experts in
Construction Materials
CMOD………………………………………………………..Crack Mouth Opening
CEP……………………………………………Committee on Environmental Policy
10
CDP……………………………..…………………….Concrete Damaged Plasticity
CEB………………………………………...…..Comte Euro-International du Beton
SAP……………………………………………….System Application and Products
LM………………………………………………..…….Live Traffic Load Modeling
AREMA…………….….American Railway Engineering and Maintenance of Way
Association
UIC………………………………………………….International Union of Railway

11

12
Chapter 1
Introduction

13
1.1. Introduction
In the last 40 years, increase in train speed and axle load around the world and other
challenges in the conventional ballasted track system gave birth to ballastless
railway track system (7).
The purposes of using this materials are, increase of freightage and crack control in
the slab of the subway and railroad line. Some practical and experimental works are
done regarding the performance of the steel fiber in the pavement, but the specific
numerical works that can indicate the influence of fiber on mechanical behavior of
slab are not done (1).
Using Non-Ballast railway especially in tunnels and bridges, due to the altitude drop
of the railroad line, reduce maintenance and total cost, facilitate higher train speed
and increase of lateral resistance are widely increased. A comparison between
ballasted and ballastless tracks is essential in order to clearly identify when and
where the slab track systems perform better. A simple numerical model is developed
to make a comparison between ballasted and ballastless tracks. In many cases slab
track systems seem to have the capabilities to serve these high speed routes more
efficiently than the ballasted tracks mainly due to their higher structural stability,
significantly lower need of maintenance, and longer life cycle. The ballastless
systems are divided in two main categories: the discrete rail support and the
continuous rail support. These two categories are divided in subcategories, which
contain 34 slab track designs that have been used worldwide (7).
One of the issue that can considered, as a disadvantage of this type of pavement, is
armature. Discussion in terms of exploitation are cracks caused by passing load and
the environment situation. One of the ways to prevent these problems is the
utilization of steel fiber in construction of slab lines. In 1970, the use of steel fiber
in concrete as regenerator developed for many reasons such as significantly
increased flexibility, increasing energy attraction and mechanical properties and
disabilities like compressive strength, tensile, bending, incision, impact and
resistance against freezing and warming, creep, cavitation and corrosion. Especially
steel fiber-reinforced concrete under dynamic load (especially impact) or abrasive
load, are effective in pavements and stanchions. Other features of this concrete are
work comfortably and high molding speed of fibers (1, 7).
14
Most developed and many developing countries in the world have high speed lines
(~300 km/h) and they are preparing to update their existing lines as well as to create
new high speed railway routes (7).
Fiber-reinforced concrete is by adding fibers to the mix. The purpose of the addition
of fiber is to increase the tensile strength of concrete, so the concrete can withstand
tensile strength due to weather, climate and temperature changes that usually occur
in the concrete with a large surface. Types of fiber that used in fiber-reinforced
concrete, can be of natural fibers or artificial fibers (8).
Use of continuous reinforcement in concrete (reinforced concrete) increases strength
and ductility but requires careful placement and labor skill. The modern
development of fiber reinforced concrete (FRC) started in the early sixties. Fibers
are produced from different materials in various shapes and sizes. Using fibers in
concrete is to improve the characteristics of construction materials (9).
1.2. Research Necessity
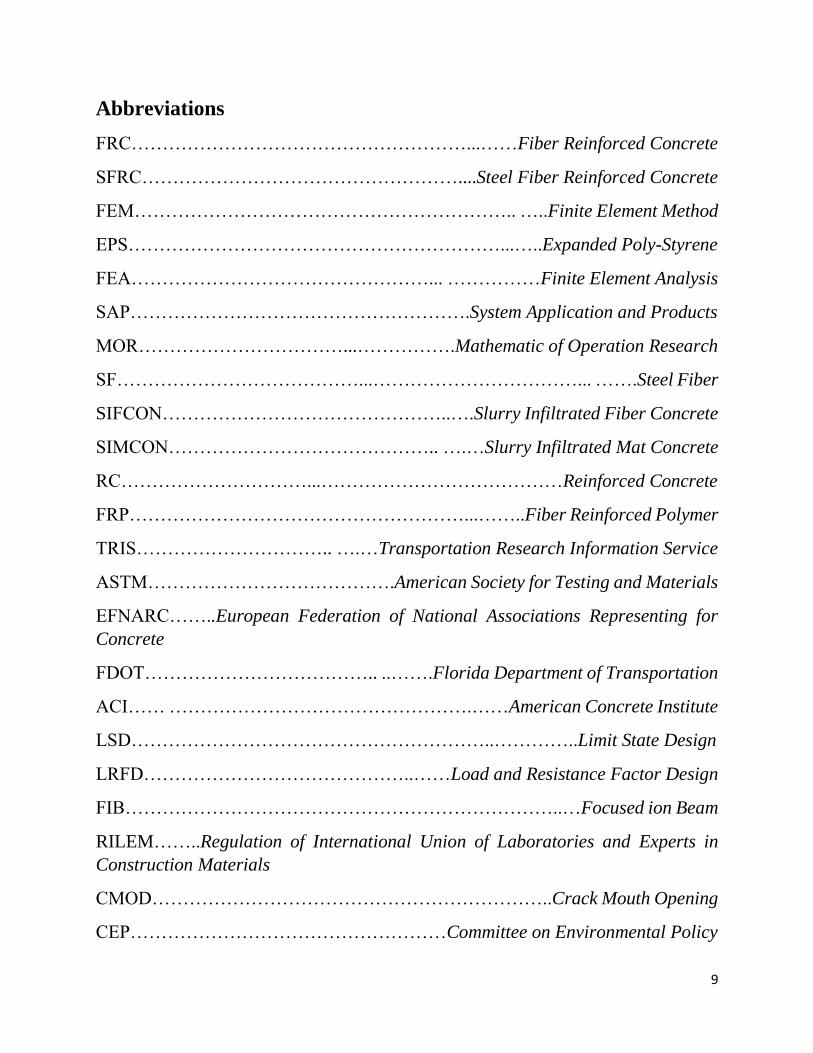
In this part, we discuss about damages due to crack of the concrete in the structure
of non-ballast lines. Slab Track is a kind of precast concrete structure. Principle of
the design of slab track, is no crack design, but some cracks can be found in the slab
track due to load action, environmental factor (such as temperature) and creep of
concrete. Cracks can appear in the inner side of the slab-track frame and some cracks
run through the total depth of it. Some cracks generate form lifting and some
generate from steam curing system of slab-track or its structure. Cracks can be
finally found in the middle of the slab track and the width of the crack reaches the
total width of track (10).
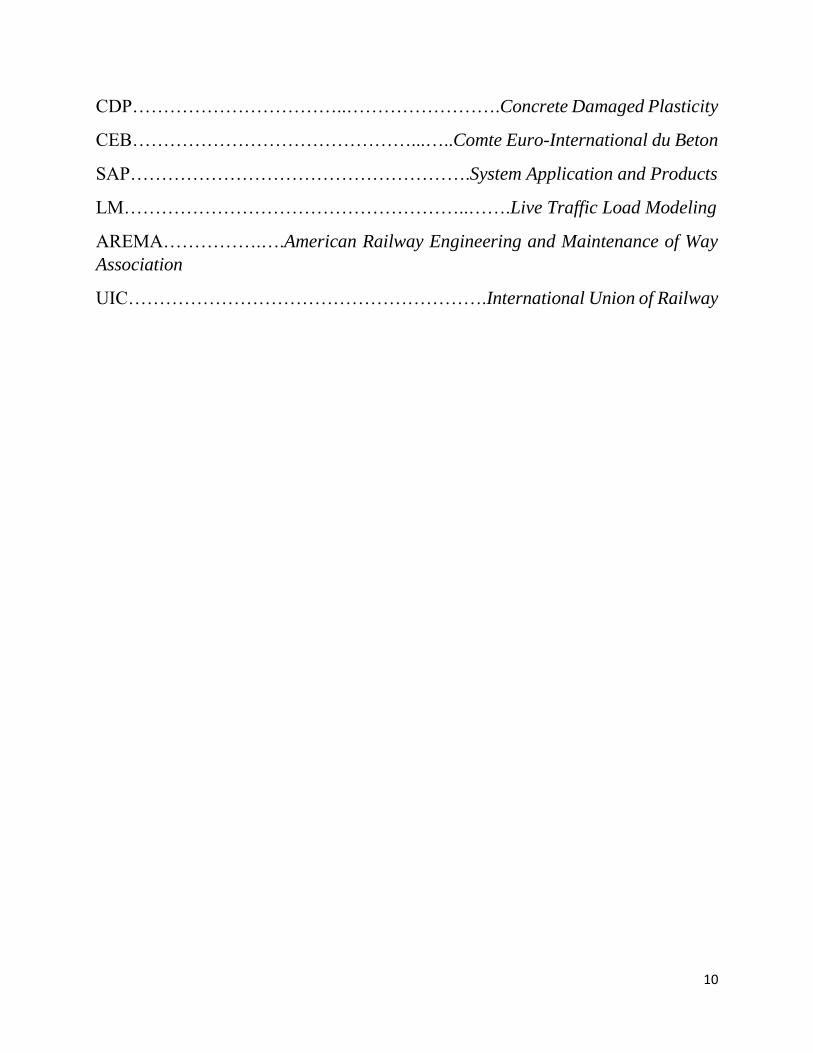
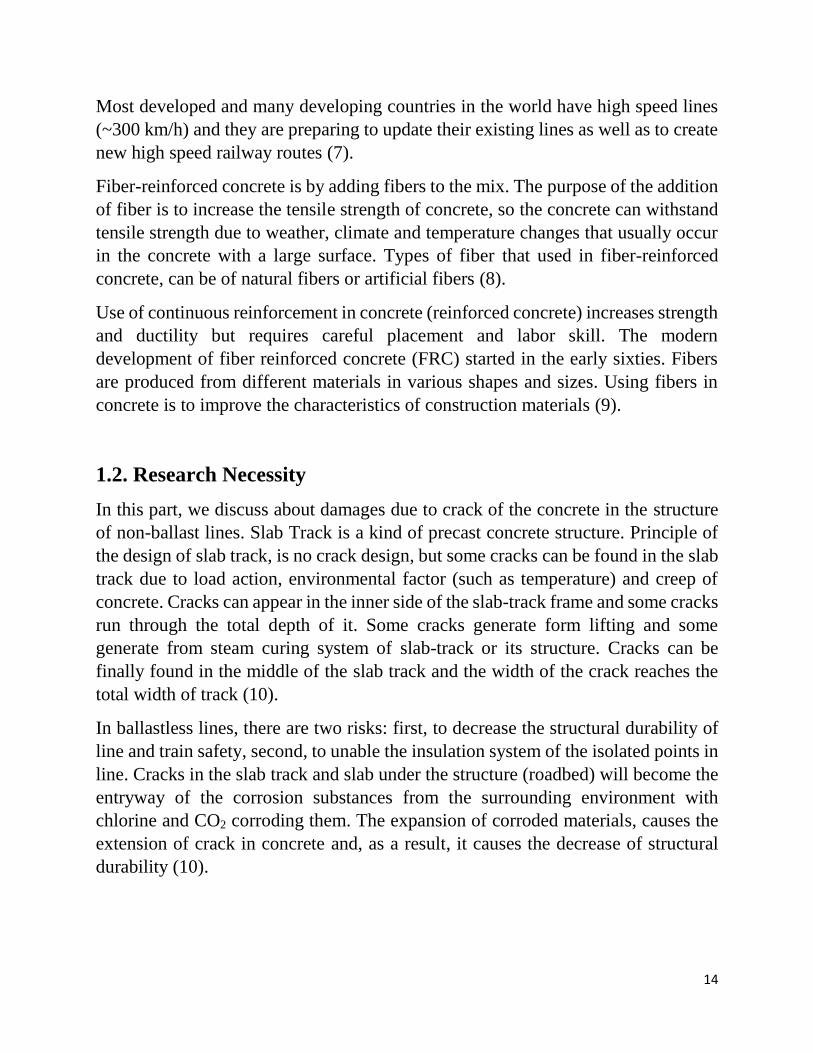
In ballastless lines, there are two risks: first, to decrease the structural durability of
line and train safety, second, to unable the insulation system of the isolated points in
line. Cracks in the slab track and slab under the structure (roadbed) will become the
entryway of the corrosion substances from the surrounding environment with
chlorine and CO2 corroding them. The expansion of corroded materials, causes the
extension of crack in concrete and, as a result, it causes the decrease of structural
durability (10).
15
Fig. 1.1. Crack in track slab
Fig. 1.2. Crack in the base concrete
Fig. 1.3. Crack in roadbed slap

16
Barros and Figueiras searched regarding to mechanical behavior of reinforced slab
line with 40 kg steel fiber per square meter (11). They had done their
experimentation according to Teutsch. They found satisfactory agreement between
the load–deflection curves obtained from experiment and those from finite element
analysis. And also they predicted the cracking behavior of slab and checked the
effect of substrate hardness on them (12).
A number of parametric studies regard mechanical properties of slab lines on
ballastless bed. The results show that substrate module contains all parameters
including internal forces, tensions and deformations. Moreover, it is indicated that
the rail properties, for example moment of inertia, do not have effect on these
parameters but it causes the homogenous load distribution on slab lines and several
researches regard the effect of fibers on mechanical properties of the slap (11).
Influence of length and volumetric percentage of steel fibers on energy absorption
of concrete slabs with various concrete strengths is investigated by Khaloo, testing
28 small steel fiber reinforced concrete (SFRC) slabs under flexure. The variables
include fiber length, volumetric percentage of fibers and concrete strength. Test
results indicate that generally longer fibers and higher fiber content provide higher
energy absorption, but the size and the amount of fiber do not have significant impact
on slab’s final bending capacity (13).
In the research by Madhkhan, to investigate the spanning behavior of slab tracks, a
FEM analysis was representing discrete and continuous systems for cracking
behavior. At first, full-size slabs without foundation including solid and hollow-core,
specimens (with 30% weight reduction) were under test, by extracting centric static
(monotonic) line loads and load-deflection curves. Then, FEM results for zero
foundation stiffness were verified with those of experiments, which were in good
agreement. The obtained load from FEM analysis, for slab line reinforced with steel
fiber, compared to the results by Barros and Figueiras, was satisfactory and their
results confirmed by experimental models. Final, the real behavior of slab lines on
elastic substrate, before and after cracking, is investigated by FEM model with
monotonic loads (12).
The use of Expanded Poly-Styrene (EPS) under slab tracks in high-speed railways
was proposed by the same researcher, in order to reduce the dead weight of the
system and, finally, to minimize the cost of stabilizing the foundation soil.
One of the property of this project, compared with previous research, is that, without
modeling the steel fiber and their embedment in the concrete, the estimation by
17
applying dynamic loads of the resistance characteristics of fiber. They are due to rail
fleet movement and the effect of this kind of load with different speed on the slab,
previously investigated only with static loads.
1.3. Investigation Issue Form
According to this issue, we can realize that it is necessary to check, technically and
economically, the amount of fiber to use in slab lines. For technical feasibility it is
used a numerical analysis of finite components with considering the random
distribution of fiber and its deformation loading behavior. Therefore, it is possible
to consider the following elements as the project purposes:
Effect of fiber on flexural and shear capacity on slab lines with service loads;
Feasibility of using fibers alone in slap line;
Combination of fibers and armature in case of their simultaneous use;
Economic analysis of use of armature, fibers and their combination;
Analysis of lateral resistance against load while using steel fiber;
Effect of steel fiber concrete on more generally trains performance (speed,
acceleration, loads, etc.);
Effects on maintenance activity and costs.
1.4. Performance Method
At first, concrete with fiber should model with specific property of ABAQUS
software. Then consider one of the project done by a researcher as a model. After
that, according to the results from this model, in comparison with laboratory results,
it can arrive to the validation of the model of slab railways, set on the elastic bed and
the tolerance of transit load.
Then, it investigates the effect of steel fiber increasing loading behavior of
displacement, shear, and bending forces. According to the results, effects of fibers
on shear and bending forces, the slap line analysis processes with speeds and reaction
coefficient of the bed and various axial loads by SAP2000 software to compare with
available regulations.
The investigation are oriented to the design process of fibered concrete and the
possibility of using fiber alone or the combination with armature.

18
Chapter 2
Review of Technical Literature on Fiber
Concrete and Their Utilization in Slabs
19
2.1. Introduction
Use of fiber in some countries dates back to several thousand years ago. In the past,
they used to use short pieces of dried herbs with water and soil as a mixture of clay,
to build wall and brick. The fibers are in use for crack control in effect of volumetric
changes due to contraction, expansion, thermal stresses, increase of tensile strength,
softness, energy absorption capability and provide an integrated system (1, 12).
Currently, hundreds types of fibers as herbal, artificial and metal are producing that
only some of them are suitable to use in concrete. This chapter gives a brief overview
of the types of fibers and a special mention of steel fibers, concrete fibers and their
applications.
2.2. History of fibers’ utilization
Many years ago, people used different fibers as a building material booster. They
used straw to reinforce clay and brick and from horse’s hair to reinforce the plaster,
and from nineteenth century, they used asbestos to reinforce cement materials.
Nowadays, use of steel, polymeric and glassy fibers, etc. seem a suitable alternative
for asbestos, since its utilization was out. In 1936, the investigated projects in USA
indicate that the tension concentration in crack points decrease, while using steel
fiber in the brittle mix. In 1960s, the extensive research confirmed that fibers could
compensate the concrete weaknesses points. Usage statistics of steel fiber in concrete
indicates in some industrial countries that just over past ten years, over several
million square meter of roads pavement, airports, indoor industrial floors, bridges
deck, hydraulic structure, etc. performed with reinforced steel fiber (14, 15).
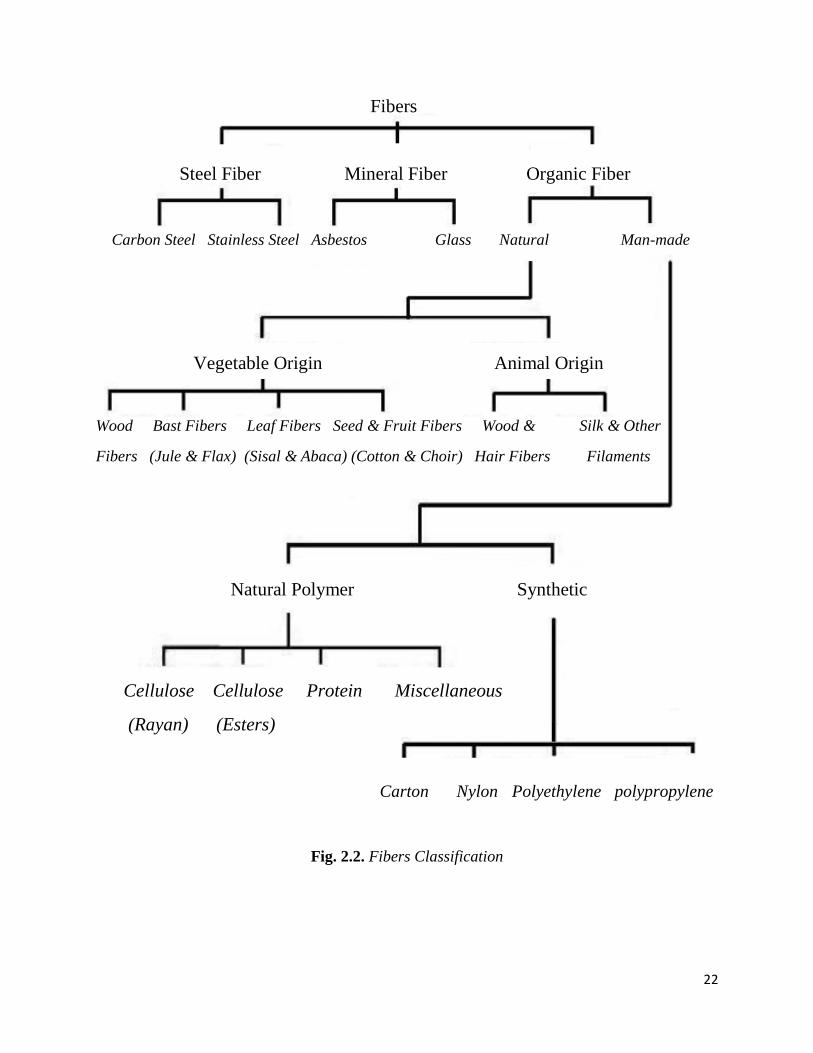
2.3. Different Types of Fiber
There are two methods to categorize fibers according their modulus of elasticity or
their origin. In point of elasticity view, the fibers are of two basic categories of fibers
that have:
Higher elastic modulus than concrete mix (hard intrusion) and the second;
Lower elastic modulus than concrete mix (soft intrusion).
Steel, carbon and glass have higher elastic modulus than cement mortar matrix and
polypropylene and vegetable fibers are low elastic modulus fibers. High elastic
20
modulus fibers simultaneously can improve both flexural and impact resistance,
whereas, low elastic modulus fibers can improve the resistance to impact of concrete
but do not contribute much to its flexural strength. According to the origin of fibers,
they are classified in three categories of Metallic fibers (such as steel, carbon steel
and stainless steel), Mineral fibers (such as asbestos and glass fibers) and Organic
fibers (3).
2.3.1. Organic Fibers
Organic fibers can be natural and manufactured. Natural fibers can be vegetable
origin or sisal (such as wood fibers and leaf fibers) and animal origin (such as hair
fibers and silk). Man-made fibers can also be divided into two groups as natural
polymer (such as cellulose and protein fibers) and synthetic (such as nylon and
polypropylene) (3).
The ability of the concrete improvement in these fibers depends on their length,
appearance and tensile strength. However, their tensile strengths are lower than other
fibers, usually cause failure in concrete structure and do not have volumetric stability
against humidity.
2.3.2. Mineral Fibers
The mineral fibers were available after the establishment of the petrochemical
industry. Some of these fibers are in different industries, like production of textiles
and use to resist some parts of car and airplane industry. In addition, they used to
refine the material of the paper. Other petrochemical products are chlorine and
polypropylene that countries like Canada, Japan and USA use (3). Use of glass fiber
in Japan is too practical. Glass brittleness gives specific and precise method for
making and mixing concrete.
2.3.3. Steel Fibers
In 1963, the first scientific research on fiber reinforced concrete (FRC) was by
Romualdi and Baston in the United States. SFRC is using the conventional hydraulic
cements, fine and coarse aggregates, water, and SFs. Steel fiber is more practical
than others are. The reasons for this issues are as follow (3):
Steel fiber creates the highest increasing in resistance and plasticity;
They are producible to different appearance for improve concrete behavior;
It is easy to do to mixture of them with other concrete materials.

21
The behavior of SFRC can be different according to its application, fiber volume
percentage and fiber effectiveness (Figure 2.1, 2.2 and Table 2.1). For instance
SFRC is classified based on its fiber volume percentage as follows (3):
Very low volume fraction of SF (less than 1% per volume of concrete), which
has been used for many years to control plastic shrinkage and as pavement
reinforcement;
Moderate volume fraction of SFs (1.5% per volume of concrete), which can
improve Modulus Of Rupture (MOR), flexural toughness, impact resistance
and other desirable mechanical properties of concrete;
High volume fraction of SFs (more than 2% per volume of concrete) used to
special applications such as impact and blast resistance structure; these
include Slurry Infiltrated Fiber Concrete (SIFCON) and Slurry Infiltrated
Mat Concrete (SIMCON).
They have different shapes (smooth, rippling, bent and rounded, oval, rectangle,
crescent, and so on) that depend on production and raw materials.
a. Straight slit sheet or wire b. Deformed slit sheet or fire
c. Crimped-end wire d. Flattened-end slit sheet or wire e. Machined chip f. Irregular fiber
Fig. 2.1. Different shapes of steel fibers
22
Fibers
Steel Fiber Mineral Fiber Organic Fiber
Carbon Steel Stainless Steel Asbestos Glass Natural Man-made
Vegetable Origin Animal Origin
Wood Bast Fibers Leaf Fibers Seed & Fruit Fibers Wood & Silk & Other
Fibers (Jule & Flax) (Sisal & Abaca) (Cotton & Choir) Hair Fibers Filaments
Natural Polymer Synthetic
Cellulose Cellulose Protein Miscellaneous
(Rayan) (Esters)
Carton Nylon Polyethylene polypropylene
Fig. 2.2. Fibers Classification

23
Fibers Diameter
(μm)
Specific
Gravity
Modulus of
Elasticity
(GPa)
Tensile
Strength
(GPa)
Elongation
To Failure
(%)
Chrysotile
Asbestos
0.02÷20 2.55 164 3.1 2÷3
Crocidolite
Asbestos 0.1÷20 2.55 196 3.5 2÷3
E-Glass
9÷15 2.56 77 2÷3.5 2÷3.5
AR-Glass
9÷15 2.71 80 2÷2.8 2÷3
Fibrillated
Polypropylene 20÷200 0.91 5 0.5 20
Steel
5÷500 7.84 200 1÷3 3÷4
Stainless Steel
5÷500 7.84 160 2.1 3
Carbon Type I
3 1.90 380 1.8 0.5
Carbon Type
II 9 1.90 230 2.6 1.0
Aramid
(Kevlar)
10 1.45 65÷133 3.6 2.1÷4.0
Cellulose
- 1.2 10 0.4 -
Wood
- 1.5 71 0.9 -
Nylon
(Type 242)
>4 1.14 4 0.9 15
Table 2.1. General Properties of Fibers
2.3.4. Fibers Properties
Fibers Aspect Ratio
The fiber aspect ratio is a measure of the slenderness of individual fibers,
computed as fiber length divided by the equivalent fiber diameter for an
individual fiber. Fibers for FRC can have an aspect ratio varying from
approximately 40 to 1000 but typically less than 300. This parameter is also a
measure of fiber stiffness and will affect mixing and placing (16).
Equivalent Diameter
For fibers that are not circular and prismatic in cross-section, it is useful to
determine what would be the diameter of an individual fiber, if actual cross-
section is as a prismatic circular cross-section. The equivalent diameter of a
24
fiber is the diameter of the circle having the same area as that of the average
cross-sectional area of an actual fiber. Relatively small equivalent diameter
fibers have correspondingly low flexural stiffness and large equivalent
diameter fibers have greater flexural stiffness (16).
Fiber Geometry
Individual fibers are produced in an almost limitless variety of geometric
forms including (16):
Prismatic: rounded or polygon cross-section with smooth surface or
deformed throughout or only at the ends.
Irregular cross-section: variable along the length of the fiber.
Collated: multifilament or monofilament networks usually designed to
separate during FRC production (mixing).
Fiber Elasticity Coefficient
When the elasticity coefficient of fiber is high, the tension in cemented
matrixes and concrete is high. This is an important factor for compression and
identify the various fibers benefits (3). If fibers have low elasticity, they
indicate some characteristics like creep under load (9).
Fiber Matrix Integration
One of the important properties of fiber is create resistance in concrete. The
methods of fiber cohesion to matrix such as adhesion, friction and mechanical
involvement are similar to methods of steel armatures in reinforced concrete
(17).
2.4. SFRC Benefits
The beneficial influence of SFs in concrete depends on many factors such as type,
shape, length, cross section, strength, fiber content; SFs bond strength, matrix
strength, mix design and mixing of concrete. The addition of SFs in the conventional
reinforced concrete (RC) members, has several advantages such as (3):
SFs increase the tensile strength of the matrix, thereby improving the flexural
strength of the concrete;
The crack bridging mechanism of SFs and their tendency to redistribute
stresses evenly throughout the matrix contribute to the post-cracking strength
and restraining of the cracks in the concrete;
Increase ductility of the concrete;
25
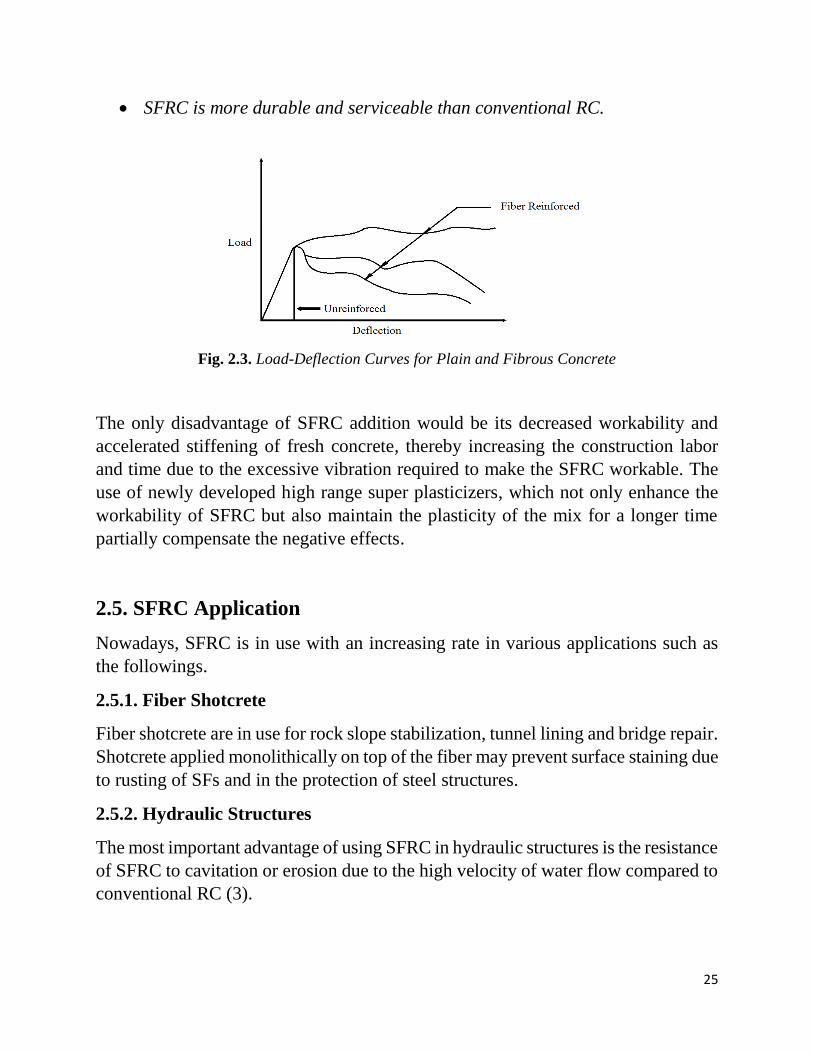
SFRC is more durable and serviceable than conventional RC.
Fig. 2.3. Load-Deflection Curves for Plain and Fibrous Concrete
The only disadvantage of SFRC addition would be its decreased workability and
accelerated stiffening of fresh concrete, thereby increasing the construction labor
and time due to the excessive vibration required to make the SFRC workable. The
use of newly developed high range super plasticizers, which not only enhance the
workability of SFRC but also maintain the plasticity of the mix for a longer time
partially compensate the negative effects.
2.5. SFRC Application
Nowadays, SFRC is in use with an increasing rate in various applications such as
the followings.
2.5.1. Fiber Shotcrete
Fiber shotcrete are in use for rock slope stabilization, tunnel lining and bridge repair.
Shotcrete applied monolithically on top of the fiber may prevent surface staining due
to rusting of SFs and in the protection of steel structures.
2.5.2. Hydraulic Structures
The most important advantage of using SFRC in hydraulic structures is the resistance
of SFRC to cavitation or erosion due to the high velocity of water flow compared to
conventional RC (3).
26
2.5.3. Highway and Airport Pavements
A traditional source of published literature on FRP composite for the highway
infrastructure is TRB’s Transportation Research Information Services (TRIS),
which is the official repository of all transportation-related research documentation
in the United States (18). SFRC can be used in the construction of new pavements
or for the repair of existing pavements by the use of bonded or un-bounded overlays
to the beneath slab. It leads to a higher flexural strength causing a decrease in the
pavement’s thickness. Besides, the resistance to impact and repeated loading will
increase. The greater tensile strain capacity of SFRC leads to a drop in the maximum
crack widths in comparison with plain concrete (3).
2.5.4. Structural Applications
Steel Fiber Reinforced Concrete has several advantages such as the following:
Provide an increased impact resistance to conventional reinforced members,
enhancing the resistance to local damage and spalling.
Inhibit crack growth and widening: this may allow the use of high strength
steel bars without excessive crack width or deformation under service loads.
SFs increase the ductility of conventional RC components and enhance their
stability and integrity under earthquake and ballast loading.
SFs increase the shear strength of RC components, as a consequence punching
shear strength of slabs will be increased and sudden punching failure can be
transformed into a gradual ductile failure (19).
2.6. Mechanical Properties of Steel Fiber
The crack-arrest and crack-control mechanism of SFs has three major effects on the
behavior of SFRC structures (20):
The addition of SFs delays the onset of flexural cracking: the tensile strain at
the first crack increases until 100% and the ultimate strain may be 20÷50 times
larger than for plain concrete.
The addition of SFs imparts a well-defined post-cracking behavior to the
structure.
The crack-arrest property and the consequence increase in ductility imparts a
greater energy absorption capacity (higher toughness) to the structure prior to
failure.
27
This section presents basic information on the mechanical properties of steel fiber-
reinforced, high-strength, lightweight concrete with compressive and flexural
strengths up to 85.4 𝑀𝑃𝑎 and 11.8 𝑀𝑃𝑎 respectively. Test results show that the
effect of fiber volume fraction (𝑉𝑓) and aspect ratio (𝑙𝑓 𝑑𝑓⁄ ) on flexural strength and
fracture toughness is extremely prominent. Compressive strength is only slightly
improved but the increase of tensile compressive strength ratio is relevant. It is
observed that the flexural deflection corresponding to ultimate load increases with
the increase of (𝑉𝑓) and (𝑙𝑓 𝑑𝑓⁄ ) and, due to fiber arresting cracking, the shape of the
descending branch of load-deflection tends towards gently (21).
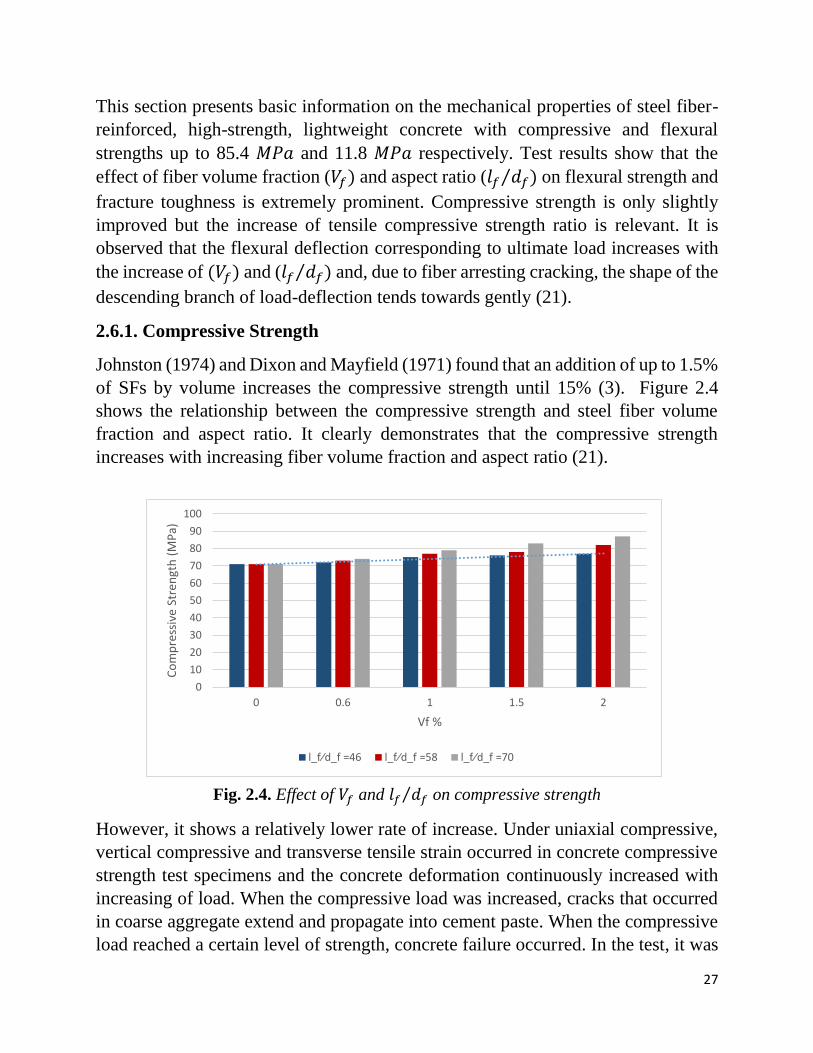
2.6.1. Compressive Strength
Johnston (1974) and Dixon and Mayfield (1971) found that an addition of up to 1.5%
of SFs by volume increases the compressive strength until 15% (3). Figure 2.4
shows the relationship between the compressive strength and steel fiber volume
fraction and aspect ratio. It clearly demonstrates that the compressive strength
increases with increasing fiber volume fraction and aspect ratio (21).
Fig. 2.4. Effect of 𝑉𝑓 and 𝑙𝑓 𝑑𝑓⁄ on compressive strength
However, it shows a relatively lower rate of increase. Under uniaxial compressive,
vertical compressive and transverse tensile strain occurred in concrete compressive
strength test specimens and the concrete deformation continuously increased with
increasing of load. When the compressive load was increased, cracks that occurred
in coarse aggregate extend and propagate into cement paste. When the compressive
load reached a certain level of strength, concrete failure occurred. In the test, it was
0
10
20
30
40
50
60
70
80
90
100
0 0.6 1 1.5 2
Co
mp
ress
ive
Stre
ngt
h (
MP
a)
Vf %
l_f⁄d_f =46 l_f⁄d_f =58 l_f⁄d_f =70
28
evident that the dispersion of fiber became very difficult, when the fiber volume
fraction increased to 2.5%. For this reason, the concrete was not fully compacted.
Concrete compressive strength increased with increasing aspect ratio of the fiber.
Compressive strength does not benefit very much from a further improvement in
matrix strength (21). The improvement of compressive strength of high strength,
lightweight concrete with the addition of steel fiber was little. Meanwhile, the
tensile/compressive strength ratio was obviously bigger. These were attributed to the
effect of the steel fiber arresting cracking (21).
2.6.2. Shear Strength
SFs substantially increases the shear strength of concrete. The ultimate shear
strength of SFRC containing 1% by volume of SFs increases up to 170% compared
to RC without SFs. The addition of SFs completely replaces the traditional
transverse shear. Rather than using a single type of SF, a combination of SFs with
various aspect ratios is more effective in improving the mechanical performance of
SFRC (3, 22).
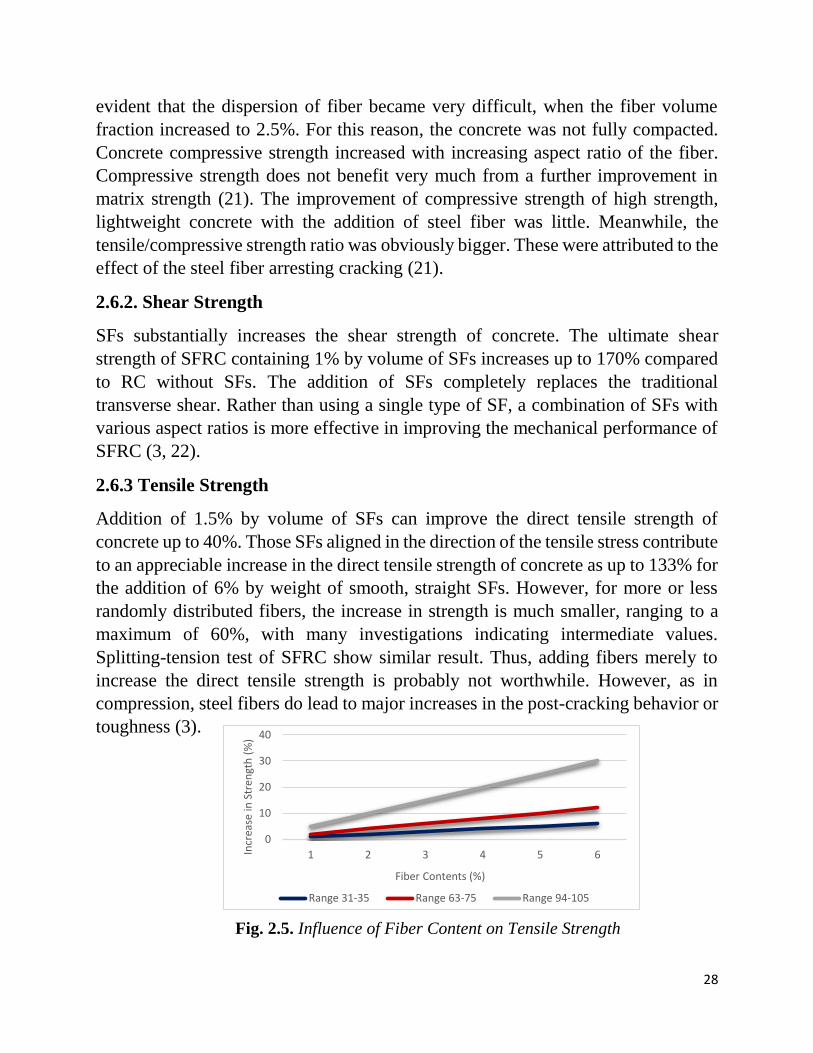
2.6.3 Tensile Strength
Addition of 1.5% by volume of SFs can improve the direct tensile strength of
concrete up to 40%. Those SFs aligned in the direction of the tensile stress contribute
to an appreciable increase in the direct tensile strength of concrete as up to 133% for
the addition of 6% by weight of smooth, straight SFs. However, for more or less
randomly distributed fibers, the increase in strength is much smaller, ranging to a
maximum of 60%, with many investigations indicating intermediate values.
Splitting-tension test of SFRC show similar result. Thus, adding fibers merely to
increase the direct tensile strength is probably not worthwhile. However, as in
compression, steel fibers do lead to major increases in the post-cracking behavior or
toughness (3).
Fig. 2.5. Influence of Fiber Content on Tensile Strength
0
10
20
30
40
1 2 3 4 5 6Incr
ease
in S
tren
gth
(%
)
Fiber Contents (%)
Range 31-35 Range 63-75 Range 94-105
29
2.6.4. Durability
Corrosion in concrete structures due to the cracks is less severe in the SFRC
structures compared to conventional RC ones. In 1985 Schupack found that a well-
compacted SFRC has a limited corrosion of fibers close to the surface of the concrete
even when concrete is highly saturated with chloride ions. In 2005 Turatsinze,
conducted a research to investigate the corrosion of SFRC due to the cracks (3).
Steel fiber increases durability in concrete by reduction in the cement paste content.
Durability and other charachteristics of concrete depend upon the properties of its
ingredients, the mix properties, the method of compaction and other controls during
placing, compaction and curing. Adding fibers in concrete, increase its durability
againts chemical attacks (23).
Prismatic SFRC specimens with the dimensions of 100x100x500 mm containing
hook-end SFs with the dimensions of 60 mm in length and 0.8 mm in diameter were
prepared. Specimens with vertical cracks were exposed to a marine-like environment
for 1 year. After 1 year, the prisms were tested in three-point bending setup with the
span of 200 mm and load-deflection graphs were plotted and concluded that only
SFs crossing the crack within a 2 to 3 mm rim from the external faces of the
specimens exhibited extensive corrosion (3). Besides, no SFs corrosion was
observed in narrower parts of the cracks (i.e. where crack mouth opening was about
0.1 mm) whilst in the wider parts of the cracks (i.e. where crack mouth opening was
equal to 0.5 mm) a light corrosion of the fibers with no reduction in their section was
observed. The measurement of concrete electrical resistivity can give an indication
of concrete durability.
Figure 2.6. shows the relationship between the concrete electrical resistivity and
curing ages and indicates the reduction of concrete electrical resistivity with the
increase in the percentage of SFs due to the conductivity of the fibers. However, the
gel formation due to the cement hydration and pozzolanic reaction causing a dense
microstructure and fills the conductive channel, thereby it decreases the effect of SFs
conductivity. In the long run, with the addition of 1% of SFs, the desired concrete
electrical resistivity of over 20 kΩ x cm can be reached.

30
Fig. 2.6. Effects of Fibre Content on Concrete Electrical Resistivity
2.7. Method of fiber perch
The method of fiber perch in the crack axis is effective in the power transmission to
the crack level. The fibers that are parallel to the crack, do not help the power
transmission. But, the fibers indicate the maximum impact from themselves while
they are perpendicular to the crack. The amount of matrix reinforcement by fibers
depend on the number of distributed cross-section directions:
Parallel to the tensions;
Randomly in two dimensions;
Randomly in three dimensions.
Usually in massive concreting, the fibers are in three-dimensional form and the
increase in resistance can happen in all directions. For example in roads and airports
pavements, it is necessary to distribute fibers in two dimenions parallel to horizontal
or strain tension axis. Finally, the fibers in one dimension, are not effective.
2.8. Important factors in design and selection of fibers
The important factors in the design of fibers are as follow:
0
5
10
15
20
25
30
35
40
1 5 1 0 5 0 8 0 1 0 0
CO
NC
RET
E EL
ECTE
RIC
AL
RES
ISTI
VIT
Y (K
ΩC
M)
AGE (DAYS)
C2 with 0.0% steel fiber C3 with 0.5%steel fiber
C4 with 1.0% steel fiber

31
Tensile strength;
Elasticity coefficient of fibers;
Separating problems in matrix-fiber;
Length of fibers;
Possibility of transformation in concrete;
Thikness of fibers surface, enlarging or bending their ends;
Possibility to use multi-string fibers for better adhesion.
The ultimate fiber reinforced concrete depends on (2-1) equation:
𝑆𝑐 = 𝐴𝑆𝑚(1 − 𝑉𝑓) + 𝐵𝑉𝑓(𝐿𝑑⁄ ) (2-1)
Where:
𝑆𝑐 = Final strength of the cement paste;
𝑉𝑓 = Fiber volumetric ratio;
A = Constant Number;
B = Coefficient depending on the consistency resistance and shape of fibers.
2.8.1 Steel Fiber Making Method
One of the main advantage of using steel fibers in concrete is to increase the post-
peak load carrying capacity of concrete after initial cracking. Types of steel fibers
used in concrete are (24):
Smooth cold-drawn wire;
Deformed cold-drawn wire;
Smooth or deformed cut sheet;
Melt-extracted fibers;
Mill-cut or modified cold-drawn wire.
The most important steel fiber production countries around the world are Belgium,
Italy, Germany and USA. The tensile strengths of steel fibers are in the range of
345÷2100 MPa and the ultimate elongations of 0.5÷35%. The main disadvantage of
high strength fibers is that it causes severe spalling around the fiber ends. Straight
and smooth fibers have poor bond with the matrix. Thus the surfaces of fibers were

32
modified in the recent years to increase it. These include hooked, crimped, deformed
and enlarged end fibers (24).
Fig. 2.7. Hooked end fibers Fig. 2.8. Crimped steel fibers
Round fibers are produced by cutting or chopping wires, with diameters typically in
the range of 0.25÷1 mm and flat fibers are produced by shearing sheets or flattening
wire. The dimensions of flat fibers are in the range of 0.15÷0.4 mm thick and
0.25÷0.9 mm wide. Fibers are also produced by the hot melt extraction process (24).
2.9. Polypropylene FRC in Compression
According to Balaguru (1988), the uniaxial compression test is normally used to
evaluate the behavior of concrete in compression. This produces a combination of
shear failure near the ends of the specimen with lateral swelling of the unconfined
central section accompanied by cracking parallel to the loading axis when the lateral
strain exceeds the matrix cracking strain in tension. Fibers can affect these facets of
uniaxial compressive behavior that involve shear stress and tensile strain. This can
be seen from the increased strain capacity and toughness (area under the curve) in
the post-crack portion of the stress-strain curve (24).
The addition of fibers up to a volume fraction of 0.1% does not affect the
compressive strength. When tested under compression, failure occurs at or
immediately after the peak load providing very little toughness. In some instances,
if more water is added to fiber concrete to improve its workability, a reduction in

33
compressive strength can occur. This reduction should be attributed to additional
water or an increase in entrapped air (24).
2.9.1. Literature on ASTM C1550
The need for a reliable and economical estimation for the post-crack performance of
fiber-reinforced concrete material has led to the development of a determinate panel
test. Post-crack performance in fiber reinforced concrete was assessed using beams.
In the past years, ASTM C1018 beam test was used to assess the post crack
performance. In Australia, a similar beam test method called EFNARC was used for
the measurement of post crack performance. EFNARC beam test is a third-point
loaded test used for the assessment of Fiber Reinforced Shotcrete (FRS)
performance. The EFNARC specification does not clearly mention how to test the
beam in order to obtain central deflections excluding the extraneous deformation.
But these methods often caused problems for designers and contractors as the results
obtained from the beam tests had high with-in batch variability (25).
The area of the concrete beam that experiences failure is very small compared to the
volume of the concrete contained within an FRS structure. The performance of the
beam is not representative of the majority of concrete, because the performance is
strongly dependent on the number of fibers involved in the crack (25).
2.10. Concrete with high stifness
The concrete with higher stifness can tolerate many deformation without fail. The
purposes of utilization of fibers in concrete increases tensile strength, cracks control,
etc. In the fabrication of tunnels, the fiber concrete is used by spraying on the tunnel
wall without armature to remove the crack in tuneel coverage.
In a new kind of fiber concrete can be reached high fineness with pouring slurries
on the fibers. In this way the fibers are first shed then the spaces among them are
filled with slurry mortar. The amount of fiber in this concrete is about 10%, which
is about ten times the amount in conventional fiber concretes (26). This type of
material can create protective layers without crack. The compressive strength of this
type of concrete is 85÷110 Pascal and the bending strength is 35÷45 N/m. These
components can be used not only as small protective layers but also in the runways
of airports, where it shows good performance against blows (26).
In order to improve the concrete technology standards, the fibers can be made with
conventional reinforced or prestressed concrete. These are as follows:
Foundations of engines and large industrial machinery;
34
Protective walls;
Shelters and aircraft hangars;
Atomic reactor building;
Refractory parts with steel fibers.
2.11. Effects of SFRC for Concrete Pavement Slab Replacement in
Transport
2.11.1. Concrete pavement slab replacement standards
The Florida Department of Transportation (FDOT) Design Standards, require a full
depth replacement of concrete slab with severe distresses. The construction
standards and requirements of the replacement slab are provided in Section 353 of
the Standard Specifications for Road and Bridge Constructions. Two of the most
important acceptance criteria for the replacement slab are the plastic property,
specifically the 6-hour compressive strength of 2,200 psi, and the 24-hour
compressive strength of 3,000 psi. The 6-hour compressive strength is also used as
the determination point to open the slab to traffic and, therefore, it is highly
emphasized in the standard specifications. In fact, if the replacement slab does not
meet the plastic property requirements and this will severely impact the replacement
slab service life, the contractor would have to replace the slab at no cost to the FDOT.
Thus, to ensure the replacement slab meets the plastic property requirements, low
water/cement ratio concrete and concrete accelerators are used. As a consequence,
the FDOT also specified a limit on the concrete temperature not to exceed 100°F and
requires the contractor to cure the slab with curing compound and cover the surface
with white burlap-polyethylene curing blanket immediately after the slab hardens.
Furthermore, if uncontrolled cracks appear on the replacement slab, the contractor
will have to replace the slab free of charge (27).
2.11.2. Project objectives
The main purpose of this project is to explore the potential use of FRC for concrete
pavement slab replacement. Accordingly, this project has four objectives (27):
To develop FRC replacement slab mixtures;
To evaluate the performance of FRC mixtures particularly on early-age
cracking;
To evaluate the performance of FRC slab using demonstration slabs;
35
To develop guidelines for proportioning, mixing, placing, finishing and curing
of FRC
To replace slab.
2.11.3. Construction practices
Mixing
There are some important differences in mixing FRC compared to conventional
concrete. One of these is the effect of fiber balling that prevents good dispersion of
the fiber in concrete. There are two methods that have been effectively used in the
past to prevent fiber balling of steel fiber:
1. to add fibers to transit mix truck after all ingredients have been added and
mixed;
2. to add fiber to aggregate on a conveyor belt.
Using vibration is necessary for consolidating the concrete and, therefore, traditional
slump cone test cannot be used for quality control. Although increasing the fiber
amount could potentially improve the concrete properties (28).
Placing and finishing
According to literature, there are few differences between the methods for placing
and finishing conventional concrete and FRC. A difference for slab construction is
that vibration is needed for the FRC since the material tends to hang together.
Additionally, high-range water-reducing admixtures should be added to FRC to
increase the workability of the mixture and for easy placement (29).
Curing and protection
There is no special treatment when fibers are added to concrete. Like conventional
concrete, FRC needs appropriate protection when placing during hot and cold
weather (29).
2.11.4. Shrinkage and cracking properties
There are four main types of shrinkage cracks in concrete:
1. Autogenous;
2. Plastic;
3. Drying;
4. Carbonation.
36
Autogenous shrinkage is associated with the loss of water due to the hydration
process of concrete at early age and is considered relatively small compared to
drying shrinkage. However, for high-early strength concrete, as a result of high heat
of hydration, autogenous shrinkage contributes quite significantly and in some cases
it could be as high as drying shrinkage (30).
Plastic shrinkage occurs when the rate of evaporation exceeds the bleeding rate or,
in other words, the concrete dries too fast due to the combination of heat and wind
of the surrounding area. For typical concrete pavement, the plastic shrinkage could
be controlled by applying appropriate moist curing practices. However, for
replacement slab, traditional moist curing for 7 days could not be achieved because
the road will need to be reopened to traffic within 24 hours. Thus, both autogenous
and plastic shrinkages are a big problem for concrete pavement slab replacement that
could potentially lead the slab to crack. The other two types of shrinkage cracks are
not a potential problem for concrete pavement slab (30).
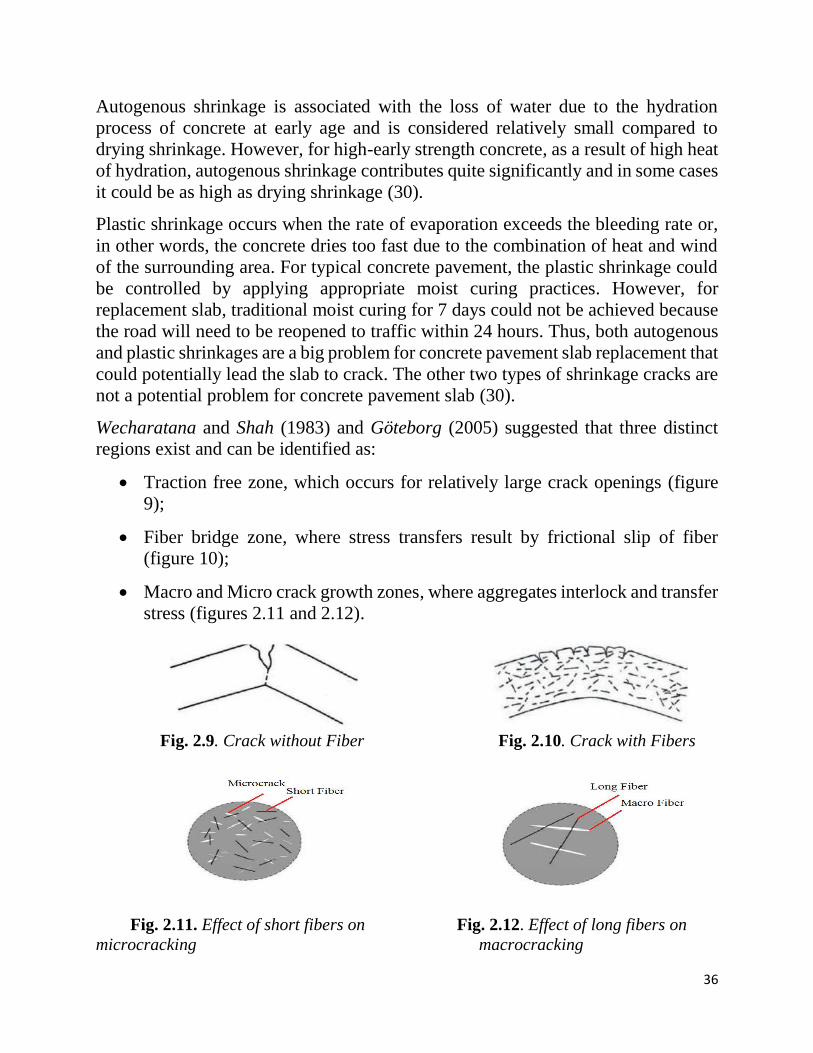
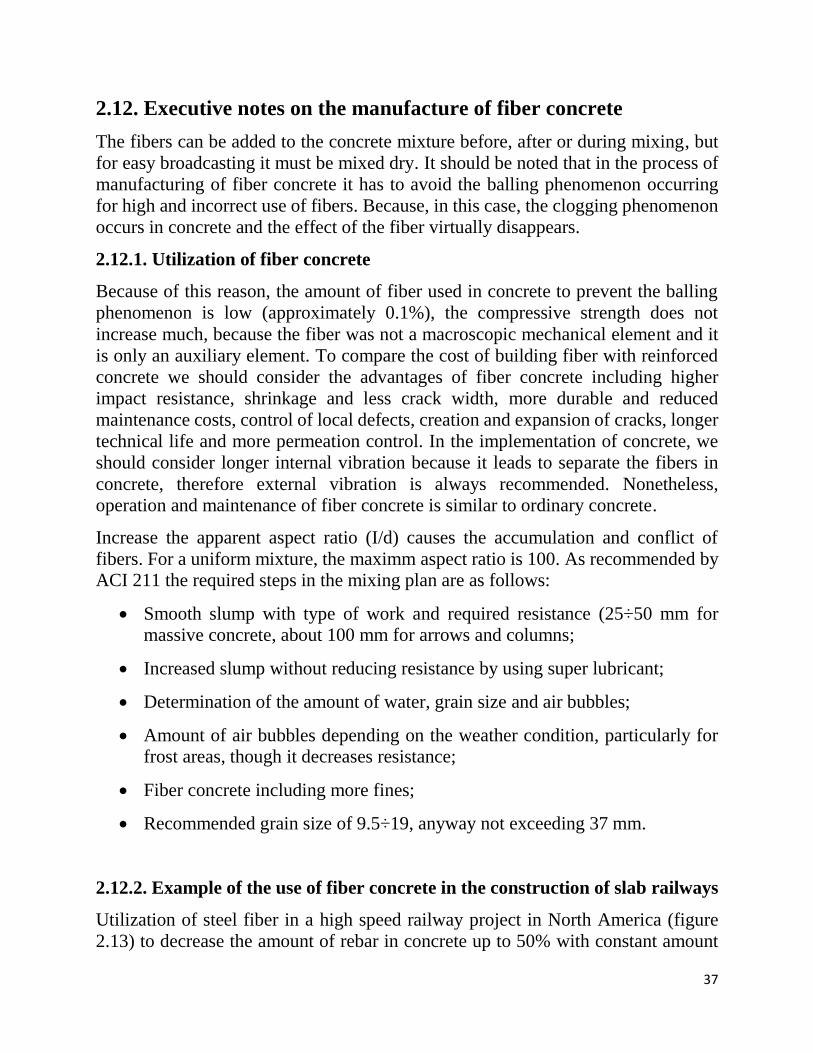
Wecharatana and Shah (1983) and Göteborg (2005) suggested that three distinct
regions exist and can be identified as:
Traction free zone, which occurs for relatively large crack openings (figure
9);
Fiber bridge zone, where stress transfers result by frictional slip of fiber
(figure 10);
Macro and Micro crack growth zones, where aggregates interlock and transfer
stress (figures 2.11 and 2.12).
Fig. 2.9. Crack without Fiber Fig. 2.10. Crack with Fibers
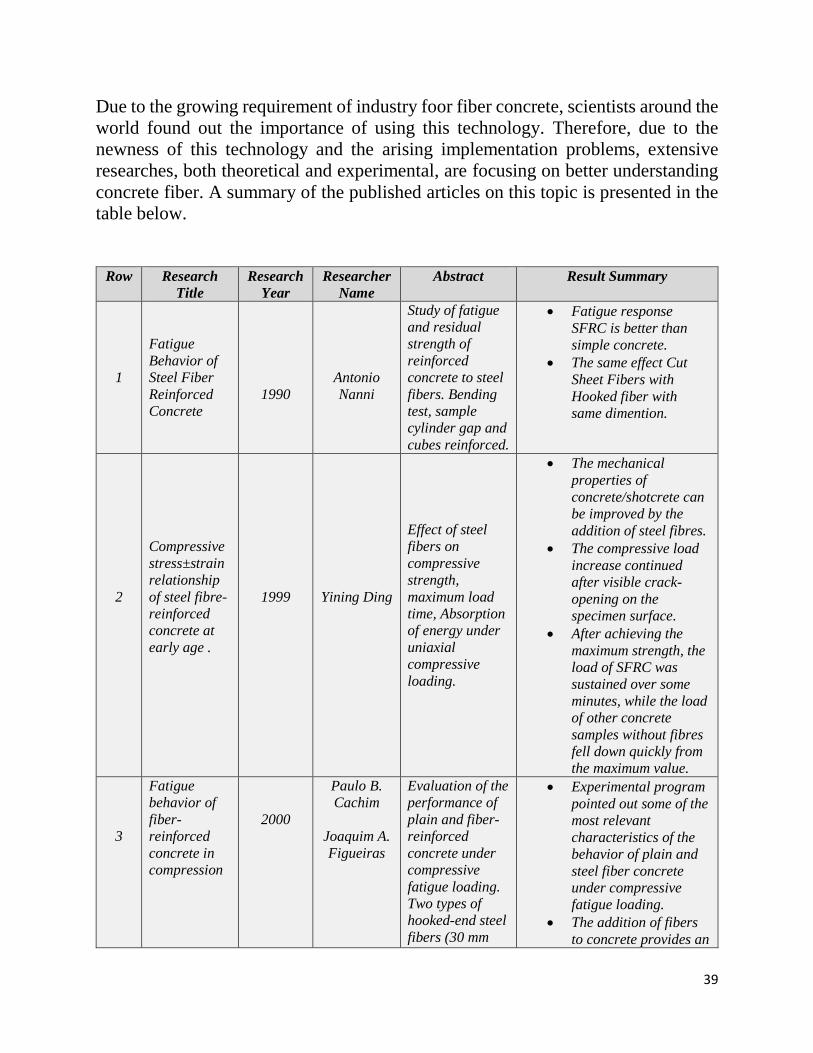
Fig. 2.11. Effect of short fibers on Fig. 2.12. Effect of long fibers on
microcracking macrocracking
37
2.12. Executive notes on the manufacture of fiber concrete
The fibers can be added to the concrete mixture before, after or during mixing, but
for easy broadcasting it must be mixed dry. It should be noted that in the process of
manufacturing of fiber concrete it has to avoid the balling phenomenon occurring
for high and incorrect use of fibers. Because, in this case, the clogging phenomenon
occurs in concrete and the effect of the fiber virtually disappears.
2.12.1. Utilization of fiber concrete
Because of this reason, the amount of fiber used in concrete to prevent the balling
phenomenon is low (approximately 0.1%), the compressive strength does not
increase much, because the fiber was not a macroscopic mechanical element and it
is only an auxiliary element. To compare the cost of building fiber with reinforced
concrete we should consider the advantages of fiber concrete including higher
impact resistance, shrinkage and less crack width, more durable and reduced
maintenance costs, control of local defects, creation and expansion of cracks, longer
technical life and more permeation control. In the implementation of concrete, we
should consider longer internal vibration because it leads to separate the fibers in
concrete, therefore external vibration is always recommended. Nonetheless,
operation and maintenance of fiber concrete is similar to ordinary concrete.
Increase the apparent aspect ratio (I/d) causes the accumulation and conflict of
fibers. For a uniform mixture, the maximm aspect ratio is 100. As recommended by
ACI 211 the required steps in the mixing plan are as follows:
Smooth slump with type of work and required resistance (25÷50 mm for
massive concrete, about 100 mm for arrows and columns;
Increased slump without reducing resistance by using super lubricant;
Determination of the amount of water, grain size and air bubbles;
Amount of air bubbles depending on the weather condition, particularly for
frost areas, though it decreases resistance;
Fiber concrete including more fines;
Recommended grain size of 9.5÷19, anyway not exceeding 37 mm.
2.12.2. Example of the use of fiber concrete in the construction of slab railways
Utilization of steel fiber in a high speed railway project in North America (figure
2.13) to decrease the amount of rebar in concrete up to 50% with constant amount

38
of cracks. The objective is to increase the efficiency and the quality of materials to
save time and money.
Fig. 2.13. High speed slab railway project in North of America (Bekaert Company, 2002)
Reconstruction of junctions in Newmarket City in Auckland, New Zealand, as a part
of DART railroad Project (figure 2.14). The limitation of the traffic interruption has
been a key element in favour of the use of fiber of RC-80/60-BN Dramix Company
typology with a consumption volume of 40 kg/m3.
Fig. 2.14. Reconstruction of junctions in railroad project in Auckland (DART project)
2.13. A summary of papers and research in field of fiber concrete
39
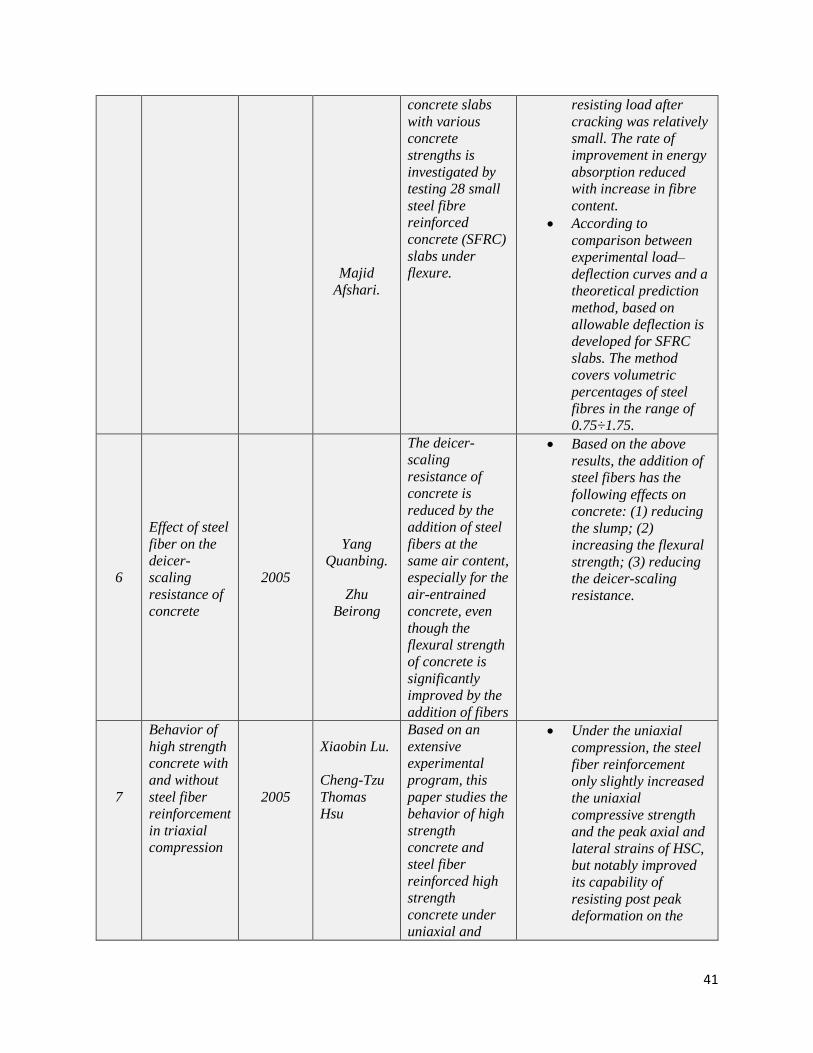
Due to the growing requirement of industry foor fiber concrete, scientists around the
world found out the importance of using this technology. Therefore, due to the
newness of this technology and the arising implementation problems, extensive
researches, both theoretical and experimental, are focusing on better understanding
concrete fiber. A summary of the published articles on this topic is presented in the
table below.
Row Research
Title
Research
Year
Researcher
Name
Abstract Result Summary
1
Fatigue
Behavior of
Steel Fiber
Reinforced
Concrete
1990
Antonio
Nanni
Study of fatigue
and residual
strength of
reinforced
concrete to steel
fibers. Bending
test, sample
cylinder gap and
cubes reinforced.
Fatigue response
SFRC is better than
simple concrete.
The same effect Cut
Sheet Fibers with
Hooked fiber with
same dimention.
2
Compressive
stress±strain
relationship
of steel fibre-
reinforced
concrete at
early age .
1999
Yining Ding
Effect of steel
fibers on
compressive
strength,
maximum load
time, Absorption
of energy under
uniaxial
compressive
loading.
The mechanical
properties of
concrete/shotcrete can
be improved by the
addition of steel fibres.
The compressive load
increase continued
after visible crack-
opening on the
specimen surface.
After achieving the
maximum strength, the
load of SFRC was
sustained over some
minutes, while the load
of other concrete
samples without fibres
fell down quickly from
the maximum value.
3
Fatigue
behavior of
fiber-
reinforced
concrete in
compression
2000
Paulo B.
Cachim
Joaquim A.
Figueiras
Evaluation of the
performance of
plain and fiber-
reinforced
concrete under
compressive
fatigue loading.
Two types of
hooked-end steel
fibers (30 mm
Experimental program
pointed out some of the
most relevant
characteristics of the
behavior of plain and
steel fiber concrete
under compressive
fatigue loading.
The addition of fibers
to concrete provides an

40
Paulo A.A.
Pereira
length and 60
mm length) have
been tested and
their
performance
compared.
increase in the
deformation at failure.
The key to the success
of improving the
fatigue life of concrete
with the addition of
fibers seems to be
related with the
distribution of the
fibers in concrete.
4
Uniaxial
tension test
for steel fibre
reinforced
concrete––a
parametric
study
2002
Bryan E.
Barragaan.
Ravindra
Gettu .
Miguel A.
Martıın .
Ra uul L.
Zerbino
A RILEM Draft
Recommendation
was proposed in
2001 for
obtaining the
stress versus
crack opening
(σ–w) response
of steel fibre
reinforced
concrete through
a uniaxial
tension test.
The ranges of the used
parameters and the
limited number of
specimens tested here,
the uniaxial tensile test
for SFRC, using a
notched moulded
cylinder, proposed
recently as a RILEM
Draft
Recommendation.
The post-peak stresses
and toughness
parameters obtained
from the tests exhibit
coefficients of variation
of up to 30%.
The test methodology
has also been
employed for the
characterisation of the
tensile response of
cores extracted from
cast SFRC elements.
Toughness measures
based on the post-peak
response have been
proposed for
representing the tensile
behaviour of SFRC,
and for possible use in
structural analysis and
design.
5
Flexural
behaviour of
small steel
fibre
reinforced
concrete
slabs
2002
AliR.
Khaloo.
Influence of
length and
volumetric
percentage of
steel fibres on
energy
absorption of
Addition of fibres does
not significantly
increase the ultimate
flexural strength of
SFRC slabs.
In slabs with low fibre
volume (0.5%) the
41
Majid
Afshari.
concrete slabs
with various
concrete
strengths is
investigated by
testing 28 small
steel fibre
reinforced
concrete (SFRC)
slabs under
flexure.
resisting load after
cracking was relatively
small. The rate of
improvement in energy
absorption reduced
with increase in fibre
content.
According to
comparison between
experimental load–
deflection curves and a
theoretical prediction
method, based on
allowable deflection is
developed for SFRC
slabs. The method
covers volumetric
percentages of steel
fibres in the range of
0.75÷1.75.
6
Effect of steel
fiber on the
deicer-
scaling
resistance of
concrete
2005
Yang
Quanbing.
Zhu
Beirong
The deicer-
scaling
resistance of
concrete is
reduced by the
addition of steel
fibers at the
same air content,
especially for the
air-entrained
concrete, even
though the
flexural strength
of concrete is
significantly
improved by the
addition of fibers
Based on the above
results, the addition of
steel fibers has the
following effects on
concrete: (1) reducing
the slump; (2)
increasing the flexural
strength; (3) reducing
the deicer-scaling
resistance.
7
Behavior of
high strength
concrete with
and without
steel fiber
reinforcement
in triaxial
compression
2005
Xiaobin Lu.
Cheng-Tzu
Thomas
Hsu
Based on an
extensive
experimental
program, this
paper studies the
behavior of high
strength
concrete and
steel fiber
reinforced high
strength
concrete under
uniaxial and
Under the uniaxial
compression, the steel
fiber reinforcement
only slightly increased
the uniaxial
compressive strength
and the peak axial and
lateral strains of HSC,
but notably improved
its capability of
resisting post peak
deformation on the

42
triaxial
compression.
descending branch of
the stress–strain curve.
Under the triaxial
compression, the steel
fiber reinforcement has
an insignificant effect
on the nonlinear
stress–strain relation
of HSC.
In the triaxial
compression, the HSC
and SFHSC essentially
fall within the same
ultimate strength
envelops in terms of the
Mohr-Coulomb and
Willam-Warnke failure
criteria.
Under the triaxial
compression, a uniform
relationship between
the octahedral shear
stress and the
engineering octahedral
shear strain at peak
stress can be adopted
for both HSC and
SFHSC.
8
Effect of
aspect ratio
and volume
fraction of
steel fiber on
the
mechanical
properties of
SFRC
2005
Semsi
Yazıcı
Go¨zde
Effects of aspect
ratio (l/d) and
volume fraction
(Vf) of steel fiber
on the
compressive
strength, split
tensile strength,
flexural strength
and ultrasonic
pulse velocity of
steel fiber
reinforced
concrete (SFRC)
were
investigated.
Three different
fiber volumes
were added to
concrete mixes
at 0.5%, 1.0%
and 1.5% by
Significant
improvement in
flexural strength SFRC
with increase of I/d
ratio and Vf.
Improve the flexural
strength of the concrete
compared to the
compressive strength
and tensile strength of
the gap.
43
volume of
concrete
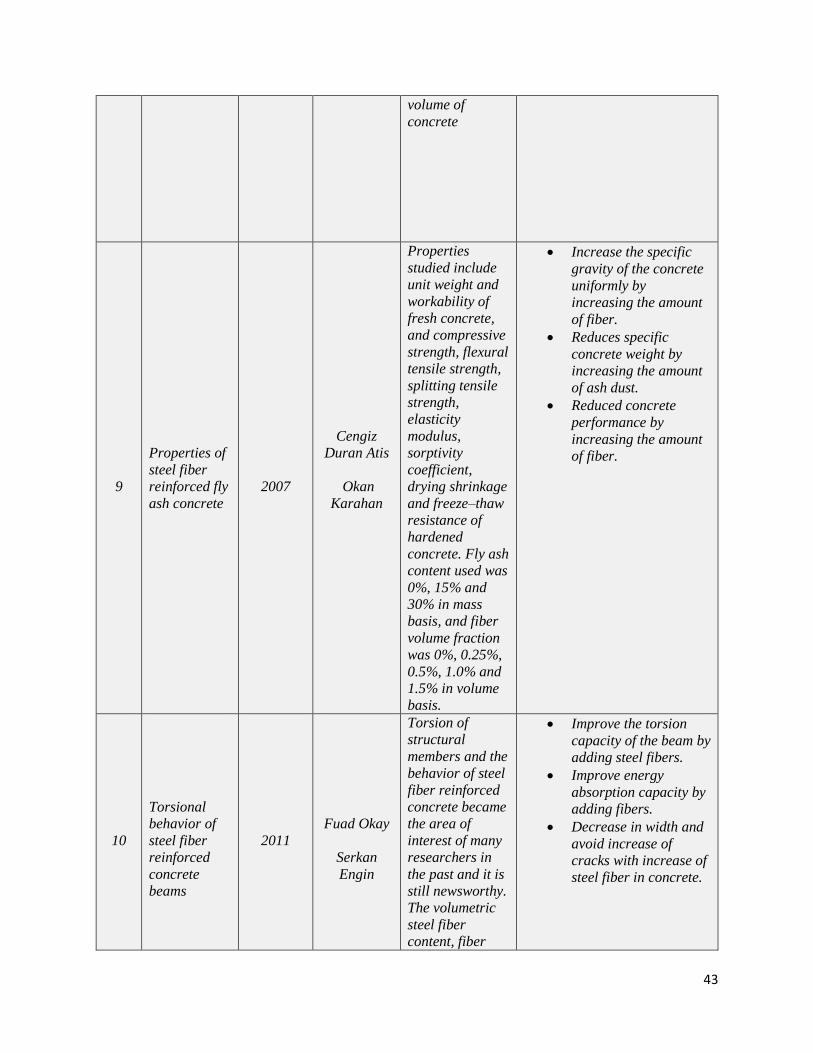
9
Properties of
steel fiber
reinforced fly
ash concrete
2007
Cengiz
Duran Atis
Okan
Karahan
Properties
studied include
unit weight and
workability of
fresh concrete,
and compressive
strength, flexural
tensile strength,
splitting tensile
strength,
elasticity
modulus,
sorptivity
coefficient,
drying shrinkage
and freeze–thaw
resistance of
hardened
concrete. Fly ash
content used was
0%, 15% and
30% in mass
basis, and fiber
volume fraction
was 0%, 0.25%,
0.5%, 1.0% and
1.5% in volume
basis.
Increase the specific
gravity of the concrete
uniformly by
increasing the amount
of fiber.
Reduces specific
concrete weight by
increasing the amount
of ash dust.
Reduced concrete
performance by
increasing the amount
of fiber.
10
Torsional
behavior of
steel fiber
reinforced
concrete
beams
2011
Fuad Okay
Serkan
Engin
Torsion of
structural
members and the
behavior of steel
fiber reinforced
concrete became
the area of
interest of many
researchers in
the past and it is
still newsworthy.
The volumetric
steel fiber
content, fiber
Improve the torsion
capacity of the beam by
adding steel fibers.
Improve energy
absorption capacity by
adding fibers.
Decrease in width and
avoid increase of
cracks with increase of
steel fiber in concrete.
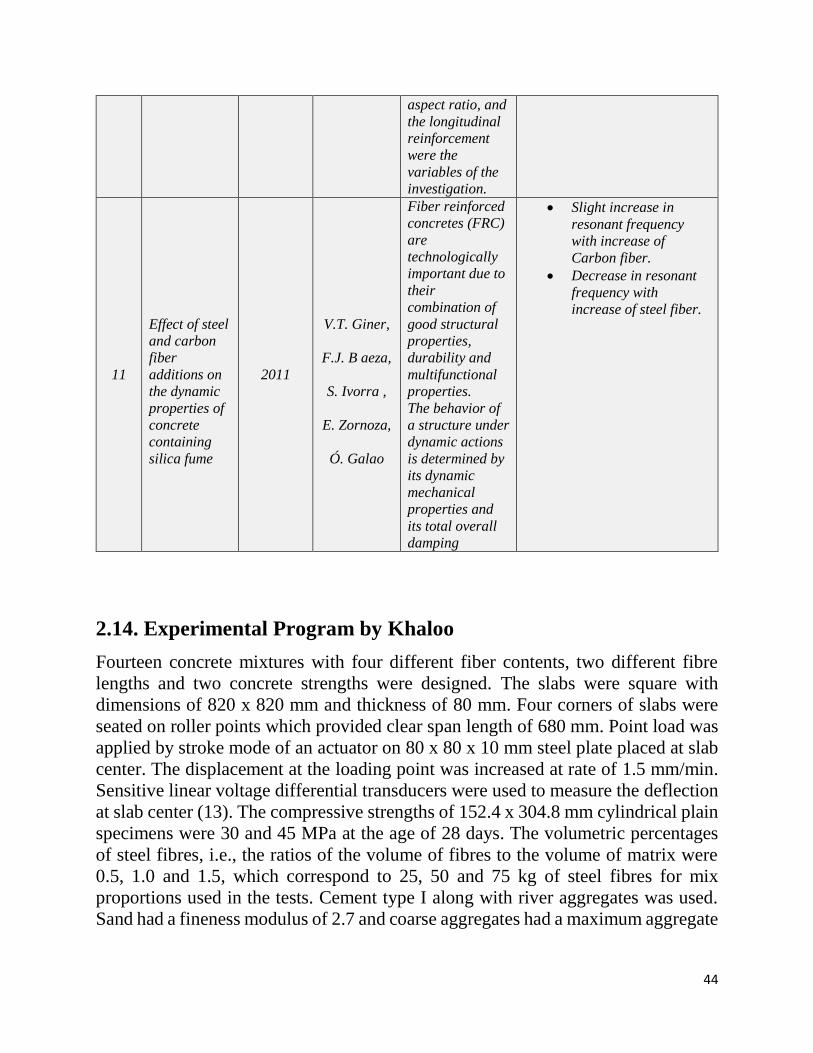
44
aspect ratio, and
the longitudinal
reinforcement
were the
variables of the
investigation.
11
Effect of steel
and carbon
fiber
additions on
the dynamic
properties of
concrete
containing
silica fume
2011
V.T. Giner,
F.J. B aeza,
S. Ivorra ,
E. Zornoza,
Ó. Galao
Fiber reinforced
concretes (FRC)
are
technologically
important due to
their
combination of
good structural
properties,
durability and
multifunctional
properties.
The behavior of
a structure under
dynamic actions
is determined by
its dynamic
mechanical
properties and
its total overall
damping
Slight increase in
resonant frequency
with increase of
Carbon fiber.
Decrease in resonant
frequency with
increase of steel fiber.
2.14. Experimental Program by Khaloo
Fourteen concrete mixtures with four different fiber contents, two different fibre
lengths and two concrete strengths were designed. The slabs were square with
dimensions of 820 x 820 mm and thickness of 80 mm. Four corners of slabs were
seated on roller points which provided clear span length of 680 mm. Point load was
applied by stroke mode of an actuator on 80 x 80 x 10 mm steel plate placed at slab
center. The displacement at the loading point was increased at rate of 1.5 mm/min.
Sensitive linear voltage differential transducers were used to measure the deflection
at slab center (13). The compressive strengths of 152.4 x 304.8 mm cylindrical plain
specimens were 30 and 45 MPa at the age of 28 days. The volumetric percentages
of steel fibres, i.e., the ratios of the volume of fibres to the volume of matrix were
0.5, 1.0 and 1.5, which correspond to 25, 50 and 75 kg of steel fibres for mix
proportions used in the tests. Cement type I along with river aggregates was used.
Sand had a fineness modulus of 2.7 and coarse aggregates had a maximum aggregate

45
size of 19 mm. The superplasticiser corresponded with ASTM C494 Type F. The
crimped shape steel fibres had a rectangular cross-section (13) (Fig. 2.15).
Fig. 2.15. Slabs in the four corners of the square on the roller supports and load on the center of the slab
The description of the experimental program is in Table 2.2.
The quantity of concrete and fibers are in Table 2.3 and 2.4.
2.14.1 Experimental results and discussion
The average test results for each pair of slabs are presented in Table 2.5. Also
flexural test results of slabs are shown as load-deflection and absorbed energy-
deflection curves in Fig. 2.16.
Table 2.2. Experimental Program
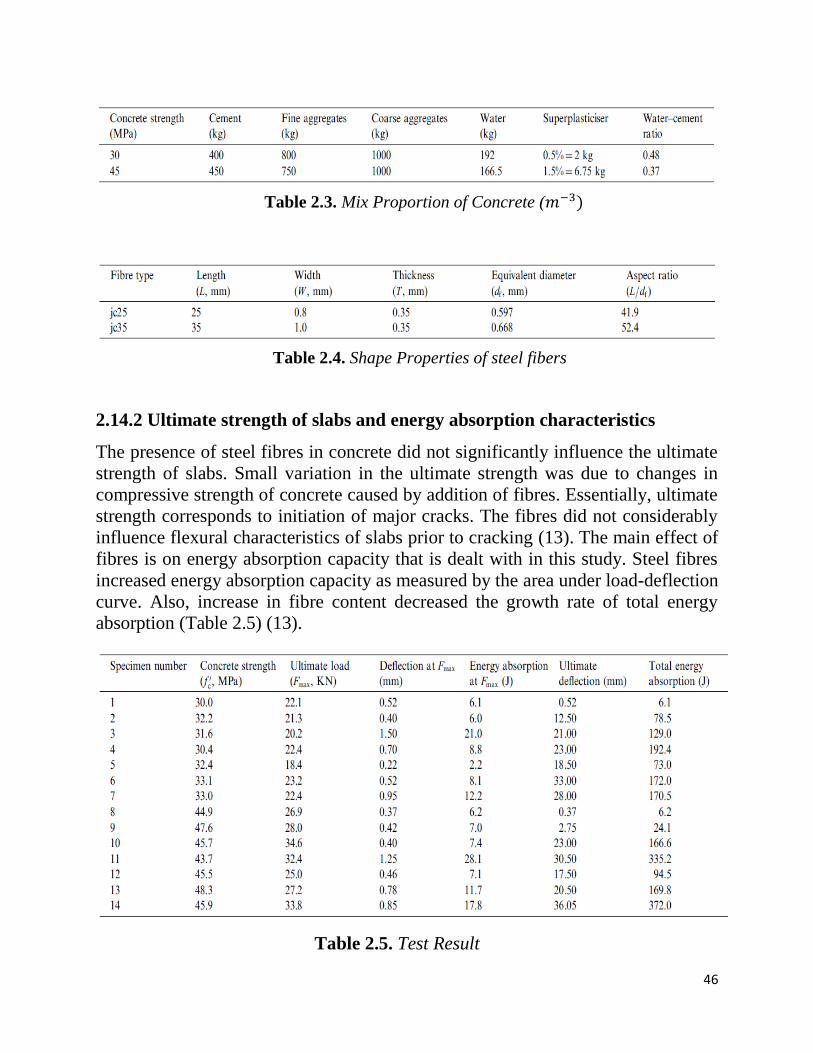
46
Table 2.3. Mix Proportion of Concrete (𝑚−3)
Table 2.4. Shape Properties of steel fibers
2.14.2 Ultimate strength of slabs and energy absorption characteristics
The presence of steel fibres in concrete did not significantly influence the ultimate
strength of slabs. Small variation in the ultimate strength was due to changes in
compressive strength of concrete caused by addition of fibres. Essentially, ultimate
strength corresponds to initiation of major cracks. The fibres did not considerably
influence flexural characteristics of slabs prior to cracking (13). The main effect of
fibres is on energy absorption capacity that is dealt with in this study. Steel fibres
increased energy absorption capacity as measured by the area under load-deflection
curve. Also, increase in fibre content decreased the growth rate of total energy
absorption (Table 2.5) (13).
Table 2.5. Test Result
47
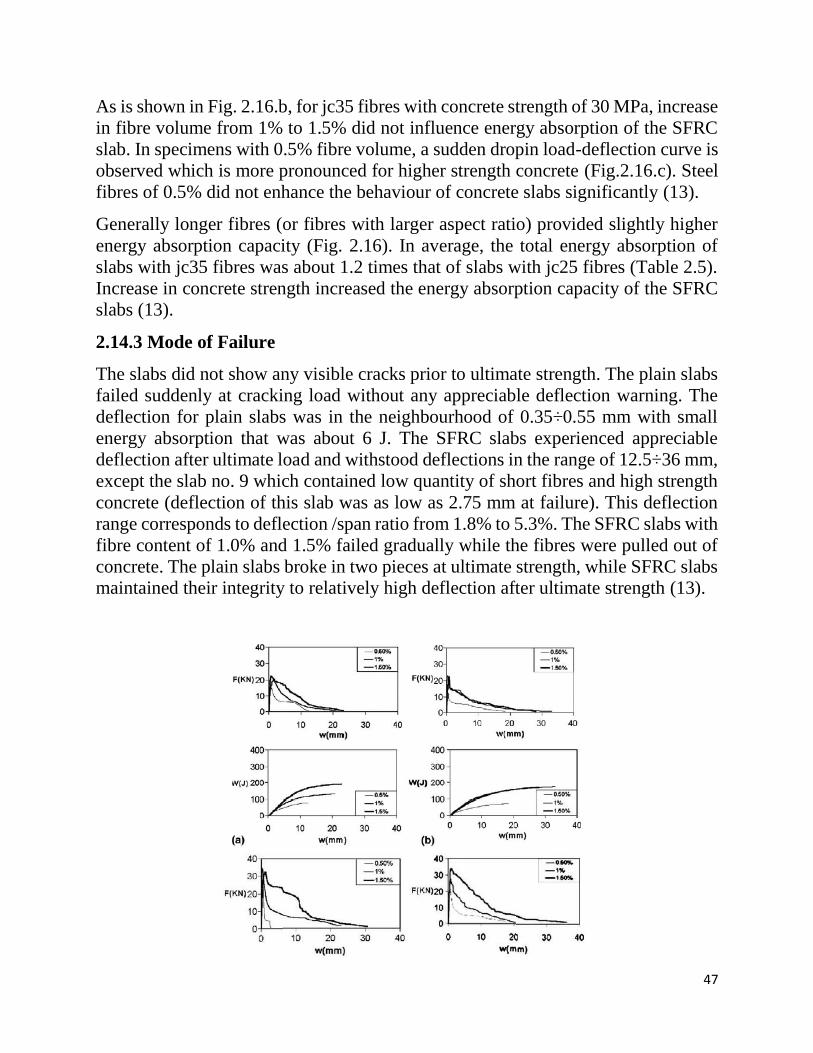
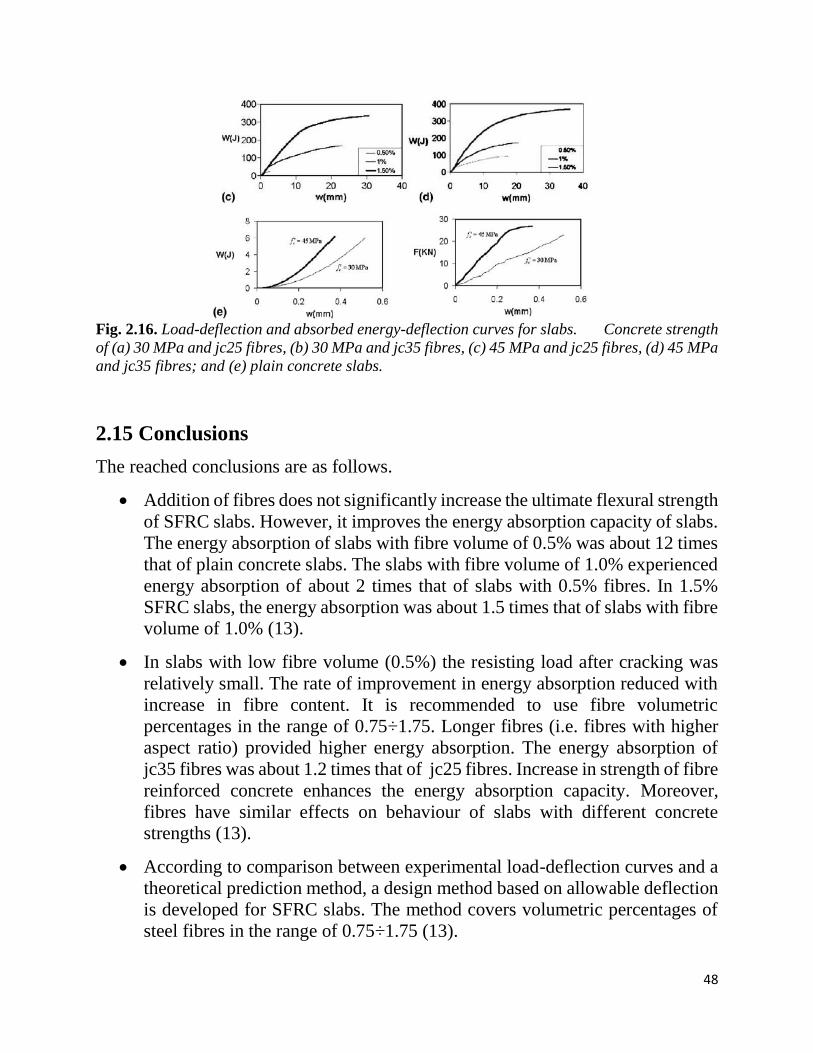
As is shown in Fig. 2.16.b, for jc35 fibres with concrete strength of 30 MPa, increase
in fibre volume from 1% to 1.5% did not influence energy absorption of the SFRC
slab. In specimens with 0.5% fibre volume, a sudden dropin load-deflection curve is
observed which is more pronounced for higher strength concrete (Fig.2.16.c). Steel
fibres of 0.5% did not enhance the behaviour of concrete slabs significantly (13).
Generally longer fibres (or fibres with larger aspect ratio) provided slightly higher
energy absorption capacity (Fig. 2.16). In average, the total energy absorption of
slabs with jc35 fibres was about 1.2 times that of slabs with jc25 fibres (Table 2.5).
Increase in concrete strength increased the energy absorption capacity of the SFRC
slabs (13).
2.14.3 Mode of Failure
The slabs did not show any visible cracks prior to ultimate strength. The plain slabs
failed suddenly at cracking load without any appreciable deflection warning. The
deflection for plain slabs was in the neighbourhood of 0.35÷0.55 mm with small
energy absorption that was about 6 J. The SFRC slabs experienced appreciable
deflection after ultimate load and withstood deflections in the range of 12.5÷36 mm,
except the slab no. 9 which contained low quantity of short fibres and high strength
concrete (deflection of this slab was as low as 2.75 mm at failure). This deflection
range corresponds to deflection /span ratio from 1.8% to 5.3%. The SFRC slabs with
fibre content of 1.0% and 1.5% failed gradually while the fibres were pulled out of
concrete. The plain slabs broke in two pieces at ultimate strength, while SFRC slabs
maintained their integrity to relatively high deflection after ultimate strength (13).
48
Fig. 2.16. Load-deflection and absorbed energy-deflection curves for slabs. Concrete strength
of (a) 30 MPa and jc25 fibres, (b) 30 MPa and jc35 fibres, (c) 45 MPa and jc25 fibres, (d) 45 MPa
and jc35 fibres; and (e) plain concrete slabs.
2.15 Conclusions
The reached conclusions are as follows.
Addition of fibres does not significantly increase the ultimate flexural strength
of SFRC slabs. However, it improves the energy absorption capacity of slabs.
The energy absorption of slabs with fibre volume of 0.5% was about 12 times
that of plain concrete slabs. The slabs with fibre volume of 1.0% experienced
energy absorption of about 2 times that of slabs with 0.5% fibres. In 1.5%
SFRC slabs, the energy absorption was about 1.5 times that of slabs with fibre
volume of 1.0% (13).
In slabs with low fibre volume (0.5%) the resisting load after cracking was
relatively small. The rate of improvement in energy absorption reduced with
increase in fibre content. It is recommended to use fibre volumetric
percentages in the range of 0.75÷1.75. Longer fibres (i.e. fibres with higher
aspect ratio) provided higher energy absorption. The energy absorption of
jc35 fibres was about 1.2 times that of jc25 fibres. Increase in strength of fibre
reinforced concrete enhances the energy absorption capacity. Moreover,
fibres have similar effects on behaviour of slabs with different concrete
strengths (13).
According to comparison between experimental load-deflection curves and a
theoretical prediction method, a design method based on allowable deflection
is developed for SFRC slabs. The method covers volumetric percentages of
steel fibres in the range of 0.75÷1.75 (13).

49
Chapter 3
Overview on fiber concrete design
criteria: shear, bending, and crack width

50
3.1 Inroduction
To ensure adequate safety and economy are the design purposes of a structure or a
structure’s component. Adequate safety means to have a sufficient stability. This
chapter explained a short summary about structural design methods and the choice
of the state mode for design of reinforced slab lines with fibers and armature.
3.2 Design methods
3.2.1 Allowable stress design
Allowable stress design, which is known as exploitation method, is one of the old
method of structural design. Although the design process based on allowed tension
method is simple and mostly obtaining a safety plan, it does not represent a realistic
estimate from consumption capacity and, in many cases, it is possible that the
coefficient of confidence is higher than considered.
3.2.2 Resistance design method
Resistance design method, known as ultimate strength design of a component at each
level should be equal or more than necessary the resistance, which is calculated by
coefficients under load combinations (U):
(𝑈)𝑅𝑒𝑠𝑖𝑠𝑡𝑎𝑛𝑐𝑒 𝑅𝑒𝑞𝑢𝑖𝑟𝑒𝑑 ≤ 𝐷𝑒𝑠𝑖𝑔𝑛 𝑅𝑒𝑠𝑖𝑠𝑡𝑎𝑛𝑐𝑒 (3-1)
In this equation, the design resistance is calculated by multiplying resistance
coefficient (𝜑) and nominal resistance.
𝐷𝑒𝑠𝑖𝑔𝑛 𝑅𝑒𝑠𝑖𝑠𝑡𝑎𝑛𝑐𝑒 = 𝑅𝑒𝑠𝑖𝑠𝑡𝑎𝑛𝑐𝑒 𝐶𝑜𝑒𝑓𝑓𝑖𝑐𝑖𝑒𝑛𝑡 𝜑 ∗ 𝑁𝑜𝑚𝑖𝑎𝑙 𝑅𝑒𝑠𝑖𝑠𝑡𝑎𝑛𝑐𝑒 (3-2)
In equation (3-2), the resistance coefficient is lower than 1 that is considered for the
compensation of the following issues:
Probability of less resistance of a component based on possible variations used
in the strength of materials and their dimensions;
Inaccuracy in design equations;
Importance of the component in the structures.
3.2.3 Design at limit state
Limit state design (LSD), also known as load and resistance factor design (LRFD),
refers to a design method used in structural engineering. A limit state is a condition
51
of a structure beyond which it no longer fulfills the relevant design criteria. The
condition may refer to a degree of loading or other actions on the structure, while
the criteria refer to structural integrity, fitness for use, durability or other design
requirements. A structure designed by LSD is proportioned to sustain all actions
likely to occur during its design life and to remain fit for use, with an appropriate
level of reliability for each limit state. Design at limit state is a design approach
basing on the concept of probabilities. The probability of a structural failure can be
reduced by estimate of load effects higher than the assurance that 𝑅 ≥ 𝑆. This
concept can be show by this equation:
𝜑𝑅𝑛 ≥ 𝛼𝑆𝑛 (3-3)
Where:
𝑅𝑛: nominal resistance;
𝜑: resistance coefficient;
𝑆𝑛: nominal load effect based on specified loads;
𝛼: load factor, usually <1.
This equation expresses the behavior of the scheme in a simplified way. In operation,
the right side of equation is divided into different load factors like (dead load, live
load, wind load, etc.) showed by (3-4) equation:
𝛼𝑆𝑛 = 𝛼𝐷𝑆𝐷𝑛 + 𝛼𝐿𝑆𝐿𝑛 + 𝛼𝑊𝑆𝑊𝑛 (3-4)
Where:
SDn: nominal dead factor effect;
SLn: nominal live factor effect;
SWn: nominal wind factor effect;
αD: dead factor coefficient;
αL: live factor coefficient;
αW: wind factor coefficient;
Basically, the dead load is more predictable rather than live factor coefficient (31).
52
3.3 Fiber concrete design
This part is considered a review of the criteria and available regulations concerning
analysis and design of fiber concrete. In this way the RILEM, FIB, and ACI
regulations are investigated. The FIB and RILEM regulations are explained about
flexural design discussion, shearing, and crack control in fiber concrete beams with
and without armature, whereas from these two regulations FIB explains about the
fiber concrete slab without armature only and it did not about component of fiber
concrete and armature (32).
3.4 Design of fiber reinforced concrete beams in RILEM regulation
RILEM is an international committee that is created by purposes of structural
development and materials used in structures. In this regulation for fiber concrete
design used to TC-162-TDF RILEM. This regulation is used these equations to get
concrete tensile stress and modulus of elasticity (33).
𝑓𝑐𝑡𝑚 = 0.3𝑓𝑐𝑘
2
3 (3-5)
𝑓𝑐𝑡𝑘 = 0.7𝑓𝑐𝑡𝑚 (3-6)
𝑓𝑐𝑡 = 0.6𝑓𝑐𝑡,𝑓𝑙 (3-7)
𝑓𝑐𝑡,𝑓𝑙 = 0.7𝑓𝑐𝑡𝑚,𝑓𝑙 (3-8)
Where:
𝑓𝑐𝑡𝑚: medium tensile strength of concrete;
𝑓𝑐𝑘: cylindrical compressive strength of concrete;
𝑓𝑐𝑡𝑘: specification of concrete tensile strength;
𝑓𝑐𝑡,𝑓𝑙: flexural strength of concrete;
𝑓𝑐𝑡𝑚,𝑓𝑙: medium concrete flexural strength.
3.4.1. Determination of flexural tensile strength
In this regulation, one of the important element in fiber concrete design is the flexural
tensile strength (𝑓𝑅,𝑗). It should be used for displacement rate of crack opening
experiment (CMOD), to determine this parameter according to the results of this
trial, where 𝑓𝑅1 and 𝑓𝑅2 are calculated by this equation with substitution of
𝐶𝑀𝑂𝐷1 and 𝐶𝑀𝑂𝐷4 (33) (fig. 3.1):

53
𝑓𝑅,𝑗 = 3 𝐹𝑗𝑙
2𝑏ℎ𝑠𝑝2 (3-9)
Fig. 3.1. F-CMOD graph in TC-162-TDF RILEM regulation to determine flexural tensile strength
Where:
l: sample crater;
b: sample width;
ℎ𝑠𝑝: distance between gap top up to the sample tested;
𝑓𝑗: Corresponding load with 𝐶𝑀𝑂𝐷𝑗;
𝑓𝑅,𝑗: flexural tensile strength corresponding with 𝐶𝑀𝑂𝐷𝑗 [j=1,2,3,4].
3.4.2 Flexural capacity calculation in RILEM
In the following forms, strain-stress relationship in fiber concrete and also strain-
stress distribution method are indicated according to the RILEM TC-162-TDF2003
regulation (33).
Parameters in Fig.3.2, starting from the fiber concrete flexural strength, are
calculated by this equation (33).
σ1 = 0.7fctm,fl(1.6 − d) (3-10)
Where d: Effective depth in meter

54
Fig. 3.2. Fiber Concrete Strain-Stress graph in RILEM TC-162-TDF 2003
𝜎2 = 0.450𝑓𝑅1𝐾ℎ(1.6 − 𝑑) (3-11)
𝐾𝑛: Size Factor
𝑓𝑅1: Tensile − flexural strength corresponding to CMOD1
𝜎3 = 0.37𝑓𝑅4𝐾ℎ (3-12)
𝑓𝑅4: Tensile − flexural strength corresponding to CMOD4
𝐸𝑐𝑚 = 9500(𝑓𝑐𝑚)1
3 (3-13)
휀1 = 𝜎1
𝐸𝑐 (3-14)
휀2 = 휀1 + 0.1 % (3-15)
휀3 =25 % (3-16)
𝐾ℎ = 1.0 − 0.6 ℎ[𝑐𝑚]−12.5
47.5[12.5 ≤ ℎ ≤ 60(𝑐𝑚)] (3-17)
Where:
h: Height of beam in (cm)

55
Fig. 3.3. 𝐾ℎ Size factor range in RILEM TC-162-TDF 2003
Fig. 3.4. Fiber concrete stress-strain diagram in RILEM TC-162-TDF 200
3.4.3 Anchor Cracking
For anchor cracking calculation it is used to (3-18) equation (33).
𝑀𝑐𝑟 = 𝑊1𝜎1 (3-18)
𝑊1 = 𝑏ℎ2
6 (3-19)
3.4.4 Surrender Moment Calculation
Fig. 3.5 Fiber concrete stress-strain diagram with Armature in RILEM TC-162-TDF
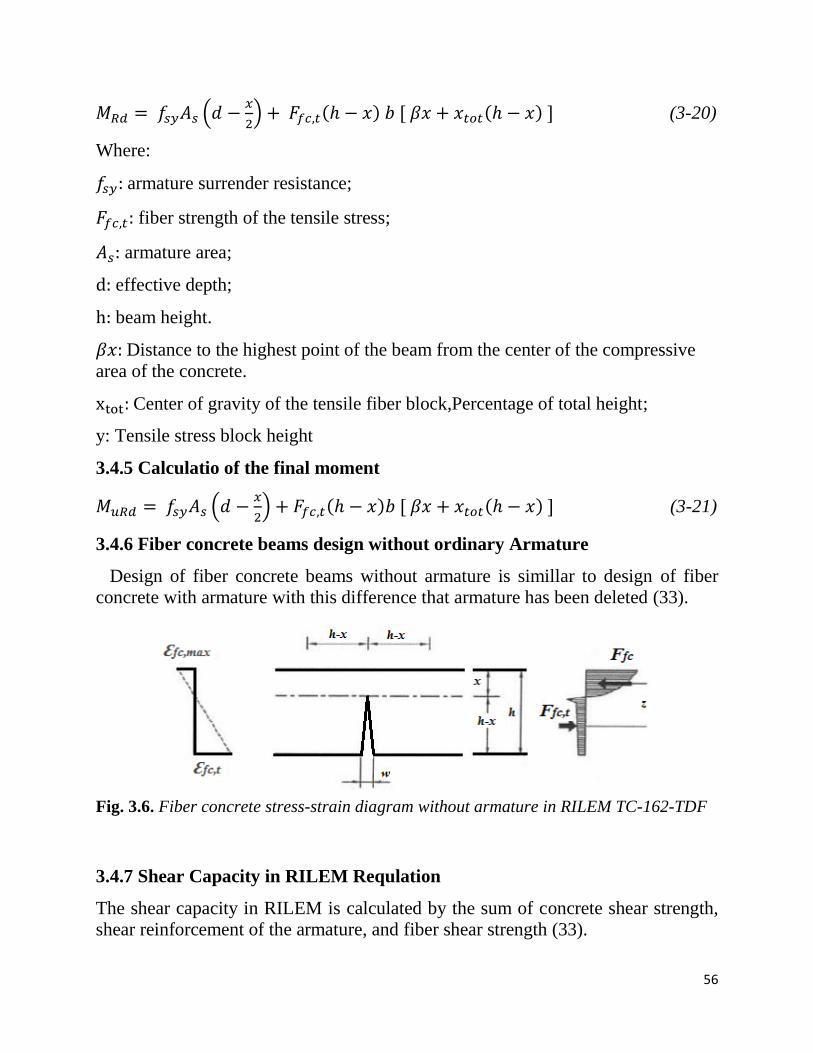
56
𝑀𝑅𝑑 = 𝑓𝑠𝑦𝐴𝑠 (𝑑 −𝑥
2) + 𝐹𝑓𝑐,𝑡(ℎ − 𝑥) 𝑏 [ 𝛽𝑥 + 𝑥𝑡𝑜𝑡(ℎ − 𝑥) ] (3-20)
Where:
𝑓𝑠𝑦: armature surrender resistance;
𝐹𝑓𝑐,𝑡: fiber strength of the tensile stress;
𝐴𝑠: armature area;
d: effective depth;
h: beam height.
𝛽𝑥: Distance to the highest point of the beam from the center of the compressive
area of the concrete.
xtot: Center of gravity of the tensile fiber block,Percentage of total height;
y: Tensile stress block height
3.4.5 Calculatio of the final moment
𝑀𝑢𝑅𝑑 = 𝑓𝑠𝑦𝐴𝑠 (𝑑 −𝑥
2) + 𝐹𝑓𝑐,𝑡(ℎ − 𝑥)𝑏 [ 𝛽𝑥 + 𝑥𝑡𝑜𝑡(ℎ − 𝑥) ] (3-21)
3.4.6 Fiber concrete beams design without ordinary Armature
Design of fiber concrete beams without armature is simillar to design of fiber
concrete with armature with this difference that armature has been deleted (33).
Fig. 3.6. Fiber concrete stress-strain diagram without armature in RILEM TC-162-TDF
3.4.7 Shear Capacity in RILEM Requlation
The shear capacity in RILEM is calculated by the sum of concrete shear strength,
shear reinforcement of the armature, and fiber shear strength (33).
57
𝑉𝑅𝑑 = 𝑉𝑐𝑑 + 𝑉𝑓𝑑 + 𝑉𝑤𝑑𝑉𝑅𝑑 (3-22)
𝑉𝑅𝑑 = [0.12𝑘(100𝜌1𝑓𝑐𝑘)1
3 + 0.15𝜎𝑐𝑝] 𝑏𝑑 (3-23)
Where:
𝜎𝑐𝑝: average stress on concrete due to loading;
𝜌1: armature percentage.
𝑘 = 1 + √200
𝑑 , (𝑘 ≤ 2) (3-24)
𝜌1 =𝐴𝑠
𝑏𝑑≤ 2% (3-25)
𝜎𝑐𝑝 =𝑁𝑠𝑑
𝐴𝑐 (3-26)
Where:
𝑁𝑠𝑑: 𝐴𝑥𝑖𝑎𝑙 𝑓𝑜𝑟𝑐𝑒 𝑖𝑛 𝑡ℎ𝑒 𝑓𝑜𝑟𝑚 𝑜𝑓 𝑝𝑟𝑒 − 𝑠𝑡𝑟𝑒𝑠𝑠
𝜎𝑐𝑝 = 0, 𝐼𝑛 𝑡ℎ𝑒 𝑎𝑏𝑠𝑒𝑛𝑐𝑒 𝑜𝑓 𝑎𝑥𝑖𝑎𝑙 𝑓𝑜𝑟𝑐𝑒 𝑖𝑛 𝑡ℎ𝑒 𝑠𝑒𝑐𝑡𝑖𝑜𝑛
𝑉𝑓𝑑 = 0.7𝑘𝑓𝑘𝜏𝑓𝑑𝑏𝑑 (3-27)
𝑘𝑓 = 1 + 𝑛 (ℎ𝑓
𝑏𝑤) (
ℎ𝑓
𝑑) , 𝑘𝑓 ≤ 1.5 (3-28)
𝜏𝑓𝑑 = 0.12𝑓𝑅𝑘,4 (3-29)
𝑛 =𝑏𝑓−𝑏𝑤
ℎ𝑓≤ 3 , 𝑛 ≤
3𝑏𝑤
ℎ𝑓 (3-30)
𝑉𝑤𝑑 =𝐴𝑠𝑤
𝑠0.9𝑑𝑓𝑦𝑤𝑑(1 + cot 𝛼) sin 𝛼 (3-31)
Where:
S: distance between shear armature;
𝛼: 𝑠ℎ𝑒𝑎𝑟 𝑎𝑟𝑚𝑎𝑡𝑢𝑟𝑒 𝑎𝑛𝑔𝑙𝑒:

58
𝑓𝑦𝑤𝑑: 𝑆𝑢𝑟𝑟𝑒𝑛𝑑𝑒𝑟 𝑅𝑒𝑠𝑖𝑠𝑡𝑎𝑛𝑐𝑒 𝑜𝑓 𝑎𝑟𝑚𝑎𝑡𝑢𝑟𝑒 𝑠ℎ𝑒𝑎𝑟 𝑟𝑒𝑖𝑛𝑓𝑜𝑟𝑐𝑒𝑚𝑒𝑛𝑡
𝐴𝑠𝑤: 𝑆ℎ𝑒𝑎𝑟 𝑎𝑟𝑚𝑎𝑡𝑢𝑟𝑒 𝑎𝑟𝑒𝑎
3.4.8 Calculation of crack width
𝑤𝑘 = 𝛽𝑠𝑟𝑚휀𝑠𝑚 (3-32)
휀𝑠𝑚 =𝜎𝑠
𝐸𝑠[1 − 𝛽1𝛽2 (
𝜎𝑠𝑟
𝜎𝑠)
2
] (3-33)
For considering fiber effect in calculation of crack width, the RILEM regulation
changed the 𝑆𝑟𝑚 data in formula and with multiplying by (50𝑑𝑓
𝑙𝑓), this regulation
changed this formula with the maximum amount:
𝑆𝑟𝑚 = (50 + 0.25𝑘1𝑘2∅𝑏
𝜌𝑟) (
50𝐿
∅⁄) (3-34)
The important note in the above equation is that the amount of fiber is not indicated
and the effect of fiber changing on crack width, is too less. The main weakness of
this model to predict the average cracks is that the amount of fiber is not considered.
Crack distance modified model is recommended by Moffatt (2001) and has been
developed in Eurocode 2 (33):
𝑆𝑚 = (50 + 0.25𝑘1𝑘2𝑑𝑏
𝜌𝑒𝑓𝑓) (1 −
𝑓𝑟𝑒𝑠
𝑓𝑐𝑟) (3-35)
3.4.9 Fiber crack width calculation without armature in RILEM
𝑊 = 휀𝑓𝑐,𝑡(ℎ − 𝑥) (3-36)
휀𝑓𝑐,𝑡 = 휀𝑓𝑐,𝑚𝑎𝑥(ℎ−𝑥)
𝑥 (3-37)
Where:
휀𝑓𝑐,𝑚𝑎𝑥: 𝐶𝑜𝑛𝑐𝑟𝑒𝑡𝑒 𝑝𝑟𝑒𝑠𝑠𝑢𝑟𝑒 𝑠𝑡𝑟𝑎𝑖𝑛
휀𝑓𝑐,𝑡: 𝐶𝑜𝑛𝑐𝑟𝑒𝑡𝑒 𝑡𝑒𝑛𝑠𝑖𝑙𝑒 𝑠𝑡𝑟𝑎𝑖𝑛
Crack width calculation without armature indicated that in the final, the crack width
is more than allowed amount. So, it requires a high percentage of fibers (33).
3.5 Design of fiber reinforced concrete beams in FIB Requlation

59
FIB is an international institute created by merging two CEB and FIP Committees.
In this regulation all conventional RC assumptions are considered, except concrete
tensile strength. This regulation used the following formula to calculate concrete
tensile stress and elasticity modulus (34).
𝑓𝑐𝑚 = 𝑓𝑐𝑘 + 8 (3-38)
𝑓𝑐𝑡𝑚 = 0.3𝑓𝑐𝑘
2
3 (3-39)
𝐸𝑐𝑚 = (𝑓𝑐𝑚
10)0.3 (3-40)
휀𝑐𝑢 = 3.5 ∗ 10−3 (3-41)
It should be noted that 𝐸𝑐𝑚 is defective because elasticity modulus can no be less
than compressive resistance. So, equation (3-42) is used in RILEM TC-162-TDF
2003 (34).
𝐸𝑐𝑚 = 9500(𝑓𝑐𝑚)1
3 (3-42)
3.5.1 Determination of tensile-flexural strength
According to this regulation, the fiber concrete design is one of the important
parameter in tensile-felxural strength, 𝑓𝑅,𝑗. It should use displacement rate test of
crack opening (CMOD) for determination of this parameter. CMOD is a loading test
that is controlled by deformation and determine the amount of crack opening. The
FIB regulation has recommended detail of EN14651 regulation (34).
𝑓𝑅,𝑗 = 3𝐹𝑗𝑙
2𝑏ℎ𝑠𝑝2 (3-43)
Where are:
l: sample craters;
b: Sample width;
ℎsp: space between gap to top;
𝐹𝑗: coressponding load with CMODj;
𝑓𝑅,𝑗: tensile-flexural strength corresponding with CMODj with [j=1,2,3,4];
𝑓𝑅1 ∶ correspond to CMOD1, 𝑓𝑅3 correspond to CMOD3: (Fig. 3.7)
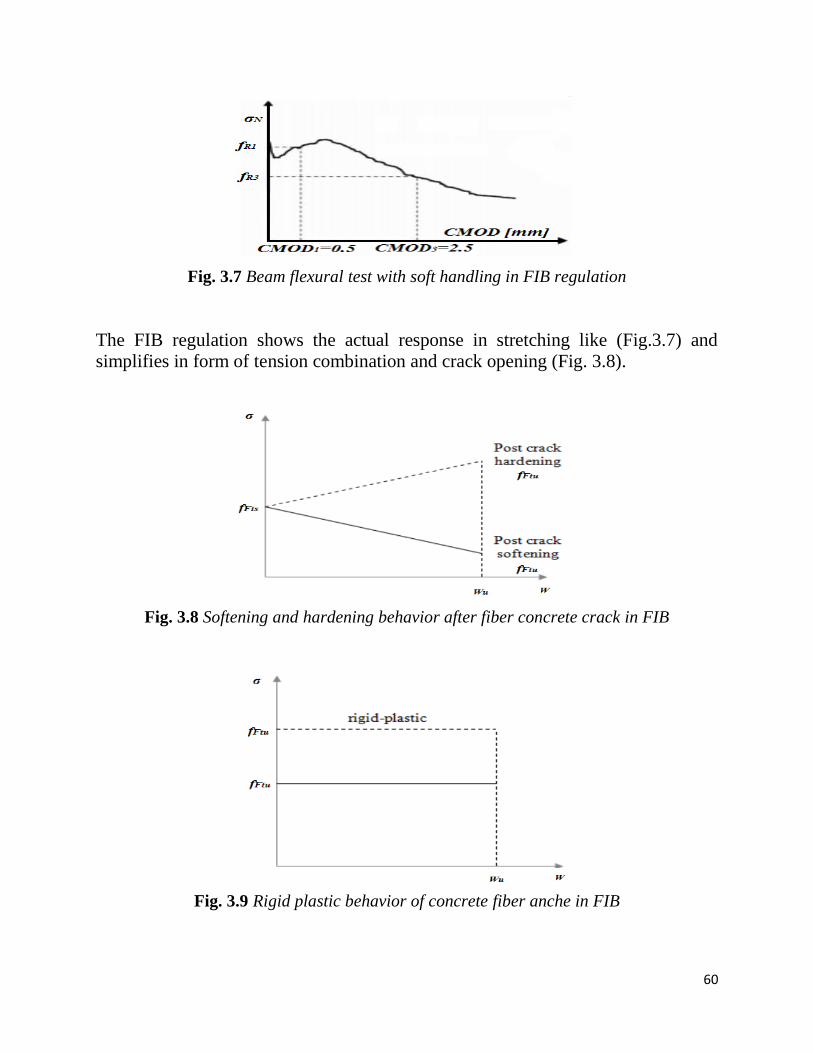
60
Fig. 3.7 Beam flexural test with soft handling in FIB regulation
The FIB regulation shows the actual response in stretching like (Fig.3.7) and
simplifies in form of tension combination and crack opening (Fig. 3.8).
Fig. 3.8 Softening and hardening behavior after fiber concrete crack in FIB
Fig. 3.9 Rigid plastic behavior of concrete fiber anche in FIB
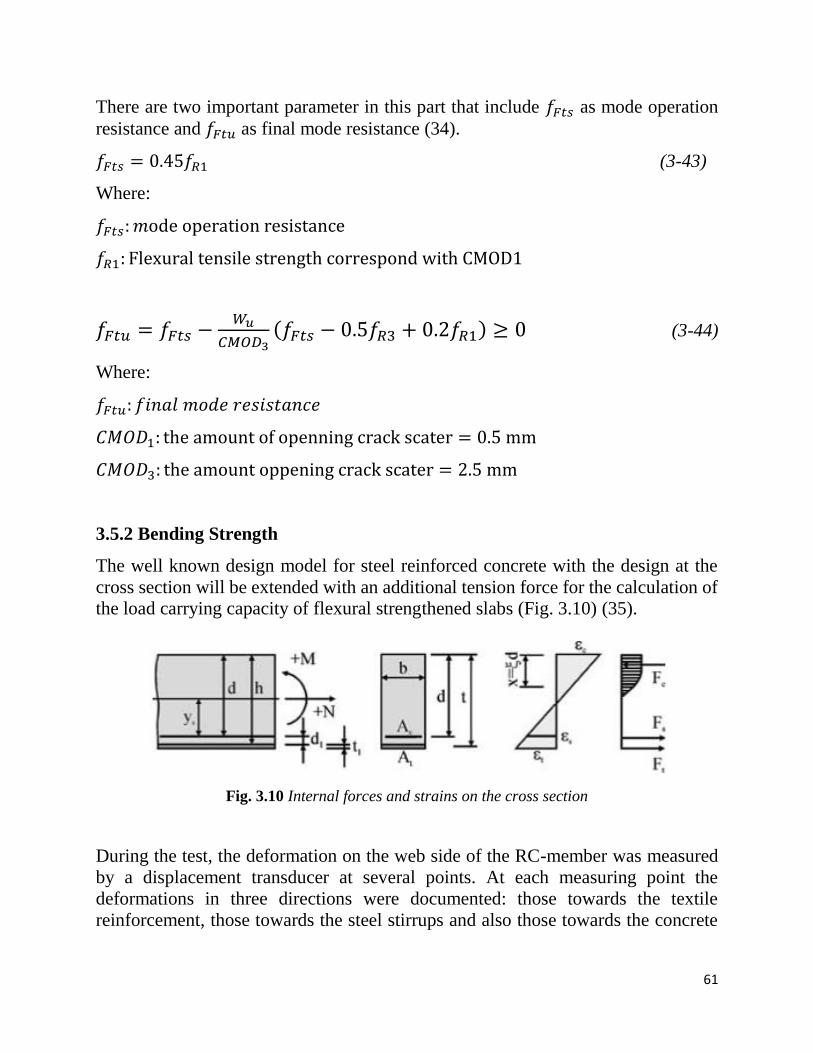
61
There are two important parameter in this part that include 𝑓𝐹𝑡𝑠 as mode operation
resistance and 𝑓𝐹𝑡𝑢 as final mode resistance (34).
𝑓𝐹𝑡𝑠 = 0.45𝑓𝑅1 (3-43)
Where:
𝑓𝐹𝑡𝑠: 𝑚ode operation resistance
𝑓𝑅1: Flexural tensile strength correspond with CMOD1
𝑓𝐹𝑡𝑢 = 𝑓𝐹𝑡𝑠 −𝑊𝑢
𝐶𝑀𝑂𝐷3(𝑓𝐹𝑡𝑠 − 0.5𝑓𝑅3 + 0.2𝑓𝑅1) ≥ 0 (3-44)
Where:
𝑓𝐹𝑡𝑢: 𝑓𝑖𝑛𝑎𝑙 𝑚𝑜𝑑𝑒 𝑟𝑒𝑠𝑖𝑠𝑡𝑎𝑛𝑐𝑒
𝐶𝑀𝑂𝐷1: the amount of openning crack scater = 0.5 mm
𝐶𝑀𝑂𝐷3: the amount oppening crack scater = 2.5 mm
3.5.2 Bending Strength
The well known design model for steel reinforced concrete with the design at the
cross section will be extended with an additional tension force for the calculation of
the load carrying capacity of flexural strengthened slabs (Fig. 3.10) (35).
Fig. 3.10 Internal forces and strains on the cross section
During the test, the deformation on the web side of the RC-member was measured
by a displacement transducer at several points. At each measuring point the
deformations in three directions were documented: those towards the textile
reinforcement, those towards the steel stirrups and also those towards the concrete
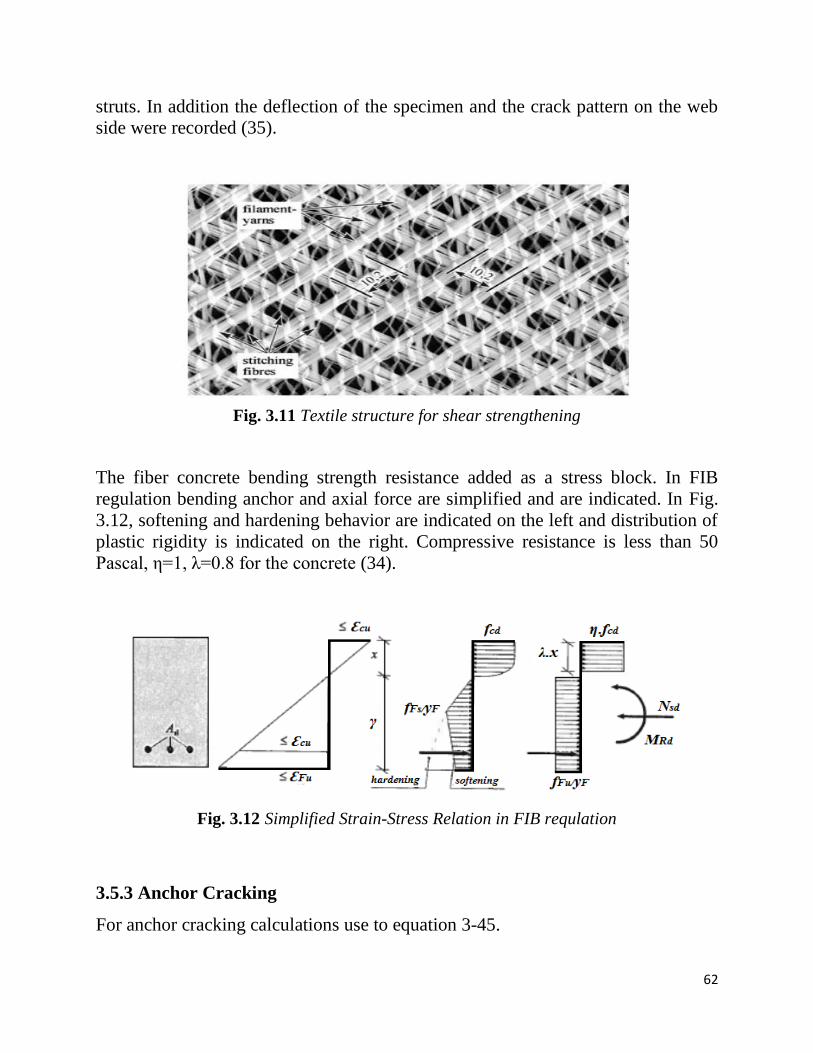
62
struts. In addition the deflection of the specimen and the crack pattern on the web
side were recorded (35).
Fig. 3.11 Textile structure for shear strengthening
The fiber concrete bending strength resistance added as a stress block. In FIB
regulation bending anchor and axial force are simplified and are indicated. In Fig.
3.12, softening and hardening behavior are indicated on the left and distribution of
plastic rigidity is indicated on the right. Compressive resistance is less than 50
Pascal, η=1, λ=0.8 for the concrete (34).
Fig. 3.12 Simplified Strain-Stress Relation in FIB requlation
3.5.3 Anchor Cracking
For anchor cracking calculations use to equation 3-45.
63
𝑀𝑐𝑟 = 𝑊1𝑓𝑐𝑡𝑚 (3-45)
𝑊1 =𝑏ℎ2
6 (3-46)
Where:
𝑊1: Intermediate module
b: Width
h: Heigth
3.6 Fiber concrete beams design without armature
This design is simillar to that with armature (34):
𝑀𝑅𝑑𝑦 = 𝑓𝐹𝑡(ℎ − 𝑥) 𝑏 [𝛽𝑥 + 𝑥𝑡𝑜𝑡𝑦] (3-47)
3.6.1 Flexibility
Design at limit state requires flexibility. In FIB regulation, flexibility condition is
estimated with minimum armature. The minimum amount of armature in reinforced
concrete beam is calculated by (34):
𝐴𝑠,𝑚𝑖𝑛 = 𝑘𝑐𝑘(𝑓𝑐𝑡𝑚 − 𝑓𝐹𝑡𝑠𝑚)𝐴𝑐𝑡
𝜎𝑠 (3-48)
Where:
𝐴𝑐𝑡: area of concrete tensile section;
𝜎𝑠: maximum tensile stress of armature while fraction;
𝑘𝑐: stress distribution coefficient before fraction;
𝑘: Coefficient of non − uniform tensions.
In reinforced concrete beams with fiber, it is possible to decrease the amount of
armature. According to the FIB regulation, the flexibility condition in fiber concrete
structure is performing one of the following equation (34).
𝛿𝑢 ≥ 20𝛿𝑆𝐿𝑆 (3-49)
𝛿𝑝𝑒𝑎𝑘 ≥ 5𝛿𝑆𝐿𝑆 (3-50)
Where:

64
𝛿𝑢: Final displacement;
𝛿𝑝𝑒𝑎𝑘: Displacement in maximum force;
𝛿𝑆𝐿𝑆: Displacement in service load.
3.6.2 Shear Capacity
The shear capacity in FIB regolation is calculated by the sum of shear strength and
armature (34):
𝑉𝑅𝑑 = 𝑉𝑅𝑑𝑐 + 𝑉𝑅𝑑,𝑠 (3-51)
The concrete beam shear strength with fiber is calculated by this equation:
𝑉𝑅𝑑,𝑐 = 𝑘𝑣√𝑓𝑐𝑘,𝑐𝑦𝑙
𝛾𝑐𝑍𝑏; (3-52)
γc: Concrete safety factor
Z = 0.9 d
3.6.3 Concrete shear capacity with different precentage of Fiber and armature
𝑉𝑅𝑑 = [(0.18
𝛾𝑐) 𝑘 [100𝜌1 (1 + 7.5
𝑓𝐹𝑡𝑢
𝑓𝑐𝑡0) 𝑓𝑐𝑘,𝑐𝑦𝑙]
1
3+ 0.15𝜎𝑐𝑝] 𝑏𝑑 (3-53)
Where is:
𝜎𝑐𝑝: average stress on concrete in effect of loading:
𝜌1: percentage of conventional armature;
𝑓𝐹𝑡𝑢: final mode resistance.
3.6.4 Crack width calcultion in FIB regulation
FIB regulation, use to following equation for all cracking steps from combination of
fiber concrete beams and armature. In this equation, steel fiber bending resistance
(𝑓𝐹𝑡𝑠) is nonzero because of fiber (34).
𝑤𝑑 =1
2
𝜑𝑠
𝜌𝑠,𝑒𝑓
(𝑓𝑐𝑡𝑚−𝑓𝐹𝑡𝑠)
𝜏𝑏𝑚(𝜎𝑠 − 𝛽𝜎𝑠𝑟)
1
𝐸𝑠 (3-54)
𝜎𝑠𝑟 =𝑓𝑐𝑡𝑚
𝜌𝑠,𝑒𝑓(1 + 𝛼𝑒𝜌𝑠) (3-55)
𝜌𝑠,𝑒𝑓 =𝐴𝑠
𝐴𝑠,𝑒𝑓 (3-56)

65
Where is:
𝐴𝑠: 𝑎𝑟𝑚𝑎𝑡𝑢𝑟𝑒 𝑎𝑟𝑒𝑎
𝐴𝑠,𝑒𝑓: 𝑐𝑜𝑛𝑐𝑟𝑒𝑡𝑒 𝑒𝑓𝑓𝑒𝑐𝑡𝑖𝑣𝑒 𝑎𝑟𝑒𝑎
𝛼𝑒: 𝑠𝑡𝑒𝑒𝑙 𝑡𝑜 𝐶𝑜𝑛𝑐𝑟𝑒𝑡𝑒 𝑒𝑙𝑎𝑠𝑡𝑖𝑠𝑖𝑡𝑦 𝑚𝑜𝑑𝑢𝑙𝑒 𝑟𝑎𝑡𝑖𝑜
3.7 Fiber Concrete Beams design in ACI544 regulation
3.7.1 Bending analysis of the beam containing fibers and reins
This method is for predicting armed beams with fibers and armature that is simillar
to final resistance design in ACI. The reinforced concrete nominal resistance with
fiber and armature is calculated by (3-57) equation (36).
𝑀𝑛 = 𝐴𝑠𝑓𝑦 (𝑑 −𝑎
2) + 𝜎𝑡𝑏(ℎ − 𝑒)(
ℎ
2+
𝑒
2
𝑎
2) (3-57)
𝜎𝑡 = 0.00772𝜌𝑓𝐹𝑏𝑒𝑙
𝑑𝑓 (3-58)
𝑒 =[∈𝑠(𝑓𝑖𝑏𝑒𝑟𝑠)+0.003]𝑐
0.003 (3-59)
Where:
∈𝑠 : 𝑇𝑒𝑛𝑠𝑖𝑙𝑒 𝑠𝑡𝑟𝑎𝑖𝑛 𝑜𝑓 𝑓𝑖𝑏𝑒𝑟𝑠;
𝜌𝑓: % 𝑉𝑜𝑙. 𝑂𝑓 𝑠𝑡𝑒𝑒𝑙 𝑓𝑖𝑏𝑒𝑟𝑠.
Fig. 3.13 Basic assumptions for reinforced concrete design with fiber and armature
3.7.2 Bending strength of fiber concrete beams in the first crack
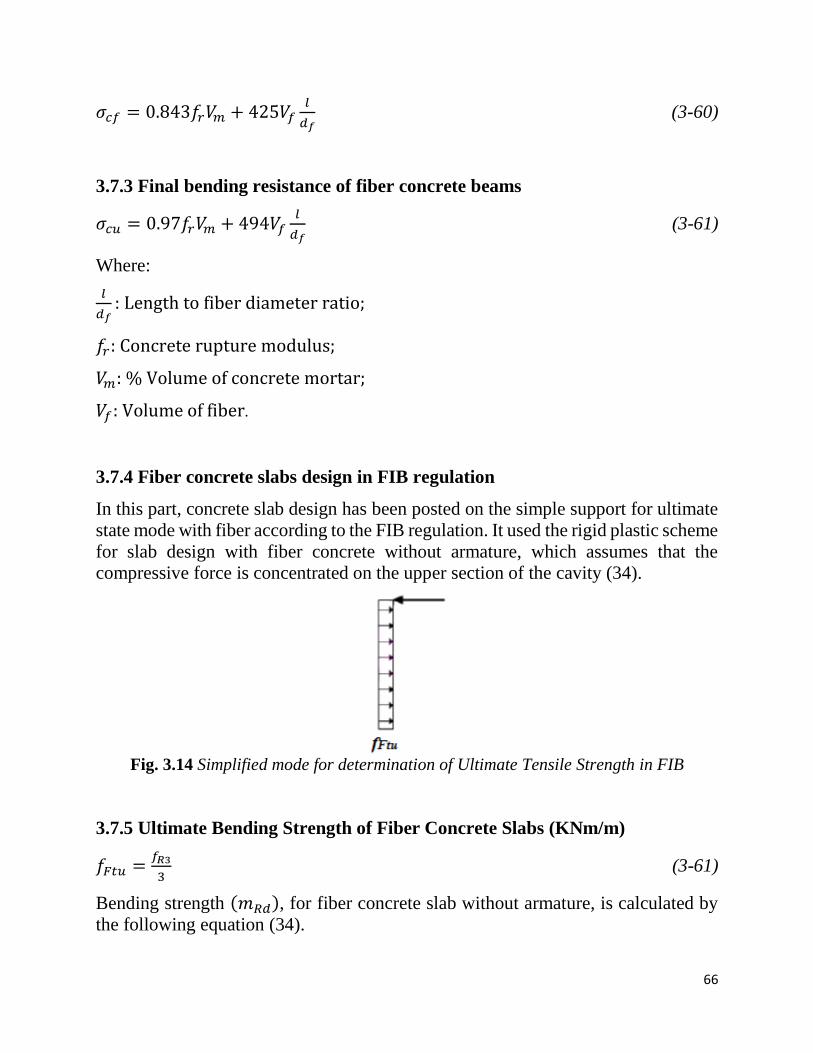
66
𝜎𝑐𝑓 = 0.843𝑓𝑟𝑉𝑚 + 425𝑉𝑓𝑙
𝑑𝑓 (3-60)
3.7.3 Final bending resistance of fiber concrete beams
𝜎𝑐𝑢 = 0.97𝑓𝑟𝑉𝑚 + 494𝑉𝑓𝑙
𝑑𝑓 (3-61)
Where:
𝑙
𝑑𝑓: Length to fiber diameter ratio;
𝑓𝑟: Concrete rupture modulus;
𝑉𝑚: % Volume of concrete mortar;
𝑉𝑓: Volume of fiber.
3.7.4 Fiber concrete slabs design in FIB regulation
In this part, concrete slab design has been posted on the simple support for ultimate
state mode with fiber according to the FIB regulation. It used the rigid plastic scheme
for slab design with fiber concrete without armature, which assumes that the
compressive force is concentrated on the upper section of the cavity (34).
Fig. 3.14 Simplified mode for determination of Ultimate Tensile Strength in FIB
3.7.5 Ultimate Bending Strength of Fiber Concrete Slabs (KNm/m)
𝑓𝐹𝑡𝑢 =𝑓𝑅3
3 (3-61)
Bending strength (𝑚𝑅𝑑), for fiber concrete slab without armature, is calculated by
the following equation (34).
67
𝑚𝑅𝑑 = 𝑓𝑓𝑡𝑢ℎ2 2⁄ (3-62)
Where:
ℎ: Slab Height;
𝑓𝐹𝑡𝑢: Residual flexural strength.
The above result shows that in fiber concrete mode should use to high volumes of
fibers for provide flexural strength (34).
3.8 Conclusion
This chapter used FIB regulation to design fiber concrete slab without armature. Due
to lack of design criteria in FIB regulation concerning the fiber concrete slab design
with armature, it used to fiber concrete beams design criteria without armature.
68
Chapter 4
Development of Numerical Model for
Analysis of Fiber Concrete Slabs
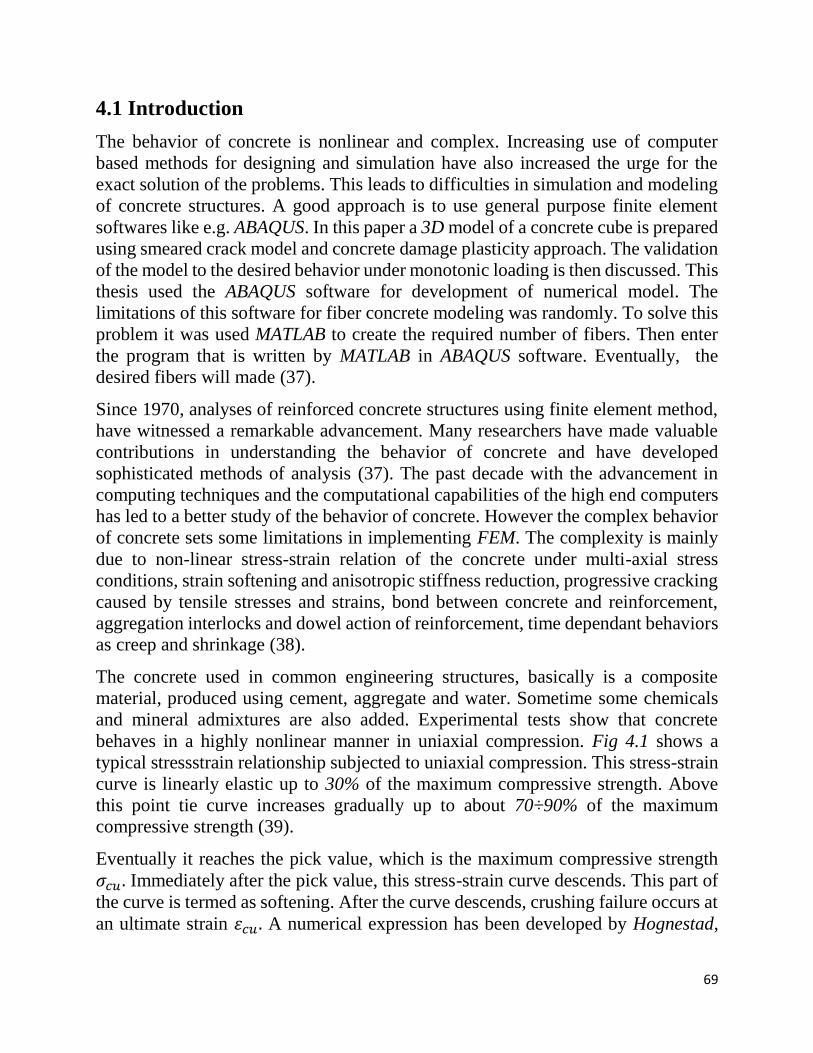
69
4.1 Introduction
The behavior of concrete is nonlinear and complex. Increasing use of computer
based methods for designing and simulation have also increased the urge for the
exact solution of the problems. This leads to difficulties in simulation and modeling
of concrete structures. A good approach is to use general purpose finite element
softwares like e.g. ABAQUS. In this paper a 3D model of a concrete cube is prepared
using smeared crack model and concrete damage plasticity approach. The validation
of the model to the desired behavior under monotonic loading is then discussed. This
thesis used the ABAQUS software for development of numerical model. The
limitations of this software for fiber concrete modeling was randomly. To solve this
problem it was used MATLAB to create the required number of fibers. Then enter
the program that is written by MATLAB in ABAQUS software. Eventually, the
desired fibers will made (37).
Since 1970, analyses of reinforced concrete structures using finite element method,
have witnessed a remarkable advancement. Many researchers have made valuable
contributions in understanding the behavior of concrete and have developed
sophisticated methods of analysis (37). The past decade with the advancement in
computing techniques and the computational capabilities of the high end computers
has led to a better study of the behavior of concrete. However the complex behavior
of concrete sets some limitations in implementing FEM. The complexity is mainly
due to non-linear stress-strain relation of the concrete under multi-axial stress
conditions, strain softening and anisotropic stiffness reduction, progressive cracking
caused by tensile stresses and strains, bond between concrete and reinforcement,
aggregation interlocks and dowel action of reinforcement, time dependant behaviors
as creep and shrinkage (38).
The concrete used in common engineering structures, basically is a composite
material, produced using cement, aggregate and water. Sometime some chemicals
and mineral admixtures are also added. Experimental tests show that concrete
behaves in a highly nonlinear manner in uniaxial compression. Fig 4.1 shows a
typical stressstrain relationship subjected to uniaxial compression. This stress-strain
curve is linearly elastic up to 30% of the maximum compressive strength. Above
this point tie curve increases gradually up to about 70÷90% of the maximum
compressive strength (39).
Eventually it reaches the pick value, which is the maximum compressive strength
𝜎𝑐𝑢. Immediately after the pick value, this stress-strain curve descends. This part of
the curve is termed as softening. After the curve descends, crushing failure occurs at
an ultimate strain 휀𝑐𝑢 . A numerical expression has been developed by Hognestad,
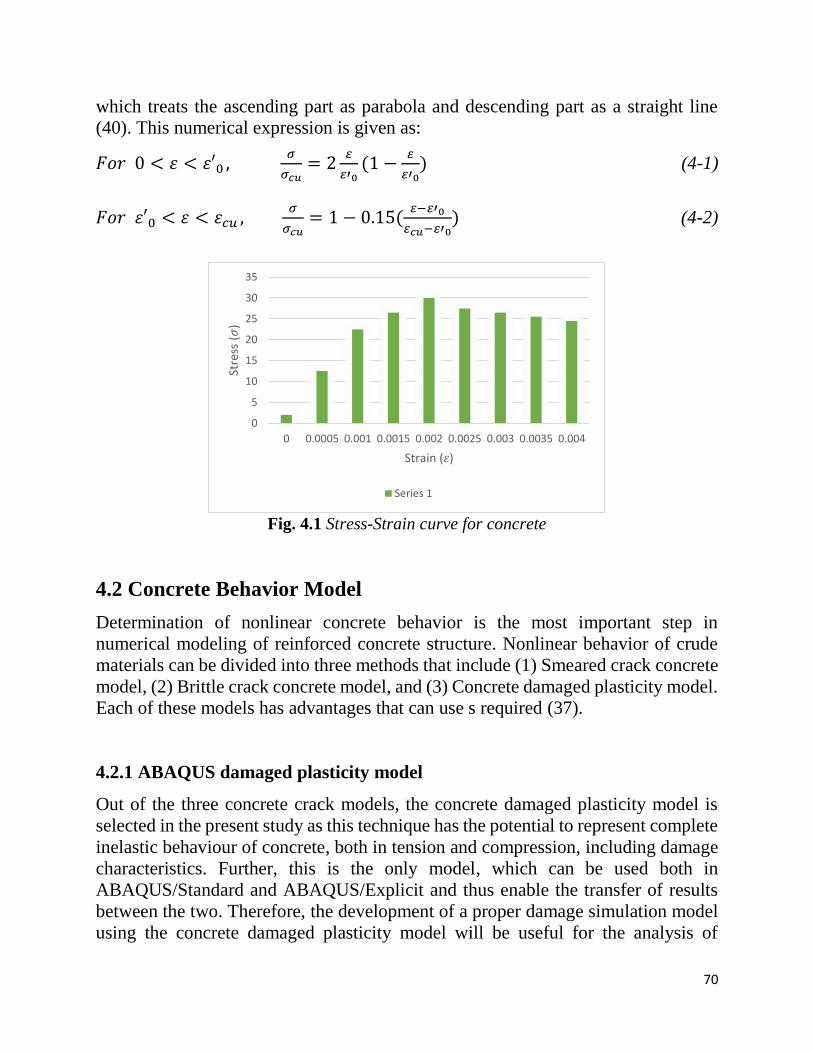
70
which treats the ascending part as parabola and descending part as a straight line
(40). This numerical expression is given as:
𝐹𝑜𝑟 0 < 휀 < 휀′0 , 𝜎
𝜎𝑐𝑢= 2
𝜀
𝜀′0(1 −
𝜀
𝜀′0) (4-1)
𝐹𝑜𝑟 휀′0 < 휀 < 휀𝑐𝑢 , 𝜎
𝜎𝑐𝑢= 1 − 0.15(
𝜀−𝜀′0
𝜀𝑐𝑢−𝜀′0) (4-2)
Fig. 4.1 Stress-Strain curve for concrete
4.2 Concrete Behavior Model
Determination of nonlinear concrete behavior is the most important step in
numerical modeling of reinforced concrete structure. Nonlinear behavior of crude
materials can be divided into three methods that include (1) Smeared crack concrete
model, (2) Brittle crack concrete model, and (3) Concrete damaged plasticity model.
Each of these models has advantages that can use s required (37).
4.2.1 ABAQUS damaged plasticity model
Out of the three concrete crack models, the concrete damaged plasticity model is
selected in the present study as this technique has the potential to represent complete
inelastic behaviour of concrete, both in tension and compression, including damage
characteristics. Further, this is the only model, which can be used both in
ABAQUS/Standard and ABAQUS/Explicit and thus enable the transfer of results
between the two. Therefore, the development of a proper damage simulation model
using the concrete damaged plasticity model will be useful for the analysis of
0
5
10
15
20
25
30
35
0 0.0005 0.001 0.0015 0.002 0.0025 0.003 0.0035 0.004
Stre
ss (𝜎
)
Strain (𝜀)
Series 1
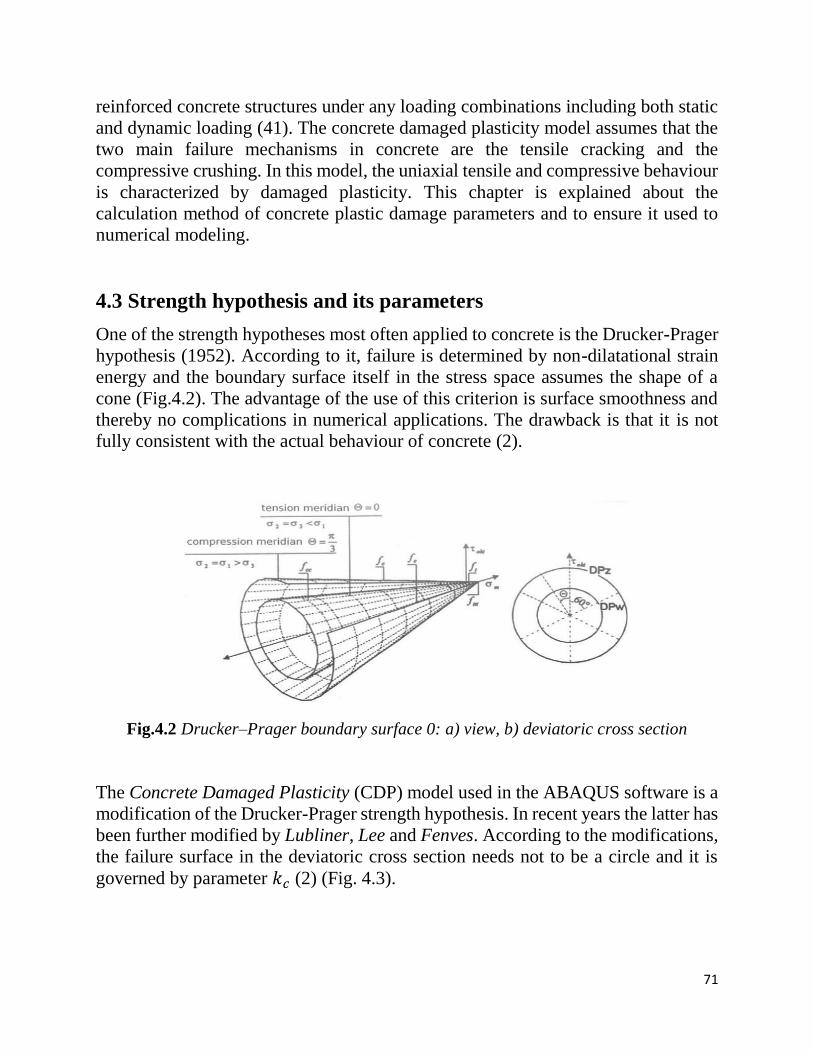
71
reinforced concrete structures under any loading combinations including both static
and dynamic loading (41). The concrete damaged plasticity model assumes that the
two main failure mechanisms in concrete are the tensile cracking and the
compressive crushing. In this model, the uniaxial tensile and compressive behaviour
is characterized by damaged plasticity. This chapter is explained about the
calculation method of concrete plastic damage parameters and to ensure it used to
numerical modeling.
4.3 Strength hypothesis and its parameters
One of the strength hypotheses most often applied to concrete is the Drucker-Prager
hypothesis (1952). According to it, failure is determined by non-dilatational strain
energy and the boundary surface itself in the stress space assumes the shape of a
cone (Fig.4.2). The advantage of the use of this criterion is surface smoothness and
thereby no complications in numerical applications. The drawback is that it is not
fully consistent with the actual behaviour of concrete (2).
Fig.4.2 Drucker–Prager boundary surface 0: a) view, b) deviatoric cross section
The Concrete Damaged Plasticity (CDP) model used in the ABAQUS software is a
modification of the Drucker-Prager strength hypothesis. In recent years the latter has
been further modified by Lubliner, Lee and Fenves. According to the modifications,
the failure surface in the deviatoric cross section needs not to be a circle and it is
governed by parameter 𝑘𝑐 (2) (Fig. 4.3).

72
Fig.4.3 Deviatoric cross section of failure surface in CDP model
Physically, parameter Kc is interpreted as a ratio of the distances between the
hydrostatic axis and, respectively, the compression meridian and the tension
meridian in the deviatoric cross section. This ratio is always higher than 0.5 and
when it assumes the value of 1, the deviatoric cross section of the failure surface
becomes a circle (as in the classic Drucker-Prager strength hypothesis). Majewski
reports that according to experimental results this value for mean normal stress equal
to zero amounts to 0.6 and slowly increases with decreasing mean stress. The CDP
model recommends to assume Kc = 2/3. This shape is similar to the strength criterion
(a combination of three mutually tangent ellipses) formulated by William and
Warnke in 1975. It is a theoretical-experimental criterion based on triaxial stress test
results (2).
Similarly, the shape of the plane’s meridians in the stress space changes:
experimental results indicate that the meridians are curves. In the CDP model the
plastic potential surface in the meridional plane assumes the form of a hyperbole
(fig. 4.4). The shape is adjusted through eccentricity (plastic potential eccentricity).
It is a small positive value which expresses the rate of approach of the plastic
potential hyperbola to its asymptote. In other words, it is the length (measured along
the hydrostatic axis) of the segment between the vertex of the hyperbole and the
intersection of the asymptotes of this hyperbole (the centre of the hyperbole).
Parameter eccentricity can be calculated as a ratio of tensile strength to compressive
strength (42).
The CDP mode recommends to assume 𝜖 = 0.1 when 𝜖 = 0, the surface in the
meridional plane becomes a straight line (the classic Drucker-Prager hypothesis) (2).
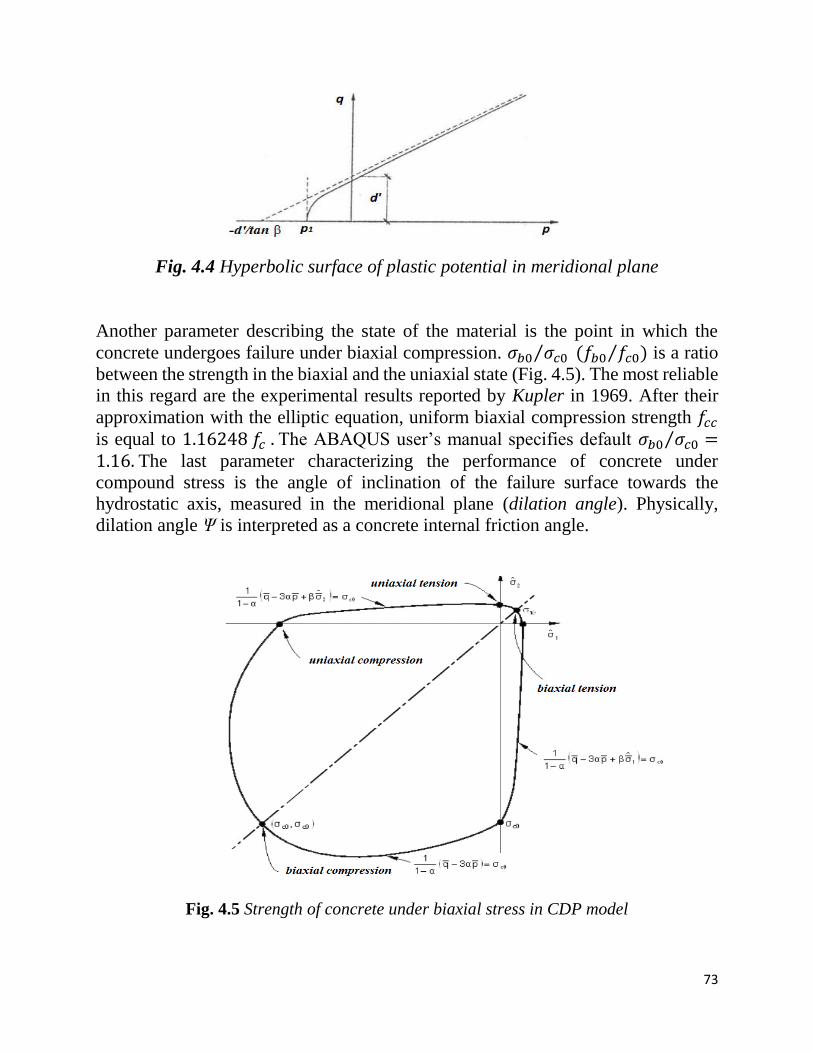
73
Fig. 4.4 Hyperbolic surface of plastic potential in meridional plane
Another parameter describing the state of the material is the point in which the
concrete undergoes failure under biaxial compression. 𝜎𝑏0 𝜎𝑐0⁄ (𝑓𝑏0 𝑓𝑐0⁄ ) is a ratio
between the strength in the biaxial and the uniaxial state (Fig. 4.5). The most reliable
in this regard are the experimental results reported by Kupler in 1969. After their
approximation with the elliptic equation, uniform biaxial compression strength 𝑓𝑐𝑐
is equal to 1.16248 𝑓𝑐 . The ABAQUS user’s manual specifies default 𝜎𝑏0 𝜎𝑐0⁄ =1.16. The last parameter characterizing the performance of concrete under
compound stress is the angle of inclination of the failure surface towards the
hydrostatic axis, measured in the meridional plane (dilation angle). Physically,
dilation angle Ψ is interpreted as a concrete internal friction angle.
Fig. 4.5 Strength of concrete under biaxial stress in CDP model

74
4.4 Stress-strain curve for uniaxial compression
The stress-strain relation for a given concrete can be most accurately described on
the basis of uniaxial compression tests carried out on it. Having obtained a graph
from laboratory tests one should transform the variables. Inelastic strains 휀𝑐~𝑖𝑛 are
used in the CDP model. In order to determine them one should deduct the elastic
part (corresponding to the undamaged material) from the total strains registered in
the uniaxial compression test:
휀𝑐~𝑖𝑛 = 휀𝑐 − 휀0𝑐
𝑒𝑙 (4-3)
휀0𝑐𝑒𝑙 =
𝜎𝑐
𝐸0 (4-4)
Fig. 4.6 Definition of inelastic strains
When transforming strains, one should consider from what moment the material
should be defined as nonlinearly elastic. Although uniaxial tests show that such
behaviour occurs almost from the beginning of the compression process, for most
numerical analyses it can be neglected in the initial stage. According to Majewski, a
linear elasticity limit should increase with concrete strength and it should be rather
assumed than experimentally determined. He calculated it as a percentage of stress
to concrete strength from this formula:
𝑒𝑙𝑖𝑚 = 1 − exp (−𝑓𝑐
80) (4-5)
This ceiling can be simply arbitrarily assumed as 0.4 𝑓𝑐𝑚. Eurocode 2 specifies the
modulus of elasticity for concrete to be in a range of 0÷0.4 𝑓𝑐𝑚. In most numerical
analyses it is rather not the initial behaviour of the material, but the stage in which it
reaches its yield strength which is investigated. Thanks to the level of 0.4 𝑓𝑐𝑚 there
are fewer problems with solution convergence. Having defined the yield stress-
inelastic strain pair of variables, one needs to define now degradation variable 𝑑𝑐. It

75
ranges from zero for an undamaged material to one for the total loss of load-bearing
capacity. These values can also be obtained from uniaxial compression tests, by
calculating the ratio of the stress for the declining part of the curve to the
compressive strength of the concrete. Thanks to the above definition the CDP model
allows one to calculate plastic strain from the formula:
휀𝑐~𝑝𝑙
= 휀𝑐~𝑖𝑛 −
𝑑𝑐
1−𝑑𝑐
𝜎𝑐
𝐸0 (4-6)
where 𝐸0 stands for the initial modulus of elasticity for the undamaged material.
Knowing the plastic strain and having determined the flow and failure surface area
one can calculate stress 𝜎𝑐 for uniaxial compression and its effective stress 𝑐.
𝜎𝑐 = (1 − 𝑑𝑐) 𝐸0 (휀𝑐 − 휀𝑐~𝑝𝑙
) (4-7)
𝑐 =𝜎𝑐
(1−𝑑𝑐)= 𝐸0(휀𝑐 − 휀𝑐
~𝑝𝑙) (4-8)
4.4.1 Plotting stress-strain curve without detailed laboratory test results
On the basis of uniaxial compression test results one can accurately determine the
way in which the material behaved. However, a problem arises when the person
running such a numerical simulation has no such test results or when the analysis is
performed for a new structure. Then often the only available quantity is the average
compressive strength (𝑓𝑐𝑚) of the concrete. Another quantity which must be known
in order to begin an analysis of the stress-strain curve is the longitudinal modulus of
elasticity (𝐸𝑐𝑚) of the concrete. Its value can be calculated using the relations
available in the literature (2):
𝐸𝑐𝑚 = 22(0.1𝑓𝑐𝑚)0.3 (4-9)
Where:
𝐸𝑐𝑚[𝐺𝑃𝑎]
𝑓𝑐𝑚[𝑀𝑃𝑎]
Other values defining the location of characteristic points on the graph are strain 휀𝑐1
at average compressive strength and ultimate strain 휀𝑐𝑢 (2):
휀𝑐1 = 0.7 (𝑓𝑐𝑚)0.31 (4-10)
휀𝑐𝑢 = 3.5 ‰ (4-11)

76
On the basis of experimental results, Majewski proposed the following (quite
accurate) approximating formulas:
휀𝑐1 = 0.0014 [2 − exp(−0.024𝑓𝑐𝑚) − exp(−0.140𝑓𝑐𝑚)] (4-12)
휀𝑐𝑢 = 0.004 − 0.0011[1 − exp(−0.0215𝑓𝑐𝑚)] (4-13)
Knowing the values of the above one can determine the points which the graph
should intersect (2).
Fig.4.7 Stress-strain diagram for analysis of structures, according to Eurocode 2
Choosing a proper formula form to describe relation 𝜎𝑐 − 휀𝑐 one should note
whether the longitudinal modulus of elasticity represents initial value
𝐸𝑐 ( 𝑎𝑡 𝑠𝑡𝑟𝑒𝑠𝑠 𝜎𝑐 = 0), or that of secant modulus 𝐸𝑐𝑚. Most of the formulas use
initial modulus 𝐸𝑐 which is neither experimentally determined nor taken from the
standards. Another important factor is the functional dependence itself. Even though
the Madrid parabola has been recognized as a good relation by CEB (Comité Euro-
International du Béton), this function is not flexible enough to correctly describe the
performance of concrete (2).
Madrid parabola
𝜎𝑐 = 𝐸𝑐휀𝑐 [1 −1
2(
𝜀𝑐
𝜀𝑐1)], 𝜎𝑐 = 𝑓(𝐸𝑐 , 휀𝑐1) (4-14)
Desay & Krishnan formula

77
𝜎𝑐 =𝐸𝑐𝜀𝑐
1+(𝜀𝑐
𝜀𝑐1)
2 , 𝜎𝑐 = 𝑓(𝐸𝑐 , 휀𝑐1) (4-15)
EN 1992-1-1
𝜎𝑐 = 𝑓𝑐𝑚𝑘𝜂−𝜂2
1+(𝑘−2) , 𝑘 = 1.05𝐸𝑐𝑚
𝜀𝑐1
𝑓𝑐𝑚 , 𝜂 =
𝜀𝑐
𝜀𝑐1 , 𝜎𝑐 = 𝑓(𝐸𝑐𝑚, 𝑓𝑐𝑚, 휀𝑐1) (4-16)
Majewski formula
𝜎𝑐 = 𝐸𝑐휀𝑐 𝑖𝑓 𝜎𝑐 ≤ 𝑒𝑙𝑖𝑚𝑓𝑐𝑚
𝜎𝑐 = 𝑓𝑐𝑚(𝑒𝑙𝑖𝑚−2)2
4(𝑒𝑙𝑖𝑚−1)(
𝜀𝑐
𝜀𝑐1)
2+ 𝑓𝑐𝑚
(𝑒𝑙𝑖𝑚−2)2
2(𝑒𝑙𝑖𝑚−1)(
𝜀𝑐
𝜀𝑐1) + 𝑓𝑐𝑚
𝑒𝑙𝑖𝑚2
4(𝑒𝑙𝑖𝑚−1) 𝐸𝑐 =
𝑓𝑐𝑚
𝜀𝑐(2 − 𝑒𝑙𝑖𝑚) , 𝜎𝑐 = 𝑓(𝐸𝑐 , 𝑓𝑐𝑚 , 휀𝑐1) (4-17)
Sáenz formula
𝜎𝑐 =𝜀𝑐
𝐴+𝐵𝜀𝑐+𝐶𝜀𝑐2+𝐷𝜀𝑐
3 , 𝜎𝑐 =f (𝐸𝑐 , 𝑓𝑐𝑚 , 𝑓𝑐𝑢, 휀𝑐1, 휀𝑐𝑢1) (4-18)
Fig.4.8 Property of 2nd order parabola
The 2nd order parabola has this property that the tangent of the angle of a tangent
passing through a point on its branch, measured relative to the horizontal axis
passing through this point, is always double that of the angle measured as the
inclination of the secant passing through the same point and the extremum of the
parabola, relative to the same horizontal axis (2).
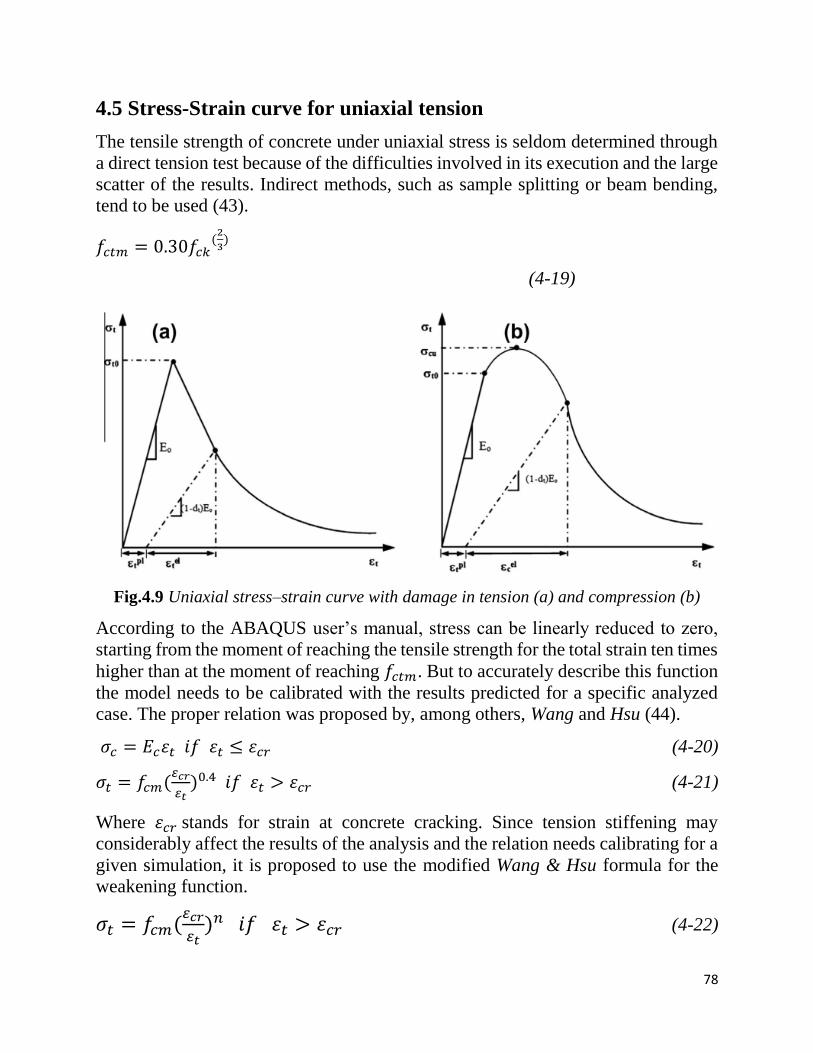
78
4.5 Stress-Strain curve for uniaxial tension
The tensile strength of concrete under uniaxial stress is seldom determined through
a direct tension test because of the difficulties involved in its execution and the large
scatter of the results. Indirect methods, such as sample splitting or beam bending,
tend to be used (43).
𝑓𝑐𝑡𝑚 = 0.30𝑓𝑐𝑘(
2
3)
(4-19)
Fig.4.9 Uniaxial stress–strain curve with damage in tension (a) and compression (b)
According to the ABAQUS user’s manual, stress can be linearly reduced to zero,
starting from the moment of reaching the tensile strength for the total strain ten times
higher than at the moment of reaching 𝑓𝑐𝑡𝑚. But to accurately describe this function
the model needs to be calibrated with the results predicted for a specific analyzed
case. The proper relation was proposed by, among others, Wang and Hsu (44).
𝜎𝑐 = 𝐸𝑐휀𝑡 𝑖𝑓 휀𝑡 ≤ 휀𝑐𝑟 (4-20)
𝜎𝑡 = 𝑓𝑐𝑚(𝜀𝑐𝑟
𝜀𝑡)0.4 𝑖𝑓 휀𝑡 > 휀𝑐𝑟 (4-21)
Where 휀𝑐𝑟 stands for strain at concrete cracking. Since tension stiffening may
considerably affect the results of the analysis and the relation needs calibrating for a
given simulation, it is proposed to use the modified Wang & Hsu formula for the
weakening function.
𝜎𝑡 = 𝑓𝑐𝑚(𝜀𝑐𝑟
𝜀𝑡)𝑛 𝑖𝑓 휀𝑡 > 휀𝑐𝑟 (4-22)
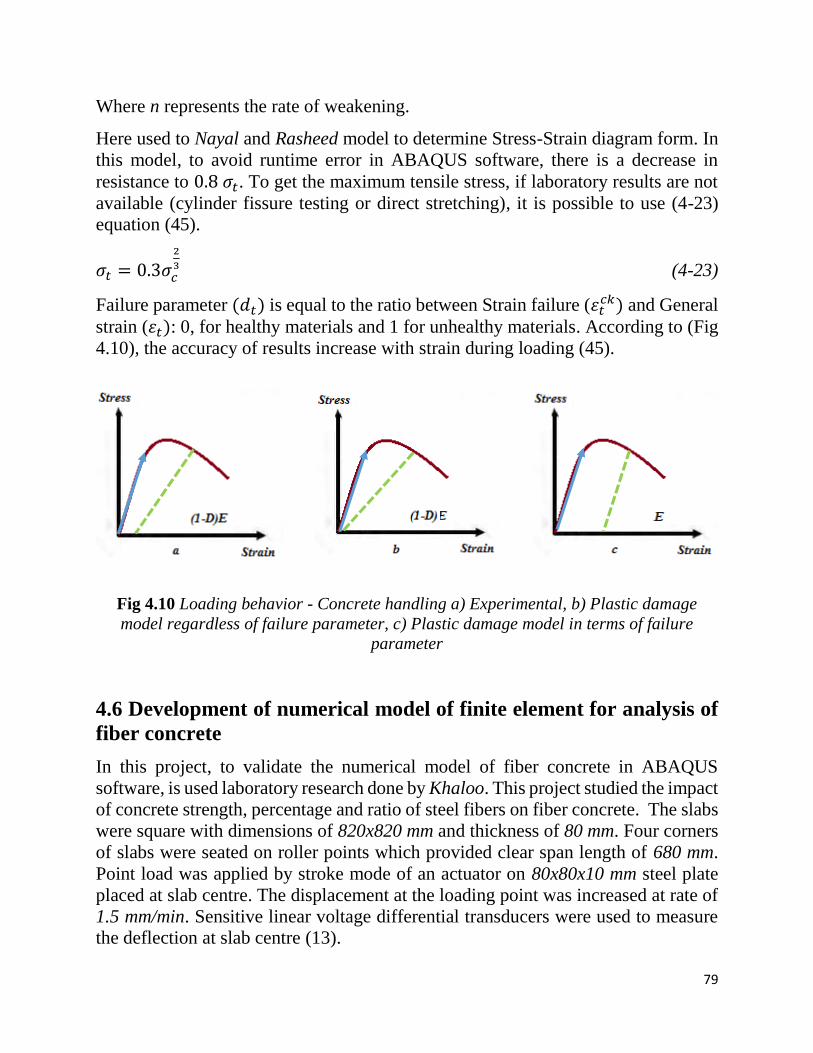
79
Where n represents the rate of weakening.
Here used to Nayal and Rasheed model to determine Stress-Strain diagram form. In
this model, to avoid runtime error in ABAQUS software, there is a decrease in
resistance to 0.8 𝜎𝑡. To get the maximum tensile stress, if laboratory results are not
available (cylinder fissure testing or direct stretching), it is possible to use (4-23)
equation (45).
𝜎𝑡 = 0.3𝜎𝑐
2
3 (4-23)
Failure parameter (𝑑𝑡) is equal to the ratio between Strain failure (휀𝑡𝑐𝑘) and General
strain (휀𝑡): 0, for healthy materials and 1 for unhealthy materials. According to (Fig
4.10), the accuracy of results increase with strain during loading (45).
Fig 4.10 Loading behavior - Concrete handling a) Experimental, b) Plastic damage
model regardless of failure parameter, c) Plastic damage model in terms of failure
parameter
4.6 Development of numerical model of finite element for analysis of
fiber concrete
In this project, to validate the numerical model of fiber concrete in ABAQUS
software, is used laboratory research done by Khaloo. This project studied the impact
of concrete strength, percentage and ratio of steel fibers on fiber concrete. The slabs
were square with dimensions of 820x820 mm and thickness of 80 mm. Four corners
of slabs were seated on roller points which provided clear span length of 680 mm.
Point load was applied by stroke mode of an actuator on 80x80x10 mm steel plate
placed at slab centre. The displacement at the loading point was increased at rate of
1.5 mm/min. Sensitive linear voltage differential transducers were used to measure
the deflection at slab centre (13).

80
Fig. 4.11 Four corners of slabs are seated on roller points which provided clear span
This laboratory has used percentages in volume of 0.5,1.0, and 1.5 in combination
with concrete as specified in table 4.1.
Table 4.1 Specifications of the fiber used in concrete slabs
For fibers with Jc25 the ratios are:
𝑑𝑓2 =
𝑇∗𝑊
𝜋 4⁄ (4-23)
𝑑𝑓 = √4∗𝑇∗𝑊
𝜋 (4-24)
The values are expressed as a percentage of the mortar volume, i.e. the mean the
concrete volume minus coarse grain or gravel. The fiber calculation method is
presented below.
Steel specific weigth = 7850 𝑘𝑔 𝑚3⁄ .
Sand grain specific weigth = 2760 𝑘𝑔 𝑚3⁄ .
Gravel volume of concrete in a cubuc meter = 1000
2760= 0.362.
Type of Fiber Length (L) Width (W) Thickness (T) Equivalent
Diameter (𝒅𝒇)
Aspect Ratio
𝑳 𝒅𝒇⁄
Jc25 25 0.8 0.35 0.597 41.9
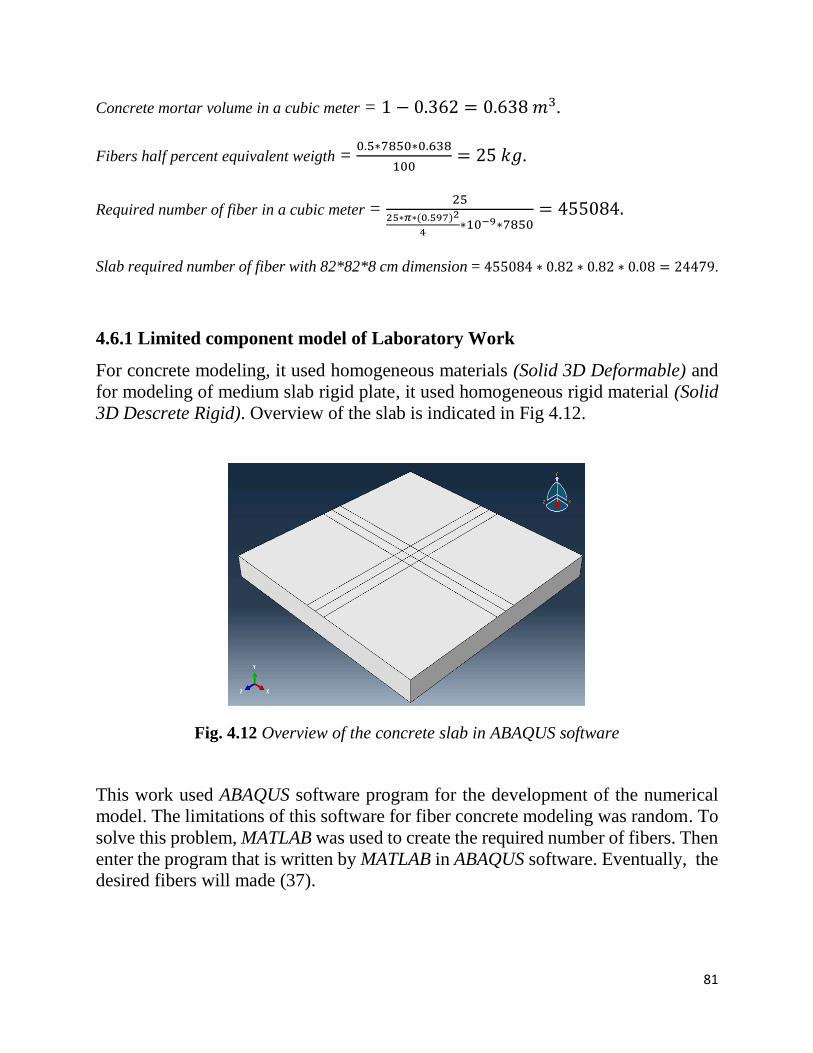
81
Concrete mortar volume in a cubic meter = 1 − 0.362 = 0.638 𝑚3.
Fibers half percent equivalent weigth = 0.5∗7850∗0.638
100= 25 𝑘𝑔.
Required number of fiber in a cubic meter = 25
25∗𝜋∗(0.597)2
4∗10−9∗7850
= 455084.
Slab required number of fiber with 82*82*8 cm dimension = 455084 ∗ 0.82 ∗ 0.82 ∗ 0.08 = 24479.
4.6.1 Limited component model of Laboratory Work
For concrete modeling, it used homogeneous materials (Solid 3D Deformable) and
for modeling of medium slab rigid plate, it used homogeneous rigid material (Solid
3D Descrete Rigid). Overview of the slab is indicated in Fig 4.12.
Fig. 4.12 Overview of the concrete slab in ABAQUS software
This work used ABAQUS software program for the development of the numerical
model. The limitations of this software for fiber concrete modeling was random. To
solve this problem, MATLAB was used to create the required number of fibers. Then
enter the program that is written by MATLAB in ABAQUS software. Eventually, the
desired fibers will made (37).
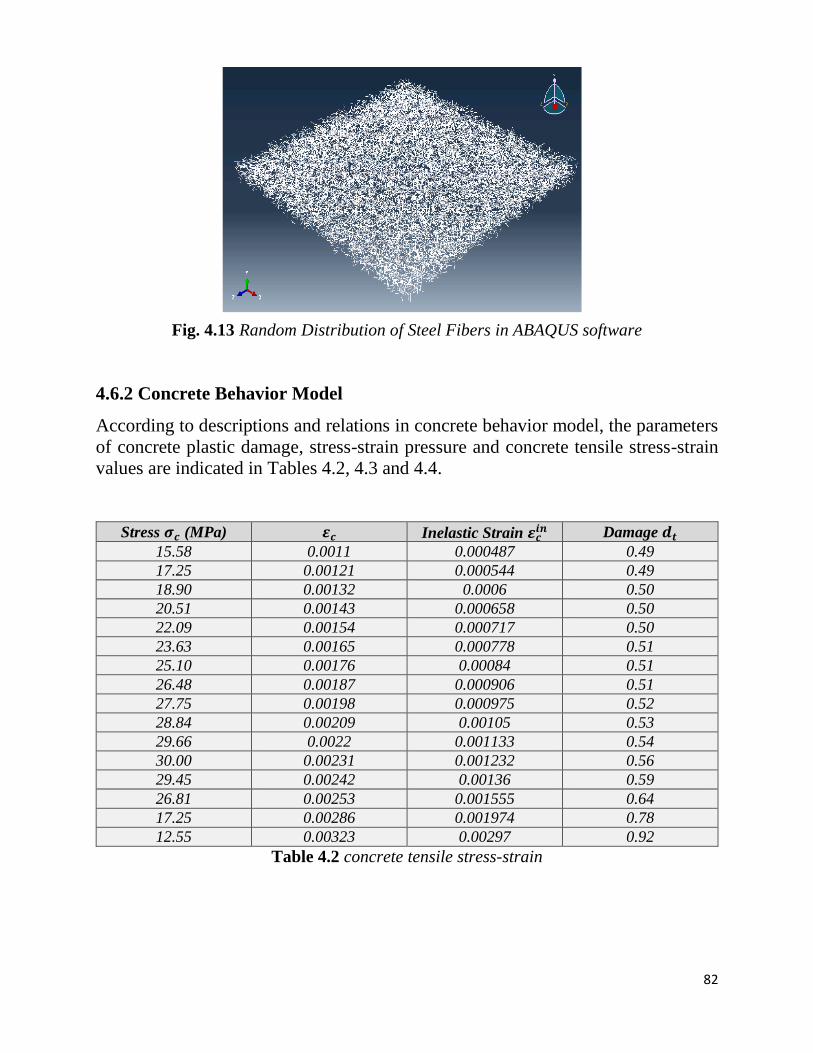
82
Fig. 4.13 Random Distribution of Steel Fibers in ABAQUS software
4.6.2 Concrete Behavior Model
According to descriptions and relations in concrete behavior model, the parameters
of concrete plastic damage, stress-strain pressure and concrete tensile stress-strain
values are indicated in Tables 4.2, 4.3 and 4.4.
Stress 𝝈𝒄 (MPa) 𝜺𝒄 Inelastic Strain 𝜺𝒄𝒊𝒏 Damage 𝒅𝒕
15.58 0.0011 0.000487 0.49
17.25 0.00121 0.000544 0.49
18.90 0.00132 0.0006 0.50
20.51 0.00143 0.000658 0.50
22.09 0.00154 0.000717 0.50
23.63 0.00165 0.000778 0.51
25.10 0.00176 0.00084 0.51
26.48 0.00187 0.000906 0.51
27.75 0.00198 0.000975 0.52
28.84 0.00209 0.00105 0.53
29.66 0.0022 0.001133 0.54
30.00 0.00231 0.001232 0.56
29.45 0.00242 0.00136 0.59
26.81 0.00253 0.001555 0.64
17.25 0.00286 0.001974 0.78
12.55 0.00323 0.00297 0.92
Table 4.2 concrete tensile stress-strain
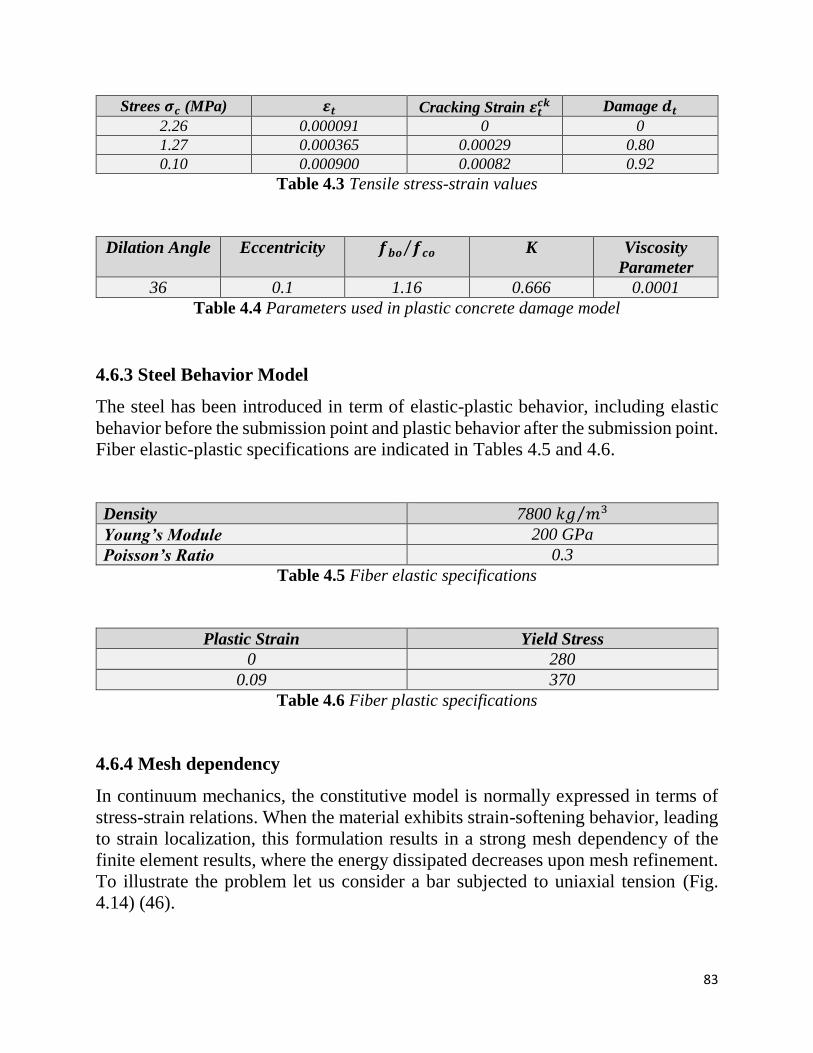
83
Strees 𝝈𝒄 (MPa) 𝜺𝒕 Cracking Strain 𝜺𝒕𝒄𝒌 Damage 𝒅𝒕
2.26 0.000091 0 0
1.27 0.000365 0.00029 0.80
0.10 0.000900 0.00082 0.92
Table 4.3 Tensile stress-strain values
Dilation Angle Eccentricity 𝒇𝒃𝒐 𝒇𝒄𝒐⁄ K Viscosity
Parameter
36 0.1 1.16 0.666 0.0001
Table 4.4 Parameters used in plastic concrete damage model
4.6.3 Steel Behavior Model
The steel has been introduced in term of elastic-plastic behavior, including elastic
behavior before the submission point and plastic behavior after the submission point.
Fiber elastic-plastic specifications are indicated in Tables 4.5 and 4.6.
Density 7800 𝑘𝑔 𝑚3⁄
Young’s Module 200 GPa
Poisson’s Ratio 0.3
Table 4.5 Fiber elastic specifications
Plastic Strain Yield Stress
0 280
0.09 370
Table 4.6 Fiber plastic specifications
4.6.4 Mesh dependency
In continuum mechanics, the constitutive model is normally expressed in terms of
stress-strain relations. When the material exhibits strain-softening behavior, leading
to strain localization, this formulation results in a strong mesh dependency of the
finite element results, where the energy dissipated decreases upon mesh refinement.
To illustrate the problem let us consider a bar subjected to uniaxial tension (Fig.
4.14) (46).
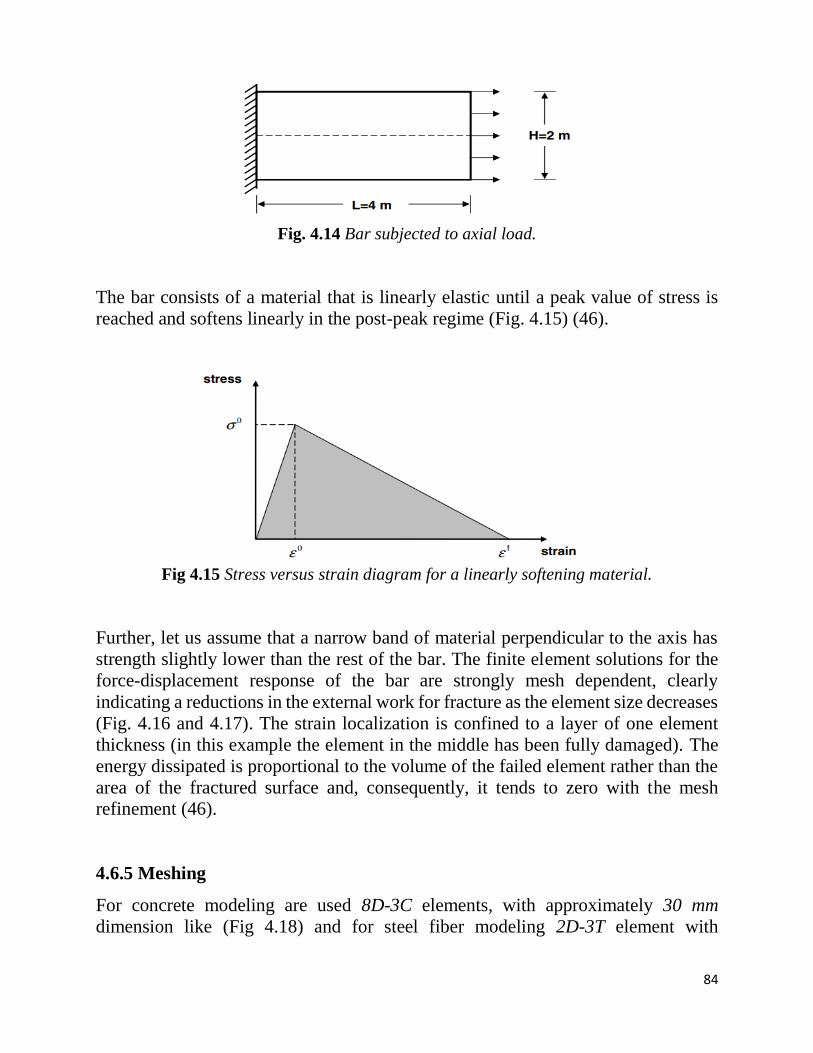
84
Fig. 4.14 Bar subjected to axial load.
The bar consists of a material that is linearly elastic until a peak value of stress is
reached and softens linearly in the post-peak regime (Fig. 4.15) (46).
Fig 4.15 Stress versus strain diagram for a linearly softening material.
Further, let us assume that a narrow band of material perpendicular to the axis has
strength slightly lower than the rest of the bar. The finite element solutions for the
force-displacement response of the bar are strongly mesh dependent, clearly
indicating a reductions in the external work for fracture as the element size decreases
(Fig. 4.16 and 4.17). The strain localization is confined to a layer of one element
thickness (in this example the element in the middle has been fully damaged). The
energy dissipated is proportional to the volume of the failed element rather than the
area of the fractured surface and, consequently, it tends to zero with the mesh
refinement (46).
4.6.5 Meshing
For concrete modeling are used 8D-3C elements, with approximately 30 mm
dimension like (Fig 4.18) and for steel fiber modeling 2D-3T element with
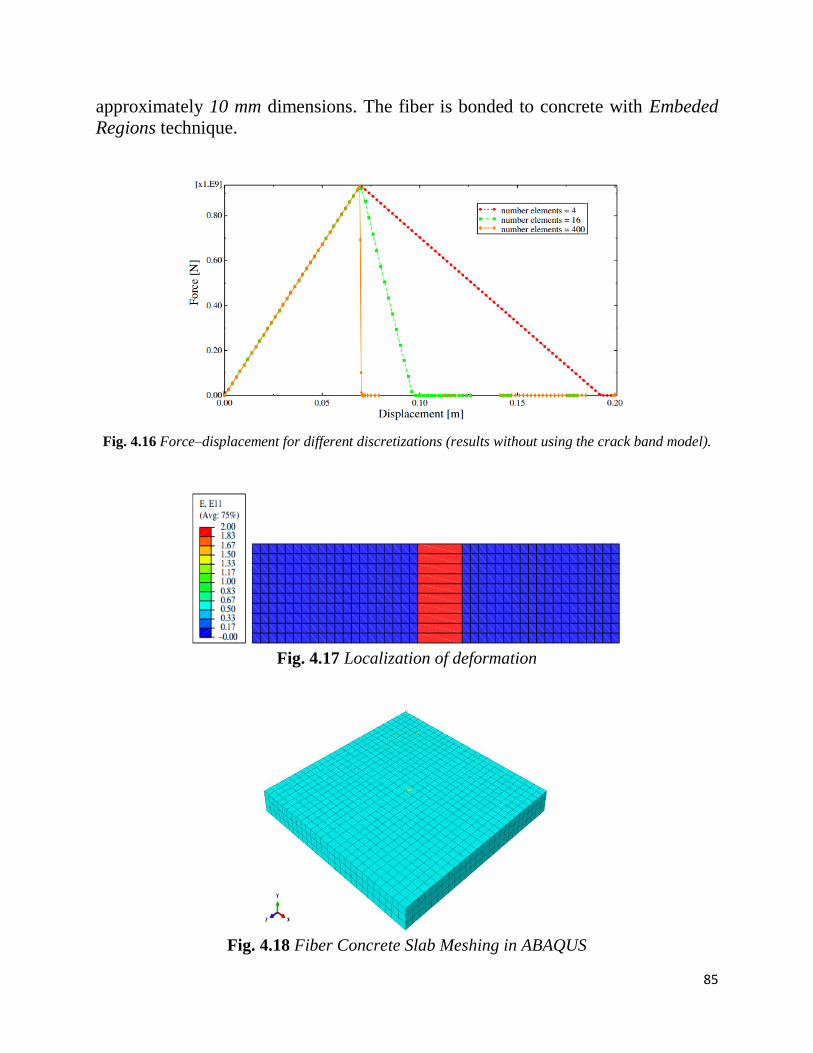
85
approximately 10 mm dimensions. The fiber is bonded to concrete with Embeded Regions technique.
Fig. 4.16 Force–displacement for different discretizations (results without using the crack band model).
Fig. 4.17 Localization of deformation
Fig. 4.18 Fiber Concrete Slab Meshing in ABAQUS

86
4.7 Examining and analyzing test results and comparison of
laboratory results with numerical modeling results
4.7.1 Slab Failure Mode
According to Fig. 4.19 and 4.20, the laboratory failure mode is creating a rupture
from the middle of the slab to both sides.
Fig. 4.19 Concrete Tension Distribution of Fiber Concrete Slab
Fig. 4.20 Distribution of steel fiber tension in Fiber Concrete Slab
Zone 1
Zone 2
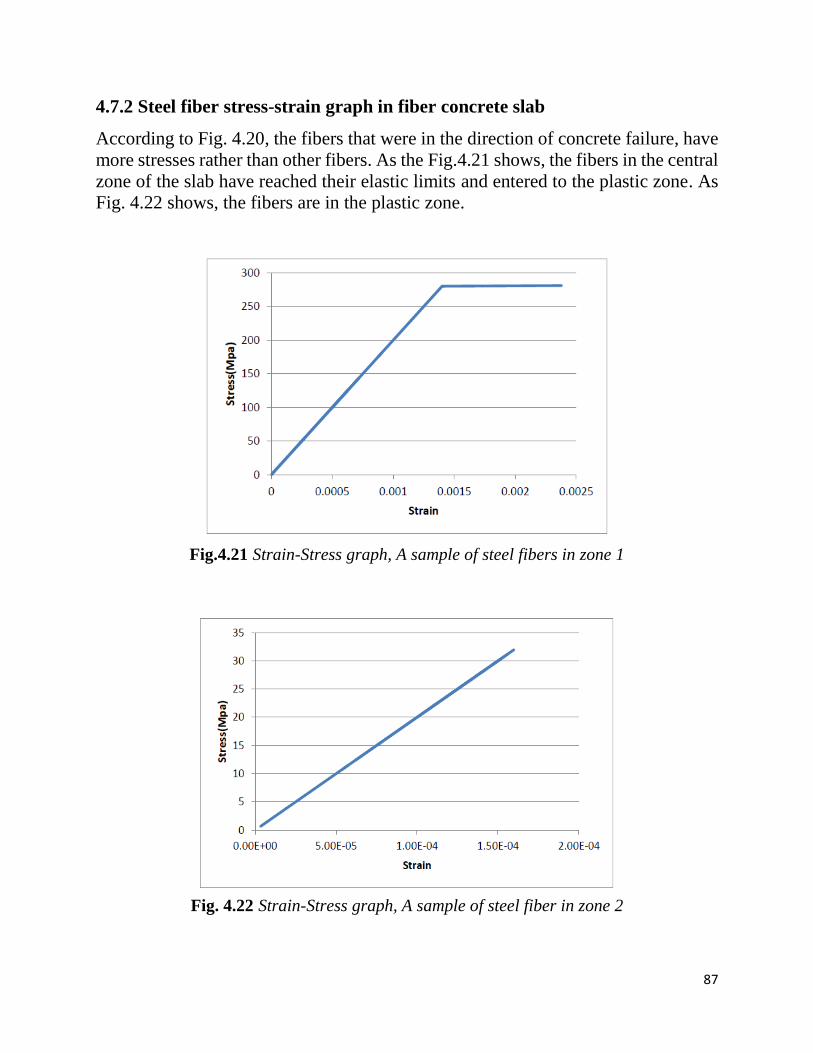
87
4.7.2 Steel fiber stress-strain graph in fiber concrete slab
According to Fig. 4.20, the fibers that were in the direction of concrete failure, have
more stresses rather than other fibers. As the Fig.4.21 shows, the fibers in the central
zone of the slab have reached their elastic limits and entered to the plastic zone. As
Fig. 4.22 shows, the fibers are in the plastic zone.
Fig.4.21 Strain-Stress graph, A sample of steel fibers in zone 1
Fig. 4.22 Strain-Stress graph, A sample of steel fiber in zone 2
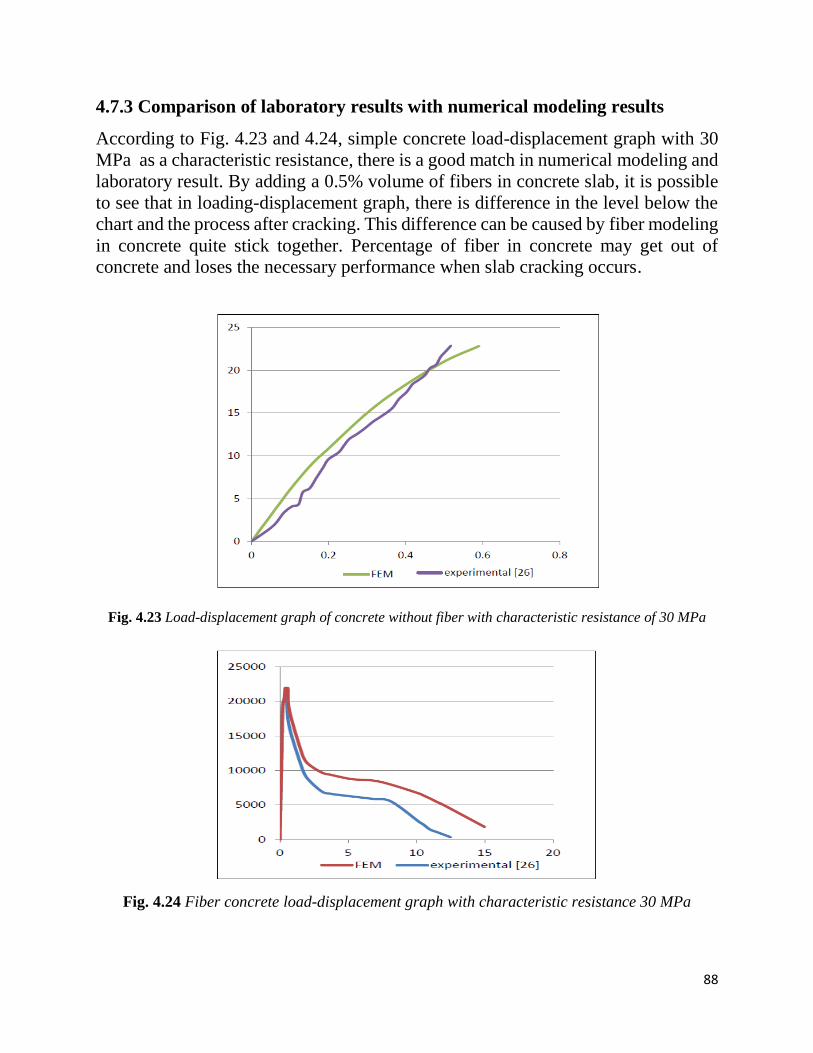
88
4.7.3 Comparison of laboratory results with numerical modeling results
According to Fig. 4.23 and 4.24, simple concrete load-displacement graph with 30
MPa as a characteristic resistance, there is a good match in numerical modeling and
laboratory result. By adding a 0.5% volume of fibers in concrete slab, it is possible
to see that in loading-displacement graph, there is difference in the level below the
chart and the process after cracking. This difference can be caused by fiber modeling
in concrete quite stick together. Percentage of fiber in concrete may get out of
concrete and loses the necessary performance when slab cracking occurs.
Fig. 4.23 Load-displacement graph of concrete without fiber with characteristic resistance of 30 MPa
Fig. 4.24 Fiber concrete load-displacement graph with characteristic resistance 30 MPa

89
4.8 Conclusion
According to the results of numerical analysis of fiber concrete slab, available
laboratory results and differences between these due to distension of fibers in
laboratory work, the results of numerical analysis were globally satisfactory. They
can be used as numerical model of the slab in railroad applications with behavioral
models of concrete and fiber and in the validation model.
90
Chapter 5
Technical-economic review and the
possibility of using fiber concrete in the
slab line of railway lines

91
5.1 Introduction
This work presents a material model which can be used to simulate the non-linear
behaviour of reinforced concrete elements. The material model needs only the
maximum compressive strength of the concrete and utilise two numerical techniques
to derive stresses train curves both at compression and tension including softening
regimes. Necessary modifications are suggested to the above numerical techniques
to be applicable with ABAQUS damaged plasticity model to simulate damage in RC
structures. This material model is validated using experiment results available in the
literature with different material and structural arrangements. Result section
indicates that both displacement and crack patterns obtained from FEM are well
matched with the experiment results. Therefore, the above material model minimise
the number of tests needed to develop an accurate material model in FE simulation
(41).
The numerical technique used to develop the stress-strain relationship for tensile
region is acceptable for both reinforced and fibre reinforced concrete as reported by
Nayal and Rasheed (45). Though the present study focus only on reinforced concrete
elements, the similarity in the tension stiffening model may enable to adopt the
present material model with fibre reinforced concrete as well with minor parametric
changes. The stress-strain relation is capable of accurately representing the strain
softening regime as proven by Hsu, enabling to accurately simulate damage caused
by concrete crushing. Thus the material model presented can be applied for both
reinforced and fibre reinforced concrete elements to simulate or assess the damage
2due to both tensile cracking and concrete crushing. This thesis verifies the accuracy
of the proposed material model using experiment results for reinforced concrete
elements subjected to flexural loading and tensile cracking (47).
The behavioral model of fiber and concrete with length of 6 meters, explained in the
previous chapter require computer systems with high memory, therefore, it is
decided to decrease the length of the slab line: by comparing the results of shear
force and bending anchor, it is selected 3 meters for the modeling. Then it is possible
to model fiber concrete and concrete without fiber slab lines in ABAQUS. In
comparison of results between slabs with fibers, without fibers and lack of fiber
effect on slab line incoming forces on service loads, continue working took place on
the SAP software without fiber.
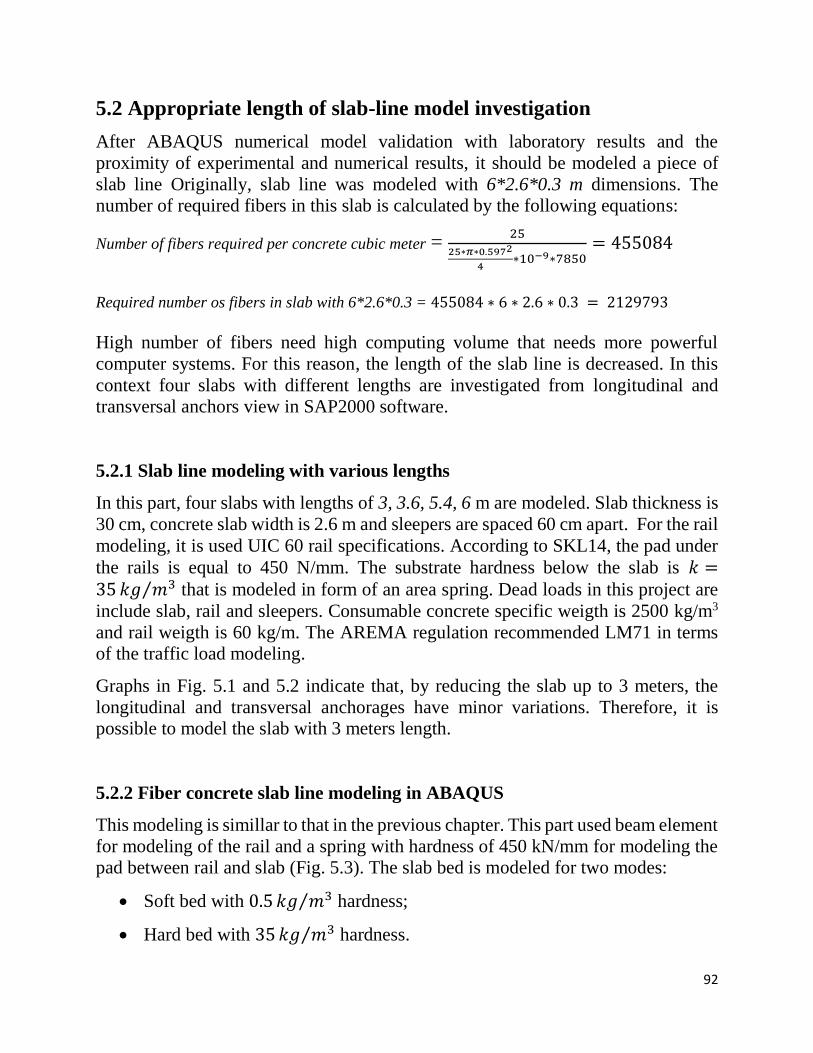
92
5.2 Appropriate length of slab-line model investigation
After ABAQUS numerical model validation with laboratory results and the
proximity of experimental and numerical results, it should be modeled a piece of
slab line Originally, slab line was modeled with 6*2.6*0.3 m dimensions. The
number of required fibers in this slab is calculated by the following equations:
Number of fibers required per concrete cubic meter = 25
25∗𝜋∗0.5972
4∗10−9∗7850
= 455084
Required number os fibers in slab with 6*2.6*0.3 = 455084 ∗ 6 ∗ 2.6 ∗ 0.3 = 2129793
High number of fibers need high computing volume that needs more powerful
computer systems. For this reason, the length of the slab line is decreased. In this
context four slabs with different lengths are investigated from longitudinal and
transversal anchors view in SAP2000 software.
5.2.1 Slab line modeling with various lengths
In this part, four slabs with lengths of 3, 3.6, 5.4, 6 m are modeled. Slab thickness is
30 cm, concrete slab width is 2.6 m and sleepers are spaced 60 cm apart. For the rail
modeling, it is used UIC 60 rail specifications. According to SKL14, the pad under
the rails is equal to 450 N/mm. The substrate hardness below the slab is 𝑘 =35 𝑘𝑔 𝑚3⁄ that is modeled in form of an area spring. Dead loads in this project are
include slab, rail and sleepers. Consumable concrete specific weigth is 2500 kg/m3
and rail weigth is 60 kg/m. The AREMA regulation recommended LM71 in terms
of the traffic load modeling.
Graphs in Fig. 5.1 and 5.2 indicate that, by reducing the slab up to 3 meters, the
longitudinal and transversal anchorages have minor variations. Therefore, it is
possible to model the slab with 3 meters length.
5.2.2 Fiber concrete slab line modeling in ABAQUS
This modeling is simillar to that in the previous chapter. This part used beam element
for modeling of the rail and a spring with hardness of 450 kN/mm for modeling the
pad between rail and slab (Fig. 5.3). The slab bed is modeled for two modes:
Soft bed with 0.5 𝑘𝑔 𝑚3⁄ hardness;
Hard bed with 35 𝑘𝑔 𝑚3⁄ hardness.
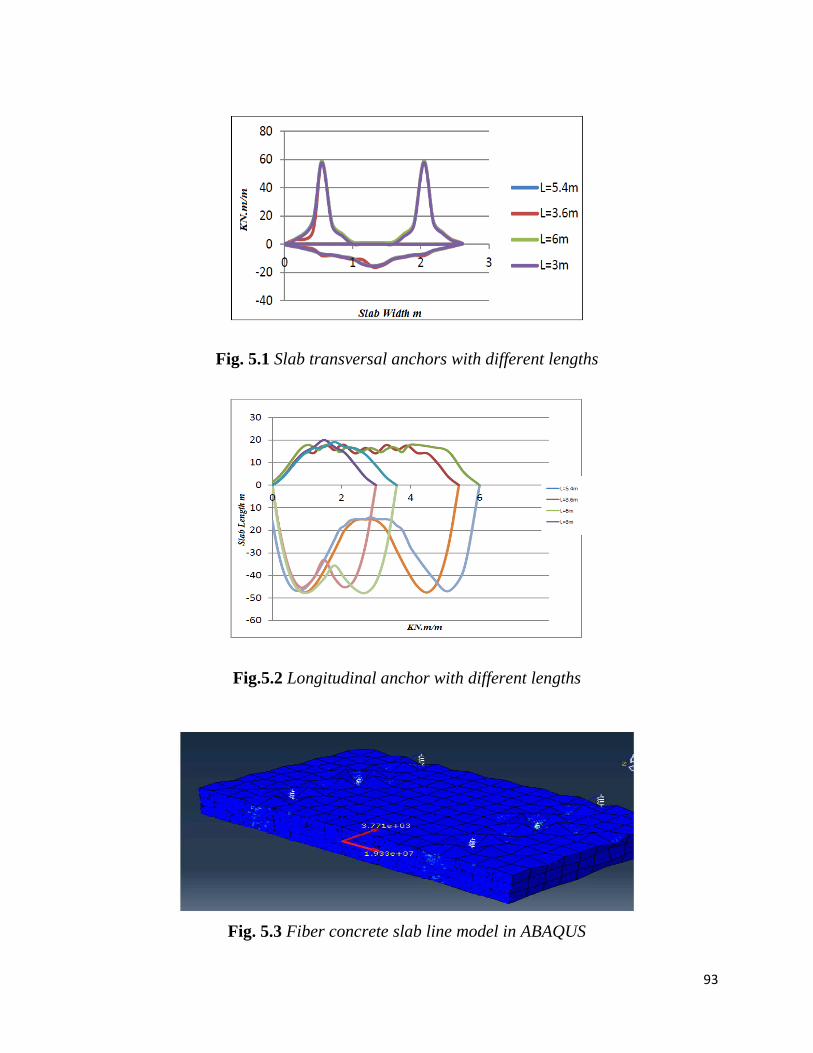
93
Fig. 5.1 Slab transversal anchors with different lengths
Fig.5.2 Longitudinal anchor with different lengths
Fig. 5.3 Fiber concrete slab line model in ABAQUS

94
5.2.3 Results comparison of slab lines ABAQUS numerical modeling in
concrete with and without fiber
The results are shown for fiber and no-fiber slab lines in two slab modes with K =
35 𝑘𝑔 𝑚3⁄ (Fig. 5.4, 5.5, 5.6 and 5.7) and K = 0.5 𝑘𝑔 𝑚3⁄ hardness (Fig. 5.8, 5.9,
5.10 and 5.11).
Fig. 5.4 Longitudinal shear force of slab, with and without fiber - K = 35 kg/m3
Fig. 5.5 Transversal shear force of slab, with and without fiber - K = 35 kg/m3
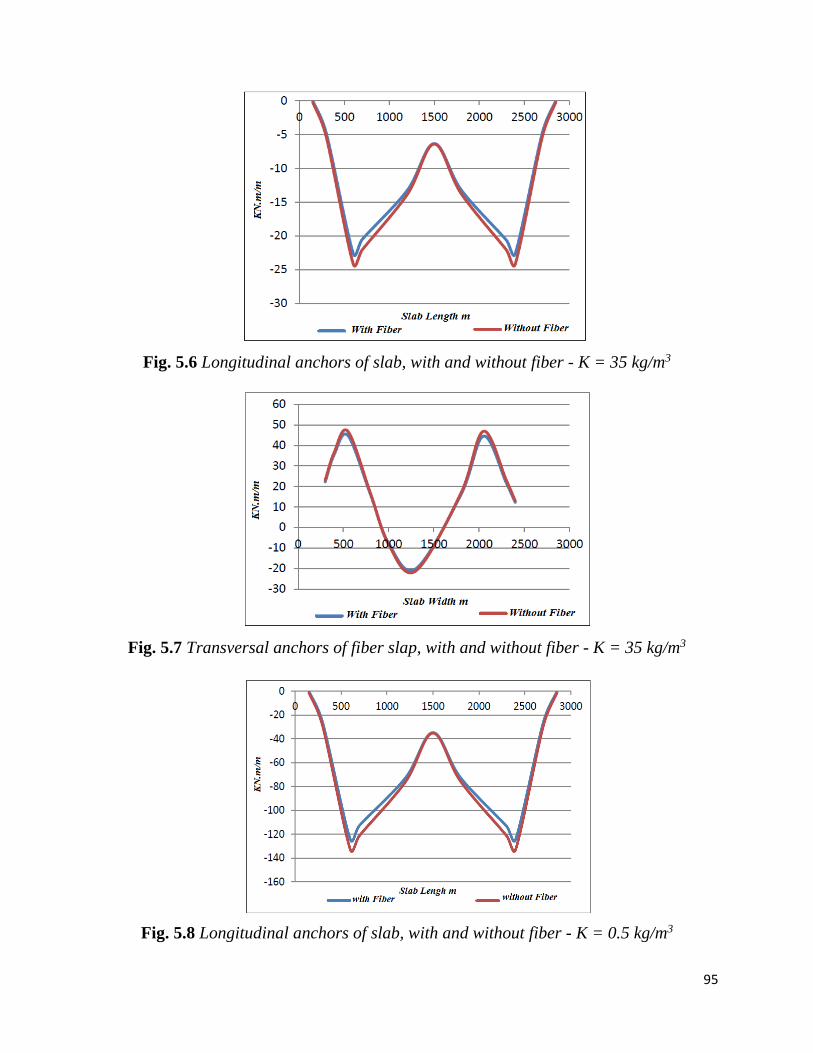
95
Fig. 5.6 Longitudinal anchors of slab, with and without fiber - K = 35 kg/m3
Fig. 5.7 Transversal anchors of fiber slap, with and without fiber - K = 35 kg/m3
Fig. 5.8 Longitudinal anchors of slab, with and without fiber - K = 0.5 kg/m3
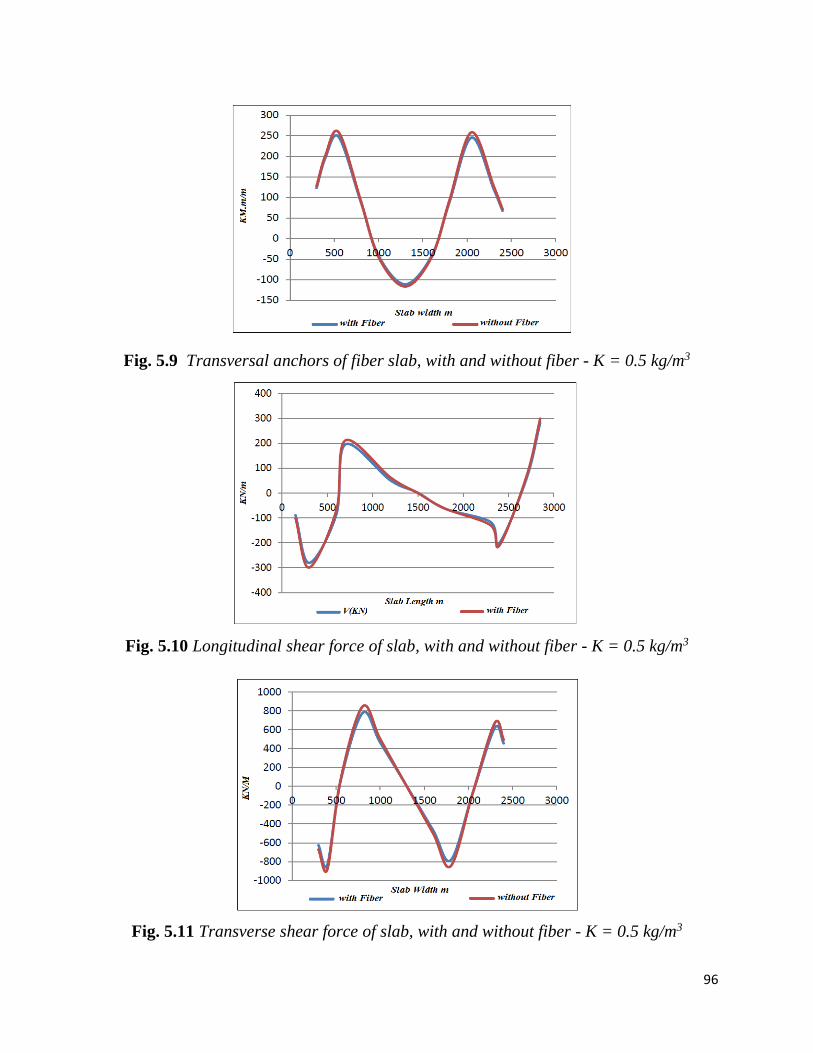
96
Fig. 5.9 Transversal anchors of fiber slab, with and without fiber - K = 0.5 kg/m3
Fig. 5.10 Longitudinal shear force of slab, with and without fiber - K = 0.5 kg/m3
Fig. 5.11 Transverse shear force of slab, with and without fiber - K = 0.5 kg/m3
97
5.3 Conclusion
Service loading results in fiber concrete slabs and concrete slab without fibers show
that increasing and adding fibers has no much impact in shear forces and bending
anchors. As a result, it can be used concrete slab line without fiber for analyzing and
designing fiber concrete slab.
5.4 Rail slab line analysis, flexural and shear forces
5.4.1 Characteristics of the slab line and introduction of applied loads
The scope is the investigation of a typical slab line on the soil bed. In order to provide
proper operation conditions and high safety, it is necessary to consider criteria and
assumptions of non-ballasted line system. Generally, the pavement system must
meet the following requirements:
Tolerate the operation loads in common operation and design speed;
Resist to dynamic effects and inmpacts caused by train movement;
Maintain its integrity without getting ruptures due to inner forces cretaed by
differential loading.
Loading
Loads on the pavement include:
Dead Load: it includes loads that are relatively constant over time, including
the weight of the structure itself and fixtures such as walls, plasterboard or
carpet. The roof is also a dead load. Dead loads are also known as permanent
or static loads. Building materials are not dead loads until constructed in
permanent position. The dead loads on the pavements include, bearing and
non-load bearing components (48). Here the dead loads include slab, rail and
sleepers. The consumable concrete specific weigth is 2500 kg/m3 and rail unit
weigth is 60 kg/m. It should be noted that the recommended amount in
Eurocode regulation is 25 for reinforced concrete specific weigth.
Live Load: it includes important components in each structural design
combination. These information are determined based on available statistics,
measurements, behavioral distributions, structural analysis and probability
theory. Live Load pattern has an important role in the design of the slab line
and different regulations have recommended patterns for it, depending on the
type of operation: passing vehicles, traffic volume, speed, maintenance
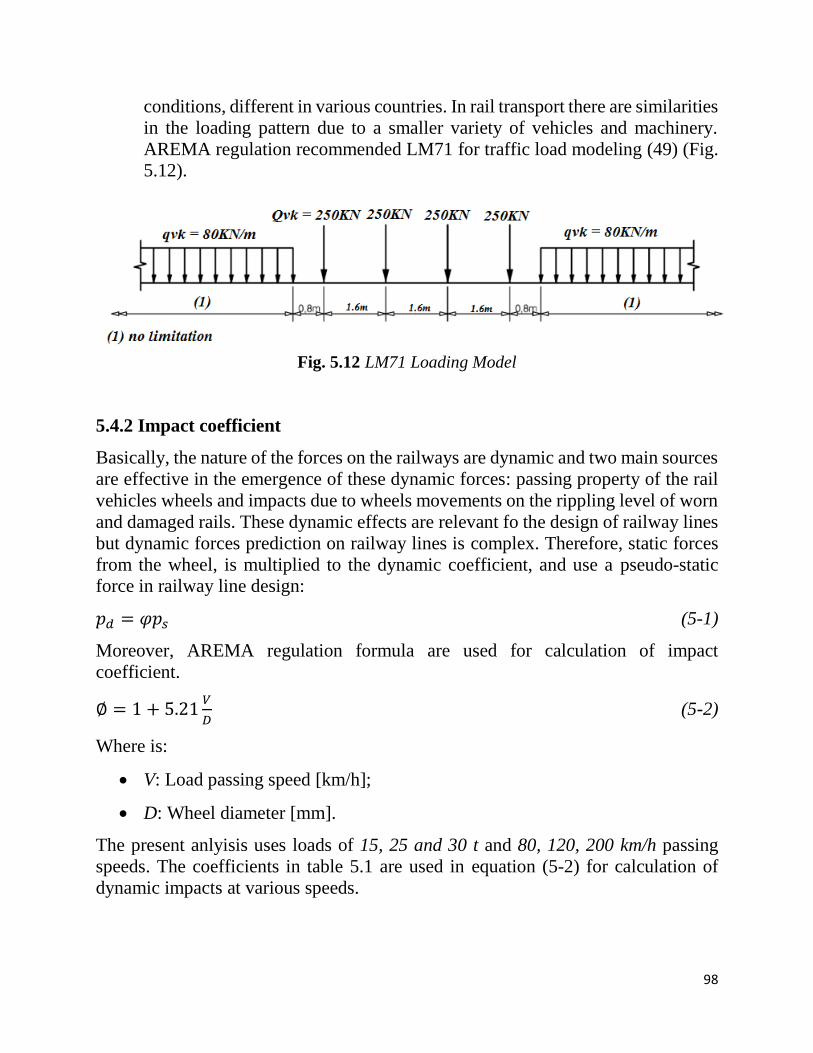
98
conditions, different in various countries. In rail transport there are similarities
in the loading pattern due to a smaller variety of vehicles and machinery.
AREMA regulation recommended LM71 for traffic load modeling (49) (Fig.
5.12).
Fig. 5.12 LM71 Loading Model
5.4.2 Impact coefficient
Basically, the nature of the forces on the railways are dynamic and two main sources
are effective in the emergence of these dynamic forces: passing property of the rail
vehicles wheels and impacts due to wheels movements on the rippling level of worn
and damaged rails. These dynamic effects are relevant fo the design of railway lines
but dynamic forces prediction on railway lines is complex. Therefore, static forces
from the wheel, is multiplied to the dynamic coefficient, and use a pseudo-static
force in railway line design:
𝑝𝑑 = 𝜑𝑝𝑠 (5-1)
Moreover, AREMA regulation formula are used for calculation of impact
coefficient.
∅ = 1 + 5.21𝑉
𝐷 (5-2)
Where is:
V: Load passing speed [km/h];
D: Wheel diameter [mm].
The present anlyisis uses loads of 15, 25 and 30 t and 80, 120, 200 km/h passing
speeds. The coefficients in table 5.1 are used in equation (5-2) for calculation of
dynamic impacts at various speeds.
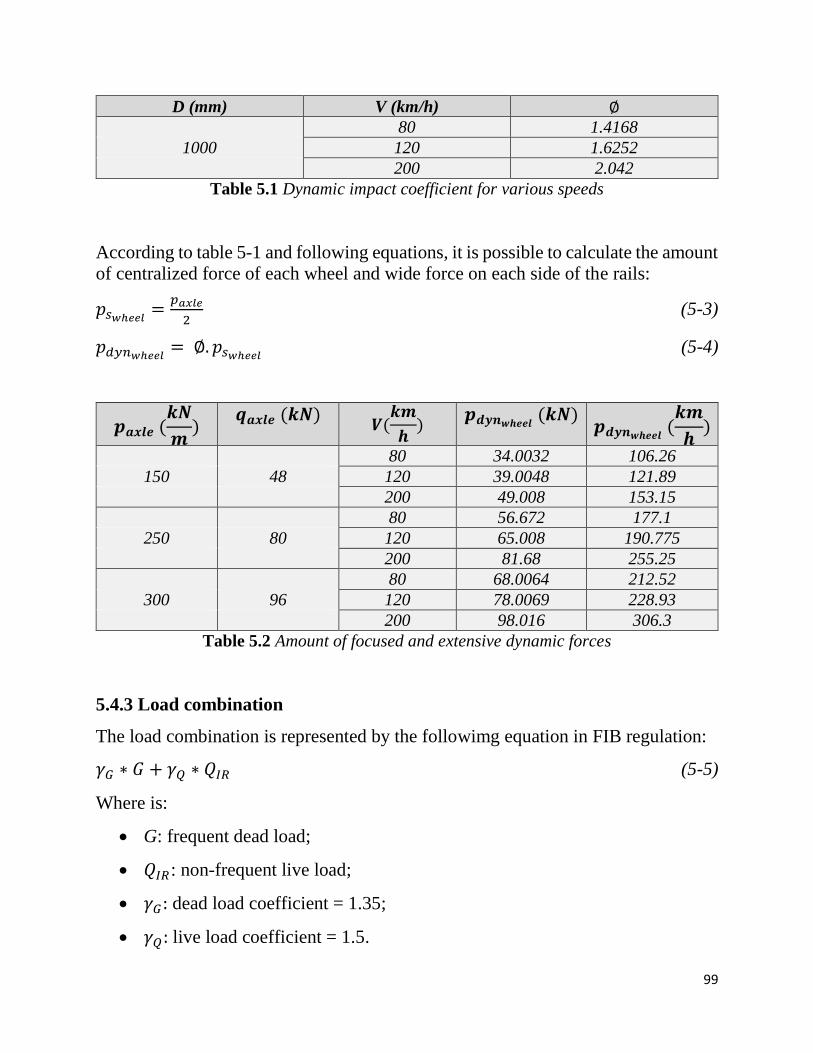
99
D (mm) V (km/h) ∅
80 1.4168
1000 120 1.6252
200 2.042
Table 5.1 Dynamic impact coefficient for various speeds
According to table 5-1 and following equations, it is possible to calculate the amount
of centralized force of each wheel and wide force on each side of the rails:
𝑝𝑠𝑤ℎ𝑒𝑒𝑙=
𝑝𝑎𝑥𝑙𝑒
2 (5-3)
𝑝𝑑𝑦𝑛𝑤ℎ𝑒𝑒𝑙= ∅. 𝑝𝑠𝑤ℎ𝑒𝑒𝑙
(5-4)
𝒑𝒂𝒙𝒍𝒆 (𝒌𝑵
𝒎)
𝒒𝒂𝒙𝒍𝒆 (𝒌𝑵) 𝑽(
𝒌𝒎
𝒉)
𝒑𝒅𝒚𝒏𝒘𝒉𝒆𝒆𝒍 (𝒌𝑵)
𝒑𝒅𝒚𝒏𝒘𝒉𝒆𝒆𝒍 (
𝒌𝒎
𝒉)
80 34.0032 106.26
150 48 120 39.0048 121.89
200 49.008 153.15
80 56.672 177.1
250 80 120 65.008 190.775
200 81.68 255.25
80 68.0064 212.52
300 96 120 78.0069 228.93
200 98.016 306.3
Table 5.2 Amount of focused and extensive dynamic forces
5.4.3 Load combination
The load combination is represented by the followimg equation in FIB regulation:
𝛾𝐺 ∗ 𝐺 + 𝛾𝑄 ∗ 𝑄𝐼𝑅 (5-5)
Where is:
G: frequent dead load;
𝑄𝐼𝑅: non-frequent live load;
𝛾𝐺: dead load coefficient = 1.35;
𝛾𝑄: live load coefficient = 1.5.
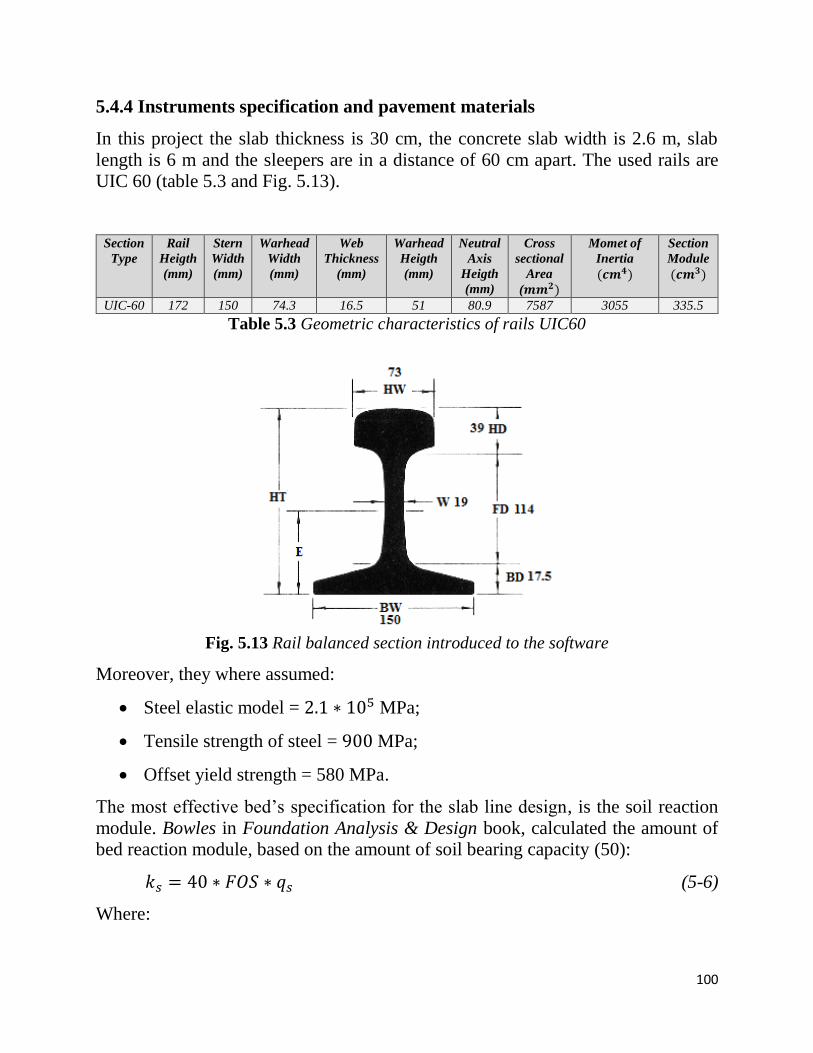
100
5.4.4 Instruments specification and pavement materials
In this project the slab thickness is 30 cm, the concrete slab width is 2.6 m, slab
length is 6 m and the sleepers are in a distance of 60 cm apart. The used rails are
UIC 60 (table 5.3 and Fig. 5.13).
Section
Type
Rail
Heigth
(mm)
Stern
Width
(mm)
Warhead
Width
(mm)
Web
Thickness
(mm)
Warhead
Heigth
(mm)
Neutral
Axis
Heigth
(mm)
Cross
sectional
Area
(𝒎𝒎𝟐)
Momet of
Inertia
(𝒄𝒎𝟒)
Section
Module
(𝒄𝒎𝟑)
UIC-60 172 150 74.3 16.5 51 80.9 7587 3055 335.5
Table 5.3 Geometric characteristics of rails UIC60
Fig. 5.13 Rail balanced section introduced to the software
Moreover, they where assumed:
Steel elastic model = 2.1 ∗ 105 MPa;
Tensile strength of steel = 900 MPa;
Offset yield strength = 580 MPa.
The most effective bed’s specification for the slab line design, is the soil reaction
module. Bowles in Foundation Analysis & Design book, calculated the amount of
bed reaction module, based on the amount of soil bearing capacity (50):
𝑘𝑠 = 40 ∗ 𝐹𝑂𝑆 ∗ 𝑞𝑠 (5-6)
Where:
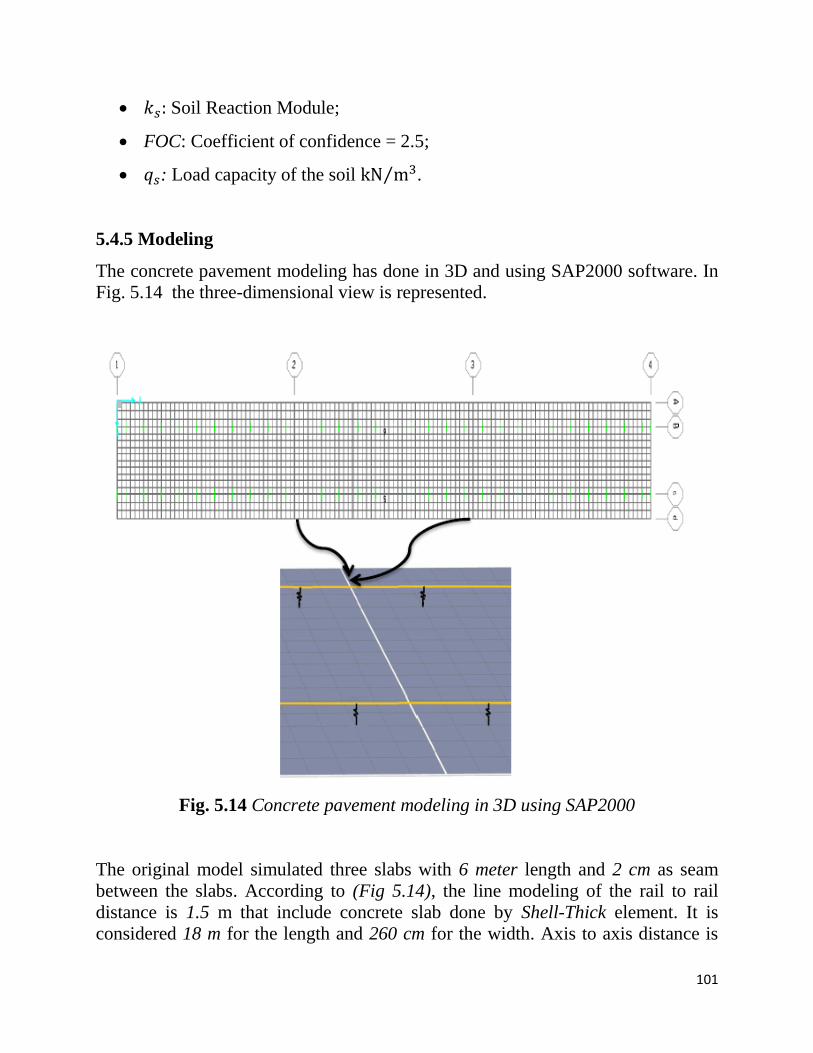
101
𝑘𝑠: Soil Reaction Module;
FOC: Coefficient of confidence = 2.5;
𝑞𝑠: Load capacity of the soil kN m3⁄ .
5.4.5 Modeling
The concrete pavement modeling has done in 3D and using SAP2000 software. In
Fig. 5.14 the three-dimensional view is represented.
Fig. 5.14 Concrete pavement modeling in 3D using SAP2000
The original model simulated three slabs with 6 meter length and 2 cm as seam
between the slabs. According to (Fig 5.14), the line modeling of the rail to rail
distance is 1.5 m that include concrete slab done by Shell-Thick element. It is
considered 18 m for the length and 260 cm for the width. Axis to axis distance is

102
considered 150 cm. After applying the hit coefficients, the moving load, moves on
the rails in two lanes. The rail connection to the concrete slab has done in 60 cm
distance with use of LINK element, a type of linear spring, which in the axial
direction include 450 kN/mm hardness. This hardness is equal to the pad hardness
under the rail, and are free in the other directions (50).
The level under the slab is identified in the software, in terms of spring areas: 1) Soft
= 5000, 2) Medium = 20000, 3) Hard = 100000.
5.4.6 Analysis of results: determination of shear and bending forces on slab line
According to the results (Fig. 5.15, 5.16, 5.17, 5.18 and 5.19), with increasing of
bed reaction coefficient, the longitudinal, transversal and shear moments on slab
lines will decrease a lot.
Fig. 5.15 Max longitudinal moment in combination of 1.35DL+1.5LL loads
Fig. 5.16 Results of transversal anchore, the axial load changing anf bed reaction
coefficient in constant speed 𝑉 = 120 𝐾𝑚/ℎ
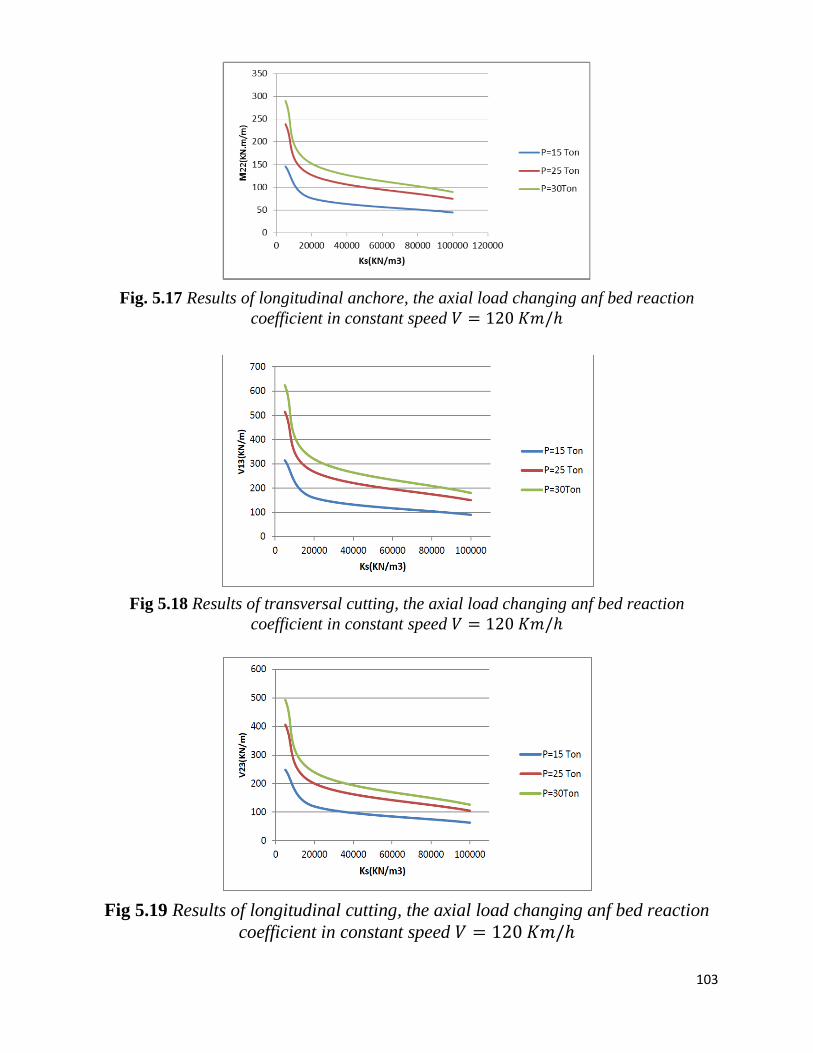
103
Fig. 5.17 Results of longitudinal anchore, the axial load changing anf bed reaction
coefficient in constant speed 𝑉 = 120 𝐾𝑚/ℎ
Fig 5.18 Results of transversal cutting, the axial load changing anf bed reaction
coefficient in constant speed 𝑉 = 120 𝐾𝑚/ℎ
Fig 5.19 Results of longitudinal cutting, the axial load changing anf bed reaction
coefficient in constant speed 𝑉 = 120 𝐾𝑚/ℎ
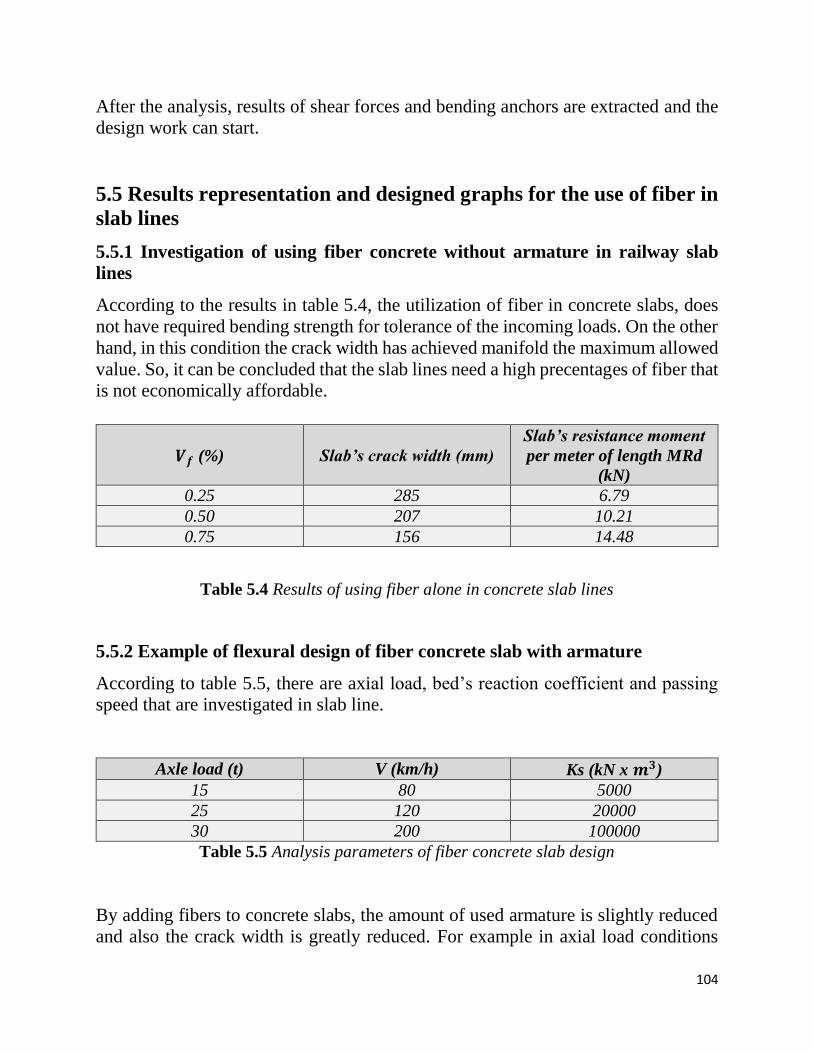
104
After the analysis, results of shear forces and bending anchors are extracted and the
design work can start.
5.5 Results representation and designed graphs for the use of fiber in
slab lines
5.5.1 Investigation of using fiber concrete without armature in railway slab
lines
According to the results in table 5.4, the utilization of fiber in concrete slabs, does
not have required bending strength for tolerance of the incoming loads. On the other
hand, in this condition the crack width has achieved manifold the maximum allowed
value. So, it can be concluded that the slab lines need a high precentages of fiber that
is not economically affordable.
Table 5.4 Results of using fiber alone in concrete slab lines
5.5.2 Example of flexural design of fiber concrete slab with armature
According to table 5.5, there are axial load, bed’s reaction coefficient and passing
speed that are investigated in slab line.
Axle load (t) V (km/h) Ks (kN x 𝒎𝟑)
15 80 5000
25 120 20000
30 200 100000
Table 5.5 Analysis parameters of fiber concrete slab design
By adding fibers to concrete slabs, the amount of used armature is slightly reduced
and also the crack width is greatly reduced. For example in axial load conditions
𝑽𝒇 (%)
Slab’s crack width (mm)
Slab’s resistance moment
per meter of length MRd
(kN)
0.25 285 6.79
0.50 207 10.21
0.75 156 14.48
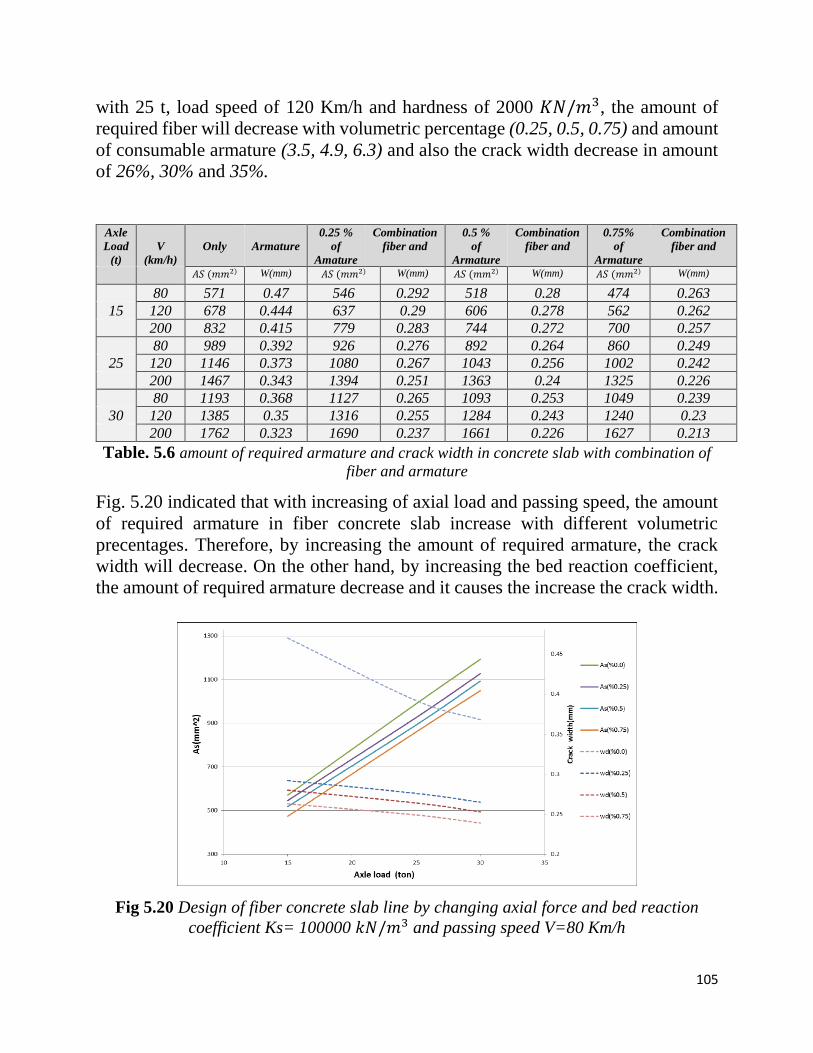
105
with 25 t, load speed of 120 Km/h and hardness of 2000 𝐾𝑁/𝑚3, the amount of
required fiber will decrease with volumetric percentage (0.25, 0.5, 0.75) and amount
of consumable armature (3.5, 4.9, 6.3) and also the crack width decrease in amount
of 26%, 30% and 35%.
Axle
Load
(t)
V
(km/h)
Only
Armature
0.25 %
of
Amature
Combination
fiber and
0.5 %
of
Armature
Combination
fiber and
0.75%
of
Armature
Combination
fiber and
𝐴𝑆 (𝑚𝑚2) W(mm) 𝐴𝑆 (𝑚𝑚2) W(mm) 𝐴𝑆 (𝑚𝑚2) W(mm) 𝐴𝑆 (𝑚𝑚2) W(mm)
80 571 0.47 546 0.292 518 0.28 474 0.263
15 120 678 0.444 637 0.29 606 0.278 562 0.262
200 832 0.415 779 0.283 744 0.272 700 0.257
80 989 0.392 926 0.276 892 0.264 860 0.249
25 120 1146 0.373 1080 0.267 1043 0.256 1002 0.242
200 1467 0.343 1394 0.251 1363 0.24 1325 0.226
80 1193 0.368 1127 0.265 1093 0.253 1049 0.239
30 120 1385 0.35 1316 0.255 1284 0.243 1240 0.23
200 1762 0.323 1690 0.237 1661 0.226 1627 0.213
Table. 5.6 amount of required armature and crack width in concrete slab with combination of
fiber and armature
Fig. 5.20 indicated that with increasing of axial load and passing speed, the amount
of required armature in fiber concrete slab increase with different volumetric
precentages. Therefore, by increasing the amount of required armature, the crack
width will decrease. On the other hand, by increasing the bed reaction coefficient,
the amount of required armature decrease and it causes the increase the crack width.
Fig 5.20 Design of fiber concrete slab line by changing axial force and bed reaction
coefficient Ks= 100000 𝑘𝑁/𝑚3 and passing speed V=80 Km/h
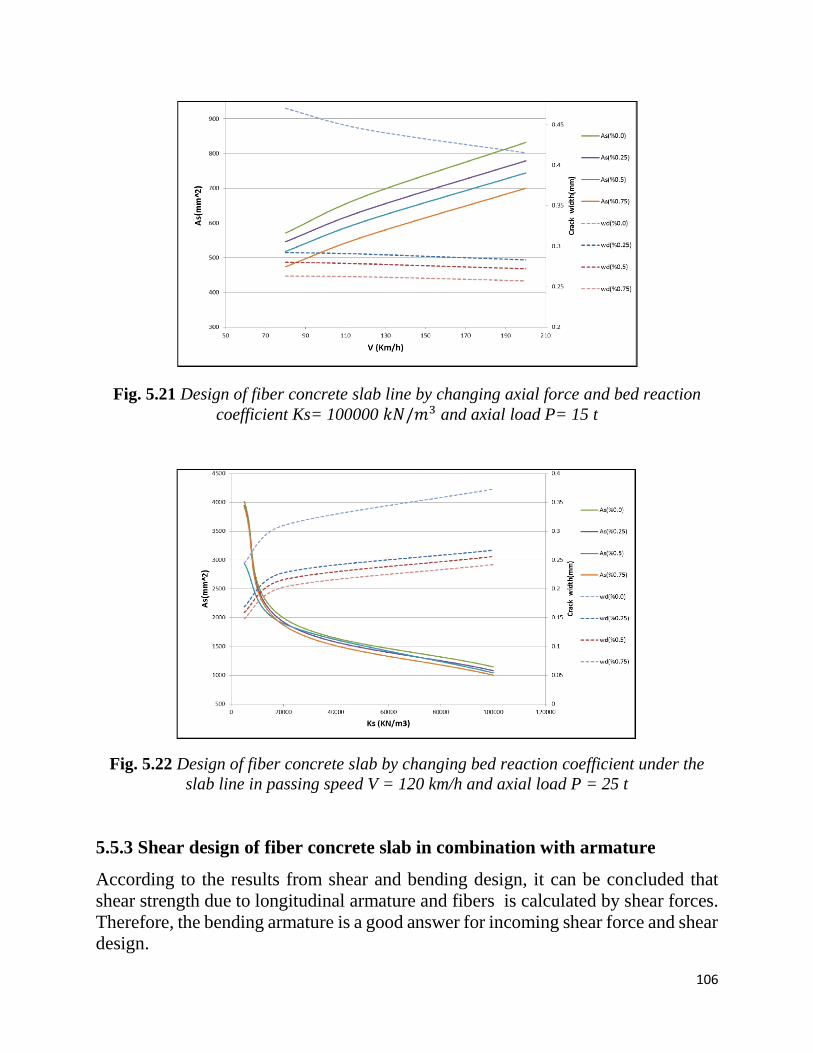
106
Fig. 5.21 Design of fiber concrete slab line by changing axial force and bed reaction
coefficient Ks= 100000 𝑘𝑁/𝑚3 and axial load P= 15 t
Fig. 5.22 Design of fiber concrete slab by changing bed reaction coefficient under the
slab line in passing speed V = 120 km/h and axial load P = 25 t
5.5.3 Shear design of fiber concrete slab in combination with armature
According to the results from shear and bending design, it can be concluded that
shear strength due to longitudinal armature and fibers is calculated by shear forces.
Therefore, the bending armature is a good answer for incoming shear force and shear
design.
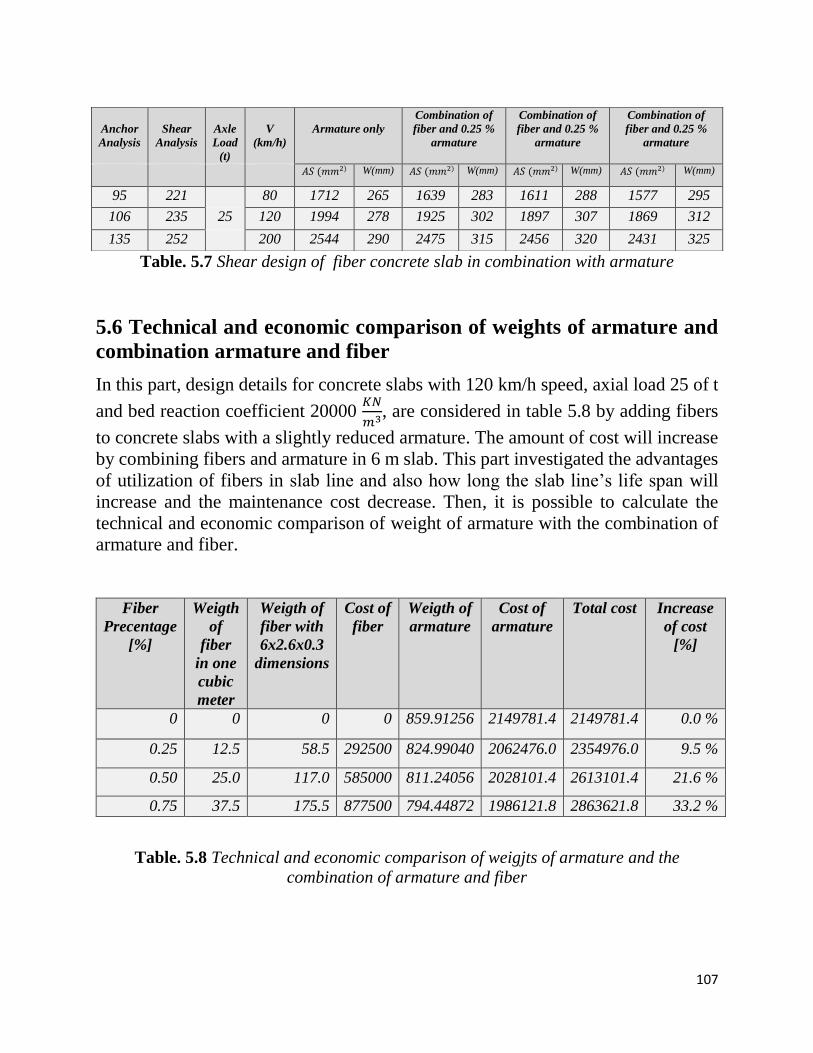
107
Table. 5.7 Shear design of fiber concrete slab in combination with armature
5.6 Technical and economic comparison of weights of armature and
combination armature and fiber
In this part, design details for concrete slabs with 120 km/h speed, axial load 25 of t
and bed reaction coefficient 20000 𝐾𝑁
𝑚3, are considered in table 5.8 by adding fibers
to concrete slabs with a slightly reduced armature. The amount of cost will increase
by combining fibers and armature in 6 m slab. This part investigated the advantages
of utilization of fibers in slab line and also how long the slab line’s life span will
increase and the maintenance cost decrease. Then, it is possible to calculate the
technical and economic comparison of weight of armature with the combination of
armature and fiber.
Fiber
Precentage
[%]
Weigth
of
fiber
in one
cubic
meter
Weigth of
fiber with
6x2.6x0.3
dimensions
Cost of
fiber
Weigth of
armature
Cost of
armature
Total cost Increase
of cost
[%]
0 0 0 0 859.91256 2149781.4 2149781.4 0.0 %
0.25 12.5 58.5 292500 824.99040 2062476.0 2354976.0 9.5 %
0.50 25.0 117.0 585000 811.24056 2028101.4 2613101.4 21.6 %
0.75 37.5 175.5 877500 794.44872 1986121.8 2863621.8 33.2 %
Table. 5.8 Technical and economic comparison of weigjts of armature and the
combination of armature and fiber
Anchor
Analysis
Shear
Analysis
Axle
Load
(t)
V
(km/h)
Armature only
Combination of
fiber and 0.25 %
armature
Combination of
fiber and 0.25 %
armature
Combination of
fiber and 0.25 %
armature
𝐴𝑆 (𝑚𝑚2) W(mm) 𝐴𝑆 (𝑚𝑚2) W(mm) 𝐴𝑆 (𝑚𝑚2) W(mm) 𝐴𝑆 (𝑚𝑚2) W(mm)
95 221 80 1712 265 1639 283 1611 288 1577 295
106 235 25 120 1994 278 1925 302 1897 307 1869 312
135 252 200 2544 290 2475 315 2456 320 2431 325
108
Chapter 6
Results & conclusion
109
6.1 Introduction
In this chapter we have a review from chapter 1 to chapter 5.
In developing countries, usage of steel fiber-reinforced cementitious composites is
widely expanding in structures, due to their high mechanical performance and
flexibility. The behavior of steel fiber-reinforced concrete exposed to corrosive
environments has been investigated. Because of the properties of the material
(concrete), computer simulations in the field of reinforced concrete structures is a
challenge. As opposed to steel, concrete when subjected to compression exhibits
nonlinearity right from the start. Moreover, it much quicker undergoes degradation
under tension. All this poses difficulties for numerical analyses. Weak tensile
strength combined with brittle behavior result in sudden tensile failure without
warning. This is obviously not desirable for any construction material. Thus,
concrete requires some form of tensile reinforcement to compensate its brittle
behavior and improve its tensile strength and strain capacity to be used in structural
applications. Historically, steel has been used as the material of choice for tensile
reinforcement in concrete. Fibre Reinforced Concrete (FRC) is defined as a
composite material essentially consisting of conventional concrete or mortar
reinforced by the random dispersal of short, discontinious, and discrete fine fibres
of specific geometry.
The elasto-plastic material model for concrete developed by considering the stress
softening and degradation of the deformation modulus for the concrete was
presented in the paper. A reduced plane stress state for the compression/tension
range with shear was assumed. Steel fiber used in concrete is in the purpose of load
increasing and crack control. In this project, the concrete is modeled directly with
elasto-plastic behavior in concrete material. In the first step, the deformation
behavior to the break is investigated in slab and the results are validated with
laboratory work. In the following, it has shown that the fiber does not have much
impact on shear and bending forces. According to these results, the design of
bending, shearing and crack control in slab line has done for 15, 25, 30 t as axial
loads, 80, 120, 200 km/h as speed and 5000, 20000, 100000 kN/m3 as the bed
hardness and the results are represented in form of graphs.
6.2 Conclusions
With increasing of hardness under the concrete slab, the amount of incoming
force to the slab will decrease. E.g. with 25 t axial load, 120 km/h speed, and
change in hardness from 5000 to 20000 and 100000 kN/m3, the amount of
110
incoming longitudinal anchor, increased to 46% and 68%, while the amount
of armature is reduced.
Economically, the cost of utilization of fiber with armature is more than usage
of armature in alone situation. E.g. with 25 t axial load, 120 km/h speed and
20000 kN/𝑚3 hardness, the amount of required fibers with 0.25, 0.5, 0.75
volumetric percentages the cost of building of the slab line increase
respectively by 9.5%, 21% and 33%.
By adding fiber to concrete slab, the amount of required armature reduced
sligthly and the crack width greatly decreased. E.g. with 25 t axial load, 120
km/h speed, and 20000 kN/𝑚3 hardness, the amount of required fibers with
0.25, 0.5, 0.75 volumetric precentages cause the decrease of the amount of
armature to 3.5%, 4.9% and 6.3% and the crack width decreased respectively
to 26%, 30% and 35%.
Utilization of fiber alone in concrete slab line, does not have required bending
strength to tolerate the incoming loads. On the other hand, in this condition
the crack width is several times larger than allowed cracks in regulation.
According to the results, it can be concluded that a high precentage of fibers
are required. Therefore, this work is not affordable.
The service’s loading results in concrete with and without fiber indicate that
increasing fiber does not have much impacts in shear forces and bending
anchors. As a result, it is possible to use a concrete slab without fiber for
analyzing the fiber concrete slab and designing it.
According to the results obtained from flexural and shear design, it can be
concluded that the shear strength due to longitudinal armatures and fibers due
to shear forces are from analysis of the slab line due to dynamic crossing loads
that an increae of incoming bending forces and the shear design is not a
criterion.
Among all kinds of fibers which can be used as concrete reinforcement, steel
fibers are the most popular ones. The performance of the Steel Fiber
Reinforced Concrete (SFRC) has shown a significant improvement in flexural
strength and overall toughness compared against conventional reinforced
concrete.
The behaviour of uncracked concrete and concrete between cracks was
simulated under the elastoplasticity framework. The soil or other base
material, supporting the concrete slab was simulated by distributed springs
orthogonal to the concrete slab middle surface. An elasto-plastic model was

111
used to modulate the non-linear behaviour of the springs. The loss of contact
between the base and the slab was accounted for.
Mechanical properties are improved by the incorporation of steel fibers in
UHSC especially splitting tensile strength. Steel fibers increased the total
charge passing and the electrical conductivity of the concrete and the increase
depends on the volume fraction of the steel fibers.
In slabs with low fibre volume (0.5%) the resisting load after cracking was
relatively small. The rate of improvement in energy absorption reduced with
the increase in fiber content.
The compressive strength of highstrength, lightweight concrete was only
slightly improved with the addition of steel fiber. The tensile/compressive
strength ratio was obviously enhanced. These were attributed to the effect of
the steel fiber arresting cracking.
Use of fiber produces more closely spaced cracks and reduces crack width.
Fibers bridge cracks to resist deformation. Fiber addition improves ductility
of concrete and its post-cracking load-carrying capacity. The mechanical
properties of FRC are much improved by the use of hooked fibers than straight
fibers, the optimum volume content being 1.5%. While fibers addition does
not increase the compressive strength, the use of 1.5% fiber increase the
flexure strength by 67%, the splitting tensile strength by 57% and the impact
strength 25 times.
The properties like shear, torsion and bending is also improved due to addition
of fibers in the concrete. This is obvious because the addition of fibers resists
the development of internal micro crack in the concrete, which are responsible
for the failure of the structure.
6.3 Advantages and disadvantages
6.3.1 How to save time and money
To eliminate completely steel fiber reinforcement, saving both materials and labour:
Reduce slab thickness giving savings in concrete and placement costs;
Make possible wider joint spacing, by saving joint forming costs and
maintenance.

112
Simplify the construction: simpler joints and no longer errors in steel fabric
positioning.
Increase speed of construction.
6.3.2 Technical and user benefits
Significantly reduced risk of cracking.
Reduced spalling joint edges.
Stronger joints.
High impact resistance.
Greater fatigue endurance.
Reduced maintenance costs.
Longer useful working life.
6.3.3. Advantages
Reinforcing concrete with steel fibres results in durable concrete with a high
flexural and fatigue flexural strength, improved abrasion, spalling and impact
resistance.
The elimination of conventional reinforcement and, in some cases, the
reduction in section thickness can contribute to some significant productivity
improvements. Steel fibers can deliver significant cost savings, together with
reduced material volume, more rapid construction and reduced labour costs.
The random distribution of steel fibres in concrete ensures that crack free
stress accommodation occurs throughout the concrete. Thus micro cracks are
intercepted before they develop and impair the performance of the concrete.
Steel fibres are a far more economical design alternative.
6.3.4. Disadvantages

113
Steel fibers will not float on the surface of a properly finished slab, however,
rain damaged slabs allow both aggregate and fibers to be exposed and will
present as aesthetically poor whilst maintaining structural soundness.
Fibers are capable to substitute reinforcement in all structural elements
(including primary reinforcement), however, within each element, there will
be a point where the fibers alternative’s cost saving and design economies are
diminished.
Strict control of concrete wastage must be monitored in order to keep it at a
minimum. Wasted concrete means wasted fibers.
6.4 Proposal
In this part there are some suggestions provided in the field of numerical, laboratory,
and implementation.
6.4.1 Numerical Study
Interaction investigation between fiber and concrete with different
coefficients of continuity between steel and concrete in numerical model of
finite element.
Investigating the effect of various fiber lengths and diameters in the numerical
analysis of fiber concrete finite element.
Check how to create and expand the cracks in the slab line and numerical
analysis of finite element.
6.4.2. Laboratory and executive studies
Carrying out laboratory studies by panel manufacturing of fiber concrete slab
line.
Sensitivity analysis of fiber various geometric features, e.g. appearance ratio,
and fiber lengths.
Design and implementation of fiber concrete slab line in subways and
railways and monitor their behavior along the years.

114
Reference
1. Alizade E, JANDAGHI AF, Zabihi S. Effect of steel fiber corrosión on mechanical properties of steel
fiber reinforced concrete. 2016.
2. Kmiecik P, Kamiński M. Modelling of reinforced concrete structures and composite structures with
concrete strength degradation taken into consideration. Archives of civil and mechanical engineering.
2011;11(3):623-36.
3. Behbahani H, Nematollahi B, Farasatpour M. Steel fiber reinforced concrete: A review. 2013.
4. Qian C, Stroeven P. Development of hybrid polypropylene-steel fibre-reinforced concrete. Cement
and concrete research. 2000;30(1):63-9.
5. Szcześniak A, Stolarski A. A simplified model of concrete for analysis of reinforced concrete
elements. Biuletyn Wojskowej Akademii Technicznej. 2016;65(4).
6. Esveld C. Recent developments in slab track application. Rail Tech Europe. 1999.
7. Michas G. Slab track systems for high-speed railways. 2012.
8. Nurchasanah Y, Masoud MA, Solikin M, editors. Steel Fiber Reinforced Concrete to Improve the
Characteristics of Fire-Resistant Concrete. Applied Mechanics and Materials; 2016: Trans Tech Publ.
9. Wafa FF. Properties & applications of fiber reinforced concrete. Engineering Sciences. 1990;2(1).
10. Yongjiang X, Huajian L, Zhongwei F, Ilwha L. Concrete crack of ballastless track structure and its
repair. International Journal of Railway. 2009;2(1):30-6.
11. Barros JA, Figueiras JA. Model for the analysis of steel fibre reinforced concrete slabs on grade.
Computers & Structures. 2001;79(1):97-106.
12. Madhkhan M, Entezam M, Torki M. Mechanical properties of precast reinforced concrete slab
tracks on non-ballasted foundations. Scientia Iranica. 2012;19(1):20-6.
13. Khaloo AR, Afshari M. Flexural behaviour of small steel fibre reinforced concrete slabs. Cement
and concrete Composites. 2005;27(1):141-9.
14. Kershaw EE, Flier JS. Adipose tissue as an endocrine organ. The Journal of Clinical Endocrinology &
Metabolism. 2004;89(6):2548-56.
15. Taucer F, Spacone E, Filippou FC. A fiber beam-column element for seismic response analysis of
reinforced concrete structures: Earthquake Engineering Research Center, College of Engineering,
University …; 1991.
16. Zollo RF. Fiber-reinforced concrete: an overview after 30 years of development. Cement and
Concrete Composites. 1997;19(2):107-22.
17. Khaliq W, Kodur V. Thermal and mechanical properties of fiber reinforced high performance self-
consolidating concrete at elevated temperatures. Cement and Concrete Research. 2011;41(11):1112-22.
18. Mertz DR. Application of fiber reinforced polymer composites to the highway infrastructure:
Transportation Research Board; 2003.
19. Jaturapitakkul C, Roongreung B. Cementing material from calcium carbide residue-rice husk ash.
Journal of Materials in Civil Engineering. 2003;15(5):470-5.
20. Altun F, Haktanir T, Ari K. Effects of steel fiber addition on mechanical properties of concrete and
RC beams. Construction and Building Materials. 2007;21(3):654-61.
21. Song P, Hwang S. Mechanical properties of high-strength steel fiber-reinforced concrete.
Construction and Building Materials. 2004;18(9):669-73.
115
22. Nanni A, Tanigaki M, Hasuo K. Bond anchorage of pretensioned FRP tendon at force release.
Journal of Structural Engineering. 1992;118(10):2837-54.
23. Krishna PV, Rao NS. Durability Studies on Steel Fiber Reinforced Concrete. International Research
Journal of Engineering and Technology (IRJET) Volume. 2016;3.
24. Neela S. Flexural Behavior of Basalt FRP Bar Reinforced Concrete Members With and Without
Polypropylene Fiber: University of Akron; 2010.
25. Bernard E. Behaviour of round steel fibre reinforced concrete panels under point loads. Materials
and Structures. 2000;33(3):181-8.
26. Shah SP, Batson GB, editors. Fiber reinforced concrete: properties and applications1987: American
Concrete Institute.
27. Handbook M. Florida Department of Transportation. Tallahassee, FL. 1997.
28. Brandt AM. Cement-based composites: materials, mechanical properties and performance: CRC
Press; 2005.
29. Folliard KJ, Sutfin D, Turner R, Whitney DP. Fiber in Continuously Reinforced Concrete Pavements.
2006.
30. Nassif H, Suksawang N, Mohammed M. Effect of curing methods on early-age and drying
shrinkage of high-performance concrete. Transportation Research Record: Journal of the Transportation
Research Board. 2003(1834):48-58.
31. Piryonesi SM, Tavakolan M. A mathematical programming model for solving cost-safety
optimization (CSO) problems in the maintenance of structures. KSCE Journal of Civil Engineering.
2017;21(6):2226-34.
32. Bakis CE, Bank LC, Brown V, Cosenza E, Davalos J, Lesko J, et al. Fiber-reinforced polymer
composites for construction—State-of-the-art review. Journal of composites for construction.
2002;6(2):73-87.
33. TC162-TDF R. Test and design methods for steel fiber reinforced concrete, σ ε-design method. Final
Recommendation. Journal of Material and Structures. 2003;35:560-7.
34. Béton FID. Structural Concrete: Textbook on Behaviour, Design and Performance: Updated
Knowledge of the CEB/FIP Model Code 1990: fib; 1999.
35. Brückner A, Ortlepp R, Curbach M. Textile reinforced concrete for strengthening in bending and
shear. Materials and structures. 2006;39(8):741-8.
36. Shah AA, Ribakov Y. Recent trends in steel fibered high-strength concrete. Materials & Design.
2011;32(8-9):4122-51.
37. Chaudhari S, Chakrabarti M. Modeling of concrete for nonlinear analysis using finite element code
ABAQUS. International Journal of Computer Applications. 2012;44(7):14-8.
38. Nazem M, Rahmani I, REZAEI PM. Nonlinear fe analysis of reinforced concrete structures using a
tresca-type yield surface. 2009.
39. Hognestad E. Study of combined bending and axial load in reinforced concrete members.
University of Illinois at Urbana Champaign, College of Engineering …; 1951.
40. Bangash M. Concrete and concrete structures: Numerical modelling and applications. 1989.
41. Wahalathantri BL, Thambiratnam D, Chan T, Fawzia S, editors. A material model for flexural crack
simulation in reinforced concrete elements using ABAQUS. Proceedings of the first international
116
conference on engineering, designing and developing the built environment for sustainable wellbeing;
2011: Queensland University of Technology.
42. Jankowiak I, Kąkol W, Madaj A, editors. Identification of a continuous composite beam numerical
model, based on experimental tests. 7th conference on composite structures, Zielona Góra; 2005.
43. De Normalisation CE. Eurocode 2: Design of concrete structures—Part 1-1: General rules and rules
for buildings. Brussels, Belgium. 2004.
44. Wang T, Hsu TT. Nonlinear finite element analysis of concrete structures using new constitutive
models. Computers & structures. 2001;79(32):2781-91.
45. Nayal R, Rasheed HA. Tension stiffening model for concrete beams reinforced with steel and FRP
bars. Journal of Materials in Civil Engineering. 2006;18(6):831-41.
46. Lapczyk I, Hurtado JA. Progressive damage modeling in fiber-reinforced materials. Composites
Part A: Applied Science and Manufacturing. 2007;38(11):2333-41.
47. Hsu L, Hsu C-T. Complete stress—strain behaviour of high-strength concrete under compression.
Magazine of concrete research. 1994;46(169):301-12.
48. Zaccaria D, Bigoni D, Noselli G, Misseroni D, editors. Structures buckling under tensile dead load.
Proceedings of the Royal Society of London A: Mathematical, Physical and Engineering Sciences; 2011: The
Royal Society.
49. Esmaeili M, Naderi B, Neyestanaki HK, Khodaverdian A. Investigating the effect of geogrid on
stabilization of high railway embankments. Soils and Foundations. 2018;58(2):319-32.
50. Costa DJRdS. Dynamic stiffness of the piled foundation of a onshore wind turbine 2014.