technical appendix: the impact of providing enhanced
TRANSCRIPT

March 2017
Technical appendix
Technical appendix: The impact of providing enhanced support for care home residents in Rushcliffe Therese Lloyd, Arne Wolters and Adam Steventon
About this technical appendix
This technical appendix provides supplemental information relating to analysis conducted
by the Improvement Analytics Unit, a partnership between NHS England and the Health
Foundation. It supports a Health Foundation briefing considering the findings of the analysis
- available from www.health.org.uk/publication/impact-enhanced-support-rushcliffe
This technical appendix provides supplemental information, in particular on data linkage,
matching and analysis methods, and should be read in conjunction with the briefing.

2 The impact of providing enhanced support for care home residents in Rushcliffe: Technical appendix
Contents
1. Data 31.1 Pseudonymised health care data on care home residents: the data linkage process explained 31.2 Identifying ‘comparable’ control areas 51.3 Study cohort 91.4 Follow-up period 111.5 Sample size calculation 12
2. Matching 132.1 Matching methods 132.2 Matching results 15
3. Analysis 203.1 Methods 203.2 Results 21
4. Sensitivity analyses 234.1 Study length 234.2 Number of deaths 244.3 Sensitivity of results to choice of regression model 24
5. Strengths and weaknesses of the analysis 27
References 30

3The impact of providing enhanced support for care home residents in Rushcliffe: Technical appendix
1. Data
This section provides additional information on some of the methodology relating to data, for example how data from different sources were linked to create our analysis dataset and how the resident cohort was determined.
1.1 Pseudonymised health care data on care home residents: the data linkage process explainedThe dataset used for the evaluation of the Principia enhanced support package was created by linking and pseudonymising the following data sources:
• SUS data: Patient-level administrative hospital data for England from 1 April 2012 to 30 August 2016 from the Secondary Uses Service (SUS), a national administrative database. SUS data includes inpatient, outpatient and A&E data.
• NHAIS extracts: Patient registration data, including address details showing when people moved to/from a particular address, covering the period from 17 August 2014 to 18 September 2016. This was derived from monthly extracts of patient registration data from NHAIS (National Health Applications and Infrastructure Services). These monthly extracts were created on the first Sunday after the 13th of each month.*
• CQC care home data: Data on care home characteristics, sourced from the Care Quality Commission (CQC). The CQC is the independent regulator of all health and social care services in England, which carries out regular inspections of all care homes in England.
The Improvement Analytics Unit (IAU) developed a process whereby these different data sources could be linked and pseudonymised prior to data being transferred to the Health Foundation’s Secure Data Environment (SDE) for analysis. At no point in the process did the IAU have access to address information that could be linked to individual patients, nor any identifiable patient information.
The following technical environments were used in this process:
• Arden GEM DSCRO: Arden & Greater East Midlands Data Services for Commissioners Regional Office, controlled by NHS Digital, has access to fully identifiable patient information. Any linkage and data processing requiring access to patient identifiers took place in this environment.
* Due to circumstances outside the control of this project, no monthly extract of NHAIS was created in December 2014. Due to the nature of the administrative data, this extract cannot be recreated in retrospect. Therefore, the extract was not included in the creation of the dataset. Changes in status of care home residents (ie, moving into or out of a care home) after 16 November 2014 and on or before 18 January 2015 are all included in the January extract. Therefore these residents were considered as having moved on 18 January 2015. Deaths are recorded separately, therefore deaths occurring after 16 November 2014 and on or before 14 December are dated as 14 December.

The impact of providing enhanced support for care home residents in Rushcliffe: Technical appendix4
• Temporary National Repository: The Temporary National Repository (tNR) is a data processor on behalf of NHS England, and is hosted by the Arden & Greater East Midlands Commissioning Support Unit. This environment is routinely used by NHS England analysts to support commissioning in line with NHS England’s statutory duties. All data held and processed in this environment are pseudonymised (ie anonymised in line with the Information Commissioner's Office's (ICO’s) code of practice to anonymisation).
• Secure Data Environment: The SDE is the Health Foundation’s accredited secure environment, which holds and processes pseudonymised patient information.
The process of linking and pseudonymising the data is described in Figure A.1 (on page 5). The key steps in this process (marked in blue) are described in more detail below.
• Step 1 – Extract address information ONLY: Arden GEM DSCRO extracted address information from the NHAIS extracts for patients aged 65 and over. This dataset consisted solely of a list of addresses, without any information on individuals. Since the data contained no information on people at all, they were considered anonymised. These address data were securely transferred to the tNR.
• Step 2 – Manual address matching: Addresses can be spelled in different ways, in both hospital data and in the CQC’s register of care homes. For this reason, matching of address data could not be systematised. Instead, the address data extracted from NHAIS were manually compared with a list of care home addresses recorded by CQC. Where addresses matched, these where flagged as belonging to a care home (yes/no) and the care home ID (ie care home name) was added, as well as associated care home characteristics (eg number of beds, residential/nursing) from the CQC register. This file did not include any identifiable patient data.
• Step 3 – Create care home flag: To create a care home resident file, the above address file was subsequently linked to the NHAIS extract. The resultant file included information on the individual patient (including NHS number). Therefore, this step of the process was conducted in the Data Service for Commissioner’s Regional Office (DSCRO) by staff authorised to handle identifiable data.
• Step 4 – Pseudonymise care home file: The care home resident file was subsequently pseudonymised by removing all direct identifiers (eg name, address, full date of birth, care home name) and replacing the NHS number by a pseudonymised patient identifier. This pseudonymisation took place within the DSCRO prior to the file being securely transferred to the tNR.
• Step 5 – Pseudonymise hospital data: DSCRO staff also pseudonymised patient data recorded in SUS by removing all direct identifiers (eg name, address, full date of birth) and replacing the NHS number by the same pseudonymised patient identifier as in step 4. The pseudonymised hospital data were also securely transferred to the tNR.
• Step 6 – Create analysis file: Both the pseudonymised care home file, and the pseudonymised SUS data were securely transferred from the tNR to the SDE, where the files were linked together using the pseudonymised patient identifier. The resulting linked dataset was used to create the analysis file used for the IAU Principia evaluation.

The impact of providing enhanced support for care home residents in Rushcliffe: Technical appendix 5
Note: This process allowed only NHS Digital authorised staff within the Arden Gem DSCRO to manipulate patient identifiable data. All data processed by the IAU are pseudonymised. All direct identifiers (eg name, address, date of birth, NHS number for patients, and care home names) were removed from the data before they were transferred to the IAU.
The approach to data linkage was reviewed and agreed by the project’s Information Governance group. This group reviews information governance on behalf of the IAU Oversight Group. The agreed approach has mitigated risks identified in a privacy impact assessment. All processing of identifiable data was carried out by NHS Digital staff. The Health Foundation holds and processes the pseudonymised data shared with the IAU as a data processor on behalf of NHS England. The purpose of processing the data and subsequent publication of findings are further governed by a memorandum of understanding.
1.2 Identifying ‘comparable’ control areasAs part of the matching process, six local authorities in England were identified that were similar to Rushcliffe in terms of demographics, socio-economic characteristics and other variables of interest in the period prior to the introduction of the enhanced support in April 2014. These provided a ‘pool’ of potential comparison residents from which the matched comparisons could be selected.1 The process was based on the method applied by the Office for National Statistics (ONS)2,3 when determining comparable health areas in England.
The ONS uses a wide range of variables (including age structure, ethnic mix, education, employment rates, overall rates of long-term illness).3 The IAU selected those variables that were most relevant from the ONS list and added other variables of importance to this study that were publicly available at the local authority level (Table A.1 on page 8). Replicating the ONS method, we first transformed the data to reduce skew using the inverse hyperbolic sine method and then standardised the data using inter-decile range to ensure that each variable contributed equally to the metric. The squared Euclidean distance (SED) was then calculated as a measure of the similarity of each local authority area to Rushcliffe.3
The required variables were obtained for the closest available time prior to the introduction of the enhanced support, except for the Index of Multiple Deprivation (IMD) scores. The 2015 IMD scores, rather than the earlier 2010 scores, were chosen as these scores are more likely to reflect the levels of socioeconomic deprivation at the time of the study. It is unlikely that the enhanced support would have had an impact on IMD scores.
For Rushcliffe, the area covered by Rushcliffe CCG and the equivalent local authority are identical. Comparison areas were based on local authority boundaries, as data on social care,4 emergency admissions5 and socio-demographic variables from the census6 were all available at local authority or county level, but not necessarily at CCG level. IMD scores, including Health Deprivation and Disability 2015 average scores and Income Deprivation Affecting Older People (IDAOPI) 2015 average scores were available at both local authority and CCG level.7 Outpatient and elective admissions were not available at local authority level and so were not included.

The impact of providing enhanced support for care home residents in Rushcliffe: Technical appendix6
Figure A.1. Data linkage process used to identify care home residents
Tem
po
rary Natio
nal R
epo
sitory
(NH
S E
ng
land
)
Ard
en G
EM
DS
CR
O
(NH
S D
igital)
Data fields:- N
ame
- Address
- NH
S N
umber
- GP
registration data
NH
AIS
Extracts
Data fields:- N
ame
- NH
S N
umber
- GP
registration data
Data fields:
- Address data O
NLY
Data fields:
-Address data O
NLY
Data fields:
-Care hom
e ID/nam
e-A
ddress-C
are home
characteristics
NH
AIS
Extracts
CQ
C care h
om
e d
ata
Data fields:
-Address data
+
-Care hom
e flag yes/no
-Care hom
e ID/nam
e-C
are home
characteristics
NH
AIS
Extracts +
Data fields:-N
ame
-NH
S N
umber
-Hospital records (i.e.
inpatient, outpatient and A
&E
data)
SU
S d
ata
Data fields:
-Pseudo patient ID
-Hospital records O
NLY
Data fields:-N
ame
-NH
S N
umber
-GP
registration data
Data fields:
-Address data
+
-Care hom
e flag yes/no
-Care hom
e ID/nam
e-C
are home
characteristics
Data fields:-N
ame
-NH
S N
umber
-GP
registration data
-Care hom
e flag yes/no
-Care hom
e name
-Care hom
e characteristics
NH
AIS
Extracts +
Care h
om
e resid
ent fi
le
Data fields:
-Pseudo patient ID
-Care hom
e flag yes/no
-Care hom
e characteristics
Pseu
do
nym
ised
care ho
me
residen
t file
Pseu
do
nym
ised
SU
S d
ata
Data fields:
-Pseudo patient ID
-Care hom
e flag yes/no
-Care hom
e characteristics
Pseu
do
nym
ised
care ho
me
residen
t file
Data fields:
-Pseudo patient ID
-Hospital records O
NLY
Pseu
do
nym
ised
SU
S d
ata
Secu
re Data E
nviro
nm
ent
(Th
e Health
Fou
nd
ation
)
Data fields:
-Pseudo patient ID
-Care hom
e flag yes/no
-Care hom
e characteristics
Pseu
do
nym
ised
care ho
me
residen
t file
Data fields:
-Pseudo patient ID
-Hospital records O
NLY
Pseu
do
nym
ised
SU
S d
ata
Data fields:
-Pseudo patient ID
-Care hom
e flag yes/no
-Care hom
e characteristics
-Hospital records
An
alysis file
Identifiab
le data
Pseud
onymised
data
Pub
lic data
Secure transfer
Extract address
information O
NLY
Apply m
anual address m
atching(no patient data)
Used m
atched addresses to createcare hom
e flag
Pseudonym
ise care hom
e inform
ation
Pseudonym
ise hospital data
Link pseudonymised
information and
create analysis file
1
2
3
45
6

The impact of providing enhanced support for care home residents in Rushcliffe: Technical appendix 7
Table A.1 Comparable control areas
Var
iabl
e
Rus
hclif
fe
Har
boro
ugh
Bla
by
Test
Val
ley
Sou
th
Cam
brid
gesh
ire
Che
lmsf
ord
Bre
ntw
ood
Ave
rage
ac
ross
all
loca
l au
thor
ities
in
Eng
land
Census data (2011 census)Persons living in a communal establishment (%) 2.1 1.6 1.1 1.6 1.3 1.3 1.1 1.8
Number of persons per hectare 2.7 1.4 7.2 1.9 1.7 5 4.8 16.0
Persons aged 0–4 (%) 5.8 5.5 5.8 5.8 6.3 5.9 5.3 6.0
Persons aged 5–14 (%) 11.6 12.3 11.6 11.8 12.2 11.5 11.7 11.3
Persons aged 25–44 (%) 24.7 24 25.5 24.1 26.9 27.2 25 26.4
Persons aged 45–64 (%) 28.1 29.5 27.5 29 27.3 26.8 27.7 26.3
Persons aged 65–89 (%) 17.6 17.4 17.3 17.5 15.8 15.9 18.1 16.6
Persons aged 90+ (%) 0.8 0.8 0.7 0.9 0.8 0.8 1 0.8
Persons who are white (%) 93.1 95.2 91 95.9 93.3 93.9 93.6 89.5
Persons who have mixed ethnicity or are from multiple ethnic groups (%) 1.8 1.1 1.6 1.3 1.7 1.6 1.6 1.9
Persons who are Asian/Asian British: Indian/Pakistani/Bangladeshi (%) 3.1 2.4 5 1.1 1.9 1.8 1.7 3.8
Persons who are Asian/Asian British: Chinese and Other (%) 1 0.6 1.1 1 1.8 1.1 1.5 1.8
Persons who are Black/African/Caribbean/Black British (%) 0.6 0.4 1 0.4 0.9 1.2 1.2 2.3
Persons who are Arab or are from another ethnic group (%) 0.4 0.2 0.4 0.3 0.4 0.4 0.4 0.7
Individuals day-to-day activities limited a lot or a little (Standardised Illness Ratio) 85.6 78.9 85.9 82.6 76.1 79.6 84.3 96.8
Hospital use (NHS Digital, 2013/14)
Emergency hospital admissions: all conditions (indirectly age standardised rate per 100,000) (2013/14) 7762 6916 7734 6935 7403 8018 6802 8914
Emergency hospital admissions: chronic conditions usually managed in primary care (indirectly age standardised rate per 100,000) 112 103 113 108 102 124 92 161
Emergency hospital admissions: acute conditions usually managed in primary care (indirectly age standardised rate per 100,000) 357 432 419 342 400 491 442 518
English indices of deprivation (2015)
IMD 2015 (average score) 7.70 8.32 10.37 10.62 8.05 12.41 9.88 19.42
Health Deprivation and Disability 2015 (average score) -0.93 -0.86 -0.61 -0.97 -1.21 -0.81 -1.10 -0.15
Income Deprivation Affecting Older People (IDAOPI) 2015 (Average score) 0.09 0.09 0.11 0.09 0.08 0.10 0.09 0.15
Estimated proportion of local authority paid residents (estimated using community care statistics data 2013/14 and Census 2011 data)* 0.59 0.56 0.56 0.45 0.61 0.56 0.56 0.57
*This estimate is only a rough approximation, due to the lack of reliable data available at local authority level

The impact of providing enhanced support for care home residents in Rushcliffe: Technical appendix8
City of London, City of Westminster, Cornwall, Isles of Scilly and Tower Hamlets did not report individual numbers for at least one of the variables, as the numbers were too small to be disclosed in the source data publication. These local authorities were therefore excluded.
We wanted to identify areas that were similar to Rushcliffe in terms of the proportion of care home residents funded by the local authority rather than privately. However, due to the limited data available, we could not measure this variable precisely. We established a variable with approximate values using the following:
• We used as the numerator the number of permanent care home residents aged 65+ supported by local authority in residential or nursing placements as at 31 March 2014. Permanent placements are those that were not intended to be of limited duration at the point of admission. The number of permanent care home residents in Rushcliffe was not available; instead we had to use data grouped at county level (Nottinghamshire), which also contained other areas within the same county that may have differed to Rushcliffe.
• As the denominator, we used census data on number of usual residents in care homes aged 65+ (for Nottinghamshire). Usual residents are those spending six or more months in a care home, which may include some temporary, rather than permanent placements. It also includes UK residents in a care home for under six months but with no other UK address, and people who are not usually resident in the UK but live in care homes for three months or more without another UK address.
Thus, the numerator and denominator were based on overlapping but differing populations, and our estimate of the proportion of care home residents funded by the local authority was only an approximation. As local authorities were only compared in relative terms within the SED calculations, we decided to use this variable but to conduct sensitivity analysis to understand the effect of omitting it. Eight out of 10 of the most similar local authorities were the same across both calculations, and all were within the fifth percentile of the local authorities most similar to Rushcliffe.
A list of the ten local authorities with most similar characteristics across all variables and their comparative values was selected and reviewed. Any local authorities with known area-wide interventions relating to care homes deemed sufficiently similar to the enhanced support or unrepresentative of usual care in other parts of the country were excluded from the list. These included other Vanguard sites8 and local authorities participating in the PEACH study (implementation of Comprehensive Geriatric Assessment (CGA) in care homes).9 Although Rushcliffe was one of four CCGs taking part in the PEACH study, this did not introduce any unobserved confounding to our analysis, as the CGA was one of the elements of the Principia enhanced support. Four of the ten local authorities were excluded due to local care home initiatives.
The final list of six areas was agreed between the IAU team and Principia, prior to the start of the analysis. The areas were:
• Harborough
• Blaby
• Test Valley
• South Cambridgeshire
• Chelmsford
• Brentwood.

The impact of providing enhanced support for care home residents in Rushcliffe: Technical appendix 9
Table A.1 (on page 6) shows the raw values of the variables used in the calculation, for each of the chosen local authorities, as well as the average across all local authorities in England (for comparison).
1.3 Study cohortCare homes were included in the study cohort if they satisfied the following three criteria:
• cared for older residents
• were open at some point between 17 August 2014 and 14 August 2015
• either benefitted from the Principia enhanced support or were located in one of the ‘comparable’ control areas.
The cut-off date for a care home opening was set to 14 August 2015 to allow us to obtain data on care residents for up to one year.
The following care homes were excluded:
• One care home outside Rushcliffe, where it had been agreed that 20 (50%) of the residents were to receive the Principia enhanced support under a Principia general practice, while the other 20 residents were to be cared for by a non-Principia general practice. This care home was excluded from the analysis, as only half of the care home residents were eligible for the enhanced support.
• Care homes likely to be specialist care homes for groups other than the frail older population, such as those for learning disabilities, as these would have very different primary care needs and usage of acute services.
Data on care home specialties were obtained from the CQC. The CQC data were not designed for research purposes and have not been validated accordingly. The CQC register allows multiple specialisations to be registered for care homes. A review of Principia care homes, comparing CQC data with information provided from the Principia team, showed that certain care homes described by the Principia team as care homes for frail older adults also included other specialist care categories on the CQC register (eg care for adults aged under 65 or caring for mental health needs). We therefore endeavoured to distinguish between care homes for frail older people that were able to accommodate residents that were younger than 65 or with more complex needs, from specialist care homes, such as those for people with learning disabilities. This was done by omitting those care homes that met both of the following two criteria:
• They had one of the following specialties: learning disabilities or autistic spectrum disorder; people who misuse drugs and alcohol; people with eating disorders; people detained under the Mental Health Act; or people with sensory impairment.
• They cared for an additional age group, besides the over 65s.
Other specialisms, such as dementia care, mental health care or physical disability were not included in the above exclusion criteria, as these categories were not inconsistent with the needs of frail older residents. The exclusion criteria relating to care home specialties did not exclude any of the Principia care homes.

The impact of providing enhanced support for care home residents in Rushcliffe: Technical appendix10
There were a total of 23 care homes for frail older people in the Principia group. This included 22 care homes in Rushcliffe and one care home outside of Rushcliffe that received enhanced support under a Principia general practice. See Figure A.2. for a flow diagram of the inclusion and exclusion criteria.
Figure A.2. Flow diagram of study cohort selection
Potential Control Group Residents moving to a care home
between 18 August 2014 and 17 July 2016 3,088 residencies (3,008 people) | 93 care homes
Intervention Group Residents moving to a care home
between 18 August 2014 and 17 July 2016 618 residencies (601 people) | 23 care homes
Data received from tNR on: People aged 65 or over who were resident in a care home catering to older people either wholly receiving
Principia enhanced support or in one of the 6 comparable LAs, between 17 August 2014 and 14 August 2016 8,617 residencies (8,372 people) | 139 care homes
Residents living in care homes for frail older people 8,093 residencies (7,872 people) | 123 care homes
Residents with month and year of birth available 8,079 residencies (7,858 people) | 123 care homes
Residents moving to a care home between 18 August 2014 and 17 July 2016) 3,706 residencies (3,609 people) | 116 care homes
Residents living in specialist care homes excluded
Residents with no month/year of birth available excluded
Residents with no hospital admissions
in 2 years up to follow up period
Residents in a care home on 17 August 2014
Potential Control Group Residents who were not previously resident in a care home
2,957 residencies (2,957 people) | 93 care homes
Intervention Group Residents who were not previously resident in a care home
588 residencies (588 people) | 23 care homess
Residents who were known to have previously resided in a care home
Residents with at least one hospital admission in the 2 years before the follow up period
6,134 residencies (5,973 people) | 120 care homes

The impact of providing enhanced support for care home residents in Rushcliffe: Technical appendix 11
The IAU team identified records for residents who moved to the selected care homes between 18 August 2014 and 17 July 2016 when aged 65 or over.
The following residents were excluded:
• Residents without full address recorded in the NHAIS data.
• Residents without a recorded month and year of birth in the NHAIS data.
• Residents without a record of prior inpatient admissions in the two years before moving to the care home. These were excluded as prior hospital data was required to define certain baseline resident characteristics such as health conditions. As the population consisted of frail older people likely to have been to hospital in the two years prior to joining a care home, a two-year pre-period was deemed sufficient and minimised the risk of identifying past conditions that had since been resolved.
• People who were known to previously reside in a care home (i.e. who were resident in a Principia care home or a care home in one of the comparison areas at the time of the first available extract, 17 August 2014). These were excluded so that no bias would be introduced when matching on prior hospital activity, as hospital activity may differ between people living in care homes and in the community.
1.4 Follow-up periodAlthough the enhanced support was introduced in April 2014, data extracts from NHAIS were only available from 17 August 2014. We therefore only included residents who moved into a care home after 17 August 2014. We considered a resident’s follow-up period to start from the date of the data extract in which they are known to first have a new care home address (ie the earliest possible start date is recorded as 14 September 2014). This allowed in effect for a bedding-in period for the care homes of approximately five months.
A resident’s follow-up period ended when the resident either died, moved away from the care home, or the study period ended. The end date was defined as the first of the following dates:
• 14 August 2016* if the resident still resided in the care home at that time.
• Date of death, estimated as the date of the data extract in which residents were first recorded as deceased.
• Date of moving away from the care home, estimated as the date of the data extract in which people were first recorded with an address different from the care home they were residing in.
* Following quality assurance, it transpired that 17 residents (11 Principia and 6 matched comparisons) had an attributed end of study date of 18 September 2016 instead of 14 August 2016. For these residents, outcomes were recorded until 30 August 2016 but the study length was computed until 18 September 2016. As a result, the study length for these residents was overestimated by 2 weeks. Due to both the minor difference in study length and the small number of residents affected, no action was taken.

The impact of providing enhanced support for care home residents in Rushcliffe: Technical appendix12
The date of death was estimated as the extract date of the month in which the person died. However, as the true death date could be as early as the day after the previous extract date, there is a risk that the follow-up period was overestimated by up to a month. The same is true for moves out of a care home, while the opposite is true for the moves into a care home. However, as it unlikely that the day of the month that a person dies or moves is other than random, or differed systematically between Principia and other care homes, this is unlikely to introduce bias between the Principia and comparison groups.
1.5 Sample size calculationNo power calculation was done for this study. The size of the sample was limited by the number of beds within the care homes receiving the enhanced support by Principia and the time frame for the analysis.

13The impact of providing enhanced support for care home residents in Rushcliffe: Technical appendix
This section provides additional details of the methodology used for matching Principia residents to controls, as well as supplemental descriptive statistics and diagnostics of the matching process.
2.1 Matching methodsFrom the wider set of residents in the six comparison areas, we selected a matched subset that was similar to the Principia care home residents with respect to variables that were likely to be predictive of outcomes.
Matched comparison residents were selected using genetic matching, which is a computer-intensive algorithm that produces more closely balanced groups than traditional approaches such as nearest neighbour matching or the propensity score.10 The genetic matching algorithm measures the similarity of pairs of residents using distance metrics that are generalised versions of Mahalanobis distance.11,12 The distance metric contains weight parameters, which are optimised to produce a matched group that is as similar as possible to the Principia residents.
For some variables we required that the corresponding Principia and matched comparison residents were exactly equal (Table A.2). For example, a resident in a nursing home had to be matched to another resident who lived in a nursing home, rather than a residential home. Similarly, care homes that were registered as providing care to a wider age group were matched to other such care homes, to ensure appropriate comparisons in case these care homes differed to those registered as only caring for older people.
Table A.2. Matching variables and method of matching
Variable Method of matching
Care home type (nursing or residential) Exact
Care home resident age categories Exact
We selected one matched comparison resident for each Principia resident, since this results in better balance than one-to-many matching. Matching was done with replacement, meaning that the same comparison resident might be matched to more than one Principia resident. This was done because matching with replacement generally leads to better balance on baseline variables than without replacement.
2. Matching

The impact of providing enhanced support for care home residents in Rushcliffe: Technical appendix14
Matching variables
Residents were matched based on the following patient-level variables, which were all measured at baseline (ie, before the start of Principia enhanced support):
• Demographics – age, gender, ethnicity (white/non-white).
• Prior hospital activity in the year prior to the study start (ie, year -1): number of emergency admissions, potentially avoidable emergency admissions, hospital bed days, A&E attendances, elective admissions, outpatient appointments.
• Emergency admissions and potentially avoidable emergency admissions in the year before the year prior to the study start (ie, year -2).
• The Charlson Index, which is an aggregate measure of the burden of disease.
• Diagnosed conditions that are consistent with frailty – anxiety or depression; functional dependence; falls & significant fracture; incontinence; mobility problems; pressure ulcers; and cognitive impairment (a composite of delirium, dementia or senility).
• Other comorbidities identified (through other research) as strong predictors of future readmissions, eg chronic pulmonary disease, congestive heart failure and dementia.13
We calculated the Charlson index and variables relating to diagnosed conditions consistent with frailty or predictive of readmission using inpatient hospital data from the two years prior to a resident entering the care home.
Residents were also matched on the characteristics of their care homes:
• Whether the care home supplied nursing care in addition to residential care.
• Whether the care home was recorded as specialising in providing care to other groups besides older people, and which groups.
• The number of beds in the care home.
• Whether the care home was located in a rural or urban setting (this was a dichotomous variable, based on the urban/rural classification at LSOA level from the 2011 census).
• Socioeconomic deprivation deciles, based on the IMD 2015, available at LSOA level.
The first three of these variables were based on information supplied by CQC. The IAU used data from 1 April 2014, ie the date the Principia enhanced support was first implemented, for care homes that were open at that time. For care homes that opened later, CQC data from the month following the opening (when the data on that care home were first available) was used.
As with the selection of comparable areas, IMD scores from 2015 were used, as previous scores based on 2010 data may no longer reflect the level of deprivation of the area and it was unlikely that the enhanced support would have had an impact on IMD scores.

The impact of providing enhanced support for care home residents in Rushcliffe: Technical appendix 15
Diagnostics
The quality of the matching was assessed by checking the ‘standardised mean difference’, which is defined as the difference in means as a proportion of the pooled standard deviation.14 Although the standardised difference should ideally be minimised without limit, a standardised difference below 10% has been used to describe negligible imbalance.15 The standardised difference is a better measure of balance than formal statistical tests, as the latter depend on the size of the groups, as well as on the level of similarity.16
The balance was assessed across all the baseline variables identified before the start of the evaluation as likely to be predictive of any of the outcomes, regardless of whether the variables were included in the matching algorithm. Therefore, the study start date (ie the date of moving into the care home) and the number of potentially avoidable emergency admissions and emergency admissions in the two months prior to the study start date were included, in addition to the matching variables detailed in the previous section.
2.2 Matching resultsFigure A.3 shows the assessment of balance across all variables. A standardised difference of 0 indicates no difference between the groups. A negative standardised difference indicates that Principia residents had a smaller average value than the matched comparison group, while the opposite is true for a positive value. Vertical dotted lines denote the +/– 10% threshold assumed to describe adequate balance; any values between these lines are considered balanced. The matching ensured that the groups were similar also across the study start date, as well as emergency admissions and potentially avoidable emergency admissions in the two months prior to study start date, even though these were not included in the matching algorithm.
Tables A.4. and A.5. show baseline characteristics before and after matching, for resident and care home characteristics respectively.

The impact of providing enhanced support for care home residents in Rushcliffe: Technical appendix16
Figure A.3 Assessment of balance before and after matching

The impact of providing enhanced support for care home residents in Rushcliffe: Technical appendix 17
Table A.4. Baseline resident characteristics before and after matching
Potential controls
Matched controls
Principia
Total number of residents 2957 588 588
Total number of people 2957 422 588
Age 86.6 (7.2) 86.6 (6.7) 85.9 (7.5)
Female 66.2% 62.4% 62.1%
White 85.1% 90.5% 88.9%
Charlson index, based on recorded comorbidities in prior 2 years 2.1 (1.8) 2.2 (1.8) 2.3 (1.8)
Number of frailty comorbidities recorded in prior 2 years 1.9 (1.4) 2.0 (1.6) 2.1 (1.6)
Anxiety or depression in prior 2 years 17.0% 14.8% 16.7%
Cognitive impairment in prior 2 years 49.7% 51.9% 54.6%
Functional dependance in prior 2 years 13.4% 21.4% 24.5%
Fall or significant fracture in prior 2 years 46.5% 51.2% 52.4%
Incontinence in prior 2 years 10.6% 11.9% 14.1%
Mobility problems in prior 2 years 23.6% 21.1% 25.2%
Pressure ulcers in prior 2 years 13.5% 8.5% 8.5%
Comorbidities predictive of hospital readmission
Metastatic cancer with solid tumour in prior 2 years 4.1% 5.6% 5.6%
Other malignant cancer in prior 2 years 12.4% 13.9% 16.3%
Chronic pulmonary disease in prior 2 years 18.2% 15.8% 17.5%
Congestive heart failure in prior 2 years 18.3% 15.0% 16.3%
Dementia in prior 2 years 46.1% 52.7% 52.7%
Diabetes with chronic complications in prior 2 years 1.6% 1.9% 2.2%
Hemiplegia or paraplegia in prior 2 years 4.2% 2.9% 3.2%
Moderate or severe liver disease in prior 2 years 0.4% freq <10 freq <10
Other liver disease in prior 2 years 1.7% freq <10 2.6%
Peripheral vascular disease in prior 2 years 6.7% 4.4% 6.8%
Renal disease in prior 2 years 0.4% freq <10 freq <10
Previous hospital use (prior to entering care home)
Emergency admissions in prior 2 months 0.5 (0.7) 0.5 (0.6) 0.4 (0.6)
Emergency admissions in prior year 1.9 (1.5) 1.8 (1.5) 1.7 (1.5)
Emergency admissions in year before prior year 0.7 (1.1) 0.6 (0.9) 0.7 (1.2)
Potentially avoidable emergency admissions in prior 2 months 0.2 (0.4) 0.1 (0.4) 0.1 (0.4)
Potentially avoidable emergency admissions in prior year 0.6 (0.9) 0.5 (0.8) 0.5 (1.0)
Potentially avoidable emergency admissions in year before prior year 0.2 (0.5) 0.1 (0.4) 0.1 (0.5)
Hospital bed days in prior year 38.5 (43.0) 38.6 (40.0) 38.4 (42.6)
A&E attendances in prior year 2.2 (1.9) 2.0 (1.9) 1.7 (1.6)
Elective admissions in prior year 0.4 (2.3) 0.3 (0.8) 0.4 (1.1)
Outpatient appointment in prior year 3.5 (6.1) 3.1 (6.1) 4.2 (6.2)
Numbers presented are either mean (standard deviation) or percentage
Percentages were suppressed where there was an underlying frequency of less than 10

The impact of providing enhanced support for care home residents in Rushcliffe: Technical appendix18
Table A.5 Baseline care home characteristics before and after matching
Potential controls
Matched controls
Principia
Total number of residents 2957 588 588
Number of care homes 93 64 23
Nursing home 56.4% 65.3% 65.3%
Care home registered as caring for older people only 86.5% 86.4% 86.4%
Number of beds, mean (sd) 61.9 (33.7) 47.5 (18.8) 47.5 (19.1)
Rural setting 36.5% 52.2% 55.8%
Index of Multiple Deprivation (IMD) decile
1 (most deprived) freq <10 freq <10 freq <10
2 1.5% freq <10 freq <10
3 freq <10 freq <10 freq <10
4 0.5% freq <10 freq <10
5 10.6% freq <10 freq <10
6 18.3% 13.3% 10.2%
7 16.8% freq <10 freq <10
8 10.6% 30.8% 39.1%
9 16.8% 11.7% 11.9%
10 (least deprived) 24.9% 41.2% 38.4%
Care home location (local authority) 6 6 1
Principia* 0% 0% 100%
Harborough 9.5% 7.5% 0%
Blaby 11.2% 7.5% 0%
Test Valley 18.4% 27.9% 0%
South Cambridgshire 19.6% 33.3% 0%
Chelmsford 21.5% 8.5% 0%
Brentwood 19.8% 15.3% 0%
Percentages were suppressed where there was an underlying frequency of less than 10
sd = standard deviation
*Includes Rushcliffe and one care home receiving Principia enhanced support in a neighbouring area
Comparison of groups before matching
Principia care home residents were similar to residents in the six comparison areas, even before matching. However, in general Principia residents had slightly more recorded health conditions than the residents in the comparison areas, and in particular, higher levels of functional dependence (25% vs 13%). This was in conjunction with having lower levels of A&E attendance in the year prior to moving to the care home. Outpatient appointments were slightly higher on average amongst Principia residents than residents in the six comparison areas. These observations may be indicative of better quality of care in the

The impact of providing enhanced support for care home residents in Rushcliffe: Technical appendix 19
Principia area even before entering a care home and being introduced to the enhanced support, though they might also reflect differences in the characteristics of care home residents in the various areas.
The size and setting of the care homes differed, with Principia care homes in general being smaller and located more often in a rural setting than those in the six comparison areas. A higher proportion of residents in Principia were in nursing homes versus the comparison areas.
Both Principia and the comparison areas had low levels of socioeconomic deprivation by national standards. However, a higher proportion of Principia care home residents lived in the least deprived localities than residents in the comparison areas.
Comparison of groups after matching
The Principia and comparison residents were more similar after matching than before matching. For most of the variables, the matched groups were very similar indeed.
However, there was imbalance in A&E and outpatient attendances (standardised difference –20.8% and +16.4%, respectively). There were also differences between the groups in terms of socioeconomic deprivation scores after matching (Figure A.3). The groups were very well balanced on other care home characteristics. The two groups were similar after matching in terms of the type of care homes they resided in (nursing vs residential), size (number of beds) and locality (urban vs rural).
Although the matched comparison and Principia residents were similar in terms of the variables we could observe, the groups may still have differed in unobserved ways, such as in the availability of informal care from friends and family.

20 The impact of providing enhanced support for care home residents in Rushcliffe: Technical appendix
This section provides supplemental information on the analysis methodology. It also presents additional results, such as crude rates and the results of unadjusted modelling.
3.1 MethodsWe aimed to estimate the ‘average treatment effect for the treated’, (ie, the effect of the Principia enhanced support for those who received it in Principia). Once matched comparison residents had been selected, the effect of the Principia enhanced support compared to the comparison group was estimated by fitting fixed-effects regression models, both unadjusted and adjusted for baseline variables. The adjusted model contained all baseline variables, to adjust for any remaining observed imbalance. We adjusted for seasonality by including a quarterly categorical variable based on the date of moving in to the care home (study start date).
Each outcome was analysed by fitting a regression model that was appropriate to the type of outcome and the characteristics of the data (see briefing for details of outcomes). Table A.6 shows the models chosen for each outcome. Residents had varying lengths of stay in the care homes. Therefore, an offset was included in the model, which allowed for differences in the observed (censored) length of care home stay, for all outcomes relating to admissions or attendances. For hospital bed days, the number of days in hospital as a proportion of length of care home stay was modelled, weighted by study length.
The model fit was checked by examining dispersion statistics (ie, the residual deviance to the residual degrees of freedom), and excess zeros by comparing predicted and observed proportion of zeros. Where there was a good model fit using several models, models were compared by observing the loglikelihood ratios, dispersion parameters and Akaike Information Criterion (AIC), as appropriate.
There was good model fit in terms of dispersion statistics for all variables, apart from hospital bed days and overall deaths, where no satisfactory model was found (the residual deviance was higher than Pearson’s Chi-squared).
Table A.6. Model selection and interpretation
Outcome Regression model Interpretation
A&E attendances Negative binomial Incidence rate ratio
Emergency admissions Negative binomial Incidence rate ratio
Potentially avoidable emergency admissions
Poisson Incidence rate ratio
Elective admissions Negative binomial Incidence rate ratio
Outpatient attendances Negative binomial Incidence rate ratio
Hospital bed days Quasi-binomial Odds ratio
Deaths outside of hospital Binomial Odds ratio
Deaths* Binomial Odds ratio
*Sensitivity analysis (see Section 5)
3. Analysis
The impact of providing enhanced support for care home residents in Rushcliffe: Technical appendix 21
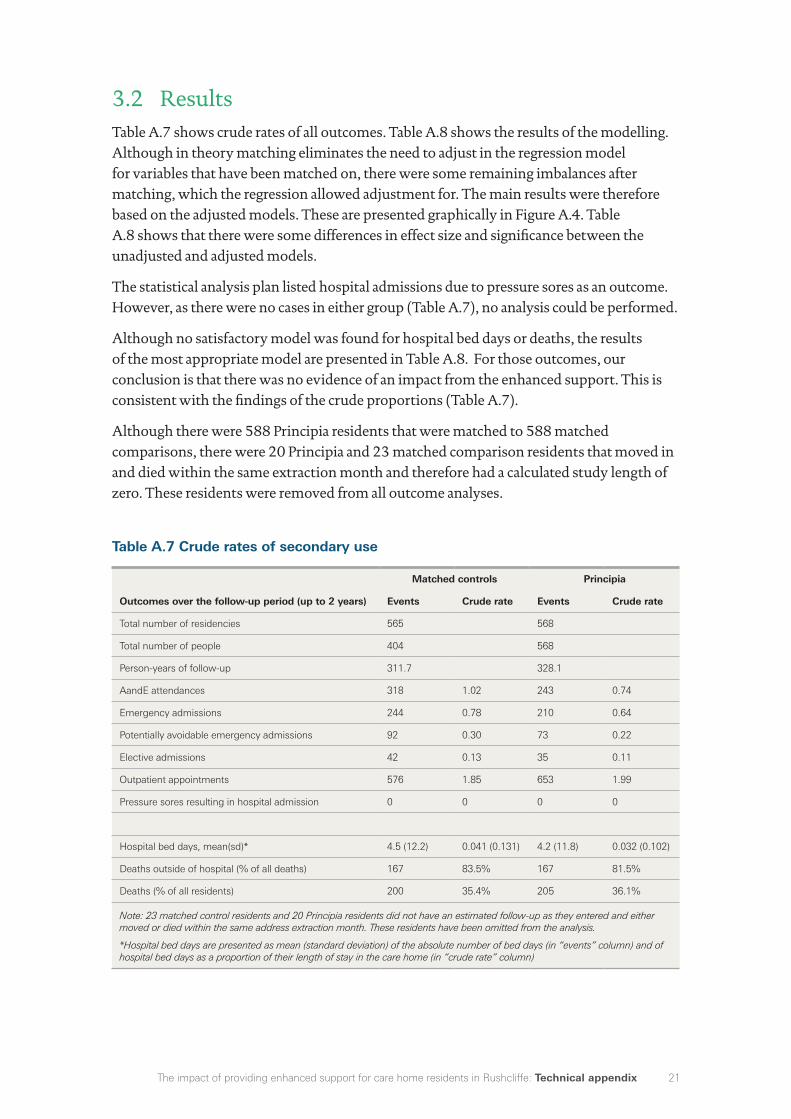
3.2 ResultsTable A.7 shows crude rates of all outcomes. Table A.8 shows the results of the modelling. Although in theory matching eliminates the need to adjust in the regression model for variables that have been matched on, there were some remaining imbalances after matching, which the regression allowed adjustment for. The main results were therefore based on the adjusted models. These are presented graphically in Figure A.4. Table A.8 shows that there were some differences in effect size and significance between the unadjusted and adjusted models.
The statistical analysis plan listed hospital admissions due to pressure sores as an outcome. However, as there were no cases in either group (Table A.7), no analysis could be performed.
Although no satisfactory model was found for hospital bed days or deaths, the results of the most appropriate model are presented in Table A.8. For those outcomes, our conclusion is that there was no evidence of an impact from the enhanced support. This is consistent with the findings of the crude proportions (Table A.7).
Although there were 588 Principia residents that were matched to 588 matched comparisons, there were 20 Principia and 23 matched comparison residents that moved in and died within the same extraction month and therefore had a calculated study length of zero. These residents were removed from all outcome analyses.
Table A.7 Crude rates of secondary use
Matched controls Principia
Outcomes over the follow-up period (up to 2 years) Events Crude rate Events Crude rate
Total number of residencies 565 568
Total number of people 404 568
Person-years of follow-up 311.7 328.1
AandE attendances 318 1.02 243 0.74
Emergency admissions 244 0.78 210 0.64
Potentially avoidable emergency admissions 92 0.30 73 0.22
Elective admissions 42 0.13 35 0.11
Outpatient appointments 576 1.85 653 1.99
Pressure sores resulting in hospital admission 0 0 0 0
Hospital bed days, mean(sd)* 4.5 (12.2) 0.041 (0.131) 4.2 (11.8) 0.032 (0.102)
Deaths outside of hospital (% of all deaths) 167 83.5% 167 81.5%
Deaths (% of all residents) 200 35.4% 205 36.1%
Note: 23 matched control residents and 20 Principia residents did not have an estimated follow-up as they entered and either moved or died within the same address extraction month. These residents have been omitted from the analysis.
*Hospital bed days are presented as mean (standard deviation) of the absolute number of bed days (in “events” column) and of hospital bed days as a proportion of their length of stay in the care home (in “crude rate” column)

The impact of providing enhanced support for care home residents in Rushcliffe: Technical appendix22
Table A.8 Results of regression modelling, unadjusted and adjusted
Unadjusted model Adjusted model
Outcomes over the follow-up period (up to 2 years)
Estimate type
Point estimate 95% CI P-value
Point estimate 95% CI P-value
A&E attendances Rate ratio 0.73 (0.59, 0.92) 0.005 0.71 (0.57, 0.89) 0.002
Emergency admissions Rate ratio 0.83 (0.65, 1.06) 0.120 0.77 (0.61, 0.97) 0.024
Potentially avoidable emergency admissions
Rate ratio 0.75 (0.55, 1.02) 0.071 0.72 (0.51, 1.00) 0.052
Elective admissions Rate ratio 0.72 (0.37, 1.39) 0.318 1.29 (0.64, 2.63) 0.445
Outpatient appointments Rate ratio 1.12 (0.88, 1.43) 0.341 1.11 (0.88, 1.40) 0.372
Hospital bed days Odds ratio 0.88 (0.58, 1.34) 0.555 0.86 (0.57, 1.29) 0.469
Deaths outside of hospital Odds ratio 0.87 (0.52, 1.45) 0.590 1.07 (0.53, 2.15) 0.851
Deaths Odds ratio 1.03 (0.81, 1.31) 0.808 0.97 (0.73, 1.30) 0.852
Note: Endpoints were adjusted for age, gender, ethnicity, all hospital activity in the previous year (year -1), potentially avoidable admissions and emergency admissions in the year prior to that (year -2), the Charlson Index, frailty comorbidities and other comorbidities associated with readmissions and seasonality. In addition, endpoints were adjusted for care home type, age group specialisation, size of care home, locality (rural vs urban) and IMD decile.
23 matched control residents and 20 Principia residents did not have an estimated follow-up as they entered and either moved or died within the same address extraction month. These residents have been omitted from the analysis.
Figure A.4 Forest plot of ratios, adjusted for baseline variables
Odds ratioRate ratio
0 0.5 1 1.5 2 2.5 3
A&E attendances
Emergency admissions
Potentially avoidableemergency admissions
Elective admissions
Outpatient appointments
Hospital bed days
Deaths outside of hospital
Deaths

23The impact of providing enhanced support for care home residents in Rushcliffe: Technical appendix
This section provides details of the sensitivity analyses that were done. These include examining study length and censoring, mortality rates and the sensitivity of the results to the modelling choice.
4.1 Study length To account for residents' differing lengths of time in a care home, an offset of the numbers of resident bed days was added to the model. However, the offset assumes that the number of days that are ‘missing’ is random and that the rate of outcomes (eg, emergency admissions), is constant, when in fact this is unlikely to be the case. For example, residents may use more hospital services in the final months of life. Therefore we examined the length of time people were followed up in the study and reasons for leaving the study between the groups (Table A.9). As detailed in section 1.4, a resident’s follow-up period ended (was censored) when the resident either died, moved away from the care home, or the study period ended (14 August 2016).
The length of time residents were followed up in the study was similar between Principia and the matched comparison group, with an average 204 days in the Principia group, compared to 194 days in the matched comparison group (based on all residents, including those with zero study length). The reasons residents were no longer followed up in the study were also similar between groups.
Table A.9. Study length
Matched
comparisons Principia
Total number of residents 588 588
Length of time in the study 193.5 (178) 203.7 (178.6)
Reason for censoring (leaving the study)
Study period ended
Resident moved
Resident died
48.3%
13.8%
37.9%
49.8%
11.9%
38.3%
The similarity between the groups in terms of length of time in the study and reasons for leaving the study strengthened our confidence in using an offset to allow for varying length of time in the study.
4. Sensitivity analyses

The impact of providing enhanced support for care home residents in Rushcliffe: Technical appendix24
4.2 Number of deathsOne of the main threats to the validity of this study was unobserved confounding – ie that the Principia and matched comparison residents may differ in ways that we did not observe yet are predictive of the outcomes.
One way to assess the effect of unobserved confounding is to compare the Principia and matched comparison groups in terms of an endpoint that was not expected to be affected by the intervention.17 We did not expect the enhanced support to have a large positive or negative impact on mortality rates, for example, so differences in mortality rates would make us doubt the performance of the matching. For example, if enrolled residents died at a higher rate than matched comparison residents, this might suggest that they were in worse health than the comparison residents at the point of enrolment.18 We therefore compared the rates of all-cause mortality over the study period (Tables A.7 and A.8).
Once residents with study lengths of zero (who moved in and died within the same month) had been excluded, 36% of Principia residents died within the study period, compared with 35% of matched comparison residents. The odds ratio was 0.97 (95% CI 0.73, 1.30). A survival analysis using Kaplan-Meier estimates, censoring residents who moved or were still resident in August 2016 (when the study period ended), showed no difference in mortality between the groups (data not shown). The similar mortality rates are reassuring in terms of unobserved confounding.
4.3 Sensitivity of results to choice of regression modelWhen determining the most appropriate model, various models were tested. Table A.10 lists the results obtained from these regression models. The table demonstrates that the effect size and significance were in general not sensitive to the choice of model. A notable exception was hospital bed days, where a Poisson model (modelling the number of hospital bed days, using an offset for length of care home stay) and Binomial model (modelling the number of hospital beds days as a proportion of care home stay) yielded significantly lower outcomes in the Principia group. The quasi-Binomial model, however, showed no significant difference between the groups. Although none of these models fitted well, the quasi-Binomial model included a highly significant dispersion parameter to address excess variance so was considered a more appropriate model.
For the outcomes relating to A&E attendances, emergency admissions and potentially avoidable admissions, the model specification did not make a qualitative difference to the findings.

The impact of providing enhanced support for care home residents in Rushcliffe: Technical appendix 25
Table A.10. Sensitivity of results to choice of regression model
Outcome Model Point estimate 95% CI P-value
A&E attendances
Poisson (adj) 0.68 (0.57, 0.82) <0.001
Robust Poisson (adj) 0.68 (0.55, 0.84) <0.001
quasi-Poisson (adj) 0.68 (0.54, 0.87) 0.002
Negative Binomial (adj) 0.71 (0.57, 0.89) 0.002
Poisson (adj interactions)* 0.69 (0.58, 0.83) <0.001
Negative Binomial (adj interactions)* 0.72 (0.58, 0.89) 0.002
Poisson (unadj) 0.73 (0.61, 0.86) <0.001
Robust Poisson (unadj) 0.73 (0.58, 0.90) 0.004
quasi-Poisson (unadj) 0.73 (0.57, 0.92) 0.009
Negative Binomial (unadj) 0.73 (0.59, 0.92) 0.005
Emergency hospital admissions
Poisson (adj) 0.73 (0.59, 0.89) 0.002
Robust Poisson (adj) 0.73 (0.58, 0.92) 0.007
quasi-Poisson (adj) 0.73 (0.56, 0.94) 0.017
Negative Binomial (adj) 0.77 (0.61, 0.97) 0.024
Poisson (adj interactions)* 0.73 (0.60, 0.90) 0.003
Negative Binomial (adj interactions)* 0.77 (0.61, 0.98) 0.027
Poisson (unadj) 0.82 (0.68, 0.98) 0.032
Robust Poisson (unadj) 0.82 (0.65, 1.03) 0.091
quasi-Poisson (unadj) 0.82 (0.63, 1.06) 0.126
Negative Binomial (unadj) 0.83 (0.65, 1.06) 0.120
Potentially avoidable emergency admissions
Poisson (adj) 0.72 (0.51, 1.00) 0.052
Robust Poisson (adj) 0.72 (0.50, 1.02) 0.064
quasi-Poisson (adj) 0.72 (0.48, 1.07) 0.106
Negative Binomial (adj) 0.72 (0.51, 1.02) 0.061
Poisson (adj interactions)* 0.72 (0.51, 1.00) 0.054
Negative Binomial (adj interactions)* 0.72 (0.51, 1.02) 0.062
Poisson (unadj) 0.75 (0.55, 1.02) 0.071
Robust Poisson (unadj) 0.75 (0.54, 1.05) 0.098
quasi-Poisson (unadj) 0.75 (0.52, 1.09) 0.137
Negative Binomial (unadj) 0.75 (0.53, 1.06) 0.091
Elective admissions
Poisson (adj) 0.92 (0.54, 1.55) 0.741
Robust Poisson (adj) 0.92 (0.46, 1.82) 0.801
quasi-Poisson (adj) 0.92 (0.43, 1.94) 0.817
Negative Binomial (adj) 1.29 (0.64, 2.63) 0.445
Poisson (adj interactions)* 0.92 (0.54, 1.55) 0.749
Negative Binomial (adj interactions)* 1.28 (0.63, 2.63) 0.459
Poisson (unadj) 0.79 (0.50, 1.24) 0.307
Robust Poisson (unadj) 0.79 (0.43, 1.45) 0.447
quasi-Poisson (unadj) 0.79 (0.44, 1.41) 0.427
Negative Binomial (unadj) 0.72 (0.37, 1.39) 0.318

The impact of providing enhanced support for care home residents in Rushcliffe: Technical appendix26
Outcome Model Point estimate 95% CI P-value
Outpatient attendances
Poisson (adj) 1.13 (1.00, 1.28) 0.056
Robust Poisson (adj) 1.13 (0.90, 1.42) 0.307
quasi-Poisson (adj) 1.13 (0.90, 1.41) 0.296
Negative Binomial (adj) 1.11 (0.88, 1.40) 0.372
Poisson (adj interactions)* 1.13 (1.00, 1.28) 0.056
Negative Binomial (adj interactions)* 1.10 (0.87, 1.39) 0.429
Poisson (unadj) 1.08 (0.96, 1.20) 0.195
Robust Poisson (unadj) 1.08 (0.84, 1.39) 0.564
quasi-Poisson (unadj) 1.08 (0.83, 1.39) 0.569
Negative Binomial (unadj) 1.12 (0.88, 1.43) 0.341
Hospital bed days~
Poisson (adj) 0.87 (0.81, 0.92) <0.001
Binomial (adj) 0.86 (0.81, 0.92) <0.001
quasi-Binomial (adj) 0.86 (0.57, 1.29) 0.469
Poisson (unadj) 0.92 (0.87, 0.98) 0.006
Binomial (unadj) 0.88 (0.83, 0.93) <0.001
quasi-Binomial (unadj) 0.88 (0.58, 1.34) 0.555
Deaths outside of hospital
Binomial (adj) 1.07 (0.53, 2.15) 0.851
quasi-Binomial (adj) 1.07 (0.53, 2.15) 0.852
Binomial (unadj) 0.87 (0.52, 1.45) 0.590
quasi-Binomial (unadj) 0.87 (0.52, 1.45) 0.591
Deaths~
Binomial (adj) 0.97 (0.73, 1.30) 0.852
quasi-Binomial (adj) 0.97 (0.73, 1.30) 0.854
Binomial (unadj) 1.03 (0.81, 1.31) 0.808
quasi-Binomial (unadj) 1.03 (0.81, 1.31) 0.808
Note: Endpoints were adjusted for age, gender, ethnicity, all hospital activity in the previous year (year -1), potentially avoidable admissions and emergency admissions in the year prior to that (year -2), the Charlson Index, frailty comorbidities and other comorbidities associated with readmissions and seasonality. In addition, endpoints were adjusted for care home type, age group specialisation, size of care home, locality (rural vs urban) and IMD decile.
Selected models in bold.
*Endpoints were adjusted for all the above variables, as well as interaction age*gender and age squared.
~no satisfactory model was found.

27The impact of providing enhanced support for care home residents in Rushcliffe: Technical appendix
This section provides further details on the strengths and weaknesses of the analysis.
By linking patient registration data and CQC data with hospital administrative data, the IAU had access to a novel and unique database. It included all care home residents aged 65 or over, regardless of whether they used hospital services while in the care home, and regardless of whether they were funded by the local authority or privately. However, due to the character of patient registration data, records are only updated if a patient reports a change of address to a general practice. One concern was that Principia residents are encouraged to change to the aligned GP on moving to the care home, and therefore may have been more likely to have updated their address details than residents in the comparison areas.
The analysis was restricted to residents who had at least one inpatient hospital admission in the two years before moving to the care home, since hospital data was required to identify baseline comorbidities. The analysis was also restricted to new residents who had not previously resided in a care home. As a result, the findings apply only to this subset of residents and may not be generalizable beyond this group.
One of the main threats to the validity of this study was unobserved confounding. In our case, this could occur at area, care home or resident level. Geographically local controls are normally preferred for matching, as this minimises the risk of differences in context that might impact on outcome,1 but local comparison residents within the CCG or local authority were not possible for this study, as the Principia enhanced support encompassed the whole CCG. If there had been a choice between several local authorities with comparable levels of similarity to Rushcliffe, we would have considered giving preference to local authorities in the geographical vicinity of Rushcliffe. However, the most similar areas with no care home interventions were situated further away. In this study we matched on a range of observed variables (such as age and prior number of hospital admissions; whether in a nursing or residential home), but there may be differences between these groups that we did not observe (such as level of need, either at an individual or care home level, or availability of palliative care outside of the care homes) and that might have contributed to their outcomes. In particular, we were not able to match on care home trends in the pre-period, due to the unavailability of data to determine care home residents prior to August 2014. Our findings might be biased if there were differences that we could not account for. However, it is reassuring that there was similarity in baseline characteristics between Principia and the pool of potential residents even before matching, as well as the fact that our limited sensitivity analyses did not show any indication of bias.
Health conditions at baseline were calculated from primary and secondary diagnosis fields in the SUS data. Although the study benefits from a single, national database of secondary care activity, in practice there are differences in coding and coding depth between
5. Strengths and weaknesses of the analysis

The impact of providing enhanced support for care home residents in Rushcliffe: Technical appendix28
hospitals19 that may bias the detection of comorbidities.20 Furthermore, there may be other differences in the characteristics of acute trusts that we are not able to allow for, such as differences in mortality or admission thresholds across different hospitals.
There is a risk that the Principia enhanced support could lead to care home selection bias. As the enhanced support becomes better known and positive results are announced, residents may choose Principia care homes over other care homes. Details about the enhanced support, as well as positive results of a local evaluation, have been disseminated over the last year.21 However, it is likely that people tend to prioritise other factors when choosing a care home, such as the proximity to family. As the enhanced support was implemented across the whole of Rushcliffe, this kind of selection bias is unlikely to be a large issue, especially at this early phase of the implementation of the enhanced support.
The use of a matched comparison group was intended to isolate the impact of a specific set of interventions, and we are not aware of any other changes that occurred within Principia or the pool of comparison areas in 2014/15. However, the outcomes may have been affected by other service changes happening during the follow-up period that we were not aware of, eg, if a step down care centre was opened.
Care home characteristics were taken from CQC data. These data are not designed for research purposes and are not validated accordingly. However, we did some limited in-house validation of the CQC data by comparing it to data on Principia care homes supplied directly from the Vanguard. We found that the CQC data was of sufficiently good quality to use in the manner described in our analyses (see section 2.1).
SUS data are administrative data and has not been subjected to the cleaning rules that Hospital Episode Statistics are. However, the IAU Data Management team performed some data checks and cleaning procedures.
Furthermore, due to limiting address matching to Principia and the comparable areas, we were not able to conclusively determine if a resident had previously resided in a care home.
Start and end dates were only approximate for two reasons. Firstly, we only had access to the monthly NHAIS extracts from August 2014 onwards.* Secondly, there was no information about when the move or death occurred between the monthly extracts. This has several implications: attribution of hospital activity to the follow-up period may be imprecise in cases where hospital activity was close to the start or end date; for example a hospital admission that occurs just after a resident moves into a care home may be wrongly attributed to the pre-period. Furthermore, the study length, used to determine the offset period for each resident, will also be approximate. However, there is no reason to believe that the date within a month that a resident moves or dies is other than random in either group.
We were not able to evaluate other potential impacts of the enhanced support, such as quality of life or improvement in working relationships, as we only had access to secondary care data. Costing secondary care data was out of scope for this study.
* With the exception of the missing extract for December 2014 – see Section 1.1. for more details.

The impact of providing enhanced support for care home residents in Rushcliffe: Technical appendix 29
Although the estimated differences in hospital use were interpreted together with the calculated statistical uncertainty in the form of 95% confidence intervals, these inferences are conditional on the matched data.
Notwithstanding statistical uncertainty and the above limitations, the lower use of emergency care cannot definitely be attributed to the enhanced support introduced in Principia care homes in April 2014. It may be that the care delivered in care homes prior to April 2014 was already leading to less emergency use compared to other areas. Without data enabling the identification of care home residents before the enhanced support was introduced, this possibility cannot be explored.

The impact of providing enhanced support for care home residents in Rushcliffe: Technical appendix30
References
1. Steventon A, Grieve R, Sekhon JS. A comparison of alternative strategies for choosing control populations in observational studies. Health Services and Outcomes Research Methodology. 2015;15:157. Available from doi: 10.1007/s10742-014-0135-8
2. Office for National Statistics (ONS). Methods for National Statistics 2001 area classification for health areas. ONS; 2001. Available from: www.ons.gov.uk/ons/guide-method/classifications/current-standard-classifications/national-statistics-2001-area-classifications/methodology-and-variables/health-areas/methodology.pdf
3. Office for National Statistics (ONS). Methodology note for the 2011 Area Classification for Local Authorities. ONS; 2015. Available from: www.ons.gov.uk/ons/guide-method/geography/products/area-classifications/ns-area-classifications/ns-2011-area-classifications/methodology-and-variables/methodology.pdf
4. NHS Digital. Community Care Statistics. Available from: www.digital.nhs.uk/article/2021/Website-Search?productid=16628&q=Community+Care+Statistics%2c+Social+Services+Activity%2c+England+2013&sort=Relevance&size=10&page=1&area=both#top
5. NHS Digital. NHS Digital Indicator Portal. Available from: https://indicators.hscic.gov.uk/webview
6. Office for National Statistics (ONS). Datasets: Census 2011. Available from: www.ons.gov.uk/methodology/geography/geographicalproducts/areaclassifications/2011areaclassifications/datasets
7. Department for Communities and Local Government (DCLG). Indices of multiple deprivation 2015. DCLG; 2015. Available from: www.gov.uk/government/statistics/english-indices-of-deprivation-2015
8. NHS England. Spreading new care models. 23 February 2017. Available from: www.england.nhs.uk/ourwork/futurenhs/new-care-models
9. Gladman J, Masud T, Sahota O, Logan P, Gordon AA, et al. East Midlands Research into Ageing Network (EMRAN) Discussion paper series: Health care for older people research in Nottingham and Derby. EMRAN; 2015. Available from: www.nottingham.ac.uk/emran/documents/issue-5-emran-sept-2015.pdf
10. Sekhon JS, Grieve RD. A matching method for improving covariate balance in cost-effectiveness analyses. Health Economics. 2012;21(6):695–714. Available from doi: 10.1002/hec.1748
11. Sekhon J. Multivariate and propensity score matching software with automated balance optimization: The matching package for R. Journal of Statistical Software. 2011;42(7):52. Available from: http://sekhon.berkeley.edu/papers/MatchingJSS.pdf
12. Diamond A, Sekhon J. Genetic matching for estimating causal effects: A general multivariate matching method for achieving balance in observational studies. The Review of Economics and Statistics. 2012;95:932–45. Available from: http://sekhon.polisci.berkeley.edu/papers/GenMatch.pdf
13. Billings J, Blunt I, Steventon A, Georghiou T, Lewis G, Bardsley M. Development of a predictive model to identify inpatients at risk of re-admission within 30 days of discharge (PARR-30). BMJ Open. 2012;2(4):e001667–e001667. Available from: http://bmjopen.bmj.com/content/2/4/e001667
14. Austin PC. Balance diagnostics for comparing the distribution of baseline covariates between treatment groups in propensity-score matched samples. Statistics in Medicine. 2009;28(25);3083–3107. Available from doi: 10.1002/sim.3697
15. Normand S-LT, Landrum MB, Guadagnoli E, Ayanian JZ, Ryan TJ, Cleary PD, et al. Validating recommendations for coronary angiography following acute myocardial infarction in the elderly: a matched analysis using propensity scores. Journal of Clinical Epidemiology. 2001;54(4);387–98. Available from doi: 10.1016/S0895-4356(00)00321-8
16. Imai K, King G, Stuart EA. Misunderstandings between experimentalists and observationalists about causal inference. Journal of the Royal Statistical Society Series A: Statistics in Society. 2008;171:481–502. Available from doi: 10.1111/j.1467-985X.2007.00527.x
17. West SG, Thoemmes F. Campbell’s and Rubin’s perspectives on causal inference. Psychological Methods. 2010;15(1):18–37. Available from doi: 10.1037/a0015917
18. Steventon A, Bardsley M, Billings J, Georghiou T, Lewis G. An evaluation of the impact of community-based interventions on hospital use. Nuffield Trust; 2011. Available from: www.nuffieldtrust.org.uk/research/an-evaluation-of-the-impact-of-community-based-interventions-on-hospital-use
19. Bottle A, Aylin P. Comorbidity scores for administrative data benefited from adaptation to local coding and diagnostic practices. Journal of Clinical Epidemiology. 2011;64(12):1426–33. Available from doi: 10.1016/j.jclinepi.2011.04.004
20. Wennberg JE, Staiger DO, Sharp SM, Gottlieb DJ, Bevan G, et al. Observational intensity bias associated with illness adjustment: cross sectional analysis of insurance claims. BMJ. 2013;346:f549. Available from: www.bmj.com/content/346/bmj.f549
21. NHS Rushcliffe Clinical Commissioning Group. Principia MCP Vanguard. Available from: www.rushcliffeccg.nhs.uk/principia-mcp-vanguard/


The Health Foundation90 Long Acre, London wc2e 9rat +44 (0)20 7257 8000e [email protected]
@HealthFdnwww.health.org.uk
Sign up for our newsletterwww.health.org.uk/enewsletter
The Health Foundation is an independent charity committed to bringing about better health and health care for people in the UK.
We believe good health and health care are key to a flourishing society. Through sharing what we learn, collaborating with others and building people’s skills and knowledge, we aim to make a difference and contribute to a healthier population.Registered charity number: 286967
Registered company number: 1714937© 2017 The Health Foundation
Acknowledgements
The Improvement Analytics Unit is a partnership between the Health Foundation and the
Operational Research and Evaluation Team at NHS England.
This briefing was authored by Therese Lloyd, Arne Wolters and Adam Steventon from the
Health Foundation, based on analysis undertaken by the Improvement Analytics Unit. The wider
Improvement Analytics Unit team also includes Sarah Blundell, Richard Brine, Martin Caunt,
Stefano Conti, Caroline Gori, Carlotta Greci, Creina Lilburne, Stephen O’Neill, Filipe Santos,
Florence Starr and Charles Tallack.
The Improvement Analytics Unit reports to an Oversight Group and has established a Technical
Advisory Group. We are grateful to members of these groups for their support and advice,
as well as to Fiona Callaghan, Elizabeth Harris and Robert Taylor from NHS Rushcliffe Clinical
Commissioning Group for their continued support.
Errors or omissions remain the responsibility of the authors alone.