technical assessment gi-193, bwr eccs suction concerns
TRANSCRIPT

i Attachment 2
Technical AssessmentGSI-193, BWR ECCS Suction Concerns
Relevant Experiments and General Reviewof Selected Thermal-hydraulic Phenomenon Effecting the Ingress
of Non-condensable Gases in the BWR ECCS SystemDuring a HELB Accident
Prepared by:Alexander Velázquez-Lozada
10/25/2005

ii Attachment 2
TABLE OF CONTENT
Page
EXECUTIVE SUMMARY. . . . . . . . . . . . . . . . . . . . . . . . . . . . . . . . . . . . . . . . . . . . . . . . . . . . . . iii
1. INTRODUCTION. . . . . . . . . . . . . . . . . . . . . . . . . . . . . . . . . . . . . . . . . . . . . . . . . . . . . . . 1
2. SUPPRESSION POOL EXPERIMENTS . . . . . . . . . . . . . . . . . . . . . . . . . . . . . . . . . . . . 1
2.1 VTT-LTKK blowdown experiment .. . . . . . . . . . . . . . . . . . . . . . . . . . . . . . . . . . 1
2.2 Palo Verde Experiments . . . . . . . . . . . . . . . . . . . . . . . . . . . . . . . . . . . . . . . . . . . 4
2.3 GESSAR (General Electric Proprietary Information) . . . . . . . . . . . . . . . . . . . . . 4
3. LIQUID JETS .. . . . . . . . . . . . . . . . . . . . . . . . . . . . . . . . . . . . . . . . . . . . . . . . . . . . . . . . 5
3.1 Gas entrainment caused by plunging liquid-jets . . . . . . . . . . . . . . . . . . . . . . . . 5
4. POOL DYNAMICS - VORTEX .. . . . . . . . . . . . . . . . . . . . . . . . . . . . . . . . . . . . . . . . . . . 8
5. TWO PHASE FLOW THROUGH PERFORATED PLATES . . . . . . . . . . . . . . . . . . . . . 9
6. BUBBLE DEFORMATION .. . . . . . . . . . . . . . . . . . . . . . . . . . . . . . . . . . . . . . . . . . . . . . 10
7. GAS BUBBLE TERMINAL VELOCITY . . . . . . . . . . . . . . . . . . . . . . . . . . . . . . . . . . . . . 10
8. SUMMARY . . . . . . . . . . . . . . . . . . . . . . . . . . . . . . . . . . . . . . . . . . . . . . . . . . . . . . . . . . 12
REFERENCES .. . . . . . . . . . . . . . . . . . . . . . . . . . . . . . . . . . . . . . . . . . . . . . . . . . . . . . . . . . 13
FIGURES
1. VTT-LTKK Condensation pool experimental facilities . . . . . . . . . . . . . . . . . . . . . . . . . . . . 2
2. Terminal Velocity of Bubbles in Settled Water at 20 Degrees Celsius . . . . . . . . . . . . . . 11

iii Attachment 2
EXECUTIVE SUMMARY
This report is part of the technical assessment of the Generic Safety Issue (GSI) 193, “BWRECCS Suction Concern.” This report is submitted to complete one of the milestone included inthe task action plan to resolve this generic issue. The task action plan involves three phases. The first phase is subdivided in three sections. This report correspond to Part B of the firstsection, named: Pool dynamics. The Pool dynamic section has three parts.
The main objective of this report is to present the results of a literature review of relevantexperiments and selected thermal-hydraulics phenomenom occurring during the blowdownphase of a high energy line break (HELB) in Boiling Water Reactors (BWRs).
The most significant experiment of study found, was performed by the Technical ResearchCentre of Finland (VTT) and Lappeenranta University of Technology (LTKK), in 2004. Thisexperiments studied the potential of gas ingress into the ECCS system of a BWR Nuclear Power Plant (NPP), caused by an injection of a liquid-gas jet into the suppression pool. The model used for the study can be compared with a typical Mark-II BWR containment. The purpose ofthis experiment is related with the main objective of generic safety issue (GSI) 193, “BWRECCS suctions concerns,” which is to assess the potential of BWR ECCS pump performancedegradation as a result of non-condensable gas entering into the pumps suction path. In theexperiment preformed by VTT and LTKK, 5% void fraction was detected in the ECCS pipeduring duration of the blowdown process.
Separate tests on void fraction (VF) demonstrated that, from 100% to 75% design flow-rate, asingle-stage pumps start to degrade at 3% VF and degraded considerably at 7% VF. Pump flowwas not completely stop at this flow rate. For 33% to 17% design flow-rate the pumpperformance degraded at void fractions lower than 3% VF and collapsed completely at 7% VF. For the case of 7% VF the recovery-time of the pump was 30 seconds after the injection of airwas suspended. In addition this experiment helped to understand and identify to types of jetsoccurring during the blowdown phase of a HELB. This two jets are (1) the liquid jet followed bya column of non-condensable gases and (2) the subsequent non-steady gas-jet. This two jetshave been identified as (1) the primary sources of gas injected into the suppression pool, (2) themechanism that break the large bubbles, and the (3) mechanism that induce a recirculationmotion inside the suppression pool. In VTT-LTKK experiments, small bubbles were trap in thisrecirculation motion, increasing the potential of gas ingress into the ECCS system.
Similar experiments, on centrifugal pumps, were performed in the United States by ArizonaPublic Service (APS) for Palo Verde Nuclear Generating Station (PVNGS). NRC identifiedseveral uncertainties in these experiments, and incorporated them to estimate a change in coredamage frequency of 5.7 x 10⁻⁶.
This report, also summarizes potential analytical tools to estimate the amount of gas in thesuppression pool. These analytical tools and experiments results will be used in Part C of thePool dynamics section of GSI-193 Task Action Plan Phase I.

1 Attachment 2
1. INTRODUCTION
This report describes relevant experiments and theoretical analysis pool phenomena at a BWRsuppression containment during a high energy line break (HELB) BWRs. Several phenomenaoccur at the same time during a blowdown process. These phenomena are affected by thegeometry of the suppression pool, magnitude or severity of the accident, thermodynamicsconditions at the time of the accident, and the response of the emergency core cooling system(ECCS). The amount of gas entering in the ECCS system depends of the combination of all thisfactors. This report presents experiments performed in suppression pools, and general thermal-hydraulics experiments and concepts of phenomena that increase or decrease the potential ofgas ingress into the ECCS pump suction path.
The first section summarizes an experiment performed by the Technical Research Centre ofFinland (VTT) and Lappeenranta University of Technology (LTKK) [Ref. 1]. This experimentquantifies the amount of gas entering into typical Mark-II NPP ECCS system and the effects it has onthe ECCS pump performance. In addition this experiment describe the types of jets, which occur during the blowdown phase of a HELB. Those are (1) the liquid jet followed by a columnof non-condensable gases and (2) the subsequent non-steady gas-jet. The first type of jetdrives the initial motion of the fluid in the suppression pool. The second type provides the mainsources of non-condensable gases with the potential to enter into the ECCS system and asecondary force that superimposed over the initial motion of the fluid.
The following two sections summarize experiments and analytical tools to estimate the size ofbubbles generated by liquid jets and by vortex also induced by the liquid jets.
The last two section present experiments of two-phase counter-flow through perforated platesand introduces the two non-dimensional numbers proposed to describe the deformation of gasbubbles at the ECCS strainer surface.
2. SUPPRESSION POOL EXPERIMENTS
2.1 VTT-LTKK blowdown experiment
In 2002, the Technical Research Centre of Finland (VTT) and Lappeenranta University ofTechnology (LTKK), conducted experiments to study the effects of injection of non-condensablegases (air) into a typical Mark-II Nuclear Power Plant (NPP) condensation-pool. The main objective ofthese experiments was to study the possibility of gas ingress into the ECCS system during theblowdown phase of a HELB. In addition, studies were performed on the effect of non-condensable gases entering into a single-stage centrifugal pump, by injecting gas directly intothe up-stream of the ECCS pump [Ref. 1, and 2]. Units are presented in SI followed by Englishunits in parentheses.
The experimental facilities were design to simulate one-forth scale of the Mark-II NPPcondensation pool (suppression pool). The location of the vents (downcomers) and strainers inthe Mark-II plant can be compare with a BWR Mark-II suppression containment. The

2 Attachment 2
downcomers in the Mark-II NPP has a diameter of 0.6 meter (1.96 foot) and are located6.4 meters (21 foot) below the suppression pool water-level. The penetration of the strainersuction-pipe is at the vertical wall of the containment at 5.8 meters (19 foot) below water-level. The strainer has a form of a box with perforations of 4 millimeters diameter. The total area of thestrainer is 32 m2 (344.4 ft2) with a total hole are of 8.4 m2 (90.4 ft2). The density is 20,889 holesper square meter. Figure1 presents the general configuration of the experimental facilities ofthe VTT-LTKK condensation pool experiments.
Strainer
Water Level
Downcomers
1.0 (3.26)
2.2 (7.2)
3.2 (10.5)
0.5 (1.65)
0.45 (1.47)
0.213 (0.69) 0.162 (0.53)
Figure 1. VTT-LTKK Condensation pool experimental facilities; meters (foots)
For experimental purpose it is assumed that the low pressure pump is drawing water from asingle strainer at a minimum mass-flow rate of 25 kg/s (396 gpm, STD H2O) at the same timethe containment spray pumps are drawing at full capacity of 75 kg/s (1188.7 gpm, STD H2O),from the same strainer, for a total of 100 kg/s (1585 gpm, STD H2O) of mass-flow rate perstrainer.

3 Attachment 2
The physical model used for the experiment has two blowdown-pipes with 0.162 (0.53 foot) and0.213 (0.69 Foot) meters in diameter and a submergence of 2.2 meters (7.2 foot)). The waterlevel in the suppression pool is 3.2 meters (10.49 foot).
The volumetric flow-rate and initial velocity of the jet used in the experimental facilities tosimulate the Mark-II NPP blowdown is about 0.14 m3/s (4.94 ft3/s)and over 40 m/s respectively(131.2 foot). The set of blowdown experiments where done for three cases. The first case waswithout strainer and without pump, the second with strainer and without pump, and the third withstrainer and pump. A fourth series of test were done with the pumps running separately.
For the first series of tests, two types of jet were without the stainer neither the pump. One jethad the downcomer partially filled with water and the other jet had the downcomer clear ofwater. The water level inside the partially-filled downcomer corresponds to the water level ofthe suppression pool. This two jets exhibited different behaviors. In the partially-filled case, thefollowing column of air hit the bottom of the pool and broke-up into small bubbles. Theobserved jet, hitting the bottom of the pool, reached a maximum diameter of 0.9 meter(2.95 foot) which is 4.2 times wider than the downcomer diameter. Two seconds after the initialblowdown, the presence of small bubbles obstructed the sight into the suppression pool. After15 seconds, the amount of bubbles reduced to a level were it was possible to observed thedowncomer again.
On the other hand, in the case of a gas-jet with a cleared downcomer, the initial jet did not touchthe floor. The jet was rather symmetrical and formed a bubble of approximately 0.9 meter,which is similar to the diameter of the jet for the partially-filled case. In this two cases just onepipe was injected air for 19 seconds. In some of the tests with two downcomers, air wasinjecting for approximately 9 seconds. In those cases the present of small bubbles, goingdownwards, were observed after 10 seconds.
The second series of tests were done with the presence of a strainer in the suppression pool. For this test, a camera was installed inside of the strainer to analyze the possibility of gasingress into the strainer. During all the tests the strainer was surrounded by air bubbles formore than 30 seconds, at the time air bubbles were observed inside strainer.
The third series of tests were done with the presence of a strainer and the ECCS pump drawingwater from the suppression pool at a constant mass-flow rate of 100 kg/s (1585 gpm, STD H2O)since the beginning of the blowdown. Air was injected for 20 seconds. Air bubbles wereobserved into the suction pipe for the 20 seconds of blowdown when the air was injectedthrough the two downcomer pipes. A rough calculation estimate 5% of void fraction. The pumphead and the volumetric flow did not degraded at that void fraction.
The fourth series of tests were done to the pump running separately. The pump was exposedto void fractions higher than 7%. For water flow rates of 75 kg/s (1188 gpm, STD H2O) and57 kg/s (903 gpm, STD H2O) the pumps start to degrade at 3% and degraded considerably at7%. The pumps did not collapsed completely at this flow rates. For water flow rates of 25 kg/s(396 gpm, STD H2O) and 12.5 kg/s (198 gpm, STD H2O) the pump performance degraded atvoid fractions lower than 3% and collapsed completely at 7%. For the case of 12.5 kg/s

4 Attachment 2
(198 gpm, STD H2O) the recovery-time of the pump was 30 seconds after the injection of airwas suspended.
From this experiment VTT concluded that the gas entered into the ECCS system of Mark-IINPP during a HELB is small enough to not challenge the operability of the ECCS pumps. Similar tests, on Pressurized Water Reactors (PWR) ECCS pumps, were performed by ArizonaPublic Service (APS) Company in United States on 2004. The next section summarize theresults of this tests and the uncertainties involved with the methodology.
2.2 Palo-Verde experiments
On July 2004, Arizona Public Service (APS) discovered that a significant section of thecontainment sump safety-injection-piping at all three Palo Verde Nuclear Generating Stations(PVNGS) were voided with gas [Ref. 3].
APS performed a series of tests to analyze the transport of this void inside the ECCS pipe ofPVNGS and to analyze the impact of this void on ECCS pump performance. Several scenariosof void-fraction versus time were defined from the one-eight scale transport-tests. Multi-stageand single-stage were tested for these scenarios.
Although these tests provided a useful insight of the pump performance, NRC identifieduncertainties on the tests methodology that could have an impact in the overall conclusionsregarding the availability of the ECCS pumps following a loss-of-coolant-accident (LOCA). Afteraccounting for these uncertainties, NRC estimated a change in core damage frequencyof 5.7 x 10⁻⁶.
2.3 GESSAR (General Electric Proprietary Information)
A significant amount of experiments were performed in the 1970s by General Electric to analyzethe hydrodynamics loads, caused by the blowdown forces over the structure and components ofBWR suppression pools. These experiments were documented in the General ElectricStandard Safety Analysis Reports (GESSARs). These experiments studied liquid-gas tounderstand and quantify the hydrodynamics loads caused by the initial blowdown of a BWR, butnot the potential of gas ingress into the ECCS system. In addition these experiments did notincorporate the strainers, neither the effect of gas ingress to the ECCS pumps performance[Ref. 4, 5, 6, and 7].

5 Attachment 2
3. LIQUID JETS
Some experiments has been done to estimate the size and behavior of the bubbles formedduring the initial gas injection in BWRs [Ref. 8]. But most of these experiments did notincorporated bubble break-up, neither the influence of the initial liquid clearance from the pipe. The initial clearance of the partially submerge downcomer induces a liquid jet, which force hasbeen observed to break bubbles and create a recirculation motion [Ref. 1 and 2].
In experiments, described in previous sections, was observed that this initial liquid-jet has thepotential to pull the gas bubbles to the bottom of the pool and break it in very small bubbles. Literature about this specific phenomena was not found, but literature of a similar phenomenawas found. This similar phenomena is liquid-jets plunging over free water surface.
A substantial amount of experiments have been done in the area of gas-entrainment caused byplunging liquid-jets, which force and potential to break bubbles can be compare with forces of asubmerge liquid jet.
This information is important to estimate the amount of non-condensable gases in a BWRsuppression pool during the evolution of a HELB. The following two section summarizes someof the theories and experiments of plunging liquid jets.
3.1 Gas entrainment caused by plunging liquid-jets
The literature presented in this section study the formation, break-up, and size distribution ofbubble in plunging liquid-jets. This section begins with a review of a study, where preliminaryassumptions of the behavior of submerged jets were done, and discuss some limitations ofthose assumptions. The rest of this section presents experimental and theoretical studies thatcan be used to analyze the liquid-gas jet phenomena during the blowdown phase in BWR
In 1977, J.F. Moody performed a review of submerged liquid-jets in BWR suppression pools[Ref. 9] . Based on Helmholtz instability and turbulent layer characteristics, Moody determinedthat shear forces and pressure gradients are negligible. Through observation and analyticalmodel, Moody concluded that a submerged liquid-jet at high velocities can penetrate longdistances without significant spreading. Moody concluded that shear forces and pressuregradients are negligible. This assumption is useful for liquid jet alone. When non-condensablegases are incorporated in the analysis, the interfacial shear stress should to be consider. That is the case when the liquid is ejected completely out of the downcomer, into thesuppression pool, follow by a bubble of non-condensable gases during. which is thephenomena analyzed in GSI-193. As previously mentioned, this phenomena can be comparewith plunging liquid jets.
The plunging jets are column of liquid injected to a free water surface. The edge of thecylinder-jet induces a strong shear force. This shear force causes the gas around the jet toenter into the liquid pool [Ref. 10]. In BWRs the jet of liquid is injected though a submerged

6 Attachment 2
pipe and followed by a bubble of non-condensable gases. Although this two scenarios aredifferent, we can establish an analogy between the shear forces that non-condensable gasesexperience at the edge of the pluning liquid-jet and shear forces experienced by non-condensable gases in the submerged liquid jet in a BWR suppression pool during a HELB.
One of the most typical non-dimensional numbers, used in the following experiments to estimatethe maximum size of stable bubbles in a viscous flow, is the Weber number. The Webernumber (Equation-1) establish the ratio of inertia to surface-tension a bubble experiences in aviscous flow [Ref. 11].
Equation-1WeV dl=
ρσ
2
WhereDl = liquid density,V = fluid velocity,d = bubble diameter, and F = interfacial surface tension.
Researchers from the University of New Castle, Australia, performed experiments of plungingjets over free surface water [Ref 10]. They found that with a Weber number of 1.2, themaximum size of the bubbles can be predicted within 20% of the measured values. Theyassumed that, for this set of experiments, the eddies responsible of breaking the bubbles areisotropic and the bubbles lies within the inertial sub-range of the Kolmogoroff scale. In this casethe bubbles would be small, compared to the turbulent macroscale; and large compare to theturbulent microscale. The kinetic energy would be independent of viscosity, and the velocitycan be defined in terms of energy dissipation rate (Equation-2).
Equation-2Vd2 2 0=
⎛⎝⎜
⎞⎠⎟.
ερ
Whereg = energy-dissipation-rate per unit volume.
The energy dissipation rate was calculated from the energy balance across the mixing zonevolume; following the analysis of Cunningham (1974) for a liquid jet gas pump. Aftersimplification and adaptation of the energy balance equation, the expression for the energydissipation-rate yield:
Equation-3( ) ( )[ ]ερ
λ λ≈ − − + + +uL
b b b bj3
2 31
2 312
2 1 2 1

7 Attachment 2
WhereL = mixing length,uj = liquid jet velocity,b = jet/column area ratio, and81 = inlet gas/liquid volumetric flow ratio.
The diameter of liquid jets used for the experiment were 44, 74, and 95 millimeters (1.73, 2.91,and 3.74 inches). The average velocity was 11.5 m/s (37.73 ft/s). The liquid and gas usedwere water and air at standard atmospheric conditions. The mixing length was between therange of 0.07 (0.23 foot) and 0.25 meters (0.82 foot) . The sizes of bubble observed in thisexperiment were from 0.22 (0.0086 inch) to 0.72 millimeters (0.028 inch). The size distributionwas fitted by a log-probability relationship, and the ratio of the Sauter mean diameter to themaximum measured bubble size was equal to 0.61. The average void fraction in the mixingzone was around 11%.
Similar experiments were conducted by Rensselaer Polytechnic Institute (RPI), New York, in1993, for two type of liquid plunging jets [Ref. 12]. The two type of jets were smooth andturbulent jets. The mean velocity of both jets were about 5 m/s (16.4 ft/s); and with an initialdiameter of 5 millimeters (0.19 inch). The smooth jet produces bubbles within the range of0.015 (0.00059 inch) and 0.3 millimeters (0.0118 inch) in diameter. On the other hand. Theturbulent jet generated bubbles with diameters within the range of 1.0 (0.039 inc) and3.0 millimeters (0.118 inch). It was found that the buoyancy force for bubbles with diametersless than 0.02 millimeters (0.00078 inch), is almost negligible. This bubbles traveled at samevelocity and direction of the flow. For the turbulence jet, it was observed void fractions over20% in the mixing zone. In addition, it was observed that the void fraction increases with theincrease in turbulence. The turbulence in jet was increased by adding internals inside theliquid-jet nozzle outlet and increasing the distance between the outlet and the water surface. This work establishes a significant difference between the bubble sizes generated by laminar(smooth) jet and turbulent (rough) jets.
In previous investigations, the group of scientists from Australia, used acoustic techniques toestimate the distribution of bubble sizes produced by plunging jets [Ref. 13]. The experimentalfacilities used a nozzle of 0.025 meters (0.082 foot) diameter. The jet distance from the watersurface and velocity was varied to analyze their impact in bubble sizes. It was found that forvelocities between 2.3 (7.54 ft/s) and 4.4 m/s (14.4 ft/s) the amount of gas entrained differs butnot the size distribution, for which the most abundant size of bubbles in the experiments was1 mm (0.039 inches). The population of larger bubbles diminishes logarithmically and theamount of bubbles smaller than 1mm (0.039 inches) was very small. This work corroborate therange of bubbles size found by (RPI) in turbulent jets. In addition it provide useful informationto estimate a distribution of bubbles sizes.
Most of this experiments were performed at relative small scales. General considerations andranges of applicability should be establish for future analysis using this information. Furtherinvestigations demonstrated the effects that model scales has in the air entrainment of liquidplunging jets [Ref. 14]. It was found that model studies with Weber number lower than 1000 will

8 Attachment 2
underestimate air entrainment when prototypes flow has weber numbers greater than 1000.
In addition to the liquid jet, the recirculation motions presents in the suppression pool cangenerate shear forces that can break-up bubbles injected after the initial liquid jet. The nextsection summarizes some experiments performed to estimate the size and distribution ofbubbles inside an irotational vortex.
4. POOL DYNAMICS - VORTEX
In addition of generating a strong interfacial shear force, it was observed that the initial liquid-jetinduces a recirculation motion in BWRs suppression pools [Ref. 1 and 2]. Although thisrecirculation motion (vortex) dissipates with time, its been observed in previous experiments thatit induces strong downward motions, capable to capture small bubbles in its main stream. Thisrecirculation motion can be compare with a Hills’ vortex [Ref. 15].
An interdisciplinary group of scientists conducted experiments to analyze the bubble break-upand estimate the size of bubbles in a Hills’ vortex [Ref. 16]. They proposed the followingequation to estimate maximum stable bubble radius:
Equation-4( ) ( )
( )( )r
We R
K U rbc
l L
max=
−⎛
⎝
⎜⎜⎜
⎞
⎠
⎟⎟⎟
=
σ δ
ρ
4
0
23 2128
1
Where:Wec = critical Weber number,F = interfacial surface tension,R = vortex radius,* = jet thickness,r = radius from the center of the vortex stagnation point to the wall,K = proportionality constant (0.38), andUo = jet velocity.
Although 1.2 is a general accepted value for the Weber number, they found that for this specificphenomena a value of 4.7 is more suitable. This study indicated that the value of 1.2 is basedon an energy dissipation rate and 4.7 is based on velocity profile, which is used in thisexperiment.
Equation-4 provides a potential tool to estimate the continuos break-up of bubbles exposed to asteady liquid jet. The liquid jet and following the liquid-gas jet in BWRs are unsteady during ablowdown process. In addition, the upward motion of the bubbles will superimpose over theinitial recirculation motion and eventually dominate the dynamics of the suppression pool. Bythat time, the assumption of a Hills’ vortex might not be appropriate to define the dynamics of

9 Attachment 2
the suppression pool. Also, scale effects should be consider all the time for any calculation. Saying that, we can predict that several assumptions and bounding conditions has to beestablish in order to make a rough estimation of the inventory of gas in the suppression pooland the size distribution of the bubbles.
The size of the bubbles determines the potential transport of this bubbles into the surface of thestrainer, trespass the strainer, and eventually entering into the ECCS pipe. The followingsection summarizes some experiments of two-phase flow through perforated plates andanalytical tools to analyze bubble deformation.
5. TWO PHASE FLOW THROUGH PERFORATED PLATES
During the blowdown process the strainer could be exposed to three different two-phase flowfields. The first one is the two-phase jet, the second is the exposure of the strainer to theenvelope of the following gas-bubbles, and the third is the bubbly flow through perforated plate. The phenomena of bubbly flow through perforated plate could be observed from the bubblesthat mixes in the suppression pool water.
From some experiments, performed to understand the impact of underwater high energy linebreaks , it was observed that two phase flows over 16 m/s (52.5 ft/s) are extremelyviolent and have a potential to make gas to go through perforations. In this experiment theperforation were too big (100 mm); compared to the typical perforation of the BWR ECCSstrainers (3.175 mm, 0.125 inches).
Another experiments have been performed to estimate the countercurrent flow limitation of gasand liquid [Ref.17]. In these experiments gas and liquid, divided by a perforated plate, flow indifferent directions influenced by gravity. Further experiments included a jet at the top of theperforated plate [Ref. 18]. This experiments where done to analyze the limitation of liquid-jets topenetrate a perforated plate and cool a reactor vessel when steam was flowing against theliquid-jet direction.
In these experiments gas was injected at the bottom of the plate and water at the top. Thesephenomena can be related just with the second type of two-phase flow that ECCS strainerscould experience during a blowdown process. When the envelope of a gas bubble enters in thestrainer a certain volume of gas gets trap inside the strainer. We observed in these experimentsthat this gas exits the strainer very easily, which is similar to the case inside of a strainer whenno suction forces are present. If the ECCS pumps initiates while gas still in the strainer, gascould be drawn into the ECCS pipe. This amount of gas is summed to the amount of bubbles inthe suppression pool that might reach the strainer and flow through the strainer. Once thebubbles reach the strainer, it has to break and/or deform to pass through the strainerperforations. The following section presents a potential approach to analyze the deformation ofbubbles.

10 Attachment 2
6. BUBBLE DEFORMATION
The bubbles in the suppression pool can be driven to the strainer by the recirculation forceinside the pool and by the suction force generated by the ECCS pumps. We can assume thatbubbles of the same or lower diameter than the perforations of the ECCS strainer (3.175 mm,0.125 inches) can flow in and out the strainer without significant resistance. Bubbles of biggerdiameter have to deform or break to flow through the strainer. The tendency of a bubble todeform can be evaluated using the Eövtös (Equation 5) and Morton (Equation 6) numbers[Ref. 19].
Equation-5( )
Ed g
o
l g=
−ρ ρ
σ
2
Equation-6( )
Mgl g l
l=
−ρ ρ µ
ρ σ
4
2 3
WhereDg = gas density,:l = dynamics viscosity, andg = gravity constant.
The tendency that a rising bubble has to deform decreases as the Morton numbers increases. An aspect ratio of a bubble between 0.8 and 1 has been suggested for a range of 1 to10 Eövtös number and 1 to 10-6 Morton number [Ref. 19]. This range can be define as thespherical range of bubbles in viscous flows.
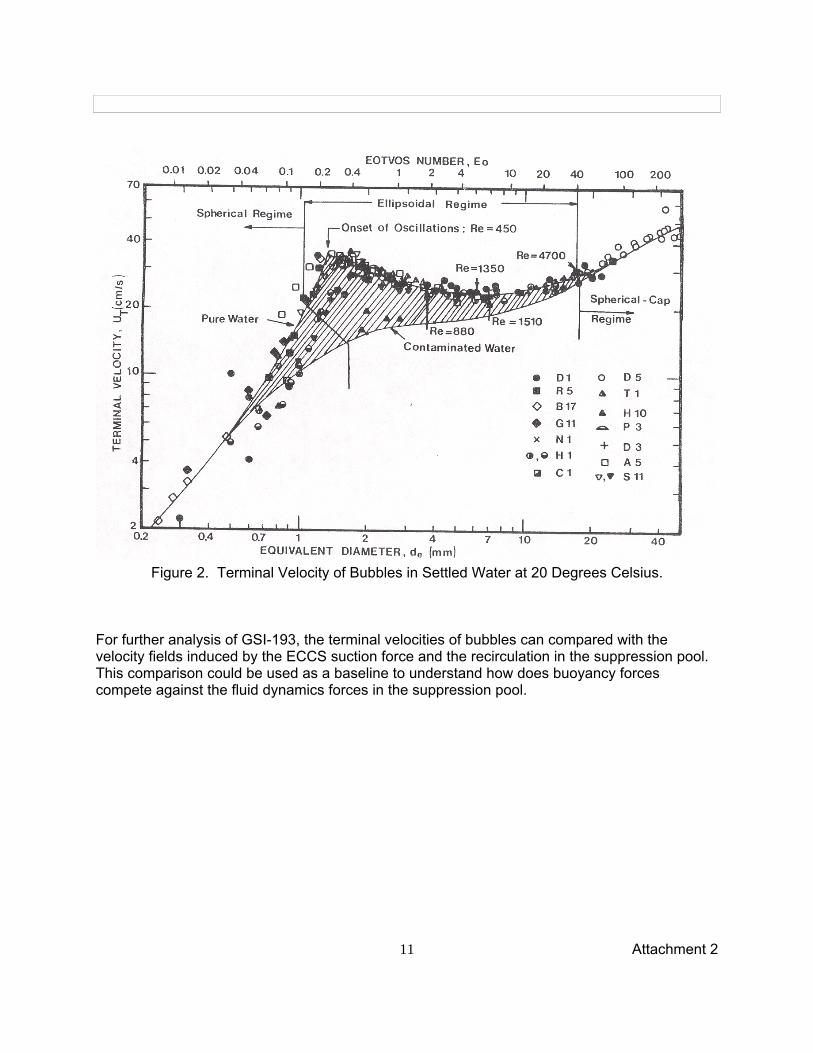
7. GAS BUBBLE TERMINAL VELOCITIES
Gas bubbles tend to rise because of the buoyancy force. Several experiments (including the onerepresented in Figure 2) have characterized the terminal velocities of various gas bubble sizes inboth distilled and contaminated water (water with surfactant) [Ref. 20]. This experimentwas conducted in settled water at an average water temperature of 20 °C.
11 Attachment 2
Figure 2. Terminal Velocity of Bubbles in Settled Water at 20 Degrees Celsius.
For further analysis of GSI-193, the terminal velocities of bubbles can compared with thevelocity fields induced by the ECCS suction force and the recirculation in the suppression pool. This comparison could be used as a baseline to understand how does buoyancy forcescompete against the fluid dynamics forces in the suppression pool.

12 Attachment 2
8. SUMMARY
The most significant experiment included in this summary is an experiment performed by theTechnical Research Centre of Finland (VTT) and Lappeenranta University of Technology(LTKK), in 2004. These experiments studied the potential of gas ingress, into the ECCS system ofthe a typical BWR Mark-II Nuclear Power Plant (NPP), caused by an injection of a liquid-gas jet into thesuppression pool. The model used for the experiments can be compared with a typical Mark-II BWRcontainment. The purpose of this experiment is related with the main objective of generic safetyissue (GSI) 193, “BWR ECCS suctions concerns,” which is to estimate the amount of gas thatcould enter into the BWR-ECCS system during a HELB and the effects on the ECCS pump. Inthis experiment 5% void fraction was detected in the ECCS pipe through the blowdownprocess.
Separate tests on single-stage pump performance demonstrated for water flow rates of 75 kg/s(1188 gpm, STD H2O) and 57 kg/s (903 gpm, STD H2O) the pumps start to degrade at 3% anddegraded considerably at 7%. The pumps did not collapsed completely at this flow rates. Forwater flow rates of 25 kg/s (396 gpm, STD H2O) and 12.5 kg/s (198 gpm, STD H2O) the pumpperformance degraded at void fractions lower than 3% and collapsed completely at 7%. For thecase of 12.5 kg/s (198 gpm, STD H2O) the recovery-time of the pump was 30 seconds after theinjection of air was suspended.
From this experiment VTT concluded that the gas entered into the ECCS system of the during a HELB is small enough to not challenge the operability of the ECCS pumps. Similar tests, on Pressurized Water Reactors (PWR) ECCS pumps, were performed by ArizonaPublic Service (APS) Company in United States on 2004. The next section summarize theresults of this tests and the uncertainties involved with the methodology.
Analytical tools, to estimate the size and distribution of the bubbles, have been suggested in thisliterature review for the blowdown phase of a HELB in the BWR suppression pools.

13 Attachment 2
REFERENCES
[1] Kyrki-Rajamaki, R., and E. Karita Puska, "The Finnish Research Programme on NuclearPower Plant Safety 1999–2002: Final Report," VTT Technical Research Centre ofFinland, 2002.
[2] Laine, J. “Condensation pool experiments with non-condensable gas,” Research ReportLappeenranta University of Technology, Nuclear Safety Research Unit, dated 4/12/2002,This document is proprietary information.
[3] Letter from Mallett, B.S. NRC to Overbeck, G.O, APS, “ Final significance determinationfor a yellow finding and notice of violation - NRC Special Inspection Report 2004-014-Palo Verde Nuclear Generating Station,” dated April 8, 2005.
[4] Fitzsimmons, G.W., Galyardt, D.L., Nixon, R.B., Mann, M.J., and Yu, K.P.,“Mark-I containment program, Full scale test program, Final Report, Task Number 5.11,” GESSAR NEDE-2453, GE Proprietary Information, dated April 1979.
[5] Varzaly, A.M., Grafton, W.A., and Seely, D.S., “ Mark-III confirmatory test program fullscale condensation and stratification phenomena test series 5707,” GESSARNEDE-21853-P, GE Proprietary Information, dated August 1978.
[6] “1/4 - Scale test report, Loads on submerged structures due to LOCA air bubbles andwater jets,” GESSAR NEDE-23817-P, GE Proprietary Information, dated September1978.
[7] “Mark-I containment program 1/4 scale pressure suppression pool swell test program:LDR load tests - generic sensitivity task number 5.5.3, series,” GESSAR NEDE-23545-P,GE Proprietary Information, dated December 1978,
[8] Norris, D.M. Jr., McMaster, W.H., Landram, C.S., Quiñones, D.F., Gong, E.Y., andMacken, N.A., “Computer Calculations of air and steam blowdown suppression,” NuclearEngineering Design 59 (1980) Pags. 301-313
[9] Moody, F.J., “Analytical model for liquid-jet properties for predicting forces on rigidsubmerged structures,” NEDE-21472, GE Proprietary Information, dated September 1977.
[10] Chanson, H., Aoki, S., and Hoque, A., “Physical modeling and similitude of air bubbleentrainment at vertical circular plunging jets,” Chemical Engineering Science 59, (2004)Pags 747-758.
[11] Incropera, F.P. and DeWitt, D.P., Fundamentals of heat and mass transfer, 3rd Edition,John Wiley & Sons, 1990.
[12] Bonetto, F. and Lahey, R.T., Jr., “An experimental study on air carryunder due to a

THIS DOCUMENT CONTAIN PROPRIETARY INFORMATION
14 Attachment 2
plunging liquid jet,” Int. J. Multiphase Flow Vol. 19, No. 2, pp. 281-294, 1993.
[13] Chanson, H. and Manasseh, R., “Air entrainment Process in a circular plunging jet: Void-fraction and acoustic measurements,” Tansactions of the ASME, Vol.125, pp. 910-921,2003.
[14] Chanson, H., Aoki, S., and Hoque, A., “Physical modelling and similitude of air bubbleentrainment at vertical circular pluning jets,” Chemical Engineering Science, 59, pp.747-758, 2004.
[15] Panton, R. L. , Incompressible flow, 2nd edition, John Wiley & Sons, Inc., 1996.
[16] Thorpe, R.b Evans, G.M., Zhang, K. and MAchniewski, P.M., " Liquid recirculation and bubble break-up beneath ventilated gas cavities in downward pipe flow,"
Chemical Engineering Science 56 (2001) 6399 - 6409. [17] Bankoff, S.G, Tankin, R.S., Yuen, M.C., and Hsieh, C.L., “Counter flow of air/water and
steam/water through a horizontal perforated plate,” Int. J. Heat Mass Transfer, Vol. 24, No.8, pp. 1381-1395, 1981.
[18] Dilber, I. And Bankoff, S.G., “ Counter flow limits for steam and cold water through ahorizontal perforated plate with vertical jet injection,” Int. J. Heat Mass Transfer, Vol. 28,No. 12, pp 2385-2388, 1985.
[19] Ohta, M., Imura, T., Yoshida, Y., and Sussman, M., “A computational study of the effect ofinitial bubble conditions on the motion of a gas bubble rising in viscous liquids,”International journal of multiphase flow, 31, pp 223-237, 2005
[20] Cliff, R., Grace, J.R., and Weber, M.E., Bubbles, drops, and particles, Academic Press,Inc., 1978.