technical assessment of the implementation of...
TRANSCRIPT
Technical assessment of the implementation
of Council Directive concerning Urban Waste
Water Treatment (91/271/EEC)
Situation as of 31 December 2009 or 31 December 20010
Annex VIII as of 9 October 2012

This document has been produced by Umweltbundesamt GmbH for the European Commission, DG
Environment. It reflects data reported by Member States as of 31 December 2009 or – in case more recent data was available – as of 31 December 2010. This document does not necessarily represent the official position of the European Commission or of any Member State of the European Union.
Brussels, October 2012.
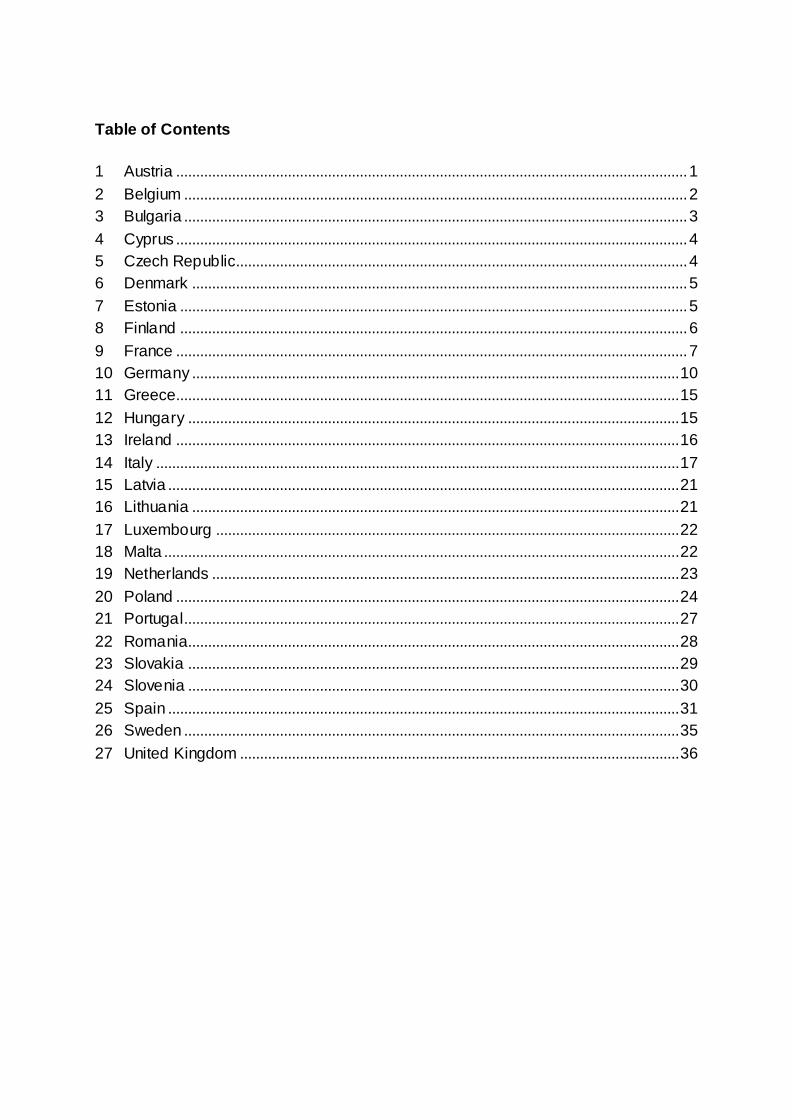
Table of Contents
1 Austria ................................................................................................................................ 1
2 Belgium .............................................................................................................................. 2
3 Bulgaria .............................................................................................................................. 3
4 Cyprus ................................................................................................................................ 4
5 Czech Republic................................................................................................................. 4
6 Denmark ............................................................................................................................ 5
7 Estonia ............................................................................................................................... 5
8 Finland ............................................................................................................................... 6
9 France ................................................................................................................................ 7
10 Germany .......................................................................................................................... 10
11 Greece.............................................................................................................................. 15
12 Hungary ........................................................................................................................... 15
13 Ireland .............................................................................................................................. 16
14 Italy ................................................................................................................................... 17
15 Latvia ................................................................................................................................ 21
16 Lithuania .......................................................................................................................... 21
17 Luxembourg .................................................................................................................... 22
18 Malta ................................................................................................................................. 22
19 Netherlands ..................................................................................................................... 23
20 Poland .............................................................................................................................. 24
21 Portugal............................................................................................................................ 27
22 Romania........................................................................................................................... 28
23 Slovakia ........................................................................................................................... 29
24 Slovenia ........................................................................................................................... 30
25 Spain ................................................................................................................................ 31
26 Sweden ............................................................................................................................ 35
27 United Kingdom .............................................................................................................. 36
Technical assessment of the implementation of Directive 91/271/EEC – Annex VII
1
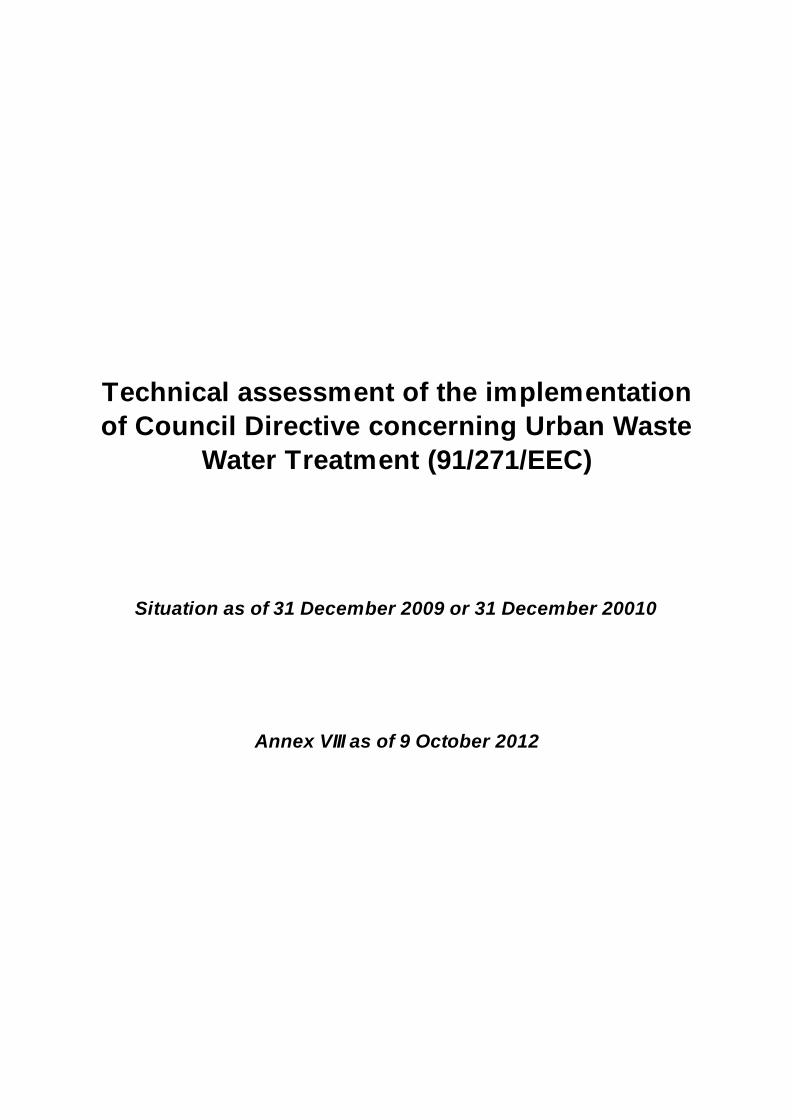
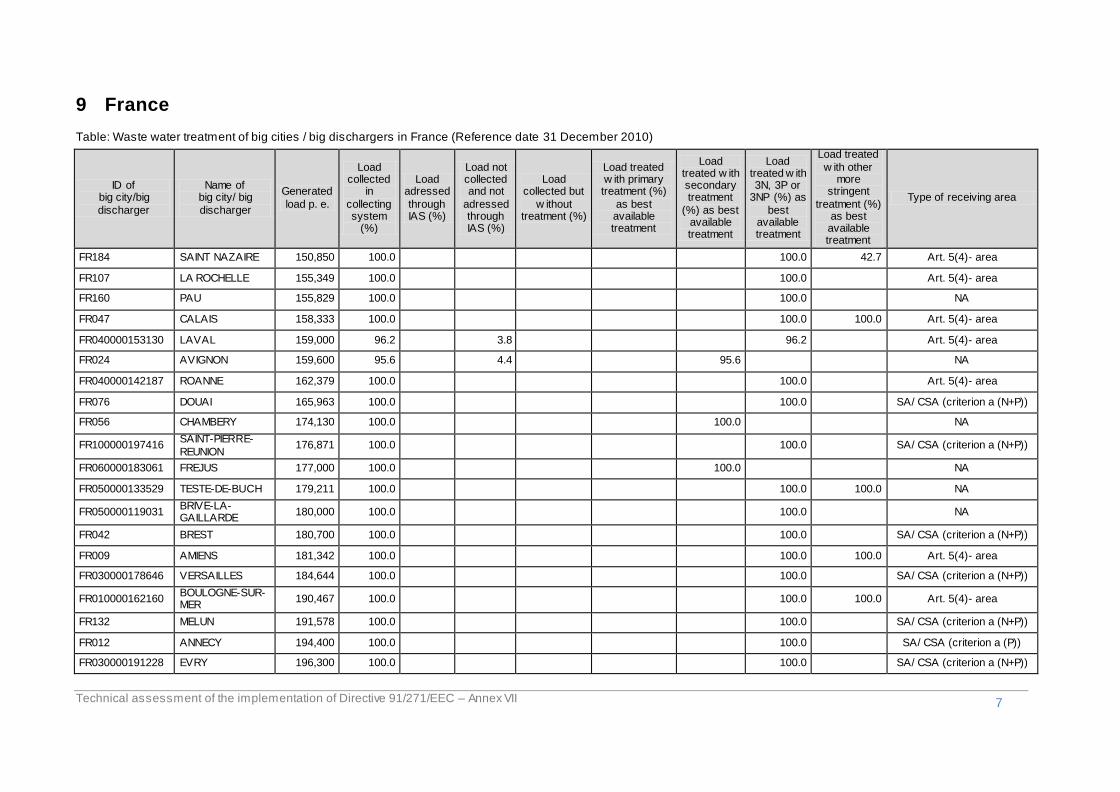
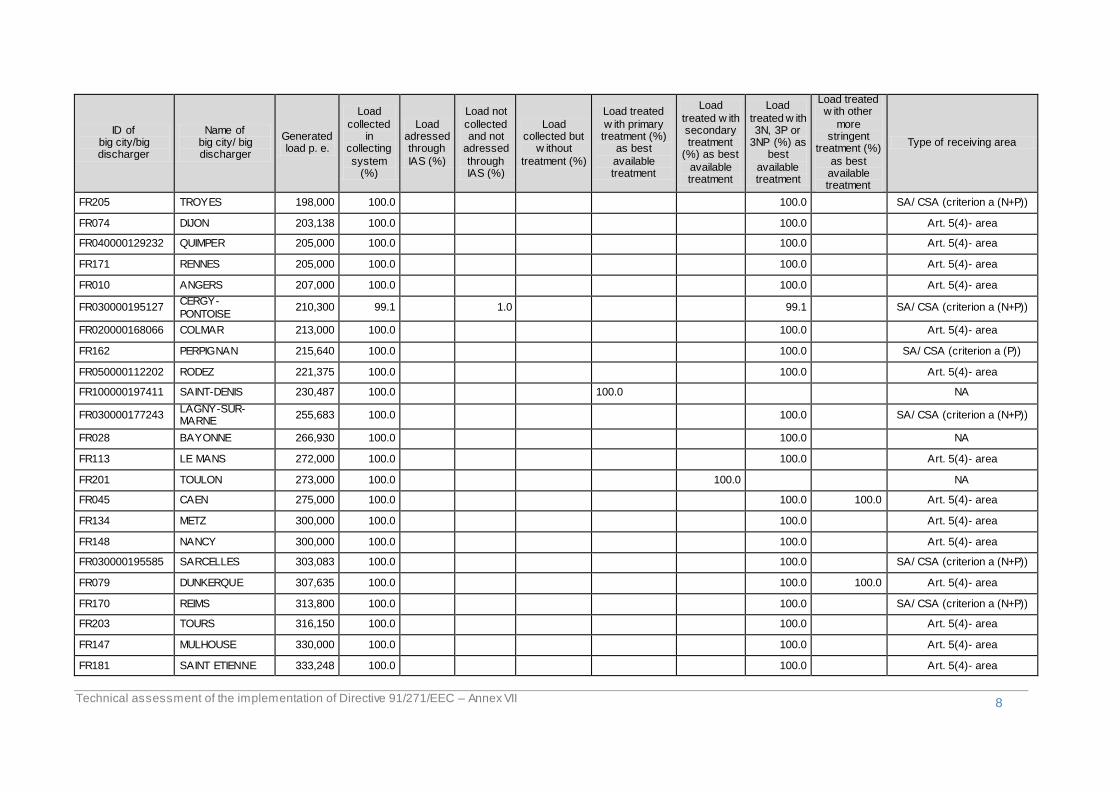
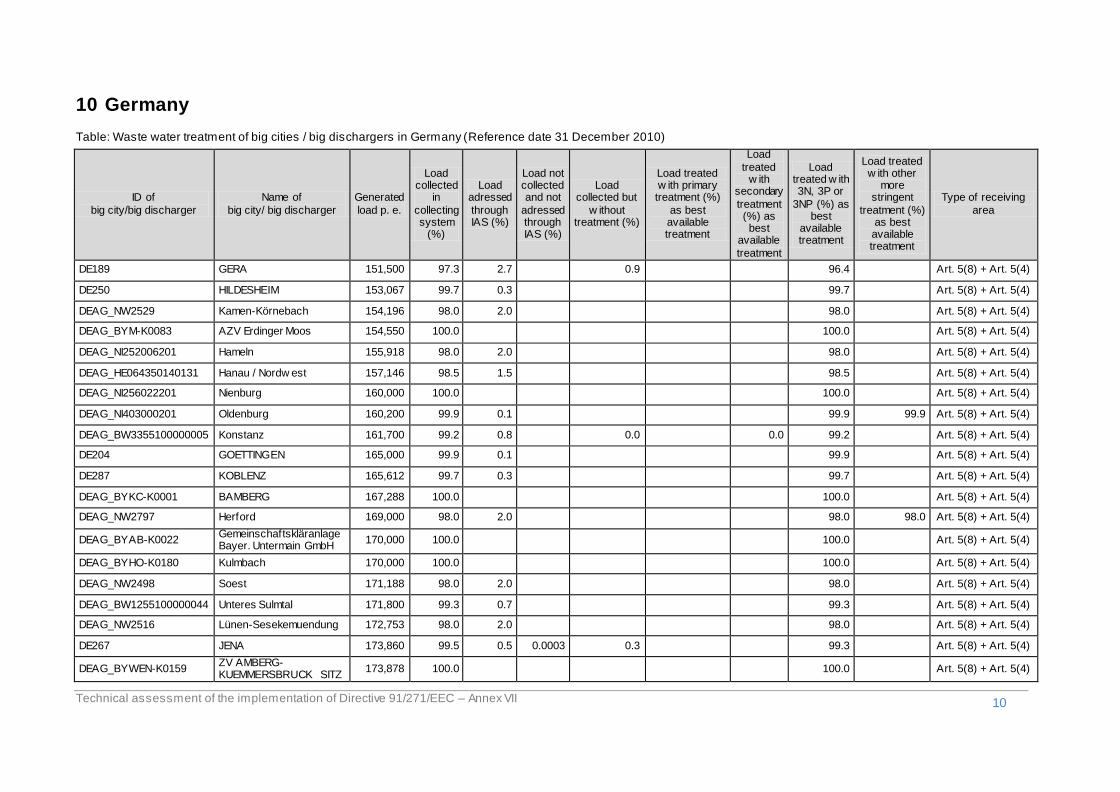
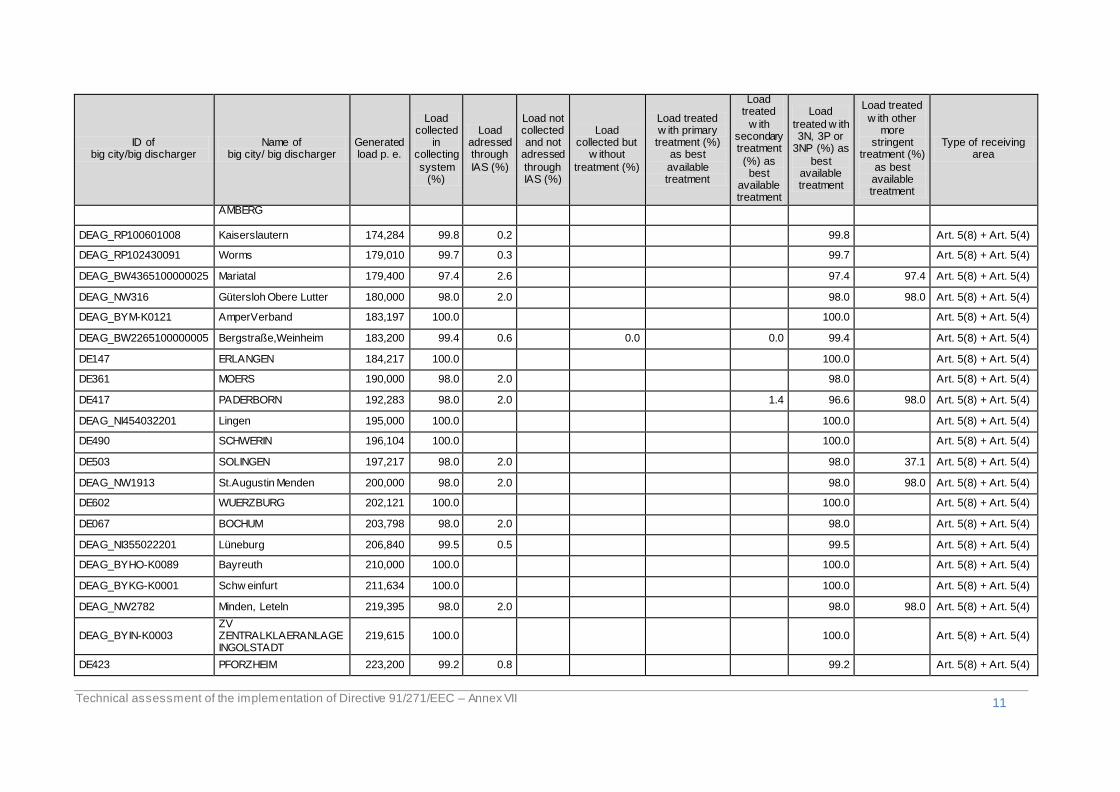
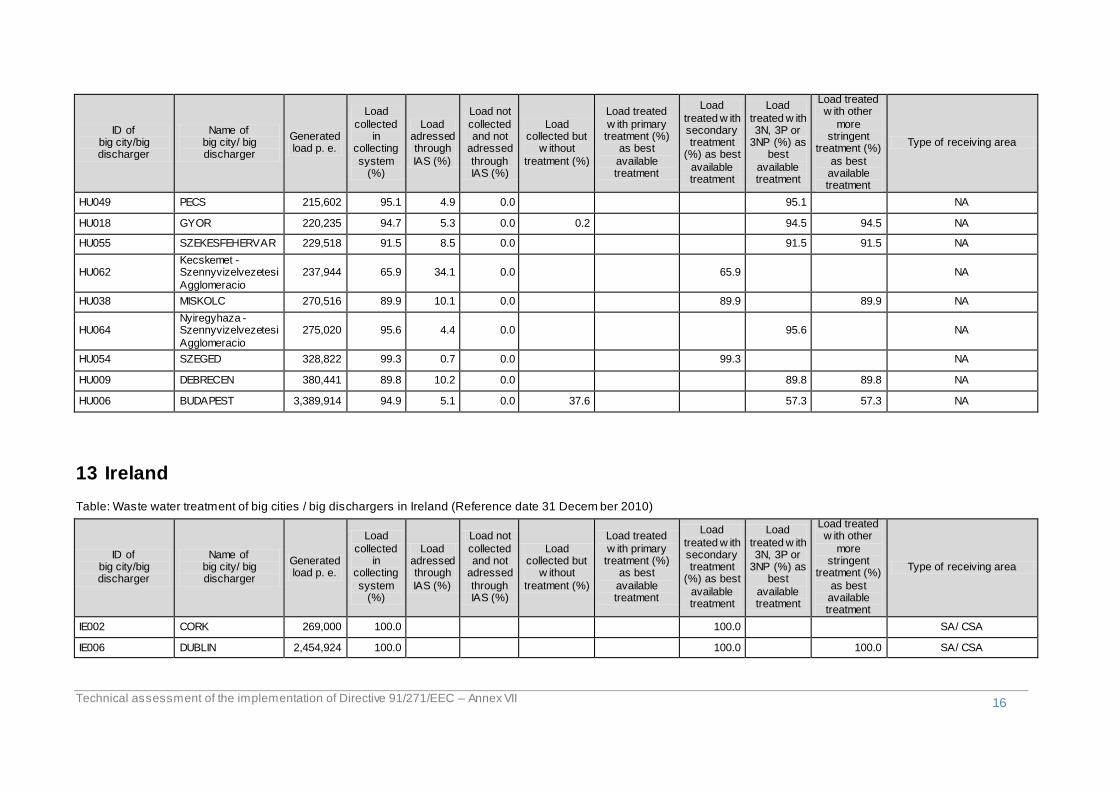
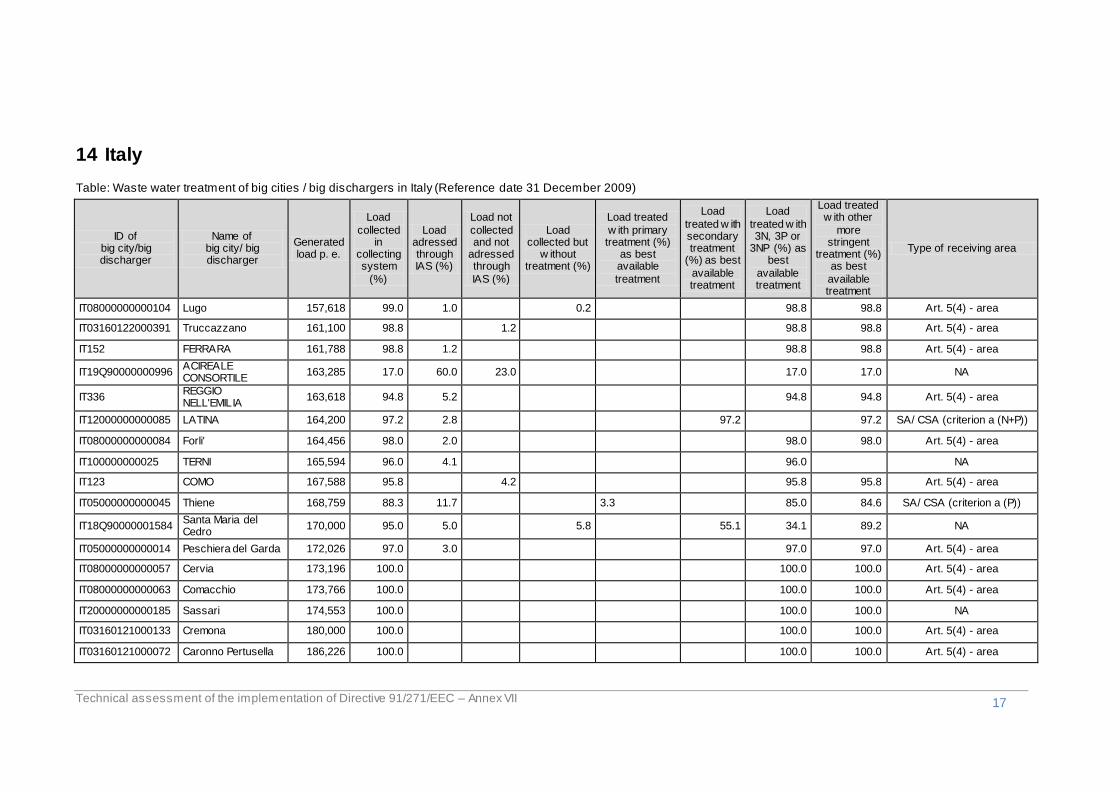
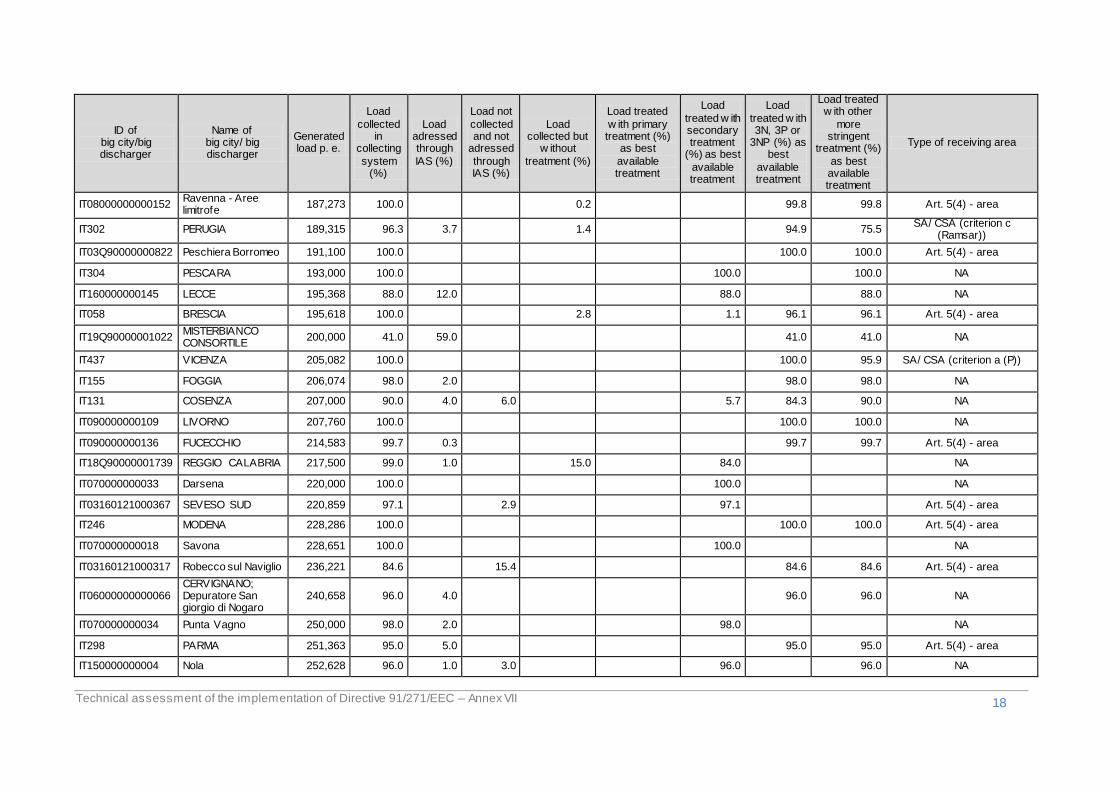
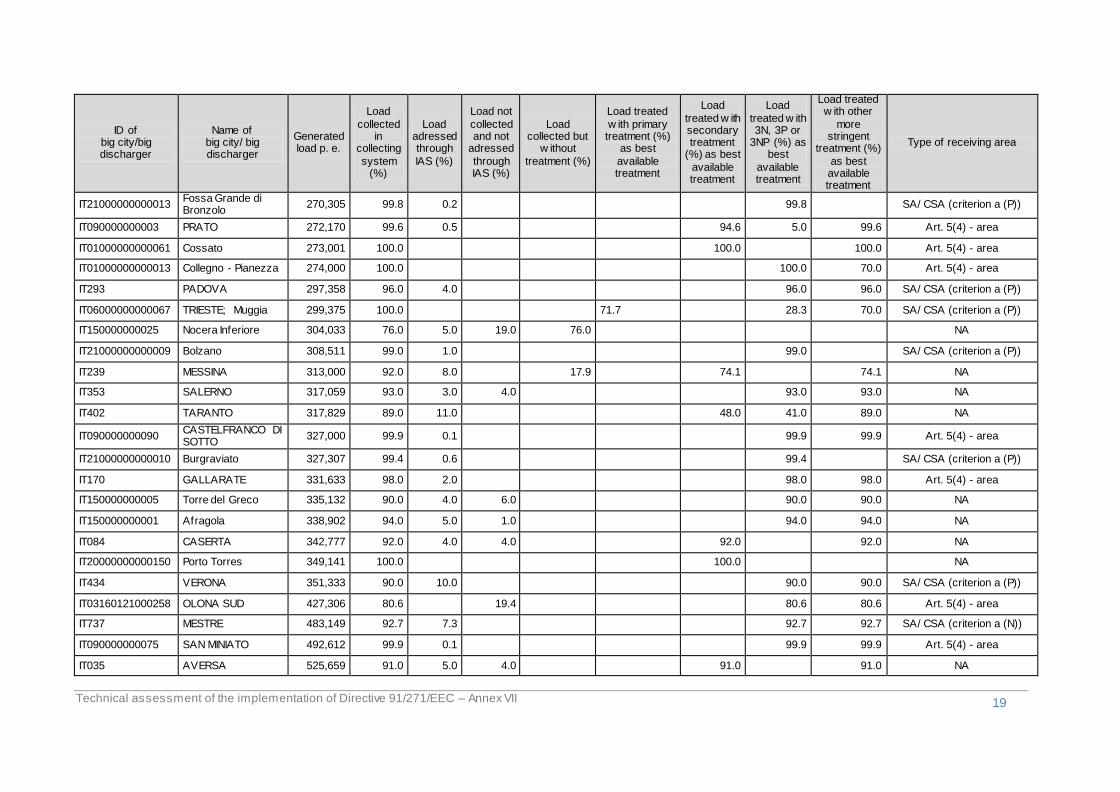
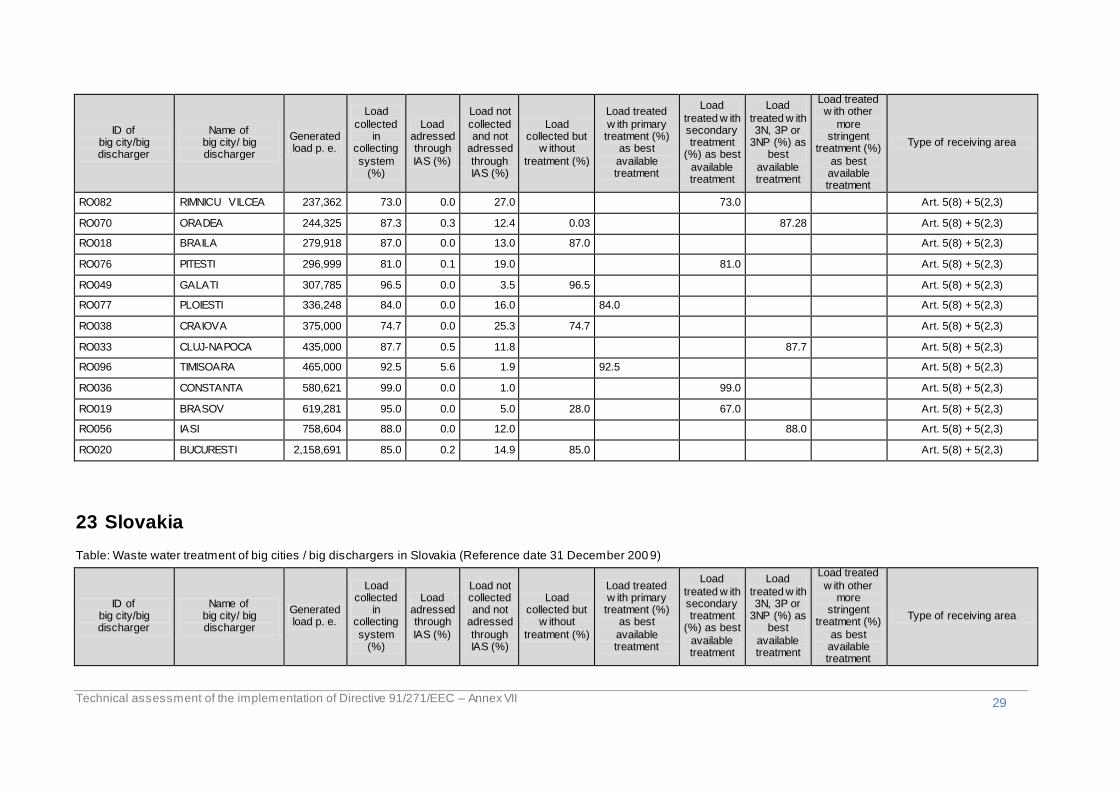
The following sub-chapters provide information as reported by Member States by reference date 31 December 2009 or 31 December 2010
on big cities / big dischargers and agglomerations with more than 150,000 p.e., which represent the biggest stressors to the aquatic environment. The name of the big city/big discharger and related ID, associated agglomerations, the total generated load in p.e. as well as the load addressed through IAS in %, the load not collected and not addressed through IAS in % as well as the load treated with primary, secondary and more stringent treatment as best available treatment is shown in the tables of all EU-27 Member States. In addition the type of receiving area – sensitive area, catchment of sensitive area or normal area – and the application of Article 5(2,3) or Article 5(4) is highlighted.
1 Austria
Table: Waste water treatment of big cities / big dischargers in Austria (Reference date 31 December 2010)
ID of big city/big
discharger
Name of
big city/ big discharger
Generated
load p. e.
Load collected in
collecting system (%)
Load adressed
through IAS (%)
Load not collected and not
adressed through IAS (%)
Load collected
but
w ithout treatment
(%)
Load
treated with
primary treatment
(%) as best
available
treatment
Load
treated w ith
secondary treatment
(%) as best
available
treatment
Load treated with 3N,
3P or
3NP (%) as best available treatment
Load
treated with other
more stringent
treatment (%) as best available
treatment
Type of receiving
area
ATAG_4-41812001 Wels und Umgebung 160,000 99.0 1.0 0.0 99.0 Art. 5(8) + Art. 5(4)
ATAG_7-7930111 Strass/Zillertal (Achental-Inntal-Zillertal)
167,000 98.0 2.0 0.0 98.0 Art. 5(8) + Art. 5(4)
ATAG_8-Hohenems Hohenems (Region Hohenems) 170,000 100.0 0.0 0.0 100.0 Art. 5(8) + Art. 5(4)
ATAG_3-47 Raum St. Polten (Traismauer-Stollhofen)
180,000 99.8 0.2 0.0 99.8 Art. 5(8) + Art. 5(4)
ATAG_2-K1939997 Villach 200,000 99.9 0.1 0.0 99.9 Art. 5(8) + Art. 5(4)
ATAG_3-449 Raum Wiener Neustadt (Wiener Neustadt-Lichtenworth)
230,000 99.9 0.1 0.0 99.9 Art. 5(8) + Art. 5(4)
ATAG_3-119 Raum Krems (Krems-Weinzierl) 275,000 100.0 0.0 0.0 100.0 Art. 5(8) + Art. 5(4)
ATAG_2-K1931629 Klagenfurt (Worthersee Ost) 300,000 99.9 0.1 0.0 99.9 Art. 5(8) + Art. 5(4)
ATAG_3-11 Raum Schw echat (Schwechat-
Mannsw orth) 370,000 99.9 0.1 0.0 99.9 Art. 5(8) + Art. 5(4)
ATAG_8-Meiningen Meiningen (Region Feldkirch) 380,000 100.0 0.0 0.0 100.0 Art. 5(8) + Art. 5(4)
Technical assessment of the implementation of Directive 91/271/EEC – Annex VII
2
ID of big city/big
discharger
Name of big city/ big discharger
Generated load p. e.
Load collected in collecting
system (%)
Load adressed through
IAS (%)
Load not collected and not
adressed
through IAS (%)
Load collected
but w ithout
treatment (%)
Load treated
with primary treatment
(%) as best
available treatment
Load treated
w ith secondary treatment
(%) as best
available treatment
Load
treated with 3N,
3P or 3NP (%)
as best available treatment
Load treated
with other more
stringent
treatment (%) as best available
treatment
Type of receiving area
AT007 INNSBRUCK 400,000 100.0 0.0 0.0 100.0 Art. 5(8) + Art. 5(4)
AT006 GRAZ 500,000 99.6 0.4 0.0 99.6 Art. 5(8) + Art. 5(4)
AT016 SALZBURG 680,000 95.1 4.9 0.0 95.1 Art. 5(8) + Art. 5(4)
AT014 LINZ 950,000 99.0 1.0 0.0 99.0 Art. 5(8) + Art. 5(4)
AT022 WIEN 4,000,000 100.0 0.0 0.0 100.0 Art. 5(8) + Art. 5(4)
2 Belgium
Table: Waste water treatment of big cities / big dischargers in Belgium (Reference date 31 December 2010)
ID of big city/big
discharger
Name of big city/ big
discharger
Generated load p. e.
Load collected in collecting
system (%)
Load adressed through
IAS (%)
Load not collected and not
adressed
through IAS (%)
Load collected
but w ithout
treatment (%)
Load treated
with primary treatment
(%) as best
available treatment
Load
treated with
secondary treatment
(%) as best available
treatment
Load
treated with 3N,
3P or 3NP (%)
as best available treatment
Load treated
with other more
stringent
treatment (%) as best available
treatment
Type of receiving area
BE022 GENT 165,000 100.0 100.0 SA/CSA (criterion a (N+P))
BE310 WAVRE 165,000 98.4 1.6 2.2 92.0 4.2 SA/CSA (criterion a (N+P), criterion b)
BE013 BRUGGE 185,000 100.0 0.0 100.0 SA/CSA (criterion a (N+P))
BE325 LA LOUVIERE 186,000 98.9 1.1 6.4 92.5 SA/CSA (criterion a (N+P), criterion b)
BE044 MONS 237,000 97.7 2.3 2.3 1.9 93.5 SA/CSA (criterion a (N+P), criterion b)
BE2 OOSTENDE 245,100 100.0 100.0 SA/CSA (criterion a (N+P))
BE324 MOUSCRON 250,000 99.6 0.4 99.6 SA/CSA (criterion a (N+P), criterion b)

Technical assessment of the implementation of Directive 91/271/EEC – Annex VII
3
ID of big city/big
discharger
Name of big city/ big
discharger
Generated load p. e.
Load collected in collecting
system (%)
Load adressed through
IAS (%)
Load not collected and not
adressed
through IAS (%)
Load collected
but w ithout
treatment (%)
Load treated
with primary treatment
(%) as best
available treatment
Load
treated with
secondary treatment
(%) as best available
treatment
Load
treated with 3N,
3P or 3NP (%)
as best available treatment
Load treated
with other more
stringent
treatment (%) as best available
treatment
Type of receiving area
BE015 CHARLEROI 333,000 98.1 1.9 2.0 7.5 88.6 SA/CSA (criterion a (N+P),
criterion b)
BE004 ANTWERPEN 374,000 100.0 100.0 SA/CSA (criterion a (N+P))
BE034 LIEGE 601,000 98.9 1.1 36.0 1.3 61.6 SA/CSA (criterion a (N+P), criterion b)
BE014 BRUXELLES/BRUSSEL 1,460,000 100.0 22.0 78.0 SA/CSA (criterion a (N+P))
3 Bulgaria
Table: Waste water treatment of big cities / big dischargers in Bulgaria (Reference date 31 December 2010)
ID of
big city/big discharger
Name of
big city/ big discharger
Generated
load p. e.
Load collected
in
collecting system
(%)
Load adressed
through IAS (%)
Load not collected and not
adressed through IAS (%)
Load collected
but w ithout treatment (%)
Load treated w ith primary treatment (%)
as best available treatment
Load treated w ith
secondary
treatment (%) as best available treatment
Load treated w ith 3N,
3P or 3NP
(%) as best
available treatment
Load treated w ith other
more stringent
treatment (%) as best available treatment
Type of receiving area
BG003 BURGAS 170,792 64.0 36.0 64.0 64.0 SA/ CSA (criterion a (N+P))
BG021 STARA ZAGORA 172,492 95.0 5.0 95.0 95.0 SA/ CSA (criterion a (N+P))
BG014 PLOVDIV 351,893 90.0 10.0 90.0 SA/ CSA (criterion a (N+P))
BG023 VARNA 387,199 90.0 1.0 9.0 90.0 90.0 SA/ CSA (criterion a (N+P))
BG020 SOFIYA 1,291,054 80.0 0.4 19.6 1.0 79.0 SA/ CSA (criterion a (N+P))

Technical assessment of the implementation of Directive 91/271/EEC – Annex VII
4
4 Cyprus
Table: Waste water treatment of big cities / big dischargers in Cyprus (Reference date 31 December 2009)
ID of big city/big
discharger
Name of big city/ big
discharger
Generated
load p. e.
Load collected in
collecting system (%)
Load adressed
through IAS (%)
Load not collected and not
adressed through IAS
(%)
Load collected but
w ithout treatment (%)
Load treated w ith primary treatment (%)
as best available treatment
Load treated w ith
secondary treatment (%)
as best available treatment
Load treated w ith 3N, 3P or
3NP (%) as
best available treatment
Load treated
w ith other more
stringent
treatment (%) as best available treatment
Type of receiving area
CY001 NICOSIA 220,000 75.7 6.3 18.0 0.1 63.6 12.0 12.0 Normal area
5 Czech Republic
Table: Waste water treatment of big cities / big dischargers in Czech Republic (Reference date 31 December 2010)
ID of big city/big
discharger
Name of big city/ big
discharger
Generated
load p. e.
Load collected in
collecting system (%)
Load adressed
through IAS (%)
Load not collected and not
adressed through IAS
(%)
Load collected but
w ithout treatment (%)
Load treated w ith primary treatment (%)
as best available treatment
Load treated w ith
secondary treatment (%)
as best available treatment
Load treated w ith 3N, 3P or
3NP (%) as
best available treatment
Load treated w ith other
more stringent
treatment (%) as best available treatment
Type of receiving area
CZAG544256 Ceske Budejovice 225,846 99.6 0.4 0.0 99.6 Art. 5(8) + 5(2,3)
CZ042 OSTRAVA 314,467 95.2 4.8 0.0 2.3 0.8 92.1 Art. 5(8) + 5(2,3)
CZ046 PLZEN 418,500 99.2 0.8 0.0 1.5 97.8 Art. 5(8) + 5(2,3)
CZ003 BRNO 557,777 98.0 2.0 0.0 98.0 Art. 5(8) + 5(2,3)
CZ047 PRAHA 1,365,000 99.2 0.8 0.0 99.2 Art. 5(8) + 5(2,3)

Technical assessment of the implementation of Directive 91/271/EEC – Annex VII
5
6 Denmark
Table: Waste water treatment of big cities / big dischargers in Denmark (Reference date 31 December 2010)
ID of big city/big
discharger
Name of big city/ big
discharger
Generated
load p. e.
Load collected in
collecting system (%)
Load adressed
through IAS (%)
Load not collected and not
adressed through IAS
(%)
Load collected but
w ithout treatment (%)
Load treated w ith primary treatment (%)
as best available treatment
Load treated w ith
secondary treatment (%)
as best available treatment
Load treated w ith 3N, 3P or
3NP (%) as
best available treatment
Load treated
w ith other more
stringent
treatment (%) as best available treatment
Type of receiving area
DK455 HORSENS 151,800 100.0 0.0 0.0 0.0 0.0 0.0 100.0 0.0 Art. 5(8) + 5(2,3)
DK434 RANDERS 152,177 100.0 0.0 0.0 0.0 0.0 0.0 100.0 0.0 Art. 5(8) + 5(2,3)
DK429 SKAGEN 160,000 100.0 0.0 0.0 0.0 0.0 0.0 100.0 0.0 Art. 5(8) + 5(2,3)
DK437 HERNING 175,000 100.0 0.0 0.0 0.0 0.0 0.0 100.0 100.0 Art. 5(8) + 5(2,3)
DK378 HOLSTEBRO 188,000 100.0 0.0 0.0 0.0 0.0 0.0 100.0 0.0 Art. 5(8) + 5(2,3)
DK026 AARHUS 301,968 100.0 0.0 0.0 0.0 0.0 0.0 100.0 0.0 Art. 5(8) + 5(2,3)
DK001 AALBORG 326,000 100.0 0.0 0.0 0.0 0.0 0.0 100.0 0.0 Art. 5(8) + 5(2,3)
DK367 FREDERICIA CENTRALRENS
420,000 100.0 0.0 0.0 0.0 0.0 0.0 100.0 0.0 Art. 5(8) + 5(2,3)
DK278 ESBJERG 429,000 100.0 0.0 0.0 0.0 0.0 0.0 100.0 0.0 Art. 5(8) + 5(2,3)
DK017 ODENSE 463,300 100.0 0.0 0.0 0.0 0.0 0.0 100.0 0.0 Art. 5(8) + 5(2,3)
DK013 KOEBENHAVN 1,100,000 100.0 0.0 0.0 0.0 0.0 0.0 100.0 0.0 Art. 5(8) + 5(2,3)
7 Estonia
Table: Waste water treatment of big cities / big dischargers in Estonia (Reference date 31 December 2009)
ID of big city/big discharger
Name of big city/ big discharger
Generated load p. e.
Load collected in collecting
system (%)
Load adressed through IAS (%)
Load not
collected and not
adressed through
IAS (%)
Load collected but
w ithout treatment (%)
Load treated
w ith primary treatment (%)
as best available
treatment
Load treated w ith
secondary treatment
(%) as best available
treatment
Load treated w ith
3N, 3P or 3NP (%) as
best available
treatment
Load treated w ith other
more stringent
treatment (%) as best
available treatment
Type of receiving area

Technical assessment of the implementation of Directive 91/271/EEC – Annex VII
6
ID of big city/big discharger
Name of big city/ big discharger
Generated load p. e.
Load collected in collecting
system (%)
Load adressed through
IAS (%)
Load not
collected and not
adressed
through IAS (%)
Load collected but
w ithout
treatment (%)
Load treated
w ith primary treatment (%)
as best
available treatment
Load treated
w ith secondary treatment
(%) as best
available treatment
Load
treated w ith 3N, 3P or
3NP (%) as best
available treatment
Load treated w ith other
more stringent
treatment (%)
as best available treatment
Type of receiving area
EERKA_LV0247 Rakvere 152,840 79.0 12.0 9.0 -- -- -- 79.0 -- Art. 5(8) + 5(2,3)
EEIV0044 Kohtla-Järve 219,096 83.0 12.0 5.0 -- -- -- 83.0 -- Art. 5(8) + 5(2,3)
EE002 TALLINN 468,000 99.0 0.0 1.0 -- -- -- 99.0 -- Art. 5(8) + 5(2,3)
8 Finland
Table: Waste water treatment of big cities / big dischargers in Finland (Reference date 31 December 200 9)
ID of
big city/big discharger
Name of
big city/ big discharger
Generated
load p. e.
Load collected
in
collecting system
(%)
Load adressed
through IAS (%)
Load not collected and not
adressed through IAS (%)
Load collected but
w ithout treatment (%)
Load treated w ith primary treatment (%)
as best available treatment
Load treated w ith secondary
treatment (%) as best
available treatment
Load treated w ith 3N, 3P or
3NP (%) as best
available treatment
Load treated w ith other
more stringent
treatment (%) as best available treatment
Type of receiving area
FIYKR05_T001477 Pori 195,500 99.0 1.0 99.0 Art. 5(8) + 5(2,3)
FI019 LAHTI 198,200 99.0 1.0 99.0 Art. 5(8) + 5(2,3)
FI036 TURKU 206,800 99.0 1.0 99.0 Art. 5(8) + 5(2,3)
FI034 TAMPERE 306,200 99.0 1.0 99.0 Art. 5(8) + 5(2,3)
FI003 HELSINKI 1,261,200 99.0 1.0 99.0 Art. 5(8) + 5(2,3)
Technical assessment of the implementation of Directive 91/271/EEC – Annex VII
7
9 France
Table: Waste water treatment of big cities / big dischargers in France (Reference date 31 December 2010)
ID of big city/big
discharger
Name of big city/ big
discharger
Generated
load p. e.
Load collected
in
collecting system
(%)
Load adressed
through IAS (%)
Load not collected and not
adressed through IAS (%)
Load collected but
w ithout treatment (%)
Load treated w ith primary treatment (%)
as best available treatment
Load treated w ith secondary treatment
(%) as best available treatment
Load treated w ith 3N, 3P or
3NP (%) as
best available treatment
Load treated
w ith other more
stringent
treatment (%) as best available treatment
Type of receiving area
FR184 SAINT NAZAIRE 150,850 100.0 100.0 42.7 Art. 5(4)- area
FR107 LA ROCHELLE 155,349 100.0 100.0 Art. 5(4)- area
FR160 PAU 155,829 100.0 100.0 NA
FR047 CALAIS 158,333 100.0 100.0 100.0 Art. 5(4)- area
FR040000153130 LAVAL 159,000 96.2 3.8 96.2 Art. 5(4)- area
FR024 AVIGNON 159,600 95.6 4.4 95.6 NA
FR040000142187 ROANNE 162,379 100.0 100.0 Art. 5(4)- area
FR076 DOUAI 165,963 100.0 100.0 SA/ CSA (criterion a (N+P))
FR056 CHAMBERY 174,130 100.0 100.0 NA
FR100000197416 SAINT-PIERRE-
REUNION 176,871 100.0 100.0 SA/ CSA (criterion a (N+P))
FR060000183061 FREJUS 177,000 100.0 100.0 NA
FR050000133529 TESTE-DE-BUCH 179,211 100.0 100.0 100.0 NA
FR050000119031 BRIVE-LA-GAILLARDE
180,000 100.0 100.0 NA
FR042 BREST 180,700 100.0 100.0 SA/ CSA (criterion a (N+P))
FR009 AMIENS 181,342 100.0 100.0 100.0 Art. 5(4)- area
FR030000178646 VERSAILLES 184,644 100.0 100.0 SA/ CSA (criterion a (N+P))
FR010000162160 BOULOGNE-SUR-MER
190,467 100.0 100.0 100.0 Art. 5(4)- area
FR132 MELUN 191,578 100.0 100.0 SA/ CSA (criterion a (N+P))
FR012 ANNECY 194,400 100.0 100.0 SA/ CSA (criterion a (P))
FR030000191228 EVRY 196,300 100.0 100.0 SA/ CSA (criterion a (N+P))
Technical assessment of the implementation of Directive 91/271/EEC – Annex VII
8
ID of big city/big discharger
Name of big city/ big discharger
Generated load p. e.
Load
collected in
collecting
system (%)
Load adressed through
IAS (%)
Load not
collected and not
adressed
through IAS (%)
Load collected but
w ithout
treatment (%)
Load treated
w ith primary treatment (%)
as best
available treatment
Load
treated w ith secondary treatment
(%) as best
available treatment
Load
treated w ith 3N, 3P or
3NP (%) as best
available treatment
Load treated w ith other
more stringent
treatment (%)
as best available treatment
Type of receiving area
FR205 TROYES 198,000 100.0 100.0 SA/ CSA (criterion a (N+P))
FR074 DIJON 203,138 100.0 100.0 Art. 5(4)- area
FR040000129232 QUIMPER 205,000 100.0 100.0 Art. 5(4)- area
FR171 RENNES 205,000 100.0 100.0 Art. 5(4)- area
FR010 ANGERS 207,000 100.0 100.0 Art. 5(4)- area
FR030000195127 CERGY-
PONTOISE 210,300 99.1 1.0 99.1 SA/ CSA (criterion a (N+P))
FR020000168066 COLMAR 213,000 100.0 100.0 Art. 5(4)- area
FR162 PERPIGNAN 215,640 100.0 100.0 SA/ CSA (criterion a (P))
FR050000112202 RODEZ 221,375 100.0 100.0 Art. 5(4)- area
FR100000197411 SAINT-DENIS 230,487 100.0 100.0 NA
FR030000177243 LAGNY-SUR-MARNE
255,683 100.0 100.0 SA/ CSA (criterion a (N+P))
FR028 BAYONNE 266,930 100.0 100.0 NA
FR113 LE MANS 272,000 100.0 100.0 Art. 5(4)- area
FR201 TOULON 273,000 100.0 100.0 NA
FR045 CAEN 275,000 100.0 100.0 100.0 Art. 5(4)- area
FR134 METZ 300,000 100.0 100.0 Art. 5(4)- area
FR148 NANCY 300,000 100.0 100.0 Art. 5(4)- area
FR030000195585 SARCELLES 303,083 100.0 100.0 SA/ CSA (criterion a (N+P))
FR079 DUNKERQUE 307,635 100.0 100.0 100.0 Art. 5(4)- area
FR170 REIMS 313,800 100.0 100.0 SA/ CSA (criterion a (N+P))
FR203 TOURS 316,150 100.0 100.0 Art. 5(4)- area
FR147 MULHOUSE 330,000 100.0 100.0 Art. 5(4)- area
FR181 SAINT ETIENNE 333,248 100.0 100.0 Art. 5(4)- area

Technical assessment of the implementation of Directive 91/271/EEC – Annex VII
9
ID of big city/big discharger
Name of big city/ big discharger
Generated load p. e.
Load
collected in
collecting
system (%)
Load adressed through
IAS (%)
Load not
collected and not
adressed
through IAS (%)
Load collected but
w ithout
treatment (%)
Load treated
w ith primary treatment (%)
as best
available treatment
Load
treated w ith secondary treatment
(%) as best
available treatment
Load
treated w ith 3N, 3P or
3NP (%) as best
available treatment
Load treated w ith other
more stringent
treatment (%)
as best available treatment
Type of receiving area
FR064 CLERMONT-FERRAND
333,667 94.0 6.0 94.0 Art. 5(4)- area
FR112 LE HAVRE 340,000 100.0 100.0 SA/ CSA (criterion a (N+P))
FR156 ORLEANS 340,900 100.0 100.0 Art. 5(4)- area
FR095 GRASSE-CANNES-ANTIBES
346,833 100.0 54.5 32.5 13.0 NA
FR119 LIMOGES 380,000 100.0 100.0 Art. 5(4)- area
FR096 GRENOBLE 401,800 100.0 100.0 NA
FR176 ROUEN 435,000 100.0 100.0 SA/ CSA (criterion a (N+P))
FR145 MONTPELLIER 440,127 100.0 100.0 NA
FR152 NICE 467,400 100.0 100.0 NA
FR118 LILLE 475,693 100.0 100.0 SA/ CSA (criterion a (N+P))
FR149 NANTES 663,600 100.0 100.0 Art. 5(4)- area
FR197 STRASBOURG 790,000 100.0 100.0 Art. 5(4)- area
FR202 TOULOUSE 953,009 95.9 4.1 4.3 91.6 SA/ CSA (criterion a (P)), Art.
5(4)- area, NA
FR010000159512 ROUBAIX 960,229 100.0 100.0 SA/ CSA (criterion a (N+P))
FR037 BORDEAUX 1,038,664 99.9 0.2 39.4 60.5 NA
FR124 LYON 1,559,400 100.0 100.0 NA
FR128 MARSEILLE-AIX-EN-PROVENCE
1,667,370 100.0 91.4 8.6 Art. 5(4)- area
FR159 PARIS 9,410,000 100.0 100.0 SA/ CSA (criterion a (N+P))
Technical assessment of the implementation of Directive 91/271/EEC – Annex VII
10
10 Germany
Table: Waste water treatment of big cities / big dischargers in Germany (Reference date 31 December 2010)
ID of
big city/big discharger
Name of
big city/ big discharger
Generated
load p. e.
Load collected
in
collecting system
(%)
Load adressed
through IAS (%)
Load not collected and not
adressed through IAS (%)
Load collected but
w ithout treatment (%)
Load treated w ith primary treatment (%)
as best available treatment
Load
treated w ith
secondary
treatment (%) as best
available
treatment
Load treated w ith 3N, 3P or
3NP (%) as best
available treatment
Load treated w ith other
more stringent
treatment (%) as best available treatment
Type of receiving
area
DE189 GERA 151,500 97.3 2.7 0.9 96.4 Art. 5(8) + Art. 5(4)
DE250 HILDESHEIM 153,067 99.7 0.3 99.7 Art. 5(8) + Art. 5(4)
DEAG_NW2529 Kamen-Körnebach 154,196 98.0 2.0 98.0 Art. 5(8) + Art. 5(4)
DEAG_BYM-K0083 AZV Erdinger Moos 154,550 100.0 100.0 Art. 5(8) + Art. 5(4)
DEAG_NI252006201 Hameln 155,918 98.0 2.0 98.0 Art. 5(8) + Art. 5(4)
DEAG_HE064350140131 Hanau / Nordw est 157,146 98.5 1.5 98.5 Art. 5(8) + Art. 5(4)
DEAG_NI256022201 Nienburg 160,000 100.0 100.0 Art. 5(8) + Art. 5(4)
DEAG_NI403000201 Oldenburg 160,200 99.9 0.1 99.9 99.9 Art. 5(8) + Art. 5(4)
DEAG_BW3355100000005 Konstanz 161,700 99.2 0.8 0.0 0.0 99.2 Art. 5(8) + Art. 5(4)
DE204 GOETTINGEN 165,000 99.9 0.1 99.9 Art. 5(8) + Art. 5(4)
DE287 KOBLENZ 165,612 99.7 0.3 99.7 Art. 5(8) + Art. 5(4)
DEAG_BYKC-K0001 BAMBERG 167,288 100.0 100.0 Art. 5(8) + Art. 5(4)
DEAG_NW2797 Herford 169,000 98.0 2.0 98.0 98.0 Art. 5(8) + Art. 5(4)
DEAG_BYAB-K0022 Gemeinschaftskläranlage Bayer. Untermain GmbH
170,000 100.0 100.0 Art. 5(8) + Art. 5(4)
DEAG_BYHO-K0180 Kulmbach 170,000 100.0 100.0 Art. 5(8) + Art. 5(4)
DEAG_NW2498 Soest 171,188 98.0 2.0 98.0 Art. 5(8) + Art. 5(4)
DEAG_BW1255100000044 Unteres Sulmtal 171,800 99.3 0.7 99.3 Art. 5(8) + Art. 5(4)
DEAG_NW2516 Lünen-Sesekemuendung 172,753 98.0 2.0 98.0 Art. 5(8) + Art. 5(4)
DE267 JENA 173,860 99.5 0.5 0.0003 0.3 99.3 Art. 5(8) + Art. 5(4)
DEAG_BYWEN-K0159 ZV AMBERG-KUEMMERSBRUCK SITZ
173,878 100.0 100.0 Art. 5(8) + Art. 5(4)
Technical assessment of the implementation of Directive 91/271/EEC – Annex VII
11
ID of big city/big discharger
Name of big city/ big discharger
Generated load p. e.
Load collected
in collecting
system (%)
Load adressed through
IAS (%)
Load not collected and not
adressed
through IAS (%)
Load collected but
w ithout
treatment (%)
Load treated w ith primary treatment (%)
as best
available treatment
Load treated
w ith secondary treatment
(%) as best
available treatment
Load
treated w ith 3N, 3P or
3NP (%) as
best available treatment
Load treated
w ith other more
stringent treatment (%)
as best available treatment
Type of receiving area
AMBERG
DEAG_RP100601008 Kaiserslautern 174,284 99.8 0.2 99.8 Art. 5(8) + Art. 5(4)
DEAG_RP102430091 Worms 179,010 99.7 0.3 99.7 Art. 5(8) + Art. 5(4)
DEAG_BW4365100000025 Mariatal 179,400 97.4 2.6 97.4 97.4 Art. 5(8) + Art. 5(4)
DEAG_NW316 Gütersloh Obere Lutter 180,000 98.0 2.0 98.0 98.0 Art. 5(8) + Art. 5(4)
DEAG_BYM-K0121 AmperVerband 183,197 100.0 100.0 Art. 5(8) + Art. 5(4)
DEAG_BW2265100000005 Bergstraße,Weinheim 183,200 99.4 0.6 0.0 0.0 99.4 Art. 5(8) + Art. 5(4)
DE147 ERLANGEN 184,217 100.0 100.0 Art. 5(8) + Art. 5(4)
DE361 MOERS 190,000 98.0 2.0 98.0 Art. 5(8) + Art. 5(4)
DE417 PADERBORN 192,283 98.0 2.0 1.4 96.6 98.0 Art. 5(8) + Art. 5(4)
DEAG_NI454032201 Lingen 195,000 100.0 100.0 Art. 5(8) + Art. 5(4)
DE490 SCHWERIN 196,104 100.0 100.0 Art. 5(8) + Art. 5(4)
DE503 SOLINGEN 197,217 98.0 2.0 98.0 37.1 Art. 5(8) + Art. 5(4)
DEAG_NW1913 St.Augustin Menden 200,000 98.0 2.0 98.0 98.0 Art. 5(8) + Art. 5(4)
DE602 WUERZBURG 202,121 100.0 100.0 Art. 5(8) + Art. 5(4)
DE067 BOCHUM 203,798 98.0 2.0 98.0 Art. 5(8) + Art. 5(4)
DEAG_NI355022201 Lüneburg 206,840 99.5 0.5 99.5 Art. 5(8) + Art. 5(4)
DEAG_BYHO-K0089 Bayreuth 210,000 100.0 100.0 Art. 5(8) + Art. 5(4)
DEAG_BYKG-K0001 Schw einfurt 211,634 100.0 100.0 Art. 5(8) + Art. 5(4)
DEAG_NW2782 Minden, Leteln 219,395 98.0 2.0 98.0 98.0 Art. 5(8) + Art. 5(4)
DEAG_BYIN-K0003 ZV ZENTRALKLAERANLAGE INGOLSTADT
219,615 100.0 100.0 Art. 5(8) + Art. 5(4)
DE423 PFORZHEIM 223,200 99.2 0.8 99.2 Art. 5(8) + Art. 5(4)

Technical assessment of the implementation of Directive 91/271/EEC – Annex VII
12
ID of big city/big discharger
Name of big city/ big discharger
Generated load p. e.
Load collected
in collecting
system (%)
Load adressed through
IAS (%)
Load not collected and not
adressed
through IAS (%)
Load collected but
w ithout
treatment (%)
Load treated w ith primary treatment (%)
as best
available treatment
Load treated
w ith secondary treatment
(%) as best
available treatment
Load
treated w ith 3N, 3P or
3NP (%) as
best available treatment
Load treated
w ith other more
stringent treatment (%)
as best available treatment
Type of receiving area
DEAG_BYHO-K0002 ZV Sächsische Saale 224,000 100.0 100.0 Art. 5(8) + Art. 5(4)
DE216 HAGEN 225,512 98.0 2.0 98.0 Art. 5(8) + Art. 5(4)
DEAG_BYN-K0003 FUERTH 231,333 100.0 100.0 Art. 5(8) + Art. 5(4)
DEAG_BW1175100000062 Göppingen 232,200 99.4 0.6 0.0 0.0 99.4 Art. 5(8) + Art. 5(4)
DE230 HEIDELBERG 249,700 99.9 0.1 99.9 Art. 5(8) + Art. 5(4)
DE412 OSNABRUECK 259,366 99.3 0.7 99.3 Art. 5(8) + Art. 5(4)
DE103 DARMSTADT 259,939 98.5 1.5 98.5 Art. 5(8) + Art. 5(4)
DE151 ESSEN 265,849 98.0 2.0 98.0 Art. 5(8) + Art. 5(4)
DE461 ROSTOCK 275,228 100.0 100.0 100.0 Art. 5(8) + Art. 5(4)
DEAG_HE065310050471
Gießen /
Margaretenhütte/Südliche Lahns
276,350 98.5 1.5 98.5 Art. 5(8) + Art. 5(4)
DE372 MUENSTER 280,000 98.0 2.0 98.0 Art. 5(8) + Art. 5(4)
DE336 LUDWIGSHAFEN AM
RHEIN 285,000 99.8 0.2 99.8 Art. 5(8) + Art. 5(4)
DEAG_BYRO-K0001 ROSENHEIM 288,537 100.0 100.0 Art. 5(8) + Art. 5(4)
DE444 REGENSBURG 300,000 100.0 100.0 Art. 5(8) + Art. 5(4)
DE341 MAINZ 300,238 99.9 0.1 99.9 Art. 5(8) + Art. 5(4)
DE219 HALLE 304,000 100.0 100.0 Art. 5(8) + Art. 5(4)
DEAG_NW35 Düren 314,146 98.0 2.0 98.0 98.0 Art. 5(8) + Art. 5(4)
DE275 KASSEL 315,862 98.5 1.5 98.5 Art. 5(8) + Art. 5(4)
DE223 HAMM 320,539 98.0 2.0 98.0 Art. 5(8) + Art. 5(4)
DE233 HEILBRONN 327,000 99.6 0.4 0.0 0.0 99.6 Art. 5(8) + Art. 5(4)
DEAG_NI352011201 Cuxhaven 336,836 97.5 2.5 97.5 Art. 5(8) + Art. 5(4)
DE059 BIELEFELD 349,000 98.0 2.0 98.0 92.4 Art. 5(8) + Art. 5(4)

Technical assessment of the implementation of Directive 91/271/EEC – Annex VII
13
ID of big city/big discharger
Name of big city/ big discharger
Generated load p. e.
Load collected
in collecting
system (%)
Load adressed through
IAS (%)
Load not collected and not
adressed
through IAS (%)
Load collected but
w ithout
treatment (%)
Load treated w ith primary treatment (%)
as best
available treatment
Load treated
w ith secondary treatment
(%) as best
available treatment
Load
treated w ith 3N, 3P or
3NP (%) as
best available treatment
Load treated
w ith other more
stringent treatment (%)
as best available treatment
Type of receiving area
DE283 KIEL 350,000 99.3 0.7 99.3 99.3 Art. 5(8) + Art. 5(4)
DEAG_BYKE-K0020 ZV GRUPPENKLAERWERK KEMPTEN S. LAUBEN
350,000 100.0 100.0 Art. 5(8) + Art. 5(4)
DE468 SAARBRUECKEN 362,810 100.0 100.0 Art. 5(8) + Art. 5(4)
DE583 WIESBADEN 364,069 98.5 1.5 98.5 Art. 5(8) + Art. 5(4)
DE339 MAGDEBURG 387,120 98.0 2.0 98.0 Art. 5(8) + Art. 5(4)
DE076 BRAUNSCHWEIG 400,000 99.0 1.0 99.0 99.0 Art. 5(8) + Art. 5(4)
DE144 ERFURT 403,680 97.6 2.4 97.6 Art. 5(8) + Art. 5(4)
DE387 NEUSS 406,716 98.0 2.0 98.0 80.9 Art. 5(8) + Art. 5(4)
DE093 CHEMNITZ 422,622 96.1 3.9 0.0100 96.1 Art. 5(8) + Art. 5(4)
DE331 LUEBECK 426,828 96.9 3.1 96.9 3.7 Art. 5(8) + Art. 5(4)
DE001 AACHEN 428,361 98.0 2.0 98.0 92.1 Art. 5(8) + Art. 5(4)
DE600 WUPPERTAL 450,101 98.0 2.0 98.0 98.0 Art. 5(8) + Art. 5(4)
DEAG_ST151541000001 Bitterfeld-Wolfen 454,769 100.0 100.0 Art. 5(8) + Art. 5(4)
DE274 KARLSRUHE 471,400 99.6 0.4 0.0 0.0 99.6 Art. 5(8) + Art. 5(4)
DE078 BREMERHAVEN 482,200 100.0 100.0 Art. 5(8) + Art. 5(4)
DE538 ULM 482,755 99.9 0.1 99.9 Art. 5(8) + Art. 5(4)
DE068 BONN 492,107 98.0 2.0 98.0 26.3 Art. 5(8) + Art. 5(4)
DE167 FREIBURG IM
BREISGAU 523,700 100.0 0.03 100.0 100.0 Art. 5(8) + Art. 5(4)
DE121 DRESDEN 554,838 99.3 0.7 0.0096 99.3 Art. 5(8) + Art. 5(4)
DE342 MANNHEIM 566,700 99.9 0.1 99.9 Art. 5(8) + Art. 5(4)
DE362 MONCHEN-GLADBACH 590,000 98.0 2.0 98.0 98.0 Art. 5(8) + Art. 5(4)
DE025 AUGSBURG 716,619 100.0 100.0 Art. 5(8) + Art. 5(4)

Technical assessment of the implementation of Directive 91/271/EEC – Annex VII
14
ID of big city/big discharger
Name of big city/ big discharger
Generated load p. e.
Load collected
in collecting
system (%)
Load adressed through
IAS (%)
Load not collected and not
adressed
through IAS (%)
Load collected but
w ithout
treatment (%)
Load treated w ith primary treatment (%)
as best
available treatment
Load treated
w ith secondary treatment
(%) as best
available treatment
Load
treated w ith 3N, 3P or
3NP (%) as
best available treatment
Load treated
w ith other more
stringent treatment (%)
as best available treatment
Type of receiving area
DEAG_SH56027 AZV Pinneberg 735,000 99.0 1.0 99.0 Art. 5(8) + Art. 5(4)
DE526 STUTTGART 754,200 99.9 0.1 0.0 0.0 99.9 99.9 Art. 5(8) + Art. 5(4)
DE119 DORTMUND 916,429 98.0 2.0 98.0 Art. 5(8) + Art. 5(4)
DE077 BREMEN 1,083,000 100.0 0.04 100.0 Art. 5(8) + Art. 5(4)
DE295 KREFELD 1,089,549 98.0 2.0 98.0 98.0 Art. 5(8) + Art. 5(4)
DE314 LEIPZIG 592,117 97.5 2.5 0.0100 97.5 Art. 5(8) + Art. 5(4)
DE400 NURNBERG 1,177,916 100.0 100.0 Art. 5(8) + Art. 5(4)
DE123 DUISBURG 1,202,607 98.0 2.0 98.0 1.9 Art. 5(8) + Art. 5(4)
DE226 HANNOVER 1,247,852 99.9 0.1 99.9 Art. 5(8) + Art. 5(4)
DE072 BOTTROP 1,327,533 98.0 2.0 98.0 Art. 5(8) + Art. 5(4)
DE126 DUESSELDORF 1,371,450 98.0 2.0 98.0 47.5 Art. 5(8) + Art. 5(4)
DE163 FRANKFURT AM MAIN 1,665,770 98.5 1.5 98.5 Art. 5(8) + Art. 5(4)
DE370 MUENCHEN 1,700,000 100.0 100.0 Art. 5(8) + Art. 5(4)
DEAG_NW905 Dinstlaken Emschermündung
1,706,002 98.0 2.0 98.0 Art. 5(8) + Art. 5(4)
DE288 KOELN 1,931,775 98.0 2.0 98.0 98.0 Art. 5(8) + Art. 5(4)
DE221 HAMBURG 2,900,000 99.8 0.2 99.8 Art. 5(8) + Art. 5(4)
DE057 BERLIN 3,640,627 99.2 0.8 99.2 38.0 Art. 5(8) + Art. 5(4)

Technical assessment of the implementation of Directive 91/271/EEC – Annex VII
15
11 Greece
Table: Waste water treatment of big cities / big dischargers in Greece (Reference date 31 December 2010)
ID of big city/big
discharger
Name of big city/ big
discharger
Generated
load p. e.
Load collected
in
collecting system
(%)
Load adressed
through IAS (%)
Load not collected and not
adressed through IAS (%)
Load collected but
w ithout treatment (%)
Load treated w ith primary treatment (%)
as best available treatment
Load treated w ith secondary treatment
(%) as best available treatment
Load treated w ith 3N, 3P or
3NP (%) as
best available treatment
Load treated
w ith other more
stringent
treatment (%) as best available treatment
Type of receiving area
GR025 PATRA 170,000 91.0 9.0 0.0 91.0 91.0 NA
GR010 IRAKLIO CRETE 175,000 100.0 0.0 0.0 100.0 100.0 NA
GR035 VOLOS 175,000 90.0 10.0 0.0 90.0 NA
GR30002601 METAMORPHOSI 450,000 14.0 86.0 0.0 14.0
14.0 NA
GR031 THESSALONIKI 900,000 100.0 0.0 0.0 100.0 100.0 SA/ CSA (criterion a (N))
GR005 ATHINA 5,400,000 100.0 0.0 0.0 100.0 SA/ CSA (criterion a (N))
12 Hungary
Table: Waste water treatment of big cities / big dischargers in Hungary (Reference date 31 December 2009)
ID of big city/big discharger
Name of big city/ big discharger
Generated load p. e.
Load
collected in
collecting
system (%)
Load adressed through
IAS (%)
Load not
collected and not
adressed
through IAS (%)
Load collected but
w ithout
treatment (%)
Load treated
w ith primary treatment (%)
as best
available treatment
Load
treated w ith secondary treatment
(%) as best
available treatment
Load
treated w ith 3N, 3P or
3NP (%) as best
available treatment
Load treated w ith other
more stringent
treatment (%)
as best available treatment
Type of receiving area
HU-AGGL-AHW709
Hodmezovasarhely - Szennyvizelvezetesi
Agglomeracio
155,284 93.6 6.4 93.6 93.6 NA
HU065
Szombathely -
Szennyvizelvezetesi Agglomeracio
177,724 96.0 4.0 0.0 96.0 NA
Technical assessment of the implementation of Directive 91/271/EEC – Annex VII
16
ID of big city/big discharger
Name of big city/ big discharger
Generated load p. e.
Load
collected in
collecting
system (%)
Load adressed through
IAS (%)
Load not
collected and not
adressed
through IAS (%)
Load collected but
w ithout
treatment (%)
Load treated
w ith primary treatment (%)
as best
available treatment
Load
treated w ith secondary treatment
(%) as best
available treatment
Load
treated w ith 3N, 3P or
3NP (%) as best
available treatment
Load treated w ith other
more stringent
treatment (%)
as best available treatment
Type of receiving area
HU049 PECS 215,602 95.1 4.9 0.0 95.1 NA
HU018 GYOR 220,235 94.7 5.3 0.0 0.2 94.5 94.5 NA
HU055 SZEKESFEHERVAR 229,518 91.5 8.5 0.0 91.5 91.5 NA
HU062 Kecskemet - Szennyvizelvezetesi
Agglomeracio
237,944 65.9 34.1 0.0 65.9 NA
HU038 MISKOLC 270,516 89.9 10.1 0.0 89.9 89.9 NA
HU064 Nyiregyhaza - Szennyvizelvezetesi
Agglomeracio
275,020 95.6 4.4 0.0 95.6 NA
HU054 SZEGED 328,822 99.3 0.7 0.0 99.3 NA
HU009 DEBRECEN 380,441 89.8 10.2 0.0 89.8 89.8 NA
HU006 BUDAPEST 3,389,914 94.9 5.1 0.0 37.6 57.3 57.3 NA
13 Ireland
Table: Waste water treatment of big cities / big dischargers in Ireland (Reference date 31 Decem ber 2010)
ID of big city/big discharger
Name of big city/ big discharger
Generated load p. e.
Load
collected in
collecting
system (%)
Load adressed through
IAS (%)
Load not
collected and not
adressed
through IAS (%)
Load collected but
w ithout
treatment (%)
Load treated
w ith primary treatment (%)
as best
available treatment
Load
treated w ith secondary treatment
(%) as best
available treatment
Load
treated w ith 3N, 3P or
3NP (%) as best
available treatment
Load treated w ith other
more stringent
treatment (%)
as best available treatment
Type of receiving area
IE002 CORK 269,000 100.0 100.0 SA/ CSA
IE006 DUBLIN 2,454,924 100.0 100.0 100.0 SA/ CSA
Technical assessment of the implementation of Directive 91/271/EEC – Annex VII
17
14 Italy
Table: Waste water treatment of big cities / big dischargers in Italy (Reference date 31 December 2009)
ID of big city/big discharger
Name of big city/ big discharger
Generated load p. e.
Load
collected in
collecting system
(%)
Load adressed through IAS (%)
Load not
collected and not
adressed through
IAS (%)
Load collected but
w ithout treatment (%)
Load treated
w ith primary treatment (%)
as best available
treatment
Load
treated w ith secondary treatment
(%) as best
available treatment
Load
treated w ith 3N, 3P or
3NP (%) as best
available treatment
Load treated w ith other
more stringent
treatment (%) as best
available treatment
Type of receiving area
IT08000000000104 Lugo 157,618 99.0 1.0 0.2 98.8 98.8 Art. 5(4) - area
IT03160122000391 Truccazzano 161,100 98.8 1.2 98.8 98.8 Art. 5(4) - area
IT152 FERRARA 161,788 98.8 1.2 98.8 98.8 Art. 5(4) - area
IT19Q90000000996 ACIREALE CONSORTILE
163,285 17.0 60.0 23.0 17.0 17.0 NA
IT336 REGGIO NELL'EMILIA
163,618 94.8 5.2 94.8 94.8 Art. 5(4) - area
IT12000000000085 LATINA 164,200 97.2 2.8 97.2 97.2 SA/ CSA (criterion a (N+P))
IT08000000000084 Forli' 164,456 98.0 2.0 98.0 98.0 Art. 5(4) - area
IT100000000025 TERNI 165,594 96.0 4.1 96.0 NA
IT123 COMO 167,588 95.8 4.2 95.8 95.8 Art. 5(4) - area
IT05000000000045 Thiene 168,759 88.3 11.7 3.3 85.0 84.6 SA/ CSA (criterion a (P))
IT18Q90000001584 Santa Maria del Cedro
170,000 95.0 5.0 5.8 55.1 34.1 89.2 NA
IT05000000000014 Peschiera del Garda 172,026 97.0 3.0 97.0 97.0 Art. 5(4) - area
IT08000000000057 Cervia 173,196 100.0 100.0 100.0 Art. 5(4) - area
IT08000000000063 Comacchio 173,766 100.0 100.0 100.0 Art. 5(4) - area
IT20000000000185 Sassari 174,553 100.0 100.0 100.0 NA
IT03160121000133 Cremona 180,000 100.0 100.0 100.0 Art. 5(4) - area
IT03160121000072 Caronno Pertusella 186,226 100.0 100.0 100.0 Art. 5(4) - area
Technical assessment of the implementation of Directive 91/271/EEC – Annex VII
18
ID of big city/big discharger
Name of big city/ big discharger
Generated load p. e.
Load
collected in
collecting
system (%)
Load adressed through
IAS (%)
Load not
collected and not
adressed
through IAS (%)
Load collected but
w ithout
treatment (%)
Load treated
w ith primary treatment (%)
as best
available treatment
Load
treated w ith secondary treatment
(%) as best
available treatment
Load
treated w ith 3N, 3P or
3NP (%) as best
available treatment
Load treated w ith other
more stringent
treatment (%)
as best available treatment
Type of receiving area
IT08000000000152 Ravenna - Aree limitrofe
187,273 100.0 0.2 99.8 99.8 Art. 5(4) - area
IT302 PERUGIA 189,315 96.3 3.7 1.4 94.9 75.5 SA/ CSA (criterion c
(Ramsar))
IT03Q90000000822 Peschiera Borromeo 191,100 100.0 100.0 100.0 Art. 5(4) - area
IT304 PESCARA 193,000 100.0 100.0 100.0 NA
IT160000000145 LECCE 195,368 88.0 12.0 88.0 88.0 NA
IT058 BRESCIA 195,618 100.0 2.8 1.1 96.1 96.1 Art. 5(4) - area
IT19Q90000001022 MISTERBIANCO CONSORTILE
200,000 41.0 59.0 41.0 41.0 NA
IT437 VICENZA 205,082 100.0 100.0 95.9 SA/ CSA (criterion a (P))
IT155 FOGGIA 206,074 98.0 2.0 98.0 98.0 NA
IT131 COSENZA 207,000 90.0 4.0 6.0 5.7 84.3 90.0 NA
IT090000000109 LIVORNO 207,760 100.0 100.0 100.0 NA
IT090000000136 FUCECCHIO 214,583 99.7 0.3 99.7 99.7 Art. 5(4) - area
IT18Q90000001739 REGGIO CALABRIA 217,500 99.0 1.0 15.0 84.0 NA
IT070000000033 Darsena 220,000 100.0 100.0 NA
IT03160121000367 SEVESO SUD 220,859 97.1 2.9 97.1 Art. 5(4) - area
IT246 MODENA 228,286 100.0 100.0 100.0 Art. 5(4) - area
IT070000000018 Savona 228,651 100.0 100.0 NA
IT03160121000317 Robecco sul Naviglio 236,221 84.6 15.4 84.6 84.6 Art. 5(4) - area
IT06000000000066 CERVIGNANO; Depuratore San giorgio di Nogaro
240,658 96.0 4.0 96.0 96.0 NA
IT070000000034 Punta Vagno 250,000 98.0 2.0 98.0 NA
IT298 PARMA 251,363 95.0 5.0 95.0 95.0 Art. 5(4) - area
IT150000000004 Nola 252,628 96.0 1.0 3.0 96.0 96.0 NA
Technical assessment of the implementation of Directive 91/271/EEC – Annex VII
19
ID of big city/big discharger
Name of big city/ big discharger
Generated load p. e.
Load
collected in
collecting
system (%)
Load adressed through
IAS (%)
Load not
collected and not
adressed
through IAS (%)
Load collected but
w ithout
treatment (%)
Load treated
w ith primary treatment (%)
as best
available treatment
Load
treated w ith secondary treatment
(%) as best
available treatment
Load
treated w ith 3N, 3P or
3NP (%) as best
available treatment
Load treated w ith other
more stringent
treatment (%)
as best available treatment
Type of receiving area
IT21000000000013 Fossa Grande di Bronzolo
270,305 99.8 0.2 99.8 SA/ CSA (criterion a (P))
IT090000000003 PRATO 272,170 99.6 0.5 94.6 5.0 99.6 Art. 5(4) - area
IT01000000000061 Cossato 273,001 100.0 100.0 100.0 Art. 5(4) - area
IT01000000000013 Collegno - Pianezza 274,000 100.0 100.0 70.0 Art. 5(4) - area
IT293 PADOVA 297,358 96.0 4.0 96.0 96.0 SA/ CSA (criterion a (P))
IT06000000000067 TRIESTE; Muggia 299,375 100.0 71.7 28.3 70.0 SA/ CSA (criterion a (P))
IT150000000025 Nocera Inferiore 304,033 76.0 5.0 19.0 76.0 NA
IT21000000000009 Bolzano 308,511 99.0 1.0 99.0 SA/ CSA (criterion a (P))
IT239 MESSINA 313,000 92.0 8.0 17.9 74.1 74.1 NA
IT353 SALERNO 317,059 93.0 3.0 4.0 93.0 93.0 NA
IT402 TARANTO 317,829 89.0 11.0 48.0 41.0 89.0 NA
IT090000000090 CASTELFRANCO DI SOTTO
327,000 99.9 0.1 99.9 99.9 Art. 5(4) - area
IT21000000000010 Burgraviato 327,307 99.4 0.6 99.4 SA/ CSA (criterion a (P))
IT170 GALLARATE 331,633 98.0 2.0 98.0 98.0 Art. 5(4) - area
IT150000000005 Torre del Greco 335,132 90.0 4.0 6.0 90.0 90.0 NA
IT150000000001 Afragola 338,902 94.0 5.0 1.0 94.0 94.0 NA
IT084 CASERTA 342,777 92.0 4.0 4.0 92.0 92.0 NA
IT20000000000150 Porto Torres 349,141 100.0 100.0 NA
IT434 VERONA 351,333 90.0 10.0 90.0 90.0 SA/ CSA (criterion a (P))
IT03160121000258 OLONA SUD 427,306 80.6 19.4 80.6 80.6 Art. 5(4) - area
IT737 MESTRE 483,149 92.7 7.3 92.7 92.7 SA/ CSA (criterion a (N))
IT090000000075 SAN MINIATO 492,612 99.9 0.1 99.9 99.9 Art. 5(4) - area
IT035 AVERSA 525,659 91.0 5.0 4.0 91.0 91.0 NA

Technical assessment of the implementation of Directive 91/271/EEC – Annex VII
20
ID of big city/big discharger
Name of big city/ big discharger
Generated load p. e.
Load
collected in
collecting
system (%)
Load adressed through
IAS (%)
Load not
collected and not
adressed
through IAS (%)
Load collected but
w ithout
treatment (%)
Load treated
w ith primary treatment (%)
as best
available treatment
Load
treated w ith secondary treatment
(%) as best
available treatment
Load
treated w ith 3N, 3P or
3NP (%) as best
available treatment
Load treated w ith other
more stringent
treatment (%)
as best available treatment
Type of receiving area
IT063 CAGLIARI 540,856 100.0 1.7 98.3 100.0 SA/ CSA (criterion a (N+P))
IT342 RIMINI 584,042 100.0 18.9 81.1 100.0 Art. 5(4) - area
IT093 CATANIA 604,824 41.0 50.0 9.0 20.5 20.5 20.5 NA
IT03160121000237 Monza 626,513 99.9 0.1 99.9 99.9 Art. 5(4) - area
IT154 FIRENZE 642,336 98.8 1.2 19.1 2.8 76.9 79.7 Art. 5(4) - area
IT054 BOLOGNA 653,809 100.0 100.0 100.0 Art. 5(4) - area
IT090000000074 SANTA CROCE SULL'ARNO
656,000 100.0 100.0 100.0 Art. 5(4) - area
IT042 BARI 821,394 96.0 4.0 96.0 96.0 NA
IT048 BERGAMO 851,661 99.9 0.1 2.8 97.2 99.7 Art. 5(4) - area
IT295 PALERMO 1,002,384 80.0 20.0 8.0 45.1 20.9 6.0 72.0 NA
IT05Q90000001824 Valle del Chiampo 1,672,102 98.0 2.0 98.0 98.0 SA/ CSA (criterion a (P))
IT267 NAPOLI 1,942,258 93.1 2.9 4.0 93.1 93.1 NA
IT240 MILANO 2,120,040 100.0 100.0 100.0 Art. 5(4) - area
IT410 TORINO 2,500,000 100.0 100.0 Art. 5(4) - area
IT344 ROMA 2,873,600 98.3 1.7 3.0 63.2 32.0 95.2 NA
Technical assessment of the implementation of Directive 91/271/EEC – Annex VII
21
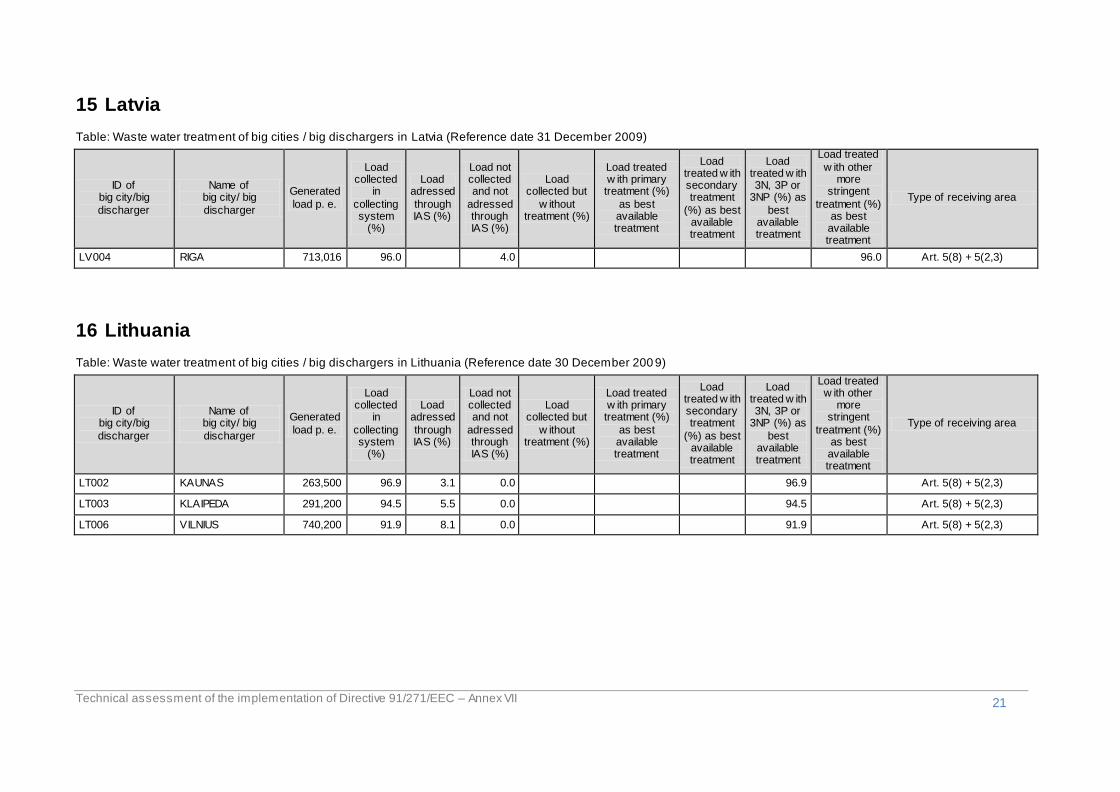
15 Latvia
Table: Waste water treatment of big cities / big dischargers in Latvia (Reference date 31 December 2009)
ID of big city/big
discharger
Name of big city/ big
discharger
Generated
load p. e.
Load collected
in
collecting system
(%)
Load adressed
through IAS (%)
Load not collected and not
adressed through IAS (%)
Load collected but
w ithout treatment (%)
Load treated w ith primary treatment (%)
as best available treatment
Load treated w ith secondary treatment
(%) as best available treatment
Load treated w ith 3N, 3P or
3NP (%) as
best available treatment
Load treated
w ith other more
stringent
treatment (%) as best available treatment
Type of receiving area
LV004 RIGA 713,016 96.0 4.0 96.0 Art. 5(8) + 5(2,3)
16 Lithuania
Table: Waste water treatment of big cities / big dischargers in Lithuania (Reference date 30 December 200 9)
ID of big city/big
discharger
Name of big city/ big
discharger
Generated
load p. e.
Load collected
in
collecting system
(%)
Load adressed
through IAS (%)
Load not collected and not
adressed through IAS (%)
Load collected but
w ithout treatment (%)
Load treated w ith primary treatment (%)
as best available treatment
Load treated w ith secondary treatment
(%) as best available treatment
Load treated w ith 3N, 3P or
3NP (%) as
best available treatment
Load treated w ith other
more stringent
treatment (%) as best available treatment
Type of receiving area
LT002 KAUNAS 263,500 96.9 3.1 0.0 96.9 Art. 5(8) + 5(2,3)
LT003 KLAIPEDA 291,200 94.5 5.5 0.0 94.5 Art. 5(8) + 5(2,3)
LT006 VILNIUS 740,200 91.9 8.1 0.0 91.9 Art. 5(8) + 5(2,3)

Technical assessment of the implementation of Directive 91/271/EEC – Annex VII
22
17 Luxembourg
Table: Waste water treatment of big cities / big dischargers in Luxembourg (Reference date 31 December 2010)
ID of big city/big
discharger
Name of big city/ big
discharger
Generated
load p. e.
Load collected
in
collecting system
(%)
Load adressed
through IAS (%)
Load not collected and not
adressed through IAS (%)
Load collected but
w ithout treatment (%)
Load treated w ith primary treatment (%)
as best available treatment
Load treated w ith secondary treatment
(%) as best available treatment
Load treated w ith 3N, 3P or
3NP (%) as
best available treatment
Load treated
w ith other more
stringent
treatment (%) as best available treatment
Type of receiving area
LU002 LUXEMBOURG 244,018 99.0 1.0 0.0 21.0 78.0 Art. 5(8) + 5(2,3)
18 Malta
Table: Waste water treatment of big cities / big dischargers in Malta (Reference date 31 December 2010)
ID of big city/big discharger
Name of big city/ big discharger
Generated load p. e.
Load collected
in collecting system
(%)
Load
adressed through IAS (%)
Load not collected
and not adressed through IAS (%)
Load
collected but w ithout
treatment (%)
Load treated w ith primary
treatment (%) as best available treatment
Load treated w ith
secondary treatment
(%) as best available
treatment
Load treated w ith
3N, 3P or 3NP (%) as
best available
treatment
Load treated w ith other
more
stringent treatment (%)
as best available
treatment
Type of receiving area
MT001 VALLETTA 350,000 100.0 0.0 0.0 100.0 NA

Technical assessment of the implementation of Directive 91/271/EEC – Annex VII
23
19 Netherlands
Table: Waste water treatment of big cities / big dischargers in the Netherlands (Reference date 31 December 200 9)
ID of big city/big
discharger
Name of big city/ big
discharger
Generated
load p. e.
Load collected
in
collecting system
(%)
Load adressed
through IAS (%)
Load not collected and not
adressed through IAS (%)
Load collected but
w ithout treatment (%)
Load treated w ith primary treatment (%)
as best available treatment
Load treated w ith secondary treatment
(%) as best available treatment
Load treated w ith 3N, 3P or
3NP (%) as
best available treatment
Load treated
w ith other more
stringent
treatment (%) as best available treatment
Type of receiving area
NLBG12004 BEVERWIJK 155,242 100.0 100.0 Art. 5(8) + Art. 5(4)
NLA30024 ROERMOND 156,139 100.0 100.0 Art. 5(8) + Art. 5(4)
NLA06005 ALMERE 158,771 100.0 100.0 Art. 5(8) + Art. 5(4)
NLA13010 HAARLEM 161,286 100.0 100.0 Art. 5(8) + Art. 5(4)
NLBG30015 HEERLEN 172,015 100.0 100.0 Art. 5(8) + Art. 5(4)
NLA12013 WARMENHUIZEN 179,808 100.0 100.0 Art. 5(8) + Art. 5(4)
NLA30003 MAASTRICHT 182,716 100.0 100.0 Art. 5(8) + Art. 5(4)
NLBG10027 AMERSFOORT 184,754 100.0 100.0 Art. 5(8) + Art. 5(4)
NLBG28005 VEGHEL 185,713 100.0 100.0 Art. 5(8) + Art. 5(4)
NLBG27008 'S
HERTOGENBOSCH 187,940 100.0 100.0 Art. 5(8) + Art. 5(4)
NLBG28003 HELMOND 188,418 100.0 100.0 Art. 5(8) + Art. 5(4)
NLA30022 SUSTEREN 189,689 100.0 100.0 Art. 5(8) + Art. 5(4)
NLBG09024 NIJMEGEN 191,609 100.0 100.0 Art. 5(8) + Art. 5(4)
NLA08022 APELDOORN 192,436 100.0 100.0 Art. 5(8) + Art. 5(4)
NLBG32001 TILBURG 192,453 100.0 100.0 Art. 5(8) + Art. 5(4)
NLBG29002 OSS 193,253 100.0 100.0 Art. 5(8) + Art. 5(4)
NLBG05013 ENSCHEDE 199,510 100.0 100.0 Art. 5(8) + Art. 5(4)
NLBG30017 VENLO 205,341 100.0 100.0 Art. 5(8) + Art. 5(4)
NLBG01033 GRONINGEN 208,104 100.0 100.0 Art. 5(8) + Art. 5(4)
NLBG25017 BREDA 220,935 100.0 100.0 Art. 5(8) + Art. 5(4)

Technical assessment of the implementation of Directive 91/271/EEC – Annex VII
24
ID of big city/big discharger
Name of big city/ big discharger
Generated load p. e.
Load
collected in
collecting
system (%)
Load adressed through
IAS (%)
Load not
collected and not
adressed
through IAS (%)
Load collected but
w ithout
treatment (%)
Load treated
w ith primary treatment (%)
as best
available treatment
Load
treated w ith secondary treatment
(%) as best
available treatment
Load
treated w ith 3N, 3P or
3NP (%) as best
available treatment
Load treated w ith other
more stringent
treatment (%)
as best available treatment
Type of receiving area
NLBG15005 'S-GRAVENHAGE 245,052 100.0 100.0 Art. 5(8) + Art. 5(4)
NLBG25021 BERGEN OP ZOOM 264,545 100.0 100.0 Art. 5(8) + Art. 5(4)
NLBG10009 UTRECHT 308,374 100.0 100.0 Art. 5(8) + Art. 5(4)
NLBG07020 ARNHEM 325,376 100.0 100.0 Art. 5(8) + Art. 5(4)
NLBG27003 EINDHOVEN 391,913 100.0 100.0 Art. 5(8) + Art. 5(4)
NLA15008 DEN HOORN 679,296 100.0 100.0 Art. 5(8) + Art. 5(4)
NLBG17061 ROTTERDAM 783,555 100.0 1.2 98.8 Art. 5(8) + Art. 5(4)
NLBG31003 AMSTERDAM 908,121 100.0 100.0 Art. 5(8) + Art. 5(4)
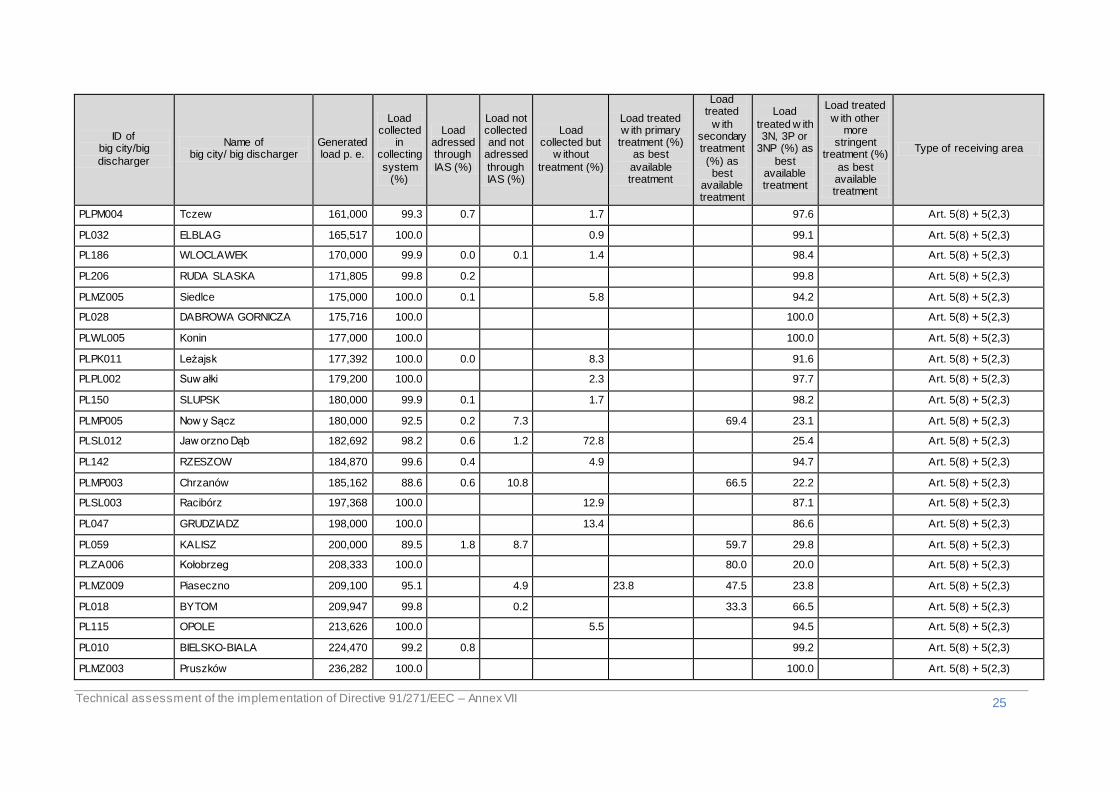
20 Poland
Table: Waste water treatment of big cities / big dischargers in Poland (Reference date 31 December 20 10)
ID of big city/big discharger
Name of big city/ big discharger
Generated load p. e.
Load collected
in collecting system
(%)
Load
adressed through IAS (%)
Load not collected
and not adressed through IAS (%)
Load
collected but w ithout
treatment (%)
Load treated w ith primary
treatment (%) as best available treatment
Load treated
w ith
secondary treatment (%) as best
available treatment
Load treated w ith
3N, 3P or 3NP (%) as
best available
treatment
Load treated w ith other
more
stringent treatment (%)
as best available
treatment
Type of receiving area
PL141 RYBNIK 150,132 98.4 1.6 6.0 92.4 Art. 5(8) + 5(2,3)
PLZA004 Stargard Szczeciński 150,468 99.9 0.1 1.6 98.3 Art. 5(8) + 5(2,3)
PLLO004 Tomaszów Mazowiecki 157,000 100.0 11.3 88.7 Art. 5(8) + 5(2,3)
PL128 PLOCK 160,000 100.0 100.0 Art. 5(8) + 5(2,3)
PL207 JASTRZEBIE-ZDROJ 160,843 96.6 3.4 96.6 Art. 5(8) + 5(2,3)
Technical assessment of the implementation of Directive 91/271/EEC – Annex VII
25
ID of big city/big
discharger
Name of big city/ big discharger
Generated load p. e.
Load collected
in collecting
system (%)
Load adressed through
IAS (%)
Load not collected and not
adressed
through IAS (%)
Load collected but
w ithout
treatment (%)
Load treated w ith primary treatment (%)
as best
available treatment
Load treated
w ith secondary treatment
(%) as best
available treatment
Load
treated w ith 3N, 3P or
3NP (%) as
best available treatment
Load treated
w ith other more
stringent treatment (%)
as best available treatment
Type of receiving area
PLPM004 Tczew 161,000 99.3 0.7 1.7 97.6 Art. 5(8) + 5(2,3)
PL032 ELBLAG 165,517 100.0 0.9 99.1 Art. 5(8) + 5(2,3)
PL186 WLOCLAWEK 170,000 99.9 0.0 0.1 1.4 98.4 Art. 5(8) + 5(2,3)
PL206 RUDA SLASKA 171,805 99.8 0.2 99.8 Art. 5(8) + 5(2,3)
PLMZ005 Siedlce 175,000 100.0 0.1 5.8 94.2 Art. 5(8) + 5(2,3)
PL028 DABROWA GORNICZA 175,716 100.0 100.0 Art. 5(8) + 5(2,3)
PLWL005 Konin 177,000 100.0 100.0 Art. 5(8) + 5(2,3)
PLPK011 Leżajsk 177,392 100.0 0.0 8.3 91.6 Art. 5(8) + 5(2,3)
PLPL002 Suw ałki 179,200 100.0 2.3 97.7 Art. 5(8) + 5(2,3)
PL150 SLUPSK 180,000 99.9 0.1 1.7 98.2 Art. 5(8) + 5(2,3)
PLMP005 Now y Sącz 180,000 92.5 0.2 7.3 69.4 23.1 Art. 5(8) + 5(2,3)
PLSL012 Jaw orzno Dąb 182,692 98.2 0.6 1.2 72.8 25.4 Art. 5(8) + 5(2,3)
PL142 RZESZOW 184,870 99.6 0.4 4.9 94.7 Art. 5(8) + 5(2,3)
PLMP003 Chrzanów 185,162 88.6 0.6 10.8 66.5 22.2 Art. 5(8) + 5(2,3)
PLSL003 Racibórz 197,368 100.0 12.9 87.1 Art. 5(8) + 5(2,3)
PL047 GRUDZIADZ 198,000 100.0 13.4 86.6 Art. 5(8) + 5(2,3)
PL059 KALISZ 200,000 89.5 1.8 8.7 59.7 29.8 Art. 5(8) + 5(2,3)
PLZA006 Kołobrzeg 208,333 100.0 80.0 20.0 Art. 5(8) + 5(2,3)
PLMZ009 Piaseczno 209,100 95.1 4.9 23.8 47.5 23.8 Art. 5(8) + 5(2,3)
PL018 BYTOM 209,947 99.8 0.2 33.3 66.5 Art. 5(8) + 5(2,3)
PL115 OPOLE 213,626 100.0 5.5 94.5 Art. 5(8) + 5(2,3)
PL010 BIELSKO-BIALA 224,470 99.2 0.8 99.2 Art. 5(8) + 5(2,3)
PLMZ003 Pruszków 236,282 100.0 100.0 Art. 5(8) + 5(2,3)

Technical assessment of the implementation of Directive 91/271/EEC – Annex VII
26
ID of big city/big
discharger
Name of big city/ big discharger
Generated load p. e.
Load collected
in collecting
system (%)
Load adressed through
IAS (%)
Load not collected and not
adressed
through IAS (%)
Load collected but
w ithout
treatment (%)
Load treated w ith primary treatment (%)
as best
available treatment
Load treated
w ith secondary treatment
(%) as best
available treatment
Load
treated w ith 3N, 3P or
3NP (%) as
best available treatment
Load treated
w ith other more
stringent treatment (%)
as best available treatment
Type of receiving area
PL023 CHORZOW 238,949 100.0 1.1 98.9 Art. 5(8) + 5(2,3)
PL073 KOSZALIN 239,578 99.8 0.3 99.7 0.0 Art. 5(8) + 5(2,3)
PL042 GORZOWWIELKOPOLSKI 239,800 99.8 0.2 8.3 91.5 Art. 5(8) + 5(2,3)
PLWL004 Piła 242,000 99.1 0.3 0.6 0.8 98.3 Art. 5(8) + 5(2,3)
PL201 ZIELONA GORA 245,667 99.5 0.5 4.0 95.6 Art. 5(8) + 5(2,3)
PL037 GLIWICE 246,700 99.8 0.1 0.2 5.9 93.9 Art. 5(8) + 5(2,3)
PLSL007 ?yw iec 247,619 100.0 35.7 64.3 Art. 5(8) + 5(2,3)
PL064 KIELCE 257,108 99.1 0.2 0.7 3.7 95.4 Art. 5(8) + 5(2,3)
PL192 ZABRZE 257,700 99.4 0.6 99.4 Art. 5(8) + 5(2,3)
PL113 OLSZTYN 270,000 99.8 0.2 2.5 97.4 Art. 5(8) + 5(2,3)
PL138 RADOM 300,477 100.0 100.0 Art. 5(8) + 5(2,3)
PL027 CZESTOCHOWA 328,385 99.8 0.2 49.9 49.9 Art. 5(8) + 5(2,3)
PL153 SOSNOWIEC 328,629 91.6 0.1 8.3 91.6 Art. 5(8) + 5(2,3)
PL171 TARNOW 366,400 98.0 0.0 2.0 6.5 91.5 Art. 5(8) + 5(2,3)
PL017 BYDGOSZCZ 380,085 95.0 0.0 5.0 23.8 71.3 Art. 5(8) + 5(2,3)
PL167 SZCZECIN 418,000 99.6 0.1 0.4 99.6 Art. 5(8) + 5(2,3)
PL061 KATOWICE 422,400 93.8 6.2 93.8 Art. 5(8) + 5(2,3)
PL179 TYCHY 429,295 98.3 1.8 0.7 97.5 Art. 5(8) + 5(2,3)
PL008 BIALYSTOK 450,254 100.0 2.5 97.5 Art. 5(8) + 5(2,3)
PL035 GDYNIA 550,000 99.9 0.0 0.1 2.7 97.2 Art. 5(8) + 5(2,3)
PL176 TORUN 555,000 99.4 0.0 0.6 49.7 49.7 Art. 5(8) + 5(2,3)
PL093 LUBLIN 559,910 98.6 0.4 1.0 3.7 94.9 Art. 5(8) + 5(2,3)
PL034 GDANSK 650,000 99.8 0.2 4.5 95.3 Art. 5(8) + 5(2,3)
Technical assessment of the implementation of Directive 91/271/EEC – Annex VII
27
ID of big city/big
discharger
Name of big city/ big discharger
Generated load p. e.
Load collected
in collecting
system (%)
Load adressed through
IAS (%)
Load not collected and not
adressed
through IAS (%)
Load collected but
w ithout
treatment (%)
Load treated w ith primary treatment (%)
as best
available treatment
Load treated
w ith secondary treatment
(%) as best
available treatment
Load
treated w ith 3N, 3P or
3NP (%) as
best available treatment
Load treated
w ith other more
stringent treatment (%)
as best available treatment
Type of receiving area
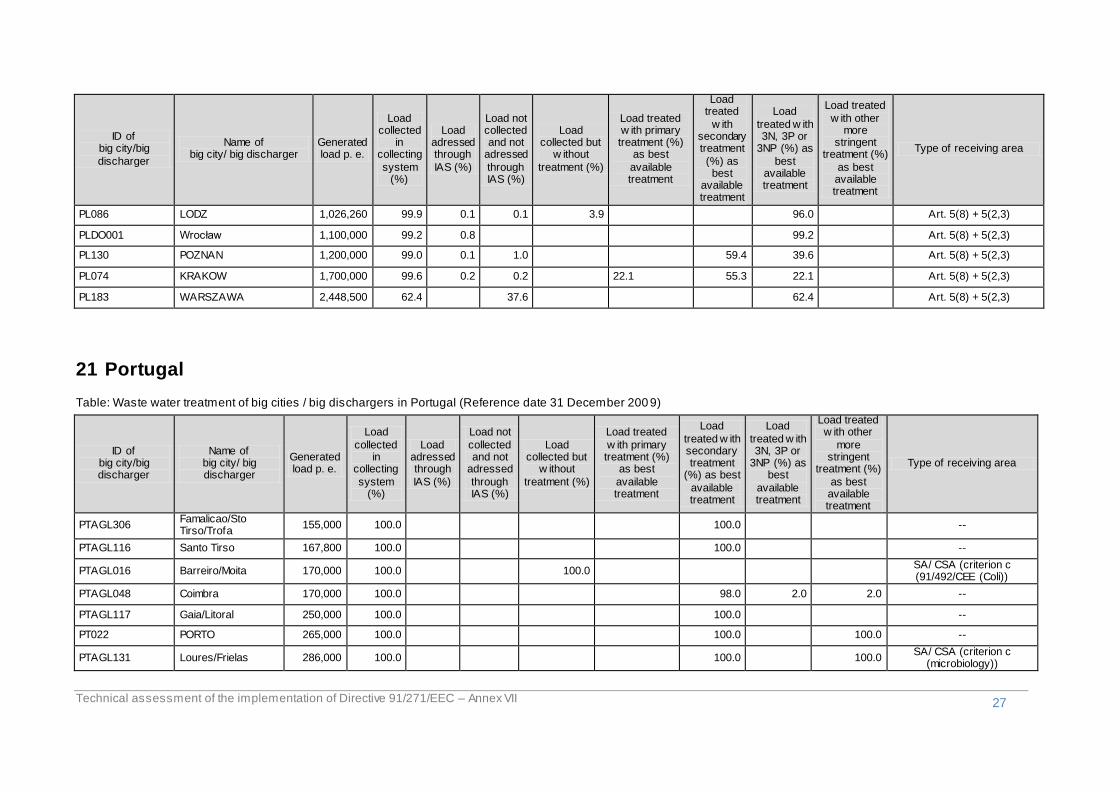
PL086 LODZ 1,026,260 99.9 0.1 0.1 3.9 96.0 Art. 5(8) + 5(2,3)
PLDO001 Wrocław 1,100,000 99.2 0.8 99.2 Art. 5(8) + 5(2,3)
PL130 POZNAN 1,200,000 99.0 0.1 1.0 59.4 39.6 Art. 5(8) + 5(2,3)
PL074 KRAKOW 1,700,000 99.6 0.2 0.2 22.1 55.3 22.1 Art. 5(8) + 5(2,3)
PL183 WARSZAWA 2,448,500 62.4 37.6 62.4 Art. 5(8) + 5(2,3)
21 Portugal
Table: Waste water treatment of big cities / big dischargers in Portugal (Reference date 31 December 200 9)
ID of big city/big discharger
Name of big city/ big discharger
Generated load p. e.
Load
collected in
collecting
system (%)
Load adressed through
IAS (%)
Load not
collected and not
adressed
through IAS (%)
Load collected but
w ithout
treatment (%)
Load treated
w ith primary treatment (%)
as best
available treatment
Load
treated w ith secondary treatment
(%) as best
available treatment
Load
treated w ith 3N, 3P or
3NP (%) as best
available treatment
Load treated w ith other
more stringent
treatment (%)
as best available treatment
Type of receiving area
PTAGL306 Famalicao/Sto Tirso/Trofa
155,000 100.0 100.0 --
PTAGL116 Santo Tirso 167,800 100.0 100.0 --
PTAGL016 Barreiro/Moita 170,000 100.0 100.0 SA/ CSA (criterion c (91/492/CEE (Coli))
PTAGL048 Coimbra 170,000 100.0 98.0 2.0 2.0 --
PTAGL117 Gaia/Litoral 250,000 100.0 100.0 --
PT022 PORTO 265,000 100.0 100.0 100.0 --
PTAGL131 Loures/Frielas 286,000 100.0 100.0 100.0 SA/ CSA (criterion c
(microbiology))
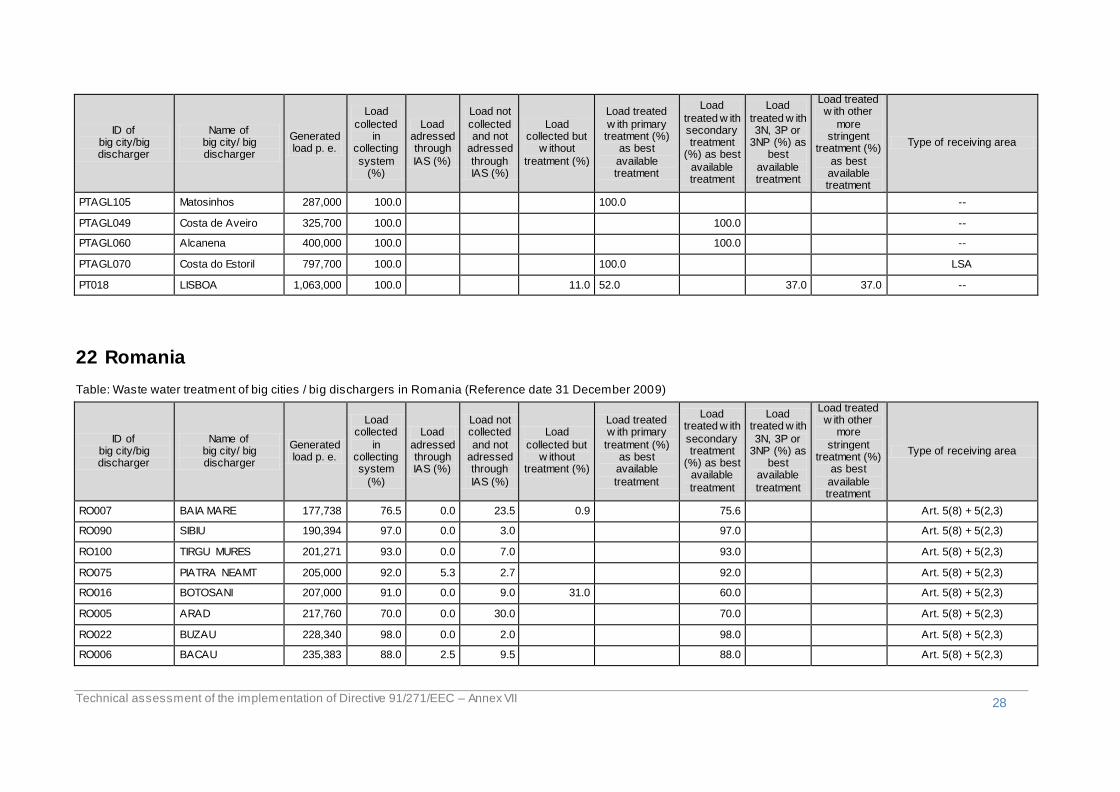
Technical assessment of the implementation of Directive 91/271/EEC – Annex VII
28
ID of big city/big discharger
Name of big city/ big discharger
Generated load p. e.
Load
collected in
collecting
system (%)
Load adressed through
IAS (%)
Load not
collected and not
adressed
through IAS (%)
Load collected but
w ithout
treatment (%)
Load treated
w ith primary treatment (%)
as best
available treatment
Load
treated w ith secondary treatment
(%) as best
available treatment
Load
treated w ith 3N, 3P or
3NP (%) as best
available treatment
Load treated w ith other
more stringent
treatment (%)
as best available treatment
Type of receiving area
PTAGL105 Matosinhos 287,000 100.0 100.0 --
PTAGL049 Costa de Aveiro 325,700 100.0 100.0 --
PTAGL060 Alcanena 400,000 100.0 100.0 --
PTAGL070 Costa do Estoril 797,700 100.0 100.0 LSA
PT018 LISBOA 1,063,000 100.0 11.0 52.0 37.0 37.0 --
22 Romania
Table: Waste water treatment of big cities / big dischargers in Romania (Reference date 31 December 2009)
ID of big city/big discharger
Name of big city/ big discharger
Generated load p. e.
Load collected
in collecting system
(%)
Load
adressed through IAS (%)
Load not collected
and not adressed through
IAS (%)
Load
collected but w ithout
treatment (%)
Load treated w ith primary
treatment (%) as best available
treatment
Load treated w ith
secondary treatment
(%) as best available
treatment
Load treated w ith
3N, 3P or 3NP (%) as
best available
treatment
Load treated w ith other
more
stringent treatment (%)
as best
available treatment
Type of receiving area
RO007 BAIA MARE 177,738 76.5 0.0 23.5 0.9 75.6 Art. 5(8) + 5(2,3)
RO090 SIBIU 190,394 97.0 0.0 3.0 97.0 Art. 5(8) + 5(2,3)
RO100 TIRGU MURES 201,271 93.0 0.0 7.0 93.0 Art. 5(8) + 5(2,3)
RO075 PIATRA NEAMT 205,000 92.0 5.3 2.7 92.0 Art. 5(8) + 5(2,3)
RO016 BOTOSANI 207,000 91.0 0.0 9.0 31.0 60.0 Art. 5(8) + 5(2,3)
RO005 ARAD 217,760 70.0 0.0 30.0 70.0 Art. 5(8) + 5(2,3)
RO022 BUZAU 228,340 98.0 0.0 2.0 98.0 Art. 5(8) + 5(2,3)
RO006 BACAU 235,383 88.0 2.5 9.5 88.0 Art. 5(8) + 5(2,3)
Technical assessment of the implementation of Directive 91/271/EEC – Annex VII
29
ID of big city/big discharger
Name of big city/ big discharger
Generated load p. e.
Load
collected in
collecting
system (%)
Load adressed through
IAS (%)
Load not
collected and not
adressed
through IAS (%)
Load collected but
w ithout
treatment (%)
Load treated
w ith primary treatment (%)
as best
available treatment
Load
treated w ith secondary treatment
(%) as best
available treatment
Load
treated w ith 3N, 3P or
3NP (%) as best
available treatment
Load treated w ith other
more stringent
treatment (%)
as best available treatment
Type of receiving area
RO082 RIMNICU VILCEA 237,362 73.0 0.0 27.0 73.0 Art. 5(8) + 5(2,3)
RO070 ORADEA 244,325 87.3 0.3 12.4 0.03 87.28 Art. 5(8) + 5(2,3)
RO018 BRAILA 279,918 87.0 0.0 13.0 87.0 Art. 5(8) + 5(2,3)
RO076 PITESTI 296,999 81.0 0.1 19.0 81.0 Art. 5(8) + 5(2,3)
RO049 GALATI 307,785 96.5 0.0 3.5 96.5 Art. 5(8) + 5(2,3)
RO077 PLOIESTI 336,248 84.0 0.0 16.0 84.0 Art. 5(8) + 5(2,3)
RO038 CRAIOVA 375,000 74.7 0.0 25.3 74.7 Art. 5(8) + 5(2,3)
RO033 CLUJ-NAPOCA 435,000 87.7 0.5 11.8 87.7 Art. 5(8) + 5(2,3)
RO096 TIMISOARA 465,000 92.5 5.6 1.9 92.5 Art. 5(8) + 5(2,3)
RO036 CONSTANTA 580,621 99.0 0.0 1.0 99.0 Art. 5(8) + 5(2,3)
RO019 BRASOV 619,281 95.0 0.0 5.0 28.0 67.0 Art. 5(8) + 5(2,3)
RO056 IASI 758,604 88.0 0.0 12.0 88.0 Art. 5(8) + 5(2,3)
RO020 BUCURESTI 2,158,691 85.0 0.2 14.9 85.0 Art. 5(8) + 5(2,3)
23 Slovakia
Table: Waste water treatment of big cities / big dischargers in Slovakia (Reference date 31 December 200 9)
ID of big city/big discharger
Name of big city/ big discharger
Generated load p. e.
Load collected
in collecting
system (%)
Load adressed through
IAS (%)
Load not collected and not
adressed
through IAS (%)
Load collected but
w ithout
treatment (%)
Load treated w ith primary treatment (%)
as best
available treatment
Load
treated w ith secondary treatment
(%) as best
available treatment
Load
treated w ith 3N, 3P or
3NP (%) as best
available treatment
Load treated
w ith other more
stringent treatment (%)
as best available treatment
Type of receiving area

Technical assessment of the implementation of Directive 91/271/EEC – Annex VII
30
ID of big city/big discharger
Name of big city/ big discharger
Generated load p. e.
Load
collected in
collecting
system (%)
Load adressed through
IAS (%)
Load not
collected and not
adressed
through IAS (%)
Load collected but
w ithout
treatment (%)
Load treated
w ith primary treatment (%)
as best
available treatment
Load
treated w ith secondary treatment
(%) as best
available treatment
Load
treated w ith 3N, 3P or
3NP (%) as best
available treatment
Load treated w ith other
more stringent
treatment (%)
as best available treatment
Type of receiving area
SK010 ZILINA 159,685 91.4 8.5 0.1 91.4 SA/CSA (criterion a (N+P))
SK012 KOSICE 221,214 99.5 0.4 0.1 99.5 SA/CSA (criterion a (N+P))
SK008 RUZOMBEROK 395,544 95.4 4.5 0.1 95.4 SA/CSA (criterion a (N+P))
SK004 BRATISLAVA 539,871 98.4 1.6 0.0 91.0 7.4 SA/CSA (criterion a (N+P))
24 Slovenia
Table: Waste water treatment of big cities / big dischargers in Slovenia (Reference date 31 December 200 9)
ID of big city/big discharger
Name of big city/ big discharger
Generated load p. e.
Load collected
in collecting
system (%)
Load adressed through
IAS (%)
Load not collected and not
adressed
through IAS (%)
Load collected but
w ithout
treatment (%)
Load treated w ith primary treatment (%)
as best
available treatment
Load
treated w ith secondary treatment
(%) as best
available treatment
Load
treated w ith 3N, 3P or
3NP (%) as best
available treatment
Load treated
w ith other more
stringent treatment (%)
as best available treatment
Type of receiving area
SI009 LJUBLJANA 351,623 94.0 6.0 0.4 91.0 2.7 NA
Technical assessment of the implementation of Directive 91/271/EEC – Annex VII
31
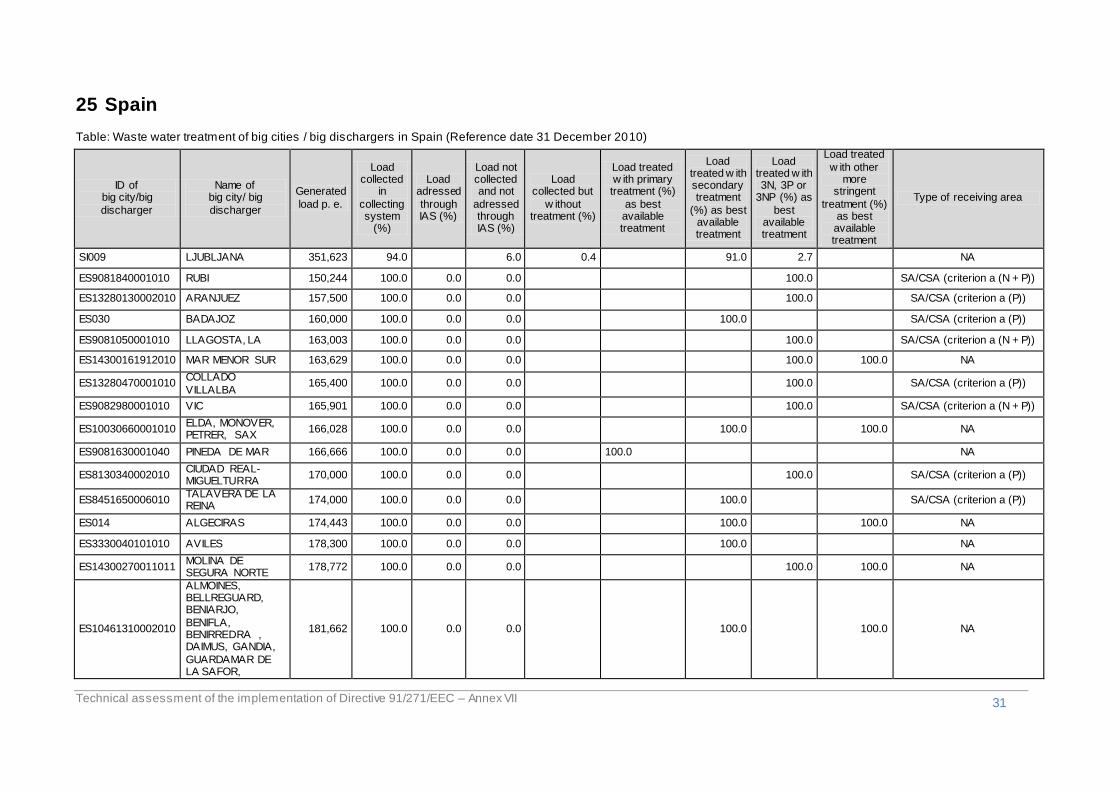
25 Spain
Table: Waste water treatment of big cities / big dischargers in Spain (Reference date 31 December 2010)
ID of big city/big
discharger
Name of big city/ big
discharger
Generated
load p. e.
Load collected
in
collecting system
(%)
Load adressed
through IAS (%)
Load not collected and not
adressed through IAS (%)
Load collected but
w ithout treatment (%)
Load treated w ith primary treatment (%)
as best available treatment
Load treated w ith secondary treatment
(%) as best available treatment
Load treated w ith 3N, 3P or
3NP (%) as
best available treatment
Load treated
w ith other more
stringent
treatment (%) as best available treatment
Type of receiving area
SI009 LJUBLJANA 351,623 94.0 6.0 0.4 91.0 2.7 NA
ES9081840001010 RUBI 150,244 100.0 0.0 0.0 100.0 SA/CSA (criterion a (N + P))
ES13280130002010 ARANJUEZ 157,500 100.0 0.0 0.0 100.0 SA/CSA (criterion a (P))
ES030 BADAJOZ 160,000 100.0 0.0 0.0 100.0 SA/CSA (criterion a (P))
ES9081050001010 LLAGOSTA, LA 163,003 100.0 0.0 0.0 100.0 SA/CSA (criterion a (N + P))
ES14300161912010 MAR MENOR SUR 163,629 100.0 0.0 0.0 100.0 100.0 NA
ES13280470001010 COLLADO
VILLALBA 165,400 100.0 0.0 0.0 100.0 SA/CSA (criterion a (P))
ES9082980001010 VIC 165,901 100.0 0.0 0.0 100.0 SA/CSA (criterion a (N + P))
ES10030660001010 ELDA, MONOVER, PETRER, SAX
166,028 100.0 0.0 0.0 100.0 100.0 NA
ES9081630001040 PINEDA DE MAR 166,666 100.0 0.0 0.0 100.0 NA
ES8130340002010 CIUDAD REAL-MIGUELTURRA
170,000 100.0 0.0 0.0 100.0 SA/CSA (criterion a (P))
ES8451650006010 TALAVERA DE LA REINA
174,000 100.0 0.0 0.0 100.0 SA/CSA (criterion a (P))
ES014 ALGECIRAS 174,443 100.0 0.0 0.0 100.0 100.0 NA
ES3330040101010 AVILES 178,300 100.0 0.0 0.0 100.0 NA
ES14300270011011 MOLINA DE SEGURA NORTE
178,772 100.0 0.0 0.0 100.0 100.0 NA
ES10461310002010
ALMOINES, BELLREGUARD, BENIARJO,
BENIFLA, BENIRREDRA , DAIMUS, GANDIA,
GUARDAMAR DE LA SAFOR,
181,662 100.0 0.0 0.0 100.0 100.0 NA
Technical assessment of the implementation of Directive 91/271/EEC – Annex VII
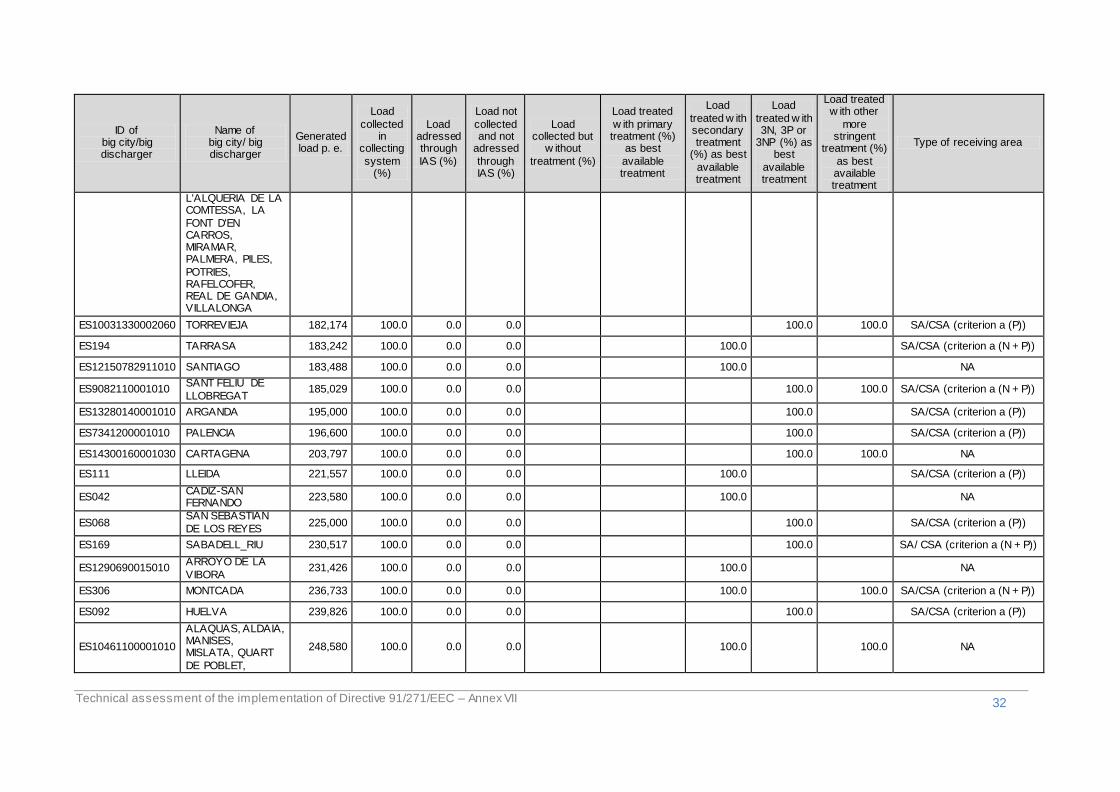
32
ID of big city/big discharger
Name of big city/ big discharger
Generated load p. e.
Load
collected in
collecting
system (%)
Load adressed through
IAS (%)
Load not
collected and not
adressed
through IAS (%)
Load collected but
w ithout
treatment (%)
Load treated
w ith primary treatment (%)
as best
available treatment
Load
treated w ith secondary treatment
(%) as best
available treatment
Load
treated w ith 3N, 3P or
3NP (%) as best
available treatment
Load treated w ith other
more stringent
treatment (%)
as best available treatment
Type of receiving area
L'ALQUERIA DE LA COMTESSA, LA
FONT D'EN CARROS, MIRAMAR, PALMERA, PILES,
POTRIES, RAFELCOFER, REAL DE GANDIA, VILLALONGA
ES10031330002060 TORREVIEJA 182,174 100.0 0.0 0.0 100.0 100.0 SA/CSA (criterion a (P))
ES194 TARRASA 183,242 100.0 0.0 0.0 100.0 SA/CSA (criterion a (N + P))
ES12150782911010 SANTIAGO 183,488 100.0 0.0 0.0 100.0 NA
ES9082110001010 SANT FELIU DE
LLOBREGAT 185,029 100.0 0.0 0.0 100.0 100.0 SA/CSA (criterion a (N + P))
ES13280140001010 ARGANDA 195,000 100.0 0.0 0.0 100.0 SA/CSA (criterion a (P))
ES7341200001010 PALENCIA 196,600 100.0 0.0 0.0 100.0 SA/CSA (criterion a (P))
ES14300160001030 CARTAGENA 203,797 100.0 0.0 0.0 100.0 100.0 NA
ES111 LLEIDA 221,557 100.0 0.0 0.0 100.0 SA/CSA (criterion a (P))
ES042 CADIZ-SAN FERNANDO
223,580 100.0 0.0 0.0 100.0 NA
ES068 SAN SEBASTIAN
DE LOS REYES 225,000 100.0 0.0 0.0 100.0 SA/CSA (criterion a (P))
ES169 SABADELL_RIU 230,517 100.0 0.0 0.0 100.0 SA/ CSA (criterion a (N + P))
ES1290690015010 ARROYO DE LA
VIBORA 231,426 100.0 0.0 0.0 100.0 NA
ES306 MONTCADA 236,733 100.0 0.0 0.0 100.0 100.0 SA/CSA (criterion a (N + P))
ES092 HUELVA 239,826 100.0 0.0 0.0 100.0 SA/CSA (criterion a (P))
ES10461100001010
ALAQUAS, ALDAIA, MANISES, MISLATA, QUART
DE POBLET,
248,580 100.0 0.0 0.0 100.0 100.0 NA
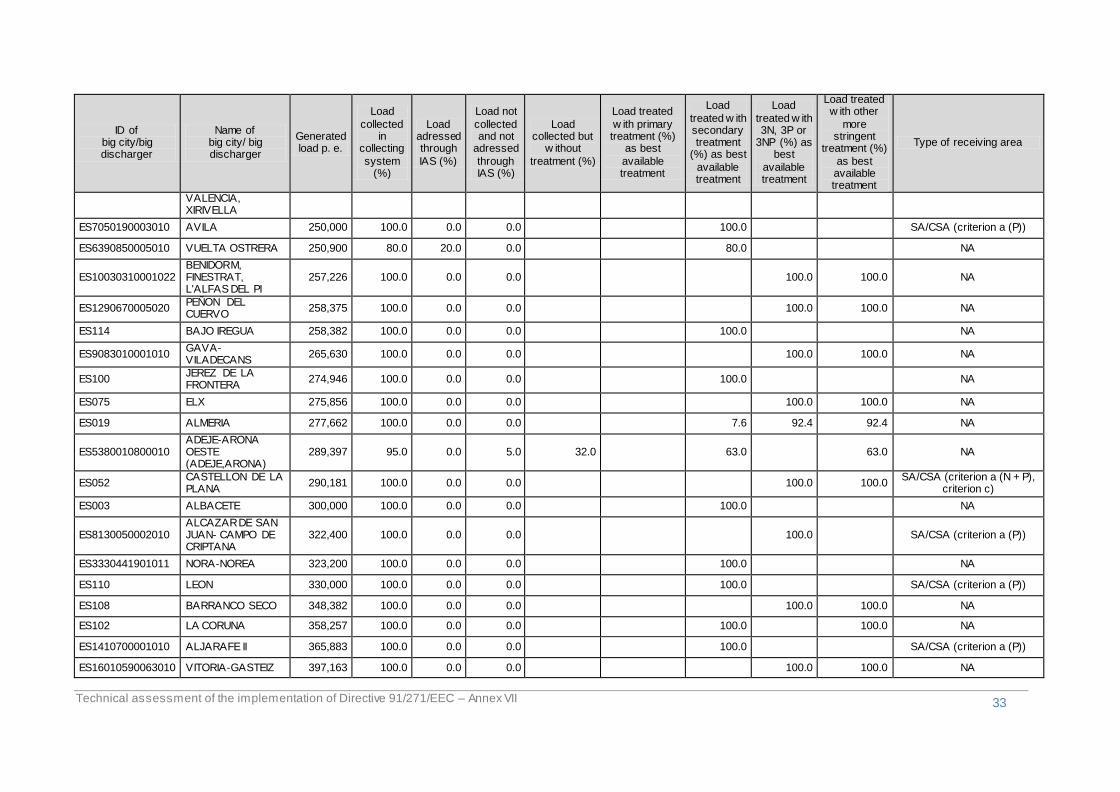
Technical assessment of the implementation of Directive 91/271/EEC – Annex VII
33
ID of big city/big discharger
Name of big city/ big discharger
Generated load p. e.
Load
collected in
collecting
system (%)
Load adressed through
IAS (%)
Load not
collected and not
adressed
through IAS (%)
Load collected but
w ithout
treatment (%)
Load treated
w ith primary treatment (%)
as best
available treatment
Load
treated w ith secondary treatment
(%) as best
available treatment
Load
treated w ith 3N, 3P or
3NP (%) as best
available treatment
Load treated w ith other
more stringent
treatment (%)
as best available treatment
Type of receiving area
VALENCIA, XIRIVELLA
ES7050190003010 AVILA 250,000 100.0 0.0 0.0 100.0 SA/CSA (criterion a (P))
ES6390850005010 VUELTA OSTRERA 250,900 80.0 20.0 0.0 80.0 NA
ES10030310001022 BENIDORM, FINESTRAT, L'ALFAS DEL PI
257,226 100.0 0.0 0.0 100.0 100.0 NA
ES1290670005020 PEÑON DEL CUERVO
258,375 100.0 0.0 0.0 100.0 100.0 NA
ES114 BAJO IREGUA 258,382 100.0 0.0 0.0 100.0 NA
ES9083010001010 GAVA-VILADECANS
265,630 100.0 0.0 0.0 100.0 100.0 NA
ES100 JEREZ DE LA FRONTERA
274,946 100.0 0.0 0.0 100.0 NA
ES075 ELX 275,856 100.0 0.0 0.0 100.0 100.0 NA
ES019 ALMERIA 277,662 100.0 0.0 0.0 7.6 92.4 92.4 NA
ES5380010800010 ADEJE-ARONA OESTE (ADEJE,ARONA)
289,397 95.0 0.0 5.0 32.0 63.0 63.0 NA
ES052 CASTELLON DE LA PLANA
290,181 100.0 0.0 0.0 100.0 100.0 SA/CSA (criterion a (N + P),
criterion c)
ES003 ALBACETE 300,000 100.0 0.0 0.0 100.0 NA
ES8130050002010 ALCAZAR DE SAN JUAN- CAMPO DE CRIPTANA
322,400 100.0 0.0 0.0 100.0 SA/CSA (criterion a (P))
ES3330441901011 NORA-NOREA 323,200 100.0 0.0 0.0 100.0 NA
ES110 LEON 330,000 100.0 0.0 0.0 100.0 SA/CSA (criterion a (P))
ES108 BARRANCO SECO 348,382 100.0 0.0 0.0 100.0 100.0 NA
ES102 LA CORUNA 358,257 100.0 0.0 0.0 100.0 100.0 NA
ES1410700001010 ALJARAFE II 365,883 100.0 0.0 0.0 100.0 SA/CSA (criterion a (P))
ES16010590063010 VITORIA-GASTEIZ 397,163 100.0 0.0 0.0 100.0 100.0 NA
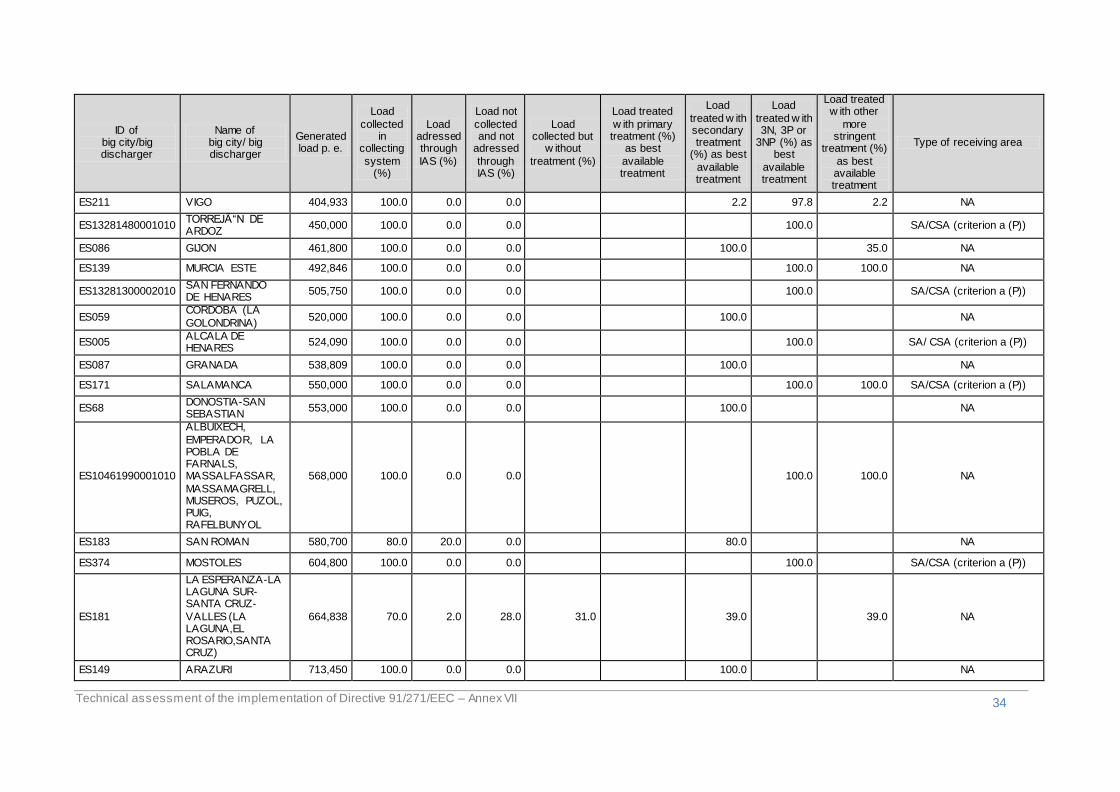
Technical assessment of the implementation of Directive 91/271/EEC – Annex VII
34
ID of big city/big discharger
Name of big city/ big discharger
Generated load p. e.
Load
collected in
collecting
system (%)
Load adressed through
IAS (%)
Load not
collected and not
adressed
through IAS (%)
Load collected but
w ithout
treatment (%)
Load treated
w ith primary treatment (%)
as best
available treatment
Load
treated w ith secondary treatment
(%) as best
available treatment
Load
treated w ith 3N, 3P or
3NP (%) as best
available treatment
Load treated w ith other
more stringent
treatment (%)
as best available treatment
Type of receiving area
ES211 VIGO 404,933 100.0 0.0 0.0 2.2 97.8 2.2 NA
ES13281480001010 TORREJÓN DE ARDOZ
450,000 100.0 0.0 0.0 100.0 SA/CSA (criterion a (P))
ES086 GIJON 461,800 100.0 0.0 0.0 100.0 35.0 NA
ES139 MURCIA ESTE 492,846 100.0 0.0 0.0 100.0 100.0 NA
ES13281300002010 SAN FERNANDO DE HENARES
505,750 100.0 0.0 0.0 100.0 SA/CSA (criterion a (P))
ES059 CORDOBA (LA
GOLONDRINA) 520,000 100.0 0.0 0.0 100.0 NA
ES005 ALCALA DE HENARES
524,090 100.0 0.0 0.0 100.0 SA/ CSA (criterion a (P))
ES087 GRANADA 538,809 100.0 0.0 0.0 100.0 NA
ES171 SALAMANCA 550,000 100.0 0.0 0.0 100.0 100.0 SA/CSA (criterion a (P))
ES68 DONOSTIA-SAN SEBASTIAN
553,000 100.0 0.0 0.0 100.0 NA
ES10461990001010
ALBUIXECH,
EMPERADOR, LA POBLA DE FARNALS, MASSALFASSAR,
MASSAMAGRELL, MUSEROS, PUZOL, PUIG, RAFELBUNYOL
568,000 100.0 0.0 0.0 100.0 100.0 NA
ES183 SAN ROMAN 580,700 80.0 20.0 0.0 80.0 NA
ES374 MOSTOLES 604,800 100.0 0.0 0.0 100.0 SA/CSA (criterion a (P))
ES181
LA ESPERANZA-LA LAGUNA SUR-SANTA CRUZ-
VALLES (LA LAGUNA,EL ROSARIO,SANTA CRUZ)
664,838 70.0 2.0 28.0 31.0 39.0 39.0 NA
ES149 ARAZURI 713,450 100.0 0.0 0.0 100.0 NA

Technical assessment of the implementation of Directive 91/271/EEC – Annex VII
35
ID of big city/big discharger
Name of big city/ big discharger
Generated load p. e.
Load
collected in
collecting
system (%)
Load adressed through
IAS (%)
Load not
collected and not
adressed
through IAS (%)
Load collected but
w ithout
treatment (%)
Load treated
w ith primary treatment (%)
as best
available treatment
Load
treated w ith secondary treatment
(%) as best
available treatment
Load
treated w ith 3N, 3P or
3NP (%) as best
available treatment
Load treated w ith other
more stringent
treatment (%)
as best available treatment
Type of receiving area
ES121 MALAGA OESTE (GUADALHORCE)
731,782 100.0 0.0 0.0 100.0 100.0 NA
ES039 BURGOS 750,000 100.0 0.0 0.0 100.0 NA
ES208 VALLADOLID 751,600 100.0 0.0 0.0 100.0 SA/CSA (criterion a (P))
ES016 ALACANT 860,453 100.0 0.0 0.0 77.6 22.4 100.0 NA
ES148 PALMA 1,024,000 100.0 0.0 0.0 55.1 44.9 100.0 SA/ CSA (criterion c)
ES225 ALMOZARA 1,120,000 100.0 0.0 0.0 8.9 91.1 SA/ CSA (criterion a (P))
ES037 GRAN BILBAO 1,211,499 100.0 0.0 0.0 100.0 NA
ES081 PINTO 1,224,720 100.0 0.0 0.0 100.0 SA/CSA (criterion a (P))
ES206 VALENCIA 1,277,888 100.0 0.0 0.0 28.3 71.7 100.0 NA
ES332 GETAFE 1,353,600 100.0 0.0 0.0 100.0 SA/CSA (criterion a (P))
ES188 SEVILLA 1,434,097 100.0 0.0 0.0 79.2 20.8 92.7 SA/ CSA (criterion a (P))
ES033 BARCELONA 2,739,925 100.0 0.0 0.0 62.4 37.6 37.6 NA
ES119 MADRID 4,072,507 100.0 0.0 0.0 100.0 SA/ CSA (criterion a (P))
26 Sweden
Table: Waste water treatment of big cities / big dischargers in Sweden (Reference date 31 December 20 10)
ID of
big city/big discharger
Name of
big city/ big discharger
Generated load p. e.
Load collected
in collecting system
(%)
Load
adressed through IAS (%)
Load not collected
and not adressed through IAS (%)
Load
collected but w ithout
treatment (%)
Load treated w ith primary
treatment (%) as best available treatment
Load treated w ith secondary
treatment (%) as best
available
treatment
Load treated w ith 3N, 3P or
3NP (%) as best
available
treatment
Load treated w ith other
more
stringent treatment (%)
as best available
treatment
Type of receiving area

Technical assessment of the implementation of Directive 91/271/EEC – Annex VII
36
ID of big city/big discharger
Name of big city/ big discharger
Generated load p. e.
Load
collected in
collecting
system (%)
Load adressed through
IAS (%)
Load not
collected and not
adressed
through IAS (%)
Load collected but
w ithout
treatment (%)
Load treated
w ith primary treatment (%)
as best
available treatment
Load
treated w ith secondary treatment
(%) as best
available treatment
Load
treated w ith 3N, 3P or
3NP (%) as best
available treatment
Load treated w ith other
more stringent
treatment (%)
as best available treatment
Type of receiving area
SE_AGGLO_1005 LINKOEPING 183,000 100.0 100.0 SA/CSA (criterion a (N + P))
SE026 MALMOE 338,700 100.0 100.0 SA/CSA (criterion a (N + P))
SE008 GOETEBORG 688,885 100.0 100.0 SA/CSA (criterion a (N + P))
SE036 STOCKHOLM 1,632,000 100.0 100.0 SA/CSA (criterion a (N + P))
27 United Kingdom
Table: Waste water treatment of big cities / big dischargers in United Kingdom (Reference date 31 December 20 10)
ID of big city/big
discharger
Name of
big city/ big discharger
Generated
load p. e.
Load collected
in
collecting system
(%)
Load adressed
through IAS (%)
Load not collected and not
adressed through IAS (%)
Load collected
but w ithout
treatment (%)
Load treated w ith primary
treatment
(%) as best available treatment
Load
treated w ith
secondary treatment
(%) as best
available
treatment
Load treated w ith 3N,
3P or
3NP (%) as best available treatment
Load
treated w ith other
more stringent
treatment (%) as best
available
treatment
Type of receiving area
UK200 NEWPORT 155,025 100.0 0.0 0.0 100.0 NA
UK062 CAMBRIDGE 155,709 99.2 0.8 0.0 99.2 criterion a (P)
UK321 Tilbury 160,796 99.8 0.2 0.0 99.8 NA
UK324 Bedford 169,417 99.2 0.8 0.0 99.2 criterion a (N+P)
UK259 SWANSEA 169,784 100.0 0.0 0.0 100.0 100.0 NA
UK301 YORK 170,898 100.0 0.0 0.0 100.0 NA
UK319 TELFORD 176,351 100.0 0.0 100.0 criterion a (P)
UK243 SOUTHEND 177,428 100.0 0.0 0.0 100.0 NA

Technical assessment of the implementation of Directive 91/271/EEC – Annex VII
37
ID of big city/big
discharger
Name of
big city/ big discharger
Generated
load p. e.
Load collected
in
collecting system
(%)
Load adressed
through IAS (%)
Load not collected and not
adressed through IAS (%)
Load collected
but w ithout
treatment (%)
Load treated w ith primary
treatment
(%) as best available treatment
Load
treated w ith
secondary treatment
(%) as best
available treatment
Load
treated w ith 3N,
3P or
3NP (%) as best available treatment
Load treated
w ith other more
stringent
treatment (%) as best
available
treatment
Type of receiving area
UK216 PLYMOUTH 179,264 99.5 0.5 0.0 99.5 86.0 NA
UK214 PETERBOROUGH 181,440 99.7 0.3 0.0 99.7 criterion a (P)
UK326 Poole 182,145 97.0 3.0 0.0 97.0 97.0 criterion a (P) + criterion
c (Shellf ish Waters Directive)
UK271 TORBAY 182,894 100.0 0.0 0.0 100.0 100.0 NA
UK184 LUTON/DUNSTABLE 187,072 100.0 0.0 100.0 24% SA (criterion a
(NP)), 76% SA
(criterion a (P))
UK125 GLOUCESTER 189,028 100.0 0.0 0.0 100.0 NA
UK260 SWINDON 193,184 100.0 0.0 0.0 100.0 criterion a (P)
UK135 GRIMSBY/CLEETHORPES 197,935 99.2 0.8 0.0 99.2 29.7 30% SA (criterion a
(P)), 69% NA
UK211 OXFORD 198,551 100.0 0.0 0.0 100.0 criterion a (P)
UK320 Wellingborough 205,470 100.0 0.0 0.0 100.0 criterion a (P)
UK327 Levenmouth 214,690 100.0 0.0 0.0 100.0 100.0 NA
UK044 BOURNEMOUTH 215,355 93.6 6.4 0.0 93.6 93.6 criterion a (P)
UK241 SLOUGH 216,905 100.0 0.0 0.0 100.0 criterion a (P)
UK256 SUNDERLAND/WHITBURN 229,108 100.0 0.0 0.0 100.0 100.0 NA
UK038 BLACKBURN/DARWEN 235,460 96.0 4.0 0.0 96.0 96.0 NA
UK103 DUNDEE 236,078 100.0 0.0 0.0 100.0 NA
UK325 Fareham 238,268 98.0 2.0 0.0 98.0 98.0 NA
UK268 THE MEDWAY TOWNS 244,479 100.0 0.0 0.0 100.0 NA
UK224 READING/WOKINGHAM 247,104 100.0 0.0 0.0 100.0 criterion a (P)
UK223 PRESTON 249,361 100.0 0.0 0.0 100.0 100.0 NA
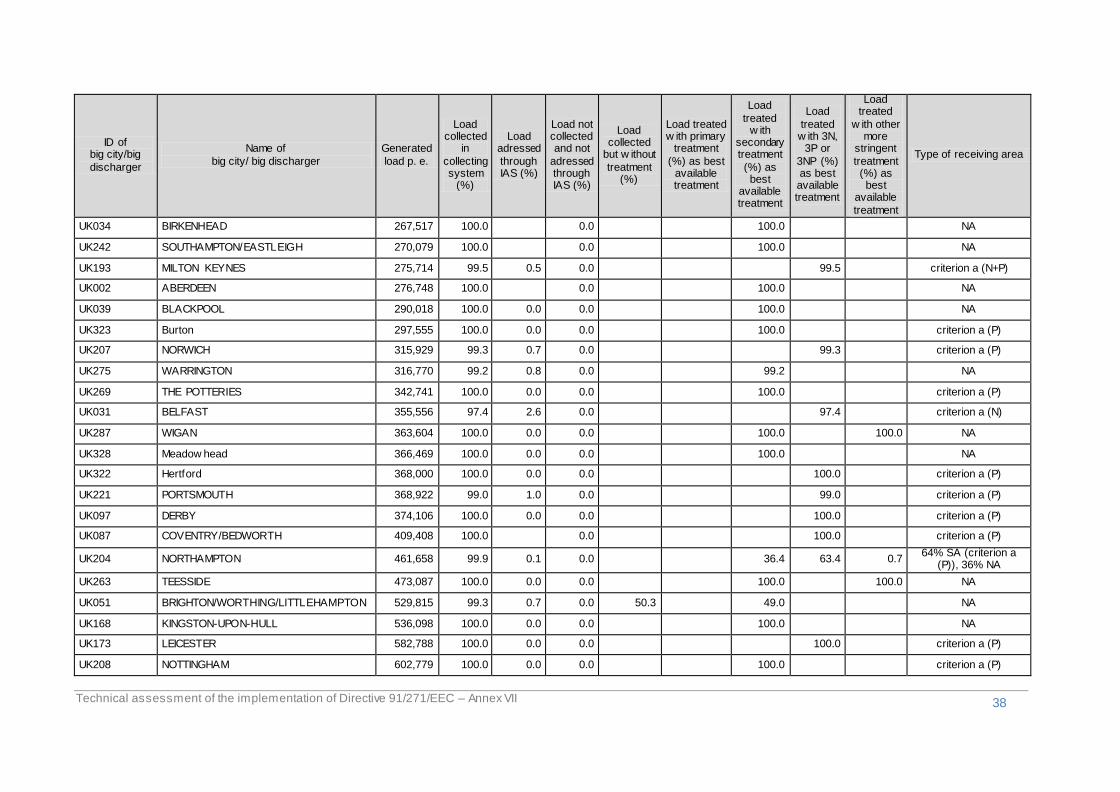
Technical assessment of the implementation of Directive 91/271/EEC – Annex VII
38
ID of big city/big
discharger
Name of
big city/ big discharger
Generated
load p. e.
Load collected
in
collecting system
(%)
Load adressed
through IAS (%)
Load not collected and not
adressed through IAS (%)
Load collected
but w ithout
treatment (%)
Load treated w ith primary
treatment
(%) as best available treatment
Load
treated w ith
secondary treatment
(%) as best
available treatment
Load
treated w ith 3N,
3P or
3NP (%) as best available treatment
Load treated
w ith other more
stringent
treatment (%) as best
available
treatment
Type of receiving area
UK034 BIRKENHEAD 267,517 100.0 0.0 100.0 NA
UK242 SOUTHAMPTON/EASTLEIGH 270,079 100.0 0.0 100.0 NA
UK193 MILTON KEYNES 275,714 99.5 0.5 0.0 99.5 criterion a (N+P)
UK002 ABERDEEN 276,748 100.0 0.0 100.0 NA
UK039 BLACKPOOL 290,018 100.0 0.0 0.0 100.0 NA
UK323 Burton 297,555 100.0 0.0 0.0 100.0 criterion a (P)
UK207 NORWICH 315,929 99.3 0.7 0.0 99.3 criterion a (P)
UK275 WARRINGTON 316,770 99.2 0.8 0.0 99.2 NA
UK269 THE POTTERIES 342,741 100.0 0.0 0.0 100.0 criterion a (P)
UK031 BELFAST 355,556 97.4 2.6 0.0 97.4 criterion a (N)
UK287 WIGAN 363,604 100.0 0.0 0.0 100.0 100.0 NA
UK328 Meadow head 366,469 100.0 0.0 0.0 100.0 NA
UK322 Hertford 368,000 100.0 0.0 0.0 100.0 criterion a (P)
UK221 PORTSMOUTH 368,922 99.0 1.0 0.0 99.0 criterion a (P)
UK097 DERBY 374,106 100.0 0.0 0.0 100.0 criterion a (P)
UK087 COVENTRY/BEDWORTH 409,408 100.0 0.0 100.0 criterion a (P)
UK204 NORTHAMPTON 461,658 99.9 0.1 0.0 36.4 63.4 0.7 64% SA (criterion a
(P)), 36% NA
UK263 TEESSIDE 473,087 100.0 0.0 0.0 100.0 100.0 NA
UK051 BRIGHTON/WORTHING/LITTLEHAMPTON 529,815 99.3 0.7 0.0 50.3 49.0 NA
UK168 KINGSTON-UPON-HULL 536,098 100.0 0.0 0.0 100.0 NA
UK173 LEICESTER 582,788 100.0 0.0 0.0 100.0 criterion a (P)
UK208 NOTTINGHAM 602,779 100.0 0.0 0.0 100.0 criterion a (P)
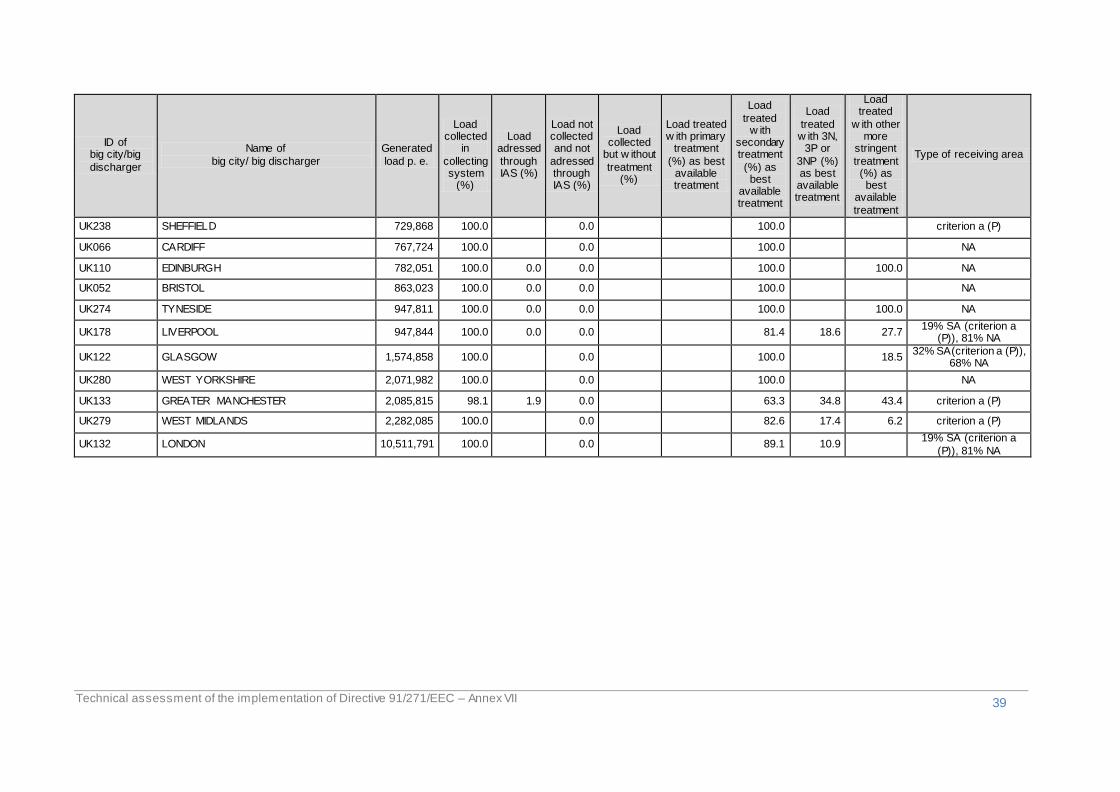
Technical assessment of the implementation of Directive 91/271/EEC – Annex VII
39
ID of big city/big
discharger
Name of
big city/ big discharger
Generated
load p. e.
Load collected
in
collecting system
(%)
Load adressed
through IAS (%)
Load not collected and not
adressed through IAS (%)
Load collected
but w ithout
treatment (%)
Load treated w ith primary
treatment
(%) as best available treatment
Load
treated w ith
secondary treatment
(%) as best
available treatment
Load
treated w ith 3N,
3P or
3NP (%) as best available treatment
Load treated
w ith other more
stringent
treatment (%) as best
available
treatment
Type of receiving area
UK238 SHEFFIELD 729,868 100.0 0.0 100.0 criterion a (P)
UK066 CARDIFF 767,724 100.0 0.0 100.0 NA
UK110 EDINBURGH 782,051 100.0 0.0 0.0 100.0 100.0 NA
UK052 BRISTOL 863,023 100.0 0.0 0.0 100.0 NA
UK274 TYNESIDE 947,811 100.0 0.0 0.0 100.0 100.0 NA
UK178 LIVERPOOL 947,844 100.0 0.0 0.0 81.4 18.6 27.7 19% SA (criterion a
(P)), 81% NA
UK122 GLASGOW 1,574,858 100.0 0.0 100.0 18.5 32% SA(criterion a (P)),
68% NA
UK280 WEST YORKSHIRE 2,071,982 100.0 0.0 100.0 NA
UK133 GREATER MANCHESTER 2,085,815 98.1 1.9 0.0 63.3 34.8 43.4 criterion a (P)
UK279 WEST MIDLANDS 2,282,085 100.0 0.0 82.6 17.4 6.2 criterion a (P)
UK132 LONDON 10,511,791 100.0 0.0 89.1 10.9 19% SA (criterion a
(P)), 81% NA