technical assistance report optimal reform … · technical assistance report — optimal reform...
TRANSCRIPT

© 2015 International Monetary Fund
IMF Country Report No. 15/315
ICELAND TECHNICAL ASSISTANCE REPORT—OPTIMAL REFORM AND DISTRIBUTIONAL ANALYSIS OF THE PERSONAL INCOME TAX
This paper on Iceland was prepared by a staff team of the International Monetary Fund. It
is based on the information available at the time it was completed on October 2015.
Copies of this report are available to the public from
International Monetary Fund Publication Services
PO Box 92780 Washington, D.C. 20090
Telephone: (202) 623-7430 Fax: (202) 623-7201
E-mail: [email protected] Web: http://www.imf.org
Price: $18.00 per printed copy
International Monetary Fund
Washington, D.C.
November 2015

INTERNATIONAL MONETARY FUND
Fiscal Affairs Department
ICELAND
OPTIMAL REFORM AND DISTRIBUTIONAL ANALYSIS
OF THE PERSONAL INCOME TAX
Thornton Matheson, Dora Benedek, David Wentworth,
Philippe Wingender and Marianna Jonasdottir
October 2015

The contents of this report constitute technical advice provided by
the staff of the International Monetary Fund (IMF) to the authorities
of Iceland (the "TA recipient") in response to their request for
technical assistance. This report (in whole or in part) or summaries
thereof may be disclosed by the IMF to IMF Executive Directors and
members of their staff, as well as to other agencies or
instrumentalities of the TA recipient, and upon their request, to
World Bank staff and other technical assistance providers and
donors with legitimate interest, unless the TA recipient specifically
objects to such disclosure (see Operational Guidelines for the
Dissemination of Technical Assistance Information—
http://www.imf.org/external/np/pp/eng/2013/061013.pdf).
Disclosure of this report (in whole or in part) or summaries thereof
to parties outside the IMF other than agencies or instrumentalities
of the TA recipient, World Bank staff, other technical assistance
providers and donors with legitimate interest shall require the
explicit consent of the TA recipient and the IMF’s Fiscal Affairs
Department.

3
Contents Page
Abbreviations ...................................................................................................................................................................... 5
Preface ................................................................................................................................................................................... 6
Executive Summary ........................................................................................................................................................... 7
I. Introduction and Overview...................................................................................................................................... 10
II. Optimal PIT Reform .................................................................................................................................................. 16
A. Overview of the Mirrlees-Saez Model ............................................................................................... 16
B. Optimizing the Icelandic PIT.................................................................................................................. 19
III. Child Benefit and Household Structure ........................................................................................................... 27
A. Child Benefit ................................................................................................................................................ 27
B. Individuals vs. Households ..................................................................................................................... 29
C. Taxing Teenagers ....................................................................................................................................... 34
IV. Housing-Related Benefits ..................................................................................................................................... 36
V. Fiscal Federalism ........................................................................................................................................................ 40
VI. IMF Reform Scenario .............................................................................................................................................. 44
VII. Distributional Analysis ........................................................................................................................................... 48
A. The Current Regime ................................................................................................................................. 48
B. The Government Reform Proposal ..................................................................................................... 53
C. The IMF Reform Scenario ....................................................................................................................... 54
Tables
1. Revenue-Maximizing Marginal Effective Top Rates – Selected Countries .......................................... 22
2. Child Benefit Parameters ........................................................................................................................................ 28
3. The Marriage Penalty ............................................................................................................................................... 31
4. The Marriage Credit from the Basic Credit ...................................................................................................... 32
5. The Marriage Credit from Bracket Sharing ...................................................................................................... 32
6. Interest Rebate Parameters.................................................................................................................................... 37
7. Average after Tax Household per Capita Income by Decile ..................................................................... 55
8. Inequality measures under the current system and the two proposals ............................................... 57
9. Government 2015 PIT Reform Proposal ........................................................................................................... 63
Figures
1. Level and Composition of General Government Tax Revenues .............................................................. 11
2. Marginal Statutory Tax Rates in Nordic Countries (2014) ......................................................................... 13
3. Average Statutory Tax Rates in Nordic Countries (2014) ........................................................................... 14

4
4. Optimal and Revenue-Maximizing Top Rates ................................................................................................ 19
6. Top 10 Percent of the Income Distribution and the Pareto Assumption ............................................ 21
7. Empirical Pareto distribution of Gross Labor Income .................................................................................. 23
8. Current and Optimal Marginal Tax Schedules ................................................................................................ 24
10. Optimal Marginal Tax Rate Schedule with Different Elasticities ........................................................... 25
9. Gross and Net Income under Baseline and Optimal PITs .......................................................................... 25
11. Division of PIT revenues between Central and Local Government ...................................................... 40
12. Composition of Local Government Revenues (2014) ................................................................................ 41
13. IMF reform with Unconditional Refundable Credit .................................................................................... 44
14. IMF Reform with Conditional Refundable Credit ........................................................................................ 45
15. After-Tax Income, IMF Reform ........................................................................................................................... 47
17. Distribution of PIT Liabilities by Income Deciles ......................................................................................... 49
16. Net Income and Tax Burden by Income Deciles ......................................................................................... 49
18. Distribution of Child Benefit by Income Decile and Share of Child Benefit in Household Net
Income ................................................................................................................................................................................ 50
19. Distribution of Interest Rebate by Income Decile and Share of Interest Rebate in Net
Income ................................................................................................................................................................................ 51
21. Net income, Tax Burden and Child Benefit by Family Type .................................................................... 52
20. Net Income, Tax Burden and Child Benefit by Number of Children ................................................... 52
22. Impact of Government Reform on Net Income by Decile ...................................................................... 53
23. Change in Household Net Income by Type of Family .............................................................................. 54
24. Change in Household Net Income by Income Deciles Compared to Current System and
Government Proposal ................................................................................................................................................... 55
25. Change in Household Net Income by Types of Family Compared to Current System and
Government Proposal ................................................................................................................................................... 56
Boxes
1. The Mirrlees-Saez Optimal Income Tax Model .............................................................................................. 18
Appendixes
A. The Evolution of Tax Policy Since the 2008 Crisis ......................................................................................... 58
B. Overview of Iceland’s PIT and Major Means-Tested Benefits .................................................................. 62

5
ABBREVIATIONS
ATR Average tax rate
CB Child benefit
CG Central government
CIT Corporate income tax
FAD Fiscal Affairs Department
FAT Financial activity tax
GDP Gross domestic product
HH Household
ISK Icelandic krona
IMF International Monetary Fund
LG Local government
LGA Local Government Act
MOFEA Ministry of Finance and Economic Affairs
MTR Marginal tax rate
PIT Personal income tax
R&D Research and development
RSK Rikisskattstjori (Icelandic Tax Administration)
SB Supplemental child benefit
SST Social security tax
TA Technical assistance
TAC Total allowable catch
UK United Kingdom
US United States
US$ United States dollars
VAT Value added tax (refers to Value-added Taxes in general)

6
PREFACE
In response to a request from the Icelandic authorities at the 2014 IMF Annual Meetings for
technical assistance (TA) on reform of the personal income tax (PIT), Ms. Thornton Matheson
(head), Ms. Dora Benedek, Mr. David Wentworth, Mr. Philippe Wingender (all Fiscal Affairs
Department) and visiting expert Ms. Marianna Jonasdottir (Director General, Department of Tax
Policy, Ministry of Finance and Economic Affairs, Reykjavik) participated in a headquarters-based
TA mission during March – July 2015.
The team was assisted in its research efforts by Ms. Fjola Agnarsdottir and Ms. Elin Gudjonsdottir
of the Department of Taxation, Ministry of Finance and Economic Affairs, and Mr. Pall Kollbeins,
Rikisskattstjori (Tax Administration). At IMF headquarters, the mission was also assisted by Ms.
Edda Ros Karlsdottir (Monetary and Capital Markets Department) and Mr. Johan Bjorgvinsson
(Statistics Department).

7
EXECUTIVE SUMMARY
At the request of the Minister of Finance and Economic Affairs, the IMF Fiscal Affairs
Division (FAD) undertook this study to reform the personal income tax (PIT). The goals of
the reform are as follows: to improve work incentives by lowering marginal tax rates; to simplify
the PIT and refundable credits (child benefit and interest rebate); and to focus those credits,
which currently flow to households in all income brackets, on needier households. Additionally,
the Minister requested assistance in formulating a standard distributional analysis to apply to
proposed tax policy changes to gauge their effect on different types of households depending
on income level and other demographic characteristics.
In formulating its recommendations, the technical assistance (TA) mission team applied an
innovative analytical model for optimal income tax reform developed principally by James
Mirrlees and Emmanuel Saez. Since the model balances work incentives against revenue needs
and redistributional preferences, it aligns well with the concerns of the Icelandic government in
the current PIT reform. The model generally prescribes a U-shaped relationship between taxpayer
income and marginal tax rates: A universal grant ensuring a minimum level of welfare is
withdrawn rapidly as taxpayer income rises; the bulk of the population in the middle of the
income spectrum faces low marginal tax rates to encourage productivity; and at the top of the
income spectrum tax rates rise again to ensure progressivity.
Iceland’s current PIT schedule contrasts sharply with this model over most of the income
spectrum. Very low-income taxpayers sheltered by the basic credit face rates at or near zero.
Once the credit is exhausted, however, the PIT rate jumps immediately to almost 40 percent and
is often compounded by the slow withdrawal of refundable credits that extend into the top
income decile. The current top PIT rate, however, is coincidentally very close to the revenue-
maximizing top marginal income tax rate calculated based on Iceland’s income distribution and
standard estimates of taxable income elasticities. Optimizing Iceland’s PIT schedule thus chiefly
entails reform of the basic credit, the initial PIT rate,1 the child benefit and the interest rebate.
With regard to reforming the PIT schedule, the mission recommends that the basic credit
be increased and made fully refundable to all taxpayers age 18 and older. To avoid paying
this benefit to young singles, such as students, who generally have other means of support, it
could be conditioned on a certain level of labor earnings. This credit should be rapidly phased-
out as labor income rises, and the initial PIT rate should be significantly reduced. As noted, the
current top PIT rate does not need reform, although the threshold for that rate should ideally be
raised.
1 The baseline model used assumes passage of the current government PIT reform proposal, which would reduce
the number of PIT rates by eliminating the second PIT rate.

8
To finance these changes, the child benefit and interest rebate require stringent reform to
simplify their structures and focus their benefit on lower-income households. The current
terms of these programs, which are conditioned not only on income but also on family structure
(single or couple), age and number of children, and net wealth, are excessively complex.
Moreover, they create socially undesirable incentives for singles without children to form couples
and for couples with children to split up: For example, current PIT and benefit rules can create a
significant “marriage penalty” for couples with children. Given the authorities’ affirmation that the
purpose of the child benefit is to prevent child poverty rather than promote fertility, the mission
recommends the following reforms: A single fixed benefit amount should be given per child
under 18, regardless of the child’s age or family structure, up to a maximum of three children per
household. The phase-out rate of the benefit should be unified and sharply increased, and the
phase-out threshold should be unified and lowered.
Giving a deduction (or refundable credit) for mortgage interest without taxing imputed
rent favors homeowners over renters and promotes debt and overconsumption of
housing. The mission therefore recommends that the Icelandic government take advantage of
the approaching expiration of interest rebate parameters to undertake a gradual phasing out of
the benefit. As a first step, program parameters should be radically simplified, with a single
mortgage interest cap, interest rebate amount, and net wealth phase-out range; the net wealth
range should be lowered and the minimum income percentage spent on interest should be at
least doubled to match better typical household expenditure shares for housing. Given the
central government’s possible takeover of rental benefits from the local governments, the
authorities should incorporate reform of the interest rebate into a general review of housing-
related benefits and consider replacing expenditure-linked subsidies with general income
support for low-income households in high housing-cost areas.
When reforming the PIT, the central government may wish to review the current revenue
sharing arrangements with local governments, under which the central government
finances the cost of the basic credit. PIT revenue sharing should not be looked at in isolation,
but as an integral part of the overall allocation of revenues and expenditures between the levels
of government. A thorough treatment of this issue, which was addressed by an earlier FAD
mission, 2 is beyond the scope of this report.
Finally, Chapter VII presents a rubric for analyzing the distributional impact of tax policy
proposals by income decile as well as family structure. Using a microsimulation model built
on detailed taxpayer-level data, the impact of a reform on individual and household tax liabilities
is calculated. Households are ranked into income deciles, and the average impact of the reform
on each decile is measured; further, households are grouped by demographic characteristics—
2 R. Hughes, T. Irwin and E.R. Karlsdottir, “Strengthening the Local Government Fiscal Framework,” International
Monetary Fund, Washington DC, 2010.

9
singles and couples, with and without children—and the average impact for each group is
calculated. The resulting analysis shows that the current PIT system (including child benefit and
interest rebate) is progressive and taxes single parents much more lightly than other household
types. The current government reform proposal, which reduces revenues by roughly ISK 10
billion, benefits all income deciles (and particularly the seventh to ninth deciles), and singles
more than couples.
To illustrate the effects of a potential PIT reform along these lines, the mission modeled a
hypothetical PIT reform based on its recommendations and the results of the Mirrlees-Saez
model: The non-refundable credit is replaced by an ISK 1.2 million refundable credit granted to
taxpayers over 17 with at least ISK 600,000 of labor income and phased out at a 35 percent rate
against total income. The reform scenario also cuts the initial central government PIT rate to 12.5
percent and the top rate to 30.5 percent with a threshold of ISK 12 million. It also calls for a
child credit of ISK 400,000 phased out at a 12 percent rate beginning at ISK 1.8 million in income
(regardless of family structure), and eliminates the interest rebate. This reform would be roughly
revenue-neutral to the government’s proposed PIT reform for 2016.
Distributional analysis of the hypothetical IMF reform show that it would maintain the
same overall progressivity as the current system and the government reform proposal, as
measured by the Gini coefficient. However, relative to the government reform it would benefit
the first quintile, due to the refundable credit, as well as the top quintile, due to the tax rate
reductions and the increase in the top rate threshold. The three middle-income deciles would be
somewhat worse off, despite the sharp decline in the initial PIT rate, due to reductions of the
child benefit and elimination of the interest rebate. Single parents’ net income would be
significantly reduced under the IMF reform scenario, which levels the treatment of singles and
couples, while other household types would be unchanged or marginally better off.

10
I. INTRODUCTION AND OVERVIEW
1. At the request of Minister of Finance and Economic Affairs Bjarni Benediktsson, this
technical assistance report makes recommendations for reforming Iceland’s personal
income tax (PIT). The main goals of this reform outlined in the mission terms of reference are to
simplify the tax system, particularly regarding the rate structure and the calculation of the main
means-tested benefits—the child benefit (CB) and the interest rebate (IR)—as well as to improve
incentives for work and reduce incentives for tax evasion, without substantially increasing
progressivity.
2. The motive for this reform stems from the history of tax policy developments since
the 2008 financial crisis, which caused general government tax revenues to fall by more
than 8 percent of GDP from its 2006 peak to its 2009 trough (Figure 1). In the wake of the
crisis the new Social Democratic/Left-Green coalition government elected in early 2009 launched
a comprehensive review of the tax system with a view toward restoring lost revenue and
improving the progressivity of the overall system and promoting efficiency. In June 2009 the
government agreed a fiscal consolidation plan with the IMF aimed at strengthening income
redistribution, the social safety net, and public service provision. As part of this plan, the IMF
delivered two tax policy TA reports: a general diagnostic of the Icelandic tax system in 2010 and a
follow-up diagnostic focusing on natural resource and energy taxation in 2011.3
3. The tax reforms that emerged from the 2009-2011 review increased revenues from
almost all segments of the tax system.4 Among indirect taxes, the top value-added tax (VAT)
rate was raised from 24.5 percent to 25.5 percent, excises were increased, and new green taxes
were introduced on carbon fuels, electricity and geothermal water. Among direct taxes, two
higher tax brackets were introduced into the initially flat-rate PIT, while the local government (LG)
income tax rates were also raised; the capital income tax rate was raised from 10 percent to 20
percent; and the corporate income tax (CIT) rate from 15 to 20 percent. Social security charges
were raised from 5.85 percent to 8.65 percent. The government also increased inheritance tax
rates and reintroduced a net wealth tax. Additionally, new taxes were imposed on the banking
sector (bank levy, financial activities tax), and the fee system on fishing quotas was reformed.
4. The tax measures taken were highly successful in stemming Iceland’s revenue
losses. In all, the MOFEA estimates that the tax measures described above, implemented in the
3 J. Escolano, T. Matheson, C. Heady and G. Michielse, Improving the Equity and Revenue Productivity of the
Icelandic Tax System, International Monetary Fund, Washington D.C., June 2010; P. Daniel, R. de Mooij, T.
Matheson and G. Michielse, Advancing Tax Reform and Taxation of Natural Resources, International Monetary
Fund, Washington D.C., May 2011.
4 For a comprehensive review of these reforms, see Appendix A.

11
period 2008 to mid-2013, raised about 6 percent of GDP. General government tax revenue
recovered from a low of 29.2 percent of GDP in 2009 to 32.2 percent in 2013.
5. Higher revenues were, however, bought at the cost of increased complexity, as new
taxes were added and higher tax rates created demand for special exemptions. For example,
the increase in the capital income tax rate was accompanied by creation of an exemption for up
to ISK 100,000 in interest income and 30 percent of rental income. Administration and
enforcement of the net wealth tax was viewed as particularly complex, especially as it required
the annual valuation of private business equity. Behavioral responses to higher capital and
corporate taxation were in part contained by the capital constraints imposed during the crisis.
6. In 2013, a center-right coalition comprising the Progressive and Independent
parties was elected on a platform to improve the situation of households and strengthen
business and industry. Taxes played a major role in the government’s declaration, which
specifically states that “An assessment will be made of the tax system and changes to the system
in recent years, and proposals made for improvement with the aim of simplifying the tax system,
broadening tax bases and reducing income-linkage and tax evasion…During the electoral term
the social security charges will be reduced, the minimum municipal taxes abolished, and the
income tax system reviewed. Consumption taxes will be leveled and simplified and commodity
Figure 1. Level and Composition of General Government Tax
Revenues* (Percentage of GDP)
*Does not include social security charges.
0.0
5.0
10.0
15.0
20.0
25.0
30.0
35.0
40.0
2005 2006 2007 2008 2009 2010 2011 2012 2013 2014
Other Indirect Direct

12
taxes reviewed.”5 In addition to simplification, the goal of the tax reform would be to rebalance
the tax mix from direct to indirect taxes in the interest of reducing distortions, while maintaining
progressivity by better targeting of expenditure on lower-income households.
7. The government’s first major step in this direction was the 2014 VAT reform.6 The
IMF supported this reform with a third TA report,7 which recommended narrowing the wide gap
between the standard and reduced rates (25.5 and 7 percent, respectively) and ultimately moving
toward a single rate; eliminating generous exemptions for tourism, transport, and recreation; and
largely abolishing the commodity tax.8 The reform enacted later that year followed these
recommendations, reducing the top rate to 24 percent and raising the bottom rate to 11 percent
and abolishing the commodity tax. To compensate for higher tax rates on staples, means-tested
child benefits were increased. Lowering the top VAT rate and repealing the commodity tax also
created downward pressure on inflation, important to households with indexed mortgages.
8. The PIT reform that is the subject of this report represents the second major step in
the government’s tax policy agenda. Iceland’s current PIT structure is characterized by a high
initial tax rate of 37.3 percent9 and a non-refundable basic tax credit of ISK 610,824, which
shelters income of about ISK 1.6 million (about US$12,000) per year. There are two additional tax
rates of 39.7 percent and 46.2 percent, which apply to income above ISK 3.7 million and
ISK 10 million, respectively.10 Although the basic unit of PIT assessment is the individual,
registered couples may share any unused portion of their basic credit with their partner, and a
fraction of any remaining credit may be offset against capital income. Couples may also share up
to one half of any unused portion of their second-rate tax bracket with their partner.
The government has already taken initial steps toward PIT reform. In 2014, it reduced the
first and second rates slightly (by 0.04 percent and 0.5 percent, respectively) and increased the
threshold between them, and increased the child benefit phase-out rates by one percentage
5 http://www.government.is/government/coalition-platform/
6 For a detailed description of all the current government’s tax reforms to date, see Appendix A. In addition to the
VAT and PIT reforms mentioned here, the current Government also allowed the net wealth tax and electricity tax
to expire, and reduced and simplified stamp duties.
7 Modernizing the Icelandic VAT; FAD Report, May 2014, page 6 paragraph 2.
8 The commodity tax was a set of excises on selected goods, mainly imports of consumer durables and building
products but also sugar and artificial sweeteners.
9 This comprises the average local government rate of 14.44 percent and the central government rate of 22.86
percent.
10 Appendix B presents a detailed description of the PIT and the Government’s proposed reform, as well as the
major means-tested benefits, child benefit and the interest rebate.

13
point. The second wave of reform, which the government introduced during the course of this
mission, lowers the first rate another 0.36 percent and eliminates the second rate altogether,
leaving the top rate unchanged at 31.8 percent. This report assumes that the government’s
current PIT reform proposals, which generally accord with the direction of reform recommended
in this report, will pass into law, and it therefore incorporates them into the baseline policy
regime. The report also assumes that eliminating the second tax rate will also eliminate bracket
sharing.
9. In comparison with the income tax schedules of other Nordic countries, Iceland’s
PIT exhibits moderate progressivity (Figure 2). The basic credit is more generous than any
other country’s except Norway, and the initial tax rate is the highest in the region. The overall PIT
schedule is relatively flat, with rates increasing less than 10 percentage points over the entire
income spectrum. Consequently, the progressivity of Iceland’s PIT, as measured by the ratio of
PIT liability to labor income (the average tax rate or ATR), is limited, with most of the
progressivity deriving from the basic credit (Figure 3).11
11 Social security charges are not included. However, in Denmark social security is funded from the PIT; in this
respect, the Danish PIT schedule is not strictly comparable with those of the other countries.
Figure 2. Marginal Statutory Tax Rates in Nordic Countries (2014)
Source: OECD tax database

14
10. Iceland’s two major means-tested household income support programs, the child
benefit and the interest rebate, are highly complex.12 Benefit levels and withdrawal rates for
CB depend not only on income and the number of children but also on marital status and
children’s ages. Benefit levels for IR depends not only on mortgage interest and income but also
on marital and parental status and net wealth. Relatively high phase-out thresholds and low
withdrawal rates extend both benefits well up the income scale. This not only raises costs and
undermines progressivity, but also raises the marginal tax rate for middle-income families, where
the already high PIT rate is compounded by withdrawal rates for child benefit and/or the interest
rebate. Moreover, the dependence of benefit levels on marital status (or rather, couple status,
since couples sharing a household need not be officially married for tax purposes), can create
perverse incentives for household formation or dissolution. Radical simplification and refocusing
of these schemes on low-income households will be recommended (Chapters III and IV).
12 Another significant means-tested benefit, rental benefits, are currently run by local governments are likely to
be assumed by the central government. The mission had insufficient data on the distribution of these benefits to
include them in the optimal PIT analysis.
Figure 3. Average Statutory Tax Rates in Nordic Countries (2014)
Source: OECD tax database

15
11. To address the government’s concern regarding the work incentives created by
taxes on labor income, this report applies the framework for optimal income tax analysis
initially developed by James Mirrlees.13 Broadly, Mirrlees’ analysis suggests that the marginal
income tax rate schedule should follow a U-shaped path: An unconditional grant is provided to
all households for income support purposes. To focus this grant on needy households, it is
withdrawn at high rates as income increases. This high marginal rate at the bottom of the income
distribution is then succeeded by lower rates on middle-income households to avoid deterring
labor effort among the bulk of the population. Finally, as population thins toward the top of the
income scale, tax rates rise again to ensure progressivity and maximize revenue.
12. By contrast, Iceland’s current PIT exhibits a much different rate pattern: A relatively
generous basic credit provides for very low marginal tax rates on low-income households, but tax
rates jump in the middle of the income distribution when the basic credit is exhausted and the
high initial and second PIT rates apply; these high rates on middle-income families are
compounded by the very gradual withdrawal of refundable credits (CB and IR), which carry into
the top tax bracket that applies to individuals in the top income decile. To improve overall work
incentives, the Mirrlees model will be calibrated to fit Iceland’s income distribution and derive an
optimal MTR schedule (Chapter II).
13. Optimal reform of the PIT is likely to alter the allocation of revenues between the
central and local governments, so the current revenue-sharing formula should be reviewed
as part of the reform process. The current structure calls for the central government to absorb
the entire cost of the basic credit, even though from the taxpayer’s point of view the credit is
used against both central and local government PIT. The implications of this regime should be
considered in the context of Iceland’s overall federal revenue and expenditure sharing regime, a
full analysis of which is beyond the scope of this report. However, some basic considerations for
evaluation of the regime are given in Chapter V.
14. Finally, the government wishes to establish a regular framework for distributional
analysis of proposed tax policy measures. Lack of such analysis in the initial legislative
proposal complicated the recent VAT reform. Chapter VI of the report will therefore present such
an analysis, evaluating proposed policy changes in terms of their impact on households not only
at different levels of the income scale, but also with different demographic characteristics.
13 Mirrlees, J. A. (1971). “An Exploration in the Theory of Optimum Income Taxation,” The Review of Economic
Studies, 38, 175–208.

16
II. OPTIMAL PIT REFORM
A. Overview of the Mirrlees-Saez Model
16. The aim of optimal tax theory is to determine the most efficient way to collect a
given amount of revenue, taking into account the fact that taxes distort behavior. A central
finding of this literature has been that lump sum taxes constitute the most efficient and least
distortive policy instrument. This is because a lump sum tax does not involve any change in the
marginal return to work, leaving individuals to benefit fully from the additional return to work
effort. For obvious reasons, equity concerns make lump-sum taxes impractical because they
would require all taxpayers to remit the same amount of tax regardless of their ability to pay,
which most societies view as unfair and politically unacceptable. In response, economists have in
recent decades developed more realistic frameworks for analyzing optimal income tax policy.
17. The basic insight of the theoretical literature is that optimal taxes trade off equity
and efficiency concerns. Equity concerns are incorporated in optimal taxation models based on
the assumption that the government values individuals’ welfare, but the weight it places on each
individual generally decreases with that person’s income. Therefore, society prefers (at the
margin) to use the tax and benefit system to redistribute resources to those with less pre-tax
income. This ensures that the tax system incorporates some elements of progressivity. Efficiency
concerns are typically modeled as the response of labor supply—and hence employment
income—to changes in marginal tax rates. The extent of this response is typically expressed as
the elasticity of taxable income: the percentage change in taxable income due to a one percent
increase in the net-of-tax rate (that is, one minus the tax rate). This parameter captures the
simple intuition that increasing marginal tax rates will generally lead people to work less and/or
seek tax-favored forms of remuneration.14
18. The optimal structure for the PIT usually involves marginal tax rates that follow a
U-shaped pattern. This basic structure includes the following main features: 1) a lump-sum
grant that guarantees a minimum income level for all taxpayers; 2) high marginal tax rates at the
bottom of the income distribution that limit the benefit of the grant to low-income individuals; 3)
low marginal tax rates for middle income earners; and 4) increasing marginal tax rates as income
levels increase above middle income.
19. These basic features of the optimal PIT structure have an intuitive rationale. First,
the universal lump-sum grant, which can take the form of a refundable tax credit or welfare
benefits provided outside of the PIT system, ensures that all taxpayers enjoy a minimum standard
14 For example, if certain fringe benefits are not recognized as taxable income, an increase in income tax rates is
likely to cause substitution of these benefits for taxable wages. An overview of the literature and a detailed
presentation of the main results can be found in Piketty, T., & Saez, E. (2013). “Optimal Labor Income
Taxation,” Handbook of Public Economics. Vol. 5, 391-474.

17
of living. The high marginal tax rates at the bottom of the income distribution are perhaps a
surprising feature of such a system, but they ensure that only the neediest individuals benefit
from the guaranteed amount targeted to the lowest earners. A high phase-out rate for the
universal grant can coexist with progressive statutory PIT rates by relying on a separate phase-
out rate for the personal tax credit or on means-tested benefits, the combination of which sums
to higher effective marginal tax rates on low to middle income earners. Low marginal tax rates
for middle income earners ensure that distortions are minimized for the bulk of the taxpaying
population. Since income distributions are usually bell-shaped, middle income earners constitute
by far the largest share of the taxpaying population. Efficiency considerations will therefore favor
low marginal rates for the majority of workers. Finally, the last main feature of the optimal
structure is the progressivity of marginal rates after the modal income. Increasing marginal rates
for top incomes ensure that individuals with the highest earnings potential will contribute
relatively more to revenue collection.
20. Although optimal tax models recognize income heterogeneity among taxpayers,
they generally do not take into account other characteristics that affect welfare. For
example, they usually do not incorporate family structure, number of dependents, or disability
status. The welfare of adult students with little or no labor income who may benefit from student
loans or parental support is also not well measured in these models. The general framework
described above also considers individuals in a one period static model. This precludes the study
of lifecycle considerations in labor supply and other behavior such as savings and investment in
education for example. This also implies that the model is most applicable to the taxation of
labor income as opposed to capital income, where savings and intertemporal substitution of
consumption introduce additional elements of complexity. The current dual income tax system in
Iceland, with its flat rate on capital income, is therefore consistent with the recommendations
that will be derived from this modeling exercise.
21. A technical description of the Mirrlees-Saez optimal income tax model is given in
Box 1. This model has been calibrated to reflect the Icelandic income distribution to derive an
optimal income tax schedule for Iceland, described in the following section.

18
Box 1. The Mirrlees-Saez Optimal Income Tax Model
Building on the seminal Mirrlees model, Saez (2001)1 shows that the optimal PIT schedule of marginal tax
rates can be expressed as a simple function of a small number of parameters. The optimal marginal tax rate
at any income level z is given by:
T′(z) =1 − G(z)
1 − G(z) + α(z) ∙ ε (1)
where G(z) is the average social marginal welfare weight for individuals with income above z. Specifically, it
provides a measure (in króna) of the value to society of increasing the consumption of individuals with
income greater than z by one króna. When society values redistribution, the term is decreasing in z,
meaning that the government values less small changes in consumption of richer individuals. According to
the formula, optimal marginal tax rates are decreasing in G(z), since a higher weight would mean society
values more marginal changes in consumption, which in turn leads to lower tax rates. The term α(z)
describes the shape of the income distribution at and above income level z. Finally, the term ε is the
elasticity of taxable income, which describes the sensitivity of the tax base to changes in marginal tax rates.
Equation (1) therefore is consistent with the traditional inverse-elasticity rule, which states that the more a
given tax base falls in response to higher tax rates, the less it should be taxed.
An important special case of the general optimal PIT result concerns the revenue-maximizing rate for top
income earners. The revenue-maximizing rate is given by the following expression:
τ∗ =1
1 + a ∙ ε (2)
This equation simplifies the general Mirrlees result by assuming that the government does not place any
value on marginal changes in the consumption of top earning individuals (G(z) = 0). The formula also uses
the fact that the distribution of top incomes in many countries is very well approximated by the Pareto
distribution. This theoretical distribution displays the useful property of having a constant term, α(z), known
as the Pareto parameter, above a sufficiently high income threshold. If a variable is Pareto distributed, the
average value above a threshold z̅ is equal to z̅ ∙ a/(a − 1) for any value of z̅. Estimating the Pareto
parameter using information on top incomes, and using standard estimates of the elasticity of taxable
income, ε, the revenue-maximizing top marginal tax rate can be easily estimated.
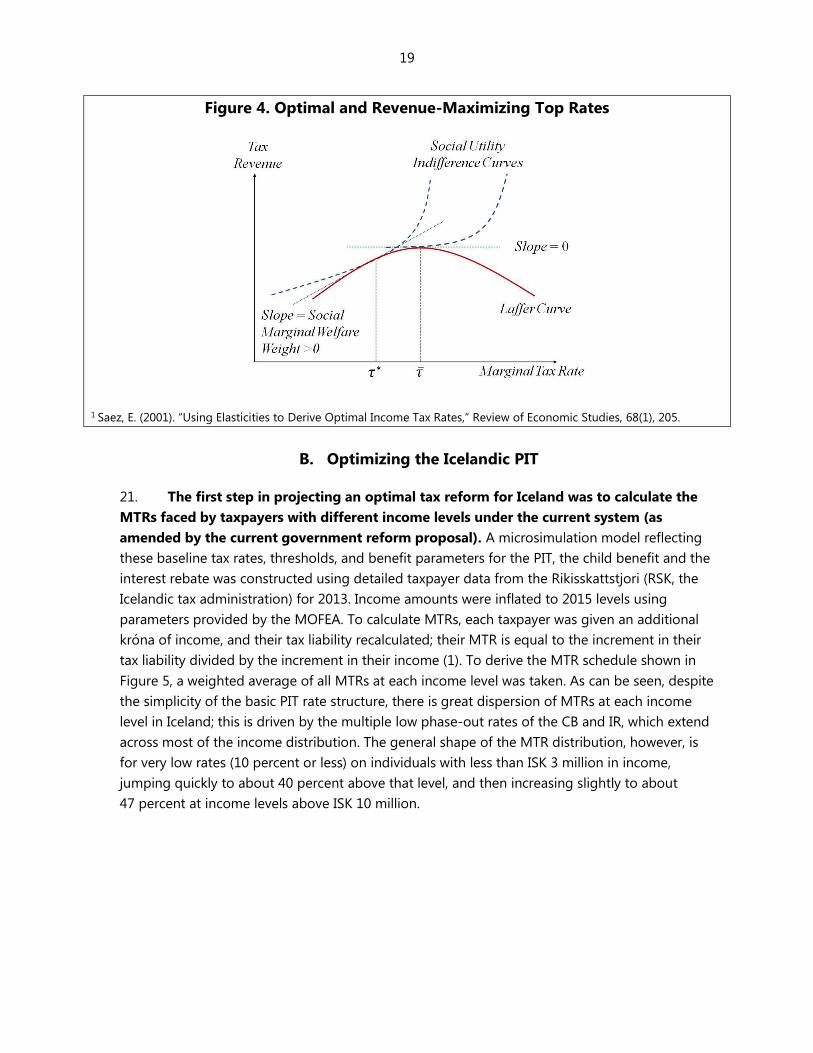
The revenue-maximizing top income tax rate is an important component of the well-known Laffer curve,
which represents the tax revenue that can be collected by increasing the tax rate. In Figure 4, the red curve
is increasing at the bottom as raising rates lead to more revenue. However, as the government reaches the
top of the curve, the negative response of the tax base begins to outweigh the mechanical increase in
revenue from raising the rate. Beyond the top of the curve, any further increase in the marginal rate actually
leads to lower total revenues. The social indifference curves illustrate the implicit rule used by the
government to determine the top rate given the constraint imposed by the Laffer curve. The slope of the
curves represents the social marginal welfare weights described earlier. The figure makes clear that it is only
when society places no value on marginal changes in the welfare of the top income will it set a top rate
equal to the revenue-maximizing rate τ̅. Placing any positive value on the welfare of high-income taxpayers
will necessarily lead to lower tax rates to the left of the curve, such as τ∗.
19
Figure 4. Optimal and Revenue-Maximizing Top Rates
1 Saez, E. (2001). “Using Elasticities to Derive Optimal Income Tax Rates,” Review of Economic Studies, 68(1), 205.
B. Optimizing the Icelandic PIT
21. The first step in projecting an optimal tax reform for Iceland was to calculate the
MTRs faced by taxpayers with different income levels under the current system (as
amended by the current government reform proposal). A microsimulation model reflecting
these baseline tax rates, thresholds, and benefit parameters for the PIT, the child benefit and the
interest rebate was constructed using detailed taxpayer data from the Rikisskattstjori (RSK, the
Icelandic tax administration) for 2013. Income amounts were inflated to 2015 levels using
parameters provided by the MOFEA. To calculate MTRs, each taxpayer was given an additional
króna of income, and their tax liability recalculated; their MTR is equal to the increment in their
tax liability divided by the increment in their income (1). To derive the MTR schedule shown in
Figure 5, a weighted average of all MTRs at each income level was taken. As can be seen, despite
the simplicity of the basic PIT rate structure, there is great dispersion of MTRs at each income
level in Iceland; this is driven by the multiple low phase-out rates of the CB and IR, which extend
across most of the income distribution. The general shape of the MTR distribution, however, is
for very low rates (10 percent or less) on individuals with less than ISK 3 million in income,
jumping quickly to about 40 percent above that level, and then increasing slightly to about
47 percent at income levels above ISK 10 million.

20
22. It is important to note that, though the current MTR schedule displays very low
MTRs at the bottom, actual MTRs are likely to be higher to the extent that there exist
means-tested benefits not captured by the microsimulation model. For example, low-income
households may benefit from rental benefits or “Pillar 1” pensions, both of which programs are
means-tested. Unfortunately, the mission had insufficient information on these programs to
include them in the microsimulation model.
23. The next step was to evaluate the distribution of top incomes in Iceland in order to
calculate the optimal top income tax rate. The distribution of top incomes in Iceland is well
approximated by a Pareto distribution with a Pareto coefficient of 2.7. For the purpose of this
estimation, we define income as the sum of labor and capital income. Panel A in Figure 6 below
displays the actual density of the top 10 percent of incomes in 2015, along with the predicted
density generated by a Pareto distribution with a coefficient of 2.7; as can be seen, the
theoretical and actual distributions match closely. Panel B plots actual versus predicted incomes
based on the same Pareto assumption. Once again, it shows that the Pareto assumption is
appropriate for representing the distribution of top incomes in Iceland.
Figure 5. Baseline Marginal Tax Rates

21
24. The distribution of top incomes in Iceland is relatively thin compared to those of
many developed countries, as reflected in its relatively high Pareto coefficient (Table 1,
column 1). Since the Pareto coefficient measures the thinness of the top of the income
distribution, Iceland’s high value indicates that it has fewer very high-income people than the
comparator countries. As described in Equation (1) above, the optimal top income tax rate
depends negatively on the thinness of the top tail distribution. If the distribution is thin, then
raising the top rate for high income earners will raise little additional revenue, since few
taxpayers would pay the highest marginal rate. This means that Iceland’s revenue-maximizing
top income tax rate (columns 3-5) will be lower than that of the UK or the US, which have much
lower Pareto coefficients.
25. Using our estimated Pareto coefficient along with a standard elasticity of taxable
income of 0.3, we calculate a revenue-maximizing top marginal tax rate of 55 percent for
Iceland (Table 1, column 4). 15 Remarkably, this is exactly equal to the current top effective
marginal tax rate in 2015 (column 2), indicating that the current top rate is located at the top of
Iceland’s Laffer curve. Our measure of the top effective marginal tax rate incorporated other
taxes on income in addition to the PIT: Specifically, it includes a weighted average of the top
statutory PIT rates of 31.8 percent for the central government and 14.44 percent for the local
government and a flat 36 percent rate on capital income;16 mandatory pension contribution rates
15 See Saez, E., Slemrod, J., & Giertz, S. H. (2012). “The elasticity of taxable income with respect to marginal tax
rates: A critical review,” Journal of Economic Literature, 3-50 for a recent review of the empirical literature.
16 This is the total effective tax rate from the compounded capital income tax (20 percent) and CIT (20 percent):
20*(1 – 0.2) + 20 = 36. This is also the tax rate on partnership income.
Figure 6. Top 10 Percent of the Income Distribution and the Pareto
Assumption
(A) Estimated and Actual Densities (B) Predicted and Actual Total Income
0.1
.2.3
De
nsi
ty
10 20 30 40
Total income (millions of króna)
Pareto Actual
1030
5070
Pre
dict
ed
10 30 50 70
Total income (millions of króna)
Pareto Actual

22
for both employers and employees; the social security tax of 7.49 percent; and an effective
consumption tax rate of 15.4 percent, which was roughly the ratio of taxes on goods and services
to GDP in 2013. The fact that the current top rate is equal to the estimated revenue-maximizing
rate has the important implication that any further increase in the top PIT rate in Iceland might
actually lead to lower revenues being collected from taxpayers with incomes in the top 10
percentile.
26. Sensitivity analysis of the model using different parameters was also conducted.
Using a lower elasticity of taxable income leads to more fiscal space, with a revenue-maximizing
rate of 71 percent (column 3); however, if the elasticity of top incomes is higher than 0.3, then
the current top effective marginal rate would be on the wrong side of the Laffer curve and
reducing the rate would increase revenue (column 5).
27. We use the Mirrlees model to derive the optimal schedule of marginal tax rates on
labor income (Figure 7). We start by investigating the term α(𝑧):
α(𝑧) = 𝑧 ∗ 𝑓(𝑧)/(1 − 𝐹(𝑧))
which equals the product of the income level, 𝑧, times the ratio of the probability density
function of the income level, f(𝑧), over one minus the cumulative distribution function of the
income level, 𝐹(𝑧), evaluated at 𝑧 throughout the income distribution. The term α(𝑧) thus
reflects the ratio of the total income of those affected by the marginal tax rate at 𝑧 relative to the
total income of taxpayers at higher income levels. According to the Mirrlees formula, the higher
the value of α(𝑧) (see Box 1), the lower the marginal tax rate should be, everything else equal. For
Iceland, the value of α(𝑧) is highest at around ISK 13 million, which is around the 95th percentile
of the gross labor income distribution (that is, income inclusive of employer and employee social
Table 1. Revenue-Maximizing Marginal Effective Top Rates – Selected Countries
Pareto Effective Top Revenue-Maximizing Top Rate
Coefficient
(1)
Marginal Rate
(2)
𝜀 = 0.15
(3)
𝜀 = 0.30
(4)
𝜀 = 0.45
(5)
Iceland 2.7 0.55 0.71 0.55 0.45
Denmark 2.2 0.64 0.75 0.61 0.51
France 2.2 0.65 0.75 0.60 0.50
Germany 1.7 0.51 0.80 0.67 0.57
Ireland 2.0 0.62 0.77 0.63 0.53
Norway 2.0 0.61 0.77 0.62 0.52
Sweden 1.9 0.73 0.78 0.64 0.54
Switzerland 1.7 0.40 0.79 0.66 0.56
United Kingdom 1.8 0.54 0.79 0.65 0.55
United States 1.6 0.45 0.81 0.68 0.58
Source: The World Top Incomes Database, OECD and IMF Staff.

23
security contributions and social security taxes). Figure 7 clearly shows the stability of the Pareto
coefficient once a sufficiently high income threshold is reached.
28. Using the Pareto estimates shown in Figure 7 and a taxable income elasticity of 0.3,
we calculate the optimal schedule of marginal tax rates for Iceland (Figure 8). To do this, we
also use a standard social welfare function with a constant inequality aversion factor of 1 to derive
the social marginal welfare weights used in the Mirrlees formula.17 Choice of this specific
parameter implies that, for example, the government values an additional kroná given to an
individual earning ISK 10 million ten times less than an additional kroná given to an individual
earning ISK 1 million.
29. The optimal MTR schedule shown in Figure 8 is markedly different from the actual
MTR schedule.18 While the actual MTR schedule rises monotonically from zero rates at the
bottom, the optimal schedule displays a high initial rate of almost 70 percent that first falls
sharply to bottom out at less than 30 percent by around ISK 7 million of income and then rises
again gradually toward the current top MTR. Thus, the optimal MTR schedule follows the U-
shaped structure found in previous Mirrlees-Saez models. Marginal rates are lower under the
optimal schedule beginning at around ISK 5 million of income and remain so for higher income
17 Specifically, we use a constant relative risk aversion social welfare function of the form 𝑊(𝑢𝑖) = ln (𝑢𝑖), where 𝑢𝑖
reflects the utility level of individual 𝑖.
18 Calculation nets out social security contributions and indirect taxes for both actual and optimal MTRs.
Figure 7. Empirical Pareto distribution of Gross Labor Income
Source: RSK data and IMF staff calculations. 2013 labor income inflated to 2015 levels using
factors provided by MOFEA staff.
01
23
Em
piric
al P
are
to C
oe
ffic
ien
t
0 20 40 60 80 100
Gross labor income (millions of króna)

24
levels. It is notable that the actual MTR jumps up at ISK 8.4 million—the top PIT rate threshold
under the government’s reform plan—while the optimal MTR schedule is close to its minimum at
this point.
30. The optimal model prescribes a guaranteed annual income level of around ISK 1.4
million. This is illustrated in Figure 9 by the intercept of the red line, showing after-tax income
under the optimal PIT, with the vertical axis. This lump sum amount could take the form of a
refundable tax credit to ensure that low-income individuals receive some net transfers from the
tax system. For individuals with no gross labor income, the refundable credit provides an after-
tax net income of 1.4 million, which is taxed away at a high rate as income rises, so that taxpayers
with more than roughly ISK 2.5 million of gross labor income would pay positive net taxes. The
optimal regime imposes slightly higher average tax rates for taxpayers earning ISK 3-6 million, as
the red line dips below the dashed line representing the baseline regime. At income levels above
ISK 6 million, the lower marginal tax rates of the optimal regime lead to lower average tax rates.
31. Again, a sensitivity analysis was conducted for the baseline model by varying the
elasticity of taxable income. Figure 10 compares the optimal MTR schedule for elasticities of
0.3 and 0.45. Unsurprisingly, a higher elasticity leads to lower marginal tax rates at all levels of
income, and the schedules diverge slightly as incomes increase. The higher elasticity model also
generates a lower guaranteed lump sum amount of ISK 1.25 million.
Figure 8. Current and Optimal Marginal Tax Schedules
020
40
60
80
100
Marg
inal Tax
Rate
(P
erc
en
t)
0 5 10 15 20 25Gross Labor Income (Millions of Króna)
Current PIT Optimal PIT

25
32. One important limitation of the Mirrlees model analyzed here is that it does not
incorporate an extensive margin—that is, it assumes that all taxpayers participate in the
Figure 9. Gross and Net Income under Baseline and Optimal PITs
05
10
Aft
er-
tax in
co
me
0 5 10
Gross labor income (millions of króna)
Current PIT Optimal PIT
Figure 10. Optimal Marginal Tax Rate Schedule with Different
Elasticities
020
40
60
80
100
Marg
inal Tax
Rate
(P
erc
en
t)
0 5 10 15 20 25Gross Labor Income (Millions of Króna)
Current PIT IMF Reform Optimal PIT

26
labor market. Thus, taxpayers’ only response to taxes in the model is to alter their work
intensity—the number of hours they work—but they do not drop out of the labor force.
However, a comprehensive analysis of labor supply response should in principle allow for the
possibility that some individuals will drop out (or enter) of the labor force when the net return to
work is too low (or attractive enough). It is therefore important to ensure that the tax system
does not discourage labor force participation.
33. Extensions of the basic Mirrlees model that reflect the extensive margin show that,
where workers have the option of dropping out, there should be lower—and possibly even
negative—MTRs at the bottom of the income scale.19 There are various ways of introducing
this initially low MTR; one way would be to condition the lump-sum grant on work hours or
earnings. An example of this is the US earned income tax credit, which displays phase-in rates at
low levels of earnings. The fundamental adjustment to the optimal schedule we just described,
however, is to ensure some of the redistribution is channeled to the working poor as opposed to
individuals who do not work.
Recommendations
Reduce marginal tax rates on middle income earners from an average of 40 percent to
about 25 percent.
Introduce a refundable credit, with the possibility of making it conditional on work
subject to some minimum hours or earnings test.
Have a high phase-out rate of the refundable credit to ensure that only low-income
individuals benefit from the transfer.
Maintain the top rate at its current level, but consider raising the top rate threshold to at
least ISK 12 million.
19 See for example Saez, E. (2002). “Optimal Income Transfer Programs: Intensive versus Extensive Labor Supply
Responses,” The Quarterly journal of economics,117(3), 1039-1073 and Jacquet, L., Lehmann, E., & Van der Linden,
B. (2013). “Optimal redistributive taxation with both extensive and intensive responses,” Journal of Economic
Theory, 148(5), 1770-1805.
27
III. CHILD BENEFIT AND HOUSEHOLD STRUCTURE
A. Child Benefit
Issue
34. The child benefit is a fully refundable credit calculated at the household level that
covers all children under the age of 18. The structure of the CB is complex, with the benefit
amount, phase-out threshold and phase-out rate all varying among households depending on
different parameters (Table 2). The benefit amount varies depending on filing status (i.e., single
parent or couple) and the number of children in the household. In addition, there is a
supplemental benefit (SB) for each child under age seven, which does not vary by filing status or
number of children. Both the CB and the SB are means tested based on total household income
(including both labor and capital income), and the threshold for means testing is ISK 2,400,000
for single parents, and ISK 4,800,000 for couples. The phase-out rate used to reduce the benefits
as income rises above the threshold level varies depending on number of children for the CB.
The SB is phased out at a rate of 4 percent, which does not vary with the number of children.
Finally, there is a minimum benefit amount per parent of ISK 5,000, below which no benefit is
paid, to reduce administrative costs.
Analysis
35. The CB appears not only too complex but also poorly focused, such that it is not
clear what social policy objectives it is attempting to achieve. Typical goals of child benefits
are to promote fertility—a policy often espoused by European societies with low birth rates, but
probably not necessary in Iceland given its high fertility rate—or to prevent childhood poverty.
The current CB system has elements suggestive of both objectives: Higher benefits are given for
children beyond the first child, with no cap on the total number of children who can benefit,
suggesting that the CB is geared toward stimulating fertility. However, means testing of the CB
suggests that it is geared toward preventing child poverty, even though the phase-out
thresholds are fairly generous and the phase-out rates very low.
36. The Icelandic authorities affirm that the intended purpose of CB is to prevent child
poverty. Thus, a number of its provisions should be amended to focus it on that goal. The
modest phase-out rates on the benefit result in the CB being distributed well into the middle
class, rather than being concentrated on low-income families to protect against poverty.
Providing smaller benefit amounts for a first child than for all subsequent children counters the
standard economic analysis that the cost of rearing two children is less than twice the cost of

28
rearing one child.20 If there is a difference between benefits per child, it would make more sense
for the amount to decrease with each subsequent child. In addition, the current differences are
not consistent between single and married parents, and in the case of single parents are so small
as to be almost meaningless. Furthermore, providing an SB for children under seven when
Iceland also provides extensive subsidies for child care, especially for single parents, seems
redundant for care of pre-school age children, and potentially not necessary for six year olds who
(generally) are already in school. Finally, the lack of a benefit cap (or a decline with each
additional child) means that the government subsidy may also be extended to quite large
families. While providing a benefit which varies with number of children reflects the greater
needs of parents with more children, at some point having additional children might be
considered a parental choice that other taxpayers should not have to subsidize.
37. In practice, the CB provides much of the reduced average tax rates observed at low
incomes, but it provides that tax relief only for taxpayers with children. Achieving the
correct distribution of effective tax rates should be achieved through the basic tax credit and
rates schedules, as discussed in Chapter II. Changes to the CB to simplify it, reduce the “marriage
penalty” (see following section), and conform to an anti-poverty policy goal will result in many
current beneficiaries of this complex system facing a tax increase.
20 The household equivalent calculations explained in Chapter VII, for instance, are based on the square-root of
household size, reflecting that household expenses grows more slowly than household size.
Table 2. Child Benefit Parameters
(in ISK/Year or Percent) Single Parents Couples
Child Benefit Amount – First Child Only 323,253 194,081
Child Benefit Amount – Other Children 331,593 231,019
Supplemental Benefit - Children under age 7 115,825 115,825
Threshold for Phase-Out (based on total income) 2,400,000 4,800,000
Basic Phase-Out Rate – One Child 4% 4%
Basic Phase-Out Rate – Two Children 6% 6%
Basic Phase-Out Rate – Three or More Children 8% 8%
Supplemental Phase-Out Rate (all children) 4% 4%
Minimum Child Benefit – Per Parent 5,000 5,000

29
Recommendations
Simplify the child benefit:
Give a single fixed benefit per child, regardless of age or parental marital status.
Phase out the benefit at a single rate regardless of number or age of children.
Focus the benefit on low-income families:
Lower the phase-out thresholds.
Increase the phase-out rate.
Limit the benefit to three children per household.
B. Individuals vs. Households
Issues
38. Under both current law and the MOFEA PIT reform proposal, the Icelandic PIT
imposes tax separately on each individual (not household). However, key components of the
tax system, notably the child benefit and the interest rebate (Chapter IV), are based on
household calculations. Because of the size of these benefits, the Icelandic Personal Income Tax
is effectively a hybrid individual/household tax system. This section examines how household
structure affects the income tax calculations, particularly with respect to the CB.
39. Two features of the PIT, the basic tax credit and bracket sharing, are indirectly
affected by household structure. The basic tax credit (ISK 610,824) is received by each taxpayer,
regardless of household structure (filing status). The credit is not refundable, but it can be shared
between two taxpayers who file as a couple. If both taxpayers have enough income to fully
absorb his or her credit, then the total effective credit (for both taxpayers) is unaffected by filing
status. But if one partner has more income than can be offset by the credit while the other has
less income than the credit can offset, the unused portion of the latter’s credit can be used by
the former, effectively increasing the total credit used.
40. Current law also includes bracket sharing for couples. If one partner has income in
the highest tax bracket (over ISK 10,036,848) while the other’s income falls below the top bracket,
one-half of the latter’s unused second bracket amount can be transferred to the high-income
partner, up to a limit equal to half the second bracket (ISK 3,163,584). This transfer is then taxed
at a rate lower than the top tax rate. Bracket sharing is not (of course) available to single
taxpayers.

30
Analysis
41. A key characteristic of any personal income tax system is whether taxes are
calculated by household or by individual. If the tax rate varies by income, either directly or
indirectly through phase-out of tax benefits, the consequences of the choice (i.e., to determine
income and tax by individual or by household) can be significant. Either choice has
consequences, some good, some bad, depending on the norms against which those
consequences are valued.
42. Under a tax system with a progressive rate structure, the key trade-off between
individual-based taxation and household-based taxation is how to treat a low-income
“married”21 taxpayer whose partner has similar or higher income.22 Under individual-based
taxation, the earnings of the low-income earner are taxed at a low rate, but under household-
based taxation those earning would be taxed at a higher rate based on the household’s
combined income. Individual-based taxation ensures that two individuals in the workplace
getting the same wage face the same tax rates (all else being equal). Household-based taxation
ensures that two households with the same combined income face the same taxes (all else being
equal). Neither option is inherently better than the other; some situations may be more equitably
handled with individual taxation while other situations would be more equitably based on
household taxation. A common situation where household taxation causes a problem is when a
parent (typically the mother) re-enters the labor force after caring for children. Individual-based
taxation treats the reentrant equally with other taxpayers earning the same wage, taxing her first
income at zero or low rates and only applying high rates if she earns substantial income.
Household-based taxation, however, taxes her first income at her spouse’s relatively high
marginal tax rate. Thus household-based taxation can be a significant barrier to parents returning
to work.
43. Consequently, progressive household-based taxation often creates a “marriage
penalty”. The marriage penalty is the difference between the combined taxes paid by two
people when filing as a couple compared to the taxes they would pay when filing as two single
taxpayers (all else being equal). In Iceland, the tax table and the basic credit are applied to
individuals, not households, so they do not create a marriage penalty as seen in many other
countries.
44. However, the CB creates a significant marriage penalty for couples with children. By
design, the CB provides greater assistance to single parents than married parents (though this is
21 Under Iceland law, couples are treated as households regardless of legal marital status, but for simplicity the
text uses the term “married” to refer to one person of a couple.
22 For simplicity, this discussion assumes each household has two adults and zero or more children, and that all
the earnings are earned by the adults. The same logic applies to earnings by teenagers. For tax systems which
apply tax to the household, an important design consideration is at what point do children become independent
taxpayers who are no longer (for tax purposes) part of their parents’ household.

31
offset somewhat by the higher phase-out threshold for couples). This may be appropriate social
policy, but the fact that the CB is dependent on both filing status (single or couple) and
household income creates a marriage penalty, which can be substantial, especially for low-
income parents. Table 3 illustrates the taxes on two adults who together have four children (two
of them under age seven). If they are taxed separately as individuals, their combined net tax is
ISK 932,000; but if they are taxed as a couple, they lose a substantial portion of their combined
CB, so that their total net tax increases. If they move from filing as singles to filing as a couple,
their CB falls from ISK 1,505,000 to 777,000 for a marriage penalty of ISK 728,000—a 78 percent
increase in their combined taxes.
45. The Iceland income tax also generates a “marriage credit” in two situations. The first
comes from the basic credit, which, as noted above, can be shared between two taxpayers who
file as a couple. As a result, there are common situations where two individuals would pay less
taxes filing as a couple as they would pay (combined) filing as two single taxpayers. This happens
when one of the taxpayers has higher income and the second taxpayer has little or no income, so
that he/she does not need the entire basic credit to reduce his/her tax (before credits) to zero.
Table 4 provides an example of a couple who are in this situation. In this case, the marriage credit
is worth ISK 163,000, or 22 percent of their combined taxes when filing separately.
Table 3. The “Marriage Penalty”
As Couple Income Children
Gross
Tax
Basic
Credit
Child
Benefit Net
Primary 7,000 2 2,583 (611) (379) 1,593
Secondary 3,000 2 1,075 (611) (398) 66
Combined 10,000 4 3,658 (1,222) (777) 1,659
As Singles Income Children
Gross
Tax
Basic
Credit
Child
Benefit Net
Primary 7,000 2 2,583 (611) (572) 1,399
Secondary 3,000 2 1,075 (611) (932) (468)
Combined 10,000 4 3,658 (1,222) (1,505) 932
Penalty 728
Penalty % 78%

32
46. Bracket sharing also generates a marriage credit (Table 5). This benefit applies only
to those couples where one taxpayer has income in the highest bracket and the other taxpayer
has income below the top bracket. In those cases, the higher earner can shift some income that
would otherwise be taxed at 46.24 percent to the second bracket to be taxed at 39.74 percent.
Savings from the bracket sharing can be fairly substantial: Under the 2015 PIT regime, the
maximum income that can be shifted is ISK 3,163,584, for a reduction of roughly ISK 250,000 in
tax. Given the high incomes to which this applies, however, the savings are a small percentage of
tax paid (only four percent in this example).
Table 4. The “Marriage Credit” from the Basic Credit
As Couple Income Children
Gross
Tax
Basic
Credit
Child
Benefit Net
Primary 3,750 0 1,344 (774) 0 571
Secondary 1,250 0 448 (448) 0 0
Combined 5,000 0 1,792 (1,222) 0 571
As Singles Income Children
Gross
Tax
Basic
Credit
Child
Benefit Net
Primary 3,750 0 1,344 (611) 0 733
Secondary 1,250 0 448 (448) 0 0
Combined 5,000 0 1,792 (1,059) 0 733
Credit (163)
Credit % -22%
Table 5. The “Marriage Credit” from Bracket Sharing
Actual Shared
Primary 18,000 14,836 5,790 (611) 0 5,179
Secondary 2,000 5,164 1,932 (611) 0 1,321
Combined 20,000 20,000 7,722 (1,222) 0 6,500
Actual Shared
Primary 18,000 14,836 7,254 (611) 0 6,643
Secondary 2,000 5,164 717 (611) 0 106
Combined 20,000 20,000 7,971 (1,222) 0 6,750
Credit (249)
Credit % -4%
As SinglesIncome Gross
Tax
Basic
Credit
Child
Benefit Net
Gross
Tax
Basic
Credit
Child
Benefit Net
IncomeAs Couple

33
47. While the potential tax benefit of bracket sharing to high-income couples is
obvious, its policy goal is not. It does not move the tax system toward a household based
system (even if that were desired); it benefits only those with the highest incomes (the top tax
bracket more or less coincides with the top income decile); and within that group only couples
with one high income and one lower income are able to benefit.
48. Iceland’s current hybrid system of individual and household taxation and
refundable credits creates perverse incentives for Icelandic taxpayers. It generally
encourages single childless individuals to become couples (for tax purposes) and encourages
couples with children to become single (for tax purposes). The extent to which Icelandic
taxpayers respond to these household tax incentives by changing their tax filing status is
unknown, although Icelandic policy experts say they see some influence of these policies on
behavior, particularly among lower-income households with children. In any event, creating these
perverse incentives would seem to be an undesirable policy that also poses significant
administrative challenges. Given that Iceland treats un-married cohabitating couples as “married”
for tax purposes, there is (as a minimum) an administrative challenge to ensure that taxpayers file
correctly as couples or singles in the absence of a bright line and documented legal test of what
defines a couple.23
49. Given Iceland’s basic commitment to individual taxation and its positive work
incentives for couples with children, that policy should be preserved and strengthened.
Bracket sharing should be eliminated. (The baseline policy scenario assumes that the
government’s proposed PIT reform will in fact do this in the course of repealing the second
income tax rate.) If the basic tax credit is made refundable in accordance with our
recommendations, there will be no need for sharing of the basic credit either, since the credit will
be fully monetized. Further, the parameters of the child benefit and interest rebate should be
reformed with an eye to eliminating (or at least greatly reducing) marital penalties and credits.
Recommendations
Preserve the current PIT practice of taxing individuals.
Eliminate bracket sharing for taxpayers filing as couples.
23 The presence of a legal test may not by itself solve this problem. In the United States, which has a marriage
penalty based on the progressive tax table, there is anecdotal evidence that some higher income individuals
routinely divorce in late December and re-marry in early January, since tax filing status is based entirely on legal
married status on December 31 of the tax year. This was more common when the tax table was more progressive
than it is today.

34
C. Taxing Teenagers
Issues
50. The tax treatment of 16- and 17-year-olds appears inconsistent: All individuals over
age 15 are required to file PIT returns, so 16- and 17-year-olds are treated as adults for the
purposes of the PIT. However, children of this age still qualify their parents to receive child
benefit payments.
51. There is a separate PIT schedule for children under 16 years of age: The first
ISK 180,000 of labor income—the typical wage for newspaper delivery, a common occupation for
Icelandic young teenagers—is exempt from tax, and additional labor income is taxed at a flat six
percent rate. Children under the age of 16 are taxed under separate rules, and capital income of
such children is taxed to one of their parents.
Analysis
52. Although the PIT and CB rules treat 16 and 17 year olds differently, this could be
appropriate given that are in transition from childhood to adulthood. Many Icelandic
teenagers earn labor income, so requiring them to file tax returns as adults is consistent with the
individual-based nature of the tax system discussed in the previous section. Eliminating the
requirement for 16- and 17-year-olds to file a PIT return could simplify compliance and
administration. However, it would also require that their incomes either: (1) be untaxed; (2) be
taxed under the rules that apply to younger children; or (3) be taxed to their parents. None of
these three options seems preferable to current law.
53. Alternatively, the inconsistent threshold of adulthood (16 for the PIT, but 18 for the
CB) could be rectified by limiting the CB to children under 16. However, this change would
ignore the fact that most children under age 18 are in fact supported largely or wholly by their
parents, and a CB for those parents (depending on their income) is therefore as appropriate as
for younger children, even if the 16- and 17-year-olds earn some income.
54. The current treatment of 16- and 17-year-olds under the PIT and CB thus appears
reasonable, with one caution: If the basic PIT credit it made refundable, 16- and 17-year olds
should not receive this benefit. The purpose of the refundable credit is to guarantee a minimum
income level to independent individuals, so children who are still largely supported by their
parents should not be eligible.
55. It is not clear why it is necessary to have a separate PIT regime for the earned
income of children under the age of 16. Most children under 16 will likely pay no tax, because
their income is unlikely to exceed to exemption amount. But if they do have labor income in
excess of the threshold, they would actually pay more tax than would the same child after age 16,
when he/she would get the benefit of full basic PIT credit. It would be preferable to subject the

35
labor income of children under 16 to the standard PIT, but only require them to file a tax return
in the (unlikely) event that their income exceeds the amount that would be offset by the personal
credit—approximately ISK 1,637,600 under current law. Capital income should continue to be
taxed to a parent, since any substantial level of capital held by children under 16 is likely to
derive from familial wealth.
Recommendations
Eliminate the special tax rules for children under age 16.
Require children under age 16 to file a tax return only if their labor income exceeds the
personal credit divided by one minus the first bracket tax rate.

36
IV. HOUSING-RELATED BENEFITS
Issues
56. The interest rebate (IR), a refundable tax credit that will cost approximately
ISK 8 billion in 2015, is extremely complex (Table 6). Reimbursement depends not only on
mortgage principal and interest and household income, but also on net wealth, marital and
parental status. The policy purpose of the IR is to help people afford to purchase homes, but the
benefit appears to extend much further up the income scale than this purpose warrants. Finally,
subsidizing mortgage interest—especially in the absence of imputed rent taxation—can
encourage taxpayers to assume excessive leverage in purchasing a home and/or to purchase a
significantly larger home than they otherwise would. For all these reasons, the IR stands in need
of reform.
57. In addition to the interest rebate, the government of Iceland offers at least two
other programs to support housing affordability: rental benefits and Housing Financing
Fund (HFF) loans. Like the IR, rental benefits are an important means-tested housing subsidy
with a very complex formulation that depends not only on rent amount and income but also net
wealth, marital status and the number of children (Appendix B). The HFF is a government agency
providing low-cost mortgage loans to households, municipalities and developers with a goal of
ensuring affordable housing. As noted in the previous chapter, multiple government programs
addressing a single social issue run the risk of obscuring policy goals and introducing additional
distortions.
Analysis
58. Under an ideal income tax, interest expense is deductible and interest income is
taxable; however, an ideal income tax also taxes imputed rent on owner-occupied housing.
Failure to tax imputed rent effectively allows homeowners to purchase housing services out of
pre-tax income, which puts them at an advantage over renters, who pay their rent out of post-tax
income. This is clearly unfair as well as regressive, since renters tend to be less well off than
homeowners. Nonetheless, most countries do not tax imputed rent due to the administrative and
compliance burden of doing so, which would require assessing each residence’s rental value and
collecting tax on that, even if the homeowner had poor cash flow. Therefore, most countries
currently disallow (or sharply curtail) mortgage interest deductions as an offset to the non-
taxation of imputed rent.24 Iceland’s IR is unusually generous in not only allowing a deduction
but actually refunding a certain amount of mortgage interest.
24 Disallowing deduction of mortgage interest creates a discontinuity between households with mortgages and
those that own their home outright, as is the case for many wealthy and older homeowners, since the latter
group effectively consume housing services on a pre-tax basis.

37
59. If the purpose of the IR program is to help families afford to buy their own homes,
then it appears to be poorly targeted. In 2013, about 13 percent of all households received
mortgage interest rebates, and the average rebate was approximately ISK 286,000 (US$2,100).
The mean total household income for IR recipients was ISK 6.1 million, and the maximum total
income was 19.8 million. The interest rebate thus flows predominantly to households in the
upper half of the income distribution: Households with above-median income receive almost
three quarters of total interest rebates, and households in the top three deciles receive almost
40 percent of them. Most households in the upper income brackets would likely own their own
homes regardless of whether they received an interest subsidy, although the IR likely enables
them to finance the purchase a larger home than they otherwise would.
Table 6. Interest Rebate Parameters
Interest rebates – assesment year 2015 Permanent Rules
Maximum IR amount, ISK
Individuals 400,000 189,957
Single parents 500,000 244,299
Couples/cohabitants 600,000 314,134
Maximum interest payment, ISK
Individuals 800,000 554,364
Single parents 1,000,000 727,762
Couples/cohabitants 1,200,000 901,158
Floor amount for net wealth, ISK
Individuals 4,000,000 7,119,124
Single parents 4,000,000 7,119,124
Couples/cohabitants 6,500,000 11,390,599
Ceiling amount for net wealth, ISK
Individuals 6,400,000 11,390,599
Single parents 6,400,000 11,390,599
Couples/cohabitants 10,400,000 18,224,958
Interest burden maximum, % of total
mortgage debt
7% 5%
Means-tested ratio of total income 8.5% 6%
IR ratio paid 100% 100%
IR minimum paid, ISK 5,000 692

38
60. Both mortgage interest and rental subsidies distort consumption patterns in favor
of housing. If sufficiently broad-based, these subsidies can have general equilibrium effects on
housing prices, with the higher prices or rents that result undermining the benefits of the
subsidy. A study of the effect of the interest rebate and rental benefits on housing values and
rents in Iceland is beyond the scope of this report, but such effects are possible, particularly in
market segments where such subsidies are prevalent—for example, apartments and smaller
houses in the Reykjavik area. Even if housing prices are not affected, however, housing-linked
subsidies alter the relative cost of housing vs. other goods for eligible households, leading them
to consume a higher level of housing than they would if given an equivalent general income
subsidy. For this reason, the government should favor general income support – such as the
refundable basic tax credit – over housing-specific subsidies.
61. One common motive for location-specific housing subsidies is geographical
differences in housing costs. For example, housing in an urban center such as Reykjavik is
typically more costly than in less populated areas, which raises the cost of living and thus the
effective poverty threshold. It makes sense for the benefit system to recognize this variation in
the cost of living by offering higher benefits in high-cost areas, but again it would be more
efficient to offer this in the form of a local income supplement that does not distort relative
prices. Consumers could then make more efficient trade-offs between, for example, living in
urban centers vs. in outlying areas, where housing is cheaper but transport costs higher.
Location-specific income supplements offer a more flexible response to local differences in living
costs than rent subsidies; for example, they could address higher living costs in remote areas or
those with harsh climate, where housing was cheap but utility and transport costs were elevated.
62. In addition to reviewing housing subsidies, the government is also considering
supply-side policies to stimulate housing supply, including a reduced capital income tax
rate on rental income. However, cutting the tax rate on rental income, which already benefits
from an imputed cost deduction of 30 percent, would undermine the efficiency benefits of the
dual income tax’s flat, uniform capital income tax rate; it would create incentives for financial
arbitrage to recharacterize interest and dividends as rents without necessarily stimulating
housing investment. It would be preferable to use any available fiscal space to lower the capital
income tax rate on all types of investment income. The property tax can also be developed in
such a manner as to encourage more intensive use of high-value urban land. (See following
chapter.) Of course, in order for this to be effective non-tax policies impacting housing supply,
such as zoning laws, must also be conducive to increased residential development.
63. A significant obstacle to phasing-out the mortgage interest rebate at present is of
course the high level of household indebtedness that lingers from the financial crisis. Even
if debt levels were normal, however, it would be inadvisable to terminate the IR abruptly, without
giving households adequate time to adjust their finances. Thus IR should be phased-out
gradually over a number of years. To begin this process, the program could be greatly simplified,
merging the treatment of all types of households into a single set of parameters: The maximum

39
rebate and the wealth phase-out range should be reduced toward that of the single homeowner
and the income phase-out rate should be sharply increased. Most households in developed
countries expect to spend much more than 8.5 percent of their income on housing, so a more
reasonable level for the income test would be 20-25 percent.
64. Radical simplification of the IR would moreover facilitate its policy purpose in
helping marginal home buyers enter the market. The formula is currently so complex and the
amount of the benefit therefore so uncertain that banks reportedly do not take the IR into
account in assessing mortgage applications. Simplification of the benefit would enable applicants
to use it to secure financing.
65. Two political developments currently offer an excellent opportunity to reform the
IR. In addition to the central government’s PIT reform initiative, the Ministry of Welfare has also
introduced legislation to take over and reform the rental benefit system currently run by local
governments. Since both programs aim at improving housing affordability, it makes sense to
integrate their reform. Additionally, unless extended the current IR parameters will lapse at the
end of 2015, after which the system will revert to its pre-2011 parameters, which offer much
lower benefit levels (but much higher wealth phase-out levels). The prospect of this lapse creates
a good incentive for rationalization in the remainder of this year.
Recommendations
Phase out the interest rebate over the next several years in favor of general income
support for low-income households (e.g., a refundable tax credit).
As a first step, simplify the parameters and focus the benefit on marginal households that
could not afford to buy a home without it.
Similarly, reform the rent benefit into enhanced income support for low-income
households in high-cost areas.

40
V. FISCAL FEDERALISM
Issue
65. Reform of the PIT, which constitutes 17 percent of central government (CG)
revenue and 61 percent of local government (LG) revenue, may necessitate rebalancing its
revenues between central and local governments. Under current PIT revenue sharing rules,
the CG bears the entire cost of the basic credit. LGs receive their share of constituents’ income
from the first dollar earned, even if the basic credit shields a constituent from paying any PIT. In
this case, the central government transfers revenue to the LG in the amount of the constituent’s
local PIT liability. When a taxpayer starts to pay PIT, all of their payments are allocated to the LG
until that liability is fully paid off before the CG begins to recoup net revenue (Figure 11). This CG
financing of the basic credit constitutes about 7 percent of LG PIT revenue. The CG’s share of PIT
revenue is thus lower (42.5 percent in 2014) as well as more volatile than that of LGs.25 Under the
IMF’s proposed reform, the CG share would fall further, by roughly 2 percentage points.26
25 Over the years 2000-2014, the coefficient of variation (standard deviation/ mean) of CG PIT revenue as a share
of GDP was 7 percent vs. 6 percent for LGs.
26 Since the IMF reform is revenue neutral, however, the costs of child benefit and interest rebate fall accordingly.
Figure 11. Division of PIT revenues between Central and Local Government
Source: MOFEA

41
66. Sharing of PIT revenues should be considered as part of the overall balance of
central and local government revenue and expenditure allocations. Since the main purpose
of this report is an evaluation of the PIT’s impact on household welfare and incentives, full
analysis of the separate issue of PIT revenue sharing is beyond its scope.27 However, at the
Minister’s request this section offers a few precepts of sound revenue sharing design for
consideration, some of which address housing supply issues raised in the preceding chapter.
Analysis
67. Iceland’s 76 municipalities account for more than a quarter of total government
revenue and expenditure. In 2014, LG revenues amounted to 12.9 percent of GDP, or
28.5 percent of total government revenue, and expenditures were 13.2 percent of GDP or
29 percent of total government spending. Their revenue sources and expenditure responsibilities
are defined by the Local Government Act (LGA) 138 of 2011. The PIT constitutes the largest
source of total LG revenue by far (61 percent, Figure 12), followed by the property tax
(12 percent), CG grants (11 percent), and local fees and charges (10 percent).
27 During the crisis, FAD presented a TA report on local government finance: R. Hughes, T. Irwin and E.R.
Karlsdottir, “Strengthening the Local Government Fiscal Framework,” International Monetary Fund, Washington
DC, October 2010.
Figure 12. Composition of Local Government Revenues (2014)
Source: MOFEA
PIT61%
Property Tax12%
Indirect Taxes1%
Grants11%
Fees and
charges
10%
Capital income4%
Other 1%

42
68. Economic theory posits that LG revenue autonomy should correspond to the extent
of LG spending autonomy. If the CG dictates local spending policies to a large extent, then LGs
are effectively administrative branches of the CG, and the latter should furnish them with
sufficient revenue to execute its policies. If, however, LGs have significant autonomy over how
much they spend and on what, then they should be responsible for raising their own revenue at
the margin so that they are answerable to local taxpayers for the use of the funds.
69. LGs in Iceland have some ability to control their revenues within bounds set by the
central government. Under the LGA, both the real estate tax and the LG share of the PIT are
considered to be LG own revenues. LGs do not have full autonomy with regard to these taxes,
however, as the central government determines their bases as well as allowable tax rates:
Currently, LGs may set their PIT rates within a narrow band of 12.44 and 14.52 percent, and the
average rate is 14.4 percent, indicating that most LGs choose the maximum allowable rate.
Similarly, the CG caps the real estate tax rate at 1.32 for commercial and government properties
and 0.5 percent on residences. Local governments are not allowed to introduce any new taxes,
but they have considerable autonomy in setting local fees and charges.
70. CG grants to the municipal Equalization Fund have appropriately expanded in
recent years to reflect LG assumption of greater spending responsibility, e.g. for
elementary schools and disabled care. The current contribution rules call for the CG to
contribute 2.12 percent of its total tax revenues and 0.264 percent of the previous year’s PIT
base. LGs also contribute 0.77 of their PIT base, earmarked for elementary school expenditure,
and 0.95 percent of the PIT base, earmarked for disabled expenditure; interest payments. The
Fund revenues are then shared among the municipalities based on a complex needs- and
resources-based formula.
71. Local governments often rely in part on revenue sharing by the central government
because it is usually easier for central governments to raise revenue. If local governments
are small (as is the case for many of Iceland’s municipalities), the central government will have an
administrative advantage in revenue collection. Base mobility is another important factor in the
central government’s revenue collection advantage: If local governments try to raise tax rates on
a mobile base such as business or personal income, part of that base is likely to migrate other
jurisdictions. Central governments face this constraint as well – particularly with regard to
corporate investment or capital income – but usually to a lesser degree. The minimum local PIT
rate imposed by Icelandic law reduces the scope for LG tax competition on this critical income
source.
72. Allocation of revenues between central and local governments need to be matched
with expenditure responsibilities not only in magnitude but also in volatility. If a particular
level of government has anti-cyclical spending responsibilities—such as social insurance that
increases in an economic downturn—then its revenues should not be procyclical (or, to the
extent that cannot be avoided, they should be smoothed via a “rainy day fund”). Revenue

43
volatility maybe more easily handled by central than local governments if the former has better
access to capital markets, or can borrow at substantially lower rates.
73. Although the local portion of the PIT is considered to be LG own revenue, the CG
financing of the basic credit is essentially a grant. If the LG were to finance its own share of
the basic PIT credit—that is, to only charge PIT on a constituent’s income once it exceeded
ISK 633,965 = ISK 610,824/0.373*0.144/0.373—its net PIT revenue would fall by roughly
15 percent and also become more volatile. The current PIT sharing formula may be reasonable in
light of the allocation of expenditures between central and local governments; for example, if
local governments are responsible for a large share of benefits to low-income households, it may
make sense to insulate their revenues from the cost of the basic credit. However, this policy also
insulates local governments from the wage negotiation process, in which unions bargain heavily
with the government over the initial PIT rate and the basic credit. Since LGs bear no cost from the
basic credit, they are generally not involved in this process, even though wage negotiations may
have important local fiscal impact. Rebalancing the PIT sharing formula could give LGs an
incentive to participate in the wage formation process, where appropriate; if necessary, the
revenue cost could be balanced by higher general revenue sharing.
74. The tax base that least suffers from base mobility is real estate, and the property
tax is therefore viewed as the ideal local government tax. Because property tax rates are
highly visible, it is also a good vehicle for ensuring the responsiveness of local governments to
their constituents. The 2011 IMF tax policy mission recommended that the property tax be
further developed, raising the 0.625 cap on the residential property tax rate and perhaps
introducing a positive floor for rates as well. Heavier recurrent taxation of real estate allocated for
residential use—particularly the tax on land (as opposed to structures)—would also encourage
more intensive development of those sites, which could help address undersupply in the
Reykjavik area.
Recommendations
Conduct a review of central and local government revenue sharing to ensure that its
division is reasonable, given the division of expenditures, and that LGs are fiscally
responsible to their constituents for their discretionary spending.
Consider increasing the cap on real estate taxes, particularly for residential properties.

44
VI. IMF REFORM SCENARIO
75. This section amalgamates the recommendations of Chapters II-V into a
hypothetical reform scenario that is revenue-neutral with respect to the baseline regime.
To fit Iceland’s MTR schedule as closely as possible to the optimal schedule estimated in Chapter
II, the following parameter changes were made: (1) All taxpayers were given an unconditional
refundable credit of ISK 1 million, which was phased out at a rate of 33.33 percent against labor
income with a zero threshold. (2) The initial CG PIT rate was lowered to 12.5 percent (while LG PIT
rates were held constant); the MTR for very low-income households was therefore
60.27 percent = 33.33+14.44+12.5. (3) The top tax rate was lowered very slightly to 31.5 percent,
and its threshold was raised to ISK 12 million. (4) The child benefit was radically simplified: a
single credit of ISK 400,000 per child was given for up to 3 children under the age of 18, and the
benefit phase-out rate was increased to 12 percent of household income above a threshold of
ISK 1.8 million, all regardless of family structure or age of children.28 Finally (5), the interest rebate
was abolished. This reform produced the red MTR schedule seen in Figure 13.
28 Stipulating a single phase-out threshold for both singles and couples may preserve the sort of “marriage
penalty” warned against in Chapter III. However, since unifying the credit amount at ISK 400,000—close to the
higher benefit level currently given to single parents—gave a big benefit increase to most couples, it seemed fair
to sharply reduce their phase-out threshold. Since couples generally have much higher household income than
singles, this also helps focus the benefit on needier families.
Figure 13. IMF reform with Unconditional Refundable Credit
Source: RSK data and IMF staff calculations
020
40
60
80
100
Marg
inal Tax
Rate
(P
erc
en
t)
0 5 10 15 20 25Gross Labor Income (Millions of Króna)
Current PIT IMF Reform Optimal PIT

45
76. When the results of this optimizing reform were analyzed, the Icelandic authorities
were concerned that the unconditional refundable credit was likely too generous to low-
income singles. The distribution of income in Iceland has a strong life-cycle component that, as
noted in Chapter II is not captured by the Mirrlees-Saez model. Thus, many low-income
taxpayers in Iceland are young singles who, though they have little or no labor income, have
other means of support such as student loans and parental support; and as they are earning
college degrees, many of these students have high expected lifetime income. It was therefore
decided to replace the unconditional refundable credit with a credit conditioned on a minimum
level of labor earnings. This form of credit would also preserve better work incentives for very
low-income households than the unconditional grant, as discussed at the end of Chapter II.
77. The modified IMF reform scenario with refundable credit conditioned on labor
income is shown in Figure 14. To make the new regime revenue-neutral, the parameters had to
be modified slightly from the unconditional model. The amount of the conditional credit was
increased to ISK 1.2 million, the phase-out rate was set at 35 percent against total income,
including capital income; and the credit was only given to individuals who earned at least
ISK 600,000 of labor income. Since these changes preserved more revenue than the
unconditional regime, the top income tax rate was lowered another notch to 30.5 percent, but
the threshold stayed at ISK 12 million. The child credit also stayed at ISK 400,000 per child, but
the phase-out threshold was raised to ISK 2.4 million for all households while the phase-out rate
was increased slightly to 13 percent. These are the parameters of the system analyzed in the
following chapter as the “IMF reform.”
Figure 14. IMF Reform with Conditional Refundable Credit
Source: IMF staff calculations using RSK data
020
40
60
80
100
Marg
inal Tax R
ate
(P
erc
en
t)
0 5 10 15 20 25Gross Labor Income (Millions of Króna)
Current PIT IMF Reform Optimal PIT

46
78. Relative to the baseline regime, this reform increases the after-tax income of lower-
income and upper-income households, but reduces that of middle-income households
(Figure 15). The distributional impact of the reform will be discussed further in the following
chapter. Comparison of Figures 14 and 15 clearly shows the tradeoff between work incentives, as
captured by MTRs, and the tax burden, as captured by after-tax income. Under the current
regime, many middle-income households profit from the child benefit and/or interest rebate,
which significantly reduce their tax burden; however, because they are often in the phase-out
range for these benefits, they face high MTRs (on top of the already high statutory PIT rates).
79. The reduction of marginal tax rates on middle-income workers would alter
incentives for owners of privately held corporations – a prevalent form of business
organization in Iceland – to allocate income between labor and capital.29 Currently, Icelandic
law requires corporate owners to allocate labor income to themselves on the basis of
administratively set “minimum wages” for various business categories, with the residual allocated
to more lightly taxed capital income. To promote progressivity and better align the tax
treatment of employees and the self-employed, IMF (2011) recommends that this method be
changed to impute capital income on the basis of book assets, with the residual allocated to
labor, as is the practice under the Norwegian and Swedish dual income taxes. The sharp cut in
the initial PIT rate under the proposed reform narrows the tax rate differential between labor and
capital income, reducing the tax advantage of being self-employed for middle-income
individuals.
80. Although it preserves many core elements of the current system, the proposed
reform in many other respects represents a radical departure from current policies. The
ultimate choices made regarding PIT reform will depend, of course, on political pressures, and
any major changes undertaken would have to be phased in over time in order to avoid
disrupting household finances already strained by the recent crisis. Nonetheless, the proposed
system would clearly move toward the goals given by the mission terms of reference: to improve
work incentives and refocus benefit programs on needier households. Its various elements could
of course be rebalanced to accord with social priorities and constraints.
29 T. Matheson and P. Kolbeins, “Allocating Business Income between Capital and Labor under the
Dual Income Tax: The Case of Iceland,” IMF working paper 12/263, 2012.

47
Figure 15. After-Tax Income, IMF Reform
05
10
Aft
er-
tax in
co
me
0 5 10
Gross labor income (millions of króna)
Current PIT IMF reform Optimal PIT

48
VII. DISTRIBUTIONAL ANALYSIS
80. The government aims to develop standardized methods for measuring the
distributional impact of tax and benefit policy reforms. This chapter therefore presents a
distributional analysis of the proposed IMF reform as a prototype for this method. To this end,
we did a microsimulation analysis using the population database of individual tax return data
from 2013, which was provided by the RSK. Using this data, the microsimulation model simulates
the tax payment and resulting net income of households under the current 2015 rules,30 the tax
reform package of the government (the “baseline regime”), and the tax reform proposal
developed by the IMF mission team, and compares results from an income distribution
perspective. The microsimulation calculations are static in the sense that they do not take into
account changes in the behavior of taxpayers, for example induced changes in their labor supply.
81. Distributional analysis is assessed at the household level and thus depends critically
on what measure of income is used to rank households into income groups. The standard
method of doing this, known as the OECD household equivalence scale,31 is to divide total
household disposable income by the square root of the total number of household members.
This method takes into account the economies of scale of providing for larger households: For
example, for a given amount of income a married couple can have a higher standard of living
together in a single household than could two single individuals who split that income and live
separately. However, in response to a request from the authorities, the mission instead used
household per capita pre-tax income, i.e., total household income divided by the total number of
household members to rank households into income deciles. For each income decile we show
the average per capita net income position and changes. For perspective, we also sometimes
show households total income unadjusted for the number of household members. This ranking
can be informative to the extent that household size—whether to form a couple and how many
children to have—can be viewed as a choice variable.
A. The Current Regime
82. The current tax system is progressive with a negative tax rate on the poorest
households (Figure 16). The average effective tax burden (the ratio of income taxes to pre-tax
income) increases very sharply for the bottom 4 deciles, and then rises more gradually. At the
same time, the income difference between the bottom and top income decile is substantial: the
average per capita household net income is more than 10 times higher in the top decile than in
30 To simulate 2015 income levels, taxpayers’ 2013 income was inflated using parameters provided by the MOFEA
staff.
31See www.oecd.org/eco/growth/OECD-Note-EquivalenceScales.pdf

49
the lowest 10 percent of households. The top 10 percent of households contributes about 33
percent (Figure 17), while the top 20 percent of households contribute about half of the total PIT
tax payment.
Figure 17. Distribution of PIT Liabilities by Income Deciles
Source: Icelandic authorities and IMF staff calculations
Note: Deciles are based on pre-tax household per capita income
-5%
0%
5%
10%
15%
20%
25%
30%
35%
Income deciles of households
Figure 16. Net Income and Tax Burden by Income Deciles
Source: Icelandic authorities and IMF staff calculations
Note: Deciles are based on pre-tax household per capita income
(4,000,000)
(2,000,000)
-
2,000,000
4,000,000
6,000,000
8,000,000
-20%
-10%
0%
10%
20%
30%
40%
bottom 2 3 4 5 6 7 8 9 top
HH per capita net income, in ISK (right scale)
tax burden, %
Income deciles of households
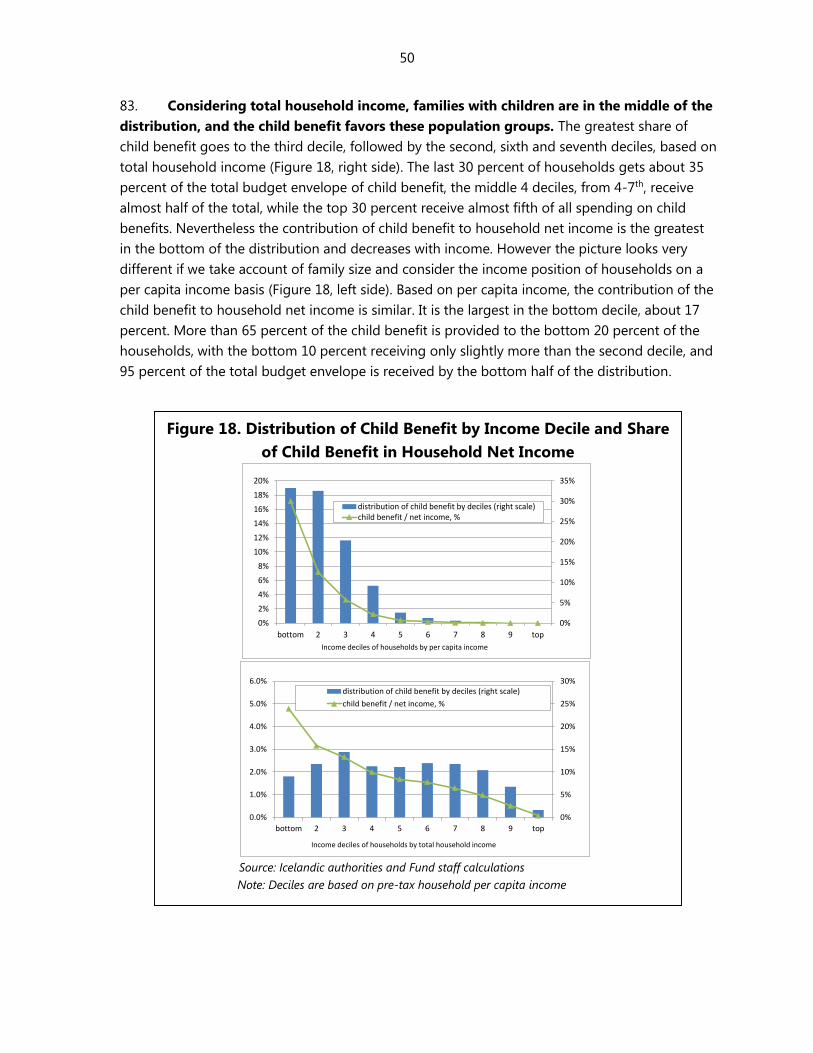
50
83. Considering total household income, families with children are in the middle of the
distribution, and the child benefit favors these population groups. The greatest share of
child benefit goes to the third decile, followed by the second, sixth and seventh deciles, based on
total household income (Figure 18, right side). The last 30 percent of households gets about 35
percent of the total budget envelope of child benefit, the middle 4 deciles, from 4-7th, receive
almost half of the total, while the top 30 percent receive almost fifth of all spending on child
benefits. Nevertheless the contribution of child benefit to household net income is the greatest
in the bottom of the distribution and decreases with income. However the picture looks very
different if we take account of family size and consider the income position of households on a
per capita income basis (Figure 18, left side). Based on per capita income, the contribution of the
child benefit to household net income is similar. It is the largest in the bottom decile, about 17
percent. More than 65 percent of the child benefit is provided to the bottom 20 percent of the
households, with the bottom 10 percent receiving only slightly more than the second decile, and
95 percent of the total budget envelope is received by the bottom half of the distribution.
Figure 18. Distribution of Child Benefit by Income Decile and Share
of Child Benefit in Household Net Income
Source: Icelandic authorities and Fund staff calculations
Note: Deciles are based on pre-tax household per capita income
0%
5%
10%
15%
20%
25%
30%
35%
0%
2%
4%
6%
8%
10%
12%
14%
16%
18%
20%
bottom 2 3 4 5 6 7 8 9 top
distribution of child benefit by deciles (right scale)child benefit / net income, %
Income deciles of households by per capita income
0%
5%
10%
15%
20%
25%
30%
0.0%
1.0%
2.0%
3.0%
4.0%
5.0%
6.0%
bottom 2 3 4 5 6 7 8 9 top
distribution of child benefit by deciles (right scale)
child benefit / net income, %
Income deciles of households by total household income

51
84. The interest rebate is less equitable than the child benefit. Considering income
distribution both by total household income (Figure 19, right side) and by per capita household
income (left side), the top half of the income distribution receives a large share of this benefit:
35 percent based on per capita categorization and 55 percent based on total household income
categorization. The share of the interest rebate in net income is a lot lower than that of the child
benefit for the bottom third of the income distribution.
85. The tax burden is similar for families with different numbers of children (Figure 20):
On average it is around 25 percent of gross income for all types. Nevertheless the contribution of
the child benefit to net income increases substantially with the number of children, from 2
percent for families with 1 child to close to 5 percent for families with 3 or more children.
86. Single parent families have the lowest per capita net income in the population,
followed by single households with no children (Figure 21). Accordingly, the tax system
favors these families and they face the lowest tax burden on their gross income. At the same
time, the child benefit system is very generous with single parents, providing more than 10
percent of their net income on average. Couples with children have substantially higher
Figure 19. Distribution of Interest Rebate by Income Decile and
Share of Interest Rebate in Net Income
Source: Icelandic authorities and Fund staff calculations
Note: Deciles are based on pre-tax household per capita income
0%
2%
4%
6%
8%
10%
12%
14%
16%
18%
0.0%
0.5%
1.0%
1.5%
2.0%
2.5%
3.0%
bottom 2 3 4 5 6 7 8 9 top
distribution of interest rebate bydeciles (right scale)
int rebate / net income (%)
Income deciles of households by per capita income
0%
5%
10%
15%
20%
0.0%
0.5%
1.0%
1.5%
2.0%
bottom 2 3 4 5 6 7 8 9 top
distribution of interest rebate by deciles (right scale)
int rebate / net income (%)
Income deciles of households by total household income

52
household net income, both in total and in per capita terms, and the child benefit constitutes a
much smaller proportion of the net income of these families
Figure 20. Net Income, Tax Burden and Child Benefit by Number of
Children
Source: Icelandic authorities and Fund staff calculations
-
1,500,000
3,000,000
4,500,000
6,000,000
7,500,000
9,000,000
0%
5%
10%
15%
20%
25%
30%
0 1 2 3+
HH per capita net income, in ISK (right scale) HH total net income, in ISK (right scale)
tax burden, % child benefit / net income, %
Number of children in household
Figure 21. Net income, Tax Burden and Child Benefit by Family Type
Source: Icelandic authorities and Fund staff calculations
-
2,000,000
4,000,000
6,000,000
8,000,000
10,000,000
12,000,000
0%
5%
10%
15%
20%
25%
30%
couple with no
children
couple with
children
single no children single parent
HH per capita net income, in ISK (right scale) HH total net income, in ISK (right scale)
tax burden, % child benefit / net income, %
Family types

53
B. The Government Reform Proposal
87. This section analyzes the impact of the government’s multi-year PIT reform
proposal, details of which are discussed in previous chapters. The reform reduces the tax
burden on middle income families slightly, but its overall distributional impact is very small
(Figure 22). The largest gain accrues to the ninth decile, where household net income increases
on average by 1.5 percent. This appears somewhat surprising in light of the reduced threshold
for the top rate; however, these households benefit greatly from the elimination of the second
tax rate.
88. The government reform somewhat favors single adult families (Figure 23). The gain
in percent of net income of single households without children and single parents are slightly
below 1 percent. At the same time, couples with or without children gain a bit less from the
reform. This is in most part due to the (assumed) elimination of bracket sharing that in the
current system favors couples with a high and a low income earner.
Figure 22. Impact of Government Reform on Net Income by Decile
Source: Icelandic authorities and Fund staff calculations
Note: Deciles are based on pre-tax household per capita income
-
1,000,000
2,000,000
3,000,000
4,000,000
5,000,000
6,000,000
7,000,000
8,000,000
0.0%
0.2%
0.4%
0.6%
0.8%
1.0%
1.2%
1.4%
1.6%
bottom 2 3 4 5 6 7 8 9 top
HH per capita net income - current system, ISK (right scale)
HH per capita net income - gov't proposal, ISK (right scale)
Change in net income, %
Income deciles of households

54
C. The IMF Reform Scenario
90. This section analyzes the distributional impact of the IMF PIT reform proposal
detailed in the preceding chapter. The proposed reform benefits the most the bottom fifth of
households, and to some extent the top 20 percent as well (Figure 24). Households in the bottom
decile would experience a very large increase in net income of more than 30 percent due to the
conditional refundable credit, while households in the second decile would see a much smaller
but still substantial increase of about 10 percent. By contrast, households in the middle of the
distribution (4th to 6th deciles) would experience a drop in net income of around 5-7 percent.
For most deciles, changes in household net income are somewhat smaller when compared to the
current regime than when compared to the government proposal. Table 7 summarizes the
impact of the government and IMF reform proposals on after-tax household per capita income
by deciles of pre-tax income.
Figure 23. Change in Household Net Income by Type of Family
Source: Icelandic authorities and Fund staff calculations
0.0%
0.1%
0.2%
0.3%
0.4%
0.5%
0.6%
0.7%
0.8%
0.9%
1.0%
couple with nochildren
couple withchildren
single nochildren
single parent
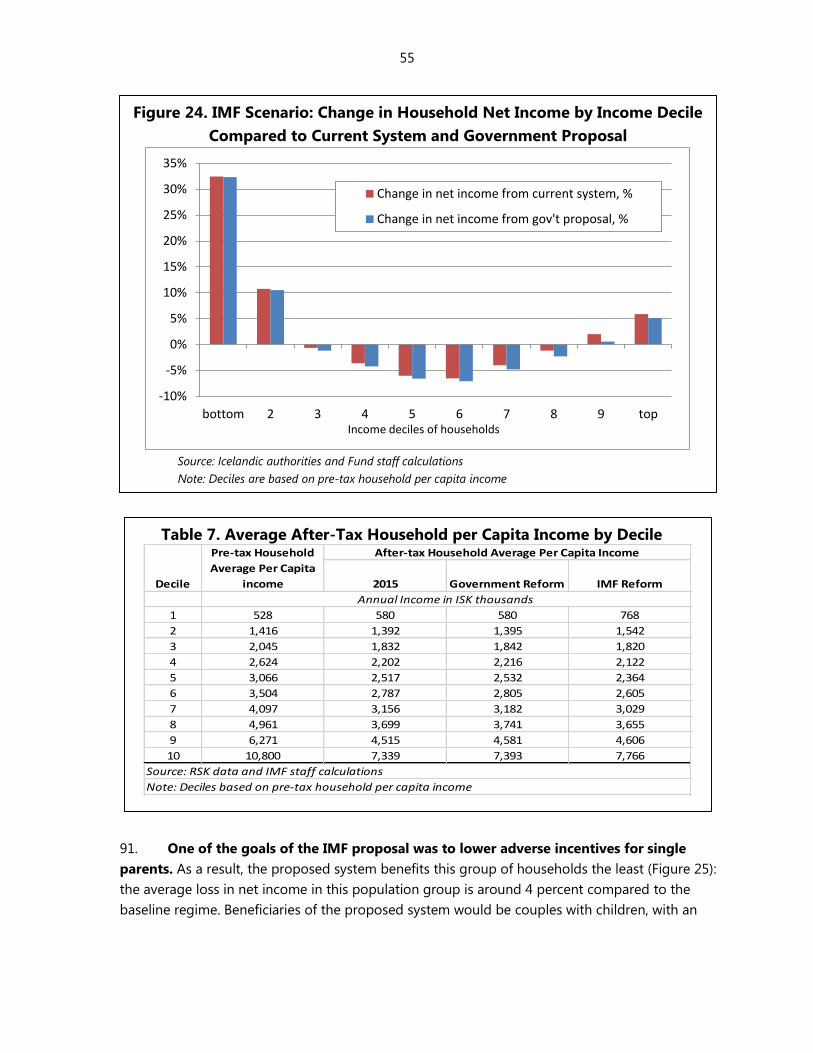
55
91. One of the goals of the IMF proposal was to lower adverse incentives for single
parents. As a result, the proposed system benefits this group of households the least (Figure 25):
the average loss in net income in this population group is around 4 percent compared to the
baseline regime. Beneficiaries of the proposed system would be couples with children, with an
Figure 24. IMF Scenario: Change in Household Net Income by Income Decile
Compared to Current System and Government Proposal
Source: Icelandic authorities and Fund staff calculations
Note: Deciles are based on pre-tax household per capita income
-10%
-5%
0%
5%
10%
15%
20%
25%
30%
35%
bottom 2 3 4 5 6 7 8 9 top
Change in net income from current system, %
Change in net income from gov't proposal, %
Income deciles of households
Table 7. Average After-Tax Household per Capita Income by Decile
2015 Government Reform IMF Reform
1 528 580 580 768
2 1,416 1,392 1,395 1,542
3 2,045 1,832 1,842 1,820
4 2,624 2,202 2,216 2,122
5 3,066 2,517 2,532 2,364
6 3,504 2,787 2,805 2,605
7 4,097 3,156 3,182 3,029
8 4,961 3,699 3,741 3,655
9 6,271 4,515 4,581 4,606
10 10,800 7,339 7,393 7,766
Note: Deciles based on pre-tax household per capita income
Decile
Pre-tax Household
Average Per Capita
income
After-tax Household Average Per Capita Income
Annual Income in ISK thousands
Source: RSK data and IMF staff calculations

56
average gain of more than 1 percent of net income. Families without children would also gain
somewhat with the proposed changes relative to the current system.
92. The IMF reform would at least preserve the progressivity of the current tax system,
and by some measures increase it (Table 8). Comparing columns 1 and 2 shows that the
current PIT, CB and IR reduce inequality substantially compared to the pre-tax income
distribution: The Gini coefficient, a well-known measure of income dispersion,32 falls from
37 percent before taxes to 32 percent after tax payment. Both the government and the IMF
reform proposals would preserve after-tax inequality as measured by the Gini coefficient at about
the same level. Two other inequality measures, the P90/P10 and P75/P25 ratios, show some
differences between the current system and the two reform proposals. The government proposal
would somewhat increase the difference in income levels between the top and bottom income
deciles, while keeping the difference unchanged between the bottom and top quarters of the
income distribution. The IMF proposal, however, would compress the middle of the income
distribution: the income difference between both the top and bottom deciles and the top and
bottom quartiles would decrease compared to the current system and the government proposal.
This improvement in equality is largely due to the large increase in welfare at the bottom of the
32 For more information on these inequality measures, see http://www.oecd.org/els/soc/income-distribution-
database.htm
Figure 25. IMF Scenario: Change in Household Net Income by Types of
Family Compared to Current System and Government Proposal
Source: Icelandic authorities and Fund staff calculations
-5%
-4%
-3%
-2%
-1%
0%
1%
2%
couples with no
children
couples with
children
single no
children
single parents
Change in net income from current system, %
Change in net income from gov't proposal, %

57
income distribution, which outweighs the effect of the more moderate increase in net income at
the top of the distribution.
Table 8. Inequality Measures Under the Current System and the Two Proposals
Pre-tax
Income
Post-tax Income
Current System Government Reform IMF Reform
Gini coefficient 0.37 0.32 0.32 0.32
P90/P10 6.30 4.37 4.43 3.75
P75/P25 2.37 2.01 2.01 1.93
Source: Icelandic authorities and Fund staff calculations
Note: P90/P10 and P75/P25 are ratios of percentiles of the income distribution. Income concept is per capita household
income.

58
APPENDIX A. THE EVOLUTION OF TAX POLICY SINCE THE 2008 CRISIS
The tax reforms that emerged after the 2008 financial crisis have affected almost all existing taxes
and also created a number of new taxes. Following is an overview of the most important changes
made by the two governments that have taken power since the crisis.
A. Tax Policy Measures 2009 – 2013
The main tax changes implemented by the Social Democratic/Left-Green government were:
Personal income tax. At the beginning of 2009, the CG PIT was a single-rate tax like the LG PIT,
which averaged 13.12 percent at the time. After the CG PIT rate was raised from 22.75 percent to
24.1 percent, a temporary 8 percent surcharge was added on taxable income above
ISK 2.4 million per year. At the beginning of 2010, the second PIT rate was reduced to 27 percent
and a third CG rate of 33 percent was added on income above ISK 7.8 million; at the same time
the average LC PIT rate was increased from 13.12 percent to 14.41 percent due to the transfer of
responsibility of the disabled services from the CG to LG.
Two other measures implemented during this period affected the revenue stream from PIT. First,
early withdrawal of private pension savings was allowed from 2010 until end 2014. These
withdrawals amounted to over ISK 100 billion and increased PIT revenues of both the CG and LG
considerably. Second, in 2012, the private pension contribution deductibility from the PIT base
was lowered from 4 percent to 2 percent supposed to be in force until January 1, 2015.
Capital income tax. A 5 percent surcharge was added to the 10 percent capital income tax rate
from mid-year 2009, and its collection was changed from annual to quarterly. At the beginning
of 2010, the tax rate was raised to 18 percent and in 2011 from 18 percent to 20 percent.
Simultaneously, yearly interest income below ISK 100 thousand per individual was made tax
exempt and a 30 percent imputed deduction was given against rental income, reducing its
effective tax rate to 14 percent. Also, a specific tax rule was introduced as regards owners of
closely held companies in case of dividend distribution: If the dividend paid exceeded a certain
threshold, then half of the excess amount would be taxed as wages and the other half as a
capital income.
Corporate income tax. At the beginning of 2010, the CIT was raised from 15 percent to
18 percent and again in 2011 from 18 percent to 20 percent. A tax relief system was also
implemented in case of companies with research and innovation expenditures (R&D relief) in the
form of a refundable tax credit. The government also implemented a system of subsidies, some
in the form of various tax concessions. This system is in line with those offered in many countries
within the European Union to small and medium sized companies.

59
Net wealth tax. A new temporary 1.25 percent net wealth tax was implemented in 2010 with a
tax-exempt threshold of ISK 90 million per individual and ISK 120 million per couple. The rate
was raised from 1.25 percent to 1.5 percent at the beginning of 2011, while the thresholds were
lowered from ISK 90/120 million to ISK 75/100 million. At the beginning of the year 2012, a
second tier of 2.25 percent was introduced on net wealth above ISK 150 million per individual
and ISK 200 million per couple.
Inheritance tax. The rate of the inheritance tax was raised from 5 percent to 10 percent at the
beginning of 2011. This was mitigated by introduction of a tax exempt threshold of
ISK 1.5 million of the deceased estate’s net assets.
Social security tax (SST). In mid-2009, the social security tax was raised from 5.34 percent to
7 percent and again at the beginning of 2010 from 7 percent to 8.65 percent. Starting in 2012,
the SST was lowered from 8.65 percent to 7.79 percent, 7.69 percent in 2013, 7.59 percent in
2014 and 7.49 percent in 2015.
Value added tax. The general VAT rate was raised from 24.5 percent to 25.5 percent at the
beginning of the year 2010. In the year 2012, however, the Parliament accepted a government
proposal to raise the VAT rate on hotel accommodation from 7 percent to 14 percent, but the
proposal was abolished before it came into force.
Energy taxes. Three temporary energy taxes were introduced in 2010: First, a carbon tax was
implemented on fossil fuels based on the ETS prices differentiated by type of fuel. Second, a
fixed charge was introduced on electricity based on purchase of kW hours; and third, a charge of
0.2 percent was introduced on the retail price of geothermal water. In 2011, the carbon tax was
raised by 50 percent and again in 2012 by 33 percent, then becoming close to the average ETS
price in each category of fossil fuels which was the original aim. The carbon tax and the charge
on geothermal water were made permanent from the year 2013, but the electricity charge was
extended just to the end of the year 2015.
Bank tax. At the beginning of 2011, a specific tax of 0.041 percent was introduced on the total
liabilities of banks and other regulated lending institutions. The rationale behind this tax was
mainly revenue raising, but it was also an attempt to curb Icelandic banks from taking on
excessive risk. A surcharge of 0.0875 percent was added to the bank tax rate for the years 2012
and 2013, which was supposed to finance government’s payments of specific interest rebates to
households in those years. The old banks and other financial entities under winding-up
procedures were exempt from the bank tax.
Financial activity tax (FAT). A twofold FAT was introduced in 2012, where one part was a
payroll tax of 5.45 percent on total salaries (same basis as social security charges), while the other
part was a tax on profits above ISK 1 billion per year. The FAT was based on the rationale that
only financial entities that were exempt from VAT would be liable to pay FAT. The VAT exemption

60
was in fact the main argument for this new taxation. The payroll tax rate was then raised in 2013
from 5.45 percent to 6.75 percent.
Excises, commodity taxes. During the period in question, excises on fuel, alcohol and tobacco
and also road taxes were increased considerably in excess of the general consumer price index,
especially the excises on tobacco. The commodity tax on sugary product was doubled in
mid-2009 together with a considerable increase of commodity taxes in general. In 2013, a new
commodity tax was introduced on sugary products for both health and revenue raising reasons.
Fisheries resource fees. A comprehensive system based on individual transferable quotas, which
give holders the right to catch a certain share of total allowable catches (TAC) for which holders
pay a fixed fee per kilo of TAC, has been in place since the early 1990s. This system was reformed
in 2012 to ensure that the public benefits from exploitation of the resource. The new fee
structure has two components: a standard fee per kilo of TAC, and second, a special fee designed
to capture the natural resource rent. In the first year, fisheries fee revenue almost tripled from ISK
3.7 billion in 2011 to ISK 9.7 billion in 2012. The current government is overhauling the fisheries
legislation with plans to implement a new system no later than 2016/2017. The 2015 budget
figure for fisheries fees revenues is ISK 7.3 billion.
B. Tax Policy Measures 2013 – 2015
Below is an overview of the main tax measures implemented so far by the current
Progressive/Independent parties government:
VAT and Commodity Tax. The standard VAT rate was lowered from 25.5 percent to 24 percent
from January 1, 2015. At the same time the lower VAT rate was raised from 7 percent to
11 percent. Also, the tax base was broadened for the tourism industry (passenger transport,
except publicly run transport, spas and tourist agencies) from January 1, 2016. Another important
step was that the commodity tax (including the sugar tax) was repealed from January 1, 2015.
The net revenue loss from the VAT and commodity tax reform is estimated around
ISK 4 billion, or 0.2 percent of GDP.
Personal income tax. The first phase of the PIT reform, implemented at the beginning of the
year 2014, was threefold: First, there was a slight transfer of PIT rates between the CG and LG,
bringing the CG lowest PIT rate from 22.9 percent to 22.86 percent. Second, the middle PIT rate
was lowered from 25.8 percent down to 25.3 percent while the top PIT rate was kept unchanged
at 31.8 percent. Third, the income threshold between the first and second bracket of the CG PIT
was raised considerably, from ISK 241.5 thousand to ISK 290 thousand per month.
Also, an important part of the government’s debt relief program was to make the private
pension contributions, both the 4 percent from the employee and the 2 percent from the
employer, tax exempt if used as a down payment of a mortgage giving right to a interest rebate
over the next three year, up to ISK 1.5 million per individual and ISK 2.25 million per couple. First-

61
time home buyers could also apply for this measure, which came into force from mid-2014. Just
recently, the second phase of the government’s PIT reform was announced to be implemented in
the years 2016 and 2017, as discussed in Appendix B.
Bank tax. The government initiated a comprehensive debt relief program in 2014 that came into
full force in the year 2015. This program is financed by base broadening of the bank tax to
include the financial entities in winding-up process, and also with a large increase of the tax rate
from 0.041 percent to 0.376 per cent as of 2014. The third change was an introduction of a debt
threshold of ISK 50 billion as regards the bank tax liability, thus exempting the small financial
entities. In 2014, bank tax revenues amounted to 6.1 percent of the total tax revenues of the CG.
Financial activity tax. In connection with the increased bank tax, the payroll part of the FAT was
lowered from 6.75 percent to 5.5 percent.
Stamp duties. At the beginning of the year 2014, a new simple system of stamp duties was
implemented, replacing the old system of stamp duties that had come to be seen as complex,
burdensome and distortive.
Net wealth tax, electricity charge. Those two taxes will expire as already legislated; the net
wealth tax from the year 2015 and the electricity charge from the year 2016, with a loss of
around 2 percent of the total CG tax revenues.
In all, the tax measures introduced from mid-2013 to 2015 described above are supposed to
increase the CG tax revenues by ISK 26.8 billion, whereof the bank tax reform will lead to an
increase of ISK 37.6 billion, while the other reforms (PIT, VAT, commodity tax, stamp duty reform
and other minor ones) will reduce them by ISK 10.9 billion. If the revenue effects from the
abolition of then net wealth tax and electricity tax are added to the new tax measures, the net
increase is around ISK 12 billion.

62
APPENDIX B. OVERVIEW OF ICELAND’S PIT AND MAJOR MEANS-TESTED BENEFITS
A. PIT Structure
Taxable income. Individuals residing in Iceland are subject to both CG and LG income taxes on
their total earnings. Taxable income includes all kind of income from past and present
employment, business or profession, and capital. All income types of income and benefits
received by the taxpayer are subject to tax, unless they are directly exempted.
Iceland has a dual income tax system similar to that of all the Nordic countries except Denmark.
Taxable income is divided into three main categories.
Category A comprises wages and salaries, including presumptive employment income of
the self-employed, employment-related benefits, old-age pensions, social security
payments, grants, payments to copyright holders, royalties, etc.
Category B comprises income from an independent economic activity (self-employed
individuals), i.e. business income.
Category C comprises capital income such as dividends, interest income, rental income
and capital gains.
Only deductions expressly provided for by law may be deducted from the income of Categories
A and C. Operating losses may only be deducted from income of Category B in the case of a self-
employed individual (sole proprietorship). Income of Category C, capital income, derived by
individuals is taxed separately at a flat rate of 20 percent (capital income tax), while income of
Category A and B is taxed progressively.
Self-employed individuals are subject to the same rules regarding the calculation of taxable
income as apply to companies, but are taxed under the progressive PIT rate rather than the
20 percent corporate income tax rate in the case of a limited liability company or the flat
36 percent rate that applies to partnerships. A self-employed individual is obliged to declare a
minimum presumptive income, prescribed by regulation for different occupations, which is the
basis for social security tax and the mandatory pension contribution.
Allowances and deductions. Employee contributions to pension funds, both the mandatory
part (usually 4 percent) and the voluntary part (maximum 4 percent) of total salary, are
deductible from taxable income. Otherwise, no significant deductions are allowed. With respect
to business income (Category B), expenses incurred for the purpose of obtaining, securing and
maintaining taxable income can generally be deducted. As regards capital income, deduction is
allowed for capital losses only within the same tax year. Interest cost is never deductible from
capital income for individual taxpayers.
Personal tax credits. All individual taxpayers are entitled to a non-refundable personal tax credit
against the evaluated CG PIT and the LG PIT levied on income from categories A and B. This tax
credit amounts to ISK 610,824 for the income year 2015 (assessment year 2016). For married or
jointly taxed cohabiting individuals, the credit not used by one of the spouse may be transferred

63
to the other spouse. If an individual also has to pay a capital income tax he/she can use
20/37 percent of the remaining amount of the personal tax credit against that tax.
Rates. For the income year 2015 (assessment year 2016) the rates of CG PIT are the following:
Of taxable income up to ISK 3,709,680 – 22.86 percent
Of the next ISK 6,327,168 – 25.3 percent
Of taxable income exceeding ISK 10,036,848 – 31.8 percent
In the case of couples or cohabiting individuals, there is a transfer of income from bracket 3 to
bracket 2 by the spouse with higher income if the other spouse doesn’t reach bracket 3. The
transferable amount is half of the difference between the income level of that spouse in
bracket 2 and ISK 6,327,168 per year, the maximum being ISK 3,163,584.
The LG PIT is levied on the same income base as the CG PIT. The average withholding tax rate is
14.44% in 2015, but the rate has a legalized minimum of 12.44 percent and a maximum of
14.48 when finally assessed in the year succeeding the income year. .
In May 2015, the government announced its proposed next steps in the reform of the PIT for
2016 and 2017 (Table 9). The number of rates will be reduced from three to two in two phases as
shown in the table below. The total revenue loss for the full reform is estimated at
ISK 9 - 11 billion.
Capital income (Category C) derived by individuals who are not engaged in business activities
is taxed separately at a flat rate of 20 percent. In the case of dividends and interest, the tax is
withheld at source as a preliminary payment and then credited against the final assessment the
year after. In the case of capital gains as well as rental income, the tax is levied by assessment
Table 9. Government 2015 PIT Reform Proposal
2015 2016 2017
CG rate 1 22.86% 22.68% 22.50%
CG rate 2 2.44% 1.22% 0%
CG rate 3 6.50% 7.90% 9.30%
LG average rate 14.44% 14.44% 14.44%
Total rate 1 37.30% 37.12% 36.94%
Total rate 2 39.74% 38.34% --
Total rate 3 46.24% 46.24% 46.24%
Income thresholds*
Rate 2 309,140 309,140 --
Rate 3 836,404 770,000 700,000
*Monthly figures

64
with a one year lag. The yearly tax-free limit for interest income is ISK 125,000 per individual and
30 percent of individual´s rental income is tax exempt.
Payment of the PIT. The CG PIT and the LG PIT on Category A income are withheld at source
each month during the income year. Individuals deriving business income (Category B) or savings
and investment income (Category C) on which tax is not withheld at source may on their own
initiative pay the difference between the tax to be assessed and the amount already withheld at
source before the end of January following the tax year. Final assessment takes place on the
basis of the tax return by July 31st of the year following the income year. Any difference between
tax withheld and levied income tax of both CG PIT and LG PIT is refunded with a 2.5 percent
credit on the difference; any deficit is collected with a 2.5 percent charge.
B. Child Benefit
Basic rules. Child benefits, which are paid for every child under 18 years of age, are
assessed/evaluated yearly at the same time as the final income tax assessment takes place. The
amount varies depending on whether the custodial parent is single or not. The benefits are
means-tested to total income of the household where the child has a legal residency. Child
benefits are refundable and tax exempt. Expenditures on child benefits are estimated to be
ISK 11 billion in the year 2015 and are supposed to be paid to around 54 thousand households in
that year. Further detail of the CB rules and parameters are given in Chapter III.
C. Housing Benefits
There are two main systems of housing benefits in Iceland: the interest rebate system, which is
the responsibility of the CG, and the rental benefit systems, which is the responsibility of LGs.
Interest Rebates
Basic rules. Individuals who build, renovate or purchase a residence for their personal use and
bear interest expenses, are entitled to a refundable interest rebate. The amount of the rebate is
based on the interest paid of mortgage loans obtained for the purpose of refinancing or
renovating an owner-occupied resident or for the purchase of an owner-occupied residence. The
benefits are means-tested to income and net wealth. Limitations apply to the amount of interest
paid and also to the amount of the interest compensation itself. For more details, see Chapter IV
of this report. In 2014 the total expenditure of interest rebates amounted to ISK 9.5 billion and
was paid to 53,525 households.
At the end of 2010, considerable legislative changes were made to the interest rebate rules to
reduce expenditure growth in the wake of the financial crisis. Another underlying aim was to
focus the benefit on lower income, lower net wealth families. The changes were supposed to be
temporary, valid only for the years 2011- 2012, but they are still in force for the year 2015 (based

65
on 2014 figures). If no political decision is taken on extending those rules as a part of the budget
assumptions for the year 2016, then the old rules will come into force again in 2016. Table 6 in
Chapter IV shows both the preliminary and the permanent rules.
Rental benefits
Basic rules. The LG is responsible for the payment of rental benefits, so rules vary between
municipalities. Total rental benefits paid out in 2015 are estimated at ISK 6.4 billion, whereof the
financing share of the central government will be ISK 4.5 billion, or 70 percent of the total.
1. The current basic rules in the largest municipality, Reykjavik, are as follows: The basis for the
calculation of rent benefits is the monthly amount of rent that the applicant pays for the
rented apartment/house. The maximum amount that each family can get is ISK 50,000 per
month or 50 percent of the rent amount, whichever is lower. Most large municipalities add a
special rental benefit on top of that, so the subsidy can get as high as 75 percent of the total
rent in some cases. In Reykjavik, however, the average rental benefit is around 47 percent of
the total rent, but Reykjavik rental prices are also the highest in Iceland. There is a basic
amount of rent benefits per apartment, or ISK 17,500 per month. If the individual or the
couple renting the apartment have children, the rent benefits are raised by ISK 14,000 per
child one, ISK 8,500 per child two and ISK 5,500 per child three. In addition, the family can
get 15 percent of the rent amount between ISK 20,000-50,000, but all in all the maximum
rent benefit is ISK 50,000 per month.
2. The rent benefits are means tested to both income and net wealth. The formula of the means
test for income is that 0.67 percent of the yearly income above ISK 2.55 million is deducted
from the amount of rent benefits each month. The formula of the means test for net wealth is
that 25 percent of the net wealth of the family at the end of previous year above
ISK 6,927,000 is added to the yearly income and after that the means test for the income
against the rent benefits is recalculated.
3. The statistics around the rental benefit system are unreliable, but a rough estimate shows
that around 15,400 Icelandic households get rental benefits every year. The majority of them
are singles, with or without children. In comparison, 41,933 households got interest rebates
in the year 2014, the total amount paid being ISK 8 billion.