technical data report marine acoustics modelling study 2010
TRANSCRIPT

Technical Data Report
Marine Acoustics Modelling Study 2010
ENBRIDGE NORTHERN GATEWAY PROJECT
JASCO Applied Sciences Victoria, British Columbia
Nicole Chorney, B.Sc. Graham Warner, B.Sc.
Melanie Austin, B.A.Sc.
2010

Marine Acoustics Modelling Study 2010 Technical Data Report Acknowledgements
2010 Page i
Acknowledgements
We thank Robert Kung (Natural Resources Canada, Geological Survey of Canada, Pacific Division) for providing at short notice seabed core data for the Langara site, which were needed for deriving geo-acoustic properties. We acknowledge the editorial assistance of Roberto Racca and Holly Sneddon.


Marine Acoustics Modelling Study 2010 Technical Data Report Table of Contents
2010 Page iii
Table of Contents
1 Introduction .................................................................................................... 1-1 2 Methods ......................................................................................................... 2-1
2.1 Propagation Loss Model ................................................................................... 2-1 2.2 Acoustic Source Levels .................................................................................... 2-1
2.2.1 Tanker Underway (VLCC Surrogate) ............................................................ 2-2 2.2.2 ASD Escort Tug ............................................................................................. 2-2
2.3 Acoustic Environment ...................................................................................... 2-3 2.3.1 Bathymetry ..................................................................................................... 2-3 2.3.2 Underwater Sound Speed ............................................................................. 2-3 2.3.3 Seabed Geo-acoustics .................................................................................. 2-5
3 Model Scenarios and Results ......................................................................... 3-1 3.1 Scenario 1: Transiting Tanker at Langara ......................................................... 3-1 3.2 Scenario 2: Transiting Tanker at Cape St. James ............................................. 3-1 3.3 Scenario 3: Transiting Tanker and Escort Tug at Triple Island .......................... 3-6 3.4 Scenario 4: Transiting Tanker and Escort Tug at Browning Entrance ............... 3-9
4 Summary ........................................................................................................ 4-1 5 References ..................................................................................................... 5-1
List of Tables
Table 1 Location and Sound Sources for Each Model Scenario .......................... 2-1Table 2 Seabed Geo-Acoustic Profile for Scenario 1 at the Langara Site ........... 2-5Table 3 Seabed Geo-Acoustic Profile for Scenario 2 at the Cape St. James
Site ......................................................................................................... 2-6Table 4 Seabed Geo-Acoustic Profile for Scenarios 3 and 4 at the Triple
Island and Browning Entrance Sites ....................................................... 2-6Table 5 95% Radius to a Threshold Level of 120 dB re 1 µPa for Each
Model Scenario ...................................................................................... 4-1
List of Figures
Figure 1 Langara, Triple Island, Browning Entrance and Cape St. James Modelling Locations ................................................................................ 1-1
Figure 2 Third-Octave Band Source Levels for a Tanker and an ASD Escort Tug ......................................................................................................... 2-2
Figure 3 ASD Escort Tugs Katun and Britoil 51 .................................................... 2-3Figure 4 Modelling Scenarios 1 and 2 at the Langara and Cape St. James
Sites ....................................................................................................... 2-4Figure 5 Modelling Scenario 3 at the Triple Island Site ......................................... 2-4
Marine Acoustics Modelling Study 2010 Technical Data Report Table of Contents
Page iv 2010
Figure 6 Modelling Scenario 4 at the Browning Entrance Site ............................... 2-5 Figure 7 Scenario 1: Transiting Tanker at Langara ............................................... 3-2 Figure 8 Scenario 1: Transiting Tanker at Langara - Larger Scale View ............... 3-3 Figure 9 Scenario 2: Transiting Tanker at Cape St. James ................................... 3-4 Figure 10 Scenario 2: Transiting Tanker at Cape St. James - Larger Scale
View ........................................................................................................ 3-5 Figure 11 Relative Vessel Positions for Scenario 3 at the Triple Island Site ........... 3-6 Figure 12 Scenario 3: Transiting Tanker and Escort Tug at Triple Island ................ 3-7 Figure 13 Scenario 3: Transiting Tanker and Escort Tug at Triple Island -
Larger Scale View ................................................................................... 3-8 Figure 14 Relative Vessel Positions for Scenario 4 at the Browning Entrance
Site .......................................................................................................... 3-9 Figure 15 Scenario 4: Transiting Tanker and Escort Tug at Browning Entrance ... 3-10 Figure 16 Scenario 4: Transiting Tanker and Escort Tug at Browning Entrance
- Larger Scale View ............................................................................... 3-11

Marine Acoustics Modelling Study 2010 Technical Data Report Glossary
2010 Page v
Glossary
Acoustic pressure The deviation from the ambient hydrostatic pressure caused by a sound wave. Measured in Pa, μPa or bars (1 Pa = 106µPa = 10-5 bar).
Audiogram A curve of hearing threshold (sound pressure level, measured in decibels) as a function of frequency that describes the hearing sensitivity of an animal over its normal hearing range.
Audiogram weighting The process of combining an animal’s audiogram and sound pressure levels to determine the sound pressure levels above the animal’s hearing threshold.
Azimuth Stern Drive (ASD) escort tug
A tug with propellers mounted on pivots that can be rotated to face any azimuthal (horizontal) direction. ASD vessels usually have better manoeuvrability than vessels with fixed propellers and rudder systems.
Bathymetry Measurements of underwater depths
Broadband level The total sound pressure level over a specified frequency range. It is calculated by summing the acoustic pressures in small frequency bands and converting to sound pressure level.
Ensonified Filled with sound
Geo-acoustic Relating to the acoustic properties of the seabed.
Hydrostatic pressure The pressure, at any given depth in a static liquid, from the weight of the liquid plus any additional force acting on the surface. Measured in Pa, μPa or bars (1 Pa = 106µPa = 10-5 bar).
Propagation loss The reduction in sound level with distance from an acoustic source, subject to the influence of the surrounding environment. Measured in dB.
Seabed piston-core data Data from seabed sediment samples collected by a piston corer. A piston corer is a hollow cylinder with a weight above that is lowered to the seabed. The hollow cylinder plunges into the seabed and fills with undisturbed sediment. The core is then brought to the surface and the sediment extracted. A piston inside the cylinder allows the collection of long samples.
Sound pressure level (SPL) The logarithmic ratio of acoustic pressure to a reference pressure, typically 1 μPa (expressed as dB re 1 μPa), multiplied by 20:
( )refPPSPL /log20 10=

Marine Acoustics Modelling Study 2010 Technical Data Report Glossary
Page vi 2010
Source level The sound level referenced to 1 m from a point source. For sources that are physically larger than a few cm (ship propellers, for example), the spectrum is measured at some range, and a sound propagation model applied to correct it to 1 m from a point source. Vessel source levels are expressed in dB re1μPa at 1 m.
1/3-Octave band levels Frequency-resolved pressure or energy levels in frequency bands that are 1/3 of an octave wide (where an octave is a doubling of frequency).

Marine Acoustics Modelling Study 2010 Technical Data Report Section 1: Introduction
2010 Page 1-1
1 Introduction This report presents the results of underwater acoustic modelling carried out by JASCO Applied Sciences (JASCO) to predict the extent of ensonification produced by vessel traffic transiting to and from the Enbridge Northern Gateway Project’s marine terminal near Kitimat, British Columbia. This study follows the Marine Acoustics (2006) Technical Data Report (TDR; Austin et al. 2006), which uses the same acoustic model at four new locations. The model results are similarly presented; however, this report does not include audiogram weighting.
JASCO’s Marine Operations Noise Model (MONM) was used to predict broadband underwater sound level distributions resulting from a transiting very large crude carrier (VLCC), with and without an azimuth stern drive (ASD) escort tug. Sound source levels were unavailable for a VLCC; therefore, a large tanker was used, as in Marine Acoustics (2006) TDR.
Sound level distributions from a tanker transiting at 16 knots and an escort tug at full speed were modelled in four scenarios (see Figure 1). The four modelled locations are Langara, Triple Island, Browning Entrance and Cape St. James. The modelling areas are 80 km by 80 km square grids projected in Universal Transverse Mercator (UTM) Zone 9N. The model results for each scenario are presented as sound level contour maps at a standard depth of 20 m, and the radius to the 120 dB re 1 µPa sound level threshold is given.
Figure 1 Langara, Triple Island, Browning Entrance and Cape St. James Modelling Locations


Marine Acoustics Modelling Study 2010 Technical Data Report Section 2: Methods
2010 Page 2-1
2 Methods
2.1 Propagation Loss Model Four scenarios were modelled along proposed tanker shipping routes. The locations and sound sources for each are listed in Table 1. This study used JASCO’s MONM, which was also used in the Marine Acoustics (2006) TDR. To model underwater sound propagation loss, MONM incorporates the following site-specific environmental properties (see Section 2.3):
• bathymetric grids of the modelling area • underwater sound speed as a function of depth • geo-acoustic profiles based on the stratified composition of the seafloor
Table 1 Location and Sound Sources for Each Model Scenario
Scenario Site Latitude Longitude Vessel Sound
Sources 1 Langara 54° 19' 07.01" N 133° 01' 09.16" W Tanker
2 Cape St. James 51° 40' 30.91" N 130° 40' 53.34" W Tanker
3 Triple Island 54° 18' 27.71" N 131° 04' 17.10" W Tanker, Escort tug
4 Browning Entrance 53° 41' 51.83" N 130° 40' 08.05" W Tanker, Escort tug
Sound propagation loss is computed over a range of frequencies and is combined with the frequency specific sound source levels to yield a grid of received levels.
Underwater sound propagation was modelled at the centre frequencies of consecutive 1/3-octave bands between 20 Hz and 5 kHz. At each frequency, the sound was propagated in range and depth over a fan of radial lines, yielding a spatial grid of received levels to a range of at least 40 km from the source. The resulting 1/3-octave band levels were summed to obtain broadband (20 Hz to 5 kHz) levels within the modelling volume; these were then sampled at a standard depth of 20 m (or at the seafloor if shallower) at each planar grid location and are presented as single-depth sound level contours.
For each model scenario, the 95% radius for a threshold level of 120 dB re 1 µPa was computed. This quantity is defined as the radius of the circle centred at the source that contains 95% of the area ensonified above 120 dB re 1 µPa. The 95% radii are given in each set of results (see Section 3) and consolidated in the Summary (see Section 4, Table 5).
2.2 Acoustic Source Levels Underwater noise levels were modelled using sound source levels from the same tanker and ASD escort tug that were used for vessel surrogates in the Marine Acoustics (2006) TDR, but transiting at full speed instead of the reduced levels.

Marine Acoustics Modelling Study 2010 Technical Data Report Section 2: Methods
Page 2-2 2010
2.2.1 Tanker Underway (VLCC Surrogate) Sound source levels were unavailable for a VLCC; therefore, a large tanker acted as surrogate. See Figure 2 for the third-octave band sound source levels, which (at 1 m) were published for a large tanker transiting at 16 knots (Malme et al. 1989, Internet site), derived from measurements of an 800-ft (244 m) oil tanker (Cybulski 1977) and vessel class averages (Heine and Gray 1977).
These surrogate source levels are conservative estimates of potential noise levels of vessel transits since vessels would likely transit at 14 to 15 knots near the modelled sites.
Figure 2 Third-Octave Band Source Levels for a Tanker and an ASD Escort Tug
2.2.2 ASD Escort Tug Third-octave source levels for a generic 10,000 HP escort tug (see Figure 2) were calculated by averaging the measured source levels of two large ASD tugs. The third-octave band source levels used here were from the Katun (Femco Management Ltd. 2010, Internet site) and the Britoil 51 (Britoil Offshore Services Ltd. 2010, Internet site) travelling at full speed (Hannay et al. 2004). The Katun is a 67.6 m long, ASD, assist and anchor-handling tug, built in 1983, with a 10,560 BHP main engine (see Figure 3); the Britoil 51 is a 45 m long, ASD, ocean-going anchor-handling tug, built in 2003, with a 6,600 BHP main engine (see Figure 3). Measured broadband source levels were 190.3 and 202.7 dB re 1 µPa at 1 m for the Katun and Britoil 51, respectively.

Marine Acoustics Modelling Study 2010 Technical Data Report Section 2: Methods
2010 Page 2-3
Katun Britoil 51
Figure 3 ASD Escort Tugs Katun and Britoil 51
2.3 Acoustic Environment
2.3.1 Bathymetry
Bathymetry data for the open water sites, Langara and Cape St. James, were obtained from the Global Integrated Topo/ Bathymetry Grid dataset (Lindquist et al. 2004, Internet site). These data consist of topography and bathymetry information from three publicly available gridded datasets, sampled and merged into identically registered 30-s latitude/longitude grids. Latitude/longitude point bathymetry data for each modelling area were converted to Universal Transverse Mercator (UTM) Zone 9N coordinates and interpolated onto a regular x/y grid with 200-m resolution.
Bathymetry data encompassing the Triple Island and Browning Entrance sites were obtained from the Canadian Hydrographical Service, consisting of ocean depth by latitude and longitude. These have been similarly converted to UTM Zone 9N coordinates and resampled with 100-m resolution (MacGillivray 2006).
2.3.2 Underwater Sound Speed
Underwater sound speed as a function of depth was derived for each modelling site from temperature and salinity profiles using an empirical formula (Brekhovskikh and Lysanov 2003). Vertical profiles of water temperature and salinity were obtained from a catalogue of conductivity-temperature-depth (CTD) profiles measured between January 1986 and February 2008 (DFO 2008, Internet site). Profiles from the North Coast Region encompassed the modelling locations, and those for autumn (September 1 to November 30) conditions were used for consistency with the Marine Acoustic (2006) TDR.
The sound speed profile used for Scenarios 1 and 2, at the Langara and Cape St. James sites (see Figure 4), was derived from the DFO temperature and salinity data (DFO 2008, Internet site) from the Offshore Subarea. The sound speed profiles used for Scenarios 3 and 4, at Triple Island (see Figure 5) and Browning Entrance (see Figure 6) were derived from the DFO data from the Dixon Entrance and Hecate Strait Subareas (DFO 2008, Internet site), respectively.

Marine Acoustics Modelling Study 2010 Technical Data Report Section 2: Methods
Page 2-4 2010
The maximum water depth within the Browning Entrance modelling area exceeded the range of available temperature and salinity data, so these profiles were extended from 245 m to 400 m depth (indicated in blue in Figure 6). Ocean temperature was extrapolated from the deepest available data point (5.5°C at 245 m), assuming a linear decrease to 5.0°C at 400 m, and ocean salinity was extended using a constant slope equal to that between the two deepest data points (230 and 245 m) (DFO 2008, Internet site).
Figure 4 Modelling Scenarios 1 and 2 at the Langara and Cape St. James Sites
Figure 5 Modelling Scenario 3 at the Triple Island Site

Marine Acoustics Modelling Study 2010 Technical Data Report Section 2: Methods
2010 Page 2-5
Figure 6 Modelling Scenario 4 at the Browning Entrance Site
2.3.3 Seabed Geo-acoustics The seabed geo-acoustic profiles were obtained from a combination of well logs and profiles from previous modelling studies. The uppermost 4 m of the geo-acoustic profile for the Langara site was based on seabed piston-core data provided by Natural Resources Canada (2009). The geo-acoustic parameters associated with each sediment type in the core data were derived according to methods described by Hamilton (1980). Below 4 m, an acoustic basement having geo-acoustic properties of bedrock (Bornhold and Barrie 1991) was assumed. The geo-acoustic profile that was used for modelling at the Langara site is given in Table 2.
Table 2 Seabed Geo-Acoustic Profile for Scenario 1 at the Langara Site
Material
Depth (m)
Compressional Speed (m/s)
Density (g/cm3)
Compressional Attenuation
(dB/λ)
Shear Speed (m/s)
Shear Attenuation
(dB/λ) Coarse sand 0 1789.5 2.0 0.85 230.0 1.0
1 1790.5 2.0 0.85
Sand-silt-clay 1 1539.2 1.6 0.18
4 1543.2 1.6 0.18
Bedrock 4 2200.0 2.2 0.10
100 2298.4 2.2 0.10
200 2421.4 2.2 0.10

Marine Acoustics Modelling Study 2010 Technical Data Report Section 2: Methods
Page 2-6 2010
The profiles for the Cape St. James, Triple Island and Browning Entrance sites were obtained from a geo-acoustic database of Hecate Strait (MacGillivray 2006). The Cape St. James site lies within Province V of that database, characterized by glacial till deposited atop consolidated Tertiary sediments (see Table 3). The Triple Island and Browning Entrance sites lie within Province IV, characterized by sand and gravel surface deposits (see Table 4).
Table 3 Seabed Geo-Acoustic Profile for Scenario 2 at the Cape St. James Site
Material
Depth (m)
Compressional Speed (m/s)
Density (g/cm3)
Compressional Attenuation
(dB/λ)
Shear Speed (m/s)
Shear Attenuation
(dB/λ) Till 0 1603.8 1.771 0.160 380 1.82
5 1609.9 1.771 0.161
10 1616.1 1.771 0.162
12 1618.5 1.771 0.162
15 1622.2 1.771 0.162
Bedrock 15 2200.0 2.200 0.100
500 2796.6 2.200 0.100
Table 4 Seabed Geo-Acoustic Profile for Scenarios 3 and 4 at the Triple Island and Browning Entrance Sites
Material
Depth (m)
Compressional Speed (m/s)
Density (g/cm3)
Compressional Attenuation
(dB/λ)
Shear Speed (m/s)
Shear Attenuation
(dB/λ) Sand 0 1700.3 1.941 0.425 70 0.90
3 1728.6 1.941 0.432
8 1754.2 1.941 0.439
15 1770.8 1.941 0.443
20 1778.5 1.941 0.445
Bedrock 20 2200.0 2.200 0.100
100 2298.4 2.200 0.100

Marine Acoustics Modelling Study 2010 Technical Data Report Section 3: Model Scenarios and Results
2010 Page 3-1
3 Model Scenarios and Results Two sound level contour maps, of differing scales, are presented for each modelled scenario. Sharp edges of sound level contours either indicate the boundaries of the modelled area, or are artefacts of the angular resolution of the model grid.
3.1 Scenario 1: Transiting Tanker at Langara The isopleths of underwater sound levels produced by a tanker transiting at 16 knots was modelled north of Langara Island in Dixon Entrance (see Figure 7). Levels are unweighted, broadband (20 Hz to 5 kHz) sound pressure in decibels referenced to 1 μPa, at 20 m depth (or at the seabed if shallower). Note that the bathymetric contours with depths in metres are shown in grey.
The results at small and large scales (see Figures 7 and 8, respectively) show increased sound attenuation by shallower regions to the south (coastal area) and north of the source. The 95% radius to a threshold level of 120 dB re 1 µPa is 6.7 km from the tanker location.
3.2 Scenario 2: Transiting Tanker at Cape St. James The isopleths of underwater sound levels produced by a tanker transiting at 16 knots was modelled south of Cape St. James in the Queen Charlotte Basin (see Figure 9). Levels are unweighted, broadband (20 Hz to 5 kHz) sound pressure in decibels referenced to 1 μPa, at 20 m depth (or at the seabed if shallower). Note that bathymetric contours with depths in metres are shown in grey.
The results at two different scales are shown in Figures 9 and 10. The 95% radius to a threshold level of 120 dB re 1 µPa is 8.0 km from the tanker location.

Marine Acoustics Modelling Study 2010 Technical Data Report Section 3: Model Scenarios and Results
Page 3-2 2010
Figure 7 Scenario 1: Transiting Tanker at Langara

Marine Acoustics Modelling Study 2010 Technical Data Report Section 3: Model Scenarios and Results
2010 Page 3-3
Figure 8 Scenario 1: Transiting Tanker at Langara - Larger Scale View

Marine Acoustics Modelling Study 2010 Technical Data Report Section 3: Model Scenarios and Results
Page 3-4 2010
Figure 9 Scenario 2: Transiting Tanker at Cape St. James

Marine Acoustics Modelling Study 2010 Technical Data Report Section 3: Model Scenarios and Results
2010 Page 3-5
Figure 10 Scenario 2: Transiting Tanker at Cape St. James - Larger Scale View
Marine Acoustics Modelling Study 2010 Technical Data Report Section 3: Model Scenarios and Results
Page 3-6 2010
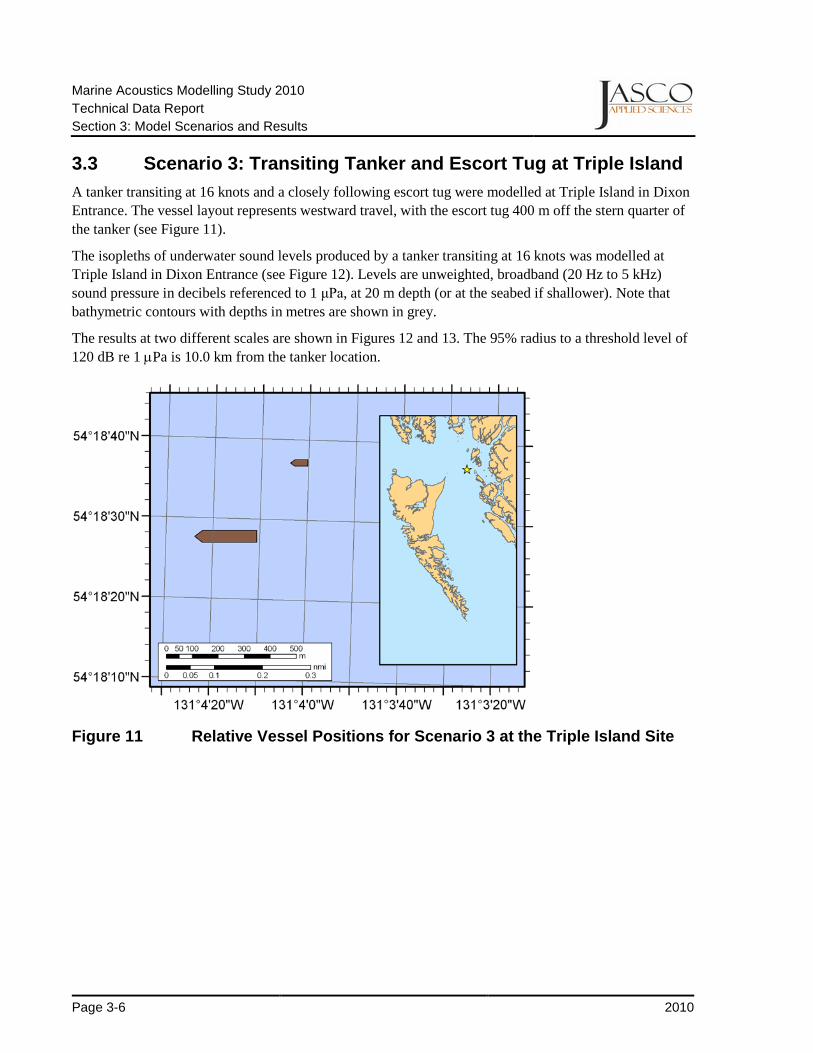
3.3 Scenario 3: Transiting Tanker and Escort Tug at Triple Island A tanker transiting at 16 knots and a closely following escort tug were modelled at Triple Island in Dixon Entrance. The vessel layout represents westward travel, with the escort tug 400 m off the stern quarter of the tanker (see Figure 11).
The isopleths of underwater sound levels produced by a tanker transiting at 16 knots was modelled at Triple Island in Dixon Entrance (see Figure 12). Levels are unweighted, broadband (20 Hz to 5 kHz) sound pressure in decibels referenced to 1 μPa, at 20 m depth (or at the seabed if shallower). Note that bathymetric contours with depths in metres are shown in grey.
The results at two different scales are shown in Figures 12 and 13. The 95% radius to a threshold level of 120 dB re 1 µPa is 10.0 km from the tanker location.
Figure 11 Relative Vessel Positions for Scenario 3 at the Triple Island Site

Marine Acoustics Modelling Study 2010 Technical Data Report Section 3: Model Scenarios and Results
2010 Page 3-7
Figure 12 Scenario 3: Transiting Tanker and Escort Tug at Triple Island

Marine Acoustics Modelling Study 2010 Technical Data Report Section 3: Model Scenarios and Results
Page 3-8 2010
Figure 13 Scenario 3: Transiting Tanker and Escort Tug at Triple Island - Larger Scale View
Marine Acoustics Modelling Study 2010 Technical Data Report Section 3: Model Scenarios and Results
2010 Page 3-9
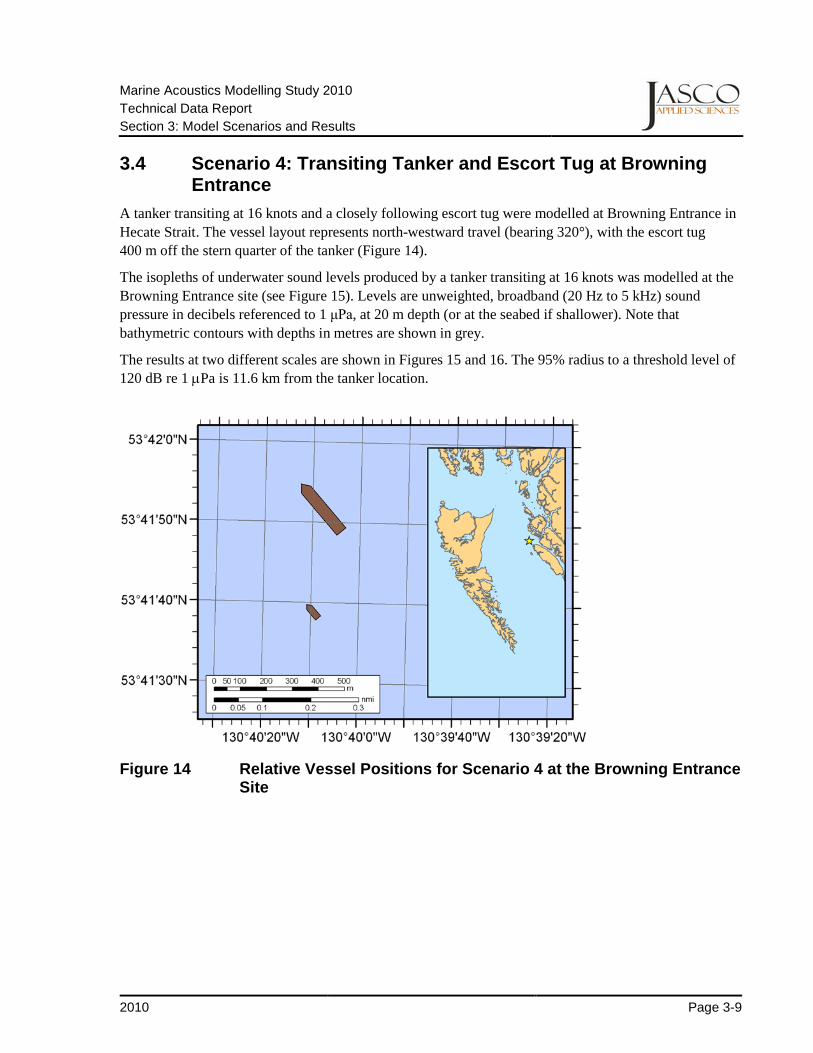
3.4 Scenario 4: Transiting Tanker and Escort Tug at Browning Entrance
A tanker transiting at 16 knots and a closely following escort tug were modelled at Browning Entrance in Hecate Strait. The vessel layout represents north-westward travel (bearing 320°), with the escort tug 400 m off the stern quarter of the tanker (Figure 14).
The isopleths of underwater sound levels produced by a tanker transiting at 16 knots was modelled at the Browning Entrance site (see Figure 15). Levels are unweighted, broadband (20 Hz to 5 kHz) sound pressure in decibels referenced to 1 μPa, at 20 m depth (or at the seabed if shallower). Note that bathymetric contours with depths in metres are shown in grey.
The results at two different scales are shown in Figures 15 and 16. The 95% radius to a threshold level of 120 dB re 1 µPa is 11.6 km from the tanker location.
Figure 14 Relative Vessel Positions for Scenario 4 at the Browning Entrance Site

Marine Acoustics Modelling Study 2010 Technical Data Report Section 3: Model Scenarios and Results
Page 3-10 2010
Figure 15 Scenario 4: Transiting Tanker and Escort Tug at Browning Entrance

Marine Acoustics Modelling Study 2010 Technical Data Report Section 3: Model Scenarios and Results
2010 Page 3-11
Figure 16 Scenario 4: Transiting Tanker and Escort Tug at Browning Entrance - Larger Scale View


Marine Acoustics Modelling Study 2010 Technical Data Report Section 4: Summary
2010 Page 4-1
4 Summary JASCO’s MONM underwater acoustic propagation model was used to model 1/3-octave frequency bands from 20 Hz to 5 kHz and sample at a standard depth of 20 m (or at the seabed if shallower). Broadband received sound levels were determined by summing the 1/3-octave band levels and are presented as isopleth contours over each 80 km by 80 km modelled area.
Four scenarios were modelled along proposed vessel transit routes: Langara and Triple Island in Dixon Entrance, Browning Entrance in Hecate Strait, and Cape St. James in the Queen Charlotte Basin. Each scenario consisted of a tanker (VLCC surrogate) transiting at 16 knots, and Scenarios 3 and 4 (Triple Island and Browning Entrance, respectively) also included a closely following ASD escort tug. Acoustic source levels were of the same vessel surrogates modelled in the Marine Acoustic (2006) TDR, but transiting in open water at full speed instead of reduced speed. Underwater sound level maps for each scenario are presented in Figures 7 to 10, 12, 13, 15 and 16. Table 5 below lists the 95% radius to a threshold level of 120 dB re 1 µPa (radius of circle containing 95% of the area ensonified above 120 dB re 1 µPa) for each model scenario.
Table 5 95% Radius to a Threshold Level of 120 dB re 1 µPa for Each Model Scenario
Scenario Site Vessel Sound Sources 95% Radius (km)
To 120 Db Re 1 µpa 1 Langara Tanker 6.7
2 Cape St. James Tanker 8.0
3 Triple Island Tanker, Escort tug 10.0
4 Browning Entrance Tanker, Escort tug 11.6


Marine Acoustics Modelling Study 2010 Technical Data Report Section 5: References
2010 Page 5-1
5 References Austin, M., A. MacGillivray, D. Hannay, and M. Zykov. 2006. Gateway Environmental Management:
Marine Acoustics Study. Technical report prepared for Jacques Whitford Ltd. by JASCO Research Ltd., September 2006.
Bornhold, B.D. and J.V. Barrie. 1991. Surficial sediments on the western Canadian continental shelf. Continental Shelf Research 11:685-699.
Brekhovskikh, L.M. and Y.P. Lysanov. 2003. Fundamentals of Ocean Acoustics, 3rd Edn. Springer-Verlag. New York, NY.
Britoil Offshore Services Pte. Ltd. 2010. Image acquired from Britoil Offshore Services Pte. Ltd.: Vessel Specifications—Britoil 50/51. http://www.britoil.com.sg/britoil50.htm
Cybulski, J. 1977. Probable Origin of Measured Supertanker Radiated Noise Spectra. p. 15C-1-15C-8 In: Oceans 77 Conference Record, Vol. 1, Marine Tech. Soc., Washington, DC. Cited in Malme, C.I., P.R. Miles, G.W. Miller, W.J. Richardson, D.G. Roseneau, D.H. Thomson, and C.R. Greene Jr. 1989. Analysis and Ranking of the Acoustic Disturbance Potential of Petroleum Industry Activities and Other Sources of Noise in the Environment of Marine Mammals in Alaska. OCS Study MMS 89-0006. Report No. 6945 prepared for U.S. Minerals Management Service, Alaska OCS Region by BBN Systems and Technologies Corp. pp 130-132. http://www.mms.gov/alaska/reports/1980rpts/akpubs80s.HTM
Department of Fisheries and Oceans Canada. 2008. Range Profiles. Data retrieved from Ocean Sciences Data (IOS/OSD) archive. http://www.pac.dfo-mpo.gc.ca/sci/osap/data/SearchTools/rangeprofiles_e.htm
Femco Management Ltd. 2010. Image acquired from Femco-Management: Fleet— AHTS Katun. http://www.femco.ru/?what=fleet-item&id=2
Hamilton, E. 1980. Geo-acoustic modeling of the sea floor. J. Acoust. Soc. Am. 68:1313-1340.
Hannay, D., A. MacGillivray, M. Laurinolli, and R. Racca. 2004. Sakhalin Energy: Source Level Measurements from 2004 Acoustics Program, Ver. 1.5. Technical report prepared for Sakhalin Energy by JASCO Research Ltd., December 2004.
Heine, J.C. and L.M. Gray. 1977. Merchant Ship Radiated Noise Model. BBN Report No. 3020 (Rev. 1) prepared for Naval Oceans Systems Center by Bolt Beranek and Newman Inc. 48 p. Cited in Malme, C.I., P.R. Miles, G.W. Miller, W.J. Richardson, D.G. Roseneau, D.H. Thomson, and C.R. Greene Jr. 1989. Analysis and Ranking of the Acoustic Disturbance Potential of Petroleum Industry Activities and Other Sources of Noise in the Environment of Marine Mammals in Alaska. OCS Study MMS 89-0006. Report No. 6945 prepared for U.S. Minerals Management Service, Alaska OCS Region by BBN Systems and Technologies Corp. pp 130-132. http://www.mms.gov/alaska/reports/1980rpts/akpubs80s.HTM

Marine Acoustics Modelling Study 2010 Technical Data Report Section 5: References
Page 5-2 2010
Lindquist, K.G., K. Engle, D. Stahlke, and E. Price. 2004. Global Topography and Bathymetry Grid Improves Research Efforts, Eos Trans. AGU, 85(19), doi:10.1029/2004EO190003. Data retrieved from Geographic Information Network of Alaska (GINA). http://www.gina.alaska.edu/data/global-gridded/
MacGillivray, A.O. 2006. An Acoustic Modelling Study of Seismic Airgun Noise in Queen Charlotte Basin. M.Sc. Thesis, University of Victoria, 98 p.
Malme, C.I., P.R. Miles, G.W. Miller, W.J. Richardson, D.G. Roseneau, D.H. Thomson, and C.R. Greene Jr. 1989. Analysis and Ranking of the Acoustic Disturbance Potential of Petroleum Industry Activities and Other Sources of Noise in the Environment of Marine Mammals in Alaska. OCS Study MMS 89-0006. Report No. 6945 prepared for U.S. Minerals Management Service, Alaska OCS Region by BBN Systems and Technologies Corp. 304 p. http://www.mms.gov/alaska/reports/1980rpts/akpubs80s.HTM
Natural Resources Canada. 2009. Core locations and composition profiles provided by Natural Resources Canada, Geological Survey of Canada (Pacific Division).