technical documentation – volume four future data collection
TRANSCRIPT

City of Raleigh Climate/Energy Action Plan
November 2012
Technical Documentation – Volume FourFuture Data Collection Tool
1
T E C H N I C A L M E M O R A N D U M
City of Raleigh Operations Data Collection Framework – Data Needs and Emissions Quantification Assessment
PREPARED FOR: City of Raleigh, Office of Sustainability
PREPARED BY: CH2M HILL
DATE: October 2, 2012
During the CEAP development, it was observed that some City of Raleigh operations gather information internally that can be used to calculate energy efficiency and greenhouse gas emissions, but this information was not typically available in a format needed to be most useful for performing the calculations, primarily because it is not being gathered for that specific purpose. It is critical that the Office of Sustainability obtain the information needed to clearly track, document and report advances in energy efficiency and reductions in GHG emissions as strategies are implemented. This information must be gathered and reported in a uniform manner to ensure its integrity and that values will be comparable to each other over time. The purpose of this memorandum is to:
Summarize the fundamental data needed to prepare the City of Raleigh greenhouse gas (GHG) emissions inventory consistently over time;
Recommend several frameworks for collecting the requisite data and quantifying the resulting emissions;
List other City of Raleigh operations that should be considered for inclusion in the GHG inventory in order to yield a comprehensive inventory; and
Define specific parameters that must be measured in order to track, document and report advances in energy efficiency
1.0 Greenhouse Gas Emissions Quantification Assessment The City of Raleigh’s fiscal year (FY) 2007 and 2010 GHG emissions inventories included the following City operations:
1. Vehicle Fleet Services under the Department of Public Works
2. Buildings under the management of the Buildings Superintendent
3. Raleigh Convention Center.
4. Raleigh Transit Facility under the Department of Public Works
5. Solid Waste Services Department
6. Water/Wastewater Operations under the Department of Public Utilities
The GHG emission source categories listed below were included in the inventories:
1. Stationary combustion of fossil fuels
2. Mobile combustion of fossil fuels
3. Process-related source
4. Fugitive emission sources
5. Electricity Usage

CITY OF RALEIGH OPERATIONS DATA COLLECTION FRAMEWORK – DATA NEEDS AND EMISSIONS QUANTIFICATION ASSESSMENT
2
A list aligning the emission source categories with the various City operations is provided in Exhibit 1.
EXHIBIT 1 Emission Sources Categorized by City Operation
City Operation Emission Source Category
Vehicle Fleet Services Mobile Combustion
Buildings
Stationary Combustion
Fugitive Emissions
Electricity Usage
Raleigh Convention Center
Stationary Combustion
Fugitive Emissions
Electricity Usage
Raleigh Transit Facility
Stationary Combustion
Mobile Combustion
Fugitive Emissions
Electricity Usage
Solid Waste Services Department
Stationary Combustion
Mobile Combustion
Process-Related
Electricity Usage
Water/Wastewater Operations
Stationary Combustion
Mobile Combustion
Process-Related
Fugitive Emissions
Electricity Usage
The specific data needed to accurately calculate GHG emissions from these source categories are detailed in the sections that follow.
1.1 Stationary Combustion Stationary combustion emissions result from the combustion of fossil-based fuels (e.g. coal, natural gas, propane, etc.) using equipment in a fixed location. Such pieces of equipment include boilers, heaters, incinerators, and generators in offices, schools, and operations. Heaters within homes and operations equipment for industrial businesses within the community are also stationary combustion sources and are included as part of the Community-based GHG inventory.
The most accurate data to be collected for this source category is measured data. Meter readings from gauges located at the specific pieces of equipment are the primary data source as they provide individual fuel usage. A secondary data source would be gauges on tanks that supply fuel to the specific pieces of equipment and/or a meter on a pipeline supplying fuel to an entire building and/or facility. These bulk fuel usage records provide overall fuel usage, but may also include fuel loss to line leaks or other sources. The data required for assessing stationary combustion source emissions consists of the following:
Fuel type
Annual fuel usage, by fuel type
Number of combustion units included, if grouped, by fuel type
Fuel heat content and/or carbon content, if measured, by fuel type

CITY OF RALEIGH OPERATIONS DATA COLLECTION FRAMEWORK – DATA NEEDS AND EMISSIONS QUANTIFICATION ASSESSMENT
3
If fuel usage data are not known, two additional pieces of data can be collected to determine total usage: 1) design heat rating and 2) maximum run time.
1.2 Mobile Combustion Mobile combustion emissions result from the combustion of fossil-based fuels in transportation sources both on- and off-road. These sources include owned and leased passenger fleet vehicles, trucks, heavy equipment, engines for marine vessels, and construction and maintenance vehicles. Mobile sources within the community (e.g. passenger vehicles, light and heavy trucks used for commuting and/or material transport) also fall within this category and are included as part of the Community-based GHG emissions inventory.
City-Owned Vehicles
As with stationary combustion sources, metered/measured data are the most accurate data. Fuel used and/or miles traveled obtained for individual mobile sources is the primary data source as it allows emissions to be determined per vehicle and/or piece of equipment. Secondary data would be obtained from fuel tank dispensing records and/or pump gauges that dispense fuel. These sources are not always accurate as fuel may be dispensed and used in other sources and/or not used during the year. The required data for quantifying emissions from mobile combustion sources includes the following:
Vehicle make
Vehicle manufacture year
Fuel type
Annual fuel usage, by fuel type
Annual vehicle miles traveled
If fuel usage data are not known for construction and maintenance equipment, hours of operation data can be used to determine the total annual usage based upon the equipments energy output capacity. Vehicle fuel economy and miles traveled data can also be used to determine annual fuel usage. Conversely, if miles traveled data are not known, fuel usage and vehicle fuel economy can be used to estimate annual mileage.
Community Transportation
For Community-based mobile combustion sources, the following data are needed:
Vehicle category (e.g. car, truck, motorcycle, etc.)
Average annual speed, by vehicle type
Annual vehicle miles traveled (VMT)
Average annual meteorological data
These data are generally provided by the regional transportation planning commission and/or regional air quality commission. The data are then input into transportation modeling software to determine GHG emissions.
Contracted Services
Other mobile combustion source emissions result from activities over which the City exerts significant control or influence, but do not own. The major source of these emissions is contracted transportation services such as solid waste collection, solid waste transport, and solid waste disposal at a landfill outside of the City. Mobile source emissions would be generated from equipment and vehicles operated by contracted businesses performing services for the City.
As previously stated for mobile combustion sources, the most accurate data needed for evaluating emissions is directly measured fuel usage and miles traveled data. This data could be obtained from contractor log books. A

CITY OF RALEIGH OPERATIONS DATA COLLECTION FRAMEWORK – DATA NEEDS AND EMISSIONS QUANTIFICATION ASSESSMENT
4
secondary source of data would be to obtain the departure and arrival city locations to determine total miles traveled. The required data for quantifying emissions for contracted mobile combustion sources includes the following:
Vehicle make
Vehicle manufacture year
Fuel type
Annual fuel usage, by fuel type
Annual vehicle miles traveled
Vehicle fuel economy and miles traveled data can also be used to determine annual fuel usage, if not known. Conversely, if miles traveled information is not known, annual fuel usage and vehicle fuel economy can be used to estimate annual mileage.
1.3 Process-Related Emissions Process-related emissions result from physical or chemical processes and refer to emissions other than those resulting from fuel combustion. For the City of Raleigh, this includes emissions from the City-owned landfill, Wilders Grove, and three (3) wastewater treatment plants – Little Creek, Neuse River, and Smith Creek. Process-related emissions from manufacturing operations within the City were not included in the Community-based inventory.
Landfill
The decomposition of organic matter under the landfill cap/cover produces GHGs called landfill gas (LFG). The majority of these emissions are recovered by a collection system and flared. Some emissions are released to the atmosphere through the landfill cover, if no recovery system is present. Other emissions are released through the flare as non-combusted gas. The type of cover and processes (e.g. LFG recovery, flaring, etc.) used at the landfill are integral in assessing emissions. As such, the data needed to determine GHG emissions from landfills is readily available as part of daily operations and regulatory reporting requirements. This data includes:
Landfill cover type (e.g. soil, synthetic, combination)
LFG control device type (e.g. flare, combustion, etc.)
Volume of LFG collected, if applicable
Methane (CH4) content of LFG, if measured
LFG collection system efficiency (as calculated or determined by vendor)
In the absence of measured methane content and LFG collection efficiency data, default values based upon U.S. industry standards can be used to complete the emissions quantification.
Landfill Exports
Some of the City’s solid waste is collected locally and disposed of outside the City at a landfill and/or composting facility. Recycled materials are collected and sorted locally and sent out of the City for processing. The process-related emissions resulting from the solid waste disposal methods are included as part of the Community-based GHG emissions inventory.
The following data are needed to assess emissions for solid waste disposed outside of the City and is usually available from Solid Waste Management personnel; note that there are no substitutions for this data.
Types of material collected
Total volume or weight collected, by material type
Method of disposal, by material type

CITY OF RALEIGH OPERATIONS DATA COLLECTION FRAMEWORK – DATA NEEDS AND EMISSIONS QUANTIFICATION ASSESSMENT
5
Wastewater Treatment
Process emissions at the wastewater treatment plants result from organic matter and nutrients being processed through the treatment facility, chemicals used within the process, and sludge treatment/biosolids production. Direct measured operational data are generally maintained and stored within the treatment plant’s control system. Laboratory analysis data are also used to control and/or modify the treatment process continually. The primary data needed to assess wastewater treatment process emissions should be obtained from the process control system and laboratory analysis data. The required data includes:
Average daily volume of wastewater treated
Average 5-day biological oxygen demand (BOD5) or chemical oxygen demand (COD) loading
Total amount of chemical (e.g. methanol, caustic, etc.) added, if applicable
Type of treatment process (e.g. aerobic, anaerobic digestion, septic, etc.)
Total volume of digester gas recovered, if applicable
Average total nitrogen (TN) content of effluent
Total population served by the plant
There are no substitutions for process-related data. However, if total nitrogen content data are not known, default data based upon U.S. industry averages can be used.
1.4 Fugitive Emission Sources Fugitives emissions result from unintentional leaks or releases from processes, storage devices, systems, etc. For the City, fugitive emissions result from refrigerant/coolant usage within refrigeration and cooling systems in buildings and facilities. Fugitive emissions from residential and industrial cooling systems were not included in the Community-based emissions inventory.
Because fugitive emissions cannot be measured, they are based upon the total amount of material charged to equipment and/or systems. As a matter of accounting, it is assumed that the amount of material charged to equipment/systems during a given year is equal to the amount that leaked from the device. Equipment service records that contain the total amount and type of coolant/material placed in a unit or system is the preferred data. The following data are needed to assess emissions:
Quantity of refrigerant charged annually
Material/coolant type
Number of units included, if grouped
Equipment manufacturer, size, and model number, if known
In the case for which total refrigerant usage is not available, the total refrigerant charge capacity of the equipment along with U.S. industrial average leak rates for specific types of equipment can be used to estimate total usage and the resulting emissions.
1.5 Electricity Usage Emissions resulting from the use of purchased electricity were included as part of the City-wide GHG emissions inventory. In addition, emissions for residential and industrial users of electricity were included in the Community-based GHG emissions inventory. The City does not currently purchase steam or hot/chilled water; hence it was not accounted for in the emissions inventory.
Metered data that provides the total annual amount of electricity usage is the most accurate data for assessing emissions. Annual usage data from meters directly connected to buildings, facilities, and large pieces of equipment is the primary source of data. Utility bills are a secondary source of data for buildings and facilities that

CITY OF RALEIGH OPERATIONS DATA COLLECTION FRAMEWORK – DATA NEEDS AND EMISSIONS QUANTIFICATION ASSESSMENT
6
contain pieces of equipment that do not have local meters, but provide usage for the entirety of operations within.
If actual electricity usage is not known for a building and/or facility, the type of operations being conducting in the space along with the total square footage can be determined using U.S. industrial averages for energy use per square foot.
2.0 Other Emission Sources Other emissions sources that were not included in the City- and/or Community-based emissions inventory, but should be considered for inclusion due to significant energy use or relevance to City operations include:
Vehicle Fleet Services outside of the Department of Public Works
All other buildings and facilities owned by the City
Water treatment and distribution operations
Wastewater collection operations
Employee commuting and business travel
The data required to assess emissions from these sources is similar to the data needs detailed in the proceeding sections. The following additional data would be required to determine emissions from employee commuting.
Employee Commuting Because fuel use for employee commuting is not known, estimating methods are used to determine the usage. GHG emissions from these vehicles are determined from miles traveled data. Employee zip code data obtained from City Human Resources records could be used to determine the miles traveled from home to work one way. Hence, the required data include:
Employee status ( full or part time)
Home zip code
Work zip code
In the absence of this level of data, average miles traveled one way from the outer most populated areas to the City center and the total number of employees could be used to determine annual miles traveled for commuting purposes.
To summarize the proceeding sections, Exhibit 2 details the data needed by source category to complete a comprehensive City- and Community-based GHG emissions inventory.

CITY OF RALEIGH OPERATIONS DATA COLLECTION FRAMEWORK – DATA NEEDS AND EMISSIONS QUANTIFICATION ASSESSMENT
7
EXHIBIT 2 Data Needed by GHG Emission Source
Emission Source Activity Data
Category Equipment Type Required Data Primary Sources of
Activity Data Data Level
Stationary Combustion
Heaters, boilers, generators, emergency pumps
Fuel usage, fuel physical property data, equipment design capacity, hours of operation/run time
Flow meters, supply line/tank gauges, purchasing records, operations reports/ logs, Operations database
Unit, piece of equipment, building, grouped source
Mobile Combustion (includes Contracted Services and Employee Commuting)
Fleet vehicles, maintenance trucks, materials handling equipment, off-road equipment, aerial and aquatic vessels
On-road vehicles – cars, trucks, motorcycles, etc.
Fuel usage, miles traveled
Shipping manifests, departure and arrival locations
Zip codes for home and work
Vehicle odometer, trip logs, purchasing records, fuel tank/ supply pump gauges, Fleet database
Human Resources records
Vehicle, vessel, grouped source by vehicle type
Process-Related
City-Owned landfill operations
Non-Owned landfill operations
Wastewater treatment operations
Landfill cover type, recovery process type, volume of gas recovered
Volume/weight and composition of wastes landfilled, recycled, or composted offsite
Process type, volume of water treated, organic loading, analytical data
Solid waste services records, database
Disposal records, Operations database, shipping manifests
Operational data, lab analytical reports
Process
Fugitive Emissions
Air conditioning units, cooling systems, fire suppression equipment/systems
Refrigerant usage Purchasing records, vendor requisitions/ work orders
Unit, piece of equipment, building, grouped source
Electricity Usage
Buildings, facilities, and equipment
Electricity usage
Meter readings, utility bills, purchasing records, Facilities database
Building, facility, unit, piece of equipment
Community-Based Stationary Combustion
Heaters, boilers, generators
Fuel usage (natural gas)
Utility provider
Grouped source (e.g. residential, commercial, industrial)
Community-Based Mobile Combustion
On-road vehicles – cars, trucks, motorcycles, etc.
Vehicle miles traveled Regional transportation data, modeling software
Region

CITY OF RALEIGH OPERATIONS DATA COLLECTION FRAMEWORK – DATA NEEDS AND EMISSIONS QUANTIFICATION ASSESSMENT
8
Emission Source Activity Data
Category Equipment Type Required Data Primary Sources of
Activity Data Data Level
Community-Based Electricity Usage
Buildings, facilities, equipment
Electricity usage Utility provider
Grouped source (e.g. residential, commercial, industrial)
3.0 Data Collection and Emissions Quantification Framework There are many options for collecting the required data and quantifying emissions for completion of a GHG inventory. The following options present a high and low cost solution and an integrated option for consideration by the City. CH2M HILL has assisted organizations with implementation and use of the following:
Commercial Off-the-Shelf Software
Desktop Applications
Integrated Intranet-Based System
The determination of which method to use is generally based upon the specific needs of the organization and end-use of the results. Other factors for consideration may include price, ease of use, and ability to integrate the framework into an existing data management or accounting system.
3.1 Commercial Off-the-Shelf Software Commercial off-the-shelf (COTS) software (e.g. Enviance, SAP, Essential, etc.) is generally purchased by an entity and modified to client specifications by the installer. This software can be installed on various computers throughout an organization based upon a licensing agreement. The software is hosted on the internet to allow for continuous update and access. The host organization is usually the software installer. COTS software is expensive in comparison to desktop application software and incurs monthly hosting and/or maintenance fees.
The use of COTS software allows for “real time” data entry, emissions quantification, and viewing of results over time. Customized graphics can be generated for reporting purposes and/or a visual display of emission results. This software can also be programmed to receive data from other organizational systems (e.g. departmental databases, process control systems, etc.) on specified intervals (i.e. monthly, quarterly, annually) or data can be hand-entered by predetermined individuals within various organizational departments. Security settings would be determined by the organization and based upon the number of personnel to which access would have to be granted.
3.2 Desktop Applications An Excel-based emissions quantification tool or Access database could also be used to quantify GHG emissions. These tools are easily integrated into an organization’s existing data management system as personnel are generally already familiar with or using these desktop applications as part of their daily work activities. The cost of using an existing desktop application is low as the software is already installed on organizational computers and no internet hosting or maintenance fees are required.
When using a spreadsheet type tool, designated points of contact from each applicable City department could provide activity data for their respective operations and/or departments to an appointed inventory manager. The inventory manager would enter the requisite data into the emissions quantification tool. The spreadsheet would automatically quantify emissions for a given year based on the activity data entered. The resulting emissions data

CITY OF RALEIGH OPERATIONS DATA COLLECTION FRAMEWORK – DATA NEEDS AND EMISSIONS QUANTIFICATION ASSESSMENT
9
are easily manipulated or aggregated using existing functionality within Excel. Charts and other graphic representations can be produced within the application.
An Excel-based emissions quantification tool was developed as an option for calculating GHG emissions for the City. The inventory tool incorporates emissions quantification methods and emission factors identified in The Climate Registry (TCR)/ICLEI Local Government Operations Protocol (LGOP). A standard operating procedure for use of the emissions quantification tool is included as Attachment 1.
3.3 Integrated Intranet-Based System An additional option for data collection and emissions quantification is using an integrated intranet-based system. This hybrid approach would allow an organization to utilize a desktop application hosted on the entity’s intranet eliminating software development costs and monthly hosting and maintenance fees. The desktop application would be located in a specified area of the organization’s intranet. Access to the tool site would be granted to individuals within various organizational departments. Departmental data would be entered by the respective personnel directly into the desktop application tool at a specified time interval. An inventory manager would review data entries for completeness and retrieve results for reporting purposes. Departmental data could also be saved to a data warehouse located on the intranet site allowing the intranet site to be a central point for data collection, emissions calculation, results analysis, and reporting.
In accordance with GHG accounting principles, data should be collected at least annually independent of the type of data collection system used. It is recommended that annual data collection occur in the first 3 months of the subsequent calendar year to coincide with data collection for other environmental reporting. Overlap between data used for the GHG inventory and other environmental and/or annual reports is expected to minimize overall level of effort on the part of City personnel.
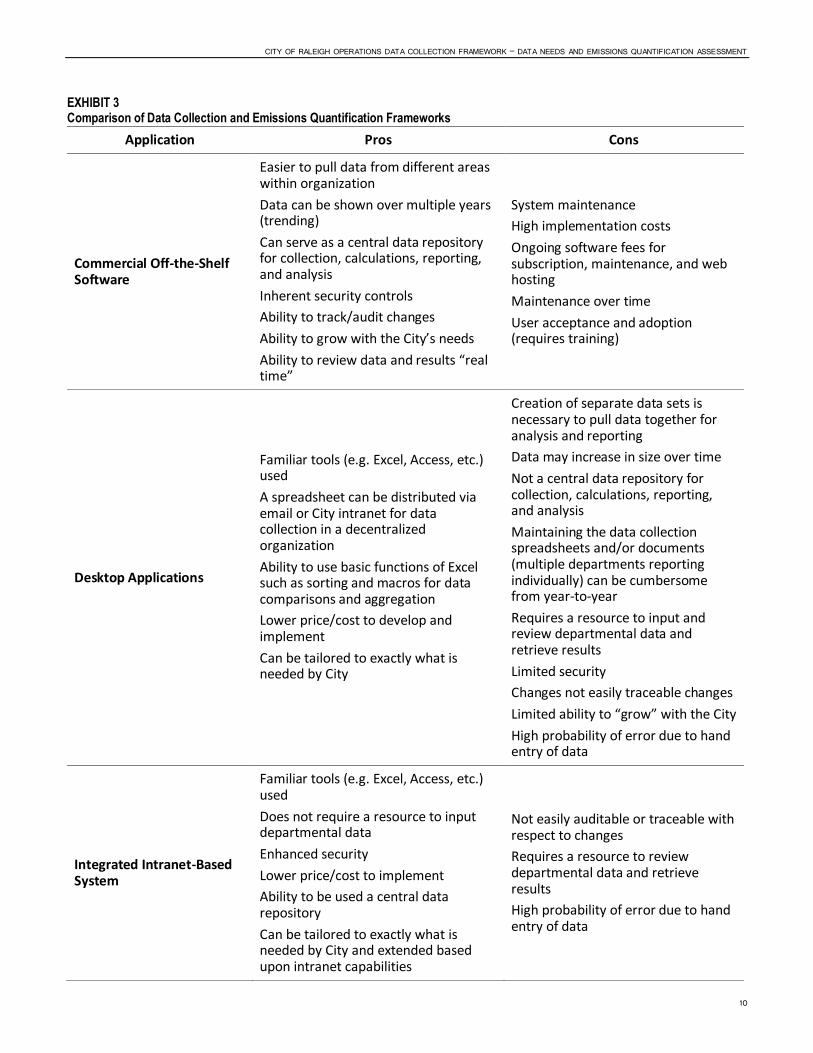
A comparison of the data collection and emissions quantification frameworks is included in Exhibit 3.
CITY OF RALEIGH OPERATIONS DATA COLLECTION FRAMEWORK – DATA NEEDS AND EMISSIONS QUANTIFICATION ASSESSMENT
10
EXHIBIT 3 Comparison of Data Collection and Emissions Quantification Frameworks
Application Pros Cons
Commercial Off-the-Shelf Software
Easier to pull data from different areas within organization
Data can be shown over multiple years (trending)
Can serve as a central data repository for collection, calculations, reporting, and analysis
Inherent security controls
Ability to track/audit changes
Ability to grow with the City’s needs
Ability to review data and results “real time”
System maintenance
High implementation costs
Ongoing software fees for subscription, maintenance, and web hosting
Maintenance over time
User acceptance and adoption (requires training)
Desktop Applications
Familiar tools (e.g. Excel, Access, etc.) used
A spreadsheet can be distributed via email or City intranet for data collection in a decentralized organization
Ability to use basic functions of Excel such as sorting and macros for data comparisons and aggregation
Lower price/cost to develop and implement
Can be tailored to exactly what is needed by City
Creation of separate data sets is necessary to pull data together for analysis and reporting
Data may increase in size over time
Not a central data repository for collection, calculations, reporting, and analysis
Maintaining the data collection spreadsheets and/or documents (multiple departments reporting individually) can be cumbersome from year-to-year
Requires a resource to input and review departmental data and retrieve results
Limited security
Changes not easily traceable changes
Limited ability to “grow” with the City
High probability of error due to hand entry of data
Integrated Intranet-Based System
Familiar tools (e.g. Excel, Access, etc.) used
Does not require a resource to input departmental data
Enhanced security
Lower price/cost to implement
Ability to be used a central data repository
Can be tailored to exactly what is needed by City and extended based upon intranet capabilities
Not easily auditable or traceable with respect to changes
Requires a resource to review departmental data and retrieve results
High probability of error due to hand entry of data

CITY OF RALEIGH OPERATIONS DATA COLLECTION FRAMEWORK – DATA NEEDS AND EMISSIONS QUANTIFICATION ASSESSMENT
11
4.0 Data Collection for Energy Efficiency Tracking Information should be gathered in order to track changes in the City of Raleigh Operations energy efficiency over time.
4.1 Data Needs Typical parameters suggested to be measured and tracked initially include:
Building KW/square foot heated and cooled (electricity) – by building
Building therms/square foot heated (natural gas) – by building
KW/gallon of water treated (electricity) – by treatment facility
KW/gallon of finished water pumped through distribution system (electricity) – by major pumping system
KW/gallon of wastewater treated (electricity) – by treatment facility
Miles/gallon for each type of fuel utilized – by vehicle
It is critical that the energy efficiency of each building, treatment facility, vehicle, etc. is measured and reported individually rather than combined together. If combined, the efficiency of older or less efficient facilities/ equipment would be “masked” by the newer or more efficient units and would not provide a transparent representation of energy efficiency changes over time. For example, if the following energy efficiencies were combined, the resulting changes over time could not be attributed to specific actions taken to improve efficiency:
The Raleigh Convention Center or other new facilities with older buildings;
New and/or upgraded treatment facilities with older facilities;
New pumps with old pumps; and
New vehicles with old vehicles
4.2 Intensity-Based Reporting Energy efficiency can be reported by the parameters as listed above, or converted to units such as CO2-e/KWh used, CO2-e/gallon water treated, etc. For GHG emissions reporting, this is referred to as “intensity-based reporting”.
Total emissions for a GHG inventory are expressed as carbon dioxide equivalents (CO2-eq). Carbon dioxide equivalents represent the universal unit for comparing emissions of the various GHGs to one unit of CO2 based upon their global warming potential (GWP) value. GWPs indicate the degree of warming to the atmosphere that would result from the emission of one unit of a given GHG compared to one unit of CO2. To obtain CO2-eq emissions, the mass rate of emissions for each GHG is multiplied by its respective GWP as shown in Exhibit 4.
EXHIBIT 4
Greenhouse Gas Global Warming Potentials
Greenhouse Gas (GHG) Global Warming Potential (GWP) (a)
Carbon Dioxide (CO2) 1
Methane (CH4) 21
Nitrous Oxide (N2O) 310
Hydrofluorocarbons (HFCs) 1300 (for R-134a)
Perfluorocarbons (PFCs) varies
Sulfur Hexafluoride (SF6) 2600
(a) Based upon the Second Assessment Report (SAR) of the Intergovernmental Panel on Climate Change

CITY OF RALEIGH OPERATIONS DATA COLLECTION FRAMEWORK – DATA NEEDS AND EMISSIONS QUANTIFICATION ASSESSMENT
12
4.3 Other Parameters and Level of Detail As the data collected through the quantification assessment become available for analysis, other parameters of interest can be defined over time.
The level of detail of tracking may be refined over time, and may include the evaluation of individual pieces of equipment such as boilers, chillers. Likewise, individual pumps and blowers used for wastewater treatment could be evaluated, as well as individual treatment processes such as wastewater treatment aeration, ultraviolet light disinfection, etc.
Such evaluations of individual energy usages could ultimately be used to determine key performance indicators for a specific site, area or process.

13
ATTACHMENT 1
Standard Operating Procedure for Use of the GHG Emissions Quantification Tool

1
Appendix A – City of Raleigh Standard Operating Procedure for Use of
the GHG Emissions Quantification Tool The following sections describe the data inputs required on each emission source category spreadsheet
to generate an overall GHG emissions inventory using the GHG Emissions Quantification Tool. Summary
graphics (charts) are automatically generated on designated tabs upon data entry and completion of
calculations. An entity-wide summary table of the emission results is presented as the first spreadsheet
tab within the Excel-based workbook.
General Instructions
Spreadsheet Tab Colors
Tab Colors indicate the purpose of each spreadsheet in the tool. Red tabs are summary tables.
Yellow tabs are data input spreadsheets where the majority of city information must be entered.
Blue tabs have pie charts. Green tabs have factors and constants, which should not be edited, but
may be viewed for reference. Black tabs are working sheets where internal calculations for the tools
are handled, and are not intended for viewing or editing. These tabs are hidden in the tool.
Calculation Spreadsheets
o Data should be entered in the yellow shaded cells only.
o Grey shaded cells are automatically updated based upon the data entered in the yellow shaded
cells. Emission factors and constants are presented within these cells and should not be altered.
o Calculations are performed in the blue shaded cells. These cells should not be altered.
1. Stationary Combustion The following data inputs are required to assess GHG emissions from stationary combustion sources.
City-Owned Assets Department Enter the department for which data is being entered.
Facility Name Enter the name of the facility where the source is located.
No. of Units Enter the number of pieces of equipment at the facility or individual units at the facility.
Equipment Name Input the name or description of the equipment being evaluated.
Fuel Type Choose the fuel type from the drop down menu. The heat content of the fuel will be automatically entered based upon the fuel type.
Fuel Usage Enter the annual fuel usage. NOTE: Data must be entered in the specific units shown in the "Units" column.
Percent Equity Enter the percent ownership of the asset being considered – city-owned assets should be listed as having 100% equity.
Equipment Category Choose from the drop down list the most appropriate category that describes the equipment being used.
GHG emission factors are automatically pulled into the spreadsheet as determined by the fuel type and equipment category. If these cells are left blank, the emission factors will not update and emissions will not be calculated. Emissions calculations for each GHG (CO2, CH4, and N2O) are completed in the blue shaded cells. The carbon dioxide equivalent (CO2-eq) of the GHGs is output in the final column, Total CO2-eq.

2
Community-Based Sources Sector Enter the sector (e.g. residential, commercial, industrial) for which data is being
entered.
Facility Name Enter “Various”, unless a specific entity within a sector has provided data for inclusion.
No. of Units Enter the number of pieces of equipment at the facility or individual units at the facility. Leave blank if unknown.
Equipment Name Enter “Various”, unless a specific entity within a sector has provided data for inclusion.
Fuel Type Choose the fuel type from the drop down menu. The heat content of the fuel will be automatically entered based upon the fuel type.
Fuel Usage Enter the annual fuel usage. NOTE: Data must be entered in the specific units shown in the "Units" column.
Percent Equity Enter the percent equity within the community for the assets under evaluation.
Equipment Category Choose from the drop down list the most appropriate category that describes the equipment being used.
GHG emission factors are automatically pulled into the spreadsheet as determined by the fuel type and equipment category. If these cells are left blank, the emission factors will not update and emissions will not be calculated. Emissions calculations for each GHG (CO2, CH4, and N2O) are completed in the blue shaded cells. The total carbon dioxide equivalent (CO2-eq) in metric tons of the GHGs is output in the final column.
2. Mobile Combustion The following data inputs are required to assess GHG emissions from mobile combustion sources.
City-Owned Fleet (all fuel types) Department Enter the department for which data is being entered.
Vehicle ID Enter the identification number for the vehicle being evaluated.
Make & Model Enter the make and model of the vehicle.
Vehicle Description Enter a description of the vehicle.
Year Enter the model year of the vehicle.
Fuel Type Choose the type of fuel used in the vehicle from the drop down list.
Fuel Usage Enter the gallons of fuel used in the inventory year, if available. If the fuel usage is not tracked, leave the cell blank. The vehicle fuel economy will be used to estimate fuel usage based upon the miles traveled.
Miles Traveled Enter the miles traveled in the inventory year, if available. If the miles traveled are not tracked, leave the cell blank. The vehicle fuel economy will be used to estimate the miles traveled based upon fuel usage.
Percent Equity Enter the percent ownership of the asset being considered – city-owned assets should be listed as having 100% equity.
Vehicle Classification Choose a vehicle classification from the drop down list that best describes the vehicle being evaluated. The vehicle fuel economy will be automatically entered based upon this entry.
GHG emission factors are automatically pulled into the spreadsheet as determined by the fuel type and vehicle classification. If these cells are left blank, the emission factors will not update and emissions will not be calculated. Emissions calculations for each GHG (CO2, CH4, and N2O) are completed in the blue shaded cells. The total carbon dioxide equivalent (CO2-eq) in metric tons of the GHGs is output in the final column.

3
Contracted Service Vehicles Entity Enter a description of the department or organizational entity that contracts the
service vehicles.
Vehicle ID Enter the identification number for the vehicle being evaluated, if known
Make & Model Enter the make and model of the vehicle, if known.
Vehicle Description Enter a description of the contracted vehicle.
Year Enter the model year of the vehicle, if known.
Fuel Type Choose the type of fuel used in the vehicle from the drop down list.
Fuel Usage Enter the gallons of fuel used in the inventory year, if available. If the fuel usage is not tracked, leave the cell blank. If fuel usage is not known, the vehicle fuel economy will be used to estimate the gallons of fuel used.
Miles Traveled Enter the miles traveled in the inventory year, if available. This can be determined using destination data from bills of lading or trip logs. If the miles traveled are not tracked, leave the cell blank.
Percent Equity Enter the percent ownership of the asset being considered –100% equity should be entered for reporting purposes.
Vehicle Classification Choose a vehicle classification from the drop down list. The vehicle fuel economy will be automatically entered based upon this entry.
GHG emission factors are automatically pulled into the spreadsheet as determined by the fuel type and vehicle classification. If these cells are left blank, the emission factors will not update and emissions will not be calculated. Emissions calculations for each GHG (CO2, CH4, and N2O) are completed in the blue shaded cells. The total carbon dioxide equivalent (CO2-eq) in metric tons of the GHGs is output in the final column.
3. Commuter Combustion The following data inputs are required to assess GHG emissions from mobile combustion sources used by City employees commuting to and from work as well as from community-based travel on roadways within the City geographical boundary.
City Employee Commuting
There are two employee types, full-time and part-time. Full time employees report to work five (5) days per week for 46 weeks in a year (calendar year less holidays and vacation time). Part-time employees report to work 3 days per week for 46 weeks a year.
Department Enter the department for which the employees work.
Miles Traveled One Way Based upon the employee’s home zip code and work location, determine the total miles traveled one way for each employee type. Sum all one way miles and enter total miles traveled one way.
Miles Traveled in One Day No input required. This cell is automatically calculated.
Miles Traveled in One Week No input required. This cell is automatically calculated.
Annual Miles Traveled No input required. This cell is automatically calculated.
Fuel Economy No input required. This cell is automatically calculated.
Fuel Type Choose the type of fuel used in the vehicle from the drop down list.
Vehicle Description Choose a vehicle description from the drop down list. The vehicle fuel economy will be automatically entered based upon this entry.
GHG emission factors are automatically pulled into the spreadsheet as determined by the fuel type and vehicle classification. If these cells are left blank, the emission factors will not update and emissions will not be calculated. Emissions calculations for each GHG (CO2, CH4, and N2O) are completed in the blue shaded cells. The total carbon dioxide equivalent (CO2-eq) in metric tons of the GHGs is output in the final column.

4
Community Transportation
Data used for determining Community-based mobile source emissions must be obtained from a regional planning commission and from air emissions modeling software. The following data is used to determine Community-based mobile emissions.
Entity/Sector Enter “Community” as the entity.
Vehicle/Roadway Type Enter either the vehicle type (e.g. auto/motorcycle, light duty truck, buses, etc.) or roadway type (e.g. interstate, off ramp, road, etc.) based upon the data obtained from the regional planning commission’s conformity report.
Urban Vehicle Miles Traveled Enter the total “Urban” miles estimated to be traveled from the regional planning commission’s conformity report.
Urban CO2 Enter the “Urban” CO2 emissions value, on a per ton basis value, obtained for the specific vehicle or roadway type as determined by the emissions modeling software.
Rural Vehicle Miles Traveled Enter the total “Rural” miles estimated to be traveled from the regional planning commission’s conformity report.
Rural CO2 Enter the “Rural” CO2 emissions value, on a per ton basis value, obtained for the specific vehicle or roadway type as determined by the emissions modeling software.
GHG emission factors are pre-populated into the spreadsheet based on an average for vehicle type. Emissions calculations for each GHG (CO2, CH4, and N2O) are completed in the blue shaded cells. The total carbon dioxide equivalent (CO2-eq) in metric tons of the GHGs is output in the final column.
4. Refrigerant-Based Fugitive Emissions The following data inputs are required to assess GHG emissions for fugitive emissions from cooling systems (e.g. HVAC, refrigeration, etc.).
Department Enter the department for which data is being entered.
Facility Name Enter the name of the facility where the source is located.
Type of Equipment Enter the type of equipment (e.g. chiller, HVAC unit, etc.) for which data is being entered.
Model No. For equipment tracking purposes, enter the model number of the equipment for which data is being entered.
Total Refrigerant Capacity Enter the total refrigerant capacity of the equipment (e.g. the total amount of coolant that can be added to the piece of equipment/system)/
Refrigerant Type Choose the refrigerant type from the drop-down list. Only those refrigerants within the list are reportable within a GHG emissions inventory. The global warming potential (GWP) value with be automatically updated based upon this value.
Total Refrigerant Charged Enter the annual amount of refrigerant charged (refilled) to the equipment in pounds.
Annual Leak Rate Enter the annual leak rate value. This value should be obtained from the equipment operating manual. If data is not known, industry averages can be used based upon the equipment type (see Emission Factors tab).
Percent Equity Enter the percent ownership of the asset being considered – government owned assets should be listed as having 100% equity.
Emissions calculations are completed in the blue shaded cells and are based upon the refrigerant type and total refrigerant charged to the equipment. If these cells are left blank, the GWP value will not update and emissions will not be calculated. The total carbon dioxide equivalent (CO2-eq) in metric tons is output in the final column.
5
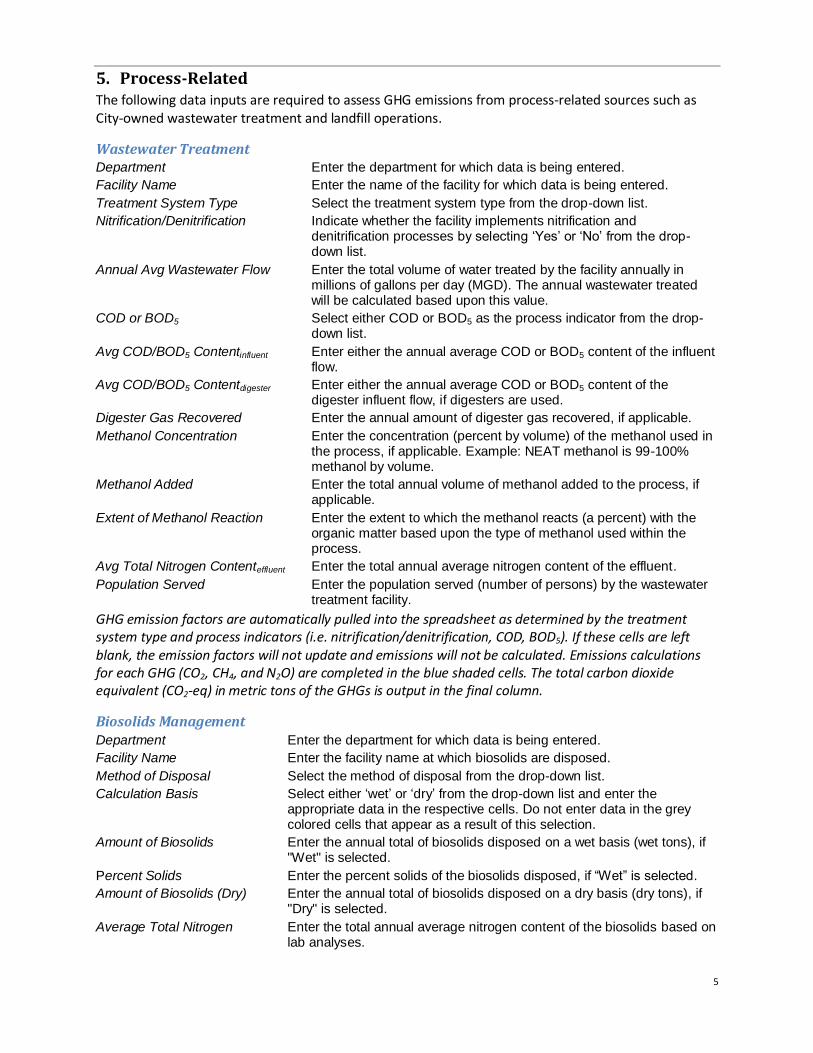
5. Process-Related The following data inputs are required to assess GHG emissions from process-related sources such as City-owned wastewater treatment and landfill operations.
Wastewater Treatment Department Enter the department for which data is being entered.
Facility Name Enter the name of the facility for which data is being entered.
Treatment System Type Select the treatment system type from the drop-down list.
Nitrification/Denitrification Indicate whether the facility implements nitrification and denitrification processes by selecting ‘Yes’ or ‘No’ from the drop-down list.
Annual Avg Wastewater Flow Enter the total volume of water treated by the facility annually in millions of gallons per day (MGD). The annual wastewater treated will be calculated based upon this value.
COD or BOD5 Select either COD or BOD5 as the process indicator from the drop-down list.
Avg COD/BOD5 Contentinfluent Enter either the annual average COD or BOD5 content of the influent flow.
Avg COD/BOD5 Contentdigester Enter either the annual average COD or BOD5 content of the digester influent flow, if digesters are used.
Digester Gas Recovered Enter the annual amount of digester gas recovered, if applicable.
Methanol Concentration Enter the concentration (percent by volume) of the methanol used in the process, if applicable. Example: NEAT methanol is 99-100% methanol by volume.
Methanol Added Enter the total annual volume of methanol added to the process, if applicable.
Extent of Methanol Reaction Enter the extent to which the methanol reacts (a percent) with the organic matter based upon the type of methanol used within the process.
Avg Total Nitrogen Contenteffluent Enter the total annual average nitrogen content of the effluent.
Population Served Enter the population served (number of persons) by the wastewater treatment facility.
GHG emission factors are automatically pulled into the spreadsheet as determined by the treatment system type and process indicators (i.e. nitrification/denitrification, COD, BOD5). If these cells are left blank, the emission factors will not update and emissions will not be calculated. Emissions calculations for each GHG (CO2, CH4, and N2O) are completed in the blue shaded cells. The total carbon dioxide equivalent (CO2-eq) in metric tons of the GHGs is output in the final column.
Biosolids Management Department Enter the department for which data is being entered.
Facility Name Enter the facility name at which biosolids are disposed.
Method of Disposal Select the method of disposal from the drop-down list.
Calculation Basis Select either ‘wet’ or ‘dry’ from the drop-down list and enter the appropriate data in the respective cells. Do not enter data in the grey colored cells that appear as a result of this selection.
Amount of Biosolids Enter the annual total of biosolids disposed on a wet basis (wet tons), if "Wet" is selected.
Percent Solids Enter the percent solids of the biosolids disposed, if “Wet” is selected.
Amount of Biosolids (Dry) Enter the annual total of biosolids disposed on a dry basis (dry tons), if "Dry" is selected.
Average Total Nitrogen Enter the total annual average nitrogen content of the biosolids based on lab analyses.

6
GHG emission factors are automatically pulled into the spreadsheet as determined by the disposal method. If this cell is left blank, the emission factors will not update and emissions will not be calculated. Emissions calculations for each GHG (CH4, and N2O) are completed in the blue shaded cells. The total carbon dioxide equivalent (CO2-eq) in metric tons of the GHGs is output in the final column.
City-Owned Landfill Operations
Landfill with a Cap and Landfill Gas (LFG) Recovery System
Department Enter the department for which data is being entered.
Facility Name Enter the name of the active landfill at which municipal solid waste (MSW) is disposed and/or that has a landfill gas (LFG) recovery system. NOTE: Some closed landfills operate LFG recovery systems.
Landfill Cover Type Select the type of landfill cover from the drop-down list. This selection will determine the oxidation factor.
Control Device Select the recovery system control device type from the drop-down list. This selection will determine the system destruction efficiency.
Landfill Gas Generated Enter the annual amount of LFG generated as determined by the USEPA Landfill Gas Emissions Model (LandGEM). NOTE: Data should be entered in ft
3/min.
Landfill Gas Collected Enter the annual amount of LFG collected by the recovery system. NOTE: Data should be entered in ft
3/min.
Methane Content Enter the methane content of the LFG collected.
Methane Flow Collected The total methane gas collected is determined based upon the methane content of the LFG collected.
Collection Efficiency The system collection efficiency is calculated using the values for the total LFG generated and collected.
Percent Equity Enter the percent ownership of the asset being considered – city-owned assets should be listed as having 100% equity.
GHG emissions are determined by the landfill cover and control device type. If these cells are left blank, emissions will not be calculated. Emissions calculations for each GHG (CO2, CH4, and N2O) are completed in the blue shaded cells. The total carbon dioxide equivalent (CO2-eq) in metric tons of the GHGs is output in the final column.
Landfill without a Cap and Landfill Gas (LFG) Recovery System
Department Enter the department for which data is being entered.
Facility Name Enter the name of the active landfill at which municipal solid waste (MSW) is disposed.
Material Choose the type of wastes disposed using the drop-down list. Complete individual entries for each material disposed at the landfill.
Quantity to Landfill Enter the annual quantity of wastes sent to the landfill.
Quantity Incinerated Enter the annual quantity of wastes sent to the incinerator at the landfill, if applicable.
Quantity Composted Enter the annual quantity of wastes composted at the landfill, if applicable.
GHG emissions factors are automatically pulled into the spreadsheet as determined by the material type and disposal method. If these cells are left blank, emissions will not be calculated. Emissions calculations for each GHG (CO2, CH4, and N2O) are completed in the blue shaded cells. The total carbon dioxide equivalent (CO2-eq) in metric tons of the GHGs is output in the final column.

7
Landfill Exports
Department Enter the name of the department that sends waste to the non-owned landfill.
Facility Name Enter the name of the name of the active landfill at which municipal solid waste (MSW) is disposed.
Material Choose the type of wastes disposed using the drop down list. Complete individual entries for each material disposed at the landfill.
Quantity to Landfill Enter the annual quantity of wastes sent to the landfill.
Quantity Incinerated Enter the annual quantity of wastes sent to the incinerator at the landfill, if applicable.
Quantity Composted Enter the annual quantity of wastes composted at the landfill, if applicable.
GHG emissions factors are automatically pulled into the spreadsheet as determined by the material type and disposal method. If these cells are left blank, emissions will not be calculated. Emissions calculations for each GHG (CO2, CH4, and N2O) are completed in the blue shaded cells. The total carbon dioxide equivalent (CO2-eq) in metric tons of the GHGs is output in the final column.
6. Electricity Usage The following data inputs are required to assess GHG emissions from the use of electricity within City-owned and Community-based buildings, facilities, equipment, and operations.
City-Owned Assets Department Enter the department for which data is being entered.
Facility ID/Acct. No. Enter the facility ID or the account number by which the facility/entity is tracked.
Facility Name Enter the name of the facility for which data is being entered.
Annual Electricity Use Enter annual electricity usage in either kilowatt hours (kWh) OR megawatt hours
(MWh).
Percent Equity Enter the percent ownership of the asset being considered – City-owned assets should be listed as having 100% equity.
GHG emissions factors are automatically pulled into the spreadsheet as determined by the eGRID sub-region. Emissions calculations for each GHG (CO2, CH4, and N2O) are completed in the blue shaded cells. The total carbon dioxide equivalent (CO2-eq) in metric tons of the GHGs is output in the final column.
Community-Based Sources
Entity Enter the sector (e.g. residential, commercial, industrial) for which data is being entered.
Facility ID/Acct. No. Enter “Various”, unless a specific facility ID or account number has been provided.
Facility Name Enter “Various”, unless a specific entity within a sector has provided data for inclusion.
Annual Electricity Use Enter annual electricity usage in either kilowatt hours (kWh) OR megawatt hours
(MWh).
Percent Equity Enter the percent equity within the community for the assets under evaluation.
GHG emissions factors are automatically pulled into the spreadsheet as determined by the eGRID sub-region. Emissions calculations for each GHG (CO2, CH4, and N2O) are completed in the blue shaded cells. The total carbon dioxide equivalent (CO2-eq) in metric tons of the GHGs is output in the final column.

Printed on 100% Post-Consumer Recycled Paper