technical evidence appendix report – part 2 of 2
TRANSCRIPT

Technical Evidence Appendix Report – Part 2 of 2
Coastal Hazard Adaptation Strategy – Phase 4 and 5
Bundaberg Regional Council
03 October 2019

Document Status
Version Doc type Reviewed by Approved by Date issued
01 Report Richard Sharp Steve Clark 3 October 2019
COPYRIGHT
Water Technology Pty Ltd has produced this document in accordance with instructions from Bundaberg Regional Council for their use only. The concepts and information contained in this document are the copyright of Water Technology Pty Ltd. Use or copying of this document in whole or in part without written permission of Water Technology Pty Ltd constitutes an infringement of copyright.
Water Technology Pty Ltd does not warrant this document is definitive nor free from error and does not accept liability for
any loss caused, or arising from, reliance upon the information provided herein.
Level 3, 43 Peel Street
South Brisbane QLD 4101
Telephone (07) 3105 1460
Fax (07) 3846 5144
ACN 093 377 283
ABN 60 093 377 283

CONTENTS
Introduction
Appendix D - Environmental Analysis Technical Summary Report and Environmental Consequence Results
Appendix E - Economic and Social Analysis Technical Report and Consequence Results
Appendix F - Risk Analysis Results

Bundaberg Regional Council | 03 October 2019 Coastal Hazard Adaptation Strategy – Phase 4 and 5
50
57
-02
-R02_B
RC
_C
HA
S_P
H4
_5_T
echnic
al_
App
endix
_P
art
2_o
f_2
1 INTRODUCTION
This Technical Evidence Appendix document provides all of the supporting documentation associated with the
development of the Phase 4 and 5 Identify Key Assets Potentially Impacted and Risk Assessment in Coastal
Hazard Areas for the Bundaberg Region Coastal Hazard Adaptation Strategy.
The analyses undertaken provide an understanding of the coastal hazard challenges and risks. Table 1-1
summarises the content of the Technical Evidence Appendix document.
TABLE 1-1 SUMMARY OF TECHNICAL EVIDENCE APPENDIX DOCUMENT
Part Description Appendix
1
Identification and prioritisation of assets exposed to coastal hazard
Appendix A – Asset Identification for 5% and 0.2% AEP Storm Tide Inundation Scenarios Appendix B – Environmental Value Mapping Appendix C – Vulnerability Assessment and Asset Prioritisation
2 Risk assessment of key assets in coastal hazard areas
Appendix D – Environmental Analysis Technical Summary Report and Environmental Consequence Results Appendix E – Economic and Social Analysis Technical Report and Consequence Results Appendix F – Risk Analysis Results

Bundaberg Regional Council | 03 October 2019 Coastal Hazard Adaptation Strategy – Phase 4 and 5
50
57
-02
-R02_B
RC
_C
HA
S_P
H4
_5_T
echnic
al_
App
endix
_P
art
2_o
f_2
APPENDIX D - ENVIRONMENTAL ANALYSIS TECHNICAL SUMMARY REPORT AND ENVIRONMENTAL CONSEQUENCE RESULTS

ACN 002 895 007
ABN 72 002 895 007
Unit 1/7 Grant Street
Cleveland Q 4163
Australia
PO Box 2363
Wellington Point Q 4160
Australia
www.frcenv.com.au
07 3286 385007 3821 [email protected]
Assessment of Habitat and Ecosystem Sensitivity for Bundaberg
CHAS – June 2019
Introduction
A preliminary method for assigning values to habitats has been addressed in Phase 4. This
report identifies a preliminary method of assessing ecosystem and habitat sensitivity and
the potential consequences of these habitats to coastal hazard and sea level rise.
Habitat Types
Natural habitat types were defined as remnant Regional Ecosystems sourced from The
Queensland Spatial Catalogue1, including estuaries and small inlets as per this mapping,
and the following additional habitats:
open sandy beach/ sea turtle sensitive area2
rocky headlands
rocky and coral reefs
seagrass, and
soft bottom habitat.
Where mapping was available, habitat types were mapped for each subregion. The current
storm tide 1% AEP extent, and the storm tide 1% AEP associated with an 80 cm increase
in sea level rise (SLR) by 2100 were overlain (Water Technology Regional Ecosystem Map
series 2019).
1 http://qldspatial.information.qld.gov.au/catalogue/custom/detail.page?fid={06ADEB9C-D8DD-40DC-8029-
936A16C4A45E} 2 mapping from assessment of aerial http://www.bundaberg.qld.gov.au/services/interactive-mapping,
Planning Scheme 2015 – overlays >Coastal Protection.

Bundaberg CHAS Habitat and Ecosystem Sensitivity 2
Regional Ecosystems
Regional ecosystems are vegetation communities in a bioregion that are consistently
associated with a particular combination of geology, landform and soil (Sattler and Williams
1999, Vegetation Management Act 1999).
Regional ecosystem coding is based on three elements (Queensland Government 2016):
The first element refers to the bioregion. Bundaberg Regional Council is in Bioregion
12: South East Queensland.
The second element refers to the land zone that the Regional Ecosystem occurs on.
The land zone is a simplified geology/substrate-landform classification for
Queensland. A description of land zones impacted by increased storm surge and
sea-level rise in the Bundaberg Regional Council area, are described in Table 1.
The third element refers to the vegetation.
Each regional ecosystem is given a three-part code based on these elements. For example,
Regional Ecosystem 12.1.3 is in South East Queensland, is on tidal flats and beaches, and
the vegetation is mangrove shrubland to low closed forest. The regional ecosystems
impacted by increased storm surge and sea-level rise are listed and described in Table 2.
No current, region wide, mapping was available for rocky headlands, seagrass, rocky and
coral reefs and soft bottom habitat. The likely occurrence of each of these habitats, and of
open beaches in each sub-region, was assessed from interpretation of aerial images by
experienced marine ecologists. While not mapped, the sensitivity of each of these habitat
types was included.
The suite of habitat types in each sub-region that may be impacted by the storm tide 1%
AEP associated with an 80 cm increase in sea level rise (SLR) are listed in Table 3. These
habitats are briefly described in Table 2 and are based on descriptions in Queensland
Herbarium 2019.
Environmental Consequences
The environmental consequences were assessed with respect to impacts to habitats listed
as threatened at a State level (regional ecosystem listed as threatened), Commonwealth
level (EPBC listed threatened community), and to the assessment of habitat values in
Phase 4.
Bundaberg CHAS Habitat and Ecosystem Sensitivity 3
Threatened Regional Ecosystem Classifications
The Regional Ecosystem Description Database (REDD) lists the vegetation management
class (VM class) and the biodiversity status (BD Status) of each regional ecosystem, listed
in the fourth and fifth column of Table 2
The biodiversity status is based on an assessment of the condition of remnant vegetation
in addition to the criteria used to determine the class under the Vegetation Management
Act 1999 (VMA) (Queensland Government 2017).
VM Classes
A regional ecosystem is listed as ‘endangered’ under the VMA if:
remnant vegetation is less than 10% of its pre-clearing extent across the bioregion;
or
10–30% of its pre-clearing extent remains and the remnant vegetation is less than
10,000 ha.
A regional ecosystem is listed as ‘of concern’ under the VMA if:
remnant vegetation is 10–30% of its pre-clearing extent across the bioregion; or
more than 30% of its pre-clearing extent remains and the remnant extent is less than
10,000 ha.
A regional ecosystem is listed as ‘least concern’ under the VMA if:
remnant vegetation is over 30% of its pre-clearing extent across the bioregion, and
the remnant area is greater than 10,000 ha.
Biodiversity Status
A regional ecosystem is listed with a biodiversity status of ‘endangered’ if:
less than 10% of its pre-clearing extent remains unaffected by severe degradation
and/or biodiversity loss1, or
10–30% of its pre-clearing extent remains unaffected by severe degradation and/or
biodiversity loss and the remnant vegetation is less than 10,000ha, or
it is a rare regional ecosystem subject to a threatening process.
A regional ecosystem is listed with a biodiversity status 'of concern' if:
10–30% of its pre-clearing extent remains unaffected by moderate degradation
and/or biodiversity loss.
A regional ecosystem is listed with a biodiversity status of ‘no concern at present’ if:
the degradation criteria listed above for ‘endangered’ or ‘of concern’ regional
ecosystems are not met.

Bundaberg CHAS Habitat and Ecosystem Sensitivity 4
EPBC Act Listed Threatened Communities.
Threatened communities are also declared at a Commonwealth level, listed in the last
column of Table 2

Bundaberg CHAS Sensitivity Assessment 7
Table 1 Descriptions of the land zones that regional ecosystems are on in the Bundaberg Regional Council Area that would be impacted by
increased storm tides and sea level rise.
Land Zone Short Description Long Description
1 Tidal flats and beaches Quaternary estuarine and marine deposits subject to periodic inundation by marine waters. Includes
mangroves, saltpans, offshore tidal flats and tidal beaches. Soils are predominantly Hydrosols (saline muds,
clays and sands) or beach sand.
2 Coastal dunes Quaternary coastal dunes and beach ridges. Includes degraded dunes, sand plains and swales, lakes and
swamps enclosed by dunes, as well as coral and sand cays. Soils are predominantly Rudosols and Tenosols
(siliceous or calcareous sands), Podosols and Organosols.
3 Alluvial river and creek flats Recent Quaternary alluvial systems, including closed depressions, paleo-estuarine deposits currently under
freshwater influence, inland lakes and associated wave-built lunettes. Excludes colluvial deposits such as
talus slopes and pediments. Includes a diverse range of soils, predominantly Vertosols and Sodosols; also,
with Dermosols, Kurosols, Chromosols, Kandosols, Tenosols, Rudosols and Hydrosols; and Organosols in
high rainfall areas.
5 Old loamy and sandy plains Tertiary-early Quaternary extensive, uniform near level or gently undulating plains with sandy or loamy soils.
Includes dissected remnants of these surfaces. Also includes plains with sandy or loamy soils of uncertain
origin, and plateau remnants with moderate to deep soils usually overlying duricrust. Excludes recent
Quaternary alluvial systems (land zone 3), exposed duricrust (land zone 7), and soils derived from underlying
bedrock (land zones 8 to 12). Soils are usually Tenosols and Kandosols, also minor deep sandy surfaced
Sodosols and Chromosols. There may be a duricrust at depth.
8 Basalt plains and hills Cainozoic igneous rocks, predominantly flood basalts forming extensive plains and occasional low scarps.
Also includes hills, cones and plugs on trachytes and rhyolites, and associated interbedded sediments, and
talus. Excludes deep soils overlying duricrust (land zone 5). Soils include Vertosols, Ferrosols, and shallow
Dermosols.
11 Hills and lowlands on metamorphic rocks Metamorphosed rocks, forming ranges, hills and lowlands. Primarily lower Permian and older sedimentary
formations which are generally moderately to strongly deformed. Includes low- to high-grade and contact
metamorphics such as phyllites, slates, gneisses of indeterminate origin and serpentinite, and interbedded
volcanics. Soils are mainly shallow, gravelly Rudosols and Tenosols, with Sodosols and Chromosols on lower
slopes and gently undulating areas. Soils are typically of low to moderate fertility.

Bundaberg CHAS Sensitivity Assessment 8
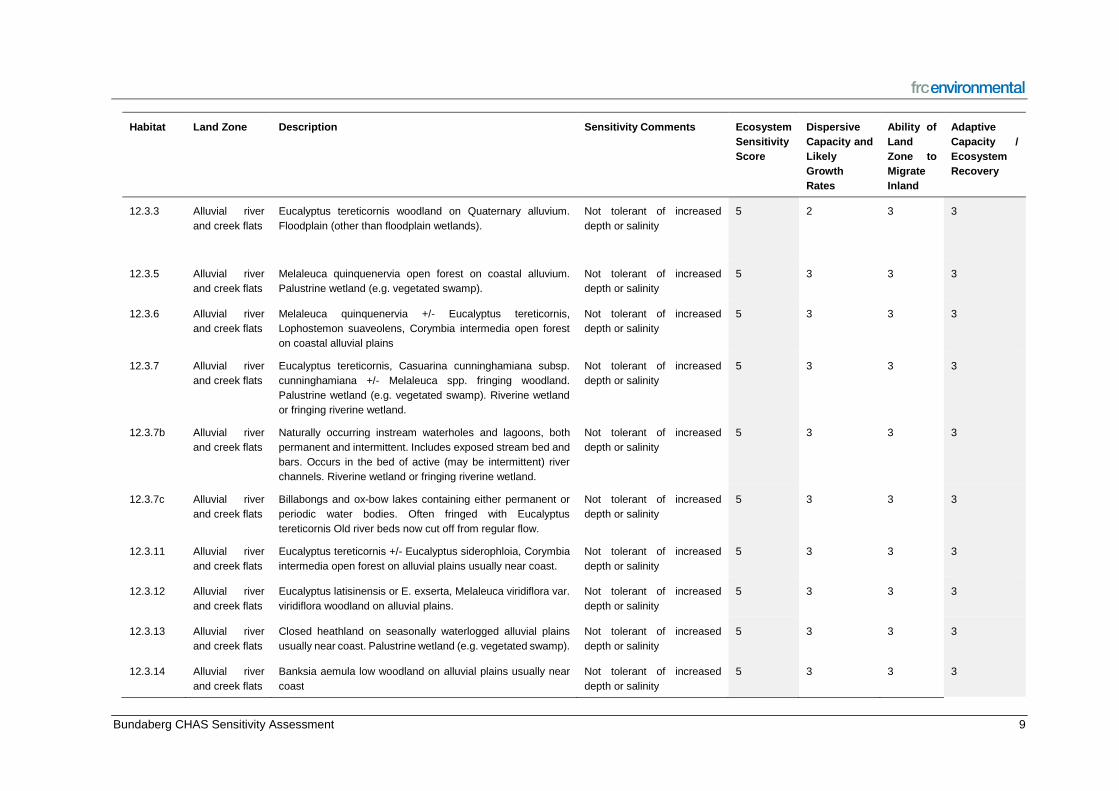
Table 2 Descriptions and conservation status of regional ecosystems and other habitats that will be disturbed by increased storm tides and
sea-level rise.
Habitat Land Zone Description VM Class3 Biodiversity
Status4
EPBC Act Status
Estuary NA Tidally inundated estuary NA NA NA
Small inlet NA As per RE mapping NA NA NA
Beach NA Open sandy beach / sea turtle sensitive area NA NA NA
Rocky and
coral reefs
NA Intertidal and subtidal headlands, rocky shorelines and
shelfs, subtidal rocky reefs and outcrops, intertidal pools
and coral reefs. Each of these supports a range of
species adapted to the rocky environment including reef
species and intertidal organisms.
NA NA NA
Seagrass NA Intertidal and subtidal seagrass meadows present. NA NA NA
Soft bottom
habitat
NA Unvegetated soft sediment habitat NA NA NA
12.1.1 Tidal flats and
beaches
Casuarina glauca woodland on margins of marine clay
plains. Infrequently tidally inundated. This RE occupies a
very small niche at the upper end of the tidal zone.
Of concern Of concern Endangered
12.1.2 Tidal flats and
beaches
Saltpan vegetation including grassland, herbland and
sedgeland on marine clay plains. Usually occurs on
hypersaline Quaternary estuarine deposits. Tidally
inundated less frequently than mangroves. This
ecosystem is under threat from sea level rise along its
seaward margins
Least concern No concern at
present
Vulnerable
12.1.3 Tidal flats and
beaches
Mangrove shrubland to low closed forest on marine clay
plains and estuaries
Least concern No concern at
present
3 Status according to the Vegetation Management Act (VMA) 4 Biodiversity status

Bundaberg CHAS Sensitivity Assessment 9
12.2.2 Coastal dunes
Microphyll/notophyll vine forest on beach ridges.
Continues to be threatened by clearing for coastal
residential development.
Of concern Endangered Critically Endangered
12.2.7 Coastal dunes Melaleuca quinquenervia or rarely M. dealbata open
forest on sand plains
Least concern No concern at
present
12.2.9 Coastal dunes Banksia aemula low open woodland on dunes and sand
plains. Usually deeply leached soils. Extensively cleared
for urban development.
Least concern No concern at
present
12.2.11 Coastal dunes Corymbia tessellaris +/- Eucalyptus tereticornis, C.
intermedia and Livistona decora woodland on beach
ridges in northern half of bioregion. Contains palustrine
wetland (e.g. in swales).
Least concern No concern at
present
12.2.12 Coastal dunes Closed heath on seasonally waterlogged sand plains.
Palustrine wetland (e.g. vegetated swamp).
Of concern Of concern
12.2.14 Coastal dunes Foredune complex. Strand and fore dune complex
comprising Spinifex sericeus grassland Casuarina
equisetifolia subsp. incana low woodland/open forest and
with Acacia leiocalyx, A. disparrima subsp. disparrima,
Banksia integrifolia subsp. integrifolia, Pandanus
tectorius, Corymbia tessellaris, Cupaniopsis
anacardioides, Acronychia imperforata. Occurs mostly on
frontal dunes and beaches but can occur on exposed
parts of dunes further inland.
Least concern No concern at
present
12.2.15 Coastal dunes Gahnia sieberiana, Empodisma minus, Gleichenia spp.
closed sedgeland in coastal swamps. Palustrine wetland
(e.g. vegetated swamp).
Least concern No concern at
present
12.2.15a Coastal dunes Permanent and semi-permanent window lakes. Occurs
as a window into the water table on Quaternary coastal
dunes and beaches. Low part of coastal landscape where
water collects from both overland flow and infiltration from
adjoining sand dunes. Lacustrine wetland (e.g. lake).
Least concern No concern at
present

Bundaberg CHAS Sensitivity Assessment 10
12.3.3 Alluvial river
and creek flats
Eucalyptus tereticornis woodland on Quaternary
alluvium. Floodplain (other than floodplain wetlands).
Endangered Endangered
12.3.5 Alluvial river
and creek flats
Melaleuca quinquenervia open forest on coastal
alluvium. Palustrine wetland (e.g. vegetated swamp).
Least concern No concern at
present
12.3.6 Alluvial river
and creek flats
Melaleuca quinquenervia +/- Eucalyptus tereticornis,
Lophostemon suaveolens, Corymbia intermedia open
forest on coastal alluvial plains
Least concern No concern at
present
12.3.7 Alluvial river
and creek flats
Eucalyptus tereticornis, Casuarina cunninghamiana
subsp. cunninghamiana +/- Melaleuca spp. fringing
woodland. Palustrine wetland (e.g. vegetated swamp).
Riverine wetland or fringing riverine wetland.
Least concern Of concern
12.3.7b Alluvial river
and creek flats
Naturally occurring instream waterholes and lagoons,
both permanent and intermittent. Includes exposed
stream bed and bars. Occurs in the bed of active (may be
intermittent) river channels. Riverine wetland or fringing
riverine wetland.
Least concern Of concern
12.3.7c Alluvial river
and creek flats
Billabongs and ox-bow lakes containing either permanent
or periodic water bodies. Often fringed with Eucalyptus
tereticornis Old riverbeds now cut off from regular flow.
Palustrine wetland (e.g. vegetated swamp).
Least concern Of concern
12.3.11 Alluvial river
and creek flats
Eucalyptus tereticornis +/- Eucalyptus siderophloia,
Corymbia intermedia open forest on alluvial plains
usually near coast. Contains palustrine wetland (e.g. in
swales).
Of concern Of concern
12.3.12 Alluvial river
and creek flats
Eucalyptus latisinensis or E. exserta, Melaleuca viridiflora
var. viridiflora woodland on alluvial plains. Contains
palustrine wetland (e.g. in swales).
Least concern No concern at
present
12.3.13 Alluvial river
and creek flats
Closed heathland on seasonally waterlogged alluvial
plains usually near coast. Palustrine wetland (e.g.
vegetated swamp). Generally, a palustrine wetland
Least concern No concern at
present

Bundaberg CHAS Sensitivity Assessment 11
although in cane growing areas near Bundaberg some
have been converted to lacustrine water bodies
associated with the construction of bunding and levees.
12.3.14 Alluvial river
and creek flats
Banksia aemula low woodland on alluvial plains usually
near coast
Of concern Of concern
12.3.17 Alluvial river
and creek flats
Simple notophyll fringing forest usually dominated by
Waterhousea floribunda. Riverine wetland or fringing
riverine wetland. Extensively cleared for agriculture.
Of concern Endangered
12.3.20 Alluvial river
and creek flats
Melaleuca quinquenervia, Casuarina glauca +/-
Eucalyptus tereticornis, E. siderophloia open forest on
low coastal alluvial plains. Palustrine wetland (e.g.
vegetated swamp).
Endangered Endangered Endangered5
12.5.2a Old loamy and
sandy plains
12.5.2a: Corymbia intermedia, Eucalyptus tereticornis
woodland. Other species can include Lophostemon
suaveolens, Angophora leiocarpa, Eucalyptus
acmenoides or E. portuensis, E. siderophloia or E.
crebra, Corymbia tessellaris and Melaleuca
quinquenervia (lower slopes). Eucalyptus exserta is
usually present in northern parts of bioregion. Occurs on
complex of remnant Tertiary surfaces +/- Cainozoic and
Mesozoic sediments usually in coastal areas with deep
red soils. (BVG1M: 9g). Has been extensively cleared for
horticulture, sugar cane and urban development.
Endangered Endangered
12.5.4 Old loamy and
sandy plains
Eucalyptus latisinensis +/- Corymbia intermedia, C.
trachyphloia subsp. trachyphloia, Angophora leiocarpa,
Eucalyptus exserta woodland on complex of remnant
Tertiary surfaces and Cainozoic and Mesozoic
sediments. Has been extensively cleared and
fragmented for exotic pine plantation, sugar cane and
rural residential development.
Least concern No concern at
present
5 To confirm

Bundaberg CHAS Sensitivity Assessment 12
12.5.5 Old loamy and
sandy plains
Eucalyptus portuensis, Corymbia intermedia open forest
on remnant Tertiary surfaces. Usually deep red soils
Of concern Of concern
12.5.7 Old loamy and
sandy plains
Corymbia citriodora subsp. variegata +/- Eucalyptus
portuensis or E. acmenoides, E. fibrosa subsp. fibrosa
open forest on remnant Tertiary surfaces. Usually deep
red soils
Least concern No concern at
present
12.5.8 Old loamy and
sandy plains
Eucalyptus hallii open woodland on complex of remnant
Tertiary surface and Tertiary sedimentary rocks. Being
cleared for sugar cane expansion and residential
development. Restricted to the Burrum River-Bundaberg
area.
Of concern Of concern
12.5.10 Old loamy and
sandy plains
Eucalyptus latisinensis and/or Banksia aemula low open
woodland on complex of remnant Tertiary surface and
Tertiary sedimentary rocks
Least concern No concern at
present
12.8.13 Basalt plains
and hills
Araucarian complex microphyll vine forest on Cainozoic
igneous rocks. Cleared for agriculture. Remnants can be
degraded by weed infestation in conjunction with wildfire
damage on margins.
Of concern Of concern
12.8.16 Basalt plains
and hills
Eucalyptus crebra +/- E. melliodora, E. tereticornis
woodland on Cainozoic igneous rocks
Of concern Of concern
12.11.18 Hills and
lowlands on
metamorphic
rocks
Eucalyptus moluccana woodland on metamorphics +/-
interbedded volcanics. Extensively cleared and thinned
for grazing and urban development.
Least concern No concern at
present
Cells shaded grey indicate threatened status of at least of concern under State or Commonwealth listings
Cells shaded orange indicate threatened status of at least endangered under State or Commonwealth listings

Bundaberg CHAS Sensitivity Assessment 13
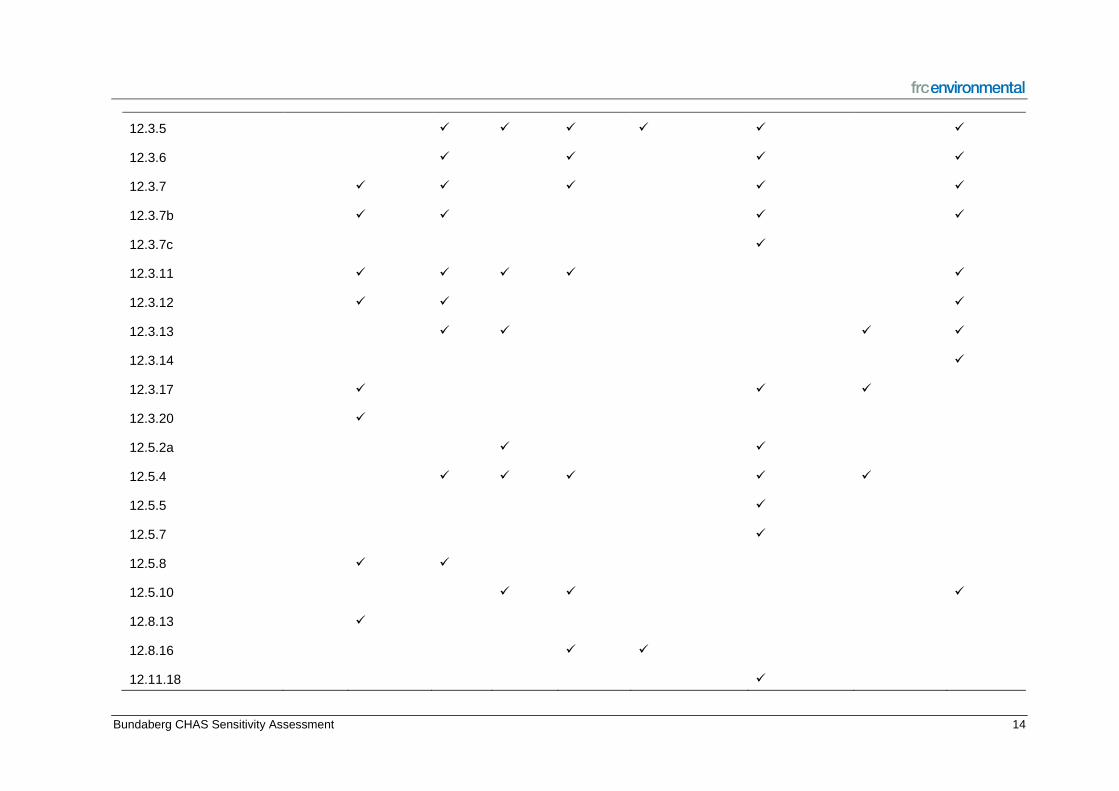
Table 3 Habitat types in each sub-region that would be impacted by the storm tide 1% AEP associated with an 80 cm increase in sea-level
rise.
Habitat Type / Regional
Ecosystem
Bargara Burnett
Heads
Buxton Coonarr
Elliot
Heads
Innes Park and
Coral Cove
Miara and
Norval Park
Moore Park
Beach
Woodgate
Estuary ✓ ✓ ✓ ✓ ✓ ✓ ✓ ✓ ✓
Small inlet ✓ ✓ ✓ ✓ ✓ ✓
Beach ✓ ✓ ✓ ✓ ✓ ✓ ✓ ✓
Rocky and coral reefs ✓ ✓ ✓ ✓ ✓ ✓ ✓
Seagrass ✓ ✓ ✓ ✓ ✓ ✓ ✓
Soft bottom habitat ✓ ✓ ✓ ✓ ✓ ✓ ✓ ✓ ✓
12.1.1 ✓ ✓ ✓ ✓ ✓ ✓
12.1.2 ✓ ✓ ✓ ✓ ✓ ✓ ✓ ✓
12.1.3 ✓ ✓ ✓ ✓ ✓ ✓ ✓ ✓ ✓
12.2.2 ✓ ✓ ✓
12.2.7 ✓ ✓ ✓ ✓ ✓
12.2.9 ✓ ✓ ✓
12.2.11 ✓ ✓ ✓ ✓ ✓ ✓ ✓ ✓ ✓
12.2.12 ✓ ✓ ✓
12.2.14 ✓ ✓ ✓ ✓ ✓
12.2.15 ✓ ✓ ✓
12.2.15a ✓
12.3.3 ✓ ✓ ✓ ✓
Bundaberg CHAS Sensitivity Assessment 14
12.3.5 ✓ ✓ ✓ ✓ ✓ ✓
12.3.6 ✓ ✓ ✓ ✓
12.3.7 ✓ ✓ ✓ ✓ ✓
12.3.7b ✓ ✓ ✓ ✓
12.3.7c ✓
12.3.11 ✓ ✓ ✓ ✓ ✓
12.3.12 ✓ ✓ ✓
12.3.13 ✓ ✓ ✓ ✓
12.3.14 ✓
12.3.17 ✓ ✓ ✓
12.3.20 ✓
12.5.2a ✓ ✓
12.5.4 ✓ ✓ ✓ ✓ ✓
12.5.5 ✓
12.5.7 ✓
12.5.8 ✓ ✓
12.5.10 ✓ ✓ ✓
12.8.13 ✓
12.8.16 ✓ ✓
12.11.18 ✓
Bundaberg CHAS Sensitivity Assessment 7
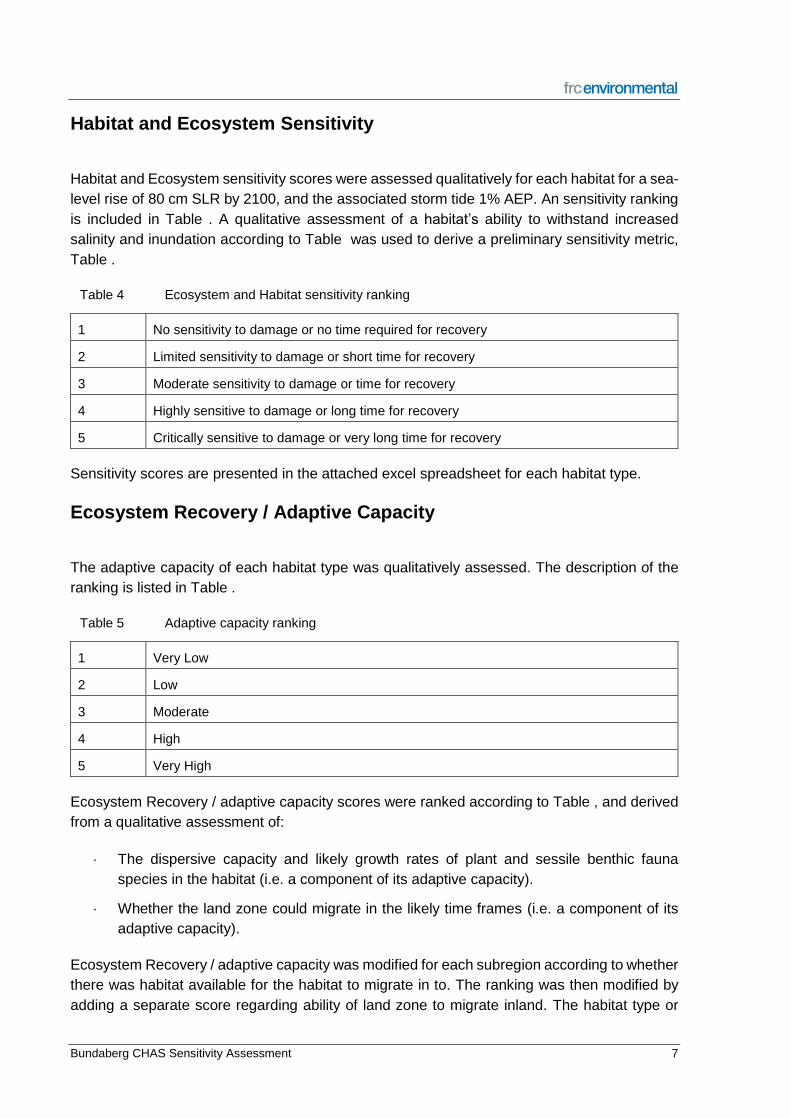
Habitat and Ecosystem Sensitivity
Habitat and Ecosystem sensitivity scores were assessed qualitatively for each habitat for a sea-
level rise of 80 cm SLR by 2100, and the associated storm tide 1% AEP. An sensitivity ranking
is included in Table . A qualitative assessment of a habitat’s ability to withstand increased
salinity and inundation according to Table was used to derive a preliminary sensitivity metric,
Table .
Table 4 Ecosystem and Habitat sensitivity ranking
1 No sensitivity to damage or no time required for recovery
2 Limited sensitivity to damage or short time for recovery
3 Moderate sensitivity to damage or time for recovery
4 Highly sensitive to damage or long time for recovery
5 Critically sensitive to damage or very long time for recovery
Sensitivity scores are presented in the attached excel spreadsheet for each habitat type.
Ecosystem Recovery / Adaptive Capacity
The adaptive capacity of each habitat type was qualitatively assessed. The description of the
ranking is listed in Table .
Table 5 Adaptive capacity ranking
1 Very Low
2 Low
3 Moderate
4 High
5 Very High
Ecosystem Recovery / adaptive capacity scores were ranked according to Table , and derived
from a qualitative assessment of:
The dispersive capacity and likely growth rates of plant and sessile benthic fauna
species in the habitat (i.e. a component of its adaptive capacity).
Whether the land zone could migrate in the likely time frames (i.e. a component of its
adaptive capacity).
Ecosystem Recovery / adaptive capacity was modified for each subregion according to whether
there was habitat available for the habitat to migrate in to. The ranking was then modified by
adding a separate score regarding ability of land zone to migrate inland. The habitat type or

Bundaberg CHAS Sensitivity Assessment 8
ecosystem score were then added together and divided by two in order to derive a mean score
for each habitat. This mean score is listed in the last column of Table .
Final adaptive capacity scores are presented in the vulnerability assessment results tables.
Final ecosystem recovery scores are presented in the consequence assessment results tables.

Bundaberg CHAS Sensitivity Assessment 7
Table 6 Preliminary sensitivity and recovery metrics for regional ecosystems and other habitats that will be disturbed by increased storm tides
and sea level rise.
Habitat Land Zone Description Sensitivity Comments Ecosystem
Sensitivity
Score
Dispersive
Capacity and
Likely
Growth
Rates
Ability of
Land
Zone to
Migrate
Inland
Adaptive
Capacity /
Ecosystem
Recovery
A B (A+B)/2
Estuary NA Tidally inundated estuary Tolerant of increased saline
inundation
2 5 5 5
Small inlet NA As per RE mapping Tolerant of increased saline
inundation
2 5 5 5
Beach NA Open sandy beach / sea turtle sensitive area Not tolerant of increased
depth
4 5 3 4
Rocky
and coral
reefs
NA Intertidal and subtidal headlands, rocky shorelines and shelfs,
subtidal rocky reefs and outcrops, intertidal pools and coral
reefs.
Some tolerance of increased
depth
2 1 1 1
Seagrass NA Intertidal and subtidal seagrass meadows present. Some tolerance of increased
depth
3 4 3 3
Soft
bottom
habitat
NA Unvegetated soft sediment habitat Some tolerance of increased
depth
3 5 4 4
12.1.1 Tidal flats and
beaches
Casuarina glauca woodland on margins of marine clay plains.
Infrequently tidally inundated. This RE occupies a very small
niche at upper end of tidal zone.
Not tolerant of increased
salinity
4 2 4 3
12.1.2 Tidal flats and
beaches
Saltpan vegetation including grassland, herbland and
sedgeland on marine clay plains. Usually occurs on
hypersaline Quaternary estuarine deposits. Tidally inundated
less frequently than mangroves. This ecosystem is under
threat from sea level rise along its seaward margins
Tolerant of increased salinity,
tolerant of increased depth
3 2 4 3
12.1.3 Tidal flats and
beaches
Mangrove shrubland to low closed forest on marine clay plains
and estuaries
Not tolerant of increased
depth
4 4 4 4

Bundaberg CHAS Sensitivity Assessment 8
Habitat Land Zone Description Sensitivity Comments Ecosystem
Sensitivity
Score
Dispersive
Capacity and
Likely
Growth
Rates
Ability of
Land
Zone to
Migrate
Inland
Adaptive
Capacity /
Ecosystem
Recovery
12.2.2 Coastal dunes
Microphyll/notophyll vine forest on beach ridges. Continues to
be threatened by clearing for coastal residential development.
Not tolerant of increased
depth or salinity
5 2 2 2.
12.2.7 Coastal dunes Melaleuca quinquenervia or rarely M. dealbata open forest on
sand plains
Not tolerant of increased
depth or salinity
5 2 2 2
12.2.9 Coastal dunes Banksia aemula low open woodland on dunes and sand plains.
Usually deeply leached soils. Extensively cleared for urban
development.
Not tolerant of increased
depth or salinity
5 2 2 2
12.2.11 Coastal dunes Corymbia tessellaris +/- Eucalyptus tereticornis, C. intermedia
and Livistona decora woodland on beach ridges in northern
half of bioregion. Contains palustrine wetland (e.g. in swales).
Not tolerant of increased
depth or salinity
5 2 2 2
12.2.12 Coastal dunes Closed heath on seasonally waterlogged sand plains.
Palustrine wetland (e.g. vegetated swamp).
Not tolerant of increased
depth or salinity
5 2 2 2
12.2.14 Coastal dunes Foredune complex. Strand and fore dune complex comprising
Spinifex sericeus grassland Casuarina equisetifolia subsp.
incana low woodland/open forest and with Acacia leiocalyx, A.
disparrima subsp. disparrima, Banksia integrifolia subsp.
integrifolia, Pandanus tectorius, Corymbia tessellaris,
Cupaniopsis anacardioides, Acronychia imperforata. Occurs
mostly on frontal dunes and beaches but can occur on
exposed parts of dunes further inland.
Not tolerant of increased
depth
5 4 2 3
12.2.15 Coastal dunes Gahnia sieberiana, Empodisma minus, Gleichenia spp. closed
sedgeland in coastal swamps. Palustrine wetland (e.g.
vegetated swamp).
Not tolerant of increased
depth or salinity
5 4 2 3
12.2.15a Coastal dunes Permanent and semi-permanent window lakes. Occurs as a
window into the water table on Quaternary coastal dunes and
beaches. Low part of coastal landscape where water collects
from both overland flow and infiltration from adjoining sand
dunes. Lacustrine wetland (e.g. lake).
Not tolerant of increased
salinity
2 2 2
Bundaberg CHAS Sensitivity Assessment 9
Habitat Land Zone Description Sensitivity Comments Ecosystem
Sensitivity
Score
Dispersive
Capacity and
Likely
Growth
Rates
Ability of
Land
Zone to
Migrate
Inland
Adaptive
Capacity /
Ecosystem
Recovery
12.3.3 Alluvial river
and creek flats
Eucalyptus tereticornis woodland on Quaternary alluvium.
Floodplain (other than floodplain wetlands).
Not tolerant of increased
depth or salinity
5 2 3 3
12.3.5 Alluvial river
and creek flats
Melaleuca quinquenervia open forest on coastal alluvium.
Palustrine wetland (e.g. vegetated swamp).
Not tolerant of increased
depth or salinity
5 3 3 3
12.3.6 Alluvial river
and creek flats
Melaleuca quinquenervia +/- Eucalyptus tereticornis,
Lophostemon suaveolens, Corymbia intermedia open forest
on coastal alluvial plains
Not tolerant of increased
depth or salinity
5 3 3 3
12.3.7 Alluvial river
and creek flats
Eucalyptus tereticornis, Casuarina cunninghamiana subsp.
cunninghamiana +/- Melaleuca spp. fringing woodland.
Palustrine wetland (e.g. vegetated swamp). Riverine wetland
or fringing riverine wetland.
Not tolerant of increased
depth or salinity
5 3 3 3
12.3.7b Alluvial river
and creek flats
Naturally occurring instream waterholes and lagoons, both
permanent and intermittent. Includes exposed stream bed and
bars. Occurs in the bed of active (may be intermittent) river
channels. Riverine wetland or fringing riverine wetland.
Not tolerant of increased
depth or salinity
5 3 3 3
12.3.7c Alluvial river
and creek flats
Billabongs and ox-bow lakes containing either permanent or
periodic water bodies. Often fringed with Eucalyptus
tereticornis Old river beds now cut off from regular flow.
Not tolerant of increased
depth or salinity
5 3 3 3
12.3.11 Alluvial river
and creek flats
Eucalyptus tereticornis +/- Eucalyptus siderophloia, Corymbia
intermedia open forest on alluvial plains usually near coast.
Not tolerant of increased
depth or salinity
5 3 3 3
12.3.12 Alluvial river
and creek flats
Eucalyptus latisinensis or E. exserta, Melaleuca viridiflora var.
viridiflora woodland on alluvial plains.
Not tolerant of increased
depth or salinity
5 3 3 3
12.3.13 Alluvial river
and creek flats
Closed heathland on seasonally waterlogged alluvial plains
usually near coast. Palustrine wetland (e.g. vegetated swamp).
Not tolerant of increased
depth or salinity
5 3 3 3
12.3.14 Alluvial river
and creek flats
Banksia aemula low woodland on alluvial plains usually near
coast
Not tolerant of increased
depth or salinity
5 3 3 3

Bundaberg CHAS Sensitivity Assessment 10
Habitat Land Zone Description Sensitivity Comments Ecosystem
Sensitivity
Score
Dispersive
Capacity and
Likely
Growth
Rates
Ability of
Land
Zone to
Migrate
Inland
Adaptive
Capacity /
Ecosystem
Recovery
12.3.17 Alluvial river
and creek flats
Simple notophyll fringing forest usually dominated by
Waterhousea floribunda. Riverine wetland or fringing riverine
wetland.
Not tolerant of increased
depth or salinity
5 3 3 3
12.3.20 Alluvial river
and creek flats
Melaleuca quinquenervia, Casuarina glauca +/- Eucalyptus
tereticornis, E. siderophloia open forest on low coastal alluvial
plains. Palustrine wetland (e.g. vegetated swamp).
Not tolerant of increased
depth or salinity
5 3 3 3
12.5.2a Old loamy and
sandy plains
12.5.2a: Corymbia intermedia, Eucalyptus tereticornis
woodland. Other species can include Lophostemon
suaveolens, Angophora leiocarpa, Eucalyptus acmenoides or
E. portuensis, E. siderophloia or E. crebra, Corymbia
tessellaris and Melaleuca quinquenervia (lower slopes).
Eucalyptus exserta is usually present in northern parts of
bioregion. Occurs on complex of remnant Tertiary surfaces +/-
Cainozoic and Mesozoic sediments usually in coastal areas
with deep red soils.
Not tolerant of increased
depth or salinity
5 3 2 2
12.5.4 Old loamy and
sandy plains
Eucalyptus latisinensis +/- Corymbia intermedia, C.
trachyphloia subsp. trachyphloia, Angophora leiocarpa,
Eucalyptus exserta woodland on complex of remnant Tertiary
surfaces and Cainozoic and Mesozoic sediments.
Not tolerant of increased
depth or salinity
5 3 2 2
12.5.5 Old loamy and
sandy plains
Eucalyptus portuensis, Corymbia intermedia open forest on
remnant Tertiary surfaces.
Not tolerant of increased
depth or salinity
5 3 2 2
12.5.7 Old loamy and
sandy plains
Corymbia citriodora subsp. variegata +/- Eucalyptus
portuensis or E. acmenoides, E. fibrosa subsp. fibrosa open
forest on remnant Tertiary surfaces.
Not tolerant of increased
depth or salinity
5 3 2 2
12.5.8 Old loamy and
sandy plains
Eucalyptus hallii open woodland on complex of remnant
Tertiary surface and Tertiary sedimentary rocks.
Not tolerant of increased
depth or salinity
5 3 2 2
12.5.10 Old loamy and
sandy plains
Eucalyptus latisinensis and/or Banksia aemula low open
woodland on complex of remnant Tertiary surface and Tertiary
sedimentary rocks
Not tolerant of increased
depth or salinity
5 3 2 2

Bundaberg CHAS Sensitivity Assessment 11
Habitat Land Zone Description Sensitivity Comments Ecosystem
Sensitivity
Score
Dispersive
Capacity and
Likely
Growth
Rates
Ability of
Land
Zone to
Migrate
Inland
Adaptive
Capacity /
Ecosystem
Recovery
12.8.13 Basalt plains
and hills
Araucarian complex microphyll vine forest on Cainozoic
igneous rocks. Cleared for agriculture. Remnants can be
degraded by weed infestation in conjunction with wildfire
damage on margins.
Not tolerant of increased
depth or salinity
5 3 1 2
12.8.16 Basalt plains
and hills
Eucalyptus crebra +/- E. melliodora, E. tereticornis woodland
on Cainozoic igneous rocks
Not tolerant of increased
depth or salinity
5 3 1 2
12.11.18 Hills and
lowlands on
metamorphic
rocks
Eucalyptus moluccana woodland on metamorphics +/-
interbedded volcanics.
Not tolerant of increased
depth or salinity
5 3 1 2

Bundaberg CHAS Sensitivity Assessment 7
Assessment of Overall Environmental Consequences
The assessment criteria for environmental consequence scale per coastal settlement is
listed in Table . The environmental consequences of sea-level rise and coastal hazards
were assessed based on the Table criteria.
Table 7 Assessment criteria for environmental consequences
Environmental – QERMF
Permanent destruction of an ecosystem or species
recognised at the Local, regional, State or national
level and / or severe damage to or loss of an ecosystem or species recognised at the State and national
level and / or significant loss or impairment of an ecosystem or species recognised at the
national level. Permanent destruction of environmental values of interest.
Consequence rating > 160
Minor damage to ecosystems or species recognised at the national level and / or significant loss or
impairment of an ecosystem or species
recognised at the State level and / or severe damage to or loss of an ecosystem or species recognised
at the Local or regional level. Severe damage to environmental values of
interest.
Consequence rating between 120 and 160
Minor damage to ecosystems and species recognised at the State level and / or significant loss or
impairment of an ecosystem or species
recognised at the Local or regional level. Significant damage to environmental values of interest.
Consequence rating between 80 and 120
Minor damage to ecosystems and species recognised at the Local or regional level.
Minor damage to environmental values of interest.
Consequence rating between 40 and 80
Bundaberg CHAS Sensitivity Assessment 8
References
Queensland Government 2016. Regional Ecosystem Framework.
https://www.qld.gov.au/environment/plants-
animals/plants/ecosystems/descriptions/framework. Accessed June 2019.
Queensland Government 2017. Biodiversity status and vegetation management class
https://www.qld.gov.au/environment/plants-
animals/plants/ecosystems/descriptions/biodiversity-status. Accessed June 2019.
Queensland Herbarium 2019. Regional Ecosystem Description Database (REDD). Version
11.1 (April 2019) (Queensland Department of Environment and Science:
Brisbane).
Sattler and Williams 1999

RISK ANALYSIS – ENVIRONMENTAL CONSEQUENCE
Methodology
The impacts to coastal ecosystems of significant ecological, conservational or biodiversity value were assessed by proportioning the range and scale of the
ecosystem types impacted combined with the ability of ecosystem to recover and the sensitivity of the ecosystem to a range of different likelihood coastal hazard
events and sea level scenarios. As the vulnerability assessment exercise provided an index-based measure of the environmental value and sensitivity of the
coastal ecosystems to different hazard types, risk was also assessed using an index-based approach.
The scale of the rating scores are shown in Table 1 and Table 2. Each score is then accumulated for each coastal settlement and assigned a value which is
evaluated within the consequence scale within Table 3.
TABLE 1 ECOSYSTEM SENSITIVITY RATING
Ecosystem Sensitivity Score
No sensitivity to damage or no time required for recovery 1
Limited sensitivity to damage or short time for recovery 2
Moderate sensitivity to damage or time for recovery 3
Highly sensitive to damage or long time for recovery 4
Critically sensitive to damage or very long time for recovery 5
TABLE 2 ECOSYSTEM RECOVERY RATING
Capacity of ecosystem to fully recover Score
Very Low 1
Low 2
Moderate 3
High 4
Very High 5
TABLE 3 ENVIRONMENTAL CONSEQUENCE SCALE
Environmental Consequence Calculated Score
Catastrophic 160+
Major 120-160
Moderate 80-120
Minor 40-80
Insignificant 0-40

Environmental consequence assessment results
Each table provides environmental index-based qualitative assessment of ecosystem recovery and sensitivity to a range of likelihood events and sea level rise scenarios.
MIARA & NORVAL PARK
CURRENT SEA LEVEL
5% AEP
2% AEP 1% AEP 0.2% AEP
Environmental Asset Ecosystem Recovery
Rating Ecosystem
Sensitivity Score TOTAL SCORE
Ecosystem Sensitivity Score
TOTAL SCORE Ecosystem
Sensitivity Score TOTAL SCORE
Ecosystem Sensitivity Score
TOTAL SCORE
Estuary 2 1 2 1 2 2 4 3 6
Small Inlet 2 1 2 1 2 2 4 3 6
Beach 1 2 2 3 3 4 4 5 5
Rocky and Coral Reefs 1 1 1 1 1 2 2 3 3
Seagrass 1 1 1 2 2 3 3 4 4
Soft Bottom Habitat 1 1 1 2 2 3 3 4 4
12.1.1 Tidal flats and beaches Casuarina glauca
1 2 2 3 3 4 4 5 5
12.2.2 Coastal dunes Microphyll/notophyll vine forest
1 3 3 4 4 5 5 5 5
12.2.12 Coastal dunes Closed heath
1 3 3 4 4 5 5 5 5
12.3.3 Alluvial river and creek flats Eucalyptus tereticornis
woodland 1 3 3 4 4 5 5 5 5
12.3.7 Alluvial river and creek flats Eucalyptus tereticornis
1 3 3 4 4 5 5 5 5
12.3.7b Alluvial river and creek flats Naturally occurring instream waterholes and
lagoons
1 3 3 4 4 5 5 5 5
12.3.7c Alluvial river and creek flats Billabongs and ox-bow
lakes 1 3 3 4 4 5 5 5 5
12.3.17 Alluvial river and creek flats Simple notophyll fringing
forest 1 3 3 4 4 5 5 5 5
12.5.2a Old loamy and sandy plains Corymbia intermediate
1 3 3 4 4 5 5 5 5
TOTAL 35 47 64 73
CONSEQUENCE Insignificant Insignificant Minor Minor
0.2M SEA LEVEL RISE
5% AEP
2% AEP 1% AEP 0.2% AEP
Environmental Asset Ecosystem Recovery
Rating Ecosystem
Sensitivity Score TOTAL SCORE
Ecosystem Sensitivity Score
TOTAL SCORE Ecosystem
Sensitivity Score TOTAL SCORE
Ecosystem Sensitivity Score
TOTAL SCORE
Estuary 3 1 3 1 3 2 6 3 9
Small Inlet 3 1 3 1 3 2 6 3 9
Beach 2 2 4 3 6 4 8 5 10
Rocky and Coral Reefs 1 1 1 1 1 2 2 3 3
Seagrass 1 1 1 2 2 3 3 4 4
Soft Bottom Habitat 2 1 2 2 4 3 6 4 8
12.1.1 Tidal flats and beaches Casuarina glauca
1 2 2 3 3 4 4 5 5
12.2.2 Coastal dunes Microphyll/notophyll vine forest
1 3 3 4 4 5 5 5 5
12.2.12 Coastal dunes Closed heath
1 3 3 4 4 5 5 5 5
12.3.3 Alluvial river and creek flats Eucalyptus tereticornis
woodland 1 3 3 4 4 5 5 5 5
12.3.7 Alluvial river and creek flats Eucalyptus tereticornis
1 3 3 4 4 5 5 5 5
12.3.7b Alluvial river and creek flats Naturally occurring instream waterholes and
lagoons
1 3 3 4 4 5 5 5 5
12.3.7c Alluvial river and creek flats Billabongs and ox-bow
lakes 1 3 3 4 4 5 5 5 5
12.3.17 Alluvial river and creek flats Simple notophyll fringing
forest 1 3 3 4 4 5 5 5 5
12.5.2a Old loamy and sandy plains Corymbia intermediate
1 3 3 4 4 5 5 5 5
TOTAL 40 54 75 88
CONSEQUENCE Insignificant Insignificant Minor Minor

0.4M SEA LEVEL RISE
5% AEP
2% AEP 1% AEP 0.2% AEP
Environmental Asset Ecosystem Recovery
Rating Ecosystem
Sensitivity Score TOTAL SCORE
Ecosystem Sensitivity Score
TOTAL SCORE Ecosystem
Sensitivity Score TOTAL SCORE
Ecosystem Sensitivity Score
TOTAL SCORE
Estuary 4 1 4 1 4 2 8 3 12
Small Inlet 4 1 4 1 4 2 8 3 12
Beach 3 2 6 3 9 4 12 5 15
Rocky and Coral Reefs 1 1 1 1 1 2 2 3 3
Seagrass 2 1 2 2 4 3 6 4 8
Soft Bottom Habitat 3 1 3 2 6 3 9 4 12
12.1.1 Tidal flats and beaches Casuarina glauca
2 2 4 3 6 4 8 5 10
12.2.2 Coastal dunes Microphyll/notophyll vine forest
1 3 3 4 4 5 5 5 5
12.2.12 Coastal dunes Closed heath
1 3 3 4 4 5 5 5 5
12.3.3 Alluvial river and creek flats Eucalyptus tereticornis
woodland 2 3 6 4 8 5 10 5 10
12.3.7 Alluvial river and creek flats Eucalyptus tereticornis
2 3 6 4 8 5 10 5 10
12.3.7b Alluvial river and creek flats Naturally occurring instream waterholes and
lagoons
2 3 6 4 8 5 10 5 10
12.3.7c Alluvial river and creek flats Billabongs and ox-bow
lakes 2 3 6 4 8 5 10 5 10
12.3.17 Alluvial river and creek flats Simple notophyll fringing
forest 2 3 6 4 8 5 10 5 10
12.5.2a Old loamy and sandy plains Corymbia intermediate
1 3 3 4 4 5 5 5 5
TOTAL 63 86 118 137
CONSEQUENCE Minor Minor Moderate Moderate
0.8M SEA LEVEL RISE
5% AEP 2% AEP 1% AEP 0.2% AEP
Environmental Asset Ecosystem Recovery
Rating Ecosystem
Sensitivity Score TOTAL SCORE
Ecosystem Sensitivity Score
TOTAL SCORE Ecosystem
Sensitivity Score TOTAL SCORE
Ecosystem Sensitivity Score
TOTAL SCORE
Estuary 5 1 5 1 5 2 10 3 15
Small Inlet 5 1 5 1 5 2 10 3 15
Beach 4 2 8 3 12 4 16 5 20
Rocky and Coral Reefs 1 1 1 1 1 2 2 3 3
Seagrass 3 1 3 2 6 3 9 4 12
Soft Bottom Habitat 4 1 4 2 8 3 12 4 16
12.1.1 Tidal flats and beaches Casuarina glauca
3 2 6 3 9 4 12 5 15
12.2.2 Coastal dunes Microphyll/notophyll vine forest
2 3 6 4 8 5 10 5 10
12.2.12 Coastal dunes Closed heath
2 3 6 4 8 5 10 5 10
12.3.3 Alluvial river and creek flats Eucalyptus tereticornis
woodland 3 3 9 4 12 5 15 5 15
12.3.7 Alluvial river and creek flats Eucalyptus tereticornis
3 3 9 4 12 5 15 5 15
12.3.7b Alluvial river and creek flats Naturally occurring instream waterholes and
lagoons
3 3 9 4 12 5 15 5 15
12.3.7c Alluvial river and creek flats Billabongs and ox-bow
lakes 3 3 9 4 12 5 15 5 15
12.3.17 Alluvial river and creek flats Simple notophyll fringing
forest 3 3 9 4 12 5 15 5 15
12.5.2a Old loamy and sandy plains Corymbia intermediate
2 3 6 4 8 5 10 5 10
TOTAL 95 130 176 201
CONSEQUENCE Minor Moderate Major Major
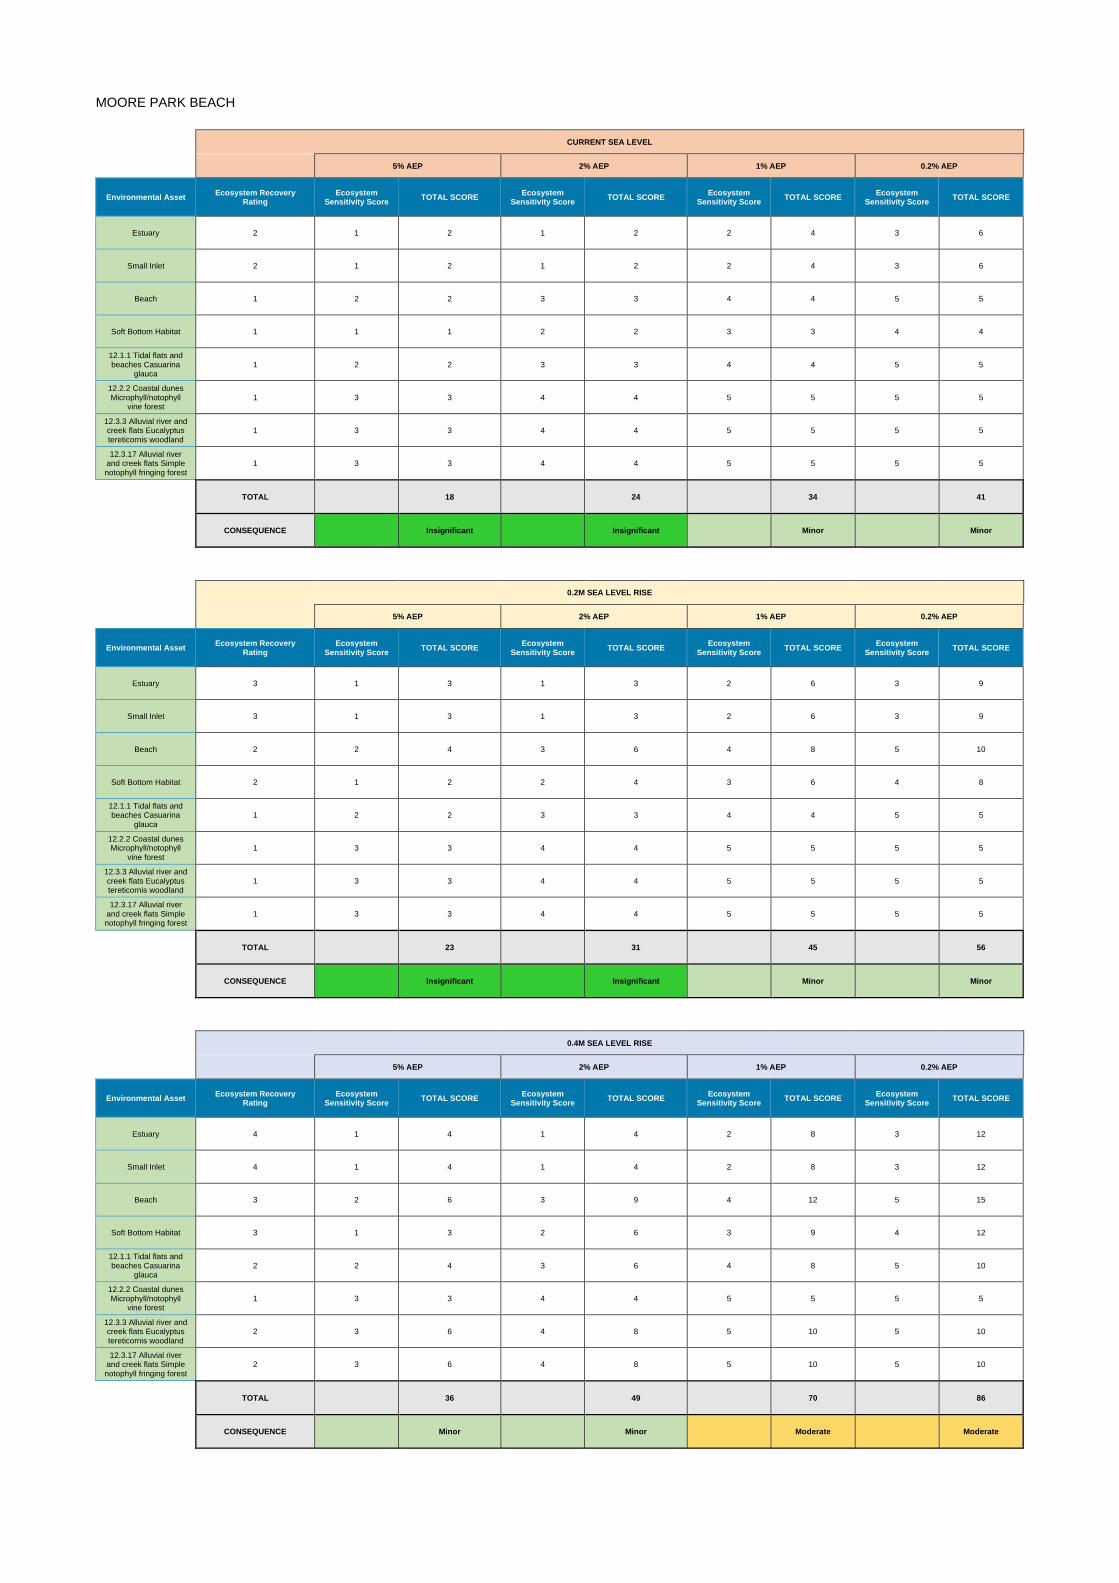
MOORE PARK BEACH
CURRENT SEA LEVEL
5% AEP 2% AEP 1% AEP 0.2% AEP
Environmental Asset Ecosystem Recovery
Rating Ecosystem
Sensitivity Score TOTAL SCORE
Ecosystem Sensitivity Score
TOTAL SCORE Ecosystem
Sensitivity Score TOTAL SCORE
Ecosystem Sensitivity Score
TOTAL SCORE
Estuary 2 1 2 1 2 2 4 3 6
Small Inlet 2 1 2 1 2 2 4 3 6
Beach 1 2 2 3 3 4 4 5 5
Soft Bottom Habitat 1 1 1 2 2 3 3 4 4
12.1.1 Tidal flats and beaches Casuarina
glauca 1 2 2 3 3 4 4 5 5
12.2.2 Coastal dunes Microphyll/notophyll
vine forest 1 3 3 4 4 5 5 5 5
12.3.3 Alluvial river and creek flats Eucalyptus tereticornis woodland
1 3 3 4 4 5 5 5 5
12.3.17 Alluvial river and creek flats Simple notophyll fringing forest
1 3 3 4 4 5 5 5 5
TOTAL 18 24 34 41
CONSEQUENCE Insignificant Insignificant Minor Minor
0.2M SEA LEVEL RISE
5% AEP 2% AEP 1% AEP 0.2% AEP
Environmental Asset Ecosystem Recovery
Rating Ecosystem
Sensitivity Score TOTAL SCORE
Ecosystem Sensitivity Score
TOTAL SCORE Ecosystem
Sensitivity Score TOTAL SCORE
Ecosystem Sensitivity Score
TOTAL SCORE
Estuary 3 1 3 1 3 2 6 3 9
Small Inlet 3 1 3 1 3 2 6 3 9
Beach 2 2 4 3 6 4 8 5 10
Soft Bottom Habitat 2 1 2 2 4 3 6 4 8
12.1.1 Tidal flats and beaches Casuarina
glauca 1 2 2 3 3 4 4 5 5
12.2.2 Coastal dunes Microphyll/notophyll
vine forest 1 3 3 4 4 5 5 5 5
12.3.3 Alluvial river and creek flats Eucalyptus tereticornis woodland
1 3 3 4 4 5 5 5 5
12.3.17 Alluvial river and creek flats Simple notophyll fringing forest
1 3 3 4 4 5 5 5 5
TOTAL 23 31 45 56
CONSEQUENCE Insignificant Insignificant Minor Minor
0.4M SEA LEVEL RISE
5% AEP 2% AEP 1% AEP 0.2% AEP
Environmental Asset Ecosystem Recovery
Rating Ecosystem
Sensitivity Score TOTAL SCORE
Ecosystem Sensitivity Score
TOTAL SCORE Ecosystem
Sensitivity Score TOTAL SCORE
Ecosystem Sensitivity Score
TOTAL SCORE
Estuary 4 1 4 1 4 2 8 3 12
Small Inlet 4 1 4 1 4 2 8 3 12
Beach 3 2 6 3 9 4 12 5 15
Soft Bottom Habitat 3 1 3 2 6 3 9 4 12
12.1.1 Tidal flats and beaches Casuarina
glauca 2 2 4 3 6 4 8 5 10
12.2.2 Coastal dunes Microphyll/notophyll
vine forest 1 3 3 4 4 5 5 5 5
12.3.3 Alluvial river and creek flats Eucalyptus tereticornis woodland
2 3 6 4 8 5 10 5 10
12.3.17 Alluvial river and creek flats Simple notophyll fringing forest
2 3 6 4 8 5 10 5 10
TOTAL 36 49 70 86
CONSEQUENCE Minor Minor Moderate Moderate

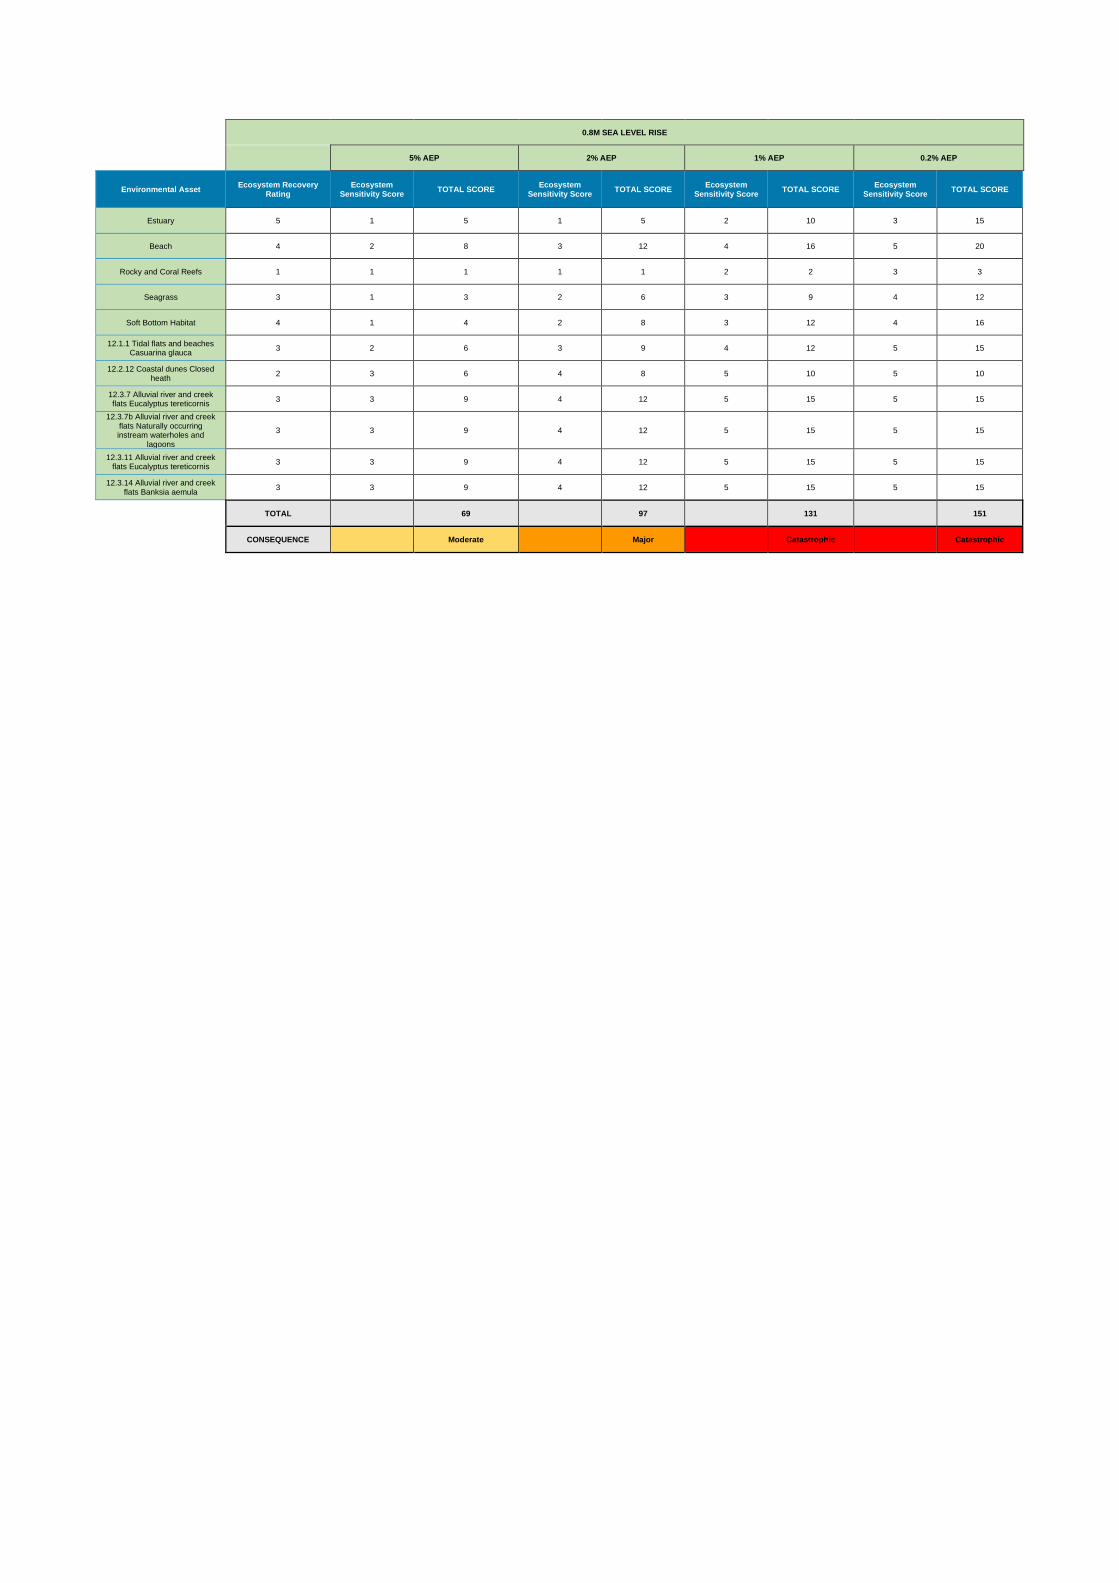
0.8M SEA LEVEL RISE
5% AEP 2% AEP 1% AEP 0.2% AEP
Environmental Asset Ecosystem Recovery
Rating Ecosystem
Sensitivity Score TOTAL SCORE
Ecosystem Sensitivity Score
TOTAL SCORE Ecosystem
Sensitivity Score TOTAL SCORE
Ecosystem Sensitivity Score
TOTAL SCORE
Estuary 5 1 5 1 5 2 10 3 15
Small Inlet 5 1 5 1 5 2 10 3 15
Beach 4 2 8 3 12 4 16 5 20
Soft Bottom Habitat 4 1 4 2 8 3 12 4 16
12.1.1 Tidal flats and beaches Casuarina
glauca 3 2 6 3 9 4 12 5 15
12.2.2 Coastal dunes Microphyll/notophyll
vine forest 2 3 6 4 8 5 10 5 10
12.3.3 Alluvial river and creek flats Eucalyptus tereticornis woodland
3 3 9 4 12 5 15 5 15
12.3.17 Alluvial river and creek flats Simple notophyll fringing forest
3 3 9 4 12 5 15 5 15
TOTAL 52 71 100 121
CONSEQUENCE Minor Moderate Major Major

BURNETT HEADS
CURRENT SEA LEVEL
5% AEP 2% AEP 1% AEP 0.2% AEP
Environmental Asset Ecosystem Recovery
Rating Ecosystem
Sensitivity Score TOTAL SCORE
Ecosystem Sensitivity Score
TOTAL SCORE Ecosystem
Sensitivity Score TOTAL SCORE
Ecosystem Sensitivity Score
TOTAL SCORE
Estuary 2 1 2 1 2 2 4 3 6
Beach 1 2 2 3 3 4 4 5 5
Rocky and Coral Reefs 1 1 1 1 1 2 2 3 3
Seagrass 1 1 1 2 2 3 3 4 4
Soft Bottom Habitat 1 1 1 2 2 3 3 4 4
12.1.1 Tidal flats and beaches Casuarina
glauca 1 2 2 3 3 4 4 5 5
12.3.3 Alluvial river and creek flats Eucalyptus tereticornis woodland
1 3 3 4 4 5 5 5 5
12.3.7 Alluvial river and creek flats Eucalyptus
tereticornis 1 3 3 4 4 5 5 5 5
12.3.7b Alluvial river and creek flats Naturally occurring instream
waterholes and lagoons
1 3 3 4 4 5 5 5 5
12.3.11 Alluvial river and creek flats Eucalyptus
tereticornis 1 3 3 4 4 5 5 5 5
12.5.8 Old loamy and sandy plains Eucalyptus
hallii open woodland 1 3 3 4 4 5 5 5 5
12.8.13 Basalt plains and hills Araucarian complex
1 3 3 4 4 5 5 5 5
TOTAL 24 33 45 52
CONSEQUENCE Insignificant Insignificant Insignificant Insignificant
0.2M SEA LEVEL RISE
5% AEP 2% AEP 1% AEP 0.2% AEP
Environmental Asset Ecosystem Recovery
Rating Ecosystem
Sensitivity Score TOTAL SCORE
Ecosystem Sensitivity Score
TOTAL SCORE Ecosystem
Sensitivity Score TOTAL SCORE
Ecosystem Sensitivity Score
TOTAL SCORE
Estuary 3 1 3 1 3 2 6 3 9
Beach 2 2 4 3 6 4 8 5 10
Rocky and Coral Reefs 1 1 1 1 1 2 2 3 3
Seagrass 1 1 1 2 2 3 3 4 4
Soft Bottom Habitat 2 1 2 2 4 3 6 4 8
12.1.1 Tidal flats and beaches Casuarina
glauca 1 2 2 3 3 4 4 5 5
12.3.3 Alluvial river and creek flats Eucalyptus tereticornis woodland
1 3 3 4 4 5 5 5 5
12.3.7 Alluvial river and creek flats Eucalyptus
tereticornis 1 3 3 4 4 5 5 5 5
12.3.7b Alluvial river and creek flats Naturally occurring instream
waterholes and lagoons
1 3 3 4 4 5 5 5 5
12.3.11 Alluvial river and creek flats Eucalyptus
tereticornis 1 3 3 4 4 5 5 5 5
12.5.8 Old loamy and sandy plains Eucalyptus
hallii open woodland 1 3 3 4 4 5 5 5 5
12.8.13 Basalt plains and hills Araucarian complex
1 3 3 4 4 5 5 5 5
TOTAL 28 39 54 64
CONSEQUENCE Insignificant Insignificant Insignificant Insignificant
0.4M SEA LEVEL RISE
5% AEP 2% AEP 1% AEP 0.2% AEP
Environmental Asset Ecosystem Recovery
Rating Ecosystem
Sensitivity Score TOTAL SCORE
Ecosystem Sensitivity Score
TOTAL SCORE Ecosystem
Sensitivity Score TOTAL SCORE
Ecosystem Sensitivity Score
TOTAL SCORE
Estuary 4 1 4 1 4 2 8 3 12
Beach 3 2 6 3 9 4 12 5 15
Rocky and Coral Reefs 1 1 1 1 1 2 2 3 3
Seagrass 2 1 2 2 4 3 6 4 8
Soft Bottom Habitat 3 1 3 2 6 3 9 4 12
12.1.1 Tidal flats and beaches Casuarina
glauca 2 2 4 3 6 4 8 5 10
12.3.3 Alluvial river and creek flats Eucalyptus tereticornis woodland
2 3 6 4 8 5 10 5 10
12.3.7 Alluvial river and creek flats Eucalyptus
tereticornis 2 3 6 4 8 5 10 5 10
12.3.7b Alluvial river and creek flats Naturally occurring instream
waterholes and lagoons
2 3 6 4 8 5 10 5 10
12.3.11 Alluvial river and creek flats Eucalyptus
tereticornis 2 3 6 4 8 5 10 5 10
12.5.8 Old loamy and sandy plains Eucalyptus
hallii open woodland 1 3 3 4 4 5 5 5 5
12.8.13 Basalt plains and hills Araucarian complex
1 3 3 4 4 5 5 5 5
TOTAL 47 66 90 105
CONSEQUENCE Insignificant Insignificant Minor Minor

0.8M SEA LEVEL RISE
5% AEP 2% AEP 1% AEP 0.2% AEP
Environmental Asset Ecosystem Recovery
Rating Ecosystem
Sensitivity Score TOTAL SCORE
Ecosystem Sensitivity Score
TOTAL SCORE Ecosystem
Sensitivity Score TOTAL SCORE
Ecosystem Sensitivity Score
TOTAL SCORE
Estuary 5 1 5 1 5 2 10 3 15
Beach 4 2 8 3 12 4 16 5 20
Rocky and Coral Reefs 1 1 1 1 1 2 2 3 3
Seagrass 3 1 3 2 6 3 9 4 12
Soft Bottom Habitat 4 1 4 2 8 3 12 4 16
12.1.1 Tidal flats and beaches Casuarina
glauca 3 2 6 3 9 4 12 5 15
12.3.3 Alluvial river and creek flats Eucalyptus tereticornis woodland
3 3 9 4 12 5 15 5 15
12.3.7 Alluvial river and creek flats Eucalyptus
tereticornis 3 3 9 4 12 5 15 5 15
12.3.7b Alluvial river and creek flats Naturally occurring instream
waterholes and lagoons
3 3 9 4 12 5 15 5 15
12.3.11 Alluvial river and creek flats Eucalyptus
tereticornis 3 3 9 4 12 5 15 5 15
12.5.8 Old loamy and sandy plains Eucalyptus
hallii open woodland 2 3 6 4 8 5 10 5 10
12.8.13 Basalt plains and hills Araucarian complex
2 3 6 4 8 5 10 5 10
TOTAL 69 97 131 151
CONSEQUENCE Insignificant Insignificant Minor Minor

BARGARA
CURRENT SEA LEVEL
5% AEP 2% AEP 1% AEP 0.2% AEP
Environmental Asset Ecosystem Recovery
Rating Ecosystem
Sensitivity Score TOTAL SCORE
Ecosystem Sensitivity Score
TOTAL SCORE Ecosystem
Sensitivity Score TOTAL SCORE
Ecosystem Sensitivity Score
TOTAL SCORE
Estuary 2 1 2 1 2 2 4 3 6
Small Inlet 2 1 2 1 2 2 4 3 6
Beach 1 2 2 3 3 4 4 5 5
Rocky and Coral Reefs 1 1 1 1 1 2 2 3 3
Seagrass 1 1 1 2 2 3 3 4 4
Soft Bottom Habitat 1 1 1 2 2 3 3 4 4
TOTAL 9 12 20 28
CONSEQUENCE Insignificant Insignificant Insignificant Insignificant
0.2M SEA LEVEL RISE
5% AEP 2% AEP 1% AEP 0.2% AEP
Environmental Asset Ecosystem Recovery
Rating Ecosystem
Sensitivity Score TOTAL SCORE
Ecosystem Sensitivity Score
TOTAL SCORE Ecosystem
Sensitivity Score TOTAL SCORE
Ecosystem Sensitivity Score
TOTAL SCORE
Estuary 3 1 3 1 3 2 6 3 9
Small Inlet 3 1 3 1 3 2 6 3 9
Beach 2 2 4 3 6 4 8 5 10
Rocky and Coral Reefs 1 1 1 1 1 2 2 3 3
Seagrass 1 1 1 2 2 3 3 4 4
Soft Bottom Habitat 2 1 2 2 4 3 6 4 8
TOTAL 14 19 31 43
CONSEQUENCE Insignificant Insignificant Insignificant Minor
0.4M SEA LEVEL RISE
5% AEP 2% AEP 1% AEP 0.2% AEP
Environmental Asset Ecosystem Recovery
Rating Ecosystem
Sensitivity Score TOTAL SCORE
Ecosystem Sensitivity Score
TOTAL SCORE Ecosystem
Sensitivity Score TOTAL SCORE
Ecosystem Sensitivity Score
TOTAL SCORE
Estuary 4 1 4 1 4 2 8 3 12
Small Inlet 4 1 4 1 4 2 8 3 12
Beach 3 2 6 3 9 4 12 5 15
Rocky and Coral Reefs 1 1 1 1 1 2 2 3 3
Seagrass 2 1 2 2 4 3 6 4 8
Soft Bottom Habitat 3 1 3 2 6 3 9 4 12
TOTAL 20 28 45 62
CONSEQUENCE Insignificant Insignificant Minor Minor
0.8M SEA LEVEL RISE
5% AEP 2% AEP 1% AEP 0.2% AEP
Environmental Asset Ecosystem Recovery
Rating Ecosystem
Sensitivity Score TOTAL SCORE
Ecosystem Sensitivity Score
TOTAL SCORE Ecosystem
Sensitivity Score TOTAL SCORE
Ecosystem Sensitivity Score
TOTAL SCORE
Estuary 5 1 5 1 5 2 10 3 15
Small Inlet 5 0 0 1 5 2 10 3 15
Beach 4 2 8 3 12 4 16 5 20
Rocky and Coral Reefs 1 1 1 1 1 2 2 3 3
Seagrass 3 1 3 2 6 3 9 4 12
Soft Bottom Habitat 4 1 4 2 8 3 12 4 16
TOTAL 21 37 59 81
CONSEQUENCE
Insignificant
Insignificant Minor Moderate

INNES PARK & CORAL COVE
CURRENT SEA LEVEL
5% AEP 2% AEP 1% AEP 0.2% AEP
Environmental Asset Ecosystem Recovery
Rating
Ecosystem Sensitivity
Score TOTAL SCORE
Ecosystem Sensitivity
Score TOTAL SCORE
Ecosystem Sensitivity
Score TOTAL SCORE
Ecosystem Sensitivity
Score TOTAL SCORE
Estuary 2 1 2 1 2 2 4 3 6
Beach 1 2 2 3 3 4 4 5 5
Rocky and Coral Reefs 1 1 1 1 1 2 2 3 3
Seagrass 1 1 1 2 2 3 3 4 4
Soft Bottom Habitat 1 1 1 2 2 3 3 4 4
12.8.16 Basalt plains and hills Eucalyptus crebra 1 3 3 4 4 5 5 5 5
TOTAL 10 14 21 27
CONSEQUENCE Insignificant Insignificant Minor Minor
0.2M SEA LEVEL RISE
5% AEP 2% AEP 1% AEP 0.2% AEP
Environmental Asset Ecosystem Recovery
Rating
Ecosystem Sensitivity
Score TOTAL SCORE
Ecosystem Sensitivity
Score TOTAL SCORE
Ecosystem Sensitivity
Score TOTAL SCORE
Ecosystem Sensitivity
Score TOTAL SCORE
Estuary 3 1 3 1 3 2 6 3 9
Beach 2 2 4 3 6 4 8 5 10
Rocky and Coral Reefs 1 1 1 1 1 2 2 3 3
Seagrass 1 1 1 2 2 3 3 4 4
Soft Bottom Habitat 2 1 2 2 4 3 6 4 8
12.8.16 Basalt plains and hills Eucalyptus crebra 1 3 3 4 4 5 5 5 5
TOTAL 14 20 30 39
CONSEQUENCE Insignificant Insignificant Minor Minor
0.4M SEA LEVEL RISE
5% AEP 2% AEP 1% AEP 0.2% AEP
Environmental Asset Ecosystem Recovery
Rating
Ecosystem Sensitivity
Score TOTAL SCORE
Ecosystem Sensitivity
Score TOTAL SCORE
Ecosystem Sensitivity
Score TOTAL SCORE
Ecosystem Sensitivity
Score TOTAL SCORE
Estuary 4 1 4 1 4 2 8 3 12
Beach 3 2 6 3 9 4 12 5 15
Rocky and Coral Reefs 1 1 1 1 1 2 2 3 3
Seagrass 2 1 2 2 4 3 6 4 8
Soft Bottom Habitat 3 1 3 2 6 3 9 4 12
12.8.16 Basalt plains and hills Eucalyptus crebra 1 3 3 4 4 5 5 5 5
TOTAL 19 28 42 55
CONSEQUENCE Insignificant Minor Minor Moderate
0.8M SEA LEVEL RISE
5% AEP 2% AEP 1% AEP 0.2% AEP
Environmental Asset Ecosystem Recovery
Rating
Ecosystem Sensitivity
Score TOTAL SCORE
Ecosystem Sensitivity
Score TOTAL SCORE
Ecosystem Sensitivity
Score TOTAL SCORE
Ecosystem Sensitivity
Score TOTAL SCORE
Estuary 5 1 5 1 5 2 10 3 15
Beach 4 2 8 3 12 4 16 5 20
Rocky and Coral Reefs 1 1 1 1 1 2 2 3 3
Seagrass 3 1 3 2 6 3 9 4 12
Soft Bottom Habitat 4 1 4 2 8 3 12 4 16
12.8.16 Basalt plains and hills Eucalyptus crebra 2 3 6 4 8 5 10 5 10
TOTAL 27 40 59 76
CONSEQUENCE Minor Minor Moderate Major

ELLIOTT HEADS
CURRENT SEA LEVEL
5% AEP 2% AEP 1% AEP 0.2% AEP
Environmental Asset Ecosystem Recovery
Rating Ecosystem
Sensitivity Score TOTAL SCORE
Ecosystem Sensitivity Score
TOTAL SCORE Ecosystem
Sensitivity Score TOTAL SCORE
Ecosystem Sensitivity Score
TOTAL SCORE
Estuary 2 1 2 1 2 2 4 3 6
Small Inlet 2 1 2 1 2 2 4 3 6
Beach 1 2 2 3 3 4 4 5 5
Rocky and Coral Reefs 1 1 1 1 1 2 2 3 3
Seagrass 1 1 1 2 2 3 3 4 4
Soft Bottom Habitat 1 1 1 2 2 3 3 4 4
12.1.1 Tidal flats and beaches Casuarina glauca
1 2 2 3 3 4 4 5 5
12.3.3 Alluvial river and creek flats Eucalyptus tereticornis
woodland 1 3 3 4 4 5 5 5 5
12.3.7 Alluvial river and creek flats Eucalyptus tereticornis
1 3 3 4 4 5 5 5 5
12.3.11 Alluvial river and creek flats Eucalyptus tereticornis
1 3 3 4 4 5 5 5 5
12.8.16 Basalt plains and hills Eucalyptus crebra
1 3 3 4 4 5 5 5 5
TOTAL 23 31 44 53
CONSEQUENCE Insignificant Insignificant Minor Minor
0.2M SEA LEVEL RISE
5% AEP 2% AEP 1% AEP 0.2% AEP
Environmental Asset Ecosystem Recovery
Rating Ecosystem
Sensitivity Score TOTAL SCORE
Ecosystem Sensitivity Score
TOTAL SCORE Ecosystem
Sensitivity Score TOTAL SCORE
Ecosystem Sensitivity Score
TOTAL SCORE
Estuary 3 1 3 1 3 2 6 3 9
Small Inlet 3 1 3 1 3 2 6 3 9
Beach 2 2 4 3 6 4 8 5 10
Rocky and Coral Reefs 1 1 1 1 1 2 2 3 3
Seagrass 1 1 1 2 2 3 3 4 4
Soft Bottom Habitat 2 1 2 2 4 3 6 4 8
12.1.1 Tidal flats and beaches Casuarina glauca
1 2 2 3 3 4 4 5 5
12.3.3 Alluvial river and creek flats Eucalyptus tereticornis
woodland 1 3 3 4 4 5 5 5 5
12.3.7 Alluvial river and creek flats Eucalyptus tereticornis
1 3 3 4 4 5 5 5 5
12.3.11 Alluvial river and creek flats Eucalyptus tereticornis
1 3 3 4 4 5 5 5 5
12.8.16 Basalt plains and hills Eucalyptus crebra
1 3 3 4 4 5 5 5 5
TOTAL 28 38 55 68
CONSEQUENCE Insignificant Insignificant Minor Minor
0.4M SEA LEVEL RISE
5% AEP 2% AEP 1% AEP 0.2% AEP
Environmental Asset Ecosystem Recovery
Rating Ecosystem
Sensitivity Score TOTAL SCORE
Ecosystem Sensitivity Score
TOTAL SCORE Ecosystem
Sensitivity Score TOTAL SCORE
Ecosystem Sensitivity Score
TOTAL SCORE
Estuary 4 1 4 1 4 2 8 3 12
Small Inlet 4 1 4 1 4 2 8 3 12
Beach 3 2 6 3 9 4 12 5 15
Rocky and Coral Reefs 1 1 1 1 1 2 2 3 3
Seagrass 2 1 2 2 4 3 6 4 8
Soft Bottom Habitat 3 1 3 2 6 3 9 4 12
12.1.1 Tidal flats and beaches Casuarina glauca
2 2 4 3 6 4 8 5 10
12.3.3 Alluvial river and creek flats Eucalyptus tereticornis
woodland 2 3 6 4 8 5 10 5 10
12.3.7 Alluvial river and creek flats Eucalyptus tereticornis
2 3 6 4 8 5 10 5 10
12.3.11 Alluvial river and creek flats Eucalyptus tereticornis
2 3 6 4 8 5 10 5 10
12.8.16 Basalt plains and hills Eucalyptus crebra
1 3 3 4 4 5 5 5 5
TOTAL 45 62 88 107
CONSEQUENCE Minor Minor Moderate Moderate

0.8M SEA LEVEL RISE
5% AEP 2% AEP 1% AEP 0.2% AEP
Environmental Asset Ecosystem Recovery
Rating Ecosystem
Sensitivity Score TOTAL SCORE
Ecosystem Sensitivity Score
TOTAL SCORE Ecosystem
Sensitivity Score TOTAL SCORE
Ecosystem Sensitivity Score
TOTAL SCORE
Estuary 5 1 5 1 5 2 10 3 15
Small Inlet 5 1 5 1 5 2 10 3 15
Beach 4 2 8 3 12 4 16 5 20
Rocky and Coral Reefs 1 1 1 1 1 2 2 3 3
Seagrass 3 1 3 2 6 3 9 4 12
Soft Bottom Habitat 4 1 4 2 8 3 12 4 16
12.1.1 Tidal flats and beaches Casuarina glauca
3 2 6 3 9 4 12 5 15
12.3.3 Alluvial river and creek flats Eucalyptus tereticornis
woodland 3 3 9 4 12 5 15 5 15
12.3.7 Alluvial river and creek flats Eucalyptus tereticornis
3 3 9 4 12 5 15 5 15
12.3.11 Alluvial river and creek flats Eucalyptus tereticornis
3 3 9 4 12 5 15 5 15
12.8.16 Basalt plains and hills Eucalyptus crebra
2 3 5 4 8 5 10 6 12
TOTAL 64 90 126 153
CONSEQUENCE Minor Moderate Major Major

COONARR
CURRENT SEA LEVEL
5% AEP 2% AEP 1% AEP 0.2% AEP
Environmental Asset Ecosystem Recovery
Rating Ecosystem
Sensitivity Score TOTAL SCORE
Ecosystem Sensitivity Score
TOTAL SCORE Ecosystem
Sensitivity Score TOTAL SCORE
Ecosystem Sensitivity Score
TOTAL SCORE
Estuary 2 1 2 1 2 2 4 3 6
Small Inlet 2 1 2 1 2 2 4 3 6
Beach 1 2 2 3 3 4 4 5 5
Rocky and Coral Reefs 1 1 1 1 1 2 2 3 3
Soft Bottom Habitat 1 1 1 2 2 3 3 4 4
12.1.1 Tidal flats and beaches Casuarina glauca
1 2 2 3 3 4 4 5 5
12.2.2 Coastal dunes Microphyll/notophyll vine forest
1 3 3 4 4 5 5 5 5
12.2.12 Coastal dunes Closed heath
1 3 3 4 4 5 5 5 5
12.3.11 Alluvial river and creek flats Eucalyptus tereticornis
1 3 3 4 4 5 5 5 5
12.5.2a Old loamy and sandy plains Corymbia intermediate
1 3 3 4 4 5 5 5 5
TOTAL 22 29 41 49
CONSEQUENCE Insignificant Insignificant Insignificant Minor
0.2M SEA LEVEL RISE
5% AEP 2% AEP 1% AEP 0.2% AEP
Environmental Asset Ecosystem Recovery
Rating Ecosystem
Sensitivity Score TOTAL SCORE
Ecosystem Sensitivity Score
TOTAL SCORE Ecosystem
Sensitivity Score TOTAL SCORE
Ecosystem Sensitivity Score
TOTAL SCORE
Estuary 3 1 3 1 3 2 6 3 9
Small Inlet 3 1 3 1 3 2 6 3 9
Beach 2 2 4 3 6 4 8 5 10
Rocky and Coral Reefs 1 1 1 1 1 2 2 3 3
Soft Bottom Habitat 2 1 2 2 4 3 6 4 8
12.1.1 Tidal flats and beaches Casuarina glauca
1 2 2 3 3 4 4 5 5
12.2.2 Coastal dunes Microphyll/notophyll vine forest
1 3 3 4 4 5 5 5 5
12.2.12 Coastal dunes Closed heath
1 3 3 4 4 5 5 5 5
12.3.11 Alluvial river and creek flats Eucalyptus tereticornis
1 3 3 4 4 5 5 5 5
12.5.2a Old loamy and sandy plains Corymbia intermediate
1 3 3 4 4 5 5 5 5
TOTAL 27 36 52 64
CONSEQUENCE Insignificant Insignificant Minor Minor
0.4M SEA LEVEL RISE
5% AEP 2% AEP 1% AEP 0.2% AEP
Environmental Asset Ecosystem Recovery
Rating Ecosystem
Sensitivity Score TOTAL SCORE
Ecosystem Sensitivity Score
TOTAL SCORE Ecosystem
Sensitivity Score TOTAL SCORE
Ecosystem Sensitivity Score
TOTAL SCORE
Estuary 4 1 4 1 4 2 8 3 12
Small Inlet 4 1 4 1 4 2 8 3 12
Beach 3 2 6 3 9 4 12 5 15
Rocky and Coral Reefs 0 1 0 1 0 2 0 3 0
Soft Bottom Habitat 3 1 3 2 6 3 9 4 12
12.1.1 Tidal flats and beaches Casuarina glauca
2 2 4 3 6 4 8 5 10
12.2.2 Coastal dunes Microphyll/notophyll vine forest
1 3 3 4 4 5 5 5 5
12.2.12 Coastal dunes Closed heath
1 3 3 4 4 5 5 5 5
12.3.11 Alluvial river and creek flats Eucalyptus tereticornis
2 3 6 4 8 5 10 5 10
12.5.2a Old loamy and sandy plains Corymbia intermediate
1 3 3 4 4 5 5 5 5
TOTAL 36 49 70 86
CONSEQUENCE Insignificant Minor Minor Moderate

0.8M SEA LEVEL RISE
5% AEP 2% AEP 1% AEP 0.2% AEP
Environmental Asset Ecosystem Recovery
Rating Ecosystem
Sensitivity Score TOTAL SCORE
Ecosystem Sensitivity Score
TOTAL SCORE Ecosystem
Sensitivity Score TOTAL SCORE
Ecosystem Sensitivity Score
TOTAL SCORE
Estuary 5 1 5 1 5 2 10 3 15
Small Inlet 5 1 5 1 5 2 10 3 15
Beach 4 2 8 3 12 4 16 5 20
Rocky and Coral Reefs 1 1 1 1 1 2 2 3 3
Soft Bottom Habitat 4 1 4 2 8 3 12 4 16
12.1.1 Tidal flats and beaches Casuarina glauca
3 2 6 3 9 4 12 5 15
12.2.2 Coastal dunes Microphyll/notophyll vine forest
2 3 6 4 8 5 10 5 10
12.2.12 Coastal dunes Closed heath
2 3 6 4 8 5 10 5 10
12.3.11 Alluvial river and creek flats Eucalyptus tereticornis
3 3 9 4 12 5 15 5 15
12.5.2a Old loamy and sandy plains Corymbia intermediate
2 3 6 4 8 5 10 5 10
TOTAL 56 76 107 129
CONSEQUENCE Minor Minor Moderate Major

WOODGATE BEACH & WALKERS POINT
CURRENT SEA LEVEL
5% AEP 2% AEP 1% AEP 0.2% AEP
Environmental Asset Ecosystem Recovery
Rating Ecosystem
Sensitivity Score TOTAL SCORE
Ecosystem Sensitivity Score
TOTAL SCORE Ecosystem
Sensitivity Score TOTAL SCORE
Ecosystem Sensitivity Score
TOTAL SCORE
Estuary 2 1 2 1 2 2 4 3 6
Beach 1 2 2 3 3 4 4 5 5
Rocky and Coral Reefs 1 1 1 1 1 2 2 3 3
Seagrass 1 1 1 2 2 3 3 4 4
Soft Bottom Habitat 1 1 1 2 2 3 3 4 4
12.1.1 Tidal flats and beaches Casuarina glauca
1 2 2 3 3 4 4 5 5
12.2.12 Coastal dunes Closed heath
1 3 3 4 4 5 5 5 5
12.3.7 Alluvial river and creek flats Eucalyptus tereticornis
1 3 3 4 4 5 5 5 5
12.3.7b Alluvial river and creek flats Naturally occurring instream waterholes and
lagoons
1 3 3 4 4 5 5 5 5
12.3.11 Alluvial river and creek flats Eucalyptus tereticornis
1 3 3 4 4 5 5 5 5
12.3.14 Alluvial river and creek flats Banksia aemula
1 3 3 4 4 5 5 5 5
TOTAL 24 33 45 52
CONSEQUENCE Insignificant Minor Minor Minor
0.2M SEA LEVEL RISE
5% AEP 2% AEP 1% AEP 0.2% AEP
Environmental Asset Ecosystem Recovery
Rating Ecosystem
Sensitivity Score TOTAL SCORE
Ecosystem Sensitivity Score
TOTAL SCORE Ecosystem
Sensitivity Score TOTAL SCORE
Ecosystem Sensitivity Score
TOTAL SCORE
Estuary 3 1 3 1 3 2 6 3 9
Beach 2 2 4 3 6 4 8 5 10
Rocky and Coral Reefs 1 1 1 1 1 2 2 3 3
Seagrass 1 1 1 2 2 3 3 4 4
Soft Bottom Habitat 2 1 2 2 4 3 6 4 8
12.1.1 Tidal flats and beaches Casuarina glauca
1 2 2 3 3 4 4 5 5
12.2.12 Coastal dunes Closed heath
1 3 3 4 4 5 5 5 5
12.3.7 Alluvial river and creek flats Eucalyptus tereticornis
1 3 3 4 4 5 5 5 5
12.3.7b Alluvial river and creek flats Naturally occurring instream waterholes and
lagoons
1 3 3 4 4 5 5 5 5
12.3.11 Alluvial river and creek flats Eucalyptus tereticornis
1 3 3 4 4 5 5 5 5
12.3.14 Alluvial river and creek flats Banksia aemula
1 3 3 4 4 5 5 5 5
TOTAL 28 39 54 64
CONSEQUENCE Insignificant Minor Minor Moderate
0.4M SEA LEVEL RISE
5% AEP 2% AEP 1% AEP 0.2% AEP
Environmental Asset Ecosystem Recovery
Rating Ecosystem
Sensitivity Score TOTAL SCORE
Ecosystem Sensitivity Score
TOTAL SCORE Ecosystem
Sensitivity Score TOTAL SCORE
Ecosystem Sensitivity Score
TOTAL SCORE
Estuary 4 1 4 1 4 2 8 3 12
Beach 3 2 6 3 9 4 12 5 15
Rocky and Coral Reefs 1 1 1 1 1 2 2 3 3
Seagrass 2 1 2 2 4 3 6 4 8
Soft Bottom Habitat 3 1 3 2 6 3 9 4 12
12.1.1 Tidal flats and beaches Casuarina glauca
2 2 4 3 6 4 8 5 10
12.2.12 Coastal dunes Closed heath
1 3 3 4 4 5 5 5 5
12.3.7 Alluvial river and creek flats Eucalyptus tereticornis
2 3 6 4 8 5 10 5 10
12.3.7b Alluvial river and creek flats Naturally occurring instream waterholes and
lagoons
2 3 6 4 8 5 10 5 10
12.3.11 Alluvial river and creek flats Eucalyptus tereticornis
2 3 6 4 8 5 10 5 10
12.3.14 Alluvial river and creek flats Banksia aemula
2 3 6 4 8 5 10 5 10
TOTAL 47 66 90 105
CONSEQUENCE Minor Moderate Moderate Major
0.8M SEA LEVEL RISE
5% AEP 2% AEP 1% AEP 0.2% AEP
Environmental Asset Ecosystem Recovery
Rating Ecosystem
Sensitivity Score TOTAL SCORE
Ecosystem Sensitivity Score
TOTAL SCORE Ecosystem
Sensitivity Score TOTAL SCORE
Ecosystem Sensitivity Score
TOTAL SCORE
Estuary 5 1 5 1 5 2 10 3 15
Beach 4 2 8 3 12 4 16 5 20
Rocky and Coral Reefs 1 1 1 1 1 2 2 3 3
Seagrass 3 1 3 2 6 3 9 4 12
Soft Bottom Habitat 4 1 4 2 8 3 12 4 16
12.1.1 Tidal flats and beaches Casuarina glauca
3 2 6 3 9 4 12 5 15
12.2.12 Coastal dunes Closed heath
2 3 6 4 8 5 10 5 10
12.3.7 Alluvial river and creek flats Eucalyptus tereticornis
3 3 9 4 12 5 15 5 15
12.3.7b Alluvial river and creek flats Naturally occurring instream waterholes and
lagoons
3 3 9 4 12 5 15 5 15
12.3.11 Alluvial river and creek flats Eucalyptus tereticornis
3 3 9 4 12 5 15 5 15
12.3.14 Alluvial river and creek flats Banksia aemula
3 3 9 4 12 5 15 5 15
TOTAL 69 97 131 151
CONSEQUENCE Moderate Major Catastrophic Catastrophic

BUXTON
CURRENT SEA LEVEL
5% AEP 2% AEP 1% AEP 0.2% AEP
Environmental Asset
Ecosystem Recovery Rating
Ecosystem Sensitivity Score
TOTAL SCORE Ecosystem
Sensitivity Score TOTAL SCORE
Ecosystem Sensitivity Score
TOTAL SCORE Ecosystem
Sensitivity Score TOTAL SCORE
Estuary 2 1 2 1 2 2 4 3 6
Small Inlet 2 1 2 1 2 2 4 3 6
Seagrass 1 1 1 2 2 3 3 4 4
Soft Bottom Habitat 1 1 1 2 2 3 3 4 4
12.3.7 Alluvial river and creek flats
Eucalyptus tereticornis
1 3 3 4 4 5 5 5 5
12.3.7b Alluvial river and creek flats
Naturally occurring instream waterholes
and lagoons
1 3 3 4 4 5 5 5 5
12.3.11 Alluvial river and creek flats
Eucalyptus tereticornis
1 3 3 4 4 5 5 5 5
12.5.8 Old loamy and sandy plains
Eucalyptus hallii open woodland
1 3 4 5 5 5
TOTAL 15 20 34 35
CONSEQUENCE Insignificant Insignificant Insignificant Insignificant
0.2M SEA LEVEL RISE
5% AEP 2% AEP 1% AEP 0.2% AEP
Environmental Asset
Ecosystem Recovery Rating
Ecosystem Sensitivity Score
TOTAL SCORE Ecosystem
Sensitivity Score TOTAL SCORE
Ecosystem Sensitivity Score
TOTAL SCORE Ecosystem
Sensitivity Score TOTAL SCORE
Estuary 3 1 3 1 3 2 6 3 9
Small Inlet 3 1 3 1 3 2 6 3 9
Seagrass 1 1 1 2 2 3 3 4 4
Soft Bottom Habitat 2 1 2 2 4 3 6 4 8
12.3.7 Alluvial river and creek flats
Eucalyptus tereticornis
1 3 3 4 4 5 5 5 5
12.3.7b Alluvial river and creek flats
Naturally occurring instream waterholes
and lagoons
1 3 3 4 4 5 5 5 5
12.3.11 Alluvial river and creek flats
Eucalyptus tereticornis
1 3 3 4 4 5 5 5 5
12.5.8 Old loamy and sandy plains
Eucalyptus hallii open woodland
1 3 4 5 5 5
TOTAL 18 24 41 45
CONSEQUENCE Insignificant Insignificant Minor Minor
0.4M SEA LEVEL RISE
5% AEP 2% AEP 1% AEP 0.2% AEP
Environmental Asset
Ecosystem Recovery Rating
Ecosystem Sensitivity Score
TOTAL SCORE Ecosystem
Sensitivity Score TOTAL SCORE
Ecosystem Sensitivity Score
TOTAL SCORE Ecosystem
Sensitivity Score TOTAL SCORE
Estuary 4 1 4 1 4 2 8 3 12
Small Inlet 4 1 4 1 4 2 8 3 12
Seagrass 2 1 2 2 4 3 6 4 8
Soft Bottom Habitat 3 1 3 2 6 3 9 4 12
12.3.7 Alluvial river and creek flats
Eucalyptus tereticornis
2 3 6 4 8 5 10 5 10
12.3.7b Alluvial river and creek flats
Naturally occurring instream waterholes
and lagoons
2 3 6 4 8 5 10 5 10
12.3.11 Alluvial river and creek flats
Eucalyptus tereticornis
2 3 6 4 8 5 10 5 10
12.5.8 Old loamy and sandy plains
Eucalyptus hallii open woodland
1 3 3 4 4 5 5 5 5
TOTAL 34 46 66 79
CONSEQUENCE Insignificant Minor Minor Minor

0.8M SEA LEVEL RISE
5% AEP 2% AEP 1% AEP 0.2% AEP
Environmental Asset
Ecosystem Recovery Rating
Ecosystem Sensitivity Score
TOTAL SCORE Ecosystem
Sensitivity Score TOTAL SCORE
Ecosystem Sensitivity Score
TOTAL SCORE Ecosystem
Sensitivity Score TOTAL SCORE
Estuary 5 1 5 1 5 2 10 3 15
Small Inlet 5 1 5 1 5 2 10 3 15
Seagrass 3 1 3 2 6 3 9 4 12
Soft Bottom Habitat 4 1 4 2 8 3 12 4 16
12.3.7 Alluvial river and creek flats
Eucalyptus tereticornis
3 3 9 4 12 5 15 5 15
12.3.7b Alluvial river and creek flats
Naturally occurring instream waterholes
and lagoons
3 3 9 4 12 5 15 5 15
12.3.11 Alluvial river and creek flats
Eucalyptus tereticornis
3 3 9 4 12 5 15 5 15
12.5.8 Old loamy and sandy plains
Eucalyptus hallii open woodland
2 3 6 4 8 5 10 5 10
TOTAL 50 68 96 113
CONSEQUENCE Minor Minor Moderate Moderate

Coastal Settlement Habitat Type Risk Score
Current SLR 0.2m SLR 0.4m SLR 0.8m SLR
5% 2% 1% 0.2% 5% 2% 1% 0.2% 5% 2% 1% 0.2% 5% 2% 1% 0.2%
Miara and Norval Park 35 47 64 73 40 54 75 88 63 86 118 137 95 130 176 201
Moore Park Beach 18 24 34 41 23 31 45 56 36 49 70 86 52 71 100 121
Burnett Heads 24 33 45 52 28 39 54 64 47 66 90 105 69 97 131 151
Bargara 9 12 20 28 14 19 31 43 20 28 45 62 21 37 59 81
Innes Park and Coral Cove 10 14 21 27 14 20 30 39 19 28 42 55 27 40 59 76
Elliott Heads 23 31 44 53 28 38 55 68 45 62 88 107 64 90 126 153
Coonarr 22 29 41 49 27 36 52 64 36 49 70 86 56 76 107 129
Woodgate Beach 24 33 45 52 28 39 54 64 47 66 90 105 69 97 131 151
Buxton 15 20 34 35 18 24 41 45 34 46 66 79 50 68 96 113
Coastal Settlement Habitat Type Associated Consequence
Current SLR 0.2m SLR 0.4m SLR 0.8m SLR
5% 2% 1% 0.2% 5% 2% 1% 0.2% 5% 2% 1% 0.2% 5% 2% 1% 0.2%
Miara and Norval Park Insignificant Insignificant Minor Minor Insignificant Insignificant Minor Minor Minor Minor Moderate Moderate Minor Moderate Major Major
Moore Park Beach Insignificant Insignificant Minor Minor Insignificant Insignificant Minor Minor Minor Minor Moderate Moderate Minor Moderate Major Major
Burnett Heads Insignificant Insignificant Insignificant Insignificant Insignificant Insignificant Insignificant Insignificant Insignificant Insignificant Minor Minor Insignificant Insignificant Minor Minor
Bargara Insignificant Insignificant Insignificant Insignificant Insignificant Insignificant Insignificant Minor Insignificant Insignificant Minor Minor Insignificant Insignificant Minor Moderate
Innes Park and Coral Cove Insignificant Insignificant Minor Minor Insignificant Insignificant Minor Minor Insignificant Minor Minor Moderate Minor Minor Moderate Major
Elliott Heads Insignificant Insignificant Minor Minor Insignificant Insignificant Minor Minor Minor Minor Moderate Moderate Minor Moderate Major Major
Coonarr Insignificant Insignificant Insignificant Minor Insignificant Insignificant Minor Minor Insignificant Minor Minor Moderate Minor Minor Moderate Major
Woodgate Beach Insignificant Minor Minor Minor Insignificant Minor Minor Moderate Minor Moderate Moderate Major Moderate Major Catastrophic Catastrophic
Buxton Insignificant Insignificant Insignificant Insignificant Insignificant Insignificant Minor Minor Insignificant Minor Minor Minor Minor Minor Moderate Moderate

Bundaberg Regional Council | 03 October 2019 Coastal Hazard Adaptation Strategy – Phase 4 and 5
50
57
-02
-R02_B
RC
_C
HA
S_P
H4
_5_T
echnic
al_
App
endix
_P
art
2_o
f_2
APPENDIX E - ECONOMIC AND SOCIAL ANALYSIS TECHNICAL REPORT AND CONSEQUENCE RESULTS

Bundaberg Coastal Hazard
Assessment Strategy - Risk
Assessment
Final Report
Bundaberg Regional Council


MOLINO STEWART PTY LTD ABN 95 571 253 092 ACN 067 774 332
PO BOX 614, PARRAMATTA CBD BC, PARRAMATTA NSW 2124 TEL: (02) 9354 0300
www.molinostewart.com.au
Bundaberg Coastal Hazard Assessment Strategy - Risk
Assessment
FINAL REPORT
for
Bundaberg Regional Council
by
Molino Stewart Pty Ltd
ACN 067 774 332
OCTOBER 2019

ii Bundaberg Regional Council
DOCUMENT CONTROL
Document Reference 1062_Phase5_Technical Memo_v3.2_unformatted
Project Bundaberg Coastal Hazard Assessment Strategy - Risk Assessment
Document Type Final Report
Author Dr Filippo Dall’Osso, Steven Molino,
REVISION HISTORY
Date Version Name Comments
30/5/2019 3.1 Filippo Dall’Osso Draft for internal review
3/6/2019 3.2 Filippo Dall’Osso Draft for internal review, simplified layout
3/6/2019 4 Steven Molino Final draft for client
28/06/2019 5 Filippo Dall’Osso Final Report with project updates (Water Technology)
DOCUMENT APPROVAL
For Molino Stewart
Name Steven Molino
Position Principal
For Water Technology
Name Richard Sharp
Position Project Manager
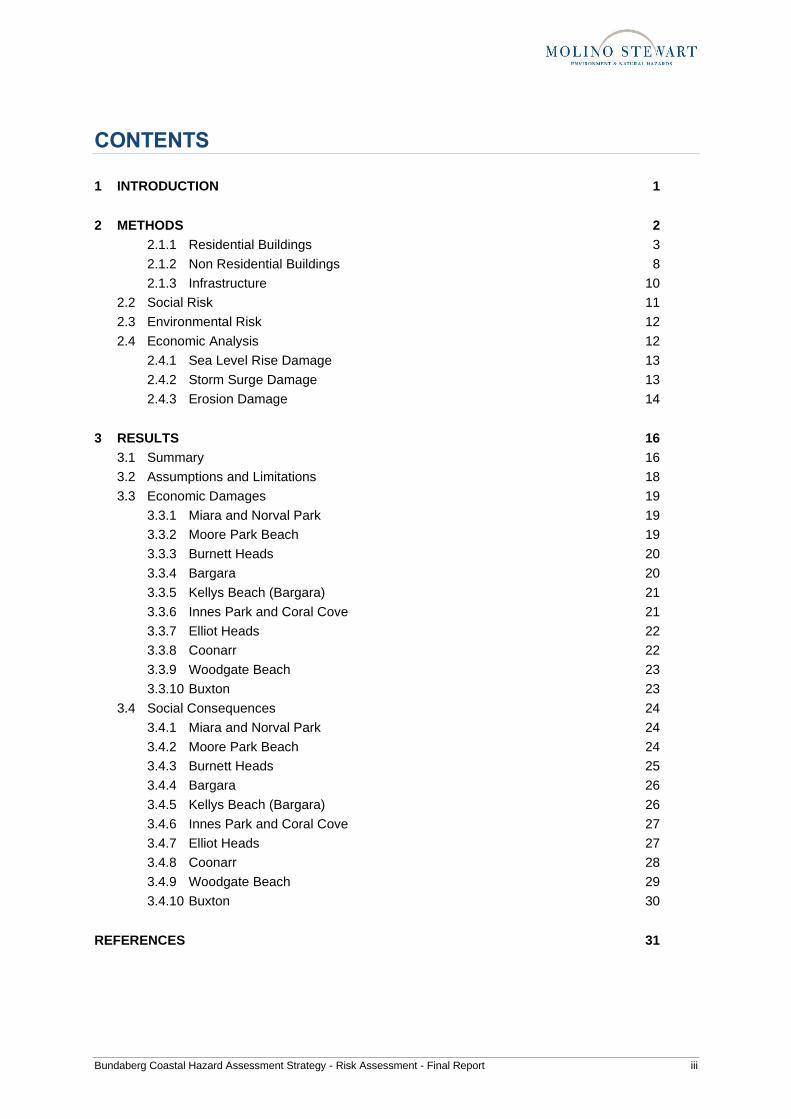
Bundaberg Coastal Hazard Assessment Strategy - Risk Assessment - Final Report iii
CONTENTS
1 INTRODUCTION 1
2 METHODS 2
2.1.1 Residential Buildings 3
2.1.2 Non Residential Buildings 8
2.1.3 Infrastructure 10
2.2 Social Risk 11
2.3 Environmental Risk 12
2.4 Economic Analysis 12
2.4.1 Sea Level Rise Damage 13
2.4.2 Storm Surge Damage 13
2.4.3 Erosion Damage 14
3 RESULTS 16
3.1 Summary 16
3.2 Assumptions and Limitations 18
3.3 Economic Damages 19
3.3.1 Miara and Norval Park 19
3.3.2 Moore Park Beach 19
3.3.3 Burnett Heads 20
3.3.4 Bargara 20
3.3.5 Kellys Beach (Bargara) 21
3.3.6 Innes Park and Coral Cove 21
3.3.7 Elliot Heads 22
3.3.8 Coonarr 22
3.3.9 Woodgate Beach 23
3.3.10 Buxton 23
3.4 Social Consequences 24
3.4.1 Miara and Norval Park 24
3.4.2 Moore Park Beach 24
3.4.3 Burnett Heads 25
3.4.4 Bargara 26
3.4.5 Kellys Beach (Bargara) 26
3.4.6 Innes Park and Coral Cove 27
3.4.7 Elliot Heads 27
3.4.8 Coonarr 28
3.4.9 Woodgate Beach 29
3.4.10 Buxton 30
REFERENCES 31
iv Bundaberg Regional Council
LIST OF TABLES
Table 1. Replacement costs for residential buildings in the study area 4
Table 2. Summary of damage curves from Geoscience Australia (2012a, 2012b) aggregated to obtain curves suitable for the study area 6
Table 3. Thresholds used to define risk consequence categories 16
Table 4. Matrix of Likelihood and Consequences used to assign Risk Levels (State of Queensland, 2016) 17
LIST OF FIGURES
Figure 1. Types of damages to the built environment (DIPNR, 2005, modif.) 3
Figure 2. Residential stage-damage curves for storm surge 7
Figure 3. Non-residential stage damage curves 9
Figure 4. Provisional flood hazard categories (AIDR, 2017) 12
Figure 5. Randomly occurring flood damage as annual average damage (HNFMSC, 2006) 14
Figure 6. Summary of Net Present Value of Economic Risk across all coastal settlements (time horizons of 80 years) 17

Bundaberg Coastal Hazard Assessment Strategy - Risk Assessment - Final Report 1
1 INTRODUCTION
This phase of the CHAS assessed and mapped risk posed to the study area by the coastal hazards
identified as part of Phase 3.
Risk is defined as the combination of the probability of an event (i.e. the “hazard”) and its negative
consequences (UNISDR, 2009). A natural hazard is defined as a natural process, or phenomenon that
may cause loss of life, injury or other health impacts, property damage, social and economic disruption
or environmental degradation (UNISDR, 2009).
When looked at through the lens of climate change, the timescale of natural hazards expands from
hours or days (e.g. storm surges, short term coastal erosion, or “storm bite”), to decades or centuries
(e.g. sea level rise). As such, the risk of impacts from these events needs to be assessed on multiple
time-scales.
Because storm surges and erosion are short term hazards, while sea level rise is a longer term
process, a scenario-based approach was used in which storm surges and erosion of various
intensities (and different probability of occurrence) were assumed to occur under a range of different
initial sea level conditions, namely:
• Current conditions;
• 0.2m of sea level rise;
• 0.4m of sea level rise;
• 0.8m of sea level rise.
Natural hazards are generally assessed based on three attributes:
• Probability of occurrence. This was expressed as the hazard’s Annual Exceedance Probability (AEP), representing the probability that a hazard of a given intensity has to be reached or exceeded every year. The following AEP events were considered when assessing risk: 5% AEP, 2% AEP, 1% AEP, 0.2% AEP, with the latter having data only for storm surges. These approximately correspond to the 20, 50, 100 and 500 year ARI (Average Recurrence Interval) events respectively.
Consistent with the CHAS Minimum Standards and Guidelines (State of Queensland, 2016), the probability of occurrence of erosion and storm surges were assumed to be independent, meaning that a given AEP erosion event will not necessarily be triggered by the corresponding AEP storm surge event.
With regard to sea level rise, it was assumed that the forecasted increases of 0.2m, 0.4m and 0.8m will occur in 20, 40 and 80 years from today, respectively. This corresponds to an average sea level increase of 1cm per year, and a total increase of 80cm by year 2100, which is the Queensland Government’s adopted sea level rise benchmark.
• Intensity. For storm surges, the peak inundation depth reached by each AEP event was used as hazard intensity indicator, or hazard “demand” parameter. For erosion and sea level rise, a yes/no approach was adopted to identify areas and assets assumed to be affected (or not affected) by these hazards.;
• Spatial distribution. This was obtained by mapping erosion prone areas and the storm peak inundation depth for each AEP event and under each initial sea level condition.
Hazard probability, intensity and spatial distribution were obtained in Phase 3 of the CHAS and
presented in the form of GIS thematic layers to be used as inputs for the risk assessment exercise.

2 Bundaberg Regional Council
2 METHODS
This phase of the CHAS assessed risk in terms of the consequences (i.e. the damages) that the study
area would incur under each hazard scenario. Where possible, damages were quantified in monetary
terms and converted to Net Present Value (NPV) to discount future costs to present day values to
account for the time value of money.
The following risks were assessed:
• Economic Risk, including tangible damages estimates to infrastructure, residential and non residential buildings. Tangible damages include direct and indirect damages. These were estimated as absolute figures (i.e. damages in dollars) and in relative terms (i.e. proportion of damages incurred in each scenario calculated with respect to the total value of infrastructure, residential and non residential buildings at risk in the worst case scenario);
• Social Risk, including intangible damages and risk to life. Similarly to Economic Risk, Social Risk was assessed with absolute figures (i.e. damages in dollars, and number of people at risk), and relative terms (i.e. proportion of intangible damages incurred in each scenario calculated with respect to the total intangible value at risk in the worst case scenario, and proportion of people at risk in each scenario with respect to the total number of people at risk in the worst case scenario);
• Environmental Risk, impacts to coastal ecosystems of significant ecological, conservational or biodiversity value were assessed by proportioning the range and scale of the ecosystem types impacted combined with the ability of ecosystem to recover from coastal hazard events and the sensitivity of the ecosystem assigned within the Vulnerability Assessment.
2.1 RISK TO THE BUILT ENVIRONMENT
Figure 1 summarises the possible types of damages to the built environment from natural hazards
(DIPNR, 2015, modified). The two main categories are tangible and intangible damages. Tangible
damages are those that can be more readily evaluated in monetary terms. Intangible damages relate
to the social cost of natural hazards and are more difficult to quantify in monetary terms and often
difficult to quantify using other metrics.
Tangible and intangible damages are further divided into direct and indirect damages. Direct damages
relate to the loss (or loss in value) of an object or a piece of property caused by direct contact with the
hazard (e.g. with floodwaters). Indirect damages relate to loss in production or revenue, loss of wages,
additional accommodation costs and living expenses, and any extra outlays that occur because of the
hazard. The following subsections explain how each damage type was assessed for buildings
(residential and non-residential) and infrastructure.
The analysis was undertaken using a dataset in GIS format provided by Council and containing
building footprints and critical infrastructure across the study area. The dataset did not contain
information on the floor level for about 75% of residential buildings. These were assumed to have the
same design as the most common residential building types in the study area, i.e. single storey
houses with a floor height of 0.3m above ground.
In addition to this, all buildings labelled as non-habitable or having an area smaller than 30 m2 were
assumed to be sheds and were deleted from the dataset.

Bundaberg Coastal Hazard Assessment Strategy - Risk Assessment - Final Report 3
2.1.1 Residential Buildings
Damages to residential buildings were assessed using a damage model appropriate for the hazard
considered. For instance, damage from inundation is proportional to the inundation depth and may
require only minor repairs and clean up before the building can be used again. On the other hand,
damage from erosion or sea level rise is likely to result in the building being permanently lost, either
because its foundations are undermined or because the building becomes regularly inundated.
a) Direct Damages
i) Estimating the Exposed Value
Depending on the model used, direct damages were assessed based on the expected loss of value of
the building structure, the building contents and the land. Council’s building dataset allowed
differentiation between the following three residential building types:
• Single storey houses;
• Double storey houses;
• Units.
The value of the building structure for each of the above mentioned building types was obtained from
average 2018 construction costs per square metre for Australian buildings estimated for tax
Figure 1. Types of damages to the built environment (DIPNR, 2005, modif.)
v
v
life

4 Bundaberg Regional Council
depreciation purposes (https://www.bmtqs.com.au/construction-cost-table). The average area of each
building type was obtained from Council’s building dataset. Finally, the overall building replacement
costs were obtained by augmenting construction costs by a factor of 1.2, to account for demolition and
clean up (Geoscience Australia, 2012)(Table 1).
Table 1. Replacement costs for residential buildings in the study area
Dwelling type Construction cost
(per m2)
Average Area
(m2)
Total
Construction
Cost
Total
Replacement cost
(incl. demolition)
Single Storey $1,849 207 $382,778 $459,333
Double Storey $2,049 427 $875,137 $1,050,164
Unit $2,277 80 $182,200 $218,640
Contents value for each building type was obtained from a dataset developed by Geoscience Australia
after the 2011 Brisbane floods (Geoscience Australia, 2012b). Geoscience Australia listed all the items
that are likely to be found in Australian residential homes of different types and size. These were
averaged to match the three building types available in Council’s building dataset. Finally, the overall
content values were inflated to present day using a rate based on the ratio between the Average
Weekly Earnings in 2018 and in 2012 (http://www.qgso.qld.gov.au/products/tables/average-weekly-
earnings-qld-aus/index.php). The resulting total contents replacement costs were:
• Single storey houses: $89,618;
• Double storey houses: $1,050,164;
• Units: $218,640.
Finally, the value of land was required to assess permanent losses of the lot resulting from erosion or
sea level rise. These were obtained from average current residential land selling price per square
meter used in real estate for beach-front lots (or lots close to the beach) within the study area, and
were:
• Burnett Heads: $150
• Moore Park Beach: $100
• Woodgate Beach: $350
• Miara and Norval Park: $100
• Bargara: $400
• Buxton: $100
• Coonarr: $50;
• Elliott Heads: $250
• Innes Park and Coral Cove: $250
• Remainder of Bundaberg LGA: $100.
It was then assumed an average lot area of 1,000 m2.
ii) Damage Models
A different damage model, or a set of damage assumptions, were used depending on the hazard type.

Bundaberg Coastal Hazard Assessment Strategy - Risk Assessment - Final Report 5
Sea Level Rise
Sea level rise is a slow onset, permanent hazard in nature, and as such it was assumed to cause a
complete loss of the building and land value. The value of building contents was excluded because
there would be sufficient time to move these elsewhere before the building is lost. Finally, it was
assumed that if a building were affected by sea level rise, no further damage from erosion or storm
surge would be possible.
Erosion
With regard to erosion, it was assumed that buildings within the erosion-prone areas would have their
foundations undermined. As such, direct damages to these buildings were assumed to be equal to the
total building and contents replacement value. It was also assumed that the damage from erosion
would be permanent and that in most instances this would result in the building owner not being able
or willing to rebuild at the same location, although it is noted that in a small number of cases (e.g.
areas exposed to temporary erosion, or “storm bite”) this may be possible. However the
geomorphological features of the Bundaberg coastal zone are such that areas exposed to short term
erosion (or “storm bite”) occupy a relatively small proportion of the overall areas exposed to all types of
erosion. For this reason this assumption was deemed compatible with the scope of this CHAS. As
previously mentioned, no further erosion damage would be possible for any buildings affected by sea
level rise, and as such these buildings were discounted from the erosion damages assessment.
Storm Surge
For tangible direct damage from storm surge inundation, a literature review was undertaken to identify
the most suitable damage model for residential and non-residential buildings.
Damages from flooding or inundation to buildings are typically predicted using “building fragility
curves”. These are curves associating the intensity of the flood hazard to the damage level that this is
expected to cause. The most commonly used quantitative model for building damage from inundation
and flooding are referred to as “stage-damage” curves. These define a relationship between peak
water depth impacting the building and the resulting level of damage. While the damage to any
structure depends both on water depth and flow velocity, in most instances peak depth and velocity
are highly correlated. As such, for simplicity most building fragility models utilise peak depth (i.e. the
water “stage”) as the only hazard “demand” parameter, and are therefore referred to as “stage-
damage” curves.
The former NSW Department of Environment and Climate Change, now Office of Environment, and
Heritage created a set of stage-damage curves for typical NSW residential dwellings, and produced an
Excel calculation spreadsheet to automatically obtain damage estimates on a building by building
basis. While the calculation spreadsheet offers several practical advantages, these curves were
deemed inappropriate for this CHAS because they were based on damage from riverine flooding
rather than storm surge, were developed for building types different from those observed in the study
area and were based on data which is now more than 20 years old.
Stage damage curves specifically developed for storm surge impact on typical Queensland residential
buildings were provided by Geoscience Australia (2012). These curves were developed based on
actual damage observations and insurance claims after cyclone Yasi and provided an estimate of
structural damage only (building contents was not included).
Contents damage was calculated using a different set of curves, developed by Geoscience Australia
after the 2011 Brisbane floods (Geoscience Australia, 2012b). Although these were obtained by
observing damages after a riverine flood, it was deemed reasonable to assume that the damage to the
building contents would have been the same as if it had been caused by a storm surge of equal depth.
It is important to emphasize that, being based on actual costs, these damage models already
accounted for post disaster reconstruction inflation factors.

6 Bundaberg Regional Council
Geoscience Australia stage-damage curves were then organised in Excel calculation spreadsheets,
using the same format used by the NSW Department of Climate Change.
Geoscience Australia’s stage-damage curves were provided for a number of building types greater
than what the available Council’s building dataset allowed to identify in the study area. As such,
Geoscience Australia’s curves were aggregated as shown in Table 2.
Table 2. Summary of damage curves from Geoscience Australia (2012a, 2012b) aggregated to obtain curves suitable for the study area
• • Aggregated structural damage curves (GA, 2012a)
• Aggregated contents damage curves (GA,2012b)
• Single Storey Houses • SSCM1, SSCM2, SSCM3 • FCM8
• Double Storey Houses • SSCM6, SSCM7 • FCM3, FCM4, FCM5, FCM6
• Units • SSCM4 • FCM8
In generating stage damage curves suitable for the study area, the following assumptions were made:
• Geoscience Australia’s contents damage model included curves for households with and without content insurance and accounting for three possible behaviours of the building occupants before the storm: protect content by moving it at a higher level, exposing content by moving it to lower level (to claim a greater insurance compensation), or do nothing. These were aggregated in a single curve per each building type using a weighted average based on the proportion of Australian households with and without contents insurance (i.e. 71% and 29% respectively) (Tooth, 2015). The damage figures corresponding to the three different occupant behaviours were averaged excluding the option of exposing contents because it was deemed relatively unlikely to happen;
• Rather than providing the actual damage expressed in dollars, Geoscience Australia’s structural damage curves outputted a Damage Index for each inundation depth, raging from zero to 1. The Damage Index represented the ratio between the cost to repair a given damage and the cost to replace the whole building (or the content). This included an allowance of +30% for structural repair costs to cover items such as the removal of the damaged parts, or the cost of matching the existing building style, and +20% for building replacement costs (to cover demolition). The Damage Index was applied to the total building structural and content replacement value to obtain the cost to repair the building structure or to replace the contents. Buildings were assumed to need full replacement when repair was uneconomical.
• Geoscience Australia’s content damage curves came with a spreadsheet providing the cost to replace and repair (if repairable) of all the most common items found in Australian homes. Because these costs were published in 2012, they were then inflated to year 2018 using an inflation rate based on the ratio between the relevant Average Weekly Earnings (AWE).
The resulting storm stage-damage curves for residential buildings, inclusive of damage to contents,
are shown in Figure 3.

Bundaberg Coastal Hazard Assessment Strategy - Risk Assessment - Final Report 7
b) Indirect Damages
For the residential sector, indirect damages caused by storm surge inundation include clean-up costs
and the costs of alternative accommodation while the house is being repaired and cleaned up. A
number of methods have been put forward for estimating these costs either individually or in
aggregate.
The simplest method used has estimated indirect damages as a percentage of direct damages. Past
research into the percentages assumed has indicated ranges of between 5% and 40% depending on
what was included in the damage estimates (for example, the lower end of the range excluded clean-
up costs) and the scale of the impacts.
The NSW OEH recommends a clean-up cost of $4,000 (2001 dollars) per building following a flood.
This value was adjusted to 2018 dollars, which produced a value of $8,064, and was used to estimate
clean-up costs in this study area for each building experiencing external damages.
In regards to alternative accommodation, the NSW OEH’s recommended value of $220/week per
household (inflated to $443 in 2018 dollars) was also used in this study. It was assumed that the
duration of stay in alternate accommodation was proportional to the damage incurred by the building.
As such, the following costs of alternate accommodation were used:
• Two weeks for buildings affected by inundation depths smaller than 300mm;
• Four weeks for buildings affected by inundation depths between 300mm and 900mm; and
• Six months (i.e. 26 weeks) for buildings affected by inundation depths exceeding 900mm.
For buildings affected by sea level rise or erosion, it was assumed that the damage was complete and
permanent and a household relocation would be required. In this case, a household relocation cost of
$2,000 was used as an indirect damage.
$0
$200,000
$400,000
$600,000
$800,000
$1,000,000
$1,200,000
-2.00 0.00 2.00 4.00 6.00 8.00 10.00
Dam
ag
e p
er
Bu
ild
ing
Depth above Floor
2 Storeys 1 Storey
Unit
Figure 2. Residential stage-damage curves for storm surge

8 Bundaberg Regional Council
2.1.2 Non Residential Buildings
Using the GIS, the building dataset provided by Council was overlaid with the extent of the selected
sea level rise, erosion and storm surge hazard scenarios to identify exposed non residential buildings.
This exercise showed that overall 99 non-residential buildings are exposed to coastal hazards. Of
these, 86 are commercial and 13 industrial. As previously noted, no schools, hospitals, or other types
of non-residential buildings were identified as being at risk.
a) Direct Damages
i) Estimating the Exposed Value
The replacement value of non residential buildings was taken from a dataset developed by the Flood
Hazard Research Centre (FHRC, 2013) at Middlesex University in the UK. While a potentially more
accurate estimate of the value of Australian non residential buildings could have been possible, the
values proposed by FHRC (2013) were adopted for consistency with the damage model selected,
which were deemed the most suitable among those available globally. These are discussed in detail in
the next section. The replacement costs of commercial and industrial buildings were then inflated to
present day obtaining the following replacement costs, which include building structure and contents:
• Commercial buildings: $2,241/m2
• Industrial buildings: $1,870/m2
Similarly to what was done for residential buildings, the value of commercial land was extracted from
recent real estate sale records and current listings. An average value of $100/m2 was used.
ii) Damage Models
Direct damages to commercial and industrial buildings were assessed using the following damage
models:
Sea Level Rise and Erosion
Non-residential buildings affected by sea level rise or erosion were assumed to be totally and
permanently lost. The damage was obtained by summing the estimated building and land value.
Storm Surge
At the time this CHAS was undertaken, there was no adopted industry standard suite of stage-damage
curves for calculating direct commercial and industrial flood damages in Australia.
The most widely adopted stage-damage functions in Australia were those developed for the
ANUFLOOD model, developed in 1983 and revised in 1994. Many studies have used the ANUFLOOD
functions with adjustment factors to derive current values, based on CPI or AWE inflation.
Other studies in Australia adopted the FLDAMAGE model developed by Water Studies in 1992.
FLDAMAGE is similar to ANUFLOOD in that it derives an estimate of total flood damages for
inundated buildings by applying stage-damage curves appropriate to each type of property.
Both of these sets of stage damage curves were derived from data collected following Australian
floods in the 1970s and 1980s when the contents of commercial and industrial premises were very
different to today.
An international literature search showed that the most up to date stage damage curves have been
developed by the Flood Hazard Research Centre (FHRC, 2013) at Middlesex University in the UK.
These stage-damage curves are based on field observations made in the UK between 2003 and 2005.
As such, they provide a contemporary evaluation of the damage to buildings and building contents.
They are referred to as FLOODSite MCM.

Bundaberg Coastal Hazard Assessment Strategy - Risk Assessment - Final Report 9
The relevant stage damage curves for commercial and industrial buildings are shown in Figure 4.
The commercial and industrial curves were derived from average values across the full range of MCM
commercial and industrial curves respectively. The original MCM curves were converted to Australian
dollars and adjusted to 2018 values.
b) Indirect Damages
Indirect damages to non residential buildings include:
• removal and storage costs;
• clean-up costs;
• payments to workforce for unproductive work ;
• extra payments to the workforce (e.g. additional staff or overtime) to make up for lost production or to maintain production;
• costs of transferring production including use of alternative premises or less efficient plant, equipment or systems;
• long term efficiency losses;
• losses to customers;
• loss of production in businesses not affected by the hazards due to interruption of workforce, supplies or sales;
• downturn in trade due to changed regional expenditure patterns caused by the hazards;
• loss of business confidence through cancellation of contracts;
• loss of market position and possible closure of business.
There are several methods which have been suggested to estimate indirect commercial and industrial
damages, either in part or in aggregate.
$0
$500
$1,000
$1,500
$2,000
$2,500
-2.00 -1.00 0.00 1.00 2.00 3.00 4.00 5.00 6.00
Dam
ag
e p
er
sq
uare
me
ter
Depth above Floor
COMMERCIAL INDUSTRIAL
Figure 3. Non-residential stage damage curves

10 Bundaberg Regional Council
The Bureau of Transport Economics (BTE, 2001) cites NRC (1999) as international evidence that
indirect costs increase as a proportion of total disaster costs with the size of disaster. It also notes
that estimation of indirect damages as a percentage of total direct damages is common but varies
widely as there is no simple relationship between the two types of damages.
In a review of flood damages research undertaken for the Warragamba Flood Mitigation Dam EIS
(Sydney Water, 1995), indirect damages for commercial and industrial properties ranged from 25% to
150% of direct damages, depending on the type of business and flooding severity.
QNRM (2002) recommends the ANUFLOOD model estimations of indirect commercial damages as
55% of direct commercial damages. Bewsher Consulting (2003) cites studies that suggest an estimate
for indirect commercial/industrial damages as 5% of actual direct damage for every day of trading that
is lost. In later studies, Bewsher Consulting (2011a & b) calculated the indirect commercial damages
as 20% of direct commercial damages.
In contrast to residential clean-up costs, the clean-up costs for commercial and industrial damages are
estimated by BTE (2001) as ranging between $2,000 and $10,000 (in 1999 dollars) and clean-up
times to be between only 1 and 3 days.
Reese and Ramsay (2010) estimate clean-up costs for commercial and industrial buildings by
multiplying clean-up time by an hourly labour rate ($80/hr and $45/hr respectively).
Disruption to business involves the estimation of value added foregone, or loss in profits, not including
the value of lost sales or stock (EMA, 2002; BTE, 2001; QNRM, 2002). This value is influenced by the
length of disruption, whether the business can be transferred within or beyond the affected area and
availability of alternative resources (BTE, 2001; Scawthorn et al., 2006). Smith (1979) estimated the
cost of lost business accounting for 67% of indirect commercial damages and 71% of indirect
industrial damages.
Reese and Ramsay (2010) measure business disruption by functional downtime and loss of income.
Functional downtime is assessed as the time (in days) the business cannot operate and is scaled
according to a building damage threshold of 10%. Loss of income is ascertained by determining daily
income per employee.
Given the number and diverse types of commercial and industrial premises across the study area it is
not practical to estimate functional downtime and loss of income per business therefore the indirect
losses have been estimated as a percentage of direct losses.
As such, consistently with Bewsher Consulting (2011a and b), indirect damages for commercial
premises were estimated as 20% of the direct costs. This proportion was increased to 50% for
industrial buildings as many have specialist equipment which is not quickly replaceable.
2.1.3 Infrastructure
Damage estimates
In most floodplain risk management studies, direct and indirect damages to infrastructure are
assessed as a proportion of the total damage to residential and non-residential buildings, typically
15%.
While this is overall a suitable approach being based on the damage recorded in historical disasters, it
does not allow pinpointing the different value of specific assets. These may include infrastructure
providing critical services to an entire community, part of which may be outside the area directly
affected by the hazards.
The vulnerability assessment exercise identified the assets at each key location that are of particular
significance. The impacts on these assets is discussed in detail in the next section. However, due to
the lack of validated damage models for different infrastructure types, some of which are highly

Bundaberg Coastal Hazard Assessment Strategy - Risk Assessment - Final Report 11
specific, and the partial lack of replacement cost data, damages to these assets could not be reliably
quantified in monetary terms as it was done for residential and non-residential buildings.
As such, this study quantified overall damages to infrastructure as a proportion (i.e. 15%) of the
total building damages. The resulting estimate is to be interpreted in conjunction with the qualitative
analysis of impacts on critical assets provided in next section.
2.2 SOCIAL RISK
Social risk includes risk to life as well as other critically important intangibles risks such as:
• People’s well-being, including mental health;
• Community identity and cohesion;
• Loss of memorabilia and items of sentimental value.
Risk to life was assessed by estimating the number and spatial distribution of Population At Risk
(PAR). This was defined as the population located within areas exposed to potentially life threatening
short-term hazard events.
As such, it was assumed that there would be no risk to life from sea level rise or erosion, because in
these instances building occupants will be able leave the premises before these experience any
significant structural instability.
With regard to storm surge inundation, a measure of the potential damage that floodwaters can cause
to life, as well as property, is given by the “flood hazard”. Flood hazard is obtained as the product
between flow velocity and depth. AIDR (2017) provides six levels of hazard, ranging from H1 (no
restrictions), to H6 (not suitable for people, vehicles or buildings)(Figure 4).
While the storm surge modelling undertaken as part of Phase 3 provided an estimate of the peak
inundation depth, flow velocity was not available and consequently flood hazard could not be
calculated. It was therefore assumed that a minimum inundation depth of 150mm would be required to
pose a threat to life. Figure 4 shows that this depth threshold, if combined with flow velocities of about
2m/s, can pose a risk to small cars and pedestrians. In storm surges generating high-velocity flows,
velocities do not typically exceed 2 to 3 m/s (Matias et al., 2010).
Broad population vulnerability mapping was achieved by assuming an average of 2.6 residents per
dwelling (ABS, 2016). For commercial and industrial buildings, the number of occupants was
estimated by counting the number of car parking spaces in recent high resolution aerial imagery and
assuming an average of 1.5 people per car space, under the worst case scenario in which all car park
spaces are occupied at the time the hazard occurs.

12 Bundaberg Regional Council
Social risks to other aspects of the community are more difficult to quantify. Attempts have been made
in some floodplain risk management studies to include a tangible estimate (sometimes 20-25% of total
residential and commercial/ industrial damages) in attempt to measure intangible, social damages.
Consistently with this work, this study estimated social/intangible damage to be 25% of total residential
and commercial/industrial damages.
2.3 ENVIRONMENTAL RISK
Environmental Risk was assessed by overlaying the outputs of the environmental vulnerability
assessment (undertaken by frc Environmental and Meridian Urban, 2019) and the extent and of
coastal hazards. As the vulnerability assessment exercise provided an index-based measure of the
environmental value and sensitivity of the coastal ecosystems to different hazard types, risk was also
assessed using an index-based approach.
2.4 ECONOMIC ANALYSIS
As per the Minimum Standards and Guidelines for Developing a CHAS (State of Queensland, 2016), a
socio-economic appraisal of any potential adaptation options is to be undertaken to demonstrate their
economic feasibility and profitability. This is to be done as part of Phase 7 of this CHAS through a cost
–benefit analysis, comparing the costs of implementation and maintenance of any adaptation options
against the benefits these provide in terms of reduction of present and future damages from coastal
hazards.
The cost-benefit analysis requires therefore that present and future costs and benefits are discounted
to present time figures, in a way that takes into account the probability of occurrence of hazard events,
under the selected range of initial sea level conditions.
Figure 4. Provisional flood hazard categories (AIDR, 2017)

Bundaberg Coastal Hazard Assessment Strategy - Risk Assessment - Final Report 13
For each hazard type, this was achieved by estimating the expected damages throughout the next 80
years, and discounting these to present time by calculating the Present Value (PV) of the losses they
will cause. The time horizon of 80 years was chosen because sea level was assumed to rise at a rate
of 1cm per year. This time scale is also consistent with the expected life span of any structural risk
reduction measures.
The PV is the sum of all future damages that can be expected over a fixed period (i.e. 80 years in this
study) expressed as a cost in today’s dollars. The present value is determined by discounting the
future flood damage costs back to the present day situation, using a discount rate. In this study we
adopted a discount rate of 7%.
The permanency, probability and time horizon of each of the three types of damages varies and must
be accounted for differently. The following sets out how the annual damages from each were
estimated and summed to create a present value.
2.4.1 Sea Level Rise Damage
Four sea level rise scenarios were modelled:
• Current conditions;
• 0.2m of sea level rise;
• 0.4m of sea level rise;
• 0.8m of sea level rise.
It was found that even under existing conditions some assets were damaged by the high astronomical
tide so this was determined to be the present day cost of existing sea level. As sea level rise is a
permanent change which increases over time, anything which falls below the HAT level can be
considered permanently lost from the time that occurs. The total damages due to sea level rise were
therefore estimated for 20cm (year 2040), 40cm (year 2060) and 80cm (year 2100).
Using the current damages and these future totals the annual incremental damage from sea level rise
could then be interpolated for each year. The present value of each increment was then calculated
based on the year it will occur in the future. These present values were all summed to estimate the
present value of the damages caused by all of the future sea level rise.
2.4.2 Storm Surge Damage
For hazard types, such as storm surge, that over time tend to cause periodical damages to the same
assets, an economic appraisal will require calculating the hazard’s Annual Average Damages (AAD).
AAD is a measure of the cost of storm surge inundation damage that could be expected each year by
the community, on average. When applicable, AAD is a convenient yardstick to compare the economic
benefits of various proposed mitigation measures with each other and the existing situation. Figure 5
describes how AAD relates to actual losses recorded over a long period. For the current study, AAD
was assessed using the potential damages derived for each AEP storm event, under the assumption
that there would be no flood damages in events as frequent as the 50% AEP.
AAD estimates are based on the assumption that after each storm event, the damaged assets would
be repaired or rebuilt and brought back to the same condition they were before the disaster.

14 Bundaberg Regional Council
In this study there was the added complication that storm surge damages will change over time
because of changes in sea level. For this reason the following approach was taken.
Firstly, in each storm surge event for each future sea level rise scenario, only that component of
damage attributable to storm surge was estimated. That is, the permanent damages caused by the
permanent change in sea level was excluded.
Secondly, the AADs were estimated for the suite of storm surge events in each of the four sea level
rise scenarios. This provided an AAD for 2020, 2040, 2060 and 2100.
Thirdly, these were interpolated linearly to estimate an AAD for each year between now and 2100.
Finally, as with the sea level rise damages for each year, each year’s AAD was discounted to a PV
and then all of the PVs summed to get a total PV for storm surge which takes into account how AADs
vary over time.
2.4.3 Erosion Damage
As with sea level rise, the losses from coastal erosion were assumed to be permanent however, there
is also a probabilistic component as to whether they are experienced or not during the planning
horizon. The permanency of the damage means that AAD is not a meaningful way of measuring
annual damages from erosion. Furthermore, once one erosion event occurs, any damage from the
next erosion event will be diminished by the damage caused by the previous event. For these
reasons the following approach was taken.
Within each sea level rise scenario, the loss from each coastal erosion event (5%, 2% and 1% AEP)
were estimated as the incremental damage over and above that caused by the permanent sea level
rise for that scenario.,
Figure 5. Randomly occurring flood damage as annual average damage (HNFMSC, 2006)

Bundaberg Coastal Hazard Assessment Strategy - Risk Assessment - Final Report 15
As the losses from a 1% AEP event are greater than those of a 2% AEP event which in turn are
greater than those of the 5% AEP event, the incremental losses from no event to 5% AEP, from 5%
AEP to 2% AEP and from 2% AEP to 1% AEP were estimated.
Because an 80 year planning horizon was used, the probability of each of those events occurring
within that time period was estimated and the incremental loss of the event was multiplied by that
probability. For example, the 5% AEP event only has a 1-(1-1/20)80= 98% chance of occurring over
the 80 years. If it were estimates that a 5% AEP erosion event would cause $1m worth of damage
then a total loss of $980,000 was assigned to it. The 2% AEP event only has an 80% chance of
occurring in 80 years and if it has a loss of $2m then its incremental loss is $1m over the 5% AEP
event but because it might not occur, its incremental loss is reduced to $800,000. Similarly the 1%
AEP event has only a 55% of occurring within the 80 year period to its incremental damages were
reduced to this proportion.
To account for when the event might occur, it was assumed that the 5% AEP event would occur in the
year by which there would be a 50/50 chance of it occurring i.e. after 13.5 years. Similarly it was
assumed the 2% AEP event would occur in 34 years’ time and the 1% AEP event in 68 years’ time as
that is when each has a 50/50 chance of occurring.
The erosion damage in year 13.5 was estimated by interpolating linearly between the erosion damage
from a 5% event now and a 5% event in 20 years’ time. The erosion damage in year 34 was
estimated by interpolating between 2040 and 2060, the incremental erosion damage from the 2%
event above the 5% event. In a similar way the difference between the 1% and 2% events in 2060
and 2100 were calculated and interpolated to estimate an incremental damage in year 68 (2088).
Each of these three damages were then brought to an NPV by discounting them from the year in
which they were assumed to occur. The three NPVs were then summed to obtain a total NPV from
erosion.
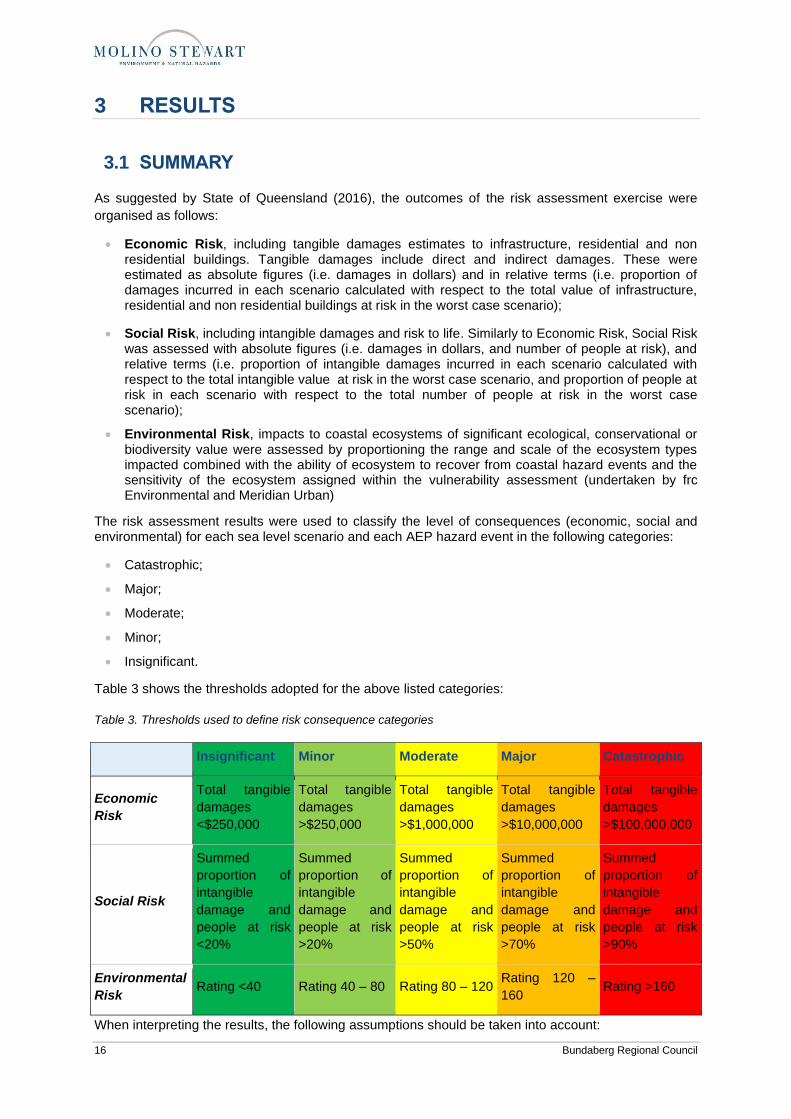
16 Bundaberg Regional Council
3 RESULTS
3.1 SUMMARY
As suggested by State of Queensland (2016), the outcomes of the risk assessment exercise were
organised as follows:
• Economic Risk, including tangible damages estimates to infrastructure, residential and non residential buildings. Tangible damages include direct and indirect damages. These were estimated as absolute figures (i.e. damages in dollars) and in relative terms (i.e. proportion of damages incurred in each scenario calculated with respect to the total value of infrastructure, residential and non residential buildings at risk in the worst case scenario);
• Social Risk, including intangible damages and risk to life. Similarly to Economic Risk, Social Risk was assessed with absolute figures (i.e. damages in dollars, and number of people at risk), and relative terms (i.e. proportion of intangible damages incurred in each scenario calculated with respect to the total intangible value at risk in the worst case scenario, and proportion of people at risk in each scenario with respect to the total number of people at risk in the worst case scenario);
• Environmental Risk, impacts to coastal ecosystems of significant ecological, conservational or biodiversity value were assessed by proportioning the range and scale of the ecosystem types impacted combined with the ability of ecosystem to recover from coastal hazard events and the sensitivity of the ecosystem assigned within the vulnerability assessment (undertaken by frc Environmental and Meridian Urban)
The risk assessment results were used to classify the level of consequences (economic, social and environmental) for each sea level scenario and each AEP hazard event in the following categories:
• Catastrophic;
• Major;
• Moderate;
• Minor;
• Insignificant.
Table 3 shows the thresholds adopted for the above listed categories:
Table 3. Thresholds used to define risk consequence categories
Insignificant Minor Moderate Major Catastrophic
Economic
Risk
Total tangible
damages
<$250,000
Total tangible
damages
>$250,000
Total tangible
damages
>$1,000,000
Total tangible
damages
>$10,000,000
Total tangible
damages
>$100,000,000
Social Risk
Summed
proportion of
intangible
damage and
people at risk
<20%
Summed
proportion of
intangible
damage and
people at risk
>20%
Summed
proportion of
intangible
damage and
people at risk
>50%
Summed
proportion of
intangible
damage and
people at risk
>70%
Summed
proportion of
intangible
damage and
people at risk
>90%
Environmental
Risk Rating <40 Rating 40 – 80 Rating 80 – 120
Rating 120 –
160 Rating >160
When interpreting the results, the following assumptions should be taken into account:

Bundaberg Coastal Hazard Assessment Strategy - Risk Assessment - Final Report 17
Results were summarised for each coastal settlement, including all possible permutations of risk types (Economic, Social, Environmental), hazard types (storm surge and erosion), and sea level conditions (i.e. current sea level, 0.2m increase, 0.4m increase and 0.8m increase). Each table provides damage figures for each AEP event of the relevant hazard type, as well as the relevant consequence category assigned according to Table 3.
Consistent with State of Queensland (2016), Risk Levels were obtained by merging probability and consequences of each event as shown in Table 4.
Table 4. Matrix of Likelihood and Consequences used to assign Risk Levels (State of Queensland, 2016)
Consequences
Likelihood
Insignificant Minor Moderate Major Catastrophic
Likely
(5% AEP) Low Medium High Extreme Extreme
Possible
(2% AEP) Low Medium High High Extreme
Unlikely
(1% AEP) Low Medium Medium High Extreme
Rare
(0.2% AEP) Low Low Medium Medium High
• A summary of the Net Present Value (NPV) of Economic Risk for each location, provided as a bar-chart (Figure 6).
$0$4,000,000$8,000,000
$12,000,000$16,000,000$20,000,000$24,000,000$28,000,000$32,000,000$36,000,000$40,000,000$44,000,000
Settlement: Total SLR Settlement: Total Erosion Settlement: Total Storm Surge
Figure 6. Summary of Net Present Value of Economic Risk across all coastal settlements (time horizons of 80 years)

18 Bundaberg Regional Council
3.2 ASSUMPTIONS AND LIMITATIONS
The following assumptions and limitations should be taken in account when interpreting the results:
• All calculations are based on the hazard extents generated as part of Phase 3. All the underlying assumptions and limitations apply to the risk assessment results too;
• The risk assessment model did not calculate any damages from erosion or storm surge for buildings affected by sea level rise. These buildings were assumed to be already totally and permanently damaged by the increase of sea level and as such no further damage was possible;
• Damages from storm surge are generally lower than damages from erosion, because in a storm surge the damage level was assumed to depend on the depth of inundation, whereas erosion was assumed to cause complete and permanent loss of the affected assets. However, the Net Present Value of damages from storm surges and erosion are comparable because damages from storm surges to the same building are assumed to occur repeatedly over the selected time frame (i.e. 80 years), while damages from coastal erosion were assumed to occur once only and cause permanent loss of that building.
• Minor model instabilities were observed for buildings located across the boundary of the storm inundation extent. The flood affectation of these buildings was inconsistently calculated by the GIS model due to the relatively small difference between the pixel size in the storm surge flood model, and the area of each building polygon. This inaccuracy has resulted in a number of cases in which total storm damages are higher in a lower sea level condition (e.g. current sea level in Bargara) than in a future increased sea level scenario (e.g. 0.2m sea level rise in Bargara), even though the number of buildings affected by sea level rise has not increased. Because this affects only buildings across the flood extent boundary, the resulting error is only noticeable when the total damages of that particular coastal settlement are relatively low.
• The logics underlying the selection of the Social Risk consequences is consistent with the CHAS minimum standards (State of Queensland, 2016), however the thresholds are subjective due to the inherent challenges of aggregating damages expressed as dollars (i.e. intangible damages) and number of people at risk.
• It should be noted that, as reported in Phase 3 of the CHAS, five key study locations were identified for further study and refinement of the coastal erosion extents:
- Moore Park Beach
- Bargara (Kellys Beach)
- Innes Park
- Coonarr
- Woodgate Beach
• In these coastal settlements, coastal erosion is considered the dominant hazard and as such the risk assessment includes the economic, social and environmental consequences applied to the range of AEPs and sea level scenarios applied to the erosion prone areas.
• In all other locations, typically rocky foreshore or estuarine areas, the coastal erosion hazard extent is represented by the default erosion prone area width of the maximum of Highest Astronomical Tide (HAT) plus 40m inland or HAT plus 0.8m sea level rise in accordance with the QLD State Erosion Prone Area Mapping. The risk assessment includes the economic, social and environmental consequences applied to the 0.8m sea level rise scenario, to ensure the CHAS aligns with the State Planning Policy 2016 (SPP) specifically addressing the coastal hazard component of the State interest policy.

Bundaberg Coastal Hazard Assessment Strategy - Risk Assessment - Final Report 19
3.3 ECONOMIC DAMAGES AND RISK RATING
3.3.1 Miara and Norval Park
Storm Tide Inundation
SLR Scenario AEP Damages Consequence
Scale Risk
Sensitivity: with semi-permanent
structures
Current Sea Level
5% $2,185,051 Moderate High $10,925,253
2% $2,481,896 Moderate High $12,409,479
1% $4,462,386 Moderate Medium $22,311,930
0.2% $5,554,056 Moderate Medium $27,770,281
0.2m
5% $2,655,671 Moderate High $13,278,355
2% $2,994,582 Moderate High $14,972,909
1% $5,151,465 Moderate Medium $25,757,323
0.2% $8,497,195 Moderate Medium $42,485,975
0.4m
5% $6,023,500 Moderate High $30,117,502
2% $6,357,687 Moderate High $31,788,435
1% $8,567,224 Moderate Medium $42,836,119
0.2% $11,663,922 Major Medium $58,319,608
0.8m
5% $19,564,223 Major Extreme $97,821,113
2% $19,678,975 Major High $98,394,876
1% $21,351,688 Major High $106,758,439
0.2% $22,223,009 Major Medium $111,115,045
Coastal Erosion
SLR Scenario AEP Damages Consequence
Scale Risk
Sensitivity: with semi-permanent
structures
0.8m
5% $29,005,323 Major Extreme $145,026,616
2% $29,005,323 Major High $145,026,616
1% $29,005,323 Major High $145,026,616
3.3.2 Moore Park Beach
Storm Tide Inundation
SLR Scenario AEP Damages Consequence
Scale Risk
Current Sea Level
5% $6,160,971 Moderate High
2% $6,547,553 Moderate High
1% $8,764,054 Moderate Medium
0.2% $30,263,758 Major Medium
0.2m
5% $10,570,023 Major Extreme
2% $10,740,026 Major High
1% $13,230,483 Major High
0.2% $37,124,152 Major Medium
0.4m
5% $15,200,303 Major Extreme
2% $15,401,357 Major High
1% $18,932,180 Major High
0.2% $67,407,322 Major Medium
0.8m
5% $26,872,947 Major Extreme
2% $27,436,380 Major High
1% $41,602,838 Major High
0.2% $140,481,687 Catastrophic High
Coastal Erosion
SLR Scenario AEP Damages Consequence
Scale Risk
Current Sea Level
5% $6,140,127 Moderate High
2% $6,140,127 Moderate High
1% $6,140,127 Moderate Medium
0.2m
5% $20,032,749 Major Extreme
2% $22,955,235 Major High
1% $22,955,235 Major High
0.4m
5% $125,740,562 Catastrophic Extreme
2% $127,609,473 Catastrophic Extreme
1% $136,229,428 Catastrophic Extreme
0.8m
5% $343,599,436 Catastrophic Extreme
2% $343,599,436 Catastrophic Extreme
1% $346,783,063 Catastrophic Extreme

Bundaberg Coastal Hazard Assessment Strategy - Risk Assessment - Final Report 20
3.3.3 Burnett Heads
Storm Tide Inundation
SLR Scenario AEP Damages Consequence
Scale Risk
Current Sea Level
5% $11,627,623 Major Extreme
2% $11,813,151 Major High
1% $18,056,247 Major High
0.2% $34,486,783 Major Medium
0.2m
5% $23,417,230 Major Extreme
2% $24,304,135 Major High
1% $27,486,923 Major High
0.2% $45,322,816 Major Medium
0.4m
5% $47,406,088 Major Extreme
2% $48,437,176 Major High
1% $51,413,284 Major High
0.2% $73,254,453 Major Medium
0.8m
5% $109,605,357 Catastrophic Extreme
2% $110,008,241 Catastrophic Extreme
1% $118,294,531 Catastrophic Extreme
0.2% $137,586,806 Catastrophic High
Coastal Erosion
SLR Scenario AEP Damages Consequence
Scale Risk
0.8m
5% $183,163,181 Catastrophic Extreme
2% $183,163,181 Catastrophic Extreme
1% $183,163,181 Catastrophic Extreme
3.3.4 Bargara
Storm Tide Inundation
SLR Scenario AEP Damages Consequence
Scale Risk
Current Sea Level
5% $98,064 Insignificant Low
2% $98,064 Insignificant Low
1% $268,067 Minor Medium
0.2% $808,468 Minor Low
0.2m
5% $98,064 Insignificant Low
2% $98,064 Insignificant Low
1% $268,067 Minor Medium
0.2% $808,468 Minor Low
0.4m
5% $98,064 Insignificant Low
2% $98,064 Insignificant Low
1% $268,067 Minor Medium
0.2% $808,468 Minor Low
0.8m
5% $24,268,603 Major Extreme
2% $24,578,334 Major High
1% $26,432,863 Major High
0.2% $45,771,851 Major Medium
Coastal Erosion
SLR Scenario AEP Damages Consequence
Scale Risk
0.8m
5% $478,677,180 Catastrophic Extreme
2% $478,677,180 Catastrophic Extreme
1% $517,741,554 Catastrophic Extreme

Bundaberg Coastal Hazard Assessment Strategy - Risk Assessment - Final Report 21
3.3.5 Kellys Beach (Bargara)
A sensitivity analysis has been undertaken for the coastal erosion hazard area of Kellys Beach.
Coastal Erosion
SLR Scenario AEP Damages Consequence
Scale Risk
Current Sea Level
5% $31,521,539 Major Extreme
2% $39,437,983 Major High
1% $39,437,983 Major High
0.2m
5% $62,526,438 Major Extreme
2% $64,304,270 Major High
1% $64,304,270 Major High
0.4m
5% $83,404,345 Major Extreme
2% $84,497,939 Major High
1% $84,497,939 Major High
0.8m
5% $98,962,351 Major Extreme
2% $98,962,351 Major High
1% $98,962,351 Major High
3.3.6 Innes Park and Coral Cove
Storm Tide Inundation
SLR Scenario AEP Damages Consequence
Scale Risk
Current Sea Level
5% $0 Insignificant Low
2% $0 Insignificant Low
1% $0 Insignificant Low
0.2% $452,279 Minor Low
0.2m
5% $46,576 Insignificant Low
2% $46,576 Insignificant Low
1% $77,627 Insignificant Low
0.2% $333,610 Minor Low
0.4m
5% $4,492,465 Moderate High
2% $4,523,516 Moderate High
1% $4,523,516 Moderate Medium
0.2% $4,686,666 Moderate Medium
0.8m
5% $8,708,491 Moderate High
2% $8,708,491 Moderate High
1% $8,708,491 Moderate Medium
0.2% $8,909,545 Moderate Medium
Coastal Erosion
SLR Scenario AEP Damages Consequence
Scale Risk
Current Sea Level
5% $0 Insignificant Low
2% $0 Insignificant Low
1% $0 Insignificant Low
0.2m
5% $0 Insignificant Low
2% $0 Insignificant Low
1% $0 Insignificant Low
0.4m
5% $7,787,803 Moderate High
2% $7,787,803 Moderate High
1% $7,787,803 Moderate Medium
0.8m
5% $30,608,769 Moderate High
2% $30,608,769 Moderate High
1% $30,608,769 Moderate Medium

Bundaberg Coastal Hazard Assessment Strategy - Risk Assessment - Final Report 22
3.3.7 Elliott Heads
Storm Tide Inundation
SLR Scenario AEP Damages Consequence
Scale Risk
Current Sea Level
5% $113,590 Insignificant Low
2% $113,590 Insignificant Low
1% $283,592 Insignificant Low
0.2% $1,041,231 Moderate Medium
0.2m
5% $113,590 Insignificant Low
2% $113,590 Insignificant Low
1% $283,592 Insignificant Low
0.2% $1,041,231 Moderate Medium
0.4m
5% $931,623 Minor Medium
2% $931,623 Minor Medium
1% $1,101,625 Moderate Medium
0.2% $1,859,263 Moderate Medium
0.8m
5% $2,429,111 Moderate High
2% $2,429,111 Moderate High
1% $2,599,114 Moderate Medium
0.2% $3,587,486 Moderate Medium
Coastal Erosion
SLR Scenario AEP Damages Consequence
Scale Risk
0.8m
5% $23,416,369 Major Extreme
2% $23,416,369 Major High
1% $23,416,369 Major High
3.3.8 Coonarr
Storm Tide Inundation
SLR Scenario AEP Damages Consequence
Scale Risk
Current Sea Level
5% $0 Insignificant Low
2% $0 Insignificant Low
1% $0 Insignificant Low
0.2% $0 Insignificant Low
0.2m
5% $0 Insignificant Low
2% $0 Insignificant Low
1% $15,525 Insignificant Low
0.2% $15,525 Insignificant Low
0.4m
5% $0 Insignificant Low
2% $0 Insignificant Low
1% $15,525 Insignificant Low
0.2% $15,525 Insignificant Low
0.8m
5% $588,033 Minor Medium
2% $588,033 Minor Medium
1% $588,033 Minor Medium
0.2% $588,033 Minor Low
Coastal Erosion
SLR Scenario AEP Damages Consequence
Scale Risk
Current Sea Level
5% $0 Insignificant Low
2% $0 Insignificant Low
1% $0 Insignificant Low
0.2m
5% $1,375,332 Moderate High
2% $1,375,332 Moderate High
1% $1,793,911 Moderate Medium
0.4m
5% $8,969,556 Moderate High
2% $8,969,556 Moderate High
1% $9,870,983 Moderate Medium
0.8m
5% $9,557,589 Moderate High
2% $9,557,589 Moderate High
1% $9,557,589 Moderate Medium

Bundaberg Coastal Hazard Assessment Strategy - Risk Assessment - Final Report 23
3.3.9 Woodgate Beach
Storm Tide Inundation
SLR Scenario AEP Damages Consequence
Scale Risk
Current Sea Level
5% $170,003 Insignificant Low
2% $170,003 Insignificant Low
1% $170,003 Insignificant Low
0.2% $3,434,173 Moderate Medium
0.2m
5% $170,003 Insignificant Low
2% $170,003 Insignificant Low
1% $170,003 Insignificant Low
0.2% $3,434,173 Moderate Medium
0.4m
5% $1,612,488 Moderate High
2% $1,612,488 Moderate High
1% $1,612,488 Moderate Medium
0.2% $3,982,617 Moderate Medium
0.8m
5% $29,233,727 Major Extreme
2% $29,233,727 Major High
1% $29,935,561 Major High
0.2% $39,115,744 Major Medium
Coastal Erosion
SLR Scenario AEP Damages Consequence
Scale Risk
Current Sea Level
5% $0 Insignificant Low
2% $0 Insignificant Low
1% $0 Insignificant Low
0.2m
5% $26,081,760 Major Extreme
2% $28,940,760 Major High
1% $34,019,687 Major High
0.4m
5% $108,044,976 Catastrophic Extreme
2% $108,044,976 Catastrophic Extreme
1% $138,592,647 Catastrophic Extreme
0.8m
5% $347,763,440 Catastrophic Extreme
2% $347,763,440 Catastrophic Extreme
1% $386,827,814 Catastrophic Extreme
3.3.10 Buxton
Storm Tide Inundation
SLR Scenario AEP Damages Consequence
Scale Risk
Current Sea Level
5% $598,236 Minor Medium
2% $598,236 Minor Medium
1% $598,236 Minor Medium
0.2% $4,528,419 Moderate Medium
0.2m
5% $1,340,514 Moderate High
2% $1,340,514 Moderate High
1% $1,547,256 Moderate Medium
0.2% $4,201,895 Moderate Medium
0.4m
5% $12,799,661 Major Extreme
2% $12,825,481 Major High
1% $12,856,531 Major High
0.2% $15,004,467 Major Medium
0.8m
5% $28,282,279 Major Extreme
2% $28,406,163 Major High
1% $28,421,689 Major High
0.2% $29,362,956 Major Medium
Coastal Erosion
SLR Scenario AEP Damages Consequence
Scale Risk
0.8m
5% $40,624,531 Major Extreme
2% $40,624,531 Major High
1% $40,624,531 Major High

Bundaberg Coastal Hazard Assessment Strategy - Risk Assessment - Final Report 24
3.4 SOCIAL CONSEQUENCES
3.4.1 Miara and Norval Park
Storm Tide Inundation
SLR Scenario AEP
Proportion of total
intangible values at risk
Proportion of total PAR
Total Consequence
Scale Risk
Current Sea Level
5% 1.3% 21.8% 23.1% Minor Medium
2% 1.5% 25.3% 26.7% Minor Medium
1% 2.6% 49.5% 52.1% Minor Medium
0.2% 3.3% 63.0% 66.3% Moderate Medium
0.2m
5% 2.0% 25.7% 27.7% Minor Medium
2% 2.2% 28.3% 30.5% Minor Medium
1% 3.8% 56.0% 59.8% Minor Medium
0.2% 6.3% 68.2% 74.5% Major Medium
0.4m
5% 3.6% 34.0% 37.5% Minor Medium
2% 3.8% 38.8% 42.5% Minor Medium
1% 5.1% 57.8% 62.8% Moderate Medium
0.2% 6.9% 74.3% 81.2% Major Medium
0.8m
5% 11.5% 34.0% 45.5% Minor Medium
2% 11.6% 38.8% 50.4% Moderate High
1% 12.6% 57.8% 70.4% Major High
0.2% 13.1% 74.3% 87.4% Major Medium
Coastal Erosion
SLR Scenario AEP
Proportion of total
intangible values at risk
Proportion of total PAR
Total Consequence
Scale Risk
0.8m
5% 68.3% 0.0% 68.3% Moderate High
2% 68.3% 0.0% 68.3% Moderate High
1% 68.3% 0.0% 68.3% Moderate Medium
3.4.2 Moore Park Beach
Storm Tide Inundation
SLR Scenario AEP
Proportion of total
intangible values at risk
Proportion of total PAR
Total Consequence
Scale Risk
Current Sea Level
5% 0.8% 1.5% 2.3% Insignificant Low
2% 0.8% 1.8% 2.7% Insignificant Low
1% 1.1% 3.3% 4.4% Insignificant Low
0.2% 3.9% 24.9% 28.8% Moderate Medium
0.2m
5% 1.4% 1.0% 2.3% Insignificant Low
2% 1.4% 1.0% 2.3% Insignificant Low
1% 1.7% 3.6% 5.3% Insignificant Low
0.2% 4.8% 41.7% 46.4% Minor Low
0.4m
5% 2.0% 1.4% 3.3% Insignificant Low
2% 2.0% 1.6% 3.6% Insignificant Low
1% 2.4% 7.8% 10.2% Insignificant Low
0.2% 8.7% 59.4% 68.1% Moderate Medium
0.8m
5% 3.5% 3.0% 6.4% Insignificant Low
2% 3.5% 6.1% 9.6% Insignificant Low
1% 5.4% 28.9% 34.2% Minor Medium
0.2% 18% 82% 100% Catastrophic High
Coastal Erosion
SLR Scenario
AEP
Proportion of total
intangible values at
risk
Proportion of total PAR
Potentially Isolated
Communities Total Consequence
Scale Risk
Current Sea Level
5% 0.7% 0.0% N/A 0.7% Insignificant Low
2% 0.7% 0.0% 0.7% Insignificant Low
1% 0.7% 0.0% 0.7% Insignificant Low
0.2m
5% 2.6% 0.0% N/A 2.6% Insignificant Low
2% 2.6% 0.0% 2.6% Insignificant Low
1% 2.6% 0.0% 2.6% Insignificant Low
0.4m
5% 12.9% 0.0% Regular inundation
of key access
routes
12.9% Major Extreme
2% 13.0% 0.0% 13.0% Major High
1% 13.9% 0.0% 13.9% Major High
0.8m
5% 34.7% 0.0% Isolation 34.7% Catastrophic Extreme
2% 34.7% 0.0% 34.7% Catastrophic Extreme
1% 35.0% 0.0% 35.0% Catastrophic Extreme

Bundaberg Coastal Hazard Assessment Strategy - Risk Assessment - Final Report 25
3.4.3 Burnett Heads
Storm Tide Inundation
SLR Scenario AEP
Proportion of total
intangible values at risk
Proportion of total PAR
Total Consequence
Scale Risk
Current Sea Level
5% 3.4% 6.0% 9.5% Insignificant Low
2% 3.5% 6.5% 10.0% Insignificant Low
1% 5.4% 16.9% 22.2% Minor Medium
0.2% 10.2% 48.7% 58.9% Moderate Medium
0.2m
5% 6.9% 3.3% 10.3% Insignificant Low
2% 7.2% 6.0% 13.2% Insignificant Low
1% 8.1% 15.1% 23.2% Minor Medium
0.2% 13.4% 51.2% 64.6% Moderate Medium
0.4m
5% 14.1% 5.1% 19.2% Insignificant Low
2% 14.4% 7.6% 21.9% Minor Medium
1% 15.2% 21.1% 36.4% Moderate Medium
0.2% 21.7% 59.6% 81.3% Major Medium
0.8m
5% 32.5% 6.4% 38.9% Moderate High
2% 32.6% 9.8% 42.4% Moderate High
1% 35.1% 29.5% 64.6% Major High
0.2% 40% 60% 100% Catastrophic High
Coastal Erosion
SLR Scenario AEP
Proportion of total
intangible values at risk
Proportion of total PAR
Total Consequence
Scale Risk
0.8m
5% 49.1% 0.0% 49.1% Minor Medium
2% 49.1% 0.0% 49.1% Minor Medium
1% 49.1% 0.0% 49.1% Minor Medium

Bundaberg Coastal Hazard Assessment Strategy - Risk Assessment - Final Report 26
3.4.4 Bargara
Storm Tide Inundation
SLR Scenario AEP
Proportion of total
intangible values at risk
Proportion of total PAR
Total Consequence
Scale Risk
Current Sea Level
5% 0.0% 0.0% 0.0% Insignificant Low
2% 0.0% 0.0% 0.0% Insignificant Low
1% 0.1% 0.0% 0.1% Insignificant Low
0.2% 0.2% 1.0% 1.2% Insignificant Low
0.2m
5% 0.0% 0.0% 0.0% Insignificant Low
2% 0.0% 0.0% 0.0% Insignificant Low
1% 0.1% 0.0% 0.1% Insignificant Low
0.2% 0.2% 6.2% 6.4% Insignificant Low
0.4m
5% 0.0% 0.0% 0.0% Insignificant Low
2% 0.0% 0.0% 0.0% Insignificant Low
1% 0.1% 0.3% 0.4% Insignificant Low
0.2% 0.2% 22.5% 22.8% Minor Low
0.8m
5% 3.4% 0.0% 3.4% Insignificant Low
2% 3.5% 1.5% 5.0% Insignificant Low
1% 3.7% 10.8% 14.5% Insignificant Low
0.2% 6.5% 50.0% 56.5% Moderate Medium
Coastal Erosion
SLR Scenario AEP
Proportion of total
intangible values at risk
Proportion of total PAR
Total Consequence
Scale Risk
0.8m
5% 52.5% 0.0% 52.5% Moderate High
2% 52.5% 0.0% 52.5% Moderate High
1% 56.8% 0.0% 56.8% Moderate Medium
3.4.5 Kellys Beach (Bargara)
A sensitivity analysis has been undertaken for the coastal erosion hazard area of Kellys Beach.
Coastal Erosion
SLR Scenario AEP
Proportion of total
intangible values at risk
Proportion of total PAR
Total Consequence
Scale Risk
Current Sea Level
5% 25.5% 0.0% 25.5% Minor Medium
2% 31.9% 0.0% 31.9% Minor Medium
1% 31.9% 0.0% 31.9% Minor Medium
0.2m
5% 50.6% 0.0% 50.6% Moderate High
2% 52.1% 0.0% 52.1% Moderate High
1% 52.1% 0.0% 52.1% Moderate Medium
0.4m
5% 67.6% 0.0% 67.6% Moderate High
2% 68.4% 0.0% 68.4% Moderate High
1% 68.4% 0.0% 68.4% Moderate Medium
0.8m
5% 80.2% 0.0% 80.2% Major Extreme
2% 80.2% 0.0% 80.2% Major High
1% 80.2% 0.0% 80.2% Major High

Bundaberg Coastal Hazard Assessment Strategy - Risk Assessment - Final Report 27
3.4.6 Innes Park and Coral Cove
Storm Tide Inundation
SLR Scenario AEP
Proportion of total
intangible values at risk
Proportion of total PAR
Total Consequence
Scale Risk
Current Sea Level
5% 0.0% 0.0% 0.0% Insignificant Low
2% 0.0% 0.0% 0.0% Insignificant Low
1% 0.0% 0.0% 0.0% Insignificant Low
0.2% 1.7% 20.8% 22.6% Minor Low
0.2m
5% 0.2% 12.5% 12.7% Insignificant Low
2% 0.2% 12.5% 12.7% Insignificant Low
1% 0.3% 20.8% 21.1% Minor Medium
0.2% 1.3% 33.3% 34.6% Minor Low
0.4m
5% 17.1% 0.0% 17.1% Insignificant Low
2% 17.2% 8.3% 25.5% Minor Medium
1% 17.2% 8.3% 25.5% Minor Medium
0.2% 17.8% 25.0% 42.8% Minor Low
0.8m
5% 33.1% 0.0% 33.1% Minor Medium
2% 33.1% 0.0% 33.1% Minor Medium
1% 33.1% 0.0% 33.1% Minor Medium
0.2% 33.9% 8.3% 42.2% Minor Low
Coastal Erosion
SLR Scenario AEP
Proportion of total
intangible values at risk
Proportion of total PAR
Total Consequence
Scale Risk
Current Sea Level
5% 0.0% 0.0% 0.0% Insignificant Low
2% 0.0% 0.0% 0.0% Insignificant Low
1% 0.0% 0.0% 0.0% Insignificant Low
0.2m
5% 0.0% 0.0% 0.0% Insignificant Low
2% 0.0% 0.0% 0.0% Insignificant Low
1% 0.0% 0.0% 0.0% Insignificant Low
0.4m
5% 26.7% 0.0% 26.7% Minor Medium
2% 26.7% 0.0% 26.7% Minor Medium
1% 26.7% 0.0% 26.7% Minor Medium
0.8m
5% 97.0% 0.0% 97.0% Catastrophic Extreme
2% 97.0% 0.0% 97.0% Catastrophic Extreme
1% 97.0% 0.0% 97.0% Catastrophic Extreme
3.4.7 Elliott Heads
Storm Tide Inundation
SLR Scenario AEP
Proportion of total
intangible values at risk
Proportion of total PAR
Total Consequence
Scale Risk
Current Sea Level
5% 0.3% 3.4% 3.7% Insignificant Low
2% 0.3% 3.4% 3.7% Insignificant Low
1% 0.8% 3.4% 4.2% Insignificant Low
0.2% 2.8% 13.7% 16.5% Insignificant Low
0.2m
5% 0.3% 0.0% 0.3% Insignificant Low
2% 0.3% 0.0% 0.3% Insignificant Low
1% 0.8% 0.0% 0.8% Insignificant Low
0.2% 2.8% 17.1% 19.9% Insignificant Low
0.4m
5% 2.5% 0.0% 2.5% Insignificant Low
2% 2.5% 0.0% 2.5% Insignificant Low
1% 3.0% 0.0% 3.0% Insignificant Low
0.2% 5.1% 13.7% 18.8% Insignificant Low
0.8m
5% 6.6% 0.0% 6.6% Insignificant Low
2% 6.6% 0.0% 6.6% Insignificant Low
1% 7.1% 0.0% 7.1% Insignificant Low
0.2% 9.8% 43.7% 53.5% Moderate Medium
Coastal Erosion
SLR Scenario AEP
Proportion of total
intangible values at risk
Proportion of total PAR
Total Consequence
Scale Risk
0.8m
5% 50.5% 0.0% 50.5% Moderate High
2% 50.5% 0.0% 50.5% Moderate High
1% 50.5% 0.0% 50.5% Moderate Medium

Bundaberg Coastal Hazard Assessment Strategy - Risk Assessment - Final Report 28
3.4.8 Coonarr
Storm Tide Inundation
SLR Scenario AEP
Proportion of total
intangible values at risk
Proportion of total PAR
Total Consequence
Scale Risk
Current Sea Level
5% 0.0% 0.0% 0.0% Insignificant Low
2% 0.0% 0.0% 0.0% Insignificant Low
1% 0.0% 0.0% 0.0% Insignificant Low
0.2% 0.0% 0.0% 0.0% Insignificant Low
0.2m
5% 0.0% 0.0% 0.0% Insignificant Low
2% 0.0% 0.0% 0.0% Insignificant Low
1% 0.2% 0.0% 0.2% Insignificant Low
0.2% 0.2% 16.7% 16.9% Insignificant Low
0.4m
5% 0.0% 0.0% 0.0% Insignificant Low
2% 0.0% 0.0% 0.0% Insignificant Low
1% 0.2% 0.0% 0.2% Insignificant Low
0.2% 0.2% 16.7% 16.9% Insignificant Low
0.8m
5% 7.8% 0.0% 7.8% Insignificant Low
2% 7.8% 0.0% 7.8% Insignificant Low
1% 7.8% 0.0% 7.8% Insignificant Low
0.2% 7.8% 0.0% 7.8% Insignificant Low
Coastal Erosion
SLR Scenario
AEP
Proportion of total
intangible values at
risk
Proportion of total PAR
Potentially Isolated
Communities Total Consequence
Scale Risk
Current Sea Level
5% 0.0% 0.0% N/A 0.0% Insignificant Low
2% 0.0% 0.0% 0.0% Insignificant Low
1% 0.0% 0.0% 0.0% Insignificant Low
0.2m
5% 0.0% 0.0% Isolation 0.0% Catastrophic Extreme
2% 0.0% 0.0% 0.0% Catastrophic Extreme
1% 18.2% 0.0% 18.2% Catastrophic Extreme
0.4m
5% 91.0% 0.0% Isolation 91.0% Catastrophic Extreme
2% 91.0% 0.0% 91.0% Catastrophic Extreme
1% 100% 0.0% 100% Catastrophic Extreme
0.8m
5% 98.8% 0.0% Isolation 98.8% Catastrophic Extreme
2% 98.8% 0.0% 98.8% Catastrophic Extreme
1% 98.8% 0.0% 98.8% Catastrophic Extreme

Bundaberg Coastal Hazard Assessment Strategy - Risk Assessment - Final Report 29
3.4.9 Woodgate Beach
Storm Tide Inundation
SLR Scenario AEP
Proportion of total
intangible values at risk
Proportion of total PAR
Total Consequence
Scale Risk
Current Sea Level
5% 0.0% 0.0% 0.0% Insignificant Low
2% 0.0% 0.0% 0.0% Insignificant Low
1% 0.0% 0.0% 0.0% Insignificant Low
0.2% 0.9% 7.0% 7.9% Insignificant Low
0.2m
5% 0.0% 0.0% 0.0% Insignificant Low
2% 0.0% 0.0% 0.0% Insignificant Low
1% 0.0% 0.3% 0.4% Insignificant Low
0.2% 0.9% 9.0% 9.9% Insignificant Low
0.4m
5% 0.4% 0.0% 0.4% Insignificant Low
2% 0.4% 0.0% 0.4% Insignificant Low
1% 0.4% 0.0% 0.4% Insignificant Low
0.2% 1.0% 14.4% 15.4% Insignificant Low
0.8m
5% 7.5% 0.0% 7.5% Insignificant Low
2% 7.5% 0.0% 7.5% Insignificant Low
1% 7.7% 4.7% 12.4% Insignificant Low
0.2% 10.1% 35.7% 45.8% Minor Low
Coastal Erosion
SLR Scenario
AEP
Proportion of total
intangible values at
risk
Proportion of total PAR
Potentially Isolated
Communities Total Consequence
Scale Risk
Current Sea Level
5% 0.0% 0.0% N/A 0.0% Insignificant Low
2% 0.0% 0.0% 0.0% Insignificant Low
1% 0.0% 0.0% 0.0% Insignificant Low
0.2m
5% 5.7% 0.0% N/A 5.7% Insignificant Low
2% 5.7% 0.0% 5.7% Insignificant Low
1% 6.7% 0.0% 6.7% Insignificant Low
0.4m
5% 21.4% 0.0% N/A 21.4% Minor Medium
2% 21.4% 0.0% 21.4% Minor Medium
1% 27.5% 0.0% 27.5% Minor Medium
0.8m
5% 70.4% 0.0% Isolation 70.4% Catastrophic Extreme
2% 70.4% 0.0% 70.4% Catastrophic Extreme
1% 78.2% 0.0% 78.2% Catastrophic Extreme

Bundaberg Coastal Hazard Assessment Strategy - Risk Assessment - Final Report 30
3.4.10 Buxton
Storm Tide Inundation
SLR Scenario AEP
Proportion of total
intangible values at risk
Proportion of total PAR
Total Consequence
Scale Risk
Current Sea Level
5% 1.2% 8.5% 9.7% Insignificant Low
2% 1.2% 8.5% 9.7% Insignificant Low
1% 1.2% 8.5% 9.7% Insignificant Low
0.2% 8.8% 66.0% 74.8% Major Medium
0.2m
5% 2.6% 2.1% 4.7% Insignificant Low
2% 2.6% 2.1% 4.7% Insignificant Low
1% 3.0% 17.0% 20.0% Minor Medium
0.2% 8.2% 61.7% 69.9% Moderate Medium
0.4m
5% 24.9% 12.8% 37.6% Minor Medium
2% 24.9% 14.9% 39.8% Minor Medium
1% 25.0% 19.1% 44.1% Minor Medium
0.2% 29.1% 46.8% 75.9% Major Medium
0.8m
5% 54.9% 2.1% 57.0% Moderate High
2% 55.2% 4.3% 59.4% Moderate High
1% 55.2% 6.4% 61.6% Moderate Medium
0.2% 57.0% 23.4% 80.4% Major Medium
Coastal Erosion
SLR Scenario AEP
Proportion of total
intangible values at risk
Proportion of total PAR
Total Consequence
Scale Risk
0.8m
5% 73.3% 0.0% 73.3% Major Extreme
2% 73.3% 0.0% 73.3% Major High
1% 73.3% 0.0% 73.3% Major High

Bundaberg Coastal Hazard Assessment Strategy - Risk Assessment - Final Report 31
REFERENCES
Australian Bureau of Statistics (ABD): https://quickstats.censusdata.abs.gov.au/
census_services/getproduct/census/2016/quickstat/LGA31820?opendocument, data from census
2016.
AIDR (Australian Institute for Disaster Resilience): Managing the floodplain: a guide to best practice in
flood risk management in Australia, 2017.
Bewsher Consulting: Draft Floodplain Risk Management Plan, In: Towradgi Creek, Wollongong
Floodplain Risk Management Study. Bewsher Consulting Pty Ltd, 2003.
Bewsher Consulting: Flood Damage Assessment, In: Macquarie Park FRMS&P. Final Report.
Bewsher Consulting Pty Ltd, 2011a
Bewsher Consulting: Defining the Flood Problem, In: Double Bay Catchment FRMS&P. Draft Report
for Public Exhibition. Bewsher Consulting Pty Ltd, 2011b.
BTE: Report 103: Economic Costs of Natural Disasters in Australia. Bureau of Transport Economics,
Canberra, 2001.
Department of Planning, Infrastructure, and Natural Resources: Floodplain Development Manual,
2005.
EMA (Emergency Management Australia): Disaster Loss Assessment Guidelines. State of
Queensland and Commonwealth of Australia, 2002.
Flood Hazard Research Centre (FHRC): The Multi-Coloured Manual. Middlesex University London.
Available online: https://www.mdx.ac.uk/our-research/centres/flood-hazard/projects/multi-coloured-
manual, 2013.
Geoscience Australia: Storm Surge Vulnerability Functions for Australian Buildings, Summary of
Current Geoscience Australia Model Suite, compiled by M. Wehner, November 2012a.
Geoscience Australia: Vulnerability Models for Inundation – Contents,, compiled by M. Wehner,
2012b.
HNFMSC (Hawkesbury-Nepean Floodplain Management Steering Committee): Managing Flood Risk
Through Planning Opportunities: guidance on land use planning in flood prone areas. Hawkesbury-
Nepean Floodplain Management Steering Committee, 2006.
Matias, A., Ferreira, Ó., Vila-Concejo, A., Morris, B., & Dias, J. A. (2010). Short-term morphodynamics
of non-storm overwash. Marine Geology, 274(1-4), 69-84.
QNRM, 2002. Guidance on the Assessment of Tangible Flood Damages. The State of Queensland,
Department of Natural Resources and Mines
Reese, S. & Ramsay, D. 2010. RiskScape: Flood fragility methodology. National Institute of Water &
Atmospheric Research Ltd, Wellington NZ.
Scawthorn, C., Flores, P., Blais, N., Seligson, H., Tate, E., Chang, S., Mifflin, E., Thomas, W., Murphy,
J., Jones, C. and Lawrence, M. 2006. HAZUS-MH Flood Loss Estimation Methodology II. Damage
and Loss Assessment. Natural Hazards Review, May 2006, 72-81.
State of Queensland: Developing a Coastal Hazard Adaptation Strategy: Minimum Standards and
Guideline for Queensland Local Governments, Prepared by: The Local Government Association of
Queensland and The Department of Environment and Heritage Protection, October 2016.
Sydney Water, 1995. Warragamba Flood Mitigation Dam Environmental Impact Statement. Prepared
by Mitchell McCotter for Sydney Water and the NSW Government.
Tooth, R.: Analysis of Demand for Home and Contents Insurance, Insurance Council of Australia,
August 2015.

Bundaberg Regional Council | 03 October 2019 Coastal Hazard Adaptation Strategy – Phase 4 and 5
50
57
-02
-R02_B
RC
_C
HA
S_P
H4
_5_T
echnic
al_
App
endix
_P
art
2_o
f_2
APPENDIX F RISK ANALYSIS RESULTS

RISK ANALYSIS RESULTS
Results have been summarised in tables for each coastal settlement, including all possible permutations of risk types (Economic, Social, Environmental), hazard types
(storm tide inundation and coastal erosion), and sea level conditions (i.e. current sea level, +0.2m, +0.4m and 0.8m increase).
These are shown in the following tables. The risk analysis process identified the coastal settlements that contain areas of high and extreme risk which have been
further classified as ‘intolerable’ risk and may require investigation into mitigation and adaptation options.

0.2m SLR - Storm Tide Inundation Economic Social Environmental Risk Rating
AEP
5% (Likely) Moderate Minor Insignificant High
2% (Possible) Moderate Minor Insignificant High
1% (Unlikely) Moderate Moderate Minor Medium
0.2% (Rare) Moderate Major Minor Medium
0.4m SLR - Storm Tide Inundation Economic Social Environmental Risk Rating
AEP
5% (Likely) Moderate Minor Minor High
2% (Possible) Moderate Minor Minor High
1% (Unlikely) Moderate Moderate Moderate Medium
0.2% (Rare) Major Major Moderate Medium
0.8m SLR - Storm Tide Inundation Economic Social Environmental Risk Rating
AEP
5% (Likely) Major Minor Minor Extreme
2% (Possible) Major Moderate Moderate High
1% (Unlikely) Major Major Major High
0.2% (Rare) Major Major Major Medium
F-1 Miara and Norval Park – Risk Analysis Results
Present Day - Storm Tide Inundation Economic Social Environmental Risk Rating
AEP
5% (Likely) Moderate Minor Insignificant High
2% (Possible) Moderate Minor Insignificant High
1% (Unlikely) Moderate Moderate Minor Medium
0.2% (Rare) Moderate Moderate Minor Medium

0.8m SLR - Erosion Prone Area Economic Social Environmental Risk Rating
AEP
5% (Likely) Major Major Minor Extreme
2% (Possible) Major Major Moderate High
1% (Unlikely) Major Major Major High
0.2m SLR - Storm Tide Inundation Economic Social Environmental Risk Rating
AEP
5% (Likely) Major Major Insignificant Extreme
2% (Possible) Major Major Insignificant High
1% (Unlikely) Major Catastrophic Minor Extreme
0.2% (Rare) Major Catastrophic Minor High
0.4m SLR - Storm Tide Inundation Economic Social Environmental Risk Rating
AEP
5% (Likely) Major Major Minor Extreme
2% (Possible) Major Catastrophic Minor Extreme
1% (Unlikely) Major Catastrophic Moderate Extreme
0.2% (Rare) Major Catastrophic Moderate High
F-2 Miara and Norval Park – Semi-Permanent Structures Sensitivity Risk Analysis Results
Present Day - Storm Tide Inundation Economic Social Environmental Risk Rating
AEP
5% (Likely) Major Moderate Insignificant Extreme
2% (Possible) Major Major Insignificant High
1% (Unlikely) Major Catastrophic Minor Extreme
0.2% (Rare) Major Catastrophic Minor High

0.8m SLR - Storm Tide Inundation Economic Social Environmental Risk Rating
AEP
5% (Likely) Major Catastrophic Minor Extreme
2% (Possible) Major Catastrophic Moderate Extreme
1% (Unlikely) Catastrophic Catastrophic Major Extreme
0.2% (Rare) Catastrophic Catastrophic Major High
0.8m SLR - Erosion Prone Area Economic Social Environmental Risk Rating
AEP
5% (Likely) Catastrophic Major Minor Extreme
2% (Possible) Catastrophic Major Moderate Extreme
1% (Unlikely) Catastrophic Major Major Extreme

0.2m SLR - Storm Tide Inundation Economic Social Environmental Risk Rating
AEP
5% (Likely) Major Insignificant Insignificant Extreme
2% (Possible) Major Insignificant Insignificant High
1% (Unlikely) Major Insignificant Minor High
0.2% (Rare) Major Minor Minor Medium
0.4m SLR - Storm Tide Inundation Economic Social Environmental Risk Rating
AEP
5% (Likely) Major Insignificant Minor Extreme
2% (Possible) Major Insignificant Minor High
1% (Unlikely) Major Insignificant Moderate High
0.2% (Rare) Major Moderate Moderate Medium
0.8m SLR - Storm Tide Inundation Economic Social Environmental Risk Rating
AEP
5% (Likely) Major Insignificant Minor Extreme
2% (Possible) Major Insignificant Moderate High
1% (Unlikely) Major Minor Major High
0.2% (Rare) Catastrophic Catastrophic Major High
F-3 Moore Park Beach – Risk Analysis Results
Present Day - Storm Tide Inundation Economic Social Environmental Risk Rating
AEP
5% (Likely) Moderate Insignificant Insignificant High
2% (Possible) Moderate Insignificant Insignificant High
1% (Unlikely) Moderate Insignificant Minor Medium
0.2% (Rare) Major Minor Minor Medium
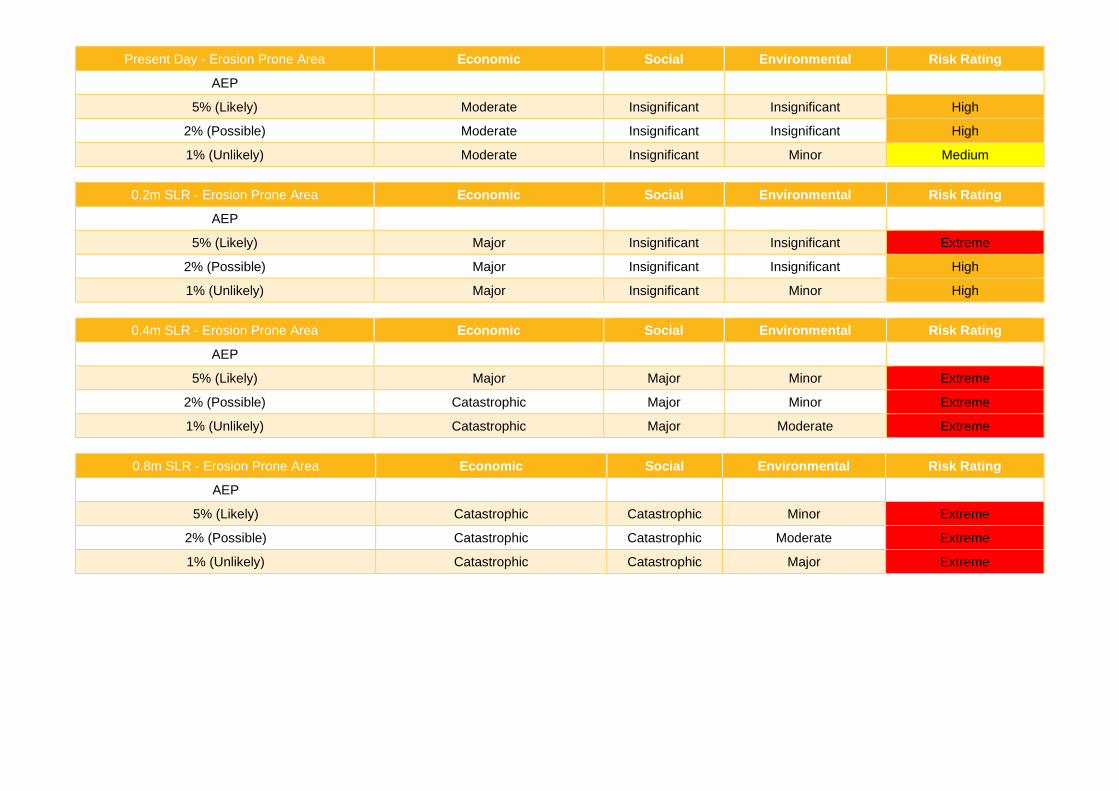
Present Day - Erosion Prone Area Economic Social Environmental Risk Rating
AEP
5% (Likely) Moderate Insignificant Insignificant High
2% (Possible) Moderate Insignificant Insignificant High
1% (Unlikely) Moderate Insignificant Minor Medium
0.2m SLR - Erosion Prone Area Economic Social Environmental Risk Rating
AEP
5% (Likely) Major Insignificant Insignificant Extreme
2% (Possible) Major Insignificant Insignificant High
1% (Unlikely) Major Insignificant Minor High
0.4m SLR - Erosion Prone Area Economic Social Environmental Risk Rating
AEP
5% (Likely) Major Major Minor Extreme
2% (Possible) Catastrophic Major Minor Extreme
1% (Unlikely) Catastrophic Major Moderate Extreme
0.8m SLR - Erosion Prone Area Economic Social Environmental Risk Rating
AEP
5% (Likely) Catastrophic Catastrophic Minor Extreme
2% (Possible) Catastrophic Catastrophic Moderate Extreme
1% (Unlikely) Catastrophic Catastrophic Major Extreme

0.2m SLR - Storm Tide Inundation Economic Social Environmental Risk Rating
AEP
5% (Likely) Major Insignificant Insignificant Extreme
2% (Possible) Major Insignificant Insignificant High
1% (Unlikely) Major Minor Insignificant High
0.2% (Rare) Major Moderate Insignificant Medium
0.4m SLR - Storm Tide Inundation Economic Social Environmental Risk Rating
AEP
5% (Likely) Major Insignificant Insignificant Extreme
2% (Possible) Major Insignificant Insignificant High
1% (Unlikely) Major Minor Minor High
0.2% (Rare) Major Major Minor Medium
0.8m SLR - Storm Tide Inundation Economic Social Environmental Risk Rating
AEP
5% (Likely) Catastrophic Minor Insignificant Extreme
2% (Possible) Catastrophic Minor Insignificant Extreme
1% (Unlikely) Catastrophic Moderate Minor Extreme
0.2% (Rare) Catastrophic Catastrophic Minor High
F-4 Burnett Heads – Risk Analysis Results
Present Day - Storm Tide Inundation Economic Social Environmental Risk Rating
AEP
5% (Likely) Major Insignificant Insignificant Extreme
2% (Possible) Major Insignificant Insignificant High
1% (Unlikely) Major Minor Insignificant High
0.2% (Rare) Major Moderate Insignificant Medium
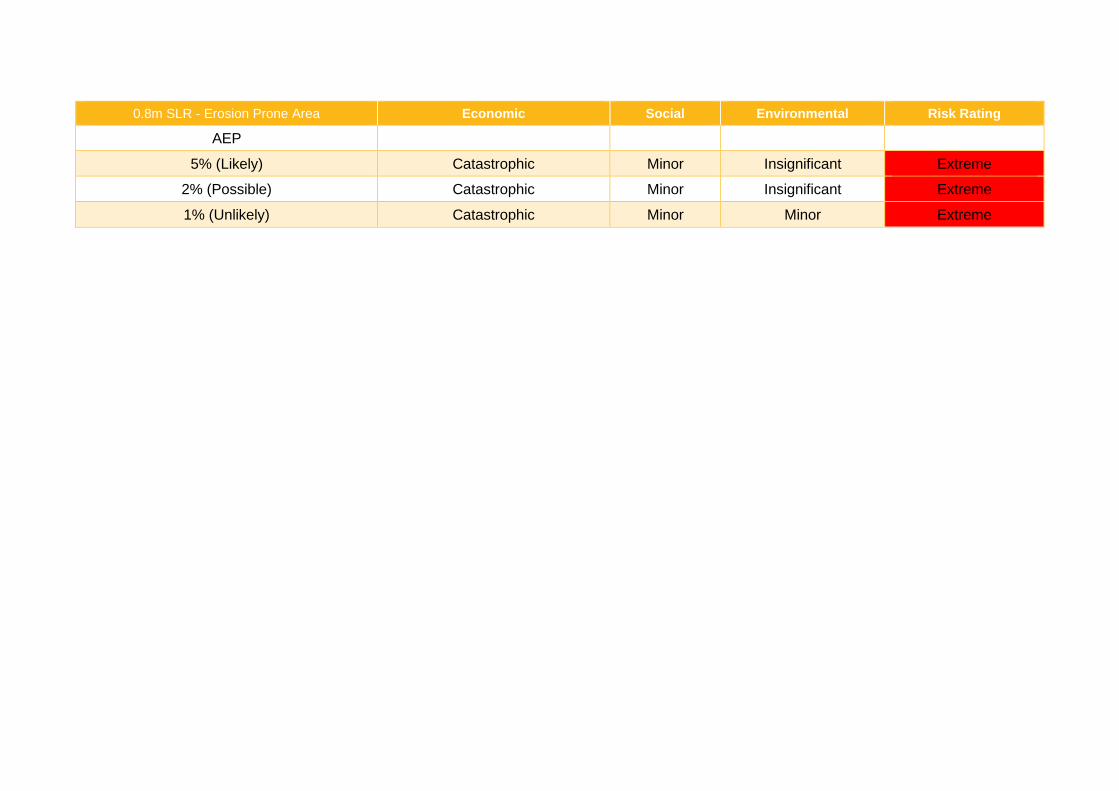
0.8m SLR - Erosion Prone Area Economic Social Environmental Risk Rating
AEP
5% (Likely) Catastrophic Minor Insignificant Extreme
2% (Possible) Catastrophic Minor Insignificant Extreme
1% (Unlikely) Catastrophic Minor Minor Extreme

0.2m SLR - Storm Tide Inundation Economic Social Environmental Risk Rating
AEP
5% (Likely) Insignificant Insignificant Insignificant Low
2% (Possible) Insignificant Insignificant Insignificant Low
1% (Unlikely) Minor Insignificant Insignificant Medium
0.2% (Rare) Minor Insignificant Minor Low
0.4m SLR - Storm Tide Inundation Economic Social Environmental Risk Rating
AEP
5% (Likely) Insignificant Insignificant Insignificant Low
2% (Possible) Insignificant Insignificant Insignificant Low
1% (Unlikely) Insignificant Insignificant Minor Medium
0.2% (Rare) Moderate Moderate Minor Medium
0.8m SLR - Storm Tide Inundation Economic Social Environmental Risk Rating
AEP
5% (Likely) Major Insignificant Insignificant Extreme
2% (Possible) Major Insignificant Insignificant High
1% (Unlikely) Major Insignificant Minor High
0.2% (Rare) Major Moderate Moderate Medium
F-5 Bargara – Risk Analysis Results
Present Day - Storm Tide Inundation Economic Social Environmental Risk Rating
AEP
5% (Likely) Insignificant Insignificant Insignificant Low
2% (Possible) Insignificant Insignificant Insignificant Low
1% (Unlikely) Minor Insignificant Insignificant Medium
0.2% (Rare) Minor Insignificant Insignificant Low

0.8m SLR - Erosion Prone Area Economic Social Environmental Risk Rating
AEP
5% (Likely) Catastrophic Moderate Insignificant Extreme
2% (Possible) Catastrophic Moderate Insignificant Extreme
1% (Unlikely) Catastrophic Moderate Minor Extreme

0.2m SLR - Erosion Prone Area Economic Social Environmental Risk Rating
AEP
5% (Likely) Major Moderate Insignificant Extreme
2% (Possible) Major Moderate Insignificant High
1% (Unlikely) Major Moderate Insignificant High
0.4m SLR - Erosion Prone Area Economic Social Environmental Risk Rating
AEP
5% (Likely) Major Moderate Insignificant Extreme
2% (Possible) Major Moderate Insignificant High
1% (Unlikely) Major Moderate Minor High
0.8m SLR - Erosion Prone Area Economic Social Environmental Risk Rating
AEP
5% (Likely) Major Major Insignificant Extreme
2% (Possible) Major Major Insignificant High
1% (Unlikely) Major Major Minor High
F-6 Kellys Beach (Bargara) – Risk Analysis Results
Present Day - Erosion Prone Area Economic Social Environmental Risk Rating
AEP
5% (Likely) Major Minor Insignificant Extreme
2% (Possible) Major Minor Insignificant High
1% (Unlikely) Major Minor Insignificant High

0.2m SLR - Storm Tide Inundation Economic Social Environmental Risk Rating
AEP
5% (Likely) Insignificant Insignificant Insignificant Low
2% (Possible) Insignificant Insignificant Insignificant Low
1% (Unlikely) Insignificant Minor Minor Medium
0.2% (Rare) Minor Minor Minor Low
0.4m SLR - Storm Tide Inundation Economic Social Environmental Risk Rating
AEP
5% (Likely) Moderate Insignificant Insignificant High
2% (Possible) Moderate Minor Minor High
1% (Unlikely) Moderate Minor Minor Medium
0.2% (Rare) Moderate Minor Moderate Medium
0.8m SLR - Storm Tide Inundation Economic Social Environmental Risk Rating
AEP
5% (Likely) Moderate Minor Minor High
2% (Possible) Moderate Minor Minor High
1% (Unlikely) Moderate Minor Moderate Medium
0.2% (Rare) Moderate Minor Major Medium
F-7 Innes Park and Coral Cove – Risk Analysis Results
Present Day - Storm Tide Inundation Economic Social Environmental Risk Rating
AEP
5% (Likely) Insignificant Insignificant Insignificant Low
2% (Possible) Insignificant Insignificant Insignificant Low
1% (Unlikely) Insignificant Insignificant Minor Medium
0.2% (Rare) Minor Minor Minor Low

Present Day - Erosion Prone Area Economic Social Environmental Risk Rating
AEP
5% (Likely) Insignificant Insignificant Insignificant Low
2% (Possible) Insignificant Insignificant Insignificant Low
1% (Unlikely) Insignificant Insignificant Minor Medium
0.2m SLR - Erosion Prone Area Economic Social Environmental Risk Rating
AEP
5% (Likely) Insignificant Insignificant Insignificant Low
2% (Possible) Insignificant Insignificant Insignificant Low
1% (Unlikely) Insignificant Insignificant Minor Medium
0.4m SLR - Erosion Prone Area Economic Social Environmental Risk Rating
AEP
5% (Likely) Moderate Minor Insignificant High
2% (Possible) Moderate Minor Minor High
1% (Unlikely) Moderate Minor Minor Medium
0.8m SLR - Erosion Prone Area Economic Social Environmental Risk Rating
AEP
5% (Likely) Major Catastrophic Minor Extreme
2% (Possible) Major Catastrophic Minor Extreme
1% (Unlikely) Major Catastrophic Moderate Extreme

0.2m SLR - Storm Tide Inundation Economic Social Environmental Risk Rating
AEP
5% (Likely) Minor Insignificant Insignificant Medium
2% (Possible) Minor Insignificant Insignificant Medium
1% (Unlikely) Minor Insignificant Minor Medium
0.2% (Rare) Moderate Insignificant Minor Medium
0.4m SLR - Storm Tide Inundation Economic Social Environmental Risk Rating
AEP
5% (Likely) Minor Insignificant Minor Medium
2% (Possible) Minor Insignificant Minor Medium
1% (Unlikely) Moderate Insignificant Moderate Medium
0.2% (Rare) Moderate Insignificant Moderate Medium
0.8m SLR - Storm Tide Inundation Economic Social Environmental Risk Rating
AEP
5% (Likely) Moderate Insignificant Minor High
2% (Possible) Moderate Insignificant Moderate High
1% (Unlikely) Moderate Insignificant Major High
0.2% (Rare) Moderate Moderate Major Medium
F-8 Elliott Heads – Risk Analysis Results
Present Day - Storm Tide Inundation Economic Social Environmental Risk Rating
AEP
5% (Likely) Minor Insignificant Insignificant Medium
2% (Possible) Minor Insignificant Insignificant Medium
1% (Unlikely) Minor Insignificant Minor Medium
0.2% (Rare) Moderate Insignificant Minor Medium

0.8m SLR - Erosion Prone Area Economic Social Environmental Risk Rating
AEP
5% (Likely) Major Moderate Minor Extreme
2% (Possible) Major Moderate Moderate High
1% (Unlikely) Major Moderate Major High

0.2m SLR - Storm Tide Inundation Economic Social Environmental Risk Rating
AEP
5% (Likely) Insignificant Insignificant Insignificant Low
2% (Possible) Insignificant Insignificant Insignificant Low
1% (Unlikely) Insignificant Insignificant Minor Medium
0.2% (Rare) Insignificant Insignificant Minor Low
0.4m SLR - Storm Tide Inundation Economic Social Environmental Risk Rating
AEP
5% (Likely) Insignificant Insignificant Insignificant Low
2% (Possible) Insignificant Insignificant Minor Medium
1% (Unlikely) Insignificant Insignificant Minor Medium
0.2% (Rare) Insignificant Insignificant Moderate Medium
0.8m SLR - Storm Tide Inundation Economic Social Environmental Risk Rating
AEP
5% (Likely) Minor Insignificant Minor Medium
2% (Possible) Minor Insignificant Minor Medium
1% (Unlikely) Minor Insignificant Moderate Medium
0.2% (Rare) Minor Insignificant Major Medium
F-9 Coonarr – Risk Analysis Results
Present Day - Storm Tide Inundation Economic Social Environmental Risk Rating
AEP
5% (Likely) Insignificant Insignificant Insignificant Low
2% (Possible) Insignificant Insignificant Insignificant Low
1% (Unlikely) Insignificant Insignificant Insignificant Low
0.2% (Rare) Insignificant Insignificant Minor Low

Present Day - Erosion Prone Area Economic Social Environmental Risk Rating
AEP
5% (Likely) Insignificant Insignificant Insignificant Low
2% (Possible) Insignificant Insignificant Insignificant Low
1% (Unlikely) Insignificant Insignificant Insignificant Low
0.2m SLR - Erosion Prone Area Economic Social Environmental Risk Rating
AEP
5% (Likely) Insignificant Catastrophic Insignificant Extreme
2% (Possible) Insignificant Catastrophic Insignificant Extreme
1% (Unlikely) Moderate Catastrophic Minor Extreme
0.4m SLR - Erosion Prone Area Economic Social Environmental Risk Rating
AEP
5% (Likely) Moderate Catastrophic Insignificant Extreme
2% (Possible) Moderate Catastrophic Minor Extreme
1% (Unlikely) Moderate Catastrophic Minor Extreme
0.8m SLR - Erosion Prone Area Economic Social Environmental Risk Rating
AEP
5% (Likely) Moderate Catastrophic Minor Extreme
2% (Possible) Moderate Catastrophic Minor Extreme
1% (Unlikely) Moderate Catastrophic Moderate Extreme
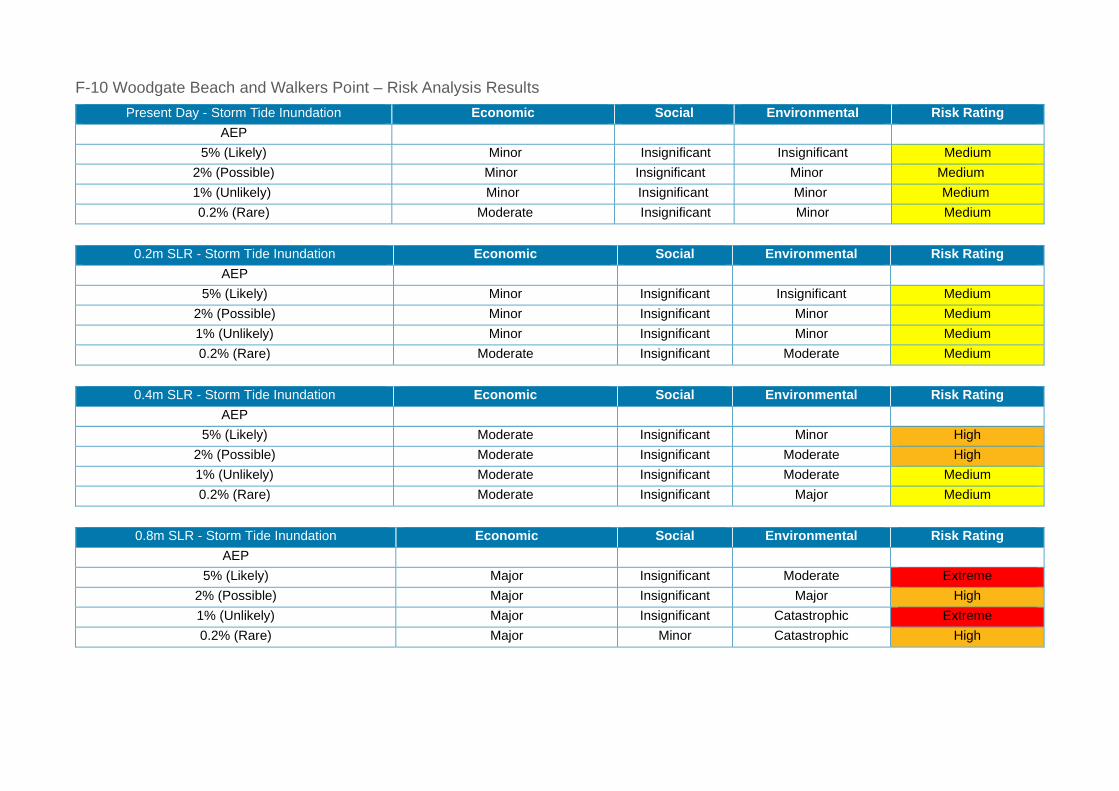
0.2m SLR - Storm Tide Inundation Economic Social Environmental Risk Rating
AEP
5% (Likely) Minor Insignificant Insignificant Medium
2% (Possible) Minor Insignificant Minor Medium
1% (Unlikely) Minor Insignificant Minor Medium
0.2% (Rare) Moderate Insignificant Moderate Medium
0.4m SLR - Storm Tide Inundation Economic Social Environmental Risk Rating
AEP
5% (Likely) Moderate Insignificant Minor High
2% (Possible) Moderate Insignificant Moderate High
1% (Unlikely) Moderate Insignificant Moderate Medium
0.2% (Rare) Moderate Insignificant Major Medium
0.8m SLR - Storm Tide Inundation Economic Social Environmental Risk Rating
AEP
5% (Likely) Major Insignificant Moderate Extreme
2% (Possible) Major Insignificant Major High
1% (Unlikely) Major Insignificant Catastrophic Extreme
0.2% (Rare) Major Minor Catastrophic High
F-10 Woodgate Beach and Walkers Point – Risk Analysis Results
Present Day - Storm Tide Inundation Economic Social Environmental Risk Rating
AEP
5% (Likely) Minor Insignificant Insignificant Medium
2% (Possible) Minor Insignificant Minor Medium
1% (Unlikely) Minor Insignificant Minor Medium
0.2% (Rare) Moderate Insignificant Minor Medium

Present Day - Erosion Prone Area Economic Social Environmental Risk Rating
AEP
5% (Likely) Insignificant Insignificant Insignificant Low
2% (Possible) Insignificant Insignificant Minor Medium
1% (Unlikely) Insignificant Insignificant Minor Medium
0.2m SLR - Erosion Prone Area Economic Social Environmental Risk Rating
AEP
5% (Likely) Major Insignificant Insignificant Extreme
2% (Possible) Major Insignificant Minor High
1% (Unlikely) Major Insignificant Minor High
0.4m SLR - Erosion Prone Area Economic Social Environmental Risk Rating
AEP
5% (Likely) Major Minor Minor Extreme
2% (Possible) Major Minor Moderate High
1% (Unlikely) Catastrophic Minor Moderate Extreme
0.8m SLR - Erosion Prone Area Economic Social Environmental Risk Rating
AEP
5% (Likely) Catastrophic Catastrophic Moderate Extreme
2% (Possible) Catastrophic Catastrophic Major Extreme
1% (Unlikely) Catastrophic Catastrophic Catastrophic Extreme

I-11 Buxton – Risk Analysis Results
Present Day - Storm Tide Inundation Economic Social Environmental Risk Rating
AEP
5% (Likely) Minor Insignificant Insignificant Medium
2% (Possible) Minor Insignificant Insignificant Medium
1% (Unlikely) Minor Insignificant Insignificant Medium
0.2% (Rare) Moderate Major Insignificant Medium
0.2m SLR - Storm Tide Inundation Economic Social Environmental Risk Rating
AEP
5% (Likely) Moderate Insignificant Insignificant High
2% (Possible) Moderate Insignificant Insignificant High
1% (Unlikely) Moderate Minor Minor Medium
0.2% (Rare) Moderate Moderate Minor Medium
0.4m SLR - Storm Tide Inundation Economic Social Environmental Risk Rating
AEP
5% (Likely) Major Minor Insignificant Extreme
2% (Possible) Major Minor Minor High
1% (Unlikely) Major Minor Minor High
0.2% (Rare) Major Major Minor Medium
0.8m SLR - Storm Tide Inundation Economic Social Environmental Risk Rating
AEP
5% (Likely) Major Moderate Minor Extreme
2% (Possible) Major Moderate Minor High
1% (Unlikely) Major Moderate Moderate High
0.2% (Rare) Major Major Moderate Medium

0.8m SLR - Erosion Prone Area Economic Social Environmental Risk Rating
AEP
5% (Likely) Major Major Minor Extreme
2% (Possible) Major Major Minor High
1% (Unlikely) Major Major Moderate High

Melbourne
15 Business Park Drive Notting Hill VIC 3168 Telephone (03) 8526 0800 Fax (03) 9558 9365
Brisbane
Level 3, 43 Peel Street South Brisbane QLD 4101 Telephone (07) 3105 1460 Fax (07) 3846 5144
Adelaide
1/198 Greenhill Road Eastwood SA 5063 Telephone (08) 8378 8000 Fax (08) 8357 8988
Perth
Ground Floor 430 Roberts Road Subiaco WA 6008 Telephone 08 6555 0105
Geelong
PO Box 436 Geelong VIC 3220 Telephone 0458 015 664
Gippsland
154 Macleod Street Bairnsdale VIC 3875 Telephone (03) 5152 5833
Wangaratta
First Floor, 40 Rowan Street Wangaratta VIC 3677 Telephone (03) 5721 2650
Wimmera
PO Box 584 Stawell VIC 3380 Telephone 0438 510 240
www.watertech.com.au