technical note - ntrs.nasa.gov · 5-foot-diameter rotor which took in air through the ......
TRANSCRIPT
cqoo
I
A
Z
<
<X
isc_ ................
i CATALOG ........
:_DEX
-tr
NASA TN D-1432
TECHNICALD-1432
NOTE
LARGE-SCALE WIND-TUNNEL TESTS OF A CIRCULAR PLAN-FORM
AIRCRAFT WITH A PERIPHERAL JET FOR LIFT,
THRUST, AND CONTROL
By Richard K. Greif and William H. Tolhurst, Jr.
Ames Research Center
Moffett Field, Calif.
_~
_ _'_'
NATIONAL AERONAUTICS AND SPACE ADMINISTRATION
WASHINGTON F ebruary _1963
https://ntrs.nasa.gov/search.jsp?R=19630003304 2018-09-01T13:12:48+00:00Z

NATIONAL AERONAUTICS AND SPACE ADMINISTRATION
TECHNICAL NOTE D-1432
IARGE-SCALE WIND-TUNNEL TESTS OF A CIRCULAR PIAN-FORM
AIRCRA/T WITH A PERIPHERAL JET FOR LIFT,
THRUST, AND CONTROL
By Richard K. Greif and William H. Tolhurst, Jr.
SUMMARY
151 o
Full-scale tests have been conducted in the Ames 40- by 80-Foot
Wind Tunnel to determine the performance 3 stability_ and control charac-
teristics of a research aircraft having a circular plan form and employ-
ing a peripheral Jet for lift 3 thrust, and control. The aircraft was
18 feet in diameter and 18 percent thick. Propulsion was provided by a
5-foot-diameter rotor which took in air through the wing upper surface
and drove it through internal ducting to a peripheral nozzle designed to
provide thrust vector control.
Six-component aerodynamic data and propulsion system flow data were
obtained at various angles of attack over a range of jet-momentum coef-
ficients from 0 to 3.4. Flight characteristics in the cruise configura-
tion were determined at altitudes ranging from 12 feet 7 inches to
2 feet 8 inches. Transition-flight characteristics were studied only at
the lowest ground height. Some effects of forward speed on rotor
performance were also investigated.
INTRODUCTION
The ability of an annular nozzle to augment thrust both statically
and at forward speeds near the ground has led to the consideration of
this device for use in vehicles ranging from simple ground-effect
machines to high-speed VTOL aircraft. The principles on which these
nozzles work have been explained in reference i, and results from small-
scale static and wind-tunnel tests of a circular wing with an annular
nozzle are presented in reference 2. Additional information on the
subject can be found in references 3 through 6.
Use of an annular nozzle as the hovering device in practical VTOL
or GETOL (Ground Effect Take-Off and Landing) applications requires some
scheme for the eventual conversion of its jet into conventional hori-
zontal thrust for wing-supported flight. For the circular-winged aircraft
of this investigation, the conversion was accomplished in the following

2
manner. In the hovering condition, its peripheral jet was highly focused(directed radially inward), providing augmentation near the ground whileavoiding the thrust reduction associated with unfocused annular Jets awayfrom the ground (ref. 2). For transition and cruise conditions, an alter-nate passage was provided in the annular nozzle duct to permit the rearand lateral portions of the jet to exhaust radially outward in a mannercharacteristic of a jet wing.
The purpose of this test was to obtain aerodynamic force and moment
data and propulsion system flow data which would enable determination of
the aircraft's performance, stability, and control characteristics in
transition and cruise flight. The flow data were also used to study aero-
dynamic effects on the propulsion system during in-flight operating condi-
tions. The transition studies were influenced by the fact that the
aircraft (which was intended for flight) had a thrust deficiency which
prohibited hovering out of ground effect. As a result, the aircraft
was tested as a GETOL vehicle, although it was originally designed for
VTOL operation.
The purpose of this report is to present the principal results of
the investigation. Additional data can be found in reference 7 along with
some performance calculations for the aircraft based on a 4_500 pound
gross weight.
NOTATION
CD
cy
drag coefficient_ dra__ggqS
side-force coefficient 3
lift
CL lift coefficient_ qs
C_
Cm
%
side force
qs
rolling-moment coefficient,rolling moment
qSD
pitching-moment coefficient,pitching moment
qSD
yawing moment
yawing-moment coefficient, qSD
jet momentum coefficient,jet momentum
CjqS
CPt
D
h
i T
Ja
Mj
q
r
r F
S
V
W
gv
turborotor total pressure coefficient,
(fan outlet total _ressure) - (ambient static _ressure)
q
wing diameter, ft
height of undersurface center from ground, ft
horizontal-tail incidence (positive when trailing edge is
down), deg
lateral control position (right gives a right rolling
moment), fraction of total travel from neutral l
longitudinal control position (negative gives pitch-down
moment), fraction of total travel from neutral l
transition control position l
total jet momentum_ lb
free-stream dy_c pressure, Ib/ft 2
radius from center of turborotor axis, ft
total turborotor radius, 5.0 ft
wing area_ ft2
velocity_ knots
gross weight _ ib
deflection of roll and pitch control vanes from neutral
(_[eutral w_s 30 °, trailing edge down, from horizontal.
See fig. 2(b).)
air density, slugs/ft s
azimuth angle measured from airplane's fore and aft center
line_ deg (see fig. 2(a))
lSee "Model and Apparatus" section for more details.
4
MODELANDAPPARATUS
Test Aircraft
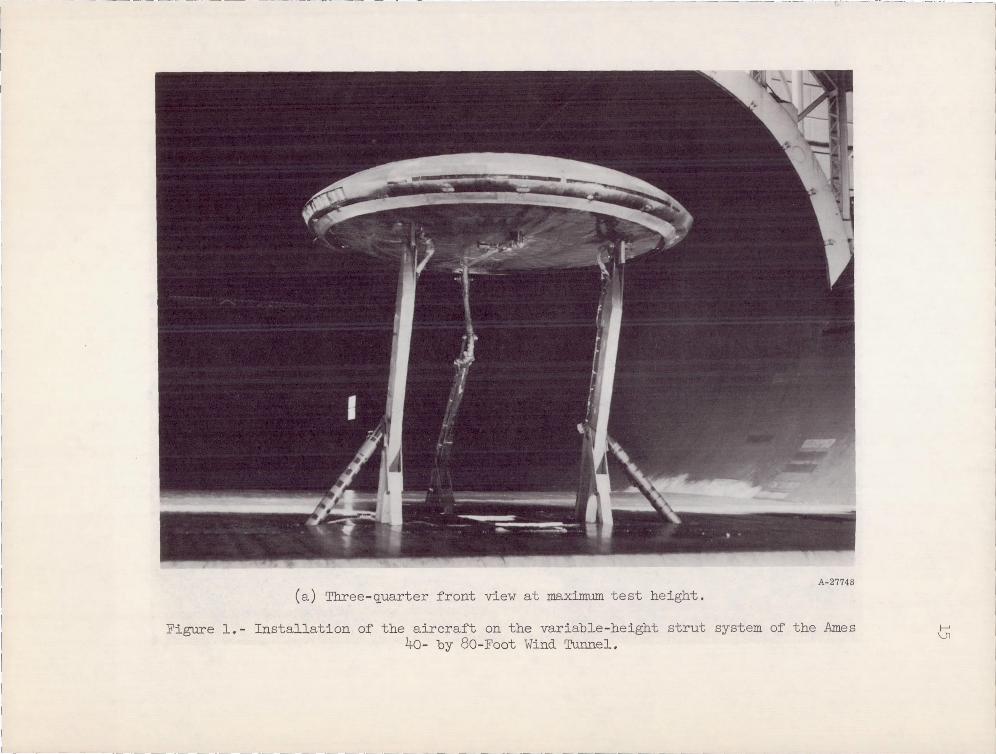
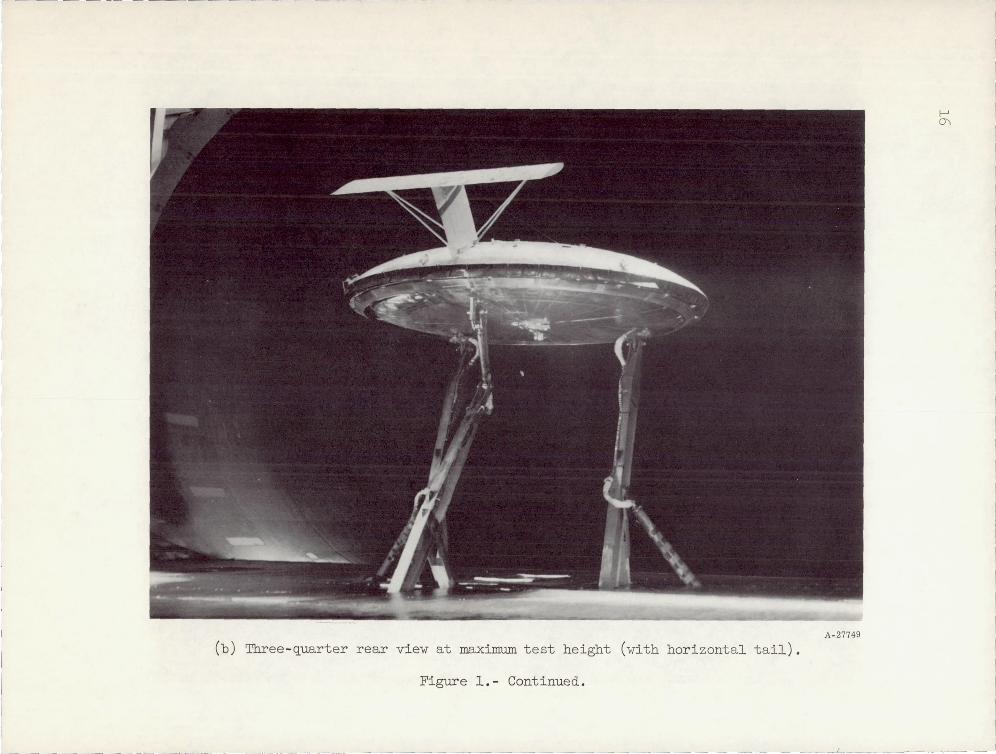
Wind-tunnel installation.- Several views of the aircraft installed
in the 40- by 80-foot wind tunnel are shown in the photographs of figure
i. A support system using variable-helght struts allowed the aircraft to
be raised and lowered for a simulation of ground proximity. Figures l(a)
and l(b) show the aircraft at the maximum test height, which was
12 feet 7 inches from the tunnel ground plane to the center of the air-
craft undersurface. Figure l(c) shows the aircraft at the minimum test
height of 2 feet 8 inches. (This photograph was taken after the wing
was modified to extend the upper surface trailing edge of the wing.)
Geometric details of the aircraft, including those of its propulsion
system, control system_ and test modifications, are presented in figure 2.
The general arrangement of these items and the major dimensions of aero-
dynamic importance are shown in figure 2(a). It should be noted that the
moment center was located at the geometric center of the wing rather than
near its aerodynsmic center, because of symmetry requirements in the
hovering condition. While this would ordinarily cause a large instability
problem at forward speeds, it was anticipated that certain features of the
design (discussed below) would help to minimize it.
Propulsion system.- The essential element of the propulsion system
was a 5-foot-diameter turborotor (rotor with tip turbines) driven by the
exhaust of three J-69 jet engines. Turborotor and engine intakes were
located in the upper surface of the wing. Both turborotor outlet flow
and tip-turbine discharge gases were ducted radially outward to the
peripheral nozzle. The arrangement of these items is shown in figure 2(a).
Control system.- The principal features of the control system are
shown in the section views of figure 2(b). To aid in the description of
this rather complex system_ an artist's sketch of the peripheral jet flow
regimes produced by it are presented in figure 3.
The focusing ring was continuous_ encircling the annular portion of
the nozzle. Its double function was to focus the annular Jet and, through
longitudinal and lateral movement_ control its direction to provide thrust
and moment control for hovering and flight at low forward speeds (figs.
3(a) and 3(b)). The symbols JE and JA denote the displacement of the
focusing ring in fractions of its total longitudinal and lateral travel,
respectively. Positive JE indicates a nose-up control input; right JA
indicates a right roll control input. Calibrations of these items are
given in figure 4.

5
For use during flight at higher speeds, an alternate nozzle was
installed in conjunction with the annular nozzle around the rear 240 ° of
the wing periphery. The design of the alternate nozzle (shown in
fig. 2(b)) allowed the jet to exhaust radially from the wing "trailing
edge" in a manner equivalent to the flow from a jet flap. The lateral
portions of the jet were turned partially aft by means of cascades
located in the nozzle exit. Examples of the flow produced by the system
are illustrated in figures 3(c) and 3(d). The purpose of the alternate
nozzle arrangement was to provide solutions to drag, lift_ and pitching-
moment problems anticipated during operation at higher speeds. To over-
come drag, its function was to provide greater horizontal thrust than
could be achieved by controlling the thrust vector with the focusing
ring system. In regard to lift and pitching moment, benefits were
expected in the forms of increased traillng-edge lift induced by the jet
flap and increased effective aspect ratio due to the radial fanning of
the jet. These would have the combined effects of increasing lift,
reducing nose-up pitching momentj and reducing instability. (Since the
center of gravity was located at the center of the wing, it was desirable
from a pitching-moment standpoint to keep the center of pressure as far
aft of the wing aerodynamic center as _oss_ble. _elve translt±on doorslocated around the aft 2400 of the duct controlled the distribution of
flow between the annular nozzle and the alternate nozzle. Instead of
operating independently_ the doors were separated into two coupled
units. The six doors located in the two lateral 60 ° sectors of the duct
formed one independently operated unit while the six doors located in the
rear 120 ° sector formed the other. The symbol JT was used to describe
a "transition control position" in terms of "rear door position"/"side
door position." (This is not to be confused as a ratio.) Door position
in each ease was expressed as a fraction of the total angular travel of
the doors from their position required for hovering. (For example, a
JT = 0.25/1 indicates the rear doors to be 2_ percent open and the side
doors to be i00 percent open.)
Movable vanes located in the exit of the rear 120 ° portion of the
thrust nozzle provided control moments for pitch and roll. These vanes
were actuated by a linkage connected to the focusing ring so that all
phases of flight would have one common input control. The calibrations
of vane deflection versus JE and JA are shown in figure 4. Note that
positive 5v is given as the angular deflection of the vane trailing
edge up from the vane's neutral position. Neutral position was 30 ° ,
trailing edge do_n, from horizontal.
Limited tests were made with the aircraft equipped with a hori-
zontal tail as shown in figure 2(a). The tail was studied primarily as
a stabilization and trim device.
Modifications.- In addition to the tail studies mentioned above, the
aircraft was tested for the effects of three modifications.

6
The most important modification consisted of a faired extension to
the upper surface trailing edge of the rear 120 ° portion of the thrust
nozzle. This modification (shown in fig. 2(b)) was made early in the
tests in an effort to increase nose-down control effectiveness. It was
left on the aircraft for the remainder of the tests.
In another attempt to increase the nose-down control effectiveness,
a 2_-percent chord flap was extended at a 30° angle from the trailing
edge of each pitch and roll control vane. The effect of these flaps was
studied only briefly.
A portion of the test was conducted with the turborotor intake
fitted with a set of guide vanes as shown in figure 2(c). The purpose
was to determine the effectiveness of these vanes in relieving the
asymmetric loading in the turborotor when operating at forward speeds.
Instrumentation
Measurement of aerodynamic forces and moments.- Measurements of
lift, drag, and pitching moment were obtained by means of strain-gage
load cells located at the attachment points of the aircraft to the
three variable-height struts. Use of the system made it unnecessary to
account for the large tare forces on the unfaired struts. Only the
exposed area of the load cells themselves could introduce tare forces
and these were negligible.
Measurements of side force, rolling moment, and yawing moment
were obtained from the conventional floating frame balance of the 40-
by 80-foot wind tunnel. Strut tares in these lateral measurements were
assumed to be cancelling.
Measurement of jet momentum.- The jet momentum was the product ofthe total mass flow through the _ system and the exit jet velocity at the
peripheral nozzle. Total mass flow consisted of the mass flow measured
through the turborotor and the mass flow of the jet engines. Turborotor
mass flow was determined from six radial pitot-static pressure rakes
spaced at 60 ° intervals around the rotor azimuth. A check using two
other systems (believed to be somewhat less reliable) gave mass flows
which agreed within the order of +i0 percent. To calculate the exit
velocity of the jet, total pressure was measured at the nozzle periphery
and the jet was assumed to expand isentropically to free-stream conditions.
This method of calculating jet velocity was subject to some question
because of the presence of a swirl effect in the duct flow. However,
it generally checked to within I0 percent of an alternate method whereby
Jet velocity was determined from continuity considerations using the total
mass flow (described above) and the exit geometry of the nozzle. In view
of the foregoing, it can be stated with reasonable certainty that the
probable error in nozzle jet momentum is no greater than lO percent.

7
Since it was difficult to hold constant values of jet momentum and
tunnel free-stream dynamic pressure during the test, it _as necessary to
state Cj as a nominal value in all figures herein except figure 6. The
deviation of actual values of Cj from the nominal was generally within
±5 percent, or less than the probable error in Cj itself.
PROCEDURE
Range of Variables
The investigation covered a range of free-stream dynamic pressures
from 3 to 25 pounds per square foot, corresponding to an approximate
Reynolds number range from 5 to 15 million, based on the wing's 18-foot
diameter. The majority of power-on runs were made with a constant jet
momentum of about 3,000 pounds. Combined with the range of tunnel speeds,
this gave a Cj variation from 0 (power off) to 3.4. Total mass flow
through the turborotor and engines was approximately 390 pounds per second
for the 3,000-pound thrust condition.
The aircraft was tested at ground heights of 2 feet 8 inches
(h/D = 0.15), 3 feet i0 inches (h/D = 0.21), 5 feet 0 inches (h/D = 0.28),
and 12 feet 7 inches (h/D = 0.70). At the lower height, angle of attack
was restricted for mechanical reasons to a range from -9.5 ° to +2.5 ° . At
the maximum height_ angle of attack was varied from -i0 ° to +24 °.
The characteristics of the longitudinal, lateral, and transition
controls were studied over their full ranges of available travel. For
those tests with the horizontal tail, stabilizer incidence was varied
from -20 ° to -32 ° .
Method of Testing
The Cj _arameter.- The majority of the tests were conducted at a
constant value of jet momentum, with tunnel speed as the variable to
obtain a range of jet momentum coefficients. To confirm the validity of
this technique, a brief investigation was made at zero angle of attack
for the forward flight configuration (JT = i/i) to determine whether jet
momentum or tunnel speed had any effects on the correlation of
aerodynamic coefficients with Cj.
GETOL transition studies.- Since the transition doors operated in
two independent units, a wide variety of transition control techniques
was available for testing. However_ it was not practical to perform the
extensive tests necessary to determine the opti_mm of these techniques,
especially in view of the other variables involved (ground height, etc.).
Three door opening sequences representative of a transition from hover
to cruise flight were therefore selected for exploratory study. These
were: (i) a sequence in which the side doors remained closed until
the rear doors were fully opened] (2) a sequence in which all doors

8
opened together; and (3) a sequence in which the rear doors remained
closed until the side doors were opened. The method that produced the
best combination of high lift and large nose-down moment for a balanced
thrust-drag condition was then selected for a complete transition study,which was carried out as follows." At each of nine transition control
settings (9 JT) selected to give the desired door-opening sequence, datawere obtained at the ground height of 2 feet 8 inches to determine the
effects of angle of attack along with longitudinal and lateral control
position. Each JT was tested over a range of momentum coefficients
selected to correspond with its particular area of operation during atrams ition •
Cruise flight tests.-Tests to determine the aircraft's character-
istics in the cruise flight condition were conducted at a ground height
of 12 feet 7 inches. For each of several Cj, the effect of longitudi-
nal control position was studied through a range of angles of attack.
Measurements of lateral control effects were less extensive.
The foregoing was repeated for the tail-on configuration after a
very brief test to determine a tail incidence that would be somewhat near
optimum (from considerations of maximum trimming capability without an
excessive drag penalty).
Power-off base runs.- A circular cover was placed in the turborotor
intake and conventional angle-of-attack variations were made with power
off at both the maximum and minimumtest heights. Both tail-on and
tail-off data were obtained.
CORRECTIONS
Standard wind-tunnel wall corrections were not incorporated in the
data reduction for this report. Corrections were applied, however_ to
account for a slight inclination of the wind axis caused by the presence
of the variable-height strut system. Uncorrected values of angle of
attack and drag coefficient based on the tunnel goemetric axis were cor-
rected as follows:
_corr =C_uncorr + _
CDcor r = CDuncor r + CL sin Zk_
were negligible)_ where, for the ground heights
0.70 2.9.28 2.5
.21 2.5
.i5 2.5
(These measurements were obtained during tests of the variable-height
strut system in the absence of a model.)
(corrections to CL
used in this investigation:

9
RESULTS
Table I is an index to the figures discussed in the following section.
Longitudinal Characteristics
Power-off base runs.- The power-off longitudinal characteristics of
the aircraft at two ground heights are presented in figure 5 for both the
tail-on and tail-off configurations. The data were taken with a cover
plate in the turborotor intake. Nominal q was 26 psf for each curve.
Correlation with momentum coefficient Cj.- The results in figure 6
indicate that the correlation of CL, CD3 and Cmwith Cj is independent
of the value of free-stream dynamic pressure for the forward flight con-
figuration (JT = l/l) at a ground height of 12 feet 7 inches (h/D = 0.70).
Based on these results 3 results of reference 23 and unpublished data, the
results for other configurations and ground heights tested in this investi-
gation should show the same degree of correlation. Their application,
therefore 3 should not be restricted to any particular value of wing load-
ing as long as geometric similarity is maintained.
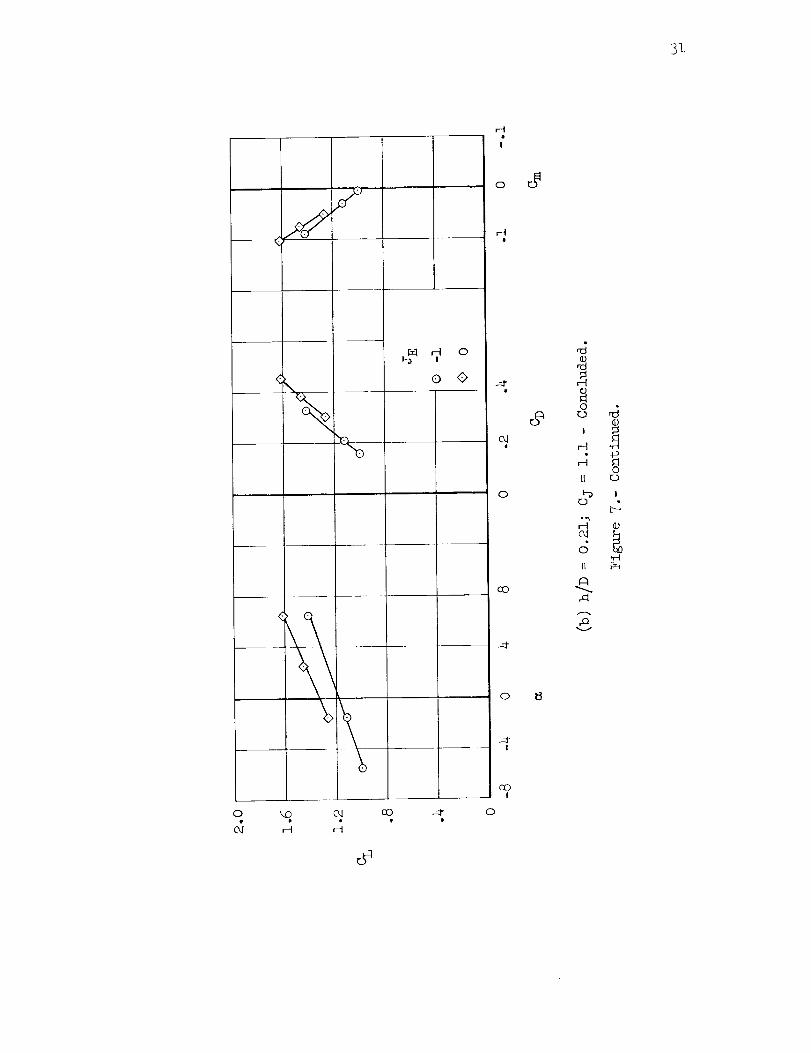
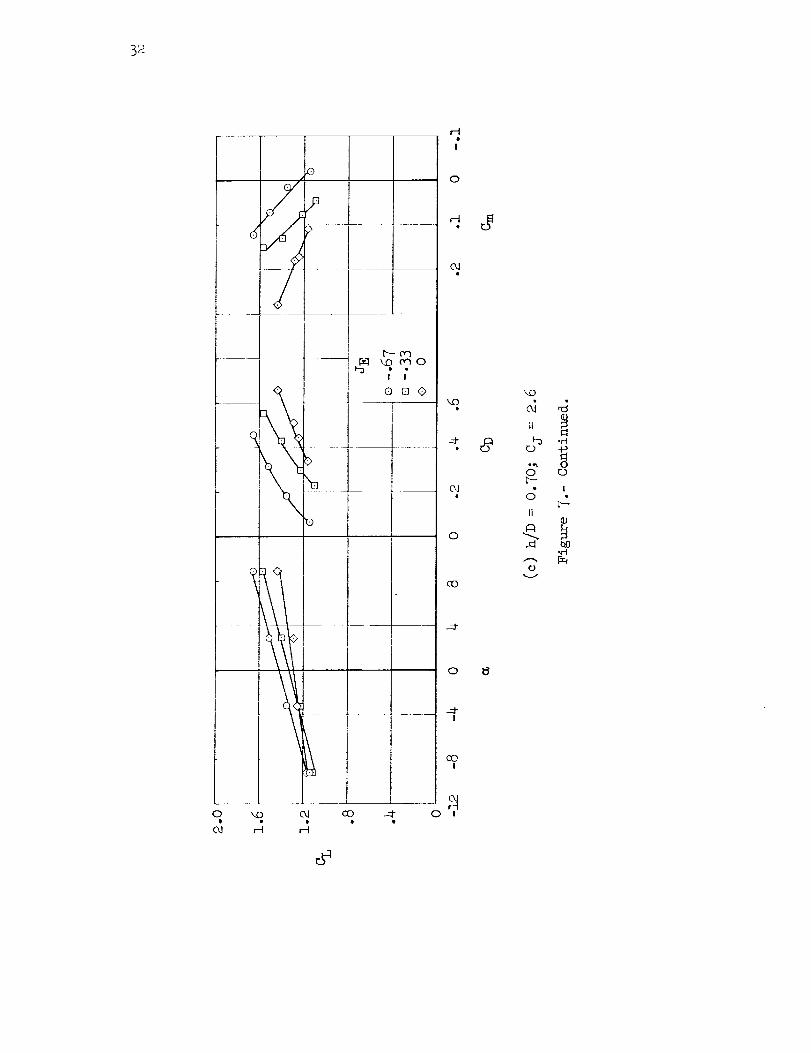
Transition characteristics.- The longitudinal characteristics of the
aircraft at various stages of transition are shown in figures 7 through 9.
Effects of angle of attack 3 longitudinal control position, and momentum
coefficient are shown over a range of transition configurations varying
from the hover configuration to the cruise configuration. A few results
have been included throughout to show the effect of the horizontal tail.
All results pertain to the modified trailing-edge configuration.
Figure 7 presents results corresponding to the initial stage of tran-
sition in which the aircraft is in the hover configuration (transition
doors closed). The results are presented for several ground heights to
show the general effect of ground proximity and to illustrate the necessity
for a more efficient jet arrangement in free air flight. A better illus-
tration of ground effect can be seen in figure 83 where the results of
figure 7 at zero angle of attack and neutral longitudinal control have
been cross plotted against h/D for several values of momentumcoefficient.
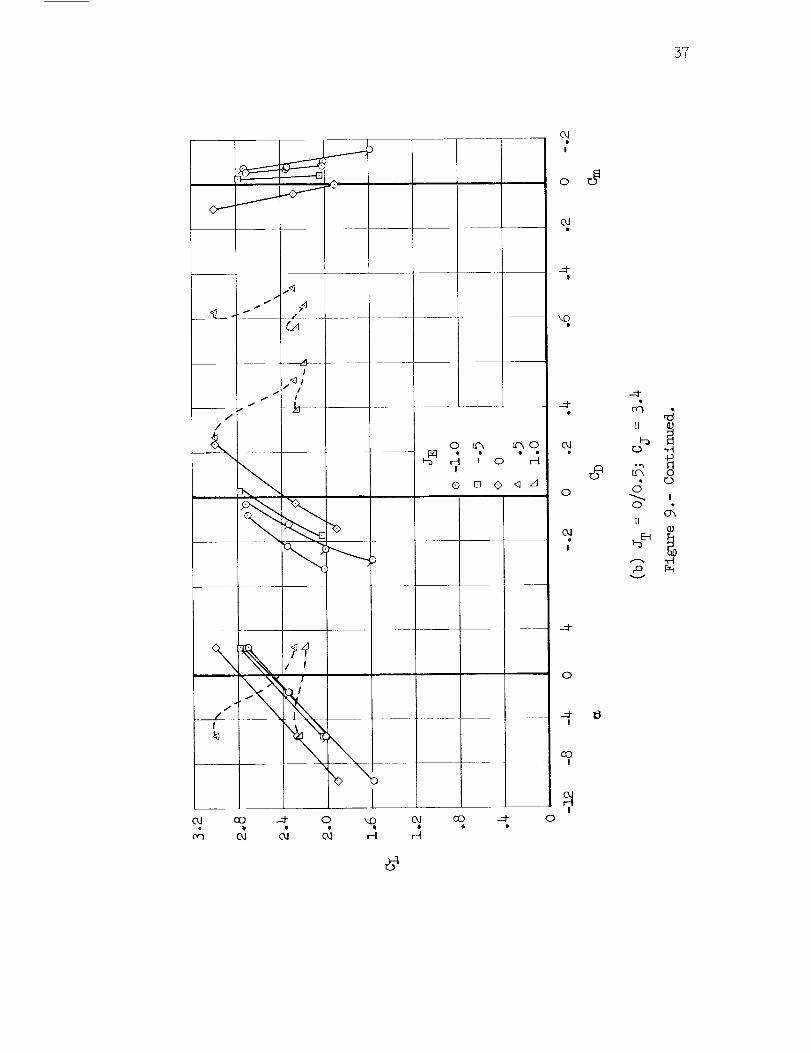
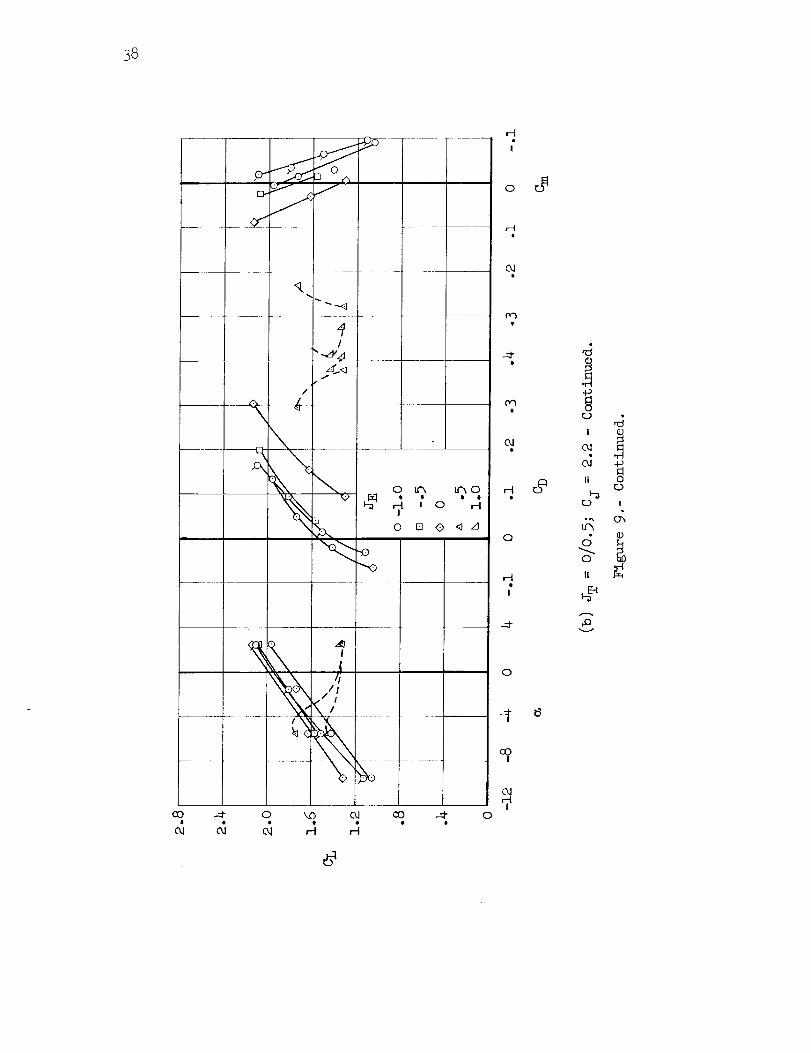
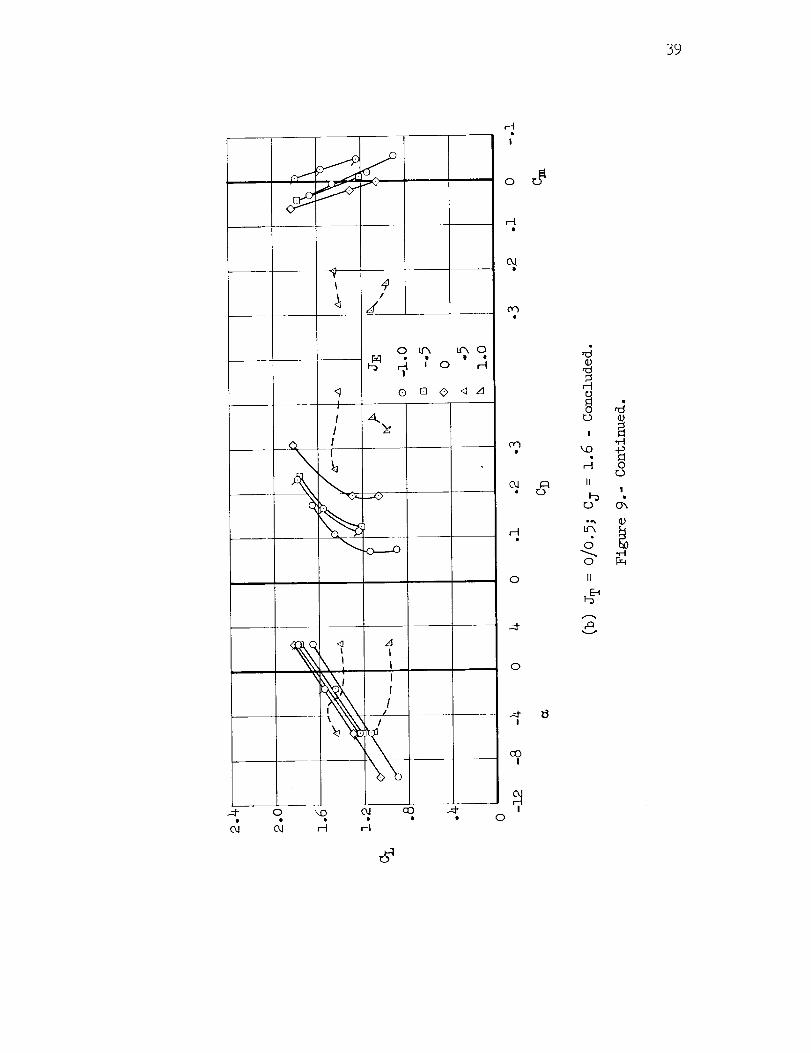
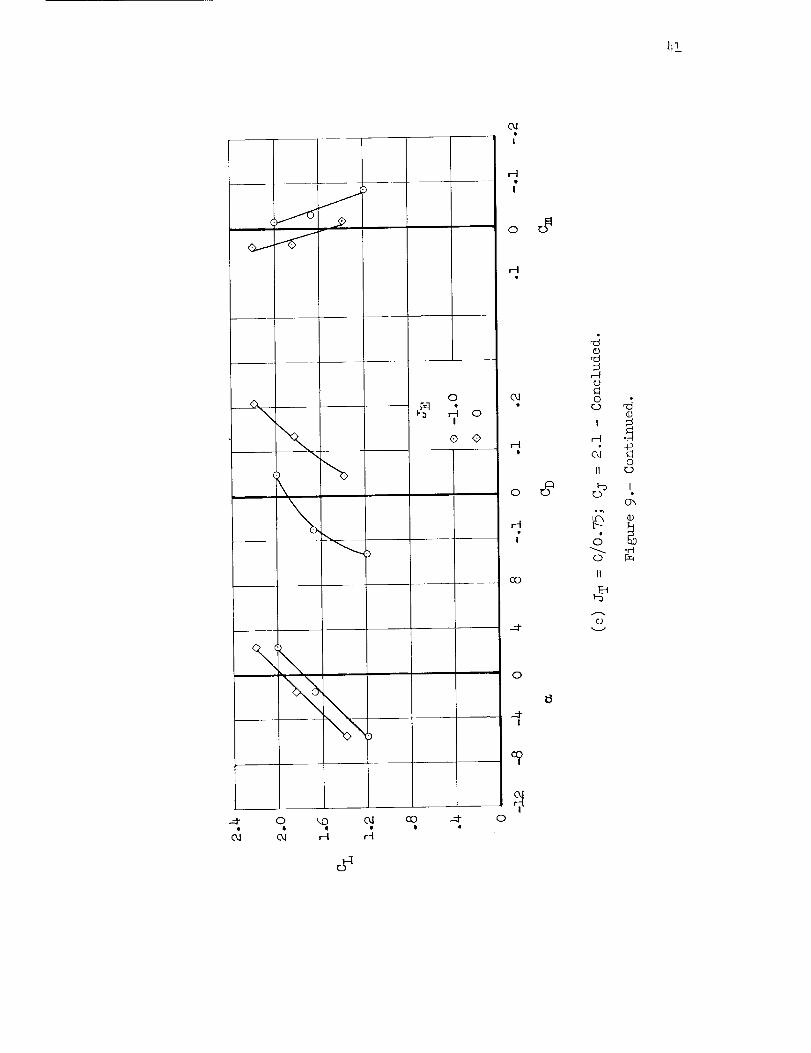
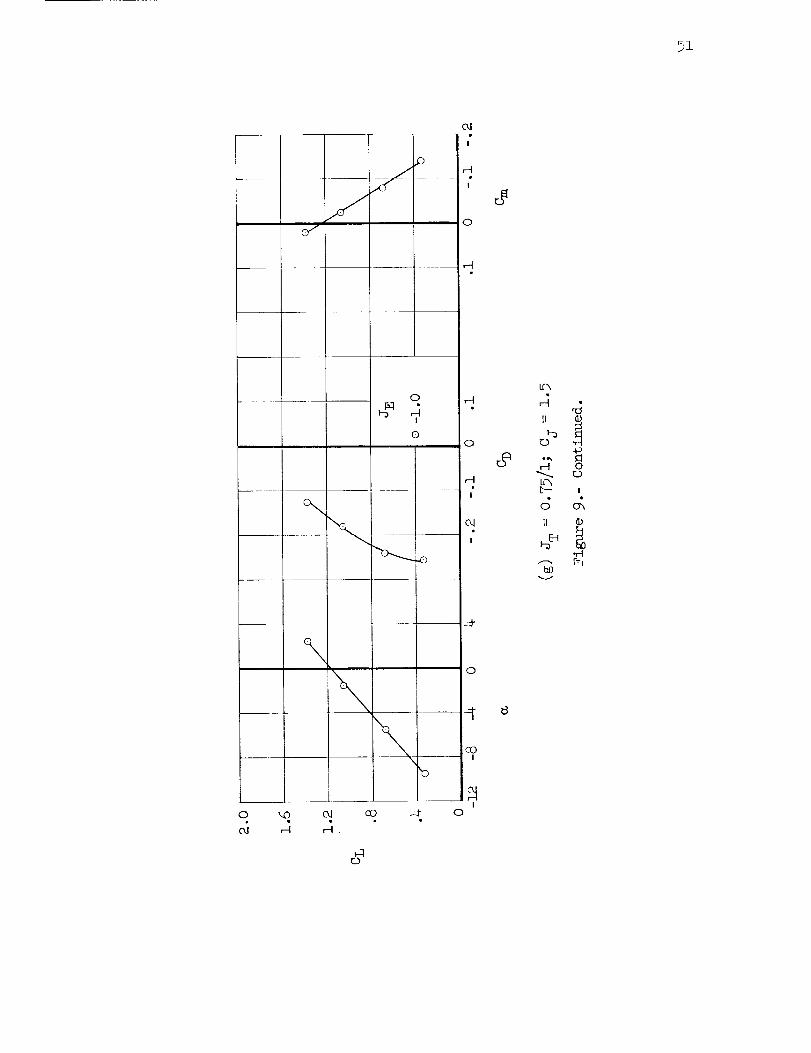
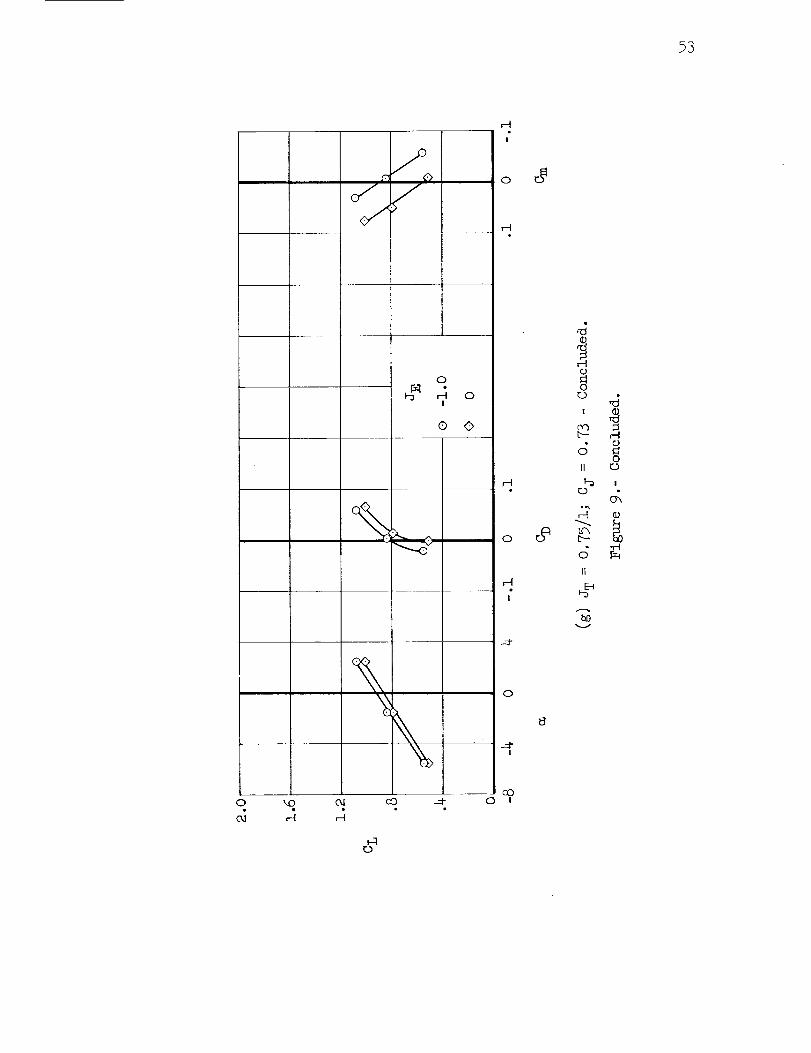
Figure 9 presents characteristics corresponding to the intermediate
stages of transition during which the transition doors move from their
hover position toward their cruise flight position. Results are shown
only for the sequence in which the side doors were opened before the rear
doors 3 because this was the only technique found not to result in exces-
sive nose-up pitching moments. The tests from which these results were

i0
obtained were conducted at the lowest possible ground height (h/D = 0.15),since it appeared that full advantage of the ground effect would have tobe taken to enable transition.
In figures 8 through 9(d), the rear transition doors were in the hoverposition and the side doors were at increasing stages of opening. Underthese conditions, increasing angle of attack produced wing leading-edgestall when the controls were set in nose-up positions (JE _ 0). The cor-responding results are presented as dashed curves in the figures. Figures9(e) through 9(g) represent the high-speed phase of transition, duringwhich the rear transition doors were at increasing stages of opening whilethe side doors were completely open. No stall characteristics wereobserved under these conditions.
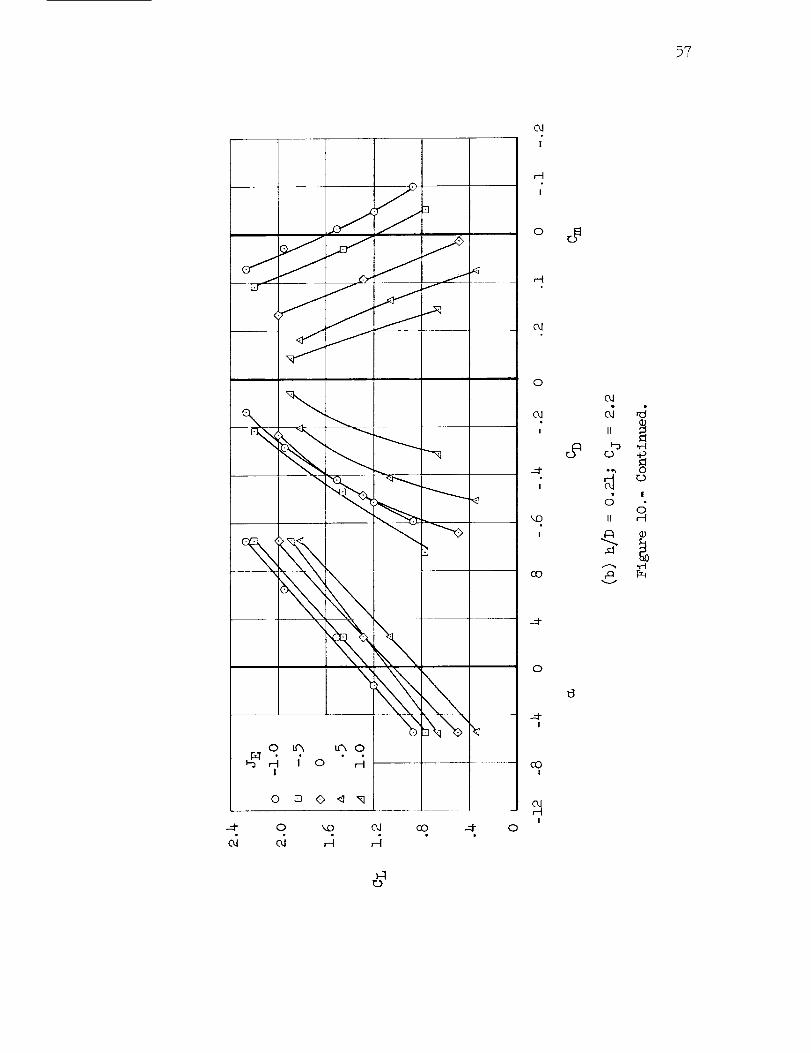
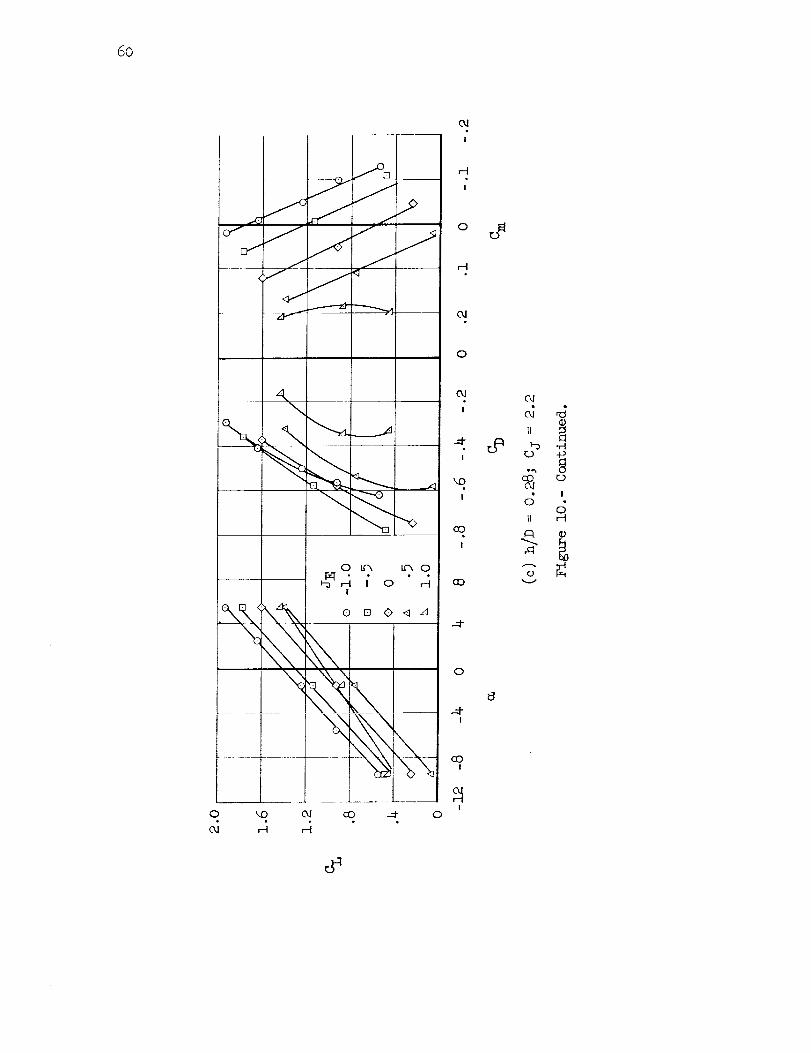
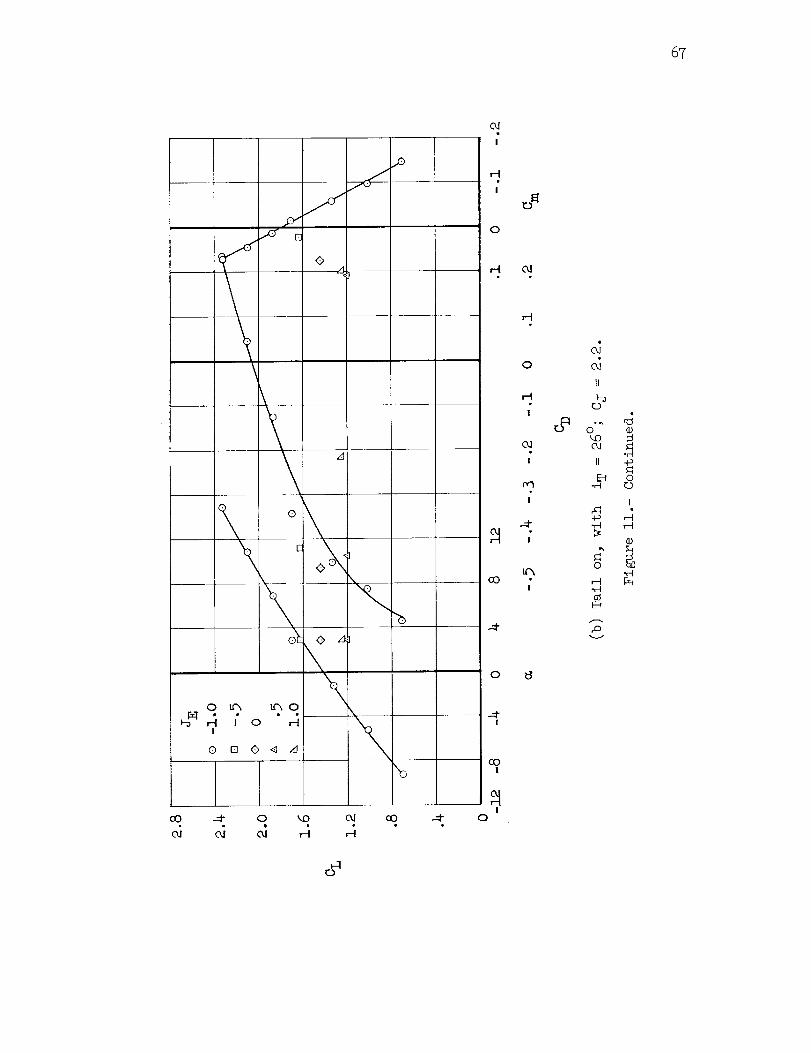
Cruise flight characteristics.- The longitudinal characteristics of
the aircraft in the cruise flight configuration are shown in figures i0
through 13. Results for various longitudinal control positions are
presented for several momentum coefficients.
The characteristics of the aircraft with the trailing-edge
modification are shown in figures i0 through 12. Figure i0 presents the
results for low and intermediate ground heights. Characteristics out of
ground effect (maximum test height) for both the tail-off and tail-on
configurations are shown in figure ii. Figure 12 presents the results
for the tail-off configuration with the addition of flaps on the pitchand roll-control vanes.
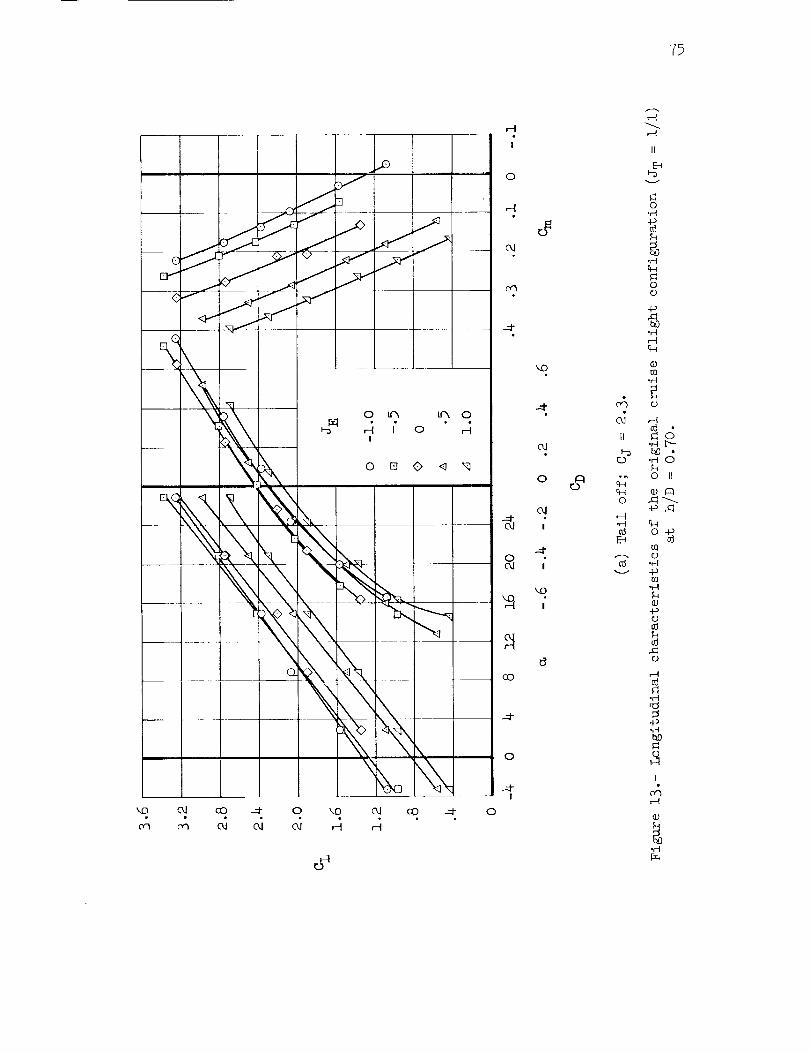
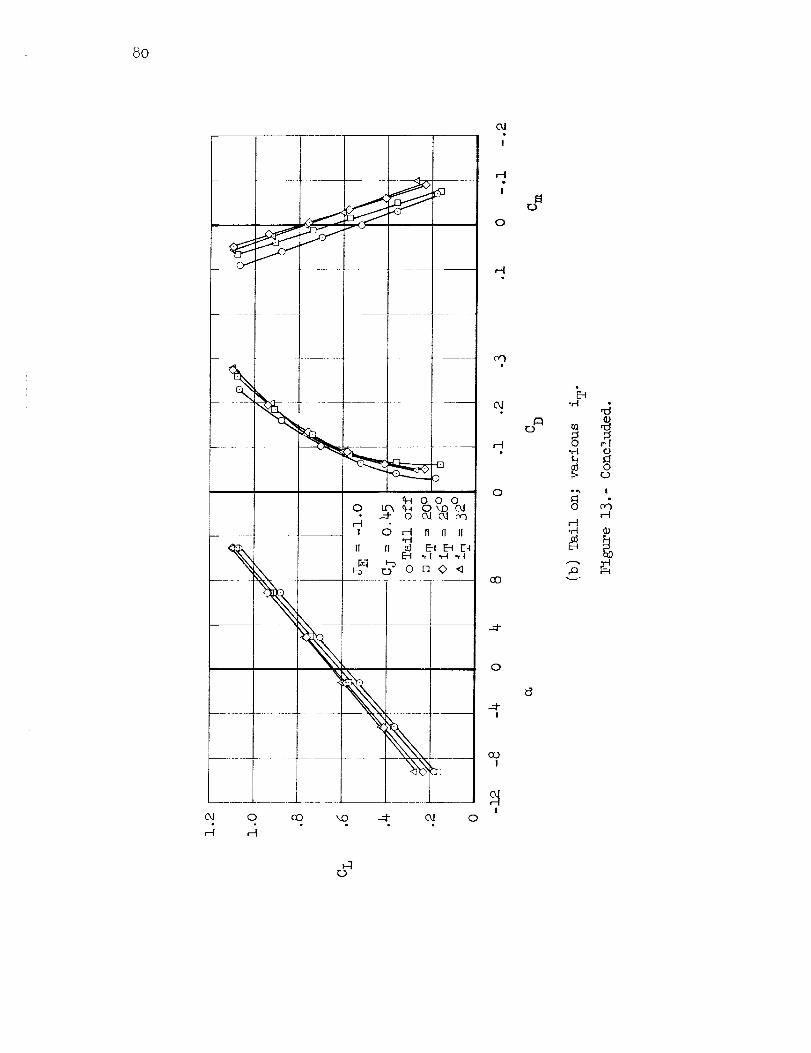
The characteristics of the aircraft prior to the trailing-edge
modification (original configuration) are given in figure 13. The latter
figure shows the effect of adding a horizontal tail and varying its inci-
dence. It is interesting to note in figure 13(b) that the tail contri-
butes very little to the stability of the aircraft. This result indicates
that the tail was operating in a region of high downwash caused by the
aircraft's propulsion system.
l_teral and Longitudinal Characteristics With and
Without Turborotor Intake Guide Vanes
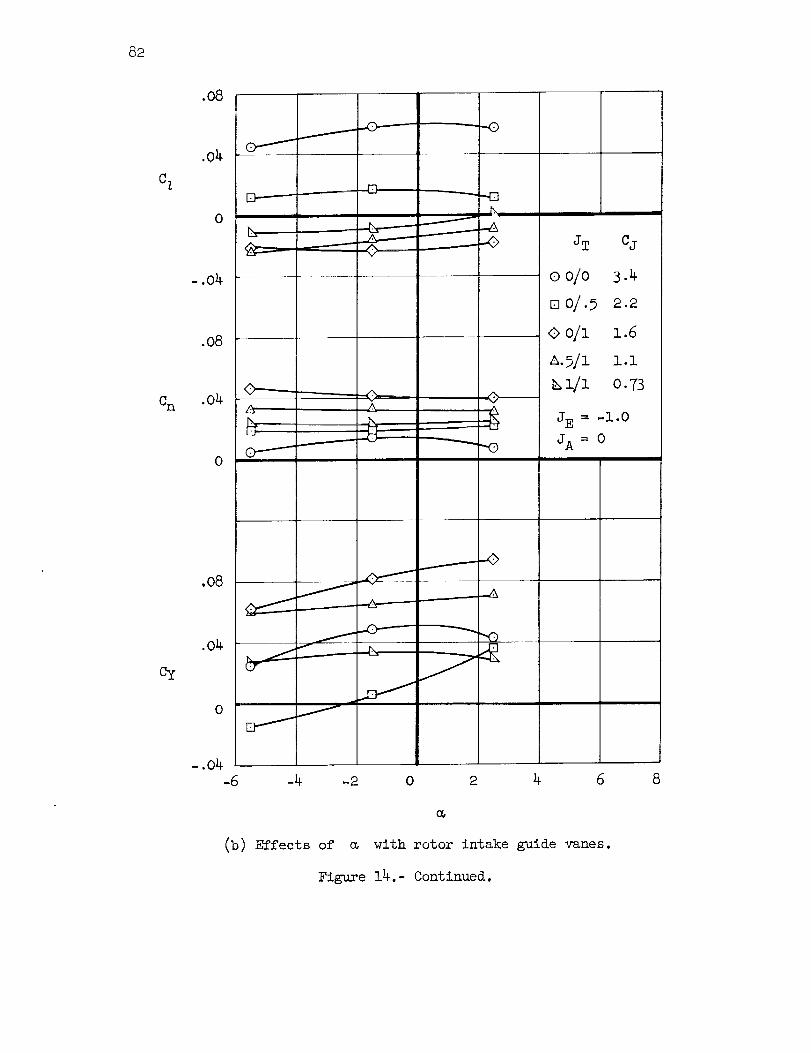
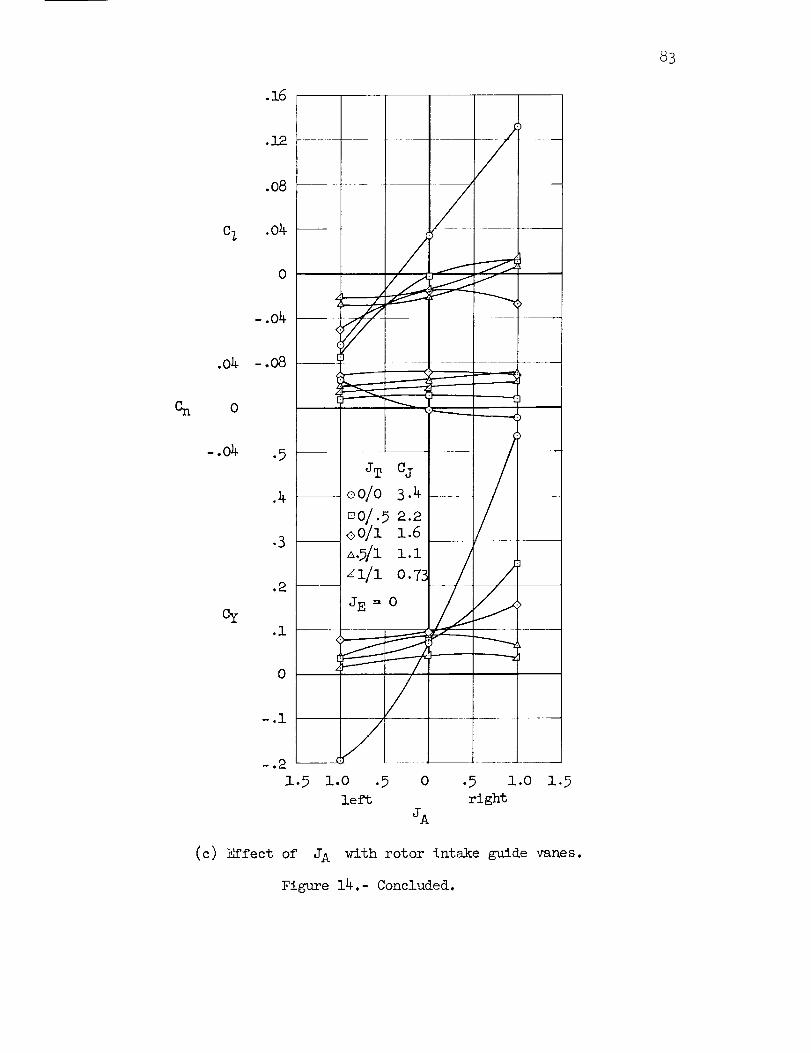
Lateral characteristics.- The lateral characteristics of various
transition configurations in the presence of ground effect are shown in
figure 14.
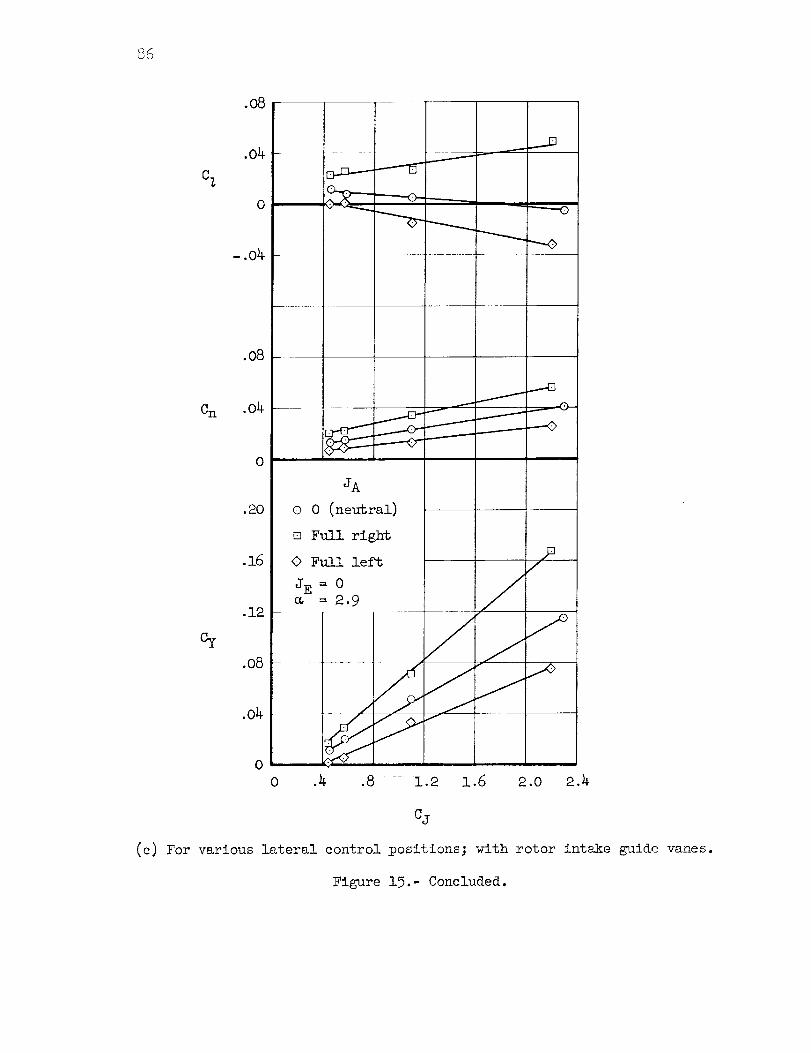
The lateral characteristics of the cruise flight configuration in the
absence of ground effect (h/D = 0.70) are presented in figure 15. The
variations of Cy, C_, and _u with momentum coefficient are shown in
figure !5(a) for several angles of attack and in figure 15(b) for various
lateral control settings. Effects of the installation of guide vanes
in the turborotor intake can be seen by comparing figure 15(b) to 15(c).

li
Longitudinal characteristics.- The longitudinal characteristics of
the aircraft with intake guide vanes are shown in figures 16(a) and 16(b)
for transition flight (h/D = 0.15) and cruise flight (h/D = 0.70),
respectively.
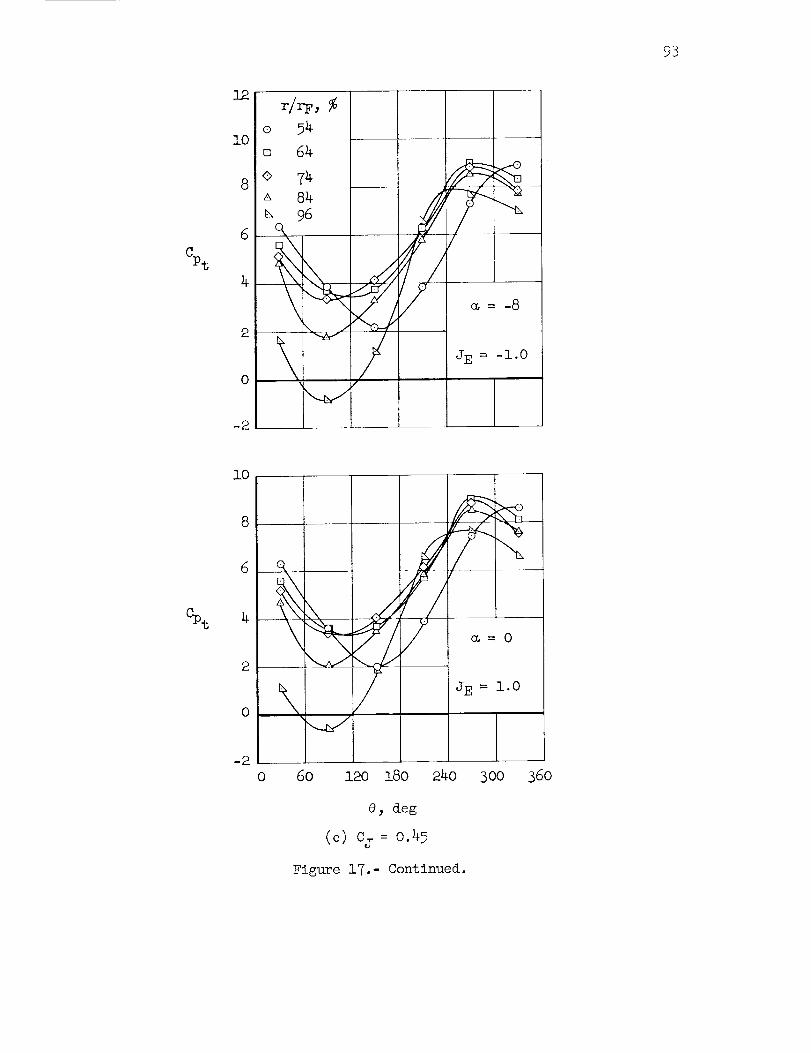
Turborotor Outlet Pressure Distribution
Circumferential pressure profiles at the turborotor outlet are
presented in figure 17 for various momentum coefficients, angles of
attack, and longitudinal control settings. Variations of total pres-
sure coefficient with azimuth angle are plotted for several radial
stations. All results were obtained at h/D = 0.70 for the forward
flight configuration without rotor intake guide vanes.
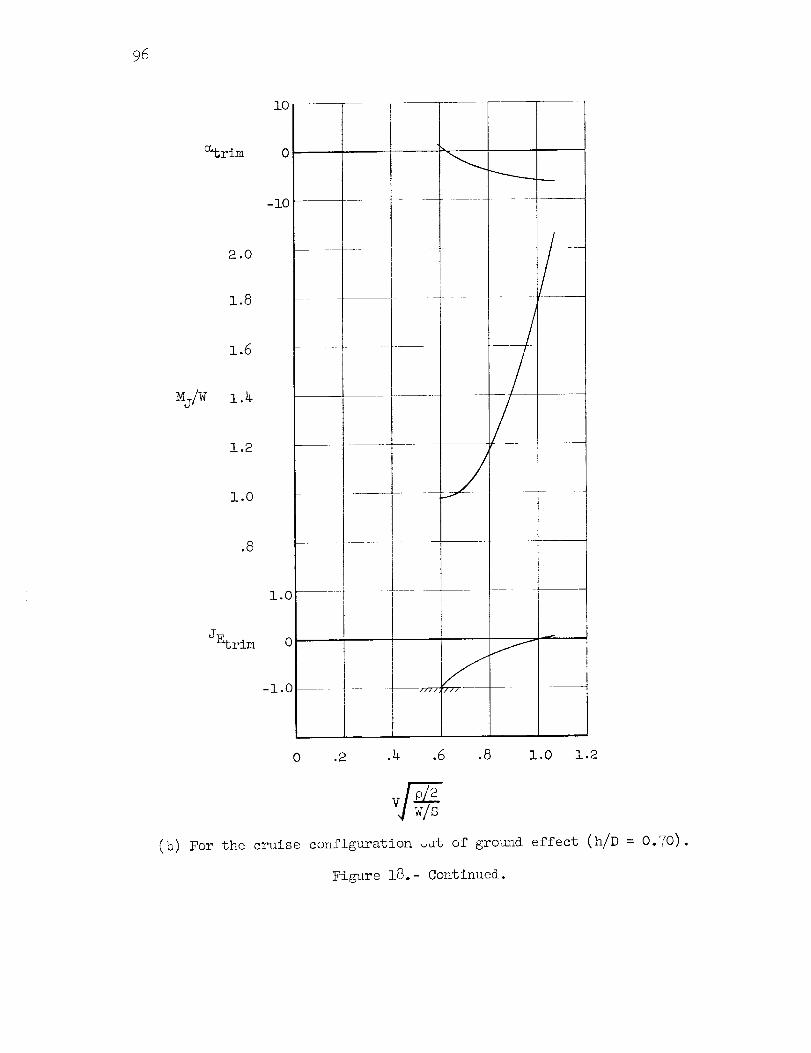
Performance Summary
An analysis of the results was performed to determine the available
speed range through which the aircraft was capable of maintaining trimmed,
level, unaccelerated flight (i g flight). The results of this study are
summarized in figure 18.
Momentum thrust to weight ratio, angle of attack, and longitudinal
control position required for I g flight are plotted against a dimension-
less speed parameter in figure 18(a) for several transition configurations
operating in the ground effect. The same form of presentation is used in
figure 18(b) to show the results for the cruise configuration out of the
ground effect. Each curve was obtained by cross plotting the basic test
results for the modified trailing-edge configuration without the hori-
zontal tail. Momentum thrust to weight ratios were obtained from ratios
of Cj to CL, while the speed parameter is equivalent to_/C L.
It can be seen in figure 18(a) that a trim point at any given speed
can be produced by more than one combination of airplane variables. A
selection of trim points through the transition speed range can therefore
be based on the desired variation of any one airplane variable (e.g., at
constant angle of attack, or at minimum thrust (power) required). To
illustrate this, cross plots of trim points for two cases of power
variation (constant power and minimum power) are shown in figure 18(c).
It is interesting to note that the momentum thrust-to-weight ratios
(see Instrumentation section regarding accuracy) required during transi-
tion appear rather large in comparison to what might be expected of a
vehicle which utilizes an annular jet for thrust augmentation during hover.
For this aircraft, however, there is little reason to expect any thrust
augmentation effect to carry over into transition since its jet configura-
tion, as dictated by the requirements of horizontal thrust and longitudinal

12
trim, does not remain annular at forward speeds. (This was illustratedin fig. 3.) Compoundingthe problem is the fact that the angles of attackrequired for trim did not permit full utilization of the aerodynamic liftavailable from the wing. A reduction in the thrust required for transi-tion might be accomplished by: (i) performing the transition at lowerground heights; (2) developing schemesto provide horizontal thrust andlongitudinal trim which would still allow the main jet configuration tobe optimized for maximumlift; and/or (3) overcoming the pitch-up problemsassociated with wing operation at high angles of attack.
While the curves of figure 18 represent the trim conditions of zerodrag and pitching moment_it should be noted that the aircraft does notin any instance have static aerodynamic stability. To makeit a flyablevehicle_ an automatic stabilization system of sometype would have to beemployed.
AmesResearch CenterNational Aeronautics and Space Administration
Moffett Field, Calif., July 19, 1962
REFERENCES
l.
.
3.
_t
5o
.
o
Chaplin, Harvey R.: Theory of the Annular Nozzle in Proximlty to
the Ground. DT_B Aero Lab; Aero Rep. 923, 1957.
Greif, Richard K., Kelly, Mark W., and Tolhurst, William H., Jr.:
Wind-Tunnel Tests of a Circular Wing with an Annular Nozzle in
Proximity to the Ground. NASA TN D-317, 1960.
Von Glahn, Uwe H.: Exploratory Study of Ground Proximity Effects
on Thrust of Annuiar and Circular Nozzles. NACA TN 3982, 1957.
Chaplin_ Harvey, and Stephenson_ Bertrand: Preliminary Study of the
Hovering Performance of Annular Jet Vehicles in Proximity to the
Ground. DTMB Aero. Lab., Aero. Rep. 947, 1958 •
Rethorst, Scott, and Royce_ W. W.: Liftimg Systems for VTOL Vehicles.
IAS Paper No. 59-123, 1959.
Boehier, Gabriel D., and Spindler, Robert J.: Aerodynamic Theory of
the Annular Jet. Part I. Aerophysics Co. Rep. AR 581-R_ 1958.
Gar!and_ D. B.: Report om Phase 2 Tests of an Avrocar in the 40- by80-foot Wind Tunnel at NASA Ames Research Center. Avro Aircraft Ltd.
Rep. 500/Aero Test/408, vols. !, 2, and 3, 1961.

13
TABLE I.- LIST OF FIGURES
Longitudinal characteristics
Power-off results ...................
Correlation with momentum coefficient, Cj .......
Hover configuration, several heights ..........
Hover config_kration, effect of h/D ..........
Transition configurations, h/D = 0.15 .........
Cruise flight co_figuration, low heights ........
Cruise flight confign/ration, h/D = 0.70, tail off/on.
Cruise flight configuration, h/D = 0.70, vane flaps
Original cruise flight configuration, h/D = 0.70, tail
off/on .......................
Lateral characteristics (with and without intake guide vanes)
Transition configurations, h/D = 0.15 .........
Cruise flight configurations, h/D = 0.70 ........
Longitudinal characteristics with intake guide vanes
Transition configurations, h/D = 0.15 ]
fCruise flight configurations, h/D = 0.70
Rotor outlet pressure distributions .............
Performance summary plots for modified trailing-edge
configuration, without tail ...............
Figure
P
6
7
8
9
lO
11
12
13
14
15
16
17
18

14
A-27748
(a) Three-quarter front view at maximum test height.
Figure 1.- Installation of the aircraft on the variable-height strut system of the Ames 40- by 80-Foot Wind Tunnel.
I--' \.Jl
l
(b) Three-quarter rear view at maximum test height (with horizontal tail) .
Figure 1 .- Continued .
A-27749
f-' 0\
-- - - - - - -- ------__ - - -- - - _ _ _ _______ .L.---__ _____ _

---------, ~ . ......,..... - --- --
(c) Rear view at minimum test height.
Figure 1.- Concluded.
A- 27772
I--' -.J

18
Wing area = 254 ft 2
Wing diameter = 18 ft
t/D = O.Z8
Aspect ratio = 2/_
Tail area = 30 ft 2
i9.67
Engine AirIntakes
Cascades/
(All dimensions in feet)
vane s
1 through 6 from port tostarboard)
PLANI VIEW r
: " ' _ 0
Moment center--_ _ 9.28 _'_
k I Turborotor_i-_-;
_-_ / _-_%i _ .... ' ___"_/
.92D-"__C_.-_''2 -" _ <t__ Pitch and roll_ _.--._. _ . _ - /-_ _-control vanes! L ver_ica± momen_ _ L___
center at 0._8 ft Transition Focuslngrlngfrom lo_er surface doors
SIDE VIEW
(a) General details.
Figure 2.- Geometrical details of the aircraft.

19
O00"1-I
_moo
.r-t%
E-_
(1) bl
0
"r-I
o 0r.D
_-_0
_ d
%

2O
SECTION A-A
(c) Sketch of the turborotor intake guide vanes.
Figure 2.- Concluded.

(a) Hover configuration Transition doors closed. Focusing ring neutral. Pitch and roll controlled by movement of focusing ring.
(c) Mid- transition stage Rear transition doors closed . Side transition doors open. Pitch and roll controlled by movement of focusing ring.
21
(b) Initial transition stage Transition doors closed. Focusing ring moved aft 7 but with reserve travel for pitch and roll control.
A-29196
(d) Cruise flight out of ground effect All transition doors open. Pitch and roll controlled by movable vanes located in rear 1200 of thrust nozzle.
Figure 3.- Sketch of the j et flow regimes produced by the control system during various flight phases.

22
30
20-
3
42
1
6
W I I
-lO o
3k--Vane number
o
(a) Longitudinal control position with neutral lateral control.
Figure 4.- Calibration of focusing ring position and pitch and roll
control vane deflection versus control position.

23
30-
lO
6
5
4
3
2
i
Vane number -/
2-
L
i .0 .5
+._
._
(b) Lateral control position with neutral longitudinal control.
Figure 4.- Concluded.

2_
O.__r_
JZ
crm
Od
!
r-[
i j
0
t-t
c¢)up
0
Q
\
o,tii
0
I!
_0 .p ,...._ II
0
0
cO
0
!
c_up
0.1 ,--1 0 r-I
t
co!
d
6_
W
4-_,-qbO
-t--I
,-q
4_
4_
H,'dicl
_J,el
r_¢.)
.,-I_1_
.t-I
(9+-_0
0
r--I
.rt
Ro
r-t
oI
%
!
,1-1

25
.2
Cm .0
_______ -------o-----cr--
.2
CD .0
-.2 _ ....
-.4
-.6 h/D = O.7O
q
o 3.1
-.8 _ 5.3<> i0.4
a 15.82.0 _ 20.6
h 26.0
JE=01.6
CL i. 2 / o
.8
.4
0
0 .4 .8 1.2 1.6 2.0 2.4 2.8 3.2
Cj
Figure 6.- Effect of free-stream dynamic pressure on the correlation of
longitudinal aerodynamic coefficients with the jet momentum
coefficient.

26
0
¢
1
oJ
1
let0 r-.b
OJ
/.4-
F.._ 0 Lr_ LrX 0_ ,4 j" o ",_i L°
I
0 [] ¢, ._ .4
....... CO
g
t
t/ 0
__ L _ ._
'o b
co!
_ 130 _ 0 LO 0 I
o_ d d d ,4
o
0
_cl
0
W
o,,,-I
4-_
°._.o"O'43
0.I]1
11
•1-t o
%
r-4 _
_ "14 m
m_
%
"1"-I
°rt
!
.r-t

27
i°
o_
t
I
o o_
4
f
%
!
Ar.3
. . __ ..._q
c_ eJ c_ _
L)
0 ff'_ I._0 0,.I• • •d i o d
I
0 [] _ ,_l ,_0
cO
0
I
00
1o,1
0 IcOt
.H
0
!
c_II
r_
Q
0
II
A
,,.,-,%
0
!
©

28
OI
I
o_
_q
%
J
o o
\
_0 OJ cO00
Od
_40
_q-8
o_d
o
o
o_oJ II o
!
o b--
o _
0.r-t
L"kl 11 E_b
o
_ dt
cOI
,-t0 !

29
0J
!
e
F_ ,-q 0t
0 0
C
o4 A
0
o.1o
!
.
_o°_
!
II©
.,-t
q
\
_.0 OJ CO _ 0 _0 CU CO
0
I
COI
0
C_

30
r-I
0
..... 1--1
J
• • • m
OJ CJ CJ F_
LO
_ _, o
o _>
0
co
0
I
cOcO _-_ 0 I
-rl
0
0II C_)
0
I1
A
_n
31
,-i
o
;-I
£ C
t
0 _0
OJ f-t r-t
cot
e
t
0
cO
0
I
coI
0
©
o
_o_J
H ,,4
0II rj
% i
o Cr'q DO4s g
,iqII _tt
¢,.Q
32
r-I
0O
0.]
t 0
_ Cq
0
oO
_ -i_o 0.I co _i- 0 u
r-t r-t
m_
g _I
d _11
or--I

33
r-t
o
ID
["_- 0q
. _, t
.3
10)
kDD
@O_
W
0
oO
0
!
.,.q
o
c_
o
0 @
d g
.-g
0
Ol
k.o
r-t
C_
r-tIb

3_
i-Ii
I
o
r'_
Odo
41
kO
..4-
0
0
do
i::l0
!
cO
0
II
d11
v
d
¢..)
<::)
!
bl
-rl
0
OJ rl rl
!
cO!
o I

3_
Cm
%
c_
.2
.i
.4
.2
0
2.8
2.4
2.0
1.6
1.2
.8
/
o_
f
Q
D
-------.__ _
Cj
3.0
2.0
1.0
.4
Figure 8.- Effect of ground height on the longitudinal characteristics of
the hover configuration at _ : 0 and JE = O.

36
-D
c
\
cO __ O _o O_ coJ e 0 • e •
r-i
o
o
o
o
r-i
_J
o
o
T
!
!
@
o
11
A
o
4_
OJ 0 E_
11 o ,._•r4 4_
C...) -r4 _tm
Ol % 0
c; -°H
-p-pII
_ ootq
•rt _'1
,--I
"r-I
+-_,r-t
!
,r-t
37
J
OJ
I
0
OJD
!I
--.H-Q
XDo
f/
I
1 t_11
0 tf_ u"XO
I
G D _ ,_ A
• @
L_ 0
0 _ !
II
o,J
V
/ I
I
!
• • U U Q 4
co G_ oJ O_ rH rd
-?
CO
I
O
0
38
_jorl
0
r-Iii
%
/
/
I "
c3
Lr_ Lr_o
.j
I
I/i
cO ._ 0 k.O OJ cOii dD • • db _p
OJ C_I 0,1 r-I H
4" 0
C_JI,
r_q,
q,
OJ
rt
rt
---d-
0
oOI
!
0rj
!
0,1
c_I!
F_
c_o
II
rov
rj
!
©
39
o #
rlII
O_
--,d-
OJ
0I
04
o LOX LOX 0. II q,
t---
/
/!
I
,4.
kO O,I cO
H H
@
I
. ',.o_4 o
_D
.i-I0
0 II
E--I_-_
-4- #a
0
I
COI
I0

Z
I
_.._ _...-------_
0
_ oe
0,J
od ,
v
0
!
|
0,1 cO ...:t" 0 _ 0..16 ) • • (i
IO
41
Jc.Z ._
i"
o
\
\\\
0
I
o0
0
i"
!
oc_
I
,-I
_J
I1
c_
0
(2?
.-g
o
IQ
ON
©
-r-t
• k 4 k0

42
o
@
_ ;o _
o @o
o &II

_3
O_
o #
e
OJ
o_ _o _; o ',-I o
0 [] <:> _ /1 i .H.p
_ or...)
,-4 r--t
0 .rt
II
X. 0 E-4,'-t _
_ ° ._..... |
_ JJ
ii I
o _ _ coO4 r-t r"t
0
-4"I
!0

44
'F!
f
rt
e
CU 0.I
0 _ I._0Q •_ ,o 4
!
k.o
r'-I
0,1 cO -.-4"
r-I
Ii
Od
0
rt
0
!
GO0 !
d
r--I
o_ d
! .r"'l
,--I 0
II I
0 ",--I
11
"d

45
0 _
C_
I
o
I
0
0
C)
0
I
0_
I
Lr_
il ©
0
L_O_ n
,.,--t
©
0g
Ctl
\
\r-I
cO M-
0
!
cOI
0 J

_6
r_
!
o J
\
"C)
0
!
©
0 ',.0 Ol cO
r..)
oJ
o
0
,-(
!
0
_._-fI
co0 i
rj
.rl
0r.D
!
I-[f_
FI
II
r_)
_CL_OJ
c_II
(1)v
J_0
r...)
!
c_
b_.r-I

47
I
0
,-I
"--o
o4 _
0r_ •
_ 0
C_l
0
I
0
I
co0 n
c)
c_
©
b_
c_ "_-p
II oC.)
c_) l
• -_ C_,-I
C_l
c_ ._
v

48
f
j_
OJ
!
s
I
O
O,5
O U"N L,_O
_ _ ,'o "_
0
.-d" 0 '_, o_1 co .-d-o • • •
o.1 o.I r--I ,--I
Lf_
lI _D
,-4 "-., _
!
d dII
_ -r-t
o
I
0 i

_9
cq
_ A ,'o'A!
Z
I
o
O
oH
O
!
q
I--I
II
;$
&&I1
E_
%v
,i-t
o
!
.H
O kO O_ co
O
-.d-
O
ooO i

_0
I
0
,-1
j_
C_l
,-I _ 0 r-I
0 D _ ,_ A
O kO ¢_1 cO ._-
_D
d
O
o
!
0o!
O
O
or.D
!
eq
Jtl
%_D
JIt
eHv
oH
0r.D
!
ON
!
0
0
4I
©
II ©
ij _ !
d
," _.rt
\
0 ',D Ol
0,1 _-t r--I.
\
M"

.92
7o"
r4i
I
o
,-4
#
0
OJ ,-I
0.I
,-I
0
_ _ o!
0 <>
A
\OD __ 0
,--I
0
,-I
I
0
I
coI
#
8
.H
0
¢.I
r-I .,.-I
0II r._)
u_[--
d NII
_3
dsIj
!
e
O
c_
_o
o _
o _
!
co __D
0
!
c_0 l
cj
_o
O
H
v

54
j_ _ . J
O Lrx U"XO
,-_ I" r_l 0
,
o D <> <A
0
c_
LO oJ co -I"
_a
0
I
0
,-I
o.1
o.I
O
Od
I
I
_D
I
.-d-
O
I
coI
,--I
II ° o
v
-i-I .1-1..p
_0._-H
.H+_,-4 H
O_ 0OCH
II m
° _II O m
-p b_
©4-_
0 .r-t
-0 %• H b.O
_ _o_
,'rt

5_
i-C
J
!
o
r_
0 t_ a'h 0
I
0 [] _> <_ .4
%
o ko cd co -_r
ro
o
!
!
o
!
co!
0
_e
_o
oII
!
o J
o._I
II
A

56
,J
_F
rl
I
O
,-I
#
O _ Lr_ O
#A ,"o
A,.
0 _D OJ
O3 _ r-I
CO -_-
0
0
0
r_
I
0
I
coI
(Dn_
(J
0
or-I_- +_•
0 0L)
III
_0o S
s g._
57
!
o D _ _ ,_
0o 0
r.D
o3
!
!
o
¢-q
o
oJ
I
!
_D
!
co
o
!
cO!
!
A
0,1
I1
%r_)
c;
I1
A
o
!
c;r-i

_8
H
I
O
,.-I
(_
O hrh
_A _'oI
O [] _ _ "_
\
,-t
O
I
co
O
I
cOI
Ao
t3
4
!
,H
oO
1ti
o J
°H
II ,El
A
--_ 0 ',.o Ctl
o,.! o,I i--I _1
I-1_D
oO .-_ 0I

59
1oI
0
,-t
0
I
0 [] Q _ '_
0,1 0 cO
o,-I
0
I
0
I
coI
!
©
0
0o @
x,O -Hb- 4°
o_o
11!
1-oo J,-t
0.H
11 ff-_
A
3-,a
v
60
_'OEl __
_'- J J_-- f JJ
<7" j_
O_
!
I
O_
0
o_ oJ
0 kid 0,I CO -W" 0
I
, j jII r--I
O0 A 0
_ -r-t
CO "_
0
I
co!
!
o,1 r-t r-I

61
0
oJ
I
--_ o
r-_
0 Lr'X U"XO°
b H I 0 HI
OJ
0.1
k.O
X 0
oI
I
'.,.o
I! __
oco .-_ 0(kl
_D
..=1-
I
4o
_ord
' 4,-I o
t=1,-I 0
0I1
!
dH
&" ®
0,H
II [ml
A

62
f j-
- _ yJS
0 I._
!
_.o
o _ xe
!
!
oj
oJ
0
I
kO
cOcO
!
0
!
cO!
!
0
od
II
o
II
o
h
o
.H
il
OA
.d
h©
Wh
.r4
4-_.Hbl?
0
!g
%
g.r-I

63
I
o
J
G
o _ u-_ 0
b_ _'o'4!
o rq 0 _ _
•-_ o _ oi
_ ,-4 ,-4
co
o.I
oro
o.I
I
co
o
I
I
o.Ir-I
I---I" o
,
d
I
,-I oc)
III
-H r-_
B
c6

6_
!
0
O_
0
I
o m 0 < s
0 _0 oJ cO
!
co
0
!
(sO!
!
0
J
@.H
440
!
c_l!
%o
v
o
!

65
J
cJ
I
I
0
0 LCX
0
o []
_.o.
o,-I r..3 o
0 e_
o0 0 c)
II I
cO
.H
.H
0 c_
1
cOI
I
_ 0 M3 cJI

66
!
o
0
I
0 \%
cO _0 _ 0_1 0
O4
0
r-i
!
cO
-.-.-I-
0
!
cOI
!
o_0
!
0
II
0
,-I.r-I
E-t
v
oo
!
°H
67
S,Y
Y E
\
\
o,I (_ _ rl ,-Io
0.I
!
!
0
0
!
0,1
!
_q
!
--:l-
cO!
o
!
cO!
!0
o
('_
II
.,_
(_-_1
o
I
ho
E_
,.ov

68
JU
A
k
o.1
!
,-I
!
0 •
cO
0
I
oo!
!
6_
0a
w
o
!
6
@o
!
,-t
o
oJ i
°_
o
,av
6a

69
0 1_ tl'hO
rl I" 0 rlI
.--4" O _ 0,1 cO --_
0,1 r-I rt
I
!
O
0,I
,-t
O
I
co
O
!
cO1
!
O
r.D
oA
.4©
-rl
O
!
LD_b-
j _4©
c_" aED",.DC_ a
E-I•rl ©
.rl•,-t r_
o
-rt
EH
,.av

70
0 L_ _ 0
I
,o
o
00
,-I
!
0
0
r-I
0
I
CO
0
I
!0
0
(D
0C.)
!
kO
0 C>LDC'LI I
E-I
•H F-_
0
rl
E-I
v

7z
\
0 L_ L_O
I
O [] 0 < ,,_
\
O ",.o 0.11
O
cO
"O
01
!
'!.!
O
o"t0
0.1
'!.
O
,-Io
!
00
O
t
00!
!O
,d
Oo
!
O
il
O
O',..OGI
il
El-H
.,-I
O
,-4,,-I
v
oo
!
r-I,4
.rl

72
J
\ o\ o
u'_ u'_ o
I o r-I
04
o '..o oJ
o,l ,-I J-1
c)
co o
0_I
i
,-I
I
o
,-I
04
0
Ckl
!
.:f
!
0
--.-r!
aO!
o
c.)o_II
o
03v
-pc_
,-I
,-I
II
v
_o
_o•r_ ,-I
_o__J
.rl
,--i© 0
%
o o
.r-t
°d
4-_.r--t
!
d
"r"lNt

73
,-I
!
,-t
\\
0
!
0
o D _,_ _
0 _ O4
0.1 0.l i-I ,--I
(13 0
o4
,-t
0
r-I
!
cO
0
I
cOI
H
JII
%rj
,-Qv
+_
0
I
,-t
.,-I

7J_
43f
oJ
!
!
o
rt
\ \
o _ t_ o
!
0J
o
,-I
I
o
I
o11 o
d,----, r--t
0
,rt
,-t r-t r--t
CtlJ
coi
Io
7_
.,o
j
,-I
!
0
,-I
C_l
nq
_-_ _ I° 0 "
O
kD O_ CO _ O kD
01
o.,-t
o _oJ
OJ i
..--I-00J I
",.D
'_ ,
rj
co
o
ct/ co .._ o
r-I
II
E_
o
%
o()
.r-t
©
-r-I
!
._ p--
_ Jo II
_.__ A
o _
H
0
Ul
m
%
-o¢..I
%c6
O
,---t
,r--I
4_-r"lN?
I
O"1
,-t
"1-t

76
0 _ _ 0
,-i i 0 ,--I1
,H
!
0
00_I
co
0
1
cO!
cO
4_
Q
• 0_-I C.)
0 11 '
',-,--1

77
O4
!
!
0
,--I
G,I
0 LP_
I* 0!
tc'x 0J
r-I
0
oJ
0
O_
I
cO
0
!
cO!
!
oA
-,H
kO
11 !
,.;H

?8
Z
T_
Z
,-I
!
o
ol o oo
r l rl
O 1#_ O
!
0 D 0
.-ml- o.I o
c)
.H
i
o rJ_ ootc_
_1 11
, %
.4,,%
oo %o
,-t.H
v
o
!
!
!o,I
_d
orj
!
r-t
r_

79
/
%
,-I
0
0 _ 0
_ _ ;o_
o D _ _
• • • •OJ
I
C_
!
I
0
OJ
#
#0
I
co
0
d
I
cOi
I
o_
I
0
u
0
113
.rl-0
I
r_
8O
oJ
I
,-I
J
%oO
0
I
o_ 4
H
OJ _0
cOt
a!
0

81
.12
C_
C n
.O8
.O4
- ,04
.O8
.04
/Z
r-<D
D---___ __.___--[3{3
.jhi
r
h- ---_ "_ ._
_0----- I
O---- -O-----
JT Cj
o olo 3.4
[] ol.._ 2.2
o oI_ 1.6
A.511 1.1
v, 1/1 o.73
JE = -i.0
JA = 0
.12
.o8
/--e-----
/
Cy .04
0
- .04
-6 -4 -2 0 2 4 6 8
(a) Effect of _ without rotor intake guide vanes.
Figure 14.- Lateral characteristics of various transition configurations
at h/D = 0.15.
82
C_
C n
.O8
.O4
0
- .04
.o8
.o4
0
,O8
.O4
0
h------
i
J
_D
J_ cj
o o/o 3.4
[] o/._ 2.2
<>o/1 1.6
A.5/1 1.1
al/l 0.73
JE = -i.0
JA=O_D
/f
I f
-4
(b) Effects of
-2 o 2 4 6
c_
with rotor intake guide vanes.
Figure 14.- Continued.
8
%
.16
83
-.04 .5
.4
.3
.2
.1
-.1
JT Cj /
®olo 3._-
_o/..5 2.2__ <>o/1 1.6
•5/1 I.i
____ _i/I o.7_. _/ //[JE = 0
-.2
1.5 1.0
left
• 5 o .5 1.o 1.5right
aA
(c) Effect of JA with rotor intake guide vanes.
Figure 14.- Concluded.

84
C_
.08
.o4
- I
Cn
Cy
.o8
.o4
.2O
.Z6
.12
.O8
.o4
O
_D
0 ,I .8 1.2 1.6 2.0 2.4
Cj
(a) For various _; without rotor intake guide vanes.
Figure 15.- Variation of lateral characteristics with Cj for the
cruise flight configuration (JT = i/i) at h/D = 0.70.

85
C_
.O8
JJ
.04 _ _--_
0
o4
_---O
Cn
O8J
J.04 _ _--
•2o
o .4 .8 1.2 1.6 2.o 2.4
cj
(b) For various lateral control positions; without rotor intake
guide vanes.
Figure 15,- Continued.
86
.O8
C_
.O4
0
- .04
Jj_
.o8
C n.o4
0
.2O
.16
.12
.o8
.o4
f
/
Q 0 (neutral)
[] Full right
p0 Full left /
JE = 0 /=2.9
///
0 .4 .8 1._ 1.6 2.O 2.4
Cj
(c) For various lateral control positions_ with rotor intake guide vanes.
Figure 15.- Concluded.

8?
I
0
o_
o"H
00 0
-p0
0OO "H
..r-im _
m
o
0 u_ ,-4
° _0,I II
-la
_ ,.-. ,.d
I
M3
c¢3
Od CO
OJ
0 kD
,-t
O/
,-t
CO
COI
0
#

88
kOi,
._-f
,-I
OJ
,--I
0
,-I
cO
0
\
• •
0
I1
ol
r-t
1
0
r'-t
0.I
0
I
I
0
I
cOI
0
@
el
II
v
o-r-I
.r-t
o
©
•r-I o
0c..)
.rl
,-to
°r-t
o"b--,
d11
A
,.Qv

89
6o
_o
4o
Cpt 30
2o
lO
o
r/_,,
o 54
[] 64
74
A 84
_" 96
\JE = -1.O
5O
4O
3o
Cpt 20 _
\
0
_=0
J = -1.O
0 60 120 180 240 300 360
e _ deg
(a) Cj = 2.2
Figure 17.- Circumferential pressure profiles beneath the turborotor at
various radii from the rotor axis_ h/D = 0.70_ no intake guide vanes.

9o
_t
24
2O
16
12
0
-4
i
jE_= 180
_t
_4
2O
16
12
0
-4
0
r/rF_ %
o p4
[] 64
O 74
8496
1_ t N
6o 120 180 240 300 360
a _ deg
(b)cj = 1.1
_igure 17.- Continued.

91
Cpt
24
2O
4 __ __
o \\/-4
_=0
JE = -.5
Cpt
24
20--
16--
0
-4
o 54
D 64
o 748496
0 60 120 180 240 300 360
e _ deg
(b) Cj = i.i - Continued.
Figure 17.- Continued.

92
Cp t
24
2O
16
Q 54
D 64
74
_ 96
12 × /
8
4 /o j0 60 120 180 240
_--8
JE = -i.0
3OO 36o
ej deg
(b) Cj = 1.1 - Concluded.
Figure 17.- Continued.
93
Cpt
12
o 54lO
64
748
84
1,
2 x,._/
o \,
-2
/f
_x
/ c_ = -8
JE = -1.O
CPt
lO
8
2
0
-20
JE
60 120 18o 24o
e_ deg
(c) cj = o.45
Figure 17.- Continued.
0
1.0
300 360

94
cpt
12
i0
8
6
4
2
0
-2
\\
e 54
D 64
96 __
Cpt
lO
8
6
4
2
-2
q
\
0
J/
le
\
_=0
JE = 0
6O
J
120 180 240 300
e_ deg
(c) Cj = 0.45 - Concluded.
Figure 17.- Concluded.
360

95
_trim
1.8
1.6
1.4
Mjlw
1.2
1.O
.8
i0
0
-lO
1.O
JEtrim 0
-1.O
(
/
contr_
!
< iJLown'
)i lira/
,/ i///./ .
JT
o ot.a_u ol..5<> 0/.75A 011
V.2911
.5/z_.75/zo I/i
0 .2 .4 .6 .8 1.0 1.2 1.4
4 w/s
(a) For transition configurations at h/D = 0,15.
Figure 18.- Performance summary showing the variation of basic aircraft
variables required for trimmed_ level_ unaccelerated flight. Tail
off configuration with modified trailing edge,
96
i0 ......
_rim
2.0
1.8
1.6
j/w 14
1.2
1.0
0
-i0
°8 __l
I.C
JEtri m 0
-I.0
o ._ .4 .6 .8 1.o 1.2
(b) For the cruise configuration _at of ground effect (h/D = 0.70).
Figure 18.- Continued.

97
JT
1.0
0
iSide !
I Reardoors doors
_trim
1,8
1.6
1.4
Mjlw1.2
1.0
.8
10
-lO
1.0
JEtrim 0
-i.0/
GLow-power tran-
sition with
reserve nose-
down control;
hid= o l_[]Transition
with constant
jet momentum;
hid = 0.15
oCrulse flight
out of ground
effect
I
O .2 .4 .6 .8 1.0 1.2 1.4 1.6
,/w/s
(c) Cross plots of figure 4(a) showing two variations of trim conditions
for transition flight.
Figure 18.- Concluded.
NASA-Langley, 1963 A-578