technical note - oecd.org - oecd climate change 2020 web.pdf · this technical note was prepared by...
TRANSCRIPT

2020 Projections of Climate Finance Towards the USD 100 Billion Goal Technical Note
Foreword
This work was undertaken in response to a request to provide analytical support to the preparation by developed countries of a roadmap for meeting the commitment of jointly mobilising USD 100 billion per year by 2020 for climate action in developing countries.
This technical note was prepared by staff members from the OECD Environment and Development Co-operation Directorates1 and aims to set out as transparently and rigorously as possible the methodology and assumptions underlying the projections of climate finance in 2020 presented here. It is published under the responsibility of the Secretary-General of the OECD. The opinions expressed and arguments employed herein do not necessarily reflect the official views of OECD member countries or the international organisations and other institutions referenced in this note. The authors are, however, grateful to the countries and institutions that have shared information to help interpret their climate finance pledges.
This document and any map included herein are without prejudice to the status of or sovereignty over any territory, to the delimitation of international frontiers and boundaries and to the name of any territory, city or area.
Please cite this publication as: OECD (2016), 2020 projections of Climate Finance towards the USD 100 billion goal: Technical Note, OECD Publishing
1. The main quantitative analysis was produced by Mariana Mirabile, Raphaël Jachnik and Simon Buckle from the Environment Directorate, with additional analytical input from Jennifer Calder and Lauren McNicoll. Jens Sedemund co-ordinated inputs from the Development Co-operation Directorate. This note further benefited from comments by OECD colleagues Julia Benn, Jan Corfee-Morlot and Nicolina Lamhauge (Development Co-operation), Jane Ellis (Environment) and Michael Gonter (Trade and Agriculture).

CONTENTS . 1
Contents1. Key results 2
2. Introduction 6
3. Projection of climate finance in 2020 9
3.1 Public climate finance 11
3.2 Export credits 22
3.3 Mobilised private finance 23
4. What if public finance, portfolios and/or private finance ratios change? 29
4.1 Analytical framework 30
4.2 Range of projected outcomes 31
5. Climate finance in the context of finance for development 34
5.1 Trends and implications 35
5.2 Insights from sectoral analysis 37
6. References 39

2 . 2020 PROJECTIONS OF CLIMATE FINANCE TOWARDS THE USD 100 BILLION GOAL
1. Key results
KEY RESULTS . 3
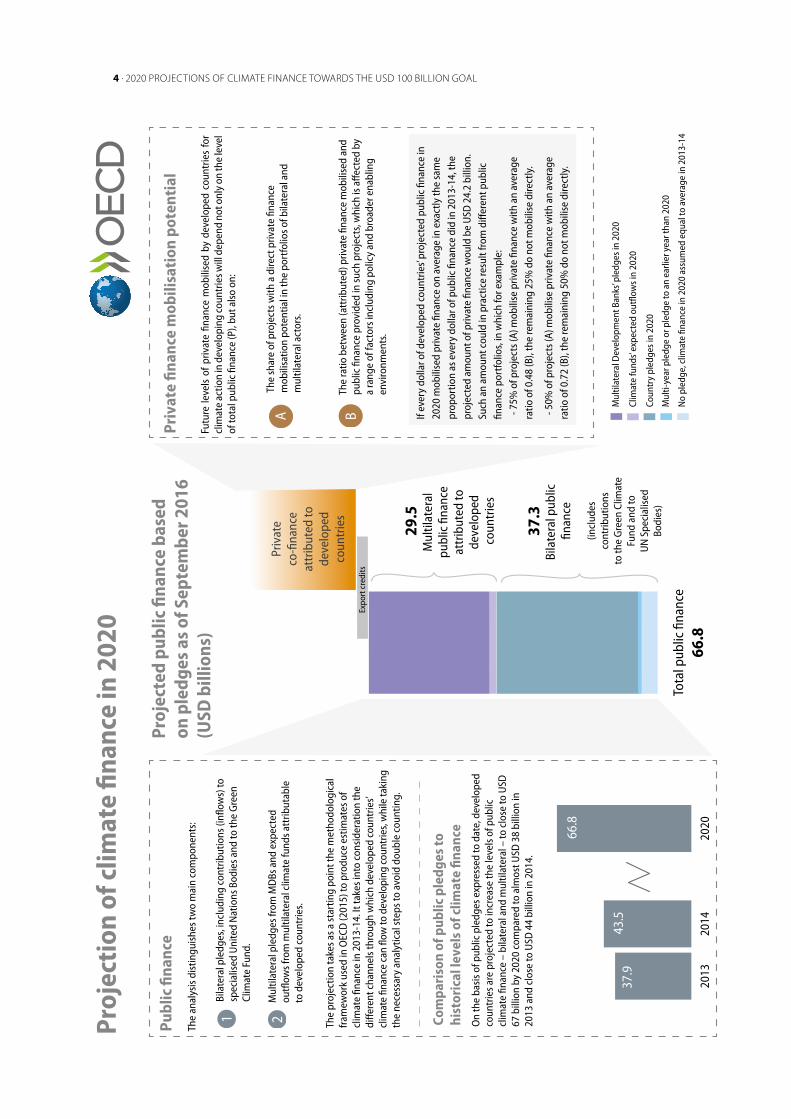
Developed countries committed to mobilise jointly USD 100 billion a year in climate finance by 2020 to address the needs of developing countries, in the context of meaningful mitigation actions and transparency on implementation (UNFCCC, 2009). “Climate finance in 2013-14 and the USD 100 billion goal” (OECD, 2015) provided estimates of progress towards this commitment. Several countries and multilateral development banks2 recently pledged to scale up the climate finance they provide in future. This note provides an analysis of what the current pledges3 imply about climate finance levels in 2020, conscious that any such projections are inherently uncertain, made at a specific point in time and incomplete in some respects. It also briefly discusses climate finance in the broader context of development finance and mainstreaming.
The methodology used here takes as a starting point the accounting framework set out in OECD (2015). The projection of developed countries’ public finance in 2020 is based on an analysis of pledges made so far by developed countries and multilateral institutions, as well as a number of assumptions detailed in the body of this note. On this basis, developed countries’ public finance in 2020 is projected to be close to USD 67 billion (approximately USD 37 billion of bilateral public finance and USD 30 billion of multilateral public finance attributable to these countries). In addition to the USD 67 billion, the projection includes the value of export credits4 at the average annual level observed in 2013-14 of USD 1.6 billion.
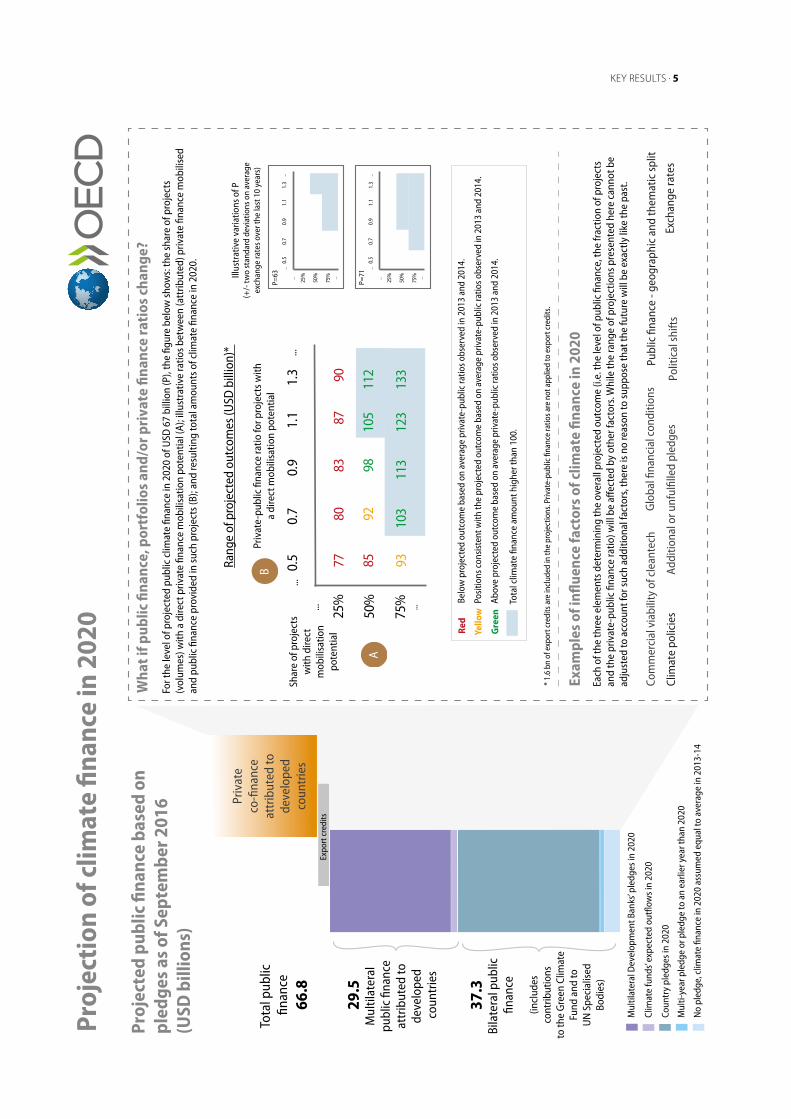
Mobilised private finance in 2020 cannot be projected with the same degree of confidence as public finance. Indeed, conceptually these two elements are of a very different nature. This note, therefore, provides a projected overall range for climate finance in 2020 that is driven by the level of public finance (P) but is conditional on the fraction of projects likely to mobilise private finance (A) as well as the corresponding private-public finance ratio (B). As an illustration, if half the public finance in 2020 mobilises private finance (A=0.5), meeting the USD 100 billion commitment would require the private-public ratio (B) to be 50 percent larger than if three quarters of the public finance (A=0.75) was devoted to such projects.
Each of these three elements (P, A and B) of the analytical framework will be affected by several other factors, such as exchange rates, the location of projects financed, and climate policies. As many of these factors are not determined at this time, there is currently insufficient information available to significantly narrow the range of future values of A and B. Historical private-public finance ratios based on estimates in OECD (2015) are, therefore, used to provide some insights.
Nevertheless, a key implication of this analysis is that, while a higher level of public finance always enhances developed countries’ ability to meet the USD 100 billion commitment, it does not guarantee a higher level of overall climate finance, which also depends on the portfolio of projects and the average private-public finance ratio.
2. http://www.worldbank.org/content/dam/Worldbank/document/Climate/Joint%20MDB%20Statement%20Climate_NOV%2028_final.pdf
3. The term “pledge” here is used to refer to any firm intention announced by countries and other relevant institutions.
4. Primarily related to renewable energy projects.
4 . 2020 PROJECTIONS OF CLIMATE FINANCE TOWARDS THE USD 100 BILLION GOAL
If ev
ery
dolla
r of d
evel
oped
cou
ntrie
s’ pr
ojec
ted
publ
ic fi
nanc
e in
20
20 m
obili
sed
priv
ate
finan
ce o
n av
erag
e in
exa
ctly
the
sam
e pr
opor
tion
as e
very
dol
lar o
f pub
lic fi
nanc
e di
d in
201
3-14
, the
pr
ojec
ted
amou
nt o
f priv
ate
finan
ce w
ould
be
USD
24.
2 bi
llion
. Su
ch a
n am
ount
cou
ld in
pra
ctic
e re
sult
from
diff
eren
t pub
lic
finan
ce p
ortf
olio
s, in
whi
ch fo
r exa
mpl
e: -
75%
of p
roje
cts (
A) m
obili
se p
rivat
e fin
ance
with
an
aver
age
ratio
of 0
.48
(B),
the
rem
aini
ng 2
5% d
o no
t mob
ilise
dire
ctly
.
- 5
0% o
f pro
ject
s (A)
mob
ilise
priv
ate
finan
ce w
ith a
n av
erag
e ra
tio o
f 0.7
2 (B
), th
e re
mai
ning
50%
do
not m
obili
se d
irect
ly.
A
Expo
rt c
redi
ts
Priv
ate
finan
ce m
obili
sati
on p
oten
tial
37.3
Bila
tera
l pub
lic
finan
ce
29.5
Mul
tilat
eral
pu
blic
fina
nce
attr
ibut
ed to
de
velo
ped
coun
trie
s
No
pled
ge, c
limat
e fin
ance
in 2
020
assu
med
equ
al to
ave
rage
in 2
013-
14
Coun
try
pled
ges i
n 20
20
Clim
ate
fund
s’ ex
pect
ed o
utflo
ws i
n 20
20
Mul
tilat
eral
Dev
elop
men
t Ban
ks’ p
ledg
es in
202
0
Mul
ti-ye
ar p
ledg
e or
ple
dge
to a
n ea
rlier
yea
r tha
n 20
20
(incl
udes
co
ntrib
utio
ns
to th
e G
reen
Clim
ate
Fund
and
to
UN
Spe
cial
ised
Bo
dies
)
Futu
re le
vels
of
priv
ate
finan
ce m
obili
sed
by d
evel
oped
cou
ntrie
s fo
r cl
imat
e ac
tion
in d
evel
opin
g co
untr
ies w
ill d
epen
d no
t onl
y on
the
leve
l of
tota
l pub
lic fi
nanc
e (P
), bu
t als
o on
:
The
shar
e of
pro
ject
s with
a d
irect
priv
ate
finan
ce
mob
ilisa
tion
pote
ntia
l in
the
port
folio
s of b
ilate
ral a
nd
mul
tilat
eral
act
ors.
The
ratio
bet
wee
n (a
ttrib
uted
) priv
ate
finan
ce m
obili
sed
and
publ
ic fi
nanc
e pr
ovid
ed in
such
pro
ject
s, w
hich
is a
ffect
ed b
y a
rang
e of
fact
ors i
nclu
ding
pol
icy
and
broa
der e
nabl
ing
envi
ronm
ents
.
B
Proj
ecte
d pu
blic
fina
nce
base
d on
ple
dges
as
of S
epte
mbe
r 201
6 (U
SD b
illio
ns)
Proj
ecti
on o
f clim
ate
finan
ce in
202
0
Publ
ic fi
nanc
e
Com
pari
son
of p
ublic
ple
dges
to
hist
oric
al le
vels
of c
limat
e fin
ance
The
anal
ysis
dis
tingu
ishe
s tw
o m
ain
com
pone
nts:
The
proj
ectio
n ta
kes a
s a st
artin
g po
int t
he m
etho
dolo
gica
l fr
amew
ork
used
in O
ECD
(201
5) to
pro
duce
est
imat
es o
f cl
imat
e fin
ance
in 2
013-
14. I
t tak
es in
to c
onsi
dera
tion
the
diffe
rent
cha
nnel
s thr
ough
whi
ch d
evel
oped
cou
ntrie
s’ cl
imat
e fin
ance
can
flow
to d
evel
opin
g co
untr
ies,
whi
le ta
king
th
e ne
cess
ary
anal
ytic
al st
eps t
o av
oid
doub
le c
ount
ing.
On
the
basi
s of p
ublic
ple
dges
exp
ress
ed to
dat
e, d
evel
oped
co
untr
ies a
re p
roje
cted
to in
crea
se th
e le
vels
of p
ublic
cl
imat
e fin
ance
– b
ilate
ral a
nd m
ultil
ater
al –
to c
lose
to U
SD
67 b
illio
n by
202
0 co
mpa
red
to a
lmos
t USD
38
billi
on in
20
13 a
nd c
lose
to U
SD 4
4 bi
llion
in 2
014.
Bila
tera
l ple
dges
, inc
ludi
ng c
ontr
ibut
ions
(infl
ows)
to
spec
ialis
ed U
nite
d N
atio
ns B
odie
s and
to th
e G
reen
Cl
imat
e Fu
nd.
Mul
tilat
eral
ple
dges
from
MD
Bs a
nd e
xpec
ted
outfl
ows f
rom
mul
tilat
eral
clim
ate
fund
s att
ribut
able
to
dev
elop
ed c
ount
ries.
21
Priv
ate
co-fi
nanc
e at
trib
uted
to
deve
lope
d co
untr
ies
2020
2014
2013
66.8
43.5
37.9
Tota
l pub
lic fi
nanc
e66
.8
A
B
Wha
t if p
ublic
fina
nce,
por
tfol
ios
and/
or p
riva
te fi
nanc
e ra
tios
cha
nge?
No
pled
ge, c
limat
e fin
ance
in 2
020
assu
med
equ
al to
ave
rage
in 2
013-
14
Coun
try
pled
ges i
n 20
20
Clim
ate
fund
s’ ex
pect
ed o
utflo
ws i
n 20
20
Mul
tilat
eral
Dev
elop
men
t Ban
ks’ p
ledg
es in
202
0
Mul
ti-ye
ar p
ledg
e or
ple
dge
to a
n ea
rlier
yea
r tha
n 20
20
37.3
Bila
tera
l pub
lic
finan
ce
29.5
Mul
tilat
eral
pu
blic
fina
nce
attr
ibut
ed to
de
velo
ped
coun
trie
s
(incl
udes
co
ntrib
utio
ns
to th
e G
reen
Clim
ate
Fund
and
to
UN
Spe
cial
ised
Bo
dies
)
Priv
ate-
publ
ic fi
nanc
e ra
tio fo
r pro
ject
s with
a
dire
ct m
obili
satio
n po
tent
ial
Illus
trat
ive
varia
tions
of P
(+
/- tw
o st
anda
rd d
evia
tions
on
aver
age
exch
ange
rate
s ove
r the
last
10
year
s)
Shar
e of
pro
ject
s w
ith d
irect
m
obili
satio
n po
tent
ial
For t
he le
vel o
f pro
ject
ed p
ublic
clim
ate
finan
ce in
202
0 of
USD
67
billi
on (P
), th
e fig
ure
belo
w sh
ows:
the
shar
e of
pro
ject
s (v
olum
es) w
ith a
dire
ct p
rivat
e fin
ance
mob
ilisa
tion
pote
ntia
l (A)
; illu
stra
tive
ratio
s bet
wee
n (a
ttrib
uted
) priv
ate
finan
ce m
obili
sed
and
publ
ic fi
nanc
e pr
ovid
ed in
such
pro
ject
s (B)
; and
resu
lting
tota
l am
ount
s of c
limat
e fin
ance
in 2
020.
Each
of t
he th
ree
elem
ents
det
erm
inin
g th
e ov
eral
l pro
ject
ed o
utco
me
(i.e.
the
leve
l of p
ublic
fina
nce,
the
frac
tion
of p
roje
cts
and
the
priv
ate-
publ
ic fi
nanc
e ra
tio) w
ill b
e aff
ecte
d by
oth
er fa
ctor
s. W
hile
the
rang
e of
pro
ject
ions
pre
sent
ed h
ere
cann
ot b
e ad
just
ed to
acc
ount
for s
uch
addi
tiona
l fac
tors
, the
re is
no
reas
on to
supp
ose
that
the
futu
re w
ill b
e ex
actly
like
the
past
.
* 1.
6 bn
of e
xpor
t cre
dits
are
incl
uded
in th
e pr
ojec
tions
. Priv
ate-
publ
ic fi
nanc
e ra
tios a
re n
ot a
pplie
d to
exp
ort c
redi
ts.
Tota
l clim
ate
finan
ce a
mou
nt h
ighe
r tha
n 10
0.
Belo
w p
roje
cted
out
com
e ba
sed
on a
vera
ge p
rivat
e-pu
blic
ratio
s obs
erve
d in
201
3 an
d 20
14.
Abov
e pr
ojec
ted
outc
ome
base
d on
ave
rage
priv
ate-
publ
ic ra
tios o
bser
ved
in 2
013
and
2014
.
Yello
w
Gre
en
Red
Rang
e of
pro
ject
ed o
utco
mes
(USD
bill
ion)
*
Proj
ecti
on o
f clim
ate
finan
ce in
202
0
Com
mer
cial
via
bilit
y of
cle
ante
chPu
blic
fina
nce
- geo
grap
hic
and
them
atic
split
Addi
tiona
l or u
nful
fille
d pl
edge
sCl
imat
e po
licie
s
Glo
bal fi
nanc
ial c
ondi
tions
Polit
ical
shift
s Ex
chan
ge ra
tes
Exam
ples
of i
nflue
nce
fact
ors
of c
limat
e fin
ance
in 2
020
Expo
rt c
redi
ts
Priv
ate
co-fi
nanc
e at
trib
uted
to
deve
lope
d co
untr
ies
......
......
25%
50%
75
%
0.5 77 85 93
0.7 80 92 103
0.9 83 98 113
1.1 87 105
123
1.3 90 112
133
......
......
25%
50
%
75%
0.5
0.7
0.9
1.1
1.3
P=63 ......
......
25%
50
%
75%
0.5
0.7
0.9
1.1
1.3
P=
71
Tota
l pub
lic
finan
ce66
.8
Proj
ecte
d pu
blic
fina
nce
base
d on
pl
edge
s as
of S
epte
mbe
r 201
6(U
SD b
illio
ns)
Posi
tions
con
sist
ent w
ith th
e pr
ojec
ted
outc
ome
base
d on
ave
rage
priv
ate-
publ
ic ra
tios o
bser
ved
in 2
013
and
2014
.
KEY RESULTS . 5

6 . 2020 PROJECTIONS OF CLIMATE FINANCE TOWARDS THE USD 100 BILLION GOAL
2. Introduction

INTRODUCTION . 7
At the 15th Conference of Parties (COP15) of the United Nations Framework Convention on Climate Change (UNFCCC) in 2009, developed countries committed to mobilise jointly USD 100 billion a year in climate finance by 2020 to address the needs of developing countries, in the context of meaningful mitigation actions and transparency on implementation (UNFCCC, 2009). This commitment has, since then, been a key element of the international climate negotiations. The text of the Copenhagen Accord specifies that this finance would come from a wide variety of sources, public and private, bilateral and multilateral, including alternative sources of finance. However, even as late as 2015 there was much confusion about what exactly constituted mobilised climate finance and the levels of such flows, despite the significant progress made on the underpinning definitional and methodological issues by a number of different institutions, including the UNFCCC Standing Committee on Finance in its first Biennial Assessment (UNFCCC SCF, 2014) and its forthcoming second Biennial Assessment to be released ahead of COP22 in Marrakech in November 2016.
The importance of having greater clarity on the progress developed countries had made against this commitment was seen by the (then current) Peruvian and incoming French COP Presidencies as a potentially critical factor for improving trust between Parties ahead of the COP21 negotiations. The two COP Presidencies, therefore, asked the OECD to provide an updated estimate of climate finance flows as an input to a ministerial meeting on climate finance in Lima in October 2015.
The OECD undertook this previous work in collaboration with Climate Policy Initiative (CPI) and published the results in the OECD report “Climate Finance in 2013-14 and the USD 100 billion goal” (OECD, 2015). That report provided a preliminary aggregate estimate of public and mobilised private climate finance flows in those years. Public and private finance mobilised by developed countries for climate action in developing countries reached USD 62 billion in 2014 compared to USD 52 billion in 2013.5
The underlying data for these estimates were specially provided by developed countries and by the relevant financial institutions, including major multilateral development banks and key climate funds. The data provided by developed countries were their preliminary estimates of what they would themselves subsequently report officially under the UNFCCC in January 2016 in their Biennial Reports. Similarly, the data provided by the major multilateral development banks were based on their own established definitions of what counted as climate finance. The major contribution of OECD (2015) was to provide the rigorous and consistent analysis of these data to ensure that the risks of any double counting were minimised and that the amounts were adjusted to ensure that developed countries could only claim their share of multilateral public flows and associated mobilised private finance.
In the run-up to and at COP21 in Paris, a number of developed countries and multilateral institutions made significant climate finance pledges, as acknowledged in the COP21 Decision relating to long-term finance (5/CP.21). Further, Decision 1/CP.21 accompanying the Paris Agreement “strongly urges developed country Parties to scale up their level of financial support, with a concrete roadmap to achieve the commitment of jointly providing USD 100 billion annually by 2020 for mitigation and adaptation while significantly increasing adaptation finance from current levels” (UNFCCC, 2015). The Paris Decision made clear that developed countries intended to continue their existing collective mobilisation commitment through to 2025, with a new collective quantified goal to be agreed prior to 2025, taking into account the needs and priorities of developing countries.
Against this background, the OECD was asked to provide analytical support to the preparation by developed countries of a concrete roadmap for meeting the commitment of mobilising USD 100 billion per year by 2020. The intention of this note is, therefore, to provide an analysis of the scale of future climate finance
5. These aggregate estimates of climate finance, as well as those projected volumes in 2020 referred to in this note, do not include finance related to coal projects. However, Japan and Australia consider that financing for high efficiency coal plants should also be considered as a form of climate finance. In addition to the figures in the OECD (2015) report, Japan provided US$3.2 billion for such projects in 2013‑14. The coal‑related volumes in Japan’s 2020 pledge are here assumed by the OECD to represent the same percentage as in 2013‑14, and this value is subtracted from the overall pledge in the projections detailed in this note.

and identify and discuss some key uncertainties. It sets out the resulting OECD projections for climate finance in 2020 along with the underlying assumptions and methodologies used to construct them, based on the recent climate finance pledges made by developed countries and relevant institutions. The analytical and accounting framework underpinning the projections is consistent with that used for the 2013-14 estimates (OECD, 2015) as well as the common understanding of the scope of mobilised climate finance that was adopted by a large group of developed countries ahead of COP21 (TWG, 2015).
The note further explores how achieving the USD 100 billion a year commitment depends on three key factors: the level of public finance in 2020; the way in which it is allocated between projects aimed at mobilising private climate finance and those which do not; and the private-public ratio with which public finance is able to mobilise private climate finance. Rather than trying to identify a single number for climate finance in 2020, this note, therefore, sets out a scenario-based approach that yields a range of projected outcomes conditional on these key factors.
8 . 2020 PROJECTIONS OF CLIMATE FINANCE TOWARDS THE USD 100 BILLION GOAL

ACKNOWLEDGMENTS . 9
3. Projection of climate finance in 2020
10 . 2020 PROJECTIONS OF CLIMATE FINANCE TOWARDS THE USD 100 BILLION GOAL
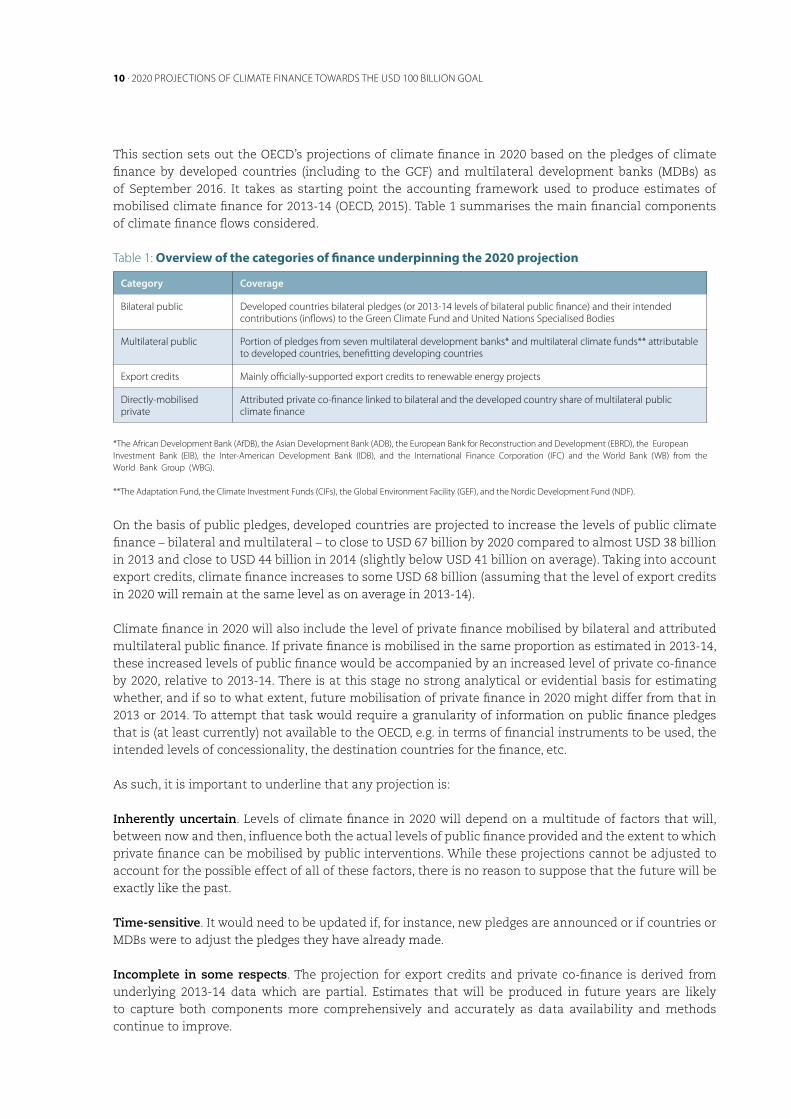
This section sets out the OECD’s projections of climate finance in 2020 based on the pledges of climate finance by developed countries (including to the GCF) and multilateral development banks (MDBs) as of September 2016. It takes as starting point the accounting framework used to produce estimates of mobilised climate finance for 2013-14 (OECD, 2015). Table 1 summarises the main financial components of climate finance flows considered.
Table 1: Overview of the categories of finance underpinning the 2020 projection
Category Coverage
Bilateral public Developed countries bilateral pledges (or 2013‑14 levels of bilateral public finance) and their intended contributions (inflows) to the Green Climate Fund and United Nations Specialised Bodies
Multilateral public Portion of pledges from seven multilateral development banks* and multilateral climate funds** attributable to developed countries, benefitting developing countries
Export credits Mainly officially‑supported export credits to renewable energy projects
Directly‑mobilised private
Attributed private co‑finance linked to bilateral and the developed country share of multilateral public climate finance
*The African Development Bank (AfDB), the Asian Development Bank (ADB), the European Bank for Reconstruction and Development (EBRD), the European Investment Bank (EIB), the Inter‑American Development Bank (IDB), and the International Finance Corporation (IFC) and the World Bank (WB) from the World Bank Group (WBG).
**The Adaptation Fund, the Climate Investment Funds (CIFs), the Global Environment Facility (GEF), and the Nordic Development Fund (NDF).
On the basis of public pledges, developed countries are projected to increase the levels of public climate finance – bilateral and multilateral – to close to USD 67 billion by 2020 compared to almost USD 38 billion in 2013 and close to USD 44 billion in 2014 (slightly below USD 41 billion on average). Taking into account export credits, climate finance increases to some USD 68 billion (assuming that the level of export credits in 2020 will remain at the same level as on average in 2013-14).
Climate finance in 2020 will also include the level of private finance mobilised by bilateral and attributed multilateral public finance. If private finance is mobilised in the same proportion as estimated in 2013-14, these increased levels of public finance would be accompanied by an increased level of private co-finance by 2020, relative to 2013-14. There is at this stage no strong analytical or evidential basis for estimating whether, and if so to what extent, future mobilisation of private finance in 2020 might differ from that in 2013 or 2014. To attempt that task would require a granularity of information on public finance pledges that is (at least currently) not available to the OECD, e.g. in terms of financial instruments to be used, the intended levels of concessionality, the destination countries for the finance, etc.
As such, it is important to underline that any projection is:
Inherently uncertain. Levels of climate finance in 2020 will depend on a multitude of factors that will, between now and then, influence both the actual levels of public finance provided and the extent to which private finance can be mobilised by public interventions. While these projections cannot be adjusted to account for the possible effect of all of these factors, there is no reason to suppose that the future will be exactly like the past.
Time-sensitive. It would need to be updated if, for instance, new pledges are announced or if countries or MDBs were to adjust the pledges they have already made.
Incomplete in some respects. The projection for export credits and private co-finance is derived from underlying 2013-14 data which are partial. Estimates that will be produced in future years are likely to capture both components more comprehensively and accurately as data availability and methods continue to improve.
PROJECTION OF CLIMATE FINANCE IN 2020 . 11
Rather than a single absolute number, these informational gaps and uncertainties require a scenario-based approach. A framework for such an approach and the resulting range of possible outcomes is presented in Section 4. The following sub-sections first describe the different components of the projection of climate finance in 2020 in further detail, along with the underlying methodological assumptions made.
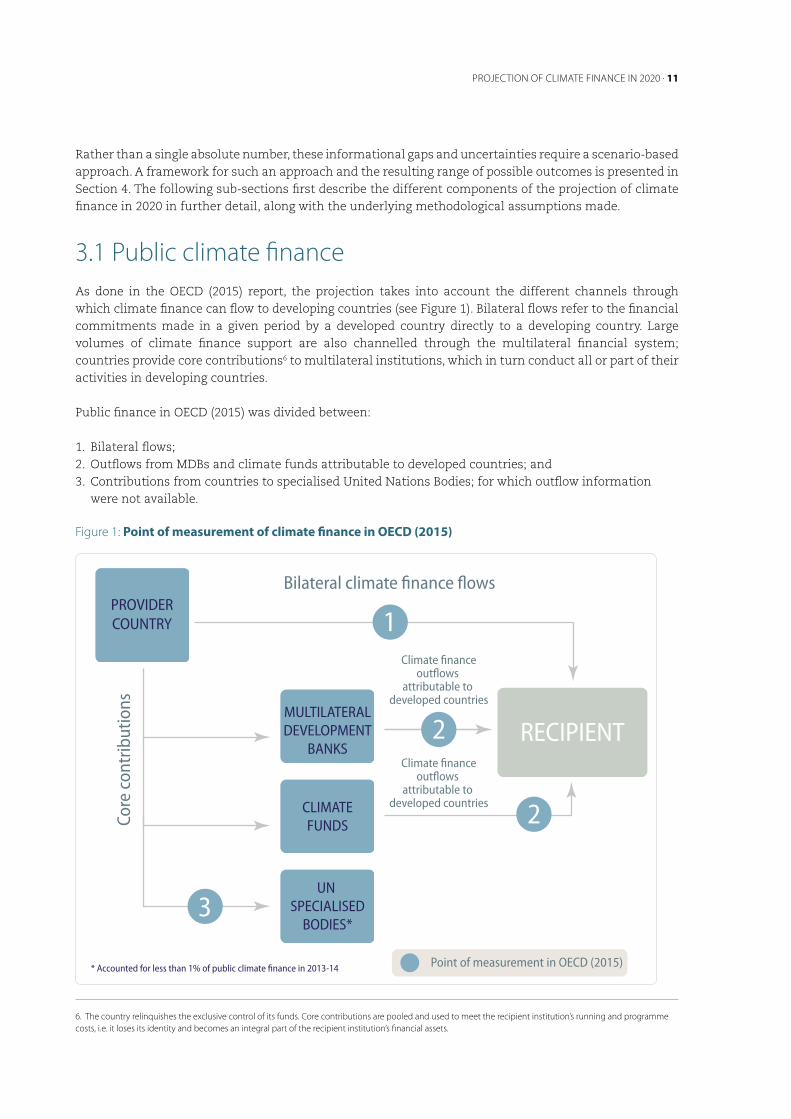
3.1 Public climate financeAs done in the OECD (2015) report, the projection takes into account the different channels through which climate finance can flow to developing countries (see Figure 1). Bilateral flows refer to the financial commitments made in a given period by a developed country directly to a developing country. Large volumes of climate finance support are also channelled through the multilateral financial system; countries provide core contributions6 to multilateral institutions, which in turn conduct all or part of their activities in developing countries.
Public finance in OECD (2015) was divided between:
1. Bilateral flows;2. Outflows from MDBs and climate funds attributable to developed countries; and3. Contributions from countries to specialised United Nations Bodies; for which outflow information
were not available.
Figure 1: Point of measurement of climate finance in OECD (2015)
6. The country relinquishes the exclusive control of its funds. Core contributions are pooled and used to meet the recipient institution’s running and programme costs, i.e. it loses its identity and becomes an integral part of the recipient institution’s financial assets.
RECIPIENTMULTILATERALDEVELOPMENT
BANKS
CLIMATEFUNDS
UN SPECIALISED
BODIES*
PROVIDERCOUNTRY
Core
con
trib
utio
ns
Bilateral climate finance flows
Point of measurement in OECD (2015)
1
3
2
2
* Accounted for less than 1% of public climate finance in 2013-14
Climate financeoutflows
attributable to developed countries
Climate financeoutflows
attributable to developed countries

12 . 2020 PROJECTIONS OF CLIMATE FINANCE TOWARDS THE USD 100 BILLION GOAL
GCF contributions were not included in OECD (2015) as, when the report was prepared, there had been no disbursements from countries to the Fund7. The substantial forward looking pledges made by developed countries to provide funds to the GCF over the coming years need to be considered in the context of the present projection.
For the purposes of this projection, and given constraints in terms of the granularity of information available, climate finance pledges made by countries and multilateral institutions are grouped into the following two categories (Figure 2):
1. Bilateral pledges, including contributions (inflows) to specialised United Nations Bodies and to the GCF;2. Multilateral pledges from MDBs and expected outflows from multilateral climate funds attributable to
developed countries.
Figure 2: Point of measurement of climate finance for 2020 projections
The methodological steps and the information used under these categories are explained in sub-sections 3.1.1 to 3.1.3.
7. OECD (2015) was based on disbursements for inflows to multilateral institutions rather than on pledges.
RECIPIENTMULTILATERALDEVELOPMENT
BANKS
CLIMATEFUNDS
UN SPECIALISED
BODIES
GREENCLIMATE
FUND
PROVIDER COUNTRY
Core
con
trib
utio
ns
Climate financeoutflows
attributable to developed countries
Bilateral climate finance flows
Point of measurement in projection
1
1
1
2
2
PROJECTION OF CLIMATE FINANCE IN 2020 . 13
3.1.1 Assumptions and methodology
The projection of public climate finance in 2020 is based on the following general assumptions:
1. Developed countries’ bilateral pledges refer to resources invested in or benefitting developing countries8. This analysis does not consider the possibility of countries transitioning out of the developing country category;
2. For multilateral institutions, the share of resources allocated to developing countries is assumed to be in 2020 equal to the share of resources allocated to such countries on average in 2013-14;
3. The structure and shareholding of multilateral institutions are assumed constant in 2020 compared to 2013-4 (or to the latest replenishment cycle) since it is difficult to foresee how the shareholding of multilateral institutions might evolve between now and 2020;
4. Except for the GCF, the in-country and international architecture of actors of climate finance is assumed constant compared to 2013-14. There is no consideration of the possibility of new bilateral development finance institutions being created or of the potential role of the recently-created Asian Infrastructure Investment Bank (AIIB);
5. Pledges are all assumed to be in nominal values, like the USD 100 billion commitment;
6. The 2013-4 annual average exchange rate from the OECD Development Assistance Committee (DAC) Creditor Reporting System (CRS) is used to ensure comparability with results from OECD (2015).9
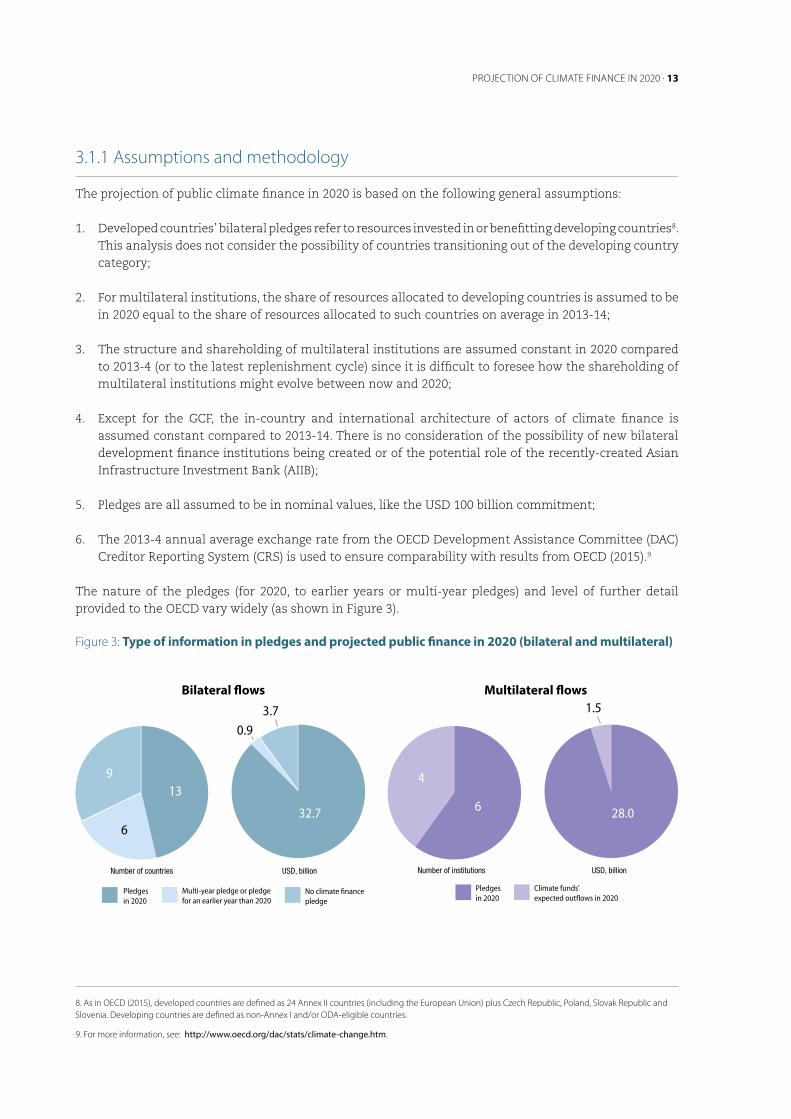
The nature of the pledges (for 2020, to earlier years or multi-year pledges) and level of further detail provided to the OECD vary widely (as shown in Figure 3).
Figure 3: Type of information in pledges and projected public finance in 2020 (bilateral and multilateral)
8. As in OECD (2015), developed countries are defined as 24 Annex II countries (including the European Union) plus Czech Republic, Poland, Slovak Republic and Slovenia. Developing countries are defined as non‑Annex I and/or ODA‑eligible countries.
9. For more information, see: http://www.oecd.org/dac/stats/climate-change.htm.
Multilateral flows
Bilateral flows
Number of countries USD, billion
13
32.7
3.70.9
6
9
No climate financepledge
Multi-year pledge or pledge for an earlier year than 2020
Pledges in 2020
Number of institutions USD, billion
6 28.0
1.5
4
Climate funds’ expected outflows in 2020
Pledges in 2020
PIE ON NB OF COUNTRIES CHANGED
Bilateral flows Multilateral flows
14 . 2020 PROJECTIONS OF CLIMATE FINANCE TOWARDS THE USD 100 BILLION GOAL
Further assumptions were, therefore, required to translate these pledges into a projected annual volume in 2020:
7. Where available, the value of the annual pledge for 2020 was used.
8. For countries or institutions having provided pledges up to 2019 or to earlier years, climate finance in 2020 is assumed to be equal to the pledge in the year closest to 2020.
9. For countries or institutions having provided multi-year pledges, the multi-year total is divided by the number of years the pledge refers to, thus implying an equal distribution of finance throughout the years.
10. For countries and institutions that have not made official climate finance pledges, finance in 2020 is assumed equal to the level of climate finance provided on average in 2013-14. This comprises nine countries whose climate finance in aggregate was estimated at USD 3.7 billion in 2013-14.
11. For countries that included export credits and/or mobilised private finance in their pledge, 2013-14 data were used as a basis for separating the share of public climate finance from the total pledge.
Over 90% of the projection of public climate finance to 2020 is based on the countries or institutions that made 2020 pledges (item 7 above). The following sub-sections describe the methodological steps followed to ensure a projection of public climate finance in 2020.
3.1.2 Projection of bilateral finance (including inflows to the GCF and Specialised United Nations Bodies)
Where pledges detailing future climate-related outflows for multilateral institutions are available, outflows attributable to developed countries are used in the projection rather than inflows (see Figure 1 and 2). Thus, whenever country pledges include contributions to a multilateral institution for which information on future outflows is available, a risk of double-counting between core contributions (from countries to multilateral institutions) and multilateral outflows arises. To avoid such double counting, future bilateral inflows to those multilateral institutions whose future outflows are counted need to be subtracted from the country pledges.
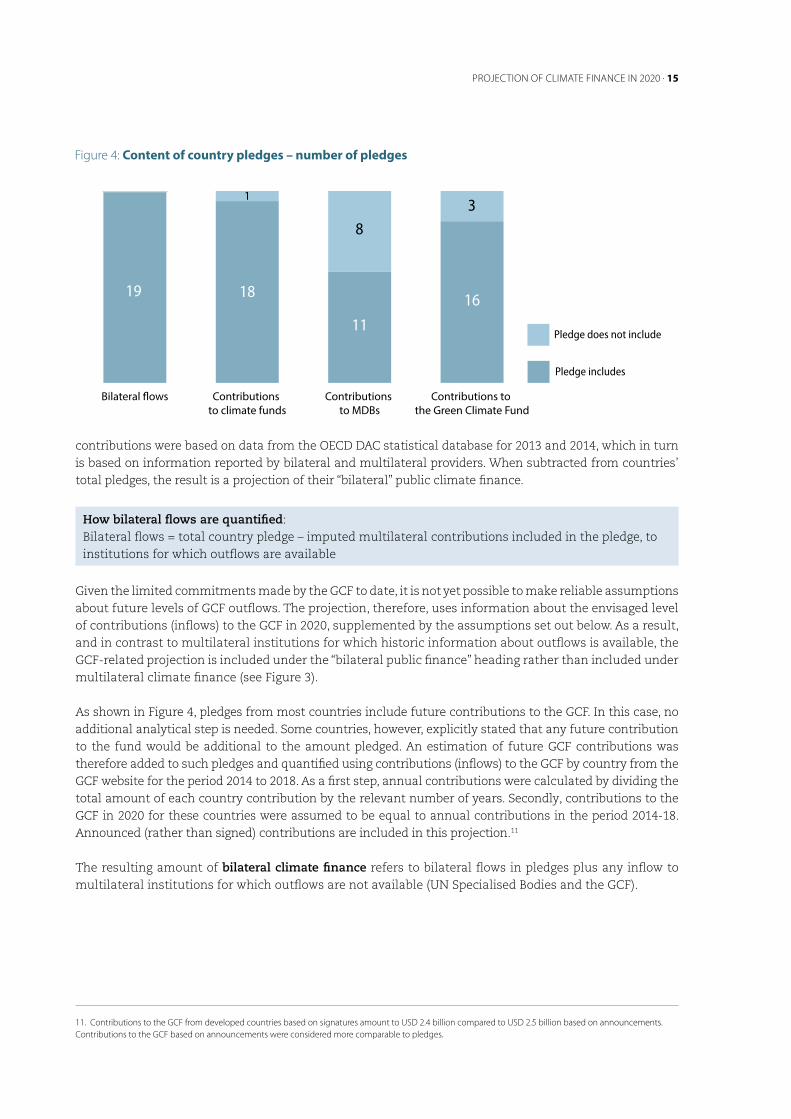
The content of the country pledges varies significantly in coverage (see Figure 4). In addition to pure bilateral flows, many pledges include contributions to climate funds, to MDBs and/or to the GCF. Clarifications on the content of pledges were sought from individual countries on a case-by-case basis, as necessary.
At this stage, however, countries know neither the share of their pledge that will be allocated to multilateral institutions in general, nor to which institutions they will provide funds. An additional assumption is therefore needed; namely that countries are assumed to disburse the same amounts (core contributions) to the same multilateral institutions in 2020 as they did on average in 2013-14.
Moreover, core contributions from countries to multilateral institutions are typically not climate-specific. So-called “climate-related imputed multilateral contributions” to multilateral institutions10 were therefore used as a proxy for separating out the climate share of core contributions in 2020. These imputed multilateral
10. Climate‑related imputed multilateral contributions are an estimation of the share of the core contributions to multi‑purpose organisations that is used for climate‑related activities. It is a two‑step estimation. First, the proportion of the activities undertaken by the multilateral organisation that aim to address climate change is calculated. Second, this proportion is applied to the country’s core contributions, to estimate the climate‑related share of their core contributions.
PROJECTION OF CLIMATE FINANCE IN 2020 . 15
contributions were based on data from the OECD DAC statistical database for 2013 and 2014, which in turn is based on information reported by bilateral and multilateral providers. When subtracted from countries’ total pledges, the result is a projection of their “bilateral” public climate finance.
How bilateral flows are quantified:Bilateral flows = total country pledge – imputed multilateral contributions included in the pledge, to institutions for which outflows are available
Given the limited commitments made by the GCF to date, it is not yet possible to make reliable assumptions about future levels of GCF outflows. The projection, therefore, uses information about the envisaged level of contributions (inflows) to the GCF in 2020, supplemented by the assumptions set out below. As a result, and in contrast to multilateral institutions for which historic information about outflows is available, the GCF-related projection is included under the “bilateral public finance” heading rather than included under multilateral climate finance (see Figure 3).
As shown in Figure 4, pledges from most countries include future contributions to the GCF. In this case, no additional analytical step is needed. Some countries, however, explicitly stated that any future contribution to the fund would be additional to the amount pledged. An estimation of future GCF contributions was therefore added to such pledges and quantified using contributions (inflows) to the GCF by country from the GCF website for the period 2014 to 2018. As a first step, annual contributions were calculated by dividing the total amount of each country contribution by the relevant number of years. Secondly, contributions to the GCF in 2020 for these countries were assumed to be equal to annual contributions in the period 2014-18. Announced (rather than signed) contributions are included in this projection.11
The resulting amount of bilateral climate finance refers to bilateral flows in pledges plus any inflow to multilateral institutions for which outflows are not available (UN Specialised Bodies and the GCF).
11. Contributions to the GCF from developed countries based on signatures amount to USD 2.4 billion compared to USD 2.5 billion based on announcements. Contributions to the GCF based on announcements were considered more comparable to pledges.
19
Contributions to the Green Climate Fund
Contributions to MDBs
Contributions to climate funds
Bilateral �ows
11
83
1618
1
Pledge includes
Pledge does not include
Figure 4: Content of country pledges – number of pledges
16 . 2020 PROJECTIONS OF CLIMATE FINANCE TOWARDS THE USD 100 BILLION GOAL
3.1.3 Projection of multilateral finance (based on outflows)
Pledges made by MDBs vary in content and in the way the pledges are expressed. Assumptions are thus needed to estimate comparable pledges.
Missing informationFor multilateral institutions whose pledges are expressed as a share of climate finance in total outflows with no indication on the level of outflows in 2020, total outflows in 2020 are assumed to be equal to the outflows on average in 2013-14. This is the case for two MDBs, whose combined multilateral public finance to developing countries12 and attributed to developed countries amounted to USD 9.5 billion on average in 2013-14 compared to total attributed multilateral public finance in the same period of USD 17.6 billion.
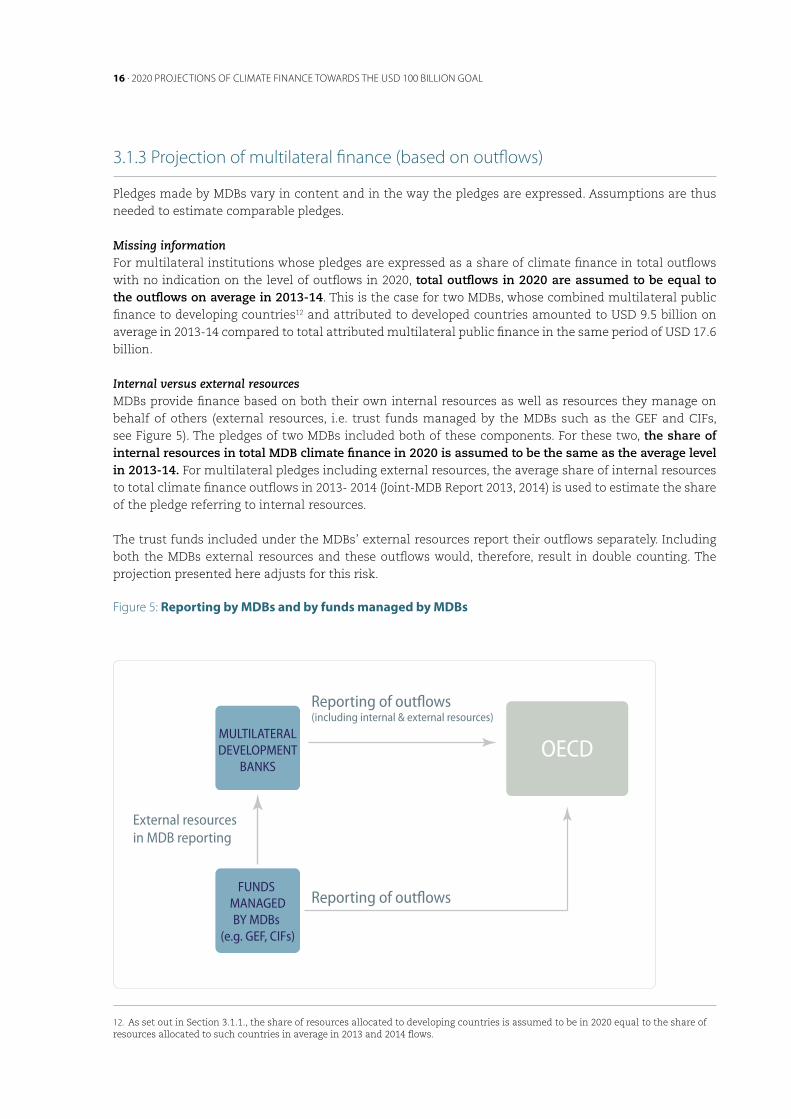
Internal versus external resourcesMDBs provide finance based on both their own internal resources as well as resources they manage on behalf of others (external resources, i.e. trust funds managed by the MDBs such as the GEF and CIFs, see Figure 5). The pledges of two MDBs included both of these components. For these two, the share of internal resources in total MDB climate finance in 2020 is assumed to be the same as the average level in 2013-14. For multilateral pledges including external resources, the average share of internal resources to total climate finance outflows in 2013- 2014 (Joint-MDB Report 2013, 2014) is used to estimate the share of the pledge referring to internal resources.
The trust funds included under the MDBs’ external resources report their outflows separately. Including both the MDBs external resources and these outflows would, therefore, result in double counting. The projection presented here adjusts for this risk.
Figure 5: Reporting by MDBs and by funds managed by MDBs
12. As set out in Section 3.1.1., the share of resources allocated to developing countries is assumed to be in 2020 equal to the share of resources allocated to such countries in average in 2013 and 2014 flows.
OECDMULTILATERALDEVELOPMENT
BANKS
Reporting of outflowsFUNDS
MANAGEDBY MDBs
(e.g. GEF, CIFs)
External resources in MDB reporting
Reporting of outflows(including internal & external resources)
PROJECTION OF CLIMATE FINANCE IN 2020 . 17
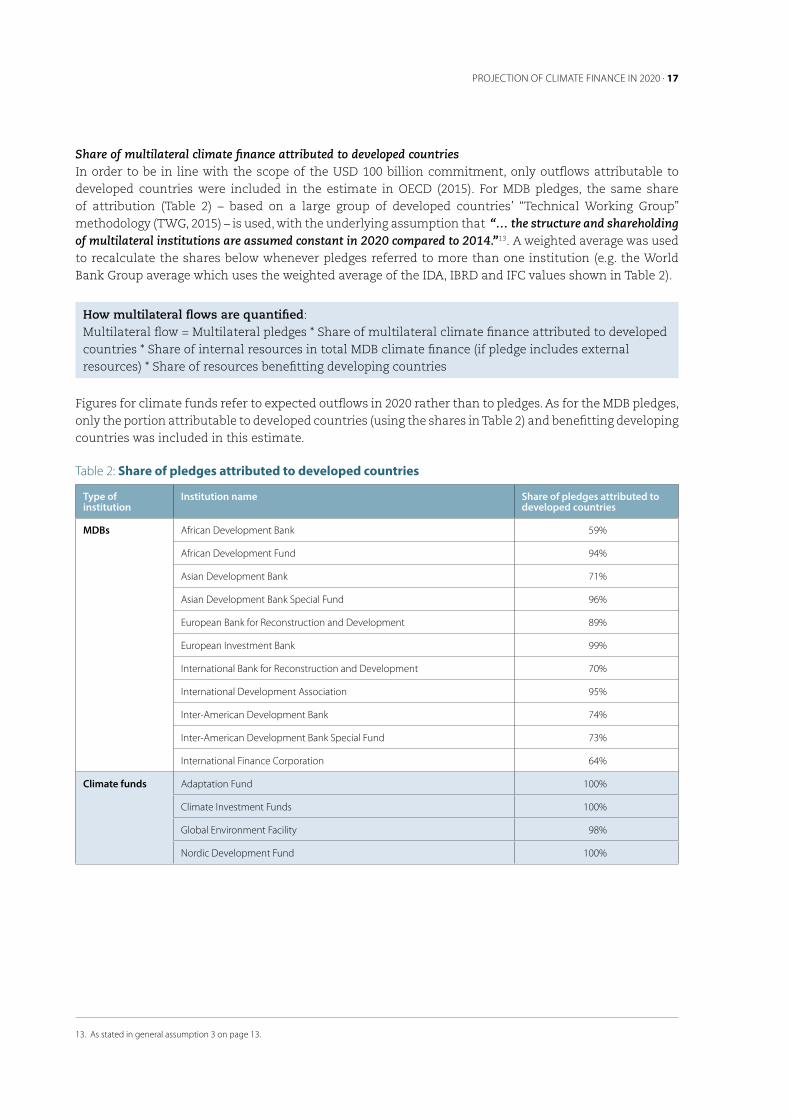
Share of multilateral climate finance attributed to developed countriesIn order to be in line with the scope of the USD 100 billion commitment, only outflows attributable to developed countries were included in the estimate in OECD (2015). For MDB pledges, the same share of attribution (Table 2) – based on a large group of developed countries’ “Technical Working Group” methodology (TWG, 2015) – is used, with the underlying assumption that “… the structure and shareholding of multilateral institutions are assumed constant in 2020 compared to 2014.”13. A weighted average was used to recalculate the shares below whenever pledges referred to more than one institution (e.g. the World Bank Group average which uses the weighted average of the IDA, IBRD and IFC values shown in Table 2).
How multilateral flows are quantified:Multilateral flow = Multilateral pledges * Share of multilateral climate finance attributed to developed countries * Share of internal resources in total MDB climate finance (if pledge includes external resources) * Share of resources benefitting developing countries
Figures for climate funds refer to expected outflows in 2020 rather than to pledges. As for the MDB pledges, only the portion attributable to developed countries (using the shares in Table 2) and benefitting developing countries was included in this estimate.
Table 2: Share of pledges attributed to developed countries
Type of institution
Institution name Share of pledges attributed to developed countries
MDBs African Development Bank 59%
African Development Fund 94%
Asian Development Bank 71%
Asian Development Bank Special Fund 96%
European Bank for Reconstruction and Development 89%
European Investment Bank 99%
International Bank for Reconstruction and Development 70%
International Development Association 95%
Inter‑American Development Bank 74%
Inter‑American Development Bank Special Fund 73%
International Finance Corporation 64%
Climate funds Adaptation Fund 100%
Climate Investment Funds 100%
Global Environment Facility 98%
Nordic Development Fund 100%
13. As stated in general assumption 3 on page 13.

18 . 2020 PROJECTIONS OF CLIMATE FINANCE TOWARDS THE USD 100 BILLION GOAL
3.1.4 Discussion of further factors that could affect the public finance projection
There are a multitude of factors that will influence the actual volumes of public climate finance in 2020 compared to the projected amounts presented here on the basis of announced pledges. Some relate to the demand (e.g. the project pipeline), domestic policy settings and enabling environments in developing countries, although such factors may have an even greater impact on the ability to mobilise private investment, as discussed in Section 3.3.2. There are, however a number of specific “supply side” factors that can impact future levels of public climate finance, two of which are briefly discussed below.
The architecture of international climate finance is evolving. New actors are emerging on the scene, most notably the GCF and the AIIB, which has a number of developed country founding members. As the GCF becomes more fully operational and to the extent that the AIIB becomes a major provider of climate finance, this could impact significantly on the projections of future climate finance set out in this note. While some account has been made for the future activities of the GCF (although only on the basis of developed country inflows to the GCF, not future outflows from the GCF), the potential contribution that the AIIB might make to climate finance flows in 2020 has not been included in these projections. Further, in the time period considered, some developed countries are considering the creation of new bilateral development finance institutions, or might restructure or consolidate existing ones. This would likely have an effect on both the respective shares of bilateral and multilateral public finance channels, as well as the ability of these countries and their DFIs to mobilise additional funds and thereafter commit such finance to projects in developing countries. Similarly, there may be changes in the way MDBs are structured, raise or channel development finance, which in turn could influence future flows. For example, the Asian Development Bank is merging the balance sheets of its concessional and non-concessional windows (effective as of January 2017) as a means to significantly increase its overall lending capacity.
Another source of uncertainty relates to the domestic political, economic and budgetary context in developed countries in relation to forward looking pledges. Without questioning in any way the commitment of developed countries to fulfil the pledges they have made, it remains possible that some will adjust their pledges.
3.1.5 Sensitivity analyses
This section highlights the sensitivity of the results presented above under alternative methodological choices. It also includes a further sensitivity analysis that underlines the impact that exchange rate variations may have on the level of climate finance reported in 2020.
3.1.5.1 Alternative baseline year for missing pledges
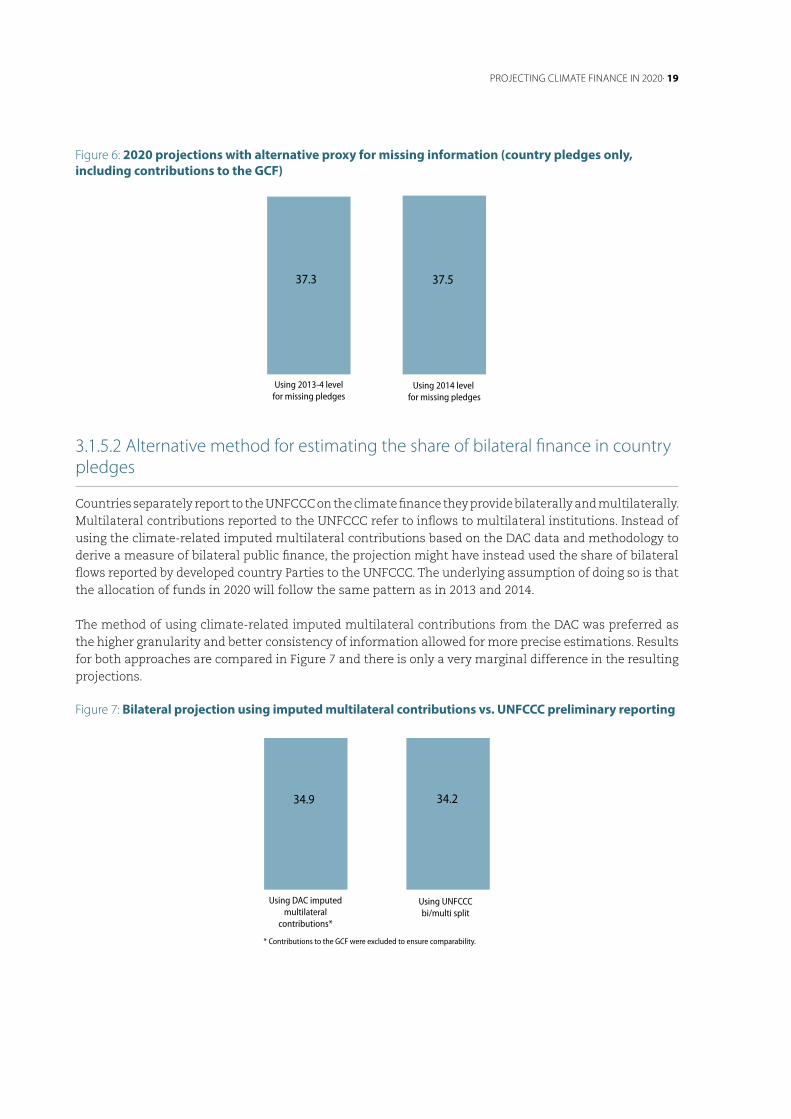
For countries and institutions not having made official pledges, or not having provided information on their pledge or the expected levels of outflows, finance in 2020 was assumed to be equal to the climate finance they provided on average in 2013 and 2014. The two-year average was preferred as a proxy for missing information in order to smooth fluctuations from large multi-year commitments programmed in a given year. The most recent data point available – 2014 flows – is an alternative proxy. Figure 6 compares the resulting 2020 projection using as a proxy the average climate finance in 2013 and 2014 versus a projection using 2014 flows. The resulting projection for country pledges appears not to be significantly affected by the choice of proxy year.
PROJECTING CLIMATE FINANCE IN 2020. 19
Figure 6: 2020 projections with alternative proxy for missing information (country pledges only, including contributions to the GCF)
3.1.5.2 Alternative method for estimating the share of bilateral finance in country pledges
Countries separately report to the UNFCCC on the climate finance they provide bilaterally and multilaterally. Multilateral contributions reported to the UNFCCC refer to inflows to multilateral institutions. Instead of using the climate-related imputed multilateral contributions based on the DAC data and methodology to derive a measure of bilateral public finance, the projection might have instead used the share of bilateral flows reported by developed country Parties to the UNFCCC. The underlying assumption of doing so is that the allocation of funds in 2020 will follow the same pattern as in 2013 and 2014.
The method of using climate-related imputed multilateral contributions from the DAC was preferred as the higher granularity and better consistency of information allowed for more precise estimations. Results for both approaches are compared in Figure 7 and there is only a very marginal difference in the resulting projections.
Figure 7: Bilateral projection using imputed multilateral contributions vs. UNFCCC preliminary reporting
37.3 37.5
21.4(73%)
7.2(24%)
0.9(3%)
Using 2013-4 levelfor missing pledges
Using 2014 level for missing pledges
Cross-cuttingAdaptation onlyMitigation only
23.5(63%)
8.5(23%)
5.4(14%)
* Includes inflows to the Green Climate Fund.
Figures refer to USD billions.
Bilateral flows* Multilateral flows
Figures refer to the number of countries having provided information on pledges.
34.9 34.2
Contributions to the Green Climate Fund
Contributions to MDBs
Contributions to climate funds
Bilateral �ows
19
11
83
1618
1
Pledge includes Pledge does not include
* Contributions to the GCF were excluded to ensure comparability.
Using DAC imputed multilateral
contributions*
Using UNFCCC bi/multi split
CHANGED

20 . 2020 PROJECTIONS OF CLIMATE FINANCE TOWARDS THE USD 100 BILLION GOAL
3.1.5.3 Exchange rate fluctuations
In the 2020 projection described in Section 3.1.1, 3.1.2 and 3.1.3, the same exchange rate as in the OECD (2015) report was used, so as to ensure that changes in volumes between 2013-14 and 2020 did not relate to exchange rate fluctuations. Pledges were reported in different currencies – so too is climate finance to the UNFCCC – and thus the aggregated climate finance figures are affected by the exchange rate used to convert the amounts reported by countries into US Dollars.
The future exchange rates that will be used to estimate climate finance in 2020 are not yet known. As an illustration of the effect exchange rate fluctuations may have on actual climate finance in 2020, Figure 8 presents the impact of exchange rate fluctuations in the last 10 years (2006-15) on the projection. To do so, the standard deviation of the average exchange rates over that period of time is used as a basis.14 It is clear from Figure 8 that exchange rates can make a very significant difference to the amounts of climate finance reported in connection with the USD 100 billion commitment.
Figure 8: 2020 projections of total public finance with alternative exchange rates
3.1.6 Thematic split
The pledges of eleven countries and two multilateral finance institutions mention mitigation and adaptation as categories of climate finance. None refer to finance targeting both activities (“cross-cutting”), as a third category, which was a significant proportion (14 percent) of bilateral public finance on average in 2013-14 (OECD, 2015)15. Only six of these pledges (four countries and the two MDBs) include a clear target in terms of either thematic allocation between mitigation and adaptation or a quantified objective for adaptation specifically. The remaining seven pledges only mention an intended, and as such tentative, increased funding of adaptation.
As a result, there is currently limited tangible and quantified information available to inform a comprehensive projection of the thematic allocation of bilateral and multilateral public finance in 2020. Except for those aforementioned six pledges that do include a clear thematic target and for inflows to the GCF (see below), the 2020 projection is based on the assumption that the respective shares of mitigation, adaptation and cross-cutting remain the same for each country and institution in 2020 as in 2013-14 on average16. The GCF aims for
14. The standard deviation was calculated for each currency and weighted by the share of the total pledges having been reported in such currency. An underlying assumption is that climate finance will be reported in 2020 in the same currencies and same proportion as the pledges.
15. It was a much smaller proportion of attributed public finance from MDBs, at about 4 percent of their 2013‑14 average.
16. The thematic split for the average level of mobilised climate finance in 2013‑14 was estimated to be: 68% mitigation, 18% adaptation and 14% cross‑cutting for total bilateral public finance; 76% mitigation, 20% adaptation and 4% cross‑cutting for total multilateral public finance attributable to developed countries (OECD, 2015).
Average exchange rate in 2006-15+ 2 standard
deviations
2013-14 average exchange rate
Average exchange rate in 2006-15
- 2 standard deviations
66.862.7 70.7
THIS CHART CHANGED (IT USED TO HAVE 3 SETS OF 3 COLUMNS)
PROJECTING CLIMATE FINANCE IN 2020 . 21
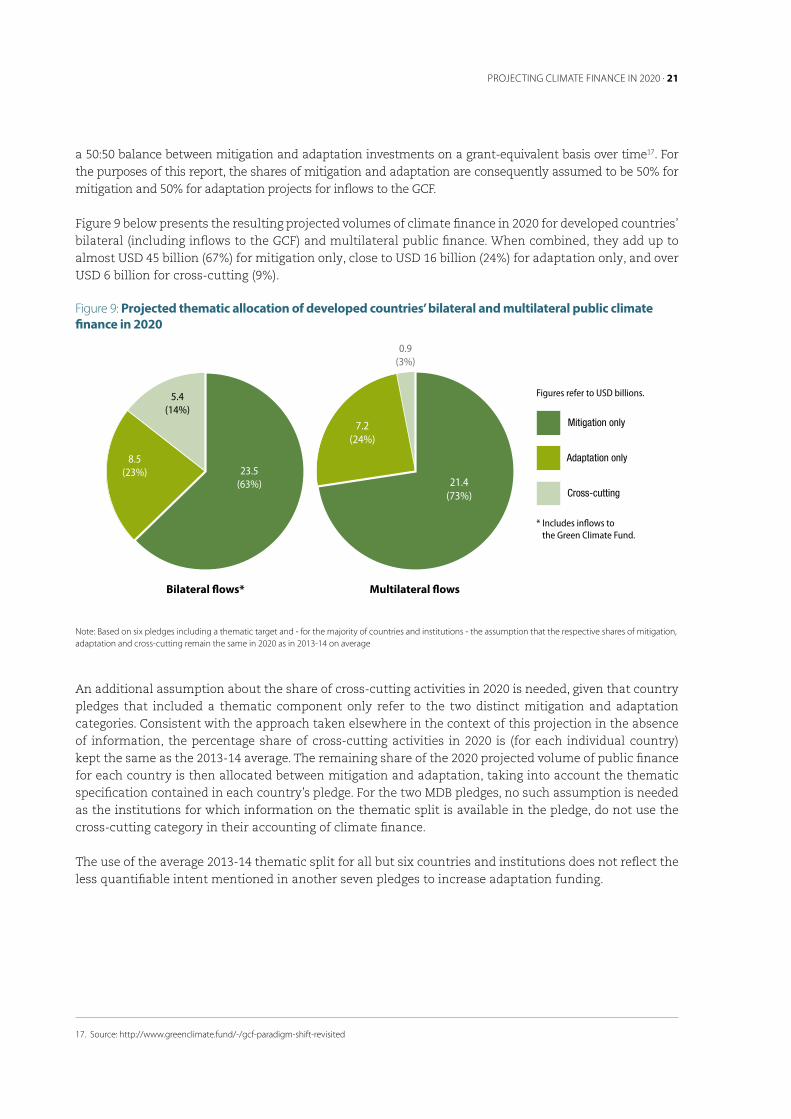
a 50:50 balance between mitigation and adaptation investments on a grant-equivalent basis over time17. For the purposes of this report, the shares of mitigation and adaptation are consequently assumed to be 50% for mitigation and 50% for adaptation projects for inflows to the GCF.
Figure 9 below presents the resulting projected volumes of climate finance in 2020 for developed countries’ bilateral (including inflows to the GCF) and multilateral public finance. When combined, they add up to almost USD 45 billion (67%) for mitigation only, close to USD 16 billion (24%) for adaptation only, and over USD 6 billion for cross-cutting (9%).
Figure 9: Projected thematic allocation of developed countries’ bilateral and multilateral public climate finance in 2020
Note: Based on six pledges including a thematic target and ‑ for the majority of countries and institutions ‑ the assumption that the respective shares of mitigation, adaptation and cross‑cutting remain the same in 2020 as in 2013‑14 on average
An additional assumption about the share of cross-cutting activities in 2020 is needed, given that country pledges that included a thematic component only refer to the two distinct mitigation and adaptation categories. Consistent with the approach taken elsewhere in the context of this projection in the absence of information, the percentage share of cross-cutting activities in 2020 is (for each individual country) kept the same as the 2013-14 average. The remaining share of the 2020 projected volume of public finance for each country is then allocated between mitigation and adaptation, taking into account the thematic specification contained in each country’s pledge. For the two MDB pledges, no such assumption is needed as the institutions for which information on the thematic split is available in the pledge, do not use the cross-cutting category in their accounting of climate finance.
The use of the average 2013-14 thematic split for all but six countries and institutions does not reflect the less quantifiable intent mentioned in another seven pledges to increase adaptation funding.
17. Source: http://www.greenclimate.fund/‑/gcf‑paradigm‑shift‑revisited
21.4(73%)
7.2(24%)
0.9(3%)
Cross-cutting
Adaptation only
Mitigation only
23.5(63%)
8.5(23%)
5.4(14%)
* Includes inflows to the Green Climate Fund.
Figures refer to USD billions.
Bilateral flows* Multilateral flows
22 . 2020 PROJECTIONS OF CLIMATE FINANCE TOWARDS THE USD 100 BILLION GOAL
3.2 Export credits Governments provide official export credits with the primary objective to support national exporters that compete for overseas sales of technologies, goods or services. Official Export Credit Agencies (ECAs) can be government institutions or private companies operating on behalf of the government. The financing that ECAs provide can take the form of direct credits (loans) to foreign buyers, or a credit guarantee or insurance to the private financial institution extending the loan to the buyer.
Export credits are, here, a separate category from public climate finance (Section 3.1) because they do not qualify as official development finance due to their financial terms and conditions and trade-related aim. Nonetheless, they can represent an important source of finance for large projects in developing countries. When they provide support in sectors and for activities that are relevant to climate change mitigation and/or adaptation, export credits participate in financing climate action in addition to supporting national exports and facilitating international trade.
3.2.1 Projection and underlying assumptions
The estimates for export credits in 2013-14 were based on renewable energy-related officially supported export credits data collected by the OECD Trade and Agriculture Directorate directly from ECAs. It is important to note that such data are limited to:
l Support to renewable energy projects but may involve the export of any type of good or service to such projects e.g. export of jack-up rigs for a wind farm is counted as wind energy;
l Export credits provided in conformity with the terms and conditions of the Arrangement on Officially Supported Export Credits18 and that were reported to the OECD via established procedures. This means that there could be export credits from official sources that are not included e.g. what countries/ECAs consider being purely market terms and conditions.
The 2013-14 estimates also included limited complementary reporting by a few countries of climate-relevant export credit data for other sectors than renewable energy. On that basis, volumes of climate-related export credits from developed to developing countries was estimated at USD 1.6 billion per year in 2013-14. This estimate may be considered as incomplete since it omits climate-related export credits beyond renewable energy for the majority of countries. Reporting on climate-related export credits might expand over the coming years, thereby resulting in more comprehensive estimates by 2020.
Climate-related activities (e.g. renewable energy, energy efficiency, resilient infrastructure such as in the water sector) might be of increasing focus for ECAs in response to priorities expressed by either provider or recipient governments. However, export credits are primarily demand driven to respond for instance to a lack of commercial market financing due to either risk appetite or liquidity concerns. Hence, in contrast to development finance institutions, ECAs do not typically make sector-, thematic- or geographic-related forward-looking pledges. As a result, consistent with the assumption made for using future volumes of public finance as a proxy in the absence of publicly-announced pledges (see Section 3.1), projected volumes of export credits in 2020 are kept constant with the average annual estimate for 2013-14 i.e. USD 1.6 billion. Actual levels of climate-related export credits in 2020 will most likely differ. Some of the factors that could lead to lower or higher volumes are discussed in Section 3.2.2.
Further, as a means to avoid double counting in cases where climate finance pledges put forward by countries were known to include export credits, the corresponding amounts were deducted from the “bilateral public finance” projection presented in Section 3.1.
18 See http://www.oecd.org/tad/xcred/theexportcreditsarrangementtext.htm

PROJECTING CLIMATE FINANCE IN 2020 . 23
3.2.2 Discussion of factors that could lead to a lower or higher volume of climate-related export credits in 2020
As mentioned above, the provision of export credits is typically demand driven. As a result, an increase in the demand of climate-related export credits between now and 2020 would mainly be dependent on an increasing deployment of commercially-viable climate-related technologies in countries requiring the use of risk-reduction instruments in support of imports. This implies a growing pipeline of (at least partly) import-based projects in developing countries. The extent to which domestic policies in developing countries include local content requirement regulations could therefore reduce the demand for export credits.
This does not mean that there cannot be supply-side factors (i.e. on the side of ECAs, governments and exporters) that could lead to an increase or decrease in volumes of climate-related export credits. These include for instance recent restrictions on official export credits for the least efficient coal-fired power plants19. However, it cannot be assumed that the consequences of this necessarily include an increased use of export credits for renewable energy.
There are nevertheless specific initiatives to pave the way for an increasing use of export credits to reduce the risk associated with climate projects in developing countries (see for e.g. EKF, 2014). The possible positive effect of such initiatives on volumes of climate-related export credits volumes by 2020 is, however, dependent on the growth of demand.
3.3 Mobilised private financeGovernments have at their disposal a range of public finance and policy interventions in order to increase private sector investments in climate-relevant activities in developing countries. Depending on their characteristics, public interventions might mobilise private finance directly (mainly the case of public finance at the project- or fund-levels), or have a more catalytic effect over time (typically the case of capacity building and climate policies). While developed countries have an important role to play in this context, it is important that developing countries’ own efforts (domestic finance and policies) towards mobilising private investments are acknowledged.
Further, the ability of public finance and policy interventions to effectively mobilise and catalyse private investment is dependent on country and market conditions (or “enabling conditions”) that influence levels of investment flows in general. Table 3 below provides an indicative list of examples of the types of factors that would ideally need to be considered to make a comprehensive and holistic analysis of what has led to private investment.
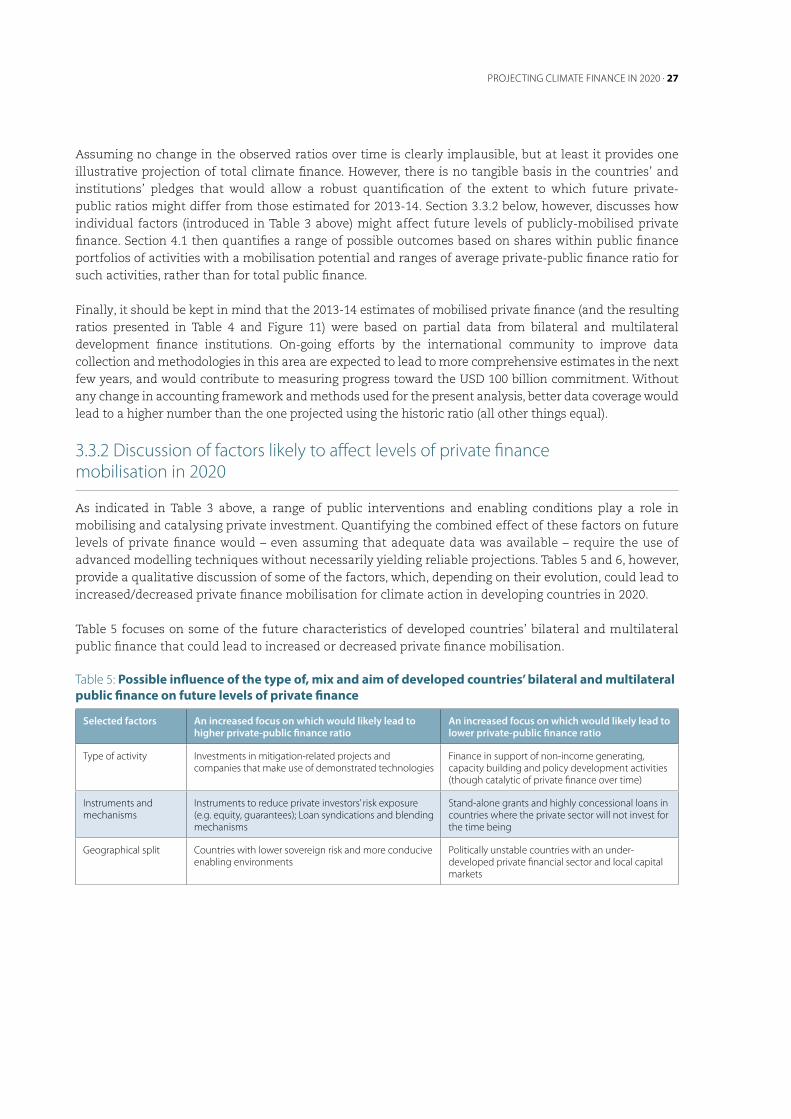
Table 3: Factors playing a role in mobilising and catalysing private investment
International and domestic public finance instruments
Domestic climate-related public policies
Enabling conditions
Grants
Loans (including credit lines)
Mezzanine finance
Direct and fund-level equity investments
Guarantees
Insurances
Joining/ratification of the Paris Agreement
Nationally-Determined Contributions
Formalised and quantified objectives
Incentive programmes
Subsidies
Carbon pricing
Quotas
GDP level and growth
Structural demand
Technology costs
Absorptive capacity
Investment environment
Legal framework
Political stability
Source: adapted from Haščič et al. (2015)
19. See http://www.oecd.org/newsroom/statement-from-participants-to-the-arrangement-on-officially-supported-export-credits.htm
24 . 2020 PROJECTION OF CLIMATE FINANCE TOWARDS THE USD 100 BILLION GOAL
Progress has been made to collect data and design methods for measuring private finance mobilised directly by international public climate finance (e.g. Benn et al., 2016; Joint-MDB, 2016; Stumhofer et al., 2015), including specifically towards the USD 100 billion commitment (OECD, 2015; TWG, 2015). By comparison, it is not yet possible to reliably quantify the “indirect” catalytic effects on private investment resulting from capacity building and policy interventions. This is, however, an active field of exploration and research (e.g. Brown et al., 2015; Haščič et al., 2015).
3.3.1 Illustrative projection of private co-finance attributable to developed countries
The projections presented in this section and the remainder of this note are based just on the direct mobilisation of private finance by public finance. This is consistent with the methodological approach used in OECD (2015) to estimate private finance mobilised in 2013-14 by developed countries for climate action in developing countries. These estimates were based on private co-financing directly associated with public climate finance (at the project-, activity- or fund-level) as best-available evidence for mobilisation.
As underlined in that report, private co-financing does not necessarily equate to mobilisation, and analysing private finance mobilisation based on co-financing data has some limitations. On the one hand, it may lead to overestimating the impact of public finance at the project level given that the catalytic role of public finance for upstream capacity building and project demonstration as well as the role of public policies is not taken into account. On the other hand, it means that private finance mobilised indirectly in the absence of direct public co-finance will not be captured, leading to a possible underestimation of overall volumes.
Taking 2013-14 total private co-financing data from bilateral and multilateral public climate finance providers as a starting point (only for projects to developing countries), two attribution steps were needed to quantify the private finance directly mobilised by developed countries:
l First, total private co-finance was attributed among public co-financiers based on respective volumes provided by each. This approach took into account the contributions of all multilateral, bilateral and domestic public actors involved, from both developed and developing countries alike.
l Second (for multilateral public actors only): the developed countries’ share in each multilateral institution (See Table 2 in Section 3.1.3) was applied to the amounts estimated as mobilised by each.
The 2013-14 estimates produced on that basis are summarised in Table 4 below, along with the resulting indicative public to private finance ratios. Very careful and transparent use should be made of such public-private finance ratios. This is because they are highly sensitive to both the underlying calculation methods (e.g. in terms of attribution of private finance among public actors involved), as well as to core characteristics of public finance that result from varying mandates of individual bilateral and multilateral institutions (see Jachnik and Raynaud, 2015). A number of other factors will also affect them, including technology risk and the country in which the project is financed.
The ratios presented in Table 4 are based on the aforementioned attribution steps. They are, therefore, significantly lower than public-private finance ratios that can be calculated by each public finance institution based on total (rather than attributed) private finance involved in the projects it funds. Using total (rather than attributed) private co-finance for estimating mobilisation at an aggregate level across actors would, however, lead to systematic double counting where more than one public co-financer is involved in a given project or activity.
PROJECTING CLIMATE FINANCE IN 2020 . 25
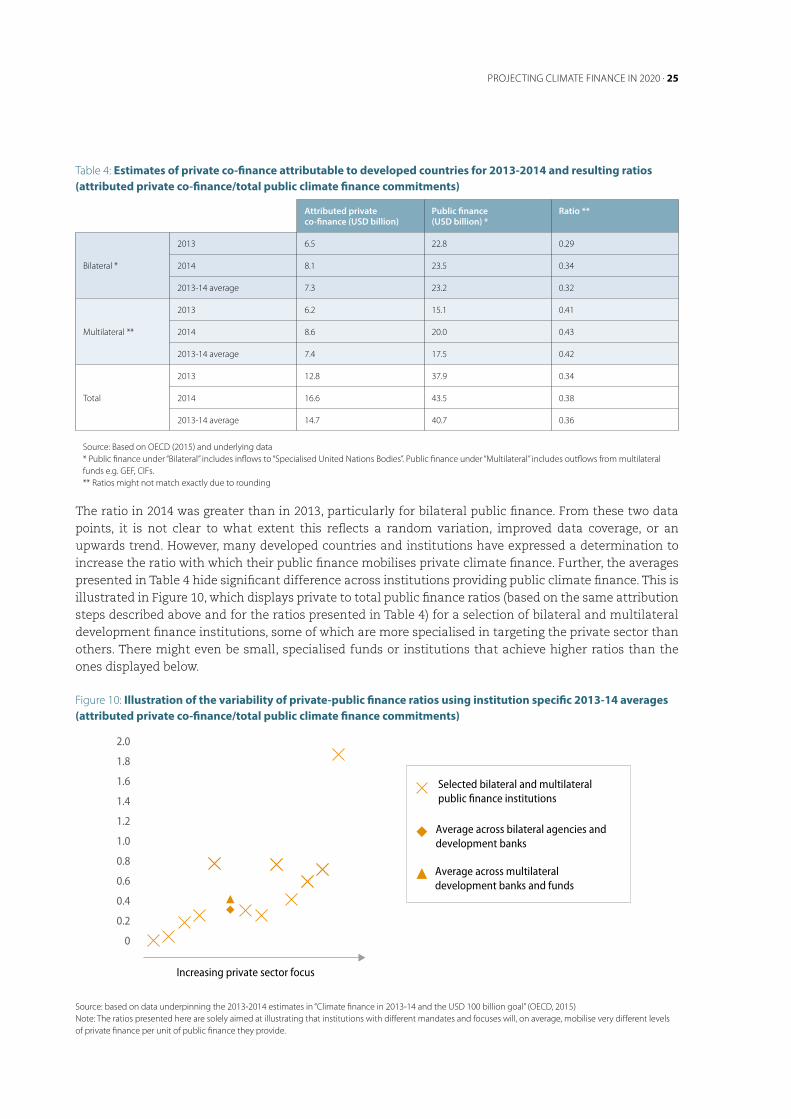
Table 4: Estimates of private co-finance attributable to developed countries for 2013-2014 and resulting ratios (attributed private co-finance/total public climate finance commitments)
Attributed private co-finance (USD billion)
Public finance (USD billion) *
Ratio **
Bilateral *
2013 6.5 22.8 0.29
2014 8.1 23.5 0.34
2013‑14 average 7.3 23.2 0.32
Multilateral **
2013 6.2 15.1 0.41
2014 8.6 20.0 0.43
2013‑14 average 7.4 17.5 0.42
Total
2013 12.8 37.9 0.34
2014 16.6 43.5 0.38
2013‑14 average 14.7 40.7 0.36
Source: Based on OECD (2015) and underlying data* Public finance under “Bilateral” includes inflows to “Specialised United Nations Bodies”. Public finance under “Multilateral” includes outflows from multilateral funds e.g. GEF, CIFs.** Ratios might not match exactly due to rounding
The ratio in 2014 was greater than in 2013, particularly for bilateral public finance. From these two data points, it is not clear to what extent this reflects a random variation, improved data coverage, or an upwards trend. However, many developed countries and institutions have expressed a determination to increase the ratio with which their public finance mobilises private climate finance. Further, the averages presented in Table 4 hide significant difference across institutions providing public climate finance. This is illustrated in Figure 10, which displays private to total public finance ratios (based on the same attribution steps described above and for the ratios presented in Table 4) for a selection of bilateral and multilateral development finance institutions, some of which are more specialised in targeting the private sector than others. There might even be small, specialised funds or institutions that achieve higher ratios than the ones displayed below.
Figure 10: Illustration of the variability of private-public finance ratios using institution specific 2013-14 averages (attributed private co-finance/total public climate finance commitments)
Source: based on data underpinning the 2013‑2014 estimates in “Climate finance in 2013‑14 and the USD 100 billion goal” (OECD, 2015)Note: The ratios presented here are solely aimed at illustrating that institutions with different mandates and focuses will, on average, mobilise very different levels of private finance per unit of public finance they provide.
Private mobilisation ratio – Average 2013-4
Private mobilisation ratio – 2014
Private mobilisation ratio – 2013
TotalMultilateralBilateral
11.812.910.7
12.412.1 12.6
24.225.5
22.8
0
0.2
0.4
0.6
0.8
1.0
1.2
1.4
1.6
1.8
2.0
Selected bilateral and multilateral public finance institutions
Average across bilateral agencies and development banks
Average across multilateral development banks and funds
Increasing private sector focus

26 . 2020 PROJECTIONS OF CLIMATE FINANCE TOWARDS THE USD 100 BILLION GOAL
It is also important to note that the ratios in Table 4 and Figure 10 were calculated by including in the denominator not just public finance that had private co-finance attached to it, but all public climate finance. This means that the ratios are averages across the full portfolios of activities and financial instruments of bilateral and multilateral actors. Obviously, considering only instruments and projects that have a direct private finance mobilisation potential would yield higher ratios on average (see Section 4 for a further discussion of these two distinct types of ratios).
Independently from how ratios are calculated, caution should be exercised in their use and interpretation. If, for instance, maximising private-public ratios is set as a performance measure, there is a risk of incentivising public resources to be provided primarily to countries and activities where the context would allow such maximisation. This might lead to increased “efficiency” in terms of use of fewer public resources needed to mobilise private investment. But it could also result in decreased “effectiveness”, as these resources might not be invested in the countries or activities most in need (Ellis et al. 2013, Mirabile et al, 2013). Thus, the amount of private finance mobilised by public actors (and the various ratios that can be derived on that basis) should not be interpreted as reflecting their respective abilities to achieve effective and transformational climate action, which requires monitoring over time of both the catalytic effect of public interventions on private finance, as well of actual mitigation and adaptation results.
Nevertheless, the historic 2013-14 average as well as the individual 2013 and 2014 annual public-private finance ratios can be used to derive an indicative projected level of private co-finance in 2020 on the assumption that nothing changes (Figure 11). This is done by multiplying the projected amounts of bilateral and multilateral public finance in 202020 presented in Section 3.1.2 and 3.1.3, by the respective average ratios of public co-finance and attributed private co-finance (shown in Table 4) observed based on the estimates for 2013 and 2014.
Figure 11: 2020 projections of mobilised private finance attributable to developed countries based on 2013-14 average ratios
20. As a means to avoid double counting where climate finance pledges put forward by countries or multilateral institutions were known to include mobilised private finance, the corresponding amounts were deducted from the “bilateral” and “multilateral” public finance projection presented above.
Private mobilisation ratio – Average 2013-14
Private mobilisation ratio – 2014
Private mobilisation ratio – 2013
TotalMultilateralBilateral
11.812.9
10.7
12.412.112.6
24.225.5
22.8
PROJECTING CLIMATE FINANCE IN 2020 . 27
Assuming no change in the observed ratios over time is clearly implausible, but at least it provides one illustrative projection of total climate finance. However, there is no tangible basis in the countries’ and institutions’ pledges that would allow a robust quantification of the extent to which future private-public ratios might differ from those estimated for 2013-14. Section 3.3.2 below, however, discusses how individual factors (introduced in Table 3 above) might affect future levels of publicly-mobilised private finance. Section 4.1 then quantifies a range of possible outcomes based on shares within public finance portfolios of activities with a mobilisation potential and ranges of average private-public finance ratio for such activities, rather than for total public finance. Finally, it should be kept in mind that the 2013-14 estimates of mobilised private finance (and the resulting ratios presented in Table 4 and Figure 11) were based on partial data from bilateral and multilateral development finance institutions. On-going efforts by the international community to improve data collection and methodologies in this area are expected to lead to more comprehensive estimates in the next few years, and would contribute to measuring progress toward the USD 100 billion commitment. Without any change in accounting framework and methods used for the present analysis, better data coverage would lead to a higher number than the one projected using the historic ratio (all other things equal).
3.3.2 Discussion of factors likely to affect levels of private finance mobilisation in 2020
As indicated in Table 3 above, a range of public interventions and enabling conditions play a role in mobilising and catalysing private investment. Quantifying the combined effect of these factors on future levels of private finance would – even assuming that adequate data was available – require the use of advanced modelling techniques without necessarily yielding reliable projections. Tables 5 and 6, however, provide a qualitative discussion of some of the factors, which, depending on their evolution, could lead to increased/decreased private finance mobilisation for climate action in developing countries in 2020.
Table 5 focuses on some of the future characteristics of developed countries’ bilateral and multilateral public finance that could lead to increased or decreased private finance mobilisation.
Table 5: Possible influence of the type of, mix and aim of developed countries’ bilateral and multilateral public finance on future levels of private finance
Selected factors An increased focus on which would likely lead to higher private-public finance ratio
An increased focus on which would likely lead to lower private-public finance ratio
Type of activity Investments in mitigation‑related projects and companies that make use of demonstrated technologies
Finance in support of non‑income generating, capacity building and policy development activities (though catalytic of private finance over time)
Instruments and mechanisms
Instruments to reduce private investors’ risk exposure (e.g. equity, guarantees); Loan syndications and blending mechanisms
Stand‑alone grants and highly concessional loans in countries where the private sector will not invest for the time being
Geographical split Countries with lower sovereign risk and more conducive enabling environments
Politically unstable countries with an under‑developed private financial sector and local capital markets

28 . 2020 PROJECTION OF CLIMATE FINANCE TOWARDS THE USD 100 BILLION GOAL
Beyond the characteristics of developed countries’ public finance (Table 5), Table 6 puts forward a number of other factors that will play a critical role in catalysing or hindering private investment. These relate to domestic policies in developing countries (the development and implementation of which can in some instances be supported by finance or technical assistance provided by developed countries), as well as to broader national and international enabling conditions.
Table 6: Possible influence of selected policy environment and enabling conditions on future levels of private finance
Selected factor Would positively impact the ability to mobilise private finance
Would negatively impact the ability to mobilise private finance
Domestic investment environment and legal framework
Transparent and stable rule of law (as well as application of it) for investors
Overly protectionist conditions e.g. discriminating between different investors, creating barriers to entry
Domestic climate policies Increased level of ambition (e.g. targets, carbon pricing) and stability of climate‑related support policies
Lack of ambition/transparency of climate goals and targets; Retroactive changes to policies; Increase in fossil fuel subsidies
Depth of domestic financial markets and industry
Well‑developed capital markets and financial services industry (e.g. banks, equity funds and investors)
Under‑developed markets for bonds and shares; limited number and variety of actors of the financial services industry
Country risk factors Improved sovereign ratings in destination countries Deteriorating macro‑economic conditions; Excessive levels of country debt and risk of default
Global financial conditions Solid balance sheets of domestic and international commercial banks
International financial crisis leading to tightening of credit‑granting conditions including high interest rates
Maturity of technologies / project‑related risk
Increased profitability of climate‑related technologies and projects thanks to a decrease in their overall cost structures
Failure of demonstration projects for key upcoming climate‑related technologies

WHAT IF PUBLIC FINANCE, PORTFOLIOS AND/OR PRIVATE FINANCE RATIOS CHANGE?. 29
4. What if public finance, portfolios and/or private
finance ratios change?
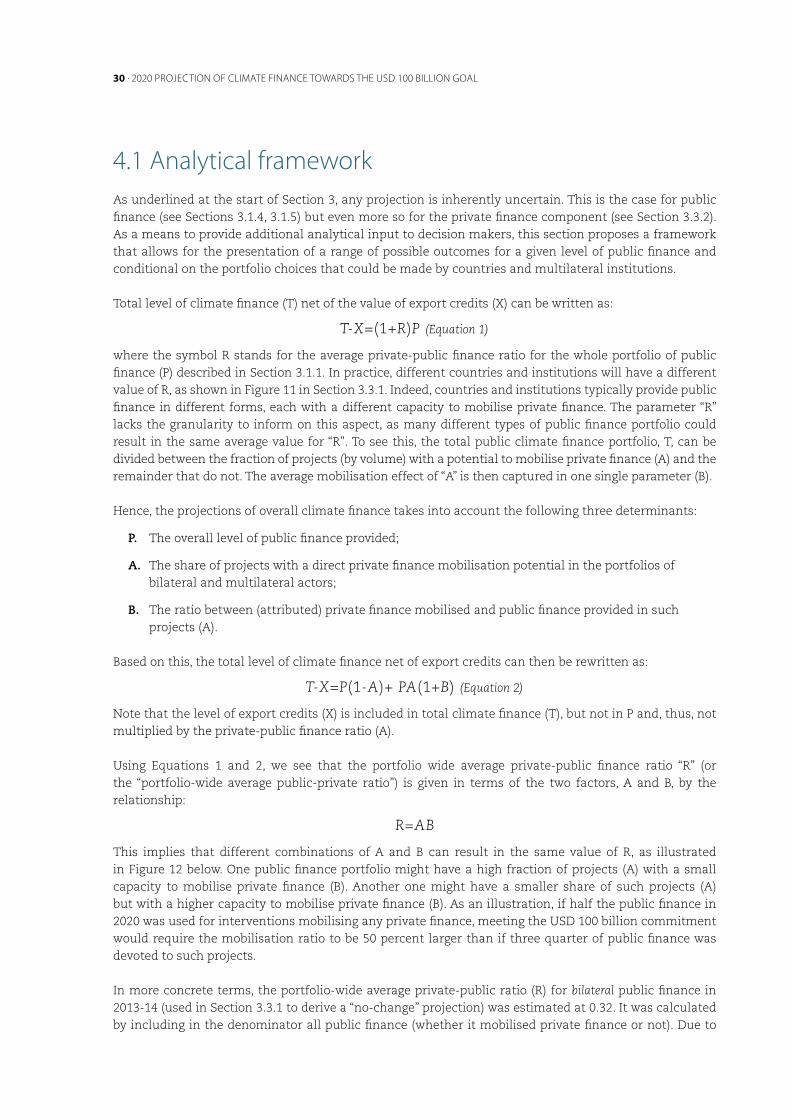
30 . 2020 PROJECTION OF CLIMATE FINANCE TOWARDS THE USD 100 BILLION GOAL
4.1 Analytical frameworkAs underlined at the start of Section 3, any projection is inherently uncertain. This is the case for public finance (see Sections 3.1.4, 3.1.5) but even more so for the private finance component (see Section 3.3.2). As a means to provide additional analytical input to decision makers, this section proposes a framework that allows for the presentation of a range of possible outcomes for a given level of public finance and conditional on the portfolio choices that could be made by countries and multilateral institutions.
Total level of climate finance (T) net of the value of export credits (X) can be written as:
T-X=(1+R)P (Equation 1)
where the symbol R stands for the average private-public finance ratio for the whole portfolio of public finance (P) described in Section 3.1.1. In practice, different countries and institutions will have a different value of R, as shown in Figure 11 in Section 3.3.1. Indeed, countries and institutions typically provide public finance in different forms, each with a different capacity to mobilise private finance. The parameter “R” lacks the granularity to inform on this aspect, as many different types of public finance portfolio could result in the same average value for “R”. To see this, the total public climate finance portfolio, T, can be divided between the fraction of projects (by volume) with a potential to mobilise private finance (A) and the remainder that do not. The average mobilisation effect of “A” is then captured in one single parameter (B). Hence, the projections of overall climate finance takes into account the following three determinants:
P. The overall level of public finance provided;
A. The share of projects with a direct private finance mobilisation potential in the portfolios of bilateral and multilateral actors;
B. The ratio between (attributed) private finance mobilised and public finance provided in such projects (A).
Based on this, the total level of climate finance net of export credits can then be rewritten as:
T-X=P(1-A)+ PA(1+B) (Equation 2)
Note that the level of export credits (X) is included in total climate finance (T), but not in P and, thus, not multiplied by the private-public finance ratio (A).
Using Equations 1 and 2, we see that the portfolio wide average private-public finance ratio “R” (or the “portfolio-wide average public-private ratio”) is given in terms of the two factors, A and B, by the relationship:
R=AB
This implies that different combinations of A and B can result in the same value of R, as illustrated in Figure 12 below. One public finance portfolio might have a high fraction of projects (A) with a small capacity to mobilise private finance (B). Another one might have a smaller share of such projects (A) but with a higher capacity to mobilise private finance (B). As an illustration, if half the public finance in 2020 was used for interventions mobilising any private finance, meeting the USD 100 billion commitment would require the mobilisation ratio to be 50 percent larger than if three quarter of public finance was devoted to such projects.
In more concrete terms, the portfolio-wide average private-public ratio (R) for bilateral public finance in 2013-14 (used in Section 3.3.1 to derive a “no-change” projection) was estimated at 0.32. It was calculated by including in the denominator all public finance (whether it mobilised private finance or not). Due to

WHAT IF PUBLIC FINANCE, PORTFOLIOS AND/OR PRIVATE FINANCE RATIOS CHANGE?. 31
data constraints, it is not possible to provide a more detailed characterisation of the portfolio of projects. It is, however, important to underline that such a ratio could result from different types of portfolios, in which for example:
l 75% of projects (A) mobilise private finance with an average ratio of 0.48 (B), the remaining 25% do not mobilise directly;
l 50% of projects (A) mobilise private finance with an average ratio of 0.72 (B), the remaining 50% do not mobilise directly.
All three determinants considered by the framework (P, A and B) will in turn be influenced by a number of contributing factors, such as the exchange rate of key currencies against the US Dollar (see Section 3.1.5) or enabling conditions for investment in recipient countries (see Section 3.3.2). It would, therefore, be premature on a purely technical and analytical basis to draw conclusions from this projection about whether or not the USD 100 billion commitment will be met by 2020. It is, however, possible to illustrate under which assumptions about “A and B” the USD 100 billion commitment might be met.
4.2 Range of projected outcomesA simple rearrangement of Equation 2 gives us the value of total climate finance that is of interest for these projections:
T=P(1+AB)+X (Equation 3)
Figure 13 presents the range of outcomes (T) based on a fixed level of public finance (P) of USD 67 billion corresponding to the 2020 public finance projection presented earlier in this note. There is currently insufficient information available to significantly narrow down the range of likely outcomes (T). This would require the availability of more complete and granular information on the composition of the current (and ideally future) public climate finance portfolios of developed countries and multilateral institutions, including the probability distribution of individual activities with different private-public finance ratios.
It is, however, possible to illustrate the range of combinations of factors A and B that would lead to the same USD 92.5 billion figure projected on the basis of the 2013-14 historical private-public finance ratios (R) – see bold numbers in Figure 13. Further, as a pure sensitivity test, Figures 14 and 15 then present the same range of outcomes (T) for a variation in the volume of public finance (P) based on exchange rate fluctuations. To do so, two standard deviations of the average exchange rates over the last ten years are used, as detailed in Section 3.1.5.3.21 A key implication when comparing Figures 13, 14 and 15 is that, while a higher level of public finance always enhances developed countries’ ability to meet the USD 100 billion commitment – all other things being equal – it does not guarantee a higher level of overall climate finance, since this also depends on the portfolio of projects and the average private-public ratio for those projects.
23. The standard deviation was calculated for each currency and weighted by the share of the total pledges having been reported in such currency. An underlying assumption is that climate finance will be reported in 2020 in the same currencies and same proportion as the pledges.
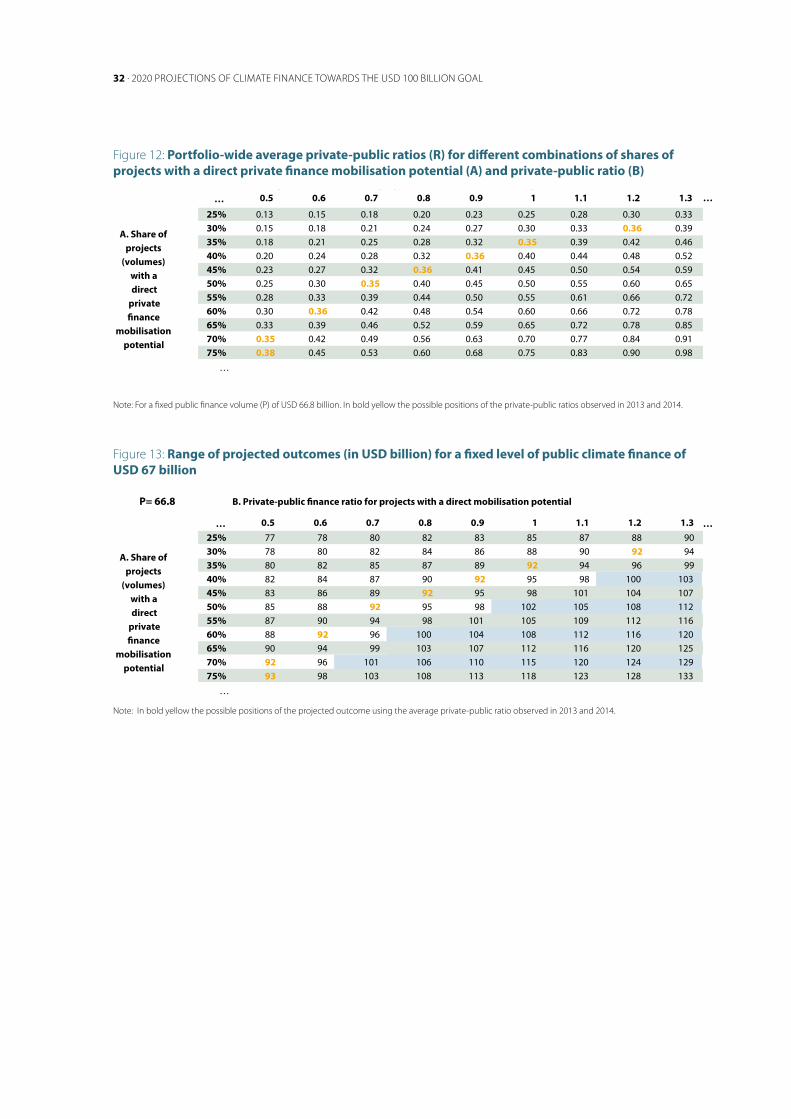
32 . 2020 PROJECTIONS OF CLIMATE FINANCE TOWARDS THE USD 100 BILLION GOAL
Figure 12: Portfolio-wide average private-public ratios (R) for different combinations of shares of projects with a direct private finance mobilisation potential (A) and private-public ratio (B)
Note: For a fixed public finance volume (P) of USD 66.8 billion. In bold yellow the possible positions of the private‑public ratios observed in 2013 and 2014.
Figure 13: Range of projected outcomes (in USD billion) for a fixed level of public climate fina nce of USD 67 billion
Note: In bold yellow the possible positions of the projected outcome using the average private‑public ratio observed in 2013 and 2014.
P= 66.8 B. Private-public �nance ratio for projects with a direct mobilisation potential
… …
…
…
…
0.5 0.6 0.7 0.8 0.9 1 1.1 1.2 1.3
… 0.5 0.6 0.7 0.8 0.9 1 1.1 1.2 1.3
… 0.5 0.6 0.7 0.8 0.9 1 1.1 1.2 1.3
… 0.5 0.6 0.7 0.8 0.9 1 1.1 1.2 1.3
25% 77 78 80 82 83 85 87 88 90 30% 78 80 82 84 86 88 90 92 94 35% 80 82 85 87 89 92 94 96 99 40% 82 84 87 90 92 95 98 100 103 45% 83 86 89 92 95 98 101 104 107 50% 85 88 92 95 98 102 105 108 112 55% 87 90 94 98 101 105 109 112 116 60% 88 92 96 100 104 108 112 116 120 65% 90 94 99 103 107 112 116 120 125 70% 92 96 101 106 110 115 120 124 129 75% 93 98 103 108 113 118 123 128 133
…
P= 62.7 B. Private-public �nance ratio for projects with a direct mobilisation potential
25% 72 74 75 77 78 80 82 83 85 30% 74 76 77 79 81 83 85 87 89 35% 75 77 80 82 84 86 88 91 93 40% 77 79 82 84 87 89 92 94 97 45% 78 81 84 87 90 93 95 98 101 50% 80 83 86 89 93 96 99 102 105 55% 82 85 88 92 95 99 102 106 109 60% 83 87 91 94 98 102 106 109 113 65% 85 89 93 97 101 105 109 113 117 70% 86 91 95 99 104 108 113 117 121 75% 88 93 97 102 107 111 116 121 125
…
P= 70.7 B. Private-public �nance ratio for projects with a direct mobilisation potential
25% 81 83 85 86 88 90 92 94 95 30% 83 85 87 89 91 94 96 98 100 35% 85 87 90 92 95 97 100 102 105 40% 86 89 92 95 98 101 103 106 109 45% 88 91 95 98 101 104 107 111 114 50% 90 94 97 101 104 108 111 115 118 55% 92 96 100 103 107 111 115 119 123 60% 94 98 102 106 111 115 119 123 128 65% 95 100 105 109 114 118 123 128 132 70% 97 102 107 112 117 122 127 132 137 75% 99 104 109 115 120 125 131 136 141
…
B. Private-public �nance ratio for projects with a direct mobilisation potential
25% 0.13 0.15 0.18 0.20 0.23 0.25 0.28 0.30 0.33 30% 0.15 0.18 0.21 0.24 0.27 0.30 0.33 0.36 0.39 35% 0.18 0.21 0.25 0.28 0.32 0.35 0.39 0.42 0.46 40% 0.20 0.24 0.28 0.32 0.36 0.40 0.44 0.48 0.52 45% 0.23 0.27 0.32 0.36 0.41 0.45 0.50 0.54 0.59 50% 0.25 0.30 0.35 0.40 0.45 0.50 0.55 0.60 0.65 55% 0.28 0.33 0.39 0.44 0.50 0.55 0.61 0.66 0.72 60% 0.30 0.36 0.42 0.48 0.54 0.60 0.66 0.72 0.78 65% 0.33 0.39 0.46 0.52 0.59 0.65 0.72 0.78 0.85 70% 0.35 0.42 0.49 0.56 0.63 0.70 0.77 0.84 0.91 75% 0.38 0.45 0.53 0.60 0.68 0.75 0.83 0.90 0.98
…
A. Share of projects
(volumes) with a direct
private �nance
mobilisation potential
A. Share of projects
(volumes) with a direct
private �nance
mobilisation potential
A. Share of projects
(volumes) with a direct
private �nance
mobilisation potential
A. Share of projects
(volumes) with a direct
private �nance
mobilisation potential
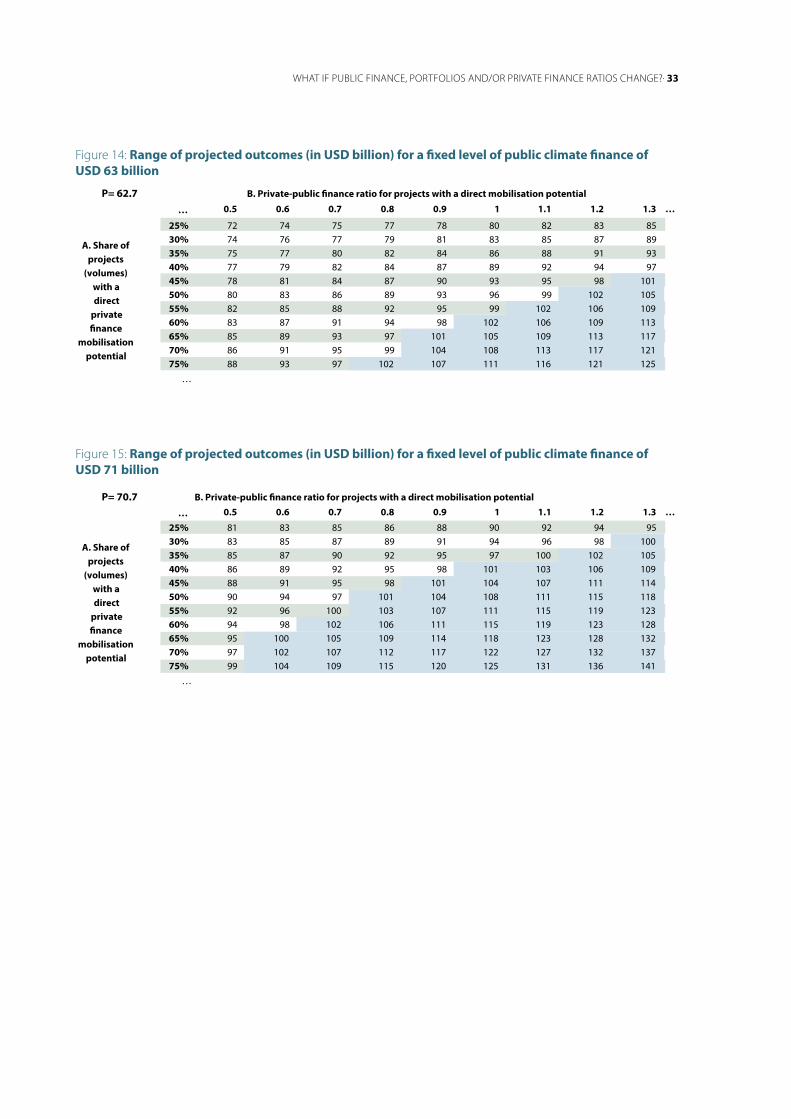
WHAT IF PUBLIC FINANCE, PORTFOLIOS AND/OR PRIVATE FINANCE RATIOS CHANGE?. 33
Figure 14: Range of projected outcomes (in USD billion) for a fixed level of public climate finance of USD 63 billion
Figure 15: Range of projected outcomes (in USD billion) for a fixed level of public climate finance of USD 71 billion
P= 66.8 B. Private-public �nance ratio for projects with a direct mobilisation potential
… …
…
…
…
0.5 0.6 0.7 0.8 0.9 1 1.1 1.2 1.3
… 0.5 0.6 0.7 0.8 0.9 1 1.1 1.2 1.3
… 0.5 0.6 0.7 0.8 0.9 1 1.1 1.2 1.3
… 0.5 0.6 0.7 0.8 0.9 1 1.1 1.2 1.3
25% 77 78 80 82 83 85 87 88 90 30% 78 80 82 84 86 88 90 92 94 35% 80 82 85 87 89 92 94 96 99 40% 82 84 87 90 92 95 98 100 103 45% 83 86 89 92 95 98 101 104 107 50% 85 88 92 95 98 102 105 108 112 55% 87 90 94 98 101 105 109 112 116 60% 88 92 96 100 104 108 112 116 120 65% 90 94 99 103 107 112 116 120 125 70% 92 96 101 106 110 115 120 124 129 75% 93 98 103 108 113 118 123 128 133
…
P= 62.7 B. Private-public �nance ratio for projects with a direct mobilisation potential
25% 72 74 75 77 78 80 82 83 85 30% 74 76 77 79 81 83 85 87 89 35% 75 77 80 82 84 86 88 91 93 40% 77 79 82 84 87 89 92 94 97 45% 78 81 84 87 90 93 95 98 101 50% 80 83 86 89 93 96 99 102 105 55% 82 85 88 92 95 99 102 106 109 60% 83 87 91 94 98 102 106 109 113 65% 85 89 93 97 101 105 109 113 117 70% 86 91 95 99 104 108 113 117 121 75% 88 93 97 102 107 111 116 121 125
…
P= 70.7 B. Private-public �nance ratio for projects with a direct mobilisation potential
25% 81 83 85 86 88 90 92 94 95 30% 83 85 87 89 91 94 96 98 100 35% 85 87 90 92 95 97 100 102 105 40% 86 89 92 95 98 101 103 106 109 45% 88 91 95 98 101 104 107 111 114 50% 90 94 97 101 104 108 111 115 118 55% 92 96 100 103 107 111 115 119 123 60% 94 98 102 106 111 115 119 123 128 65% 95 100 105 109 114 118 123 128 132 70% 97 102 107 112 117 122 127 132 137 75% 99 104 109 115 120 125 131 136 141
…
B. Private-public �nance ratio for projects with a direct mobilisation potential
25% 0.13 0.15 0.18 0.20 0.23 0.25 0.28 0.30 0.33 30% 0.15 0.18 0.21 0.24 0.27 0.30 0.33 0.36 0.39 35% 0.18 0.21 0.25 0.28 0.32 0.35 0.39 0.42 0.46 40% 0.20 0.24 0.28 0.32 0.36 0.40 0.44 0.48 0.52 45% 0.23 0.27 0.32 0.36 0.41 0.45 0.50 0.54 0.59 50% 0.25 0.30 0.35 0.40 0.45 0.50 0.55 0.60 0.65 55% 0.28 0.33 0.39 0.44 0.50 0.55 0.61 0.66 0.72 60% 0.30 0.36 0.42 0.48 0.54 0.60 0.66 0.72 0.78 65% 0.33 0.39 0.46 0.52 0.59 0.65 0.72 0.78 0.85 70% 0.35 0.42 0.49 0.56 0.63 0.70 0.77 0.84 0.91 75% 0.38 0.45 0.53 0.60 0.68 0.75 0.83 0.90 0.98
…
A. Share of projects
(volumes) with a direct
private �nance
mobilisation potential
A. Share of projects
(volumes) with a direct
private �nance
mobilisation potential
A. Share of projects
(volumes) with a direct
private �nance
mobilisation potential
A. Share of projects
(volumes) with a direct
private �nance
mobilisation potential

34 . 2020 PROJECTIONS OF CLIMATE FINANCE TOWARDS THE USD 100 BILLION GOAL
5. Climate finance in the context of finance
for development
CLIMATE FINANCE IN THE CONTEXT OF FINANCE FOR DEVELOPMENT . 35
Climate finance is an integral part of development finance. This results in a number of opportunities and challenges to ensure coherence and impact across multiple policy objectives. One key concern is whether increasing volumes and shares of climate-related finance within development co-operation portfolios might be diverting development finance from other developmental priorities or sectors.
This section provides a preliminary discussion in the light of data drawn from the OECD DAC’s statistics on climate-related development finance from bilateral and multilateral providers.22 It is in this context important to underline the extent to which insights from analysis of DAC data can be assumed to apply to climate finance data in relation to the USD 100 billion a year commitment. Key is the difference between the DAC bilateral public finance data and the data reported by countries to the UNFCCC, which was used for producing both 2013-14 estimates (OECD, 2015) and 2020 projections of climate finance (previous sections of this note) against the USD 100 billion a year commitment. There is currently no easy way to systematically identify which specific elements in the DAC data correspond to the volumes reported to the UNFCCC by the countries.23 A second consideration is that there is no attempt in DAC data to attribute a share of multilateral public climate finance outflows back to provider countries.
Despite these differences, the analysis of climate-related development finance recorded in the DAC statistical system (where all data is publicly-available at the activity level) can yield some relevant insights. This is particularly the case when it comes to the mainstreaming that will be required to make “finance flows consistent with a pathway towards low-greenhouse gas emissions and climate-resilient development” (UNFCCC, 2015) and in the context of the Sustainable Development Goals. In this regard, the sectoral allocation of development finance can provide information about the extent to which providers and partner developing countries have been able to mainstream climate objectives and align them with broader sustainable development objectives.
5.1 Trends and implications Official Development Assistance (ODA) has been on an upward trajectory since 2000, with ODA commitments from the 29 members of the OECD DAC increasing by 90% in real terms between 2000-01 and 2013-14. Least Developed Countries (LDCs) and other Low Income Countries (LICs) have traditionally been the primary recipients of concessional development finance. Recently, however, net flows of overall ODA to this group had declined, though 2015 marked a slight rebound as bilateral ODA to LDCs and LICs increased by 4%.24
Climate-related concessional development finance (see Box 1) has also increased, both in absolute terms and as a share of total (bilateral and multilateral) concessional development finance25 (see Figure 16). Annual commitments reached USD 33.7 billion in 2014, representing 20% of the total. The upward trend of the share of climate-related development finance in the total is an indication of the priority attention given to climate change within development co-operation portfolios. The convergence of allocation patterns of climate-related development finance with those for broader development finance, in terms of geographies and income groups, will be important to achieve broader sustainable development objectives.
22. While the DAC CRS database is comprehensive, containing all development finance activities at project level identified by providers as targeting climate change objectives, provider countries do not report all of the finance related to these activities to the UNFCCC. Bilateral numbers in Figure 17 refer to ODA from members of the OECD Development Assistance Committee. Due to reporting coverage issues, the series for multilateral outflows does not go back further than 2013.
23. Efforts are underway in the DAC to address this. 24. This is based on preliminary data – see http://www.oecd.org/dac/development‑aid‑rises‑again‑in‑2015‑spending‑on‑refugees‑doubles.htm.
25. All subsequent figures in this section relate to commitments.

Figure 16: Climate-related concessional development finance, volume and share of total commitments (bilateral 2010-14, bi- and multilateral 2013-14)
Source: DAC CRS, 2016.Note: Bilateral figures refer to ODA from members of the OECD Development Assistance Committee. Due to reporting coverage issues, the series for multilateral outflows does not go back further than 2013.
• ODA is a measure of effort by countries, consisting of bilateral ODA as well as contributions to eligible multilateral organisations.
• Concessional development finance refers to bilateral ODA and multilateral concessional outflows (i.e. finance provided by multilateral organisations to developing countries on concessional terms)
While ODA contributions to multilateral organisations are essential to fund their concessional operations, concessional outflows of multilateral institutions are, in turn, generally considered to be the multilateral
equivalent to ODA. Flows of concessional development finance to developing countries are constituted by concessional multilateral outflows together with direct bilateral ODA, and this section focuses primarily on this measure.
Total development finance then refers to concessional development finance as defined above, plus official bilateral and multilateral flows to developing countries that are not considered concessional but do have a primary development purpose.
Box 1: Distinction between official development assistance (ODA) and concessional development finance
22.7
17.821.4
23.325.2
6.6
8.5
20%
17%
21% 21%22%
18%
20%
2010 2011 2012 2013 2014
USD
bill
ion,
con
stan
t 201
4
Share of bilateral climate-related ODA in total bilateral ODA
Share of combined bi- and multilateral climate-related concessionaldevelopment finance in total concessional finance
Bilateral flows
Multilateral outflows
Please note that it is still uncertain whether Section 5 and the graphics it contains will be included in the final report or not.”
36 . 2020 PROJECTIONS OF CLIMATE FINANCE TOWARDS THE USD 100 BILLION GOAL

CLIMATE FINANCE IN THE CONTEXT OF FINANCE FOR DEVELOPMENT . 37
5.2 Insights from sectoral analysisMainstreaming climate change considerations into development co-operation activities offers a way forward to deliver adaptation and mitigation results as part of sustainable development (Shine and Campillo, 2016). This suggests that larger shares of climate-related finance can be expected in development finance portfolios over time, particularly in key climate-sensitive sectors such as energy, transport, agriculture and water. Mainstreaming of climate considerations into development activities also offers potential for exploiting co-benefits between action on climate change and other development objectives such as gender, health, poverty reduction and so on.
To shed more light on this issue, Figure 17 presents data on four key social sectors (Health; Education; Population & Reproductive Health; Government & Civil Society) as well as five climate-sensitive sectors accounting for 84% of total climate-related commitments in 2013-14 (Energy; Agriculture, Fisheries & Forestry; Water & Sanitation; General Environmental Protection; and Transport & Storage). The social sectors reflect key development priorities, yet they account for very low volumes of climate-related development finance. If climate-related activities had been diverting concessional development finance from priority social sectors, the share of social sectors in total commitments would be expected to exhibit a declining trend. Conversely, the share of climate-relevant sectors should exhibit a corresponding increasing trend.
Figure 17: Shares of total concessional development finance, social and climate-sensitive sectors, 2010-2014
Source: OECD CRS data Note: Shares of total concessional development finance commitments, based on sector allocable aid across multilateral and bilateral channels. Values for multilateral channels have been adjusted to account only for institutions reporting on climate finance outflows.
4.6% 4.5% 4.6% 4.7% 4.8%
4.8% 5.1% 6.3% 5.3% 4.7%4.6% 5.6% 4.8% 4.6% 5.4%
7.7% 7.7% 7.8% 7.4% 7.1%8.6% 7.8% 7.4% 6.8% 7.7%
6.9% 5.9% 8.2% 7.8% 9.3%
4.8% 3.7% 4.0% 3.4% 3.5%
12.3% 13.4% 11.0% 11.0% 11.1% 8.4% 7.3% 9.2% 9.9% 8.0%
2010 2011 2012 2013 2014 2010 2011 2012 2013 2014
HEALTH GENERAL ENVIRONMENTAL PROTECTION
POPULATION POLICIES AND REPRODUCTIVE HEALTH WATER SUPPLY AND SANITATION
EDUCATION AGRICULTURE, FORESTRY AND FISHERIES
ENERGY
GOVERNANCE AND CIVIL SOCIETY TRANSPORT AND STORAGE
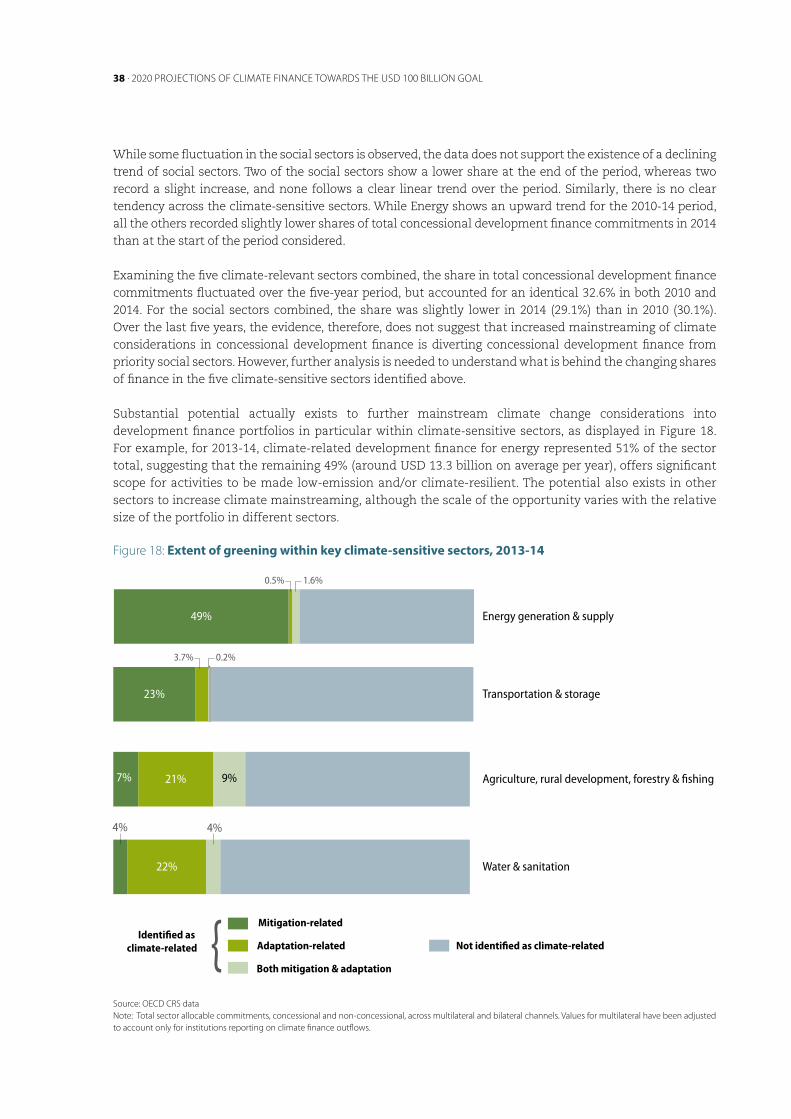
38 . 2020 PROJECTIONS OF CLIMATE FINANCE TOWARDS THE USD 100 BILLION GOAL
While some fluctuation in the social sectors is observed, the data does not support the existence of a declining trend of social sectors. Two of the social sectors show a lower share at the end of the period, whereas two record a slight increase, and none follows a clear linear trend over the period. Similarly, there is no clear tendency across the climate-sensitive sectors. While Energy shows an upward trend for the 2010-14 period, all the others recorded slightly lower shares of total concessional development finance commitments in 2014 than at the start of the period considered.
Examining the five climate-relevant sectors combined, the share in total concessional development finance commitments fluctuated over the five-year period, but accounted for an identical 32.6% in both 2010 and 2014. For the social sectors combined, the share was slightly lower in 2014 (29.1%) than in 2010 (30.1%). Over the last five years, the evidence, therefore, does not suggest that increased mainstreaming of climate considerations in concessional development finance is diverting concessional development finance from priority social sectors. However, further analysis is needed to understand what is behind the changing shares of finance in the five climate-sensitive sectors identified above.
Substantial potential actually exists to further mainstream climate change considerations into development finance portfolios in particular within climate-sensitive sectors, as displayed in Figure 18. For example, for 2013-14, climate-related development finance for energy represented 51% of the sector total, suggesting that the remaining 49% (around USD 13.3 billion on average per year), offers significant scope for activities to be made low-emission and/or climate-resilient. The potential also exists in other sectors to increase climate mainstreaming, although the scale of the opportunity varies with the relative size of the portfolio in different sectors.
Figure 18: Extent of greening within key climate-sensitive sectors, 2013-14
Source: OECD CRS dataNote: Total sector allocable commitments, concessional and non‑concessional, across multilateral and bilateral channels. Values for multilateral have been adjusted to account only for institutions reporting on climate finance outflows.
Source: OECD DAC. 2013-14 average, USD constant 2013 prices. The bar represents total ODA per sector and the climate-related share within that total.
Energy generation & supply
Transportation & storage
Water & sanitation
Agriculture, rural development, forestry & fishing
Mitigation-related
Not identified as climate-relatedAdaptation-related
Both mitigation & adaptation{Identified as
climate-related
4% 4%
1.6%0.5%
7%
49%
23%
22%
21% 9%
Please note that it is still uncertain whether Section 5 and the graphics it contains will be included in the final report or not.”
0.2%3.7%

REFERENCES . 39
ReferencesBenn, J., et al. (2016), “Amounts Mobilised from the Private Sector by Official Development Finance
Interventions: Guarantees, syndicated loans and shares in collective investment vehicles”, OECD Development Co-operation Working Papers, No. 26, OECD Publishing, Paris. DOI: http://dx.doi.org/10.1787/5jm3xh459n37-en
Brown, J., et al. (2015), Estimating Mobilized Private Finance for Adaptation: Exploring Data and Methods, Climate Policy Initiative and OECD, http://climatepolicyinitiative.org/publication/estimating-mobilized-private-finance-for-adaptation-exploring-data-and-methods
EKF (2014), Export credits and climate finance: Follow-up on the ECA workshop on climate finance – a compendium, http://www.ekf.dk/Docs/Handbook%20EKF%20climate%20financing.pdf
Ellis, J., R. Caruso and S. Ockenden (2013), “Exploring Climate Finance Effectiveness”, OECD/IEA Climate Change Expert Group Papers, No. 2013/04, OECD Publishing, Paris. DOI: http://dx.doi.org/10.1787/5jzb44nmnbd2-en
Haščič I., et al. (2015), Public Interventions and Private Climate Finance Flows: Empirical Evidence from Renewable Energy Financing, OECD Environment Working Papers, No. 80, OECD Publishing, Paris. DOI: http://dx.doi.org/10.1787/5js6b1r9lfd4-en
Jachnik, R. and V. Raynaud (2015), Sector-level approach to estimating mobilised private climate finance: The case of renewable energy, OECD Environment Working Papers, No. 98, OECD Publishing, Paris. DOI: http://dx.doi.org/10.1787/5jrp02jnzl35-en
Joint-MDB (2016, 2015, 2014, 2013), Joint report on Multilateral development banks’ Climate Finance, by the AfDB, the ADB, the EBRD, the EIB, the IDB and the WBG. http://www.adb.org/documents/joint-report-mdbs-climate-finance-2015
Mirabile, M., J. Benn and C. Sangaré (2013), “Guarantees for Development”, OECD Development Co-operation Working Papers, No. 11, OECD Publishing, Paris. DOI: http://dx.doi.org/10.1787/5k407lx5b8f8-en
OECD (2016) DAC Statistics on Climate-related Development Finance http://oe.cd/RioMarkers
OECD (2015), Climate finance in 2013-14 and the USD 100 billion goal, a report by the OECD in collaboration with Climate Policy Initiative. http://www.oecd.org/environment/cc/OECD-CPI-Climate-Finance-Report.htm
Shine, T. and G. Campillo (forthcoming) The role of development finance in climate action post-2015. OECD Development Co-operation Working Paper, OECD Publishing, Paris.
Stumhofer T, et al. (2015), Proposal of a methodology for tracking publicly mobilized private climate finance, KfW Development Bank Materials on Development Financing. https://www.kfw-entwicklungsbank.de/PDF/Download-Center/Materialien/Nr.-9_Proposal-of-a-methodology-for-tracking-publicly-mobilized-private-climate-finance.pdf

40 . 2020 PROJECTIONS OF CLIMATE FINANCE TOWARDS THE USD 100 BILLION GOAL
TWG (2015), “Joint Statement on Tracking Progress Towards the 100 billion Goal” and “Technical Working Group input to the OECD-CPI report”, http://www.bafu.admin.ch/dokumentation/medieninformation/00962/index.html?lang=en&msg-id=58589
UNFCCC SCF (2014), First Biennial Assessment and Overview of Climate Finance Flows, http://unfccc.int/cooperation_and_support/financial_mechanism/standing_committee/items/8034.php
UNFCCC (2015), Paris Agreement, http://unfccc.int/paris_agreement/items/9485.php
UNFCCC (2014) Compilation and synthesis of sixth national communications and first biennial reports from Parties included in Annex I to the Convention http://unfccc.int/documentation/documents/advanced_search/items/6911.php?priref=600008209#beg
UNFCCC (2009), Copenhagen Accord, http://unfccc.int/resource/docs/2009/cop15/eng/11a01.pdf \

www.oecd.org/environment/cc/oecd‑climate‑finance‑projection.htm
www.oecd.org/environment/cc/oecd‑cpi‑climate‑finance‑report.htm
www.oecd.org/env/researchcollaborative http://oe.cd/RioMarkers www.oecd.org/environment/cc/ccxg.htm
October 2016
L I N K S
