technical notes - republic of the philippines notes this fisheries situationer for the third quarter...
TRANSCRIPT

July – September 2016 | FISHERIES SITUATIONER
TECHNICAL NOTES This Fisheries Situationer for the third quarter of 2016 presents the data on volume and value of production of fisheries during the period. It contains information on the current situation by major species of the three (3) fisheries subsector, namely: commercial and municipal fisheries, and aquaculture. It serves as output of the four (4) fisheries surveys regularly conducted by the Philippine Statistics Authority (PSA). The surveys are: Quarterly Commercial Fisheries Survey (QCFS), Quarterly Municipal Fisheries Survey (QMFS), Quarterly Inland Fisheries Survey (QIFS) and Quarterly Aquaculture Survey (QAqS).
The QCFS gathers data on volume of unloading on sample traditional landing centers of the subsector. The sample landing centers were selected using stratified simple random sampling method. A structured survey form, QCFS Form 1, is used. Five (5) key informants per landing center are the respondents to the survey. The information being gathered are volume of unloading and price per kilogram of top 31 species and those under the others category. In addition, data are collected from the administrative records of non-traditional landing centers such as those that are managed by the Philippine Fisheries Development Authority (PFDA), local government unit (LGU) and private. The survey is conducted in 59 provinces.
The QMFS is undertaken in similar manner as commercial fisheries in terms of
sampling design, data collection and species coverage. However, interview is conducted on sample municipal traditional landing centers using QMFS Form 1. Data gathering activities from administrative records are conducted for PFDA and LGU managed landing centers, whichever is applicable. There are 67 provinces covered for this undertaking.
The volume of catch of inland fishing households are obtained through the QIFS.
Simple random sampling was employed in the selection of sample inland fishing household. QIFS Form 1 is utilized to obtain data from household head or any knowledgeable member of the sample household. The survey form captures the volume of catch and price of 34 inland species in 76 provinces.
The QAqS provides the volume and value of production for the aquaculture
subsector. There are 13 aquafarm types namely: brackishwater fishpond, pen and cage; freshwater fishpond, pen and cage; marine pen and cage; oyster; mussel; seaweed; rice fish and small farm reservoir (SFR). For each aquafarm type, municipalities belonging to the cumulative share of 80% to total aquafarm area were taken as samples. For each sample municipalities, 8 - 5 sample aquafarms were selected. The respondents are the owner, operator and/or caretaker of the sample aquafarms. The survey covers 17 species in 82 provinces.

July – September 2016 | FISHERIES SITUATIONER
Prior to the conduct of the surveys, orientation/briefing of field staff and SRs are
conducted to discuss the accomplishment of the survey forms and data collection procedures. Field staffs are assigned to supervise the entire operations. To ensure the accuracy of gathered data, spot checking and back-checking were done in selected provinces.
As a form of quality control, there are three (3) levels of data review, which are
provincial, regional and national. Data are checked as to accuracy, completeness and consistency during each stage. The process involves thorough data analysis with information and indicators like historical data, weather conditions, pests and diseases, government programs, policies and regulations and other auxiliary data.
The data sets are classified according to the Philippine Geographic Classification Code (PSGC).

July - September 2016 | FISHERIES SITUATIONER
HIGHLIGHTS
Volume of Production by Subsector and by Species, Philippines, July-September 2015-2016
-4
-3
-2
-1
0
1
2
3
2015 2016
1.07
(3.77)
pe
rce
nt
FISHERIES
-4
-3
-2
-1
0
1
2
3
2015 2016
1.96 2.68
pe
rce
nt
COMMERCIAL FISHERIES
-10
-8
-6
-4
-2
0
2
2015 2016
(1.59)
(9.39) pe
rce
nt
MUNICIPAL FISHERIES
During the third quarter of 2016, total fishery production displayed a down trend of 3.77 percent compared with the same period of the previous year. This may be attributed to the decreased in production for municipal fisheries (-9.39%) and aquaculture (-3.68%). By species, seaweed (-2.57%, carp (-0.92%), yellowfin tuna (-0.77%) and roundscad (-0.30%) contributed in the decline of production.
Commercial fisheries expanded its output by 2.68 percent to 272.72 thousand metric tons during the period from 265.59 thousand metric tons a year ago. More unloadings in General Santos fish port was noted. In Zamboanga Peninsula, abundance of big-eyed scad, crevalle, Indian mackerel and tuna species resulted to more catch. In addition, active safeguarding by Bantay Dagat personnel contributed in the prevention of encroachment of transient fishing vessels. (Table 1)
Municipal fisheries production decreased by 9.39 percent during the third quarter of 2016, registering to 283.73 thousand metric tons from 313.14 thousand metric tons of the same period last year. Of the volume, 85.1 percent came from unloadings in municipal landing centers while the rest were caught from inland bodies of water. Lesser fishing activities were noted in most regions as rough seas brought about by southwest monsoon that prevailed during the period. (Table 1)
Harvests from aquaculture went down by 3.68 percent at 454.5 thousand metric tons from the previous year’s level of 471.84 thousand metric tons. Seaweed production declined in ARMM Zamboanga Peninsula because of high cost of planting materials and low buying price of traders. (Table 1)
1
-4
-3
-2
-1
0
1
2
3
2015 2016
2.40
(3.68)
pe
rce
nt
AQUACULTURE

July - September 2016 | FISHERIES SITUATIONER
PRODUCTION OF MAJOR SPECIES
2
Milkfish (Bangus)
Total production of milkfish on the third quarter
of 2016 was 108.6 thousand metric tons. This
was up by 3.88 percent compared with its 2015
level.
Of the total milkfish produced, CALABARZON
and Western Visayas Regions contributed mainly
to the increase in production.
Increase in stocking density due to availability of
stocking materials was reported in Quezon.
Moreover, resumption of fishponds previously
stop in operations also contributed to the
increase in production.
In Western Visayas, sufficient growth of natural food and good farm management resulted to high survival rate of species were noted in Aklan and Capiz.
On the other hand, drop in milkfish production was experienced in MIMAROPA and Davao Regions.
Temporarily stop operations of some farms in Mindoro Occidental because of limited supply and high cost of material inputs. Furthermore, some operators from brackishwater fishponds opted to harvest next quarter for good price.
In Davao del Sur, production of milkfish declined by 7.81 percent because more operators shifted from grow-out to “garungan” culture i.e., juvenile size of milkfish, for better income. In addition, prices went down due to small sizes of harvested milkfish.
51
52
53
54
55
2014 2015 2016
54.02 54.48
52.59
'00
0 M
T
Tilapia: Volume of Production, Philippines, July - September 2014-2016
Tilapia
Tilapia production this quarter of 52.6 thousand metric tons, experienced a production setback of 3.47 percent.
The highest decrease in tilapia production was noted in CALABARZON where fish pens in Rizal province were affected by hot weather conditions during the previous quarter.
SOCCSKSARGEN reported decrease in area harvested in Sultan Kudarat due to inadequacy and high price of tilapia fingerlings. Also, smaller sizes of species were harvested during the quarter.
In Bicol Region, less area in operation was reported in Camarines Sur due to low water level brought about by prolonged hot weather conditions.
In contrast, better tilapia production in Central Luzon as more freshwater fishponds in Nueva Ecija reported simultaneous harvesting while in Pampanga, early harvesting was accounted because of good price of tilapia in the market. Moreover, more catch from rivers and swamps as an aftermath of “habagat”.
In Ilocos Region, more tilapia species called “mul-mul” were harvested and dispersed by BFAR.
On the other hand, sustained demand for tilapia motivated farmers in ARMM particularly, Maguindanao to invest.
100
102
104
106
108
110
2014 2015 2016
103.71 104.54
108.60
'00
0 M
T
Milkfish: Volume of Production, Philippines, July - September 2014-2016

July - September 2016 | FISHERIES SITUATIONER
The decline in CALABARZON production was due to lesser emergence of school of fish in commercial fishing grounds of Lamon Bay and Tayabas Bay area attributed to warm water. In Quezon, lesser number of fishing days was observed due to dry-docking and the transfer of fishing operations in other fishing grounds.
In ARMM, decreased production of roundscad was brought about by dry-docking and temporarily no operation of some commercial fishing boats in Basilan
Also, unloadings in Zamboanga Peninsula better price was noted, specifically in Zamboanga City.
Meanwhile in Bicol Region, lesser catch thus, lesser unloadings of the species was recorded by both commercial and municipal fishermen caused by rough seas during the period.
On the contrary, bulk of unloadings for roundscad in NCR was attributed to more appearance of the species in the fishing ground and more unloadings coming from Bulacan and Zambales during the period.
9.50
10.00
10.50
11.00
2014 2015 2016
10.64 10.87
10.06
'00
0 M
T
Tiger Prawn: Volume of Production, Philippines, July - September 2014-2016
Tiger Prawn
Production of tiger prawn, at around 10,057 metric tons, plunged by 7.50 percent from its 2015 same quarter level.
Of the total volume, 99.72 percent was produced from aquafarms.
Shortfalls in tiger prawn production of Zamboanga Peninsula, Central Luzon and Ilocos Region pulled down
the overall output.
Reduction in area was consequently due to flashflood and rehabilitation of some fishponds in Zamboanga del Sur. Also, operators stocked less as there was scarcity in supply of prawn fry.
In Pampanga, some prawn stocks were affected either with yellow head disease (YHD) or the low water salinity caused by “habagat” (frequent rains). In Bulacan, the sudden change in weather, that is extreme heat after sudden rains, resulted in mortality of stocks.
In Pangasinan, high water temperature in fishponds accounted for slow growth of stocks, thus, smaller sizes harvested.
Meanwhile, stocking density increased in Caraga and Northern Mindanao prompted by demand for export. Additional operators engaged in Agusan del Norte while in Lanao del Norte, the prevailing good weather conditions produced quality stocks.
Also, in Quezon province in CALABARZON, good water salinity resulted in high survival rate of tiger prawns. The operators’ proper pond maintenance also lessened the incidence of soft-shelled virus.
45
50
55
2014 2015 2016
54.15 52.35
49.20
'00
0 M
T
Roundscad: Volume of Production, Philippines, July - September 2014-2016 Roundscad (Galunggong)
Roundscad volume of production continued to perform negatively from 3.32 percent to 6.01 percent with an estimated output of 49,205 metric tons during the period.
Commercial subsector accounted to 70 percent of the total roundscad production.
3

July - September 2016 | FISHERIES SITUATIONER
Yellowfin Tuna (Tambakol/Bariles)
During the third quarter of 2016, yellowfin tuna at 26 thousand metric tons suffered production losses of 23.86 percent.
Commercial fisheries subsector contributed 64.11 percent of the total yellowfin tuna production while the rest came from municipal subsector at 35.89 percent.
Downtrend in SOCCSKSARGEN was notes as decreased volume of unloadings at the commercial landing centers was recorded in South Cotabato as a result of limited fishing trips to the high seas because of strong winds and currents during the months of July and August.
0
20
40
2014 2015 2016
32.55 33.91 25.82
'00
0 M
T
Yellowfin Tuna: Volume of Production, Philippines,
July - September 2014-2016
In MIMAROPA, production of yellowfin tuna showed a decrement in Palawan which was attributed to lesser fishing trips of municipal fishing boats due to rough seas caused by southwest monsoon and low pressure area.
The “payaos” (fish aggregating device) that were either lost or damaged by the cargo vessels that pass along the municipal fishing grounds of Ilocos Norte lessened the appearance of school of fish thus, pulled down its production in Ilocos Region during the quarter.
On the other hand, more catch of the species was unloaded in the private landing centers in Zamboanga Peninsula
More appearance of yellowfin tuna in CALABARZON was observed in due to availability of forage fish especially in Quezon.
Skipjack
Skipjack production was estimated at 59 thousand metric tons which recorded a two-digit increase of 10.29 percent.
The greater portion of its total production of 87.35 percent was shared by the commercial fisheries sub-sector.
Production rise was observed in SOCCSKSARGEN where more frozen tuna for canneries was unloaded in the landing centers of South
Cotabato.
oduction of skipjack was estimated at 48 thousand metric tons which registered a double-digit decrease of 31.14 percent.
Bigger part of its total production (84.09 percent) was unloaded at the commercial fish landing centers.
The biggest drop in production came from SOCCSKSARGEN. Less frozen tuna was unloaded in the landing centers of South Cotabato which was affected by continuous ban of fishing in Indonesian waters.
45
50
55
60
2014 2015 2016
52.21 53.53
59.04
'00
0 M
T
Skipjack: Volume of Production, Philippines, July - September 2014-2016
In Zamboanga Peninsula, production increment was credited to the favorable catch at the private landing centers located in Zamboanga City.
Also, the abundant catch of skipjack in the landing centers of Basilan and Sulu was the main factor for the positive growth of production in ARMM.
Despite of the increases in some regions, Eastern Visayas posted a slight reduction in production for marine municipal fisheries subsector. This was caused by the temporary stop operation of some fishing boats in Eastern Samar for repair.
In addition, less emergence of this species in the commercial fishing grounds of Quezon resulted to negative growth in CALABARZON. Also, fishing days were lessened due to dry docking of some fishing boats while others transferred fishing operation to other fishing grounds.
4

July - September 2016 | FISHERIES SITUATIONER
260
280
300
320
2014 2015 2016
300.55 304.22
277.22
'00
0 M
T
Seaweed: Volume of Production, Philippines, July - September 2014-2016
Frigate Tuna (Tulingan)
Frigate tuna production was about 30 thousand
metric tons which registered a slight increase of
0.27 percent over last year’s level.
Large share of frigate tuna unloadings came from
the commercial fisheries sector at 56.41 percent
and the remaining was from municipal fisheries.
The regions that contributed to the positive
growth were SOCCSKSARGEN, NCR and Central
Visayas.
30.00
30.20
30.40
30.60
2014 2015 2016
30.56
30.22 30.31
'00
0 M
T
Frigate Tuna: Volume of Production, Philippines, July - September 2014-2016
In SOCCSKSARGEN, production of frigate tuna went up due to more appearance of the species in the
fishing grounds of South Cotabato.
More unloadings of frigate tuna was observed in NCR due to seasonality of the species.
More fishing trips in Central Visayas due to the support of fishing gears and motor boat materials from
BFAR RFO 7 particularly to the municipal fishermen in Cebu.
However, the undersized species caught by municipal fishing boats in Zamboanga del Sur was the main
reason of the production shortfall in Zamboanga Peninsula.
Also, lean season and rough coastal water resulted to less fishing trips in ARMM provinces like Basilan
and Lanao del Sur.
Continuous decline in production was experienced in Tawi-Tawi because of the decreasing price from traders. Also, most of the seaweed growers in Basilan temporarily stopped operation due to lack of capital.
High cost of planting materials and low buying price of traders prevented operation of some seaweed farms in Zamboanga City.
All provinces in MIMAROPA reported low harvest. The reasons were insufficient and poor quality of planting materials as an effect of the past El Niño in Palawan; seaweed areas damaged by flood in Romblom and lack of propagules and rotten yield due to water salinity in Occidental Mindoro.
However, slight increase was reported in Central Visayas particularly in Bohol due to availability of planting materials and paraphernalia distributed by BFAR.
In addition, nominal growth was observed in Eastern Visayas specifically in Leyte which was attributed to less existence of “ice-ice” disease in most seaweed farms.
5
Seaweed
The production of seaweed for this quarter was about 277 thousand metric tons, posted a negative growth of 8.88 percent compared from last year’s same period.
Major portion of the decrease came from the regions of CALABARZON, ARMM, Zamboanga Peninsula and MIMAROPA.
Decreased production in Quezon was caused by unavailability of planting materials of Cottonii variety due to the presence of ice-ice disease thus, most seaweed farms ceased operation during the period.

July - September 2016 | FISHERIES SITUATIONER
Indian Sardines (Tamban)
Minimal decrease of 1.13 percent was observed in unloadings of indian sardines at 87.9 thousand metric tons during the quarter.
The bulk of production of indian sardines came from commercial fisheries subsector which contributed 79.19 percent to the total volume of the species unloaded.
Negative growth in output was recorded in Zamboanga Peninsula because of smaller sizes of catch that did not conform to the size prescribed by Zamboanga City private landing centers.
In CALABARZON, drop in fish catch was traced to less emergence of this species during the quarter attributed to scarcity of food. Moreover, migratory species as such, did not stay in one place.
Lean catch was also noted in the provinces of Bicol Region. Lesser fishing trips brought about by southwest monsoon and dry docking of some fishing boats for repair in Albay, Camarines Norte and Masbate.
On the contrary, the Navotas Fishport in NCR exhibited a positive growth because of increased unloadings of fishing boats coming from Bulacan and Zambales due to high buying price during the period.
Big-eyed Scad (Matangbaka)
Big–eyed scad production at 36 thousand metric
tons displayed improvement in its performance at
12.01 percent this quarter.
More unloadings of big–eyed scads in municipal
landing centers at 56.90 percent to the total
production while the remaining 43.10 production
came from commercial fisheries.
Regions contributing to the positive performance
were Zamboanga Peninsula, Davao Region and
Central Visayas
70
75
80
85
90
2014 2015 2016
79.05
88.89 87.89
'00
0 M
T
Indian Sardines: Volume of Production, Philippines, July - September 2014-2016
The use of newly repaired nets designed for catching big–eyed scad resulted to more catch in private
landing centers and PFDA in Zamboanga City.
Heavy unloadings from municipal fishing boats in Davao del Norte and Davao Oriental was due to
seasonality resulted to more appearance of this species in the fishing ground.
Meanwhile, the gain of 21.30 percent of Central Visayas over the last year’s volume of unloadings in
Central Visayas was attributed to more fishing trips due to the prevailing good weather condition in
Bohol and BFAR supports on boats and gears in Cebu.
On the other hand, negative performance in ARMM specifically in Basilan province was due to rough
costal water and lesser appearance of the species.
In CALABARZON, the diminishing production in Quezon was attributed to less fishing days due to
disappearance of school of fish and transfer of fishing operations in other fishing grounds.
25
30
35
40
2014 2015 2016
29.86 31.97
35.81
'00
0 M
T
Big-eyed Scad: Volume of Production, Philippines, July - September 2014-2016
6
July - September 2016 | FISHERIES SITUATIONER
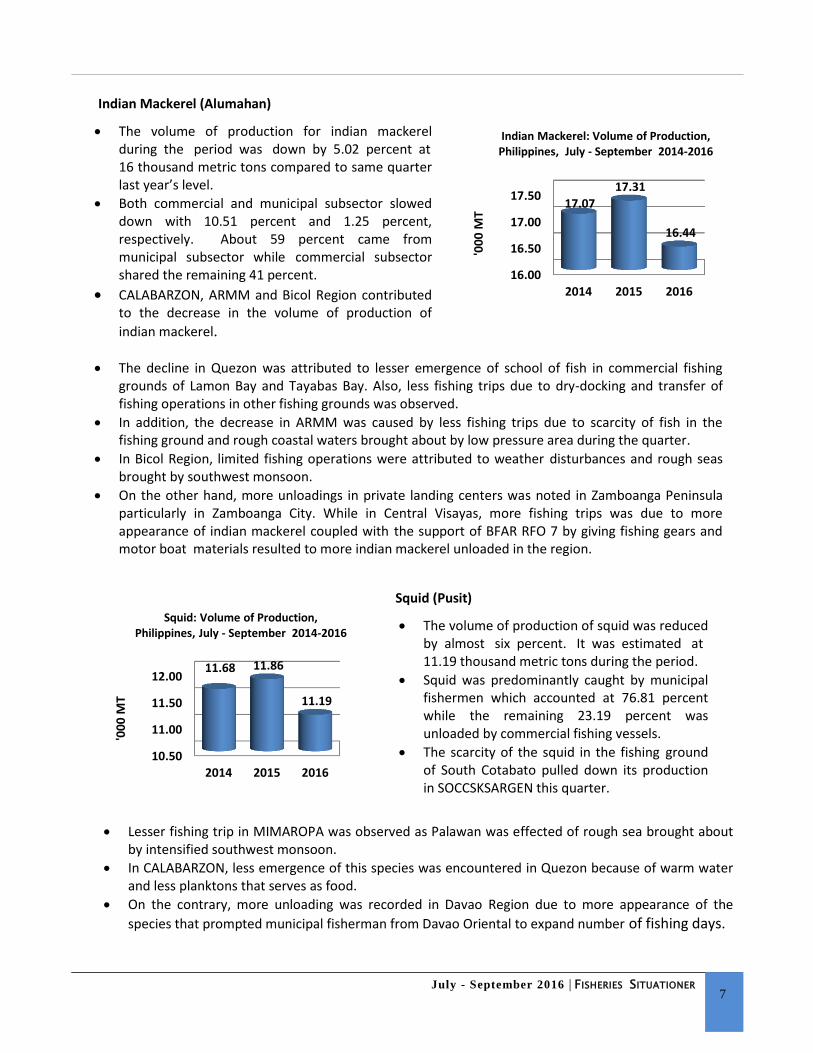
Indian Mackerel (Alumahan)
The volume of production for indian mackerel during the period was down by 5.02 percent at 16 thousand metric tons compared to same quarter last year’s level.
Both commercial and municipal subsector slowed down with 10.51 percent and 1.25 percent, respectively. About 59 percent came from municipal subsector while commercial subsector shared the remaining 41 percent.
CALABARZON, ARMM and Bicol Region contributed to the decrease in the volume of production of
indian mackerel.
16.00
16.50
17.00
17.50
2014 2015 2016
17.07
17.31
16.44
'00
0 M
T
Indian Mackerel: Volume of Production, Philippines, July - September 2014-2016
The decline in Quezon was attributed to lesser emergence of school of fish in commercial fishing grounds of Lamon Bay and Tayabas Bay. Also, less fishing trips due to dry-docking and transfer of fishing operations in other fishing grounds was observed.
In addition, the decrease in ARMM was caused by less fishing trips due to scarcity of fish in the fishing ground and rough coastal waters brought about by low pressure area during the quarter.
In Bicol Region, limited fishing operations were attributed to weather disturbances and rough seas brought by southwest monsoon.
On the other hand, more unloadings in private landing centers was noted in Zamboanga Peninsula particularly in Zamboanga City. While in Central Visayas, more fishing trips was due to more appearance of indian mackerel coupled with the support of BFAR RFO 7 by giving fishing gears and motor boat materials resulted to more indian mackerel unloaded in the region.
Lesser fishing trip in MIMAROPA was observed as Palawan was effected of rough sea brought about by intensified southwest monsoon.
In CALABARZON, less emergence of this species was encountered in Quezon because of warm water and less planktons that serves as food.
On the contrary, more unloading was recorded in Davao Region due to more appearance of the
species that prompted municipal fisherman from Davao Oriental to expand number of fishing days.
10.50
11.00
11.50
12.00
2014 2015 2016
11.68 11.86
11.19
'00
0 M
T
Squid: Volume of Production, Philippines, July - September 2014-2016
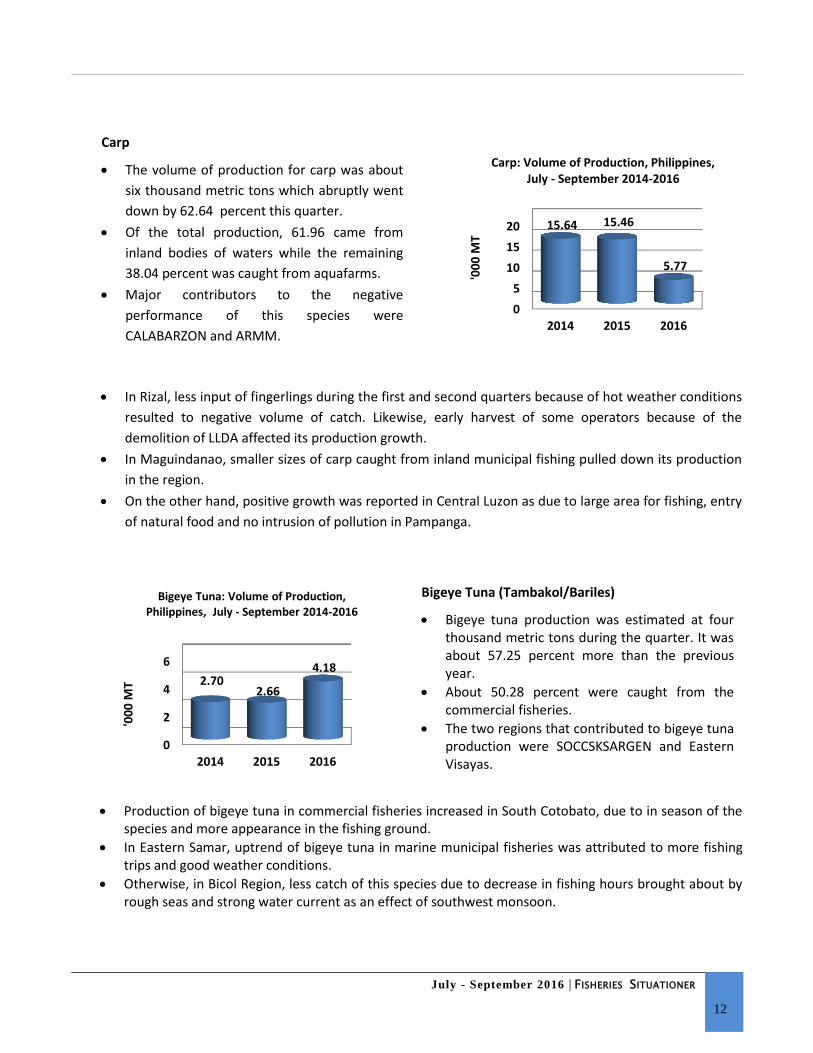
Squid (Pusit)
The volume of production of squid was reduced by almost six percent. It was estimated at 11.19 thousand metric tons during the period.
Squid was predominantly caught by municipal fishermen which accounted at 76.81 percent while the remaining 23.19 percent was unloaded by commercial fishing vessels.
The scarcity of the squid in the fishing ground of South Cotabato pulled down its production in SOCCSKSARGEN this quarter.
7

July - September 2016 | FISHERIES SITUATIONER
Mudcrab
Mudcrab production steadily moved up to almost 4.5 thousand metric tons, about six (6) percent higher than its 2015 output.
Production share was dominated by aquaculture at 94.08 percent.
The combined outputs of Northern Mindanao, Zamboanga Peninsula and CALABARZON settled the uptrend performance this period.
Production surplus in Lanao del Norte resulted from increased stocking density as well as bigger sizes produced from crablets of king crab variety. In Misamis Occidental, area expansion accounted for its production growth this period.
Negros Occidental pulled down threadfin bream production in NIR as an effect of “habagat” resulted to less catch of fishing boats using trawl and other net gears.
Reduced production in Western Visayas was attributed mainly to rough seas which hampered fishing activity specifically in Guimaras and Antique.
On the opposite side, production increment was reported in Bicol Region. Proper timing of school of threadfin species was encountered in the fishing grounds of Masbate and Camarines Sur.
Threadfin Bream (Bisugo)
Threadfin bream production for this quarter was about 10 thousand metric tons which registered a 3.61 percent reduction.
The downward trend in the total production came from marine municipal fisheries sector at 86.46 percent.
All provinces of MIMAROPA showed negative growth particularly in Palawan which was affected by rough seas brought about by intensified southwest monsoon that prevented fishermen to frequent fishing.
Uptrend in Zamboanga del Sur was traced to the increased stocking density given the availability of abundant supply.
There was high survivability of mudcrabs in Quezon as an effect of prevailing good weather condition. Also, operators were motivated to put up more stocks due to sufficient supply of crablets.
On the other hand, lesser catch of mudcrabs was observed in NIR particularly Negros Occidental when most households concentrated in sugarcane production than in fishing during the latter part of the quarter. In Bicol Region, more stocks intended for third quarter harvest were already harvested during the second quarter in Sorsogon. In Cagayan Valley, operators utilized lesser areas due to warm weather condition during the stocking period.
9.00
9.50
10.00
10.50
11.00
2014 2015 2016
9.97
10.96
10.56
'00
0 M
T
Threadfin Bream: Volume of Production, Philippines, July - September 2014-2016
8
3.60
3.80
4.00
4.20
4.40
4.60
2014 2015 2016
4.02
4.19
4.46
'00
0 M
T
Mudcrab: Volume of Production, Philippines, July - September 2014-2016

July - September 2016 | FISHERIES SITUATIONER
0
10
20
30
2014 2015 2016
24.21 18.83 18.64
'00
0 M
T
Fimbriated Sardines: Volume of Production, Philippines,
July - September 2014-2016
Fimbriated Sardines (Tunsoy)
Production of fimbriated sardines reached almost 19 thousand metric tons this quarter, a little less (0.96 percent) than the previous year.
Of total volume of fimbriated sardines unloaded, 53 percent came from commercial fisheries and 47 percent for municipal fisheries subsector.
Negative output of the species was contributed by the NCR brought about by less catch of marine municipal fishing boats due to insufficient supply of fimbriated sardines in the fishing ground.
In ARMM, the production in Basilan went down because of lean season and rough coastal water condition during the period.
Lesser appearance of school of fish in the fishing grounds was noticed in Central Luzon specifically, Bataan.
On the contrary, volume of catch in Central Visayas showed a positive performance over the same quarter last year which was attributed to more fishing trips of commercial fishing vessels due to more appearance of the species and support of fishing gears and motor boat materials from BFAR RFO 7 to marine municipal fishermen in Cebu.
Anchovies (Dilis)
Anchovies volume of production of 11 thousand metric tons went down by 16.80 percent compared to the level during the same quarter last year.
Out of the total production, about 63 percent was unloaded at the municipal landing centers.
There was a decline in production in Western Visayas particularly in Iloilo and Capiz. The reduction owed to the occurrence of weather disturbances that forced municipal fishermen to limit their fishing trips especially those using beach seines and drag nets.
0
5
10
15
2014 2015 2016
14.74 13.85
11.53
'00
0 M
T
Anchovies: Volume of Production, Philippines, July - September 2014-2016
Majority of the Bicol provinces posted negative output contributed mostly by commercial fisheries sector. The decline was caused by the occurrence of southwest monsoon leading to rough sea waters.
On the other hand, production increases were noted in NIR and Zamboanga Peninsula due to seasonality of the species led to more catch and unloading of anchovies this quarter.
9

July - September 2016 | FISHERIES SITUATIONER
6
8
10
2014 2015 2016
8.99 8.48
9.48
'00
0 M
T
Indo-pacific Mackerel: Volume of Production, Philippines, July - September 2014-2016
Indo-pacific Mackerel (Hasa-hasa)
The volume of production for indo-pacific mackerel with an estimated nine thousand metric tons recovered from negative growth last year to positive performance of 11.82 percent during the current year.
The bulk of indo-pacific mackerel production came from marine municipal subsector which shared about 66 percent of the total production.
The regions that pulled up the performance of indo-pacific mackerel species were MIMAROPA, NIR and CALABARZON.
More occurrence thus, more catch before the onset of rough seas during the period was reported in
Palawan.
In Negros Occidental, more catch and more unloadings in commercial landing centers were cited.
Moreover, the availability of forage fish in the municipal waters of Quezon that served as food contributed to the increase in the production of indo-pacific mackerel.
However, less appearance of school of fish in the fishing grounds of Bataan and Iloilo was noted that brought down production in Central Luzon and Western Visayas regions, respectively.
Blue Crab (Alimasag)
The total production of blue crab was around three percent higher compared to same period last year. It was estimated at almost seven thousand metric tons during the period.
Of the total blue crab production, 95.19 percent was caught by marine municipal fishermen while the remaining portion came from commercial subsector.
In MIMAROPA, decline in production was reported because of strong current of sea waters resulted to lesser fish catch in Palawan.
Less catch in NIR provinces was attributed to scarcity of crab pots this year.
The decreased production in Eastern Visayas was caused by rough seas as effects of southeast monsoon winds from time to time within the reference period.
On the other hand, Western Visayas displayed positive growth as more unloading in Iloilo because of better price from traders.
6.50
7.00
7.50
8.00
2014 2015 2016
7.60
7.11
6.88
'00
0 M
T
Blue Crab: Volume of Production, Philippines, July - September 2014-2016
11
10

July - September 2016 | FISHERIES SITUATIONER
0
5
10
2014 2015 2016
7.78 7.93
9.38
'00
0 M
T
Eastern Little Tuna: Volume of Production, Philippines, July - September 2014-2016
Eastern Little Tuna (Bonito)
The volume of production of eastern little tuna was up by 18.26 percent compared to same period last year. It was estimated at nine thousand metric tons this quarter.
Commercial fisheries subsector shared 61.65 percent while the remaining 38.35 was contributed by municipal subsector.
Big increase was reported in SOCCSKSARGEN due to availability of the species in municipal fishing grounds of South Cotabato.
More fishing trips were observed in Eastern Visayas due to good weather conditions and seasonality of the species mostly in Eastern Samar.
The positive production growth in MIMAROPA was attributed to more occurrences of the species in Palawan municipal waters and mostly in good sizes.
On the other hand, downward trend was noticed in Bicol Region due to less catch caused by non-seasonality of the species especially in Masbate.
Grouper (Lapu-lapu)
The volume of production of grouper was about four thousand metric tons which went down by 10.96 percent from last year’s level.
The contribution of marine municipal fisheries to the total production was as large as 80.32 percent.
CALABARZON, Zamboanga Peninsula and MIMAROPA contributed mainly to the decline in production of grouper.
The production in Quezon diminished as an effect of warm water temperature and less planktons that serves as food for fish at the marine municipal fishing grounds.
3.603.80
4.00
4.20
4.40
4.60
2014 2015 2016
4.42 4.52
4.03
'00
0 M
T
Grouper: Volume of Production, Philippines, July - September 2014-2016
13
Less frequency of fishing trips of some marine municipal fishing boats because of the repair and maintenance of gears slowed down production in Zamboanga Sibugay.
In Palawan, decline production was attributed to closed season for grouper from 16 June to 31 August 2016.
However, more unloading at the PFDA in South Cotabato coupled with availability of buyers pulled up production in SOCCSKSARGEN at the commercial fisheries sector. Moreover, slight growth in Caraga was due to more catch unloaded at the municipal landing center.
11
July - September 2016 | FISHERIES SITUATIONER
In Rizal, less input of fingerlings during the first and second quarters because of hot weather conditions
resulted to negative volume of catch. Likewise, early harvest of some operators because of the
demolition of LLDA affected its production growth.
In Maguindanao, smaller sizes of carp caught from inland municipal fishing pulled down its production
in the region.
On the other hand, positive growth was reported in Central Luzon as due to large area for fishing, entry
of natural food and no intrusion of pollution in Pampanga.
0
5
10
15
20
2014 2015 2016
15.64 15.46
5.77
'00
0 M
T
Carp: Volume of Production, Philippines, July - September 2014-2016
Carp
The volume of production for carp was about
six thousand metric tons which abruptly went
down by 62.64 percent this quarter.
Of the total production, 61.96 came from
inland bodies of waters while the remaining
38.04 percent was caught from aquafarms.
Major contributors to the negative
performance of this species were
CALABARZON and ARMM.
Bigeye Tuna (Tambakol/Bariles)
Bigeye tuna production was estimated at four thousand metric tons during the quarter. It was about 57.25 percent more than the previous year.
About 50.28 percent were caught from the commercial fisheries.
The two regions that contributed to bigeye tuna production were SOCCSKSARGEN and Eastern Visayas.
0
2
4
6
2014 2015 2016
2.70 2.66
4.18
'00
0 M
T
Bigeye Tuna: Volume of Production, Philippines, July - September 2014-2016
Production of bigeye tuna in commercial fisheries increased in South Cotobato, due to in season of the species and more appearance in the fishing ground.
In Eastern Samar, uptrend of bigeye tuna in marine municipal fisheries was attributed to more fishing trips and good weather conditions.
Otherwise, in Bicol Region, less catch of this species due to decrease in fishing hours brought about by rough seas and strong water current as an effect of southwest monsoon.
12

July - September 2016 | FISHERIES SITUATIONER
Mudfish
Mudfish production was registered at two
thousands metric tons. There was a 26 percent
decline from last year’s level.
Around 95.99 percent were caught from the
inland bodies of water.
The three regions that contributed to the
decrease in production were ARMM,
SOCCSKSARGEN and Central Luzon.
0
1
2
3
2014 2015 2016
2.75 2.67 1.97
'00
0 M
T
Mudfish: Volume of Production, Philippines, July - September 2014-2016
2.20
2.40
2.60
2.80
2014 2015 2016
2.61 2.72
2.48
'00
0 M
T
Catfish: Volume of Production, Philippines, July - September 2014-2016
Catfish
Catfish production was recorded at 2.5 thousand metric tons, lower by almost nine (9) percent than its 2015 level.
Inland municipal fish catch accounted 77.43 percent and aquafarm harvest, 22.57 percent of the total output.
The downtrend in CALABARZON, Cagayan Valley and Northern Mindanao production influenced the overall performance of catfish this quarter.
In Laguna, there was less appearance of catfish (kanduli) in inland waters.
Maguindanao, was the highest contributor to the decrease in production. Mudfish was not in
season thus, less appearance in the fishing ground.
In North Cotobato, the production of mudfish went down which was attributed to higher average
price and less production this quarter.
On the contrary, better production in CALABARZON, was observed because of good demand and
more fisherfolk used specific gear in Batangas.
The low catch of catfish in Cagayan and Nueva Vizcaya was traced to some dried up fishing grounds, such as, canals, creeks, dam, SWIP, rice fields and other tributaries. In Quirino, stocks of catfish in fishing grounds were diminishing. Catfish caught in Isabela inland waters were reportedly of smaller sizes.
In Bukidnon, there were less fishing days as some fisher folks engaged in harvesting activities.
However, demand drove Western Visayas operators to expand area and stocking rate. In addition, inland fish catch increased due to more appearance in Iloilo.
Occurrence of early rains in Central Luzon resulted to more fishing areas in Nueva Ecija. Catch (hito) were of bigger sizes. Also, there were more harvests of stocked catfish and natural entry from fishponds. Abundance of natural food was observed in inland municipal waters in Pampanga.
In SOCCSKSARGEN, the more catch in North Cotabato was due to in-season of catfish.
13

July - September 2016 | FISHERIES SITUATIONER
Endeavor Shrimp and White Shrimps
For the 3rd quarter of 2016, production estimates for endeavor prawn grew by 2.37 percent. On the contrary, harvested white shrimps went down by 11.61 percent.
The utmost regions that contribute to the increase in production of endeavor prawn were from CALABARZON and Western Visayas.
0.35
0.40
0.45
0.50
2014 2015 2016
0.48
0.41 0.42
'00
0 M
T
Endeavor Prawn: Volume of Production, Philippines, July - September 2014-2016
Gourami
During this quarter, gourami production was estimated at one thousand metric tons. It was about 18.27 percent decrease from same quarter last year.
Of the total production, 99.53 percent of gourami was caught from inland bodies of water.
The two regions that contributed to the negative growth were Central Luzon and ARMM.
0.00
0.50
1.00
1.50
2.00
2014 2015 2016
1.61 1.31
1.07
'00
0 M
T
Gourami: Volume of Production, Philippines, July - September 2014-2016
In Maguindanao and Pampanga, gourami was not in season this quarter resulted to less appearance in the fishing ground.
However, increase in production was reported in SOCCSKSARGEN particularly in North Cotobato, brought about by favorable weather conditions that encouraged fishermen to do more activity.
14
Good water salinity resulted to more tide borne species were harvested in Quezon and some part of Iloilo during the period.
In contrast, production of white shrimps continuously dropped for the past three (3) years because of less natural entry of species, thus less harvests in the ponds.

July - September 2016 | FISHERIES SITUATIONER
0
1
2
3
4
2014 2015 2016
2.34 2.36
3.26
'00
0 M
T
Mussel: Volume of Production, Philippines, July - September 2014-2016
Oyster and Mussel
Production growth of oyster and mussel this quarter was up by 44.44 percent and 38.22 percent, respectively. About 5.5 thousand metric tons output from oyster farms while 3.3 thousand metric tons of mussels were harvested.
Almost 90 percent of oysters were cultured in aquafarms while all mussels were accounted to aquaculture sector.
Positive performances of oyster production were reported in Western Visayas provinces of Iloilo and Aklan. Oyster spats was distributed by LGU to most farm operators and bigger sizes and good quality of species produced attracted more buyers from Manila and Iloilo.
Improvement in mussel production reflected in Eastern Visayas was due to some operators re-
opened their farms because of less weather disturbances in Samar.
On the other hand, declined production of oyster was noted in Central Visayas as some farms in
Bohol temporarily stopped operation which needed rehabilitation and reinstallation of bamboos.
Moreover, partial harvest of mussel lessened its produce in NIR.
Oyster production at 6.8 metric tons went down by 12.33 percent
0
2
4
6
2014 2015 2016
4.45 3.80
5.48
'00
0 M
T Oyster: Volume of Production,
Philippines, July - September 2014-2016
16
15

July - September 2016 | FISHERIES SITUATIONER
16
17

July - September 2016 | FISHERIES SITUATIONER
17

July - September 2016 | FISHERIES SITUATIONER
18

July - September 2016 | FISHERIES SITUATIONER
19

July - September 2016 | FISHERIES SITUATIONER
20
0
0

July - September 2016 | FISHERIES SITUATIONER
`
21
0
0

July - September 2016 | FISHERIES SITUATIONER
21
22

July - September 2016 | FISHERIES SITUATIONER
23

July - September 2016 | FISHERIES SITUATIONER
24

July - September 2016 | FISHERIES SITUATIONER
25

July - September 2016 | FISHERIES SITUATIONER
26

July - September 2016 | FISHERIES SITUATIONER
27

July - September 2016 | FISHERIES SITUATIONER
28

July - September 2016 | FISHERIES SITUATIONER
29

July - September 2016 | FISHERIES SITUATIONER
30

July - September 2016 | FISHERIES SITUATIONER
31

July - September 2016 | FISHERIES SITUATIONER

Quezon City, Philippines
20
Philippine Statistics Authority
FISHERIES SITUATIONER July – September 2016

Photos: Bluefin Tuna. Retrieved on August 8, 2016, from http://www.greenpeace.org/seasia/ph/ what-wedo/oceans/aquaculture. Lagniton, N. (24 September 2014. Taal Lake, Talisay, Batangas). Fish cages. Fisherman. Retrieved on August 8, 2016, from http://www.tao-kalikasan.org/gallery.php