technical papers - unstats.un.org · technical papers comparability of the death certificate and...
TRANSCRIPT

Technical Papers
COMPARABILITY OF THE DEATH CERTIFICATE AND THE1986 NATIONAL MORTALITY FOLLOWBACI< SURVEY
International Institute for Vital Registration and Statistics9650 Rockville Pike
Bethesda. Maryland 20B 14-3998USA
Number 68June 1997
Foreword
In any data collection system. the quality of the information collected should be one of the primaryconcerns.. In a civil registration and vital statistics system. there are a number of important usesto be made of the data. both by individuals and by the various users of the aggregated data.However. the means for assessing the accuracy of the reported vital statistics information is notoften easily available.. Vital records followback surveys provide one kind of tool for looking at thequality of the information
Vital records followback surveys are so named because they typically begin with a file of vital recordswhich provide a sampling frame from which a sample of the records are "followed back" to theinformant or provider of the information on the record This technique permits collection of moredetailed or different information than can be collected on a registration document. while at thesame time allows comparisons between the two data collection methods for selected itemsappearing in both systems
This paper reports on a study which compares the demographic data reported on a sample of deathcertificates with the responses to similar demographic items asked on a questionnaire sent to theinformants who had originally provided the data for the death certificates. Although there was noway to tell which of the two sources. registration information or survey response, was correct whenthey were not in agreement. the measure of disagreement for each item studied serves as anindicator of the quality for that item. Thus, measures of disagreement for items such as age, race,marital status. occupation. and place of death are derived from two different methodologies andat two points in time for a sample of decedents.
This paper is a somewhat abbreviated version of the following report: Poe, Gail et al Comparabilityof the death certificate and the 1986 National Mortality Followback Survey. National Center forHealth Statistics .. VITAL HEALTH STAT 2 (118) 1993
The views expressed in this report are those of the authors and do not necessarily reflect those ofthe IIVRS. There are no restrictions on the use of materials published by IIVRS
The program of IIVRS, including the publication and distribution of the Technical papers. is supportedby a grant from the United Nations Population Fund.

Introduction
Sources and limitations of data
FindingsAgeRaceHispanic originMarital status,OccupationIndustry ,Veteran statusPlace of death
Discussion
References
Table of Contents
1
1
4456789
1010
11
12
Text tablesA. Registration areas reporting age, race, Hispanic origin, marital status, occupation, industry, place of death, andveteran status on the death certificate: United States, 1986 38 Number of death certificates and completed National Mortality Followback Survey questionnaires for reportingStates and response rates by selected variables: United States, 1988 4C. Percent of informant questionnaires in agreement with corresponding death certificate with regard to age, by ageof decedent on death certificate and by race on survey questionnaire, interval between death and survey, andrelationship of informant to decedent: National Mortality Followback Survey, 1986 5o Percent of informant questionnaires in agreement with corresponding death certificate with regard to race, byrace of decedent on death certificate and by age at death, interval between death and survey, and relationship ofinformant to decedent: National Mortality Followback Survey, 1986 6E Percent of informant questionnaires in agreement with corresponding death certificate with regard to Hispanicorigin, by Hispanic origin of decedent on death certificate and by race on survey questionnaire, interval betweendeath and survey, and relationship of informant to decedent: National Mortality Followback Survey, 1986 7F Percent of informant questionnaires in agreement with corresponding death certificate with regard to maritalstatus, by marital status of decedent on death certificate and by race on survey questionnaire, interval between deathand survey, and relationship of informant to decedent: National Mortality Followback Survey, 1986 , , 8G Percent of informant questionnaires in agreement with corresponding death certificate with regard to occupation,by occupation of decedent on death certificate and by race on survey questionnaire, interval between death andsurvey, and relationship of informant to decedent: National Mortality Followback Survey, 1986 9H. Percent of informant questionnaires in agreement with corresponding death certificate with regard to industry, byindustry of decedent on death certificate and by race on survey questionnaire, interval between death and survey,and relationship of informant to decedent: National Mortality Followback Survey,198610J Percent of informant questionnaires in agreement with corresponding death certificate with regard to veteranstatus, by veteran status of decedent on death certificate and by race on survey questionnaire, interval betweendeath and survey, and relationship of informant to decedent: National Mortality Followback Survey, 1986 11K Number of responses by place of death on death certificate and on National Mortality Followback Surveyquestionnaire: United States, 1986 12
SymbolsData not availableCategory not applicableQuantity zero
o0 Quantity more than zero but less than 005Z Quantity more than zero but less than 500 where numbers are rounded to thousands
Figure does not meet standard of reliability or precision# Figure suppressed to comply with confidentiality requirements

COMPARABILITY OF THE DEATH CERTIFICATE AND THE 1986
NATIONAL MORTALITY FOLLOWBACI< SURVEYby Gail S Poe, M PH, Division of Vital Statistics; Eve Powell-Griner, Ph D, formerly with the Office of Vital
and Health Statistics; .Joseph 1< McLaughlin, Ph.D , National Cancer Institute; Paul.J Placek, PhD.Office of Vital and Health Statistics; Grey B Thompson, Ph D, formerly with the Division of Vital Statistics;
and Kathy Robinson, formerly with Information Management Services
INTRODUCTION
The death certificate is the primary source of annualmortality data in the United States (See appendix I). Thevalidity of cause-of-death information has been studiedextensively (1.2). as has the accuracy of the occupationand industry items (3-16). Less information exists on thequality of the remaining information on the deathcertificate. Two studies have compared Census BureauPopulation Study interview responses with deathcertificate entries (17 -20) In 1986, the National MortalityFollowbacl< Survey (NMFS) was conducted by theNational Center for Health Statistics (NCHS) to provide alarge amount of information, most of which is notavailable elsewhere, on a sample of deaths These dataare useful in assessing the reliability of demographic itemsreported on the death certificate
The purpose of this report is to assess the comparabilityof demographic information obtained from responses onthe death certificate with data from the 1986 NMFS.which is an independent source using a different methodof data collection, for those items common to bothsources Although it is not possible to discern whichsource of data is valid, the level of agreement sheds lighton the quality of these information systems
NOTES: The data collection agent for the survey was the Bureauof the Census Cosponsors of the survey included the HealthCare Financing Administration; the National Cancer Institute; theIndian Health Service; the National Heart. Lung, and BloodInstitute; the National Institute on Aging; the National Instituteof Child Health and Human Development; the National Instituteof Mental Health; the Veterans Administration; and the Office ofthe Assistant Secretary for Planning and Evaluation in the Officeof the Secretary of the Department of Health and HumanServices
This report was prepared in the Division of Vital Statistics of theNational Center for Health Statistics, lsadore Seeman. formerlywith the Office of Vital and Health Statistics Systems, providedoverall project direction; Steven Batman. Office of Research andMethodology. provided guidance in the design of the samplingprocedure; Ruth Parsons. Information Management Services.provided guidance on computer programming; Betty Smith,Statistical Resources Branch, Division of Vital Statistics, providedcontent review This report was edited by Margaret Avery andtypeset by Annette F Gaidurgis. Publications Branch, Division ofData Services
SOURCES AND LIMITATIONS OF DATA
The data presented in this report are based on the 1986NMFS conducted by the National Center for HealthStatistics and on the death certificates filed with Stateregistrars of vital statistics and compiled by NCHS. The1986 NMFS comprised a nationally representativesample of adults aged 25 years or over who died in 1986Oregon was not included in the survey because of theState's respondent-consent requirements., The data are,therefore, representative of deaths of adult residents inthe United States excluding Oregon. A detaileddescription of the methods and procedures used in theNMFS has been published (21)
The universe for the 1986 NMFS was composed of alldeath certificates of decedents 25 years of age or olderfiled in the United States The sampling frame consistedof death certificates selected from the 1986 CurrentMortality Sample (CMS) The CMS is al O-percentsystematic sample of death certificates received by theState vital statistics offices and transmitted to NCHS about3 months after the deaths. CMS records were selectedfor each month of the year. The total sample was 18,733decedents.. This sample included 2,274 deaths selectedwith certainly (at a sampling rate of 100 percent withinthe CMS) to meet specific research needs. The groups forwhich all deaths in the CMS were selected includedAmerican Indian, Eskimo, and Aleut decedents; all deathsdue to Asthma; deaths due to Ischemic heart disease formales 25-44 years of age and females 25-54 years ofage; and deaths for selected cancer sites.. Black decedentswere oversampled 2.9 times, and decedents under age55 were oversampled 3 1 times
The data presented in this report are not weighted. Theyreflect what actually occurred in the sample rather thanestimates of the degree of comparability from anexamination of all death certificates for u.s. residents 25years of age and older dying in 1986
It is possible, if desired, to prepare weighted estimates ofconsistency because the public-use data tape contains aweight for each record (22) 8ecause of the oversamplingof some groups that generally had slightly loweragreement rates, weighted estimates would haveproduced slightly higher overall rates of agreement. In thetables. an asterisk is shown for estimates of perce-hts in

which there are fewer than 30 cases in the denominator,because these figures do not meet standards of reliabilityor precision
An NMFS questionnaire was mailed to the deathcertificate informant usually the decadent's next of kin oranother person familiar with the decedent A followupquestionnaire was mailed for nonresponding casesTelephone and personal interviews were attempted forcases where there was no mail response
Following data collection, the questionnaire data and theCMS information were matched to the Multiple Cause ofDeath File. The primary matching criterion was that Stateof occurrence and death certificate number wereidentical; the secondary criterion was that demographicitems such as sex. date of death, age, race, and underlyingcause of death matched The primary criterion could notbe applied to Nebraska, Nevada, or New Mexico, becausethese States renumber the death certificates. Therefore,it is likely that for these three States there were somecases in which an incorrect Multiple Cause of Death Filedeath certificate was matched to the questionnaireBecause inclusion of these States increases the likelihoodthat differences in data from the certificate and thequestionnaire may be due to matching errors, tlley areexcluded from this report The total number of casesexcluded because they were from Nevada, New Mexico,and Nebraska is 285
The overall response rate for the survey was 886 percentIn addition, there was item nonresponse for both thedeath certificate and the questionnaire .. Also, not all Statescollect, code, and report all variables Table A shows, foreach variable included in this report the States that reportthat variable For each variable included in this report,table B shows:
• the number of sample cases for the reporting States• the death certificate item completion rate• the number of questionnaires completed• the questionnaire item response rate• the questionnaire effective item response rate (thepercent of cases in the reporting States for which therewas a questionnaire entry for the item)• the effective item response rate for both thequestionnaire and death certificate (the percent of allcases in the reporting States that have a response for theitem for both the death certificate and the questionnaire)
The effective response rate for both the questionnaire andthe death certificate was between 823 and 866 percentfor all items except veteran status, which was 75 7
For all variables in this report, with the exception ofveteran status. the responses from the Multiple Cause ofDeath File are compared with those from thequestionnaire Because veteran status is not included in
2
the Multiple Cause of Death File. this variable was takenfrom the CMS
In presenting the percents of responses agreeing in tablesC-J, the percents are based on the number of cases inwhich there is a response to both the questionnaire andthe death certificate Cases in which entries for an itemare blank. illegible, or othervvise unusable for either thequestionnaire or the death certificate are excluded fromboth the numerator and denominator of the percents
In comparing the two data sources, information fromdeath certificates was used as the denominator. That is.agreement levels reflect the degree to which next-of-kininformation on the questionnaire matches that from thedeath certificate Percent agreements shown are basedon the groupings shown For example, where percentagreement is shown for the 25-29-year age group, thismeans the number of cases in which the age on both thedeath certificate and the questionnaire is in the range25-29 divided by the number of cases in which the ageon the death certificate is in the range 25-29 Similarly,where the percent agreement is shown for an occupationor industry category such as "managerial andprofessional," this percent is for the group as shown-notfor less aggregated levels
Sources of error for both the death certificate andquestionnaire include reporting errors,. coding errors, andprocessing errors Except for occupation and industry,conceptually the variables are the same for both sourcesThe death certificate asked for the "usual" occupation andindustry, and the questionnaire requested information onlongest held occupation and industry in which thedecedent worked for pay "Usual occupation" on the deathcertificate is defined as the kind of work the decedent didduring most of his or her working life In addition. theplace-of-death variables differ somewhat between the twosources .. For the questionnaire, the respondent was simplyasked. "Where did the person die?" For the deathcertificate, the place of death variable is based on thelocation of death, which may be at a hospital, en route toor on arrival at a hospital, or at some other place If ahospital was cited, a distinction is made among decedentspronounced dead in the hospital or other institution, thosedead on arrival, outpatients or emergency room patients,and inpatients.
With respect to age, Hispanic origin. marital status..occupation, industry, and veteran status. codinginstructions are essentially the same for both Sources.Occupation and industry were coded according tostandard occupation and industry codes (23) There weredifferences in coding race: On the death certificate, entriessuch as "Mexican." "Cuban," and "other Hispanic" werecoded as "white"; on the questionnaire, such entries werecoded as "other" Moreover, responses that were not

~,I Table A. Registration areas reporting age, race, Hispanic origin. marital status. occupation. industry. place of death. and veteran statusi on the death certificate: United States, 1986
Place
Hispanic Martial of Veteran
Area1 Age Race origin statis Occupation Industry death status
Alabama X X XAlaska X X X X XArizona X X X X X XArkansas X X X X X XCalifornia X X X XColorado X X X X X X X XConnecticut X X X X XDelaware X X X XDistrict of Columbia X X X XFlorida X X X XGeorgia X X X X X X X XHawaii X X X X X XIdaho X X X X XIllinois X X X X X XIndiana X X X X X X X XIowa X X X X XKansas X X X X X X X XKentucky X X X X X XLouisiana X X X X XMaine X X X X X X XMaryland X X X XMassachusetts X X X XMichigan X X X X XMinnesota X X X XMississippi X X X X X XMissouri X X X X X X XMontana X X X X XNew Hampshire X X X X X X XNew.Jersey X X X X XNew York X X X X XNorth Carolina X X X X XNorth Dakota X X X X X XOhio X X X X X X X XOklahoma X X X X XPennsylvania X X X X XRhode Island X X X X X X XSouth Carolina X X X X X X XSouth Dakota X X X XTennessee X X X X X X XTexas X X X X XUtah X X X X X X X XVermont X X X X X X XVirginia X X X X XWashington X X X X XWest Virginia X X X X XWisconsin X X X X X X XWyoming ... X X X X X X
1Oregon. Nebraska. Nevada. and New Mexico were excluded from the comparability analysis in this report because Ore90n·s confidentialityrequirements precluded its participation in the 1986 National Mortality Followback Survey. and the primary matching criteria could not be applied forthe other three States because they reissue death certificate numbers after the processing of the Current Mortality Sample
3

Table 8 Number of death certificates and completed National Mortality Followback Survey questionnaires for reporting States andresponse rates by selected variables: United States, 1986
Variable
AgeRaceHispanic originMarital statusOccupationIndustryPlace of deathVeteran status
QuestionnaireDeath certificate Completed questionnaire and certificate
Item Item Effective item Effective item
Total completion 7 Total response? response.'] response4
Number Percent Number ~ Percent Percent
18,448 998 16,339 979 867 86518,448 5999 16.339 979 867 866
8,356 980 7.568 941 852 83.718.448 993 16.339 97..6 865 8604.525 963 4.177 951 878 84.74,525 963 4,177 92.4 853 823
13.580 998 11895 98 1 859 85714.050 879 12.422 966 85.4 757
NOTES: Oregon. Nebraska. Nevada. and New Mexico were excluded from the comparability analysis in this report because Oregon's confidentialityrequirements precluded its participation in the 1986 National Mortality Followback Survey. and the primary matching criteria could not be applied forthe other three States because they reissue death certHicate numbers after the processing of the Current Mortality Sample
The denominators of these rates exclude the number of cases in those States that did not code or collect this information on the death certificateSee table A for specific States
leaSeS for which a finaf death certificate was not matched were classified as nonresponses2Percent of filled questionnaires in the reporting Slates for which there was a substantive questionnaire entry for the item3Percent of all cases in the reporting States for which there was a substantive questionnaire entry for the item.4Percent of all cases in the reporting States for which there was a substantive response for the item for both the death certificate and the questionnaire.5For 1986. the number of death certificates for which race was unknown, not stated. or not classifiable was 02 percent of the total deaths (for allStates and registration areas) Death certificates with race entry not stated are assigned to a racial designation as follows: If Ihe preceding record iscoded ~white.~ the code assignment is 'white~; if the code is ~other than white.~ the assignment is 'brack,,~
exactly one of the four major races were classified bycoders in most cases as one of the four major races onthe death certificate, whereas they were left as "other' onthe questionnaire,
Copies of the U.S Standard Death Certificate, theinstructions for completing the certificate, and therespondent questionnaire items are included in this reportas appendixes,
FINDINGS
AGE
There was only 775-percent agreement on exact age ofdecedent (table C) The agreement was highest fordecedents 25-29 years of age (85.9 percent) as reportedon the death certificate, and lowest for decedents 70-79years of age (74.0 percent)
There was a strong relationship between percent agreeingon exact age in number of years and the interval betweenthe death and the survey: There was 85.5-percentagreement for the shortest interval of 22-25 weeks, andonly 67 a-percent agreement for the interval of 52 ormore weel<s This relationship was observed for most! a-year age groups ..
There was greater agreement in age for white decedents(816 percent) than for black (67 1 percent) or AmericanIndian, Eskimo, and Aleut(70 8 percent) decedents There
4
was greater agreement for white decedents for each1a-year age group than for any other racial group(Hereafter in this report the category "American Indian,Eskimo, and Aleuf will be referred to as "AmericanIndian"
There was greater agreement (830 percent for alldecedents) when the death certificate informant was thespouse, as compared with other relatives or nonrelatives,When the decedenfs spouse was both the deathcertificate informant and the respondent to thequestionnaire, the agreement was far higher (84.8percent) than when this was not the case (73.7 percent)This greater correspondence was observed for all 1a-yeardecedent age groups examined
For 92 7 percent of the cases, the age was either the sameor only! year different on the death certificate andquestionnaire (data not shown) There was a slighttendency for the questionnaire age response to be olderthan the age on the death certificate For 102 percent ofthe cases, the age was 1 year older on the questionnaire.For 50 percent of the cases, the age was 1 year youngeron the questionnaire Within 2 years there was95.7-percent agreement, and within 5 years there was98 2-percent agreement on decedent's age
Mortality data are commonly tabulated by 5-year agegroups for analytic purposes An error of 1 year on the
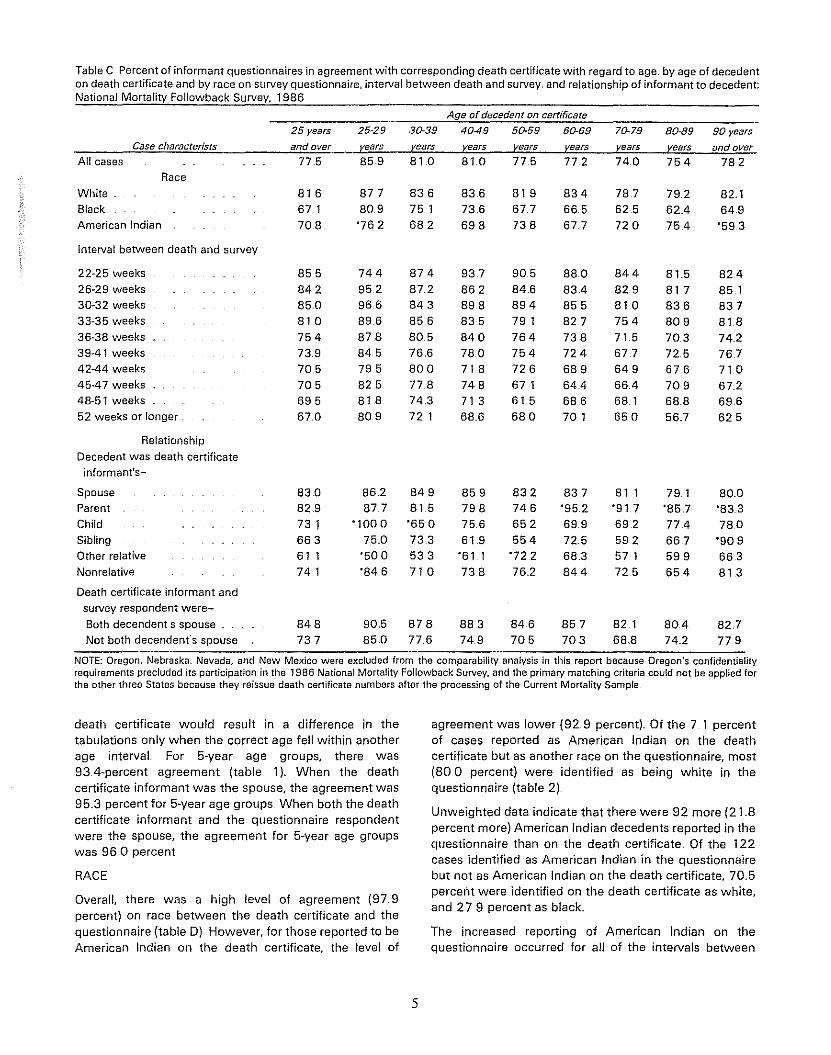
Table C Percent of informant questionnaires in agreement with corresponding death certificate with regard to age. by age of decedenton death certificate and by race on survey questionnaire" interval between death and survey. and relationship of informant to decedent:National Mortality Followback Survey, 1986
Age ofdecedent on certificate
Case characterists
All cases
Race
25 years
and over775
25-29
vears859
30-39
vears
810
4049vears81 0
50-59
vears77.5
60-69
vears772
70-79
vears
740
80·89 90 years
vears and over754 782
White81ackAmerican Indian
Interval between death and survey
22-25 weeks26-29 weeks30-32 weeks33-35 weeks36-38 weeks39-41 weeks42-44 weeks45-47 weeks48-51 weeks52 weeks or longer
Relationship
Decedent was death certificateinformantts-
Spouse
Parent
ChildSiblingOther relative
Nonrelative
Death certificate informant and
survey respondent were
Both decendenfs spouse
Not both decendent's spouse
81 667..1708
85584285.081075473970570569567.0
83082973 166361 1741
848737
877809'762
74495296689687884579582581 8809
862877
'1000750'500'846
905850
836751682
87487.284385680576.6800
778743721
84981 5'650733533710
87877.6
836736698
93786289883584078071874871 3
686
859798756619
'61 1738
883749
81967.7738
90584689479 176475472667 1615680
832746652554'72 276.2
846705
83466567 7
88083485582773.8724689644686701
83.7'952699725683844
857703
787625720
844829810754715677649664681650
81 1'91769259257 1725
82 1688
79.2624754
81581783680970372567.6709688567
79 1'85777466759.9654
804742
821649'593
82485183781874276771067.2696625
800'83.3780'909663813
827779
NOTE: Oregon. Nebraska. Nevada. and New Mexico were excluded from the comparabiJity analysis in this report because Oregon's confidentialityrequirements precluded its participation in the 1986 National Mortality Followback Survey. and the primary matching criteria could not be applied forthe other three States because they reissue death certificate numbers after the processing of the Current Mortality Sample
death certificate would result in a difference in thetabulations only when the correct age fell within anotherage interval For 5-year age groups, there was934-percent agreement (table 1). When the deathcertificate informant was the spouse, the agreement was95.3 percent for 5-year age groups. When both the deathcertificate informant and the questionnaire respondentwere the spouse, the agreement for 5-year age groupSwas 960 percent
RACE
Overall, there was a high level of agreement (97.9percent) on race between the death certificate and thequestionnaire (table D) However, for those reported to beAmerican Indian on the death certificate, the level of
5
agreement was lower (92.9 percent). Of the 7 1 percentof cases reported as American Indian on the deathcertificate but as another race on the questionnaire, most(800 percent) were identified as being white in thequestionnaire (table 2) ..
Unweighted data indicate that there were 92 more (21.8percent more) American Indian decedents reported in thequestionnaire than on the death certificate Of the 122cases identified as American Indian in the questionnairebut not as American Indian on the death certificate, 705percent were identified on the death certificate as white,and 27 9 percent as black.
The increased reporting of American Indian on thequestionnaire occurred for all of the intervals between

HISPANIC ORIGIN
There was 98,9-percent overall consistency in reportingHispanic origin between the death certificate and thequestionnaire (table E) A high level of consistency was
death and survey and for all relationships examinedbetween the death certificate informant and the deceden!Even when both the informant and the questionnairerespondent were the decedenfs spouse, 21 3 percentmore American Indian decedents were reported in thequestionnaire than on the death certificate.
observed for both Hispanic origin (97 1 percent) andnon-Hispanic origin (99,0), as well as for all races, intervalsbetween death and survey, and relationships betweeninformant and decedent examined.
Of the L 1 percent of cases in which there wasdisagreement, 88 5 percent were cases in which theorigin on the death certificate was non-Hispanic and theorigin in the questionnaire was Hispanic (table 3) Thisresulted in 19 6 percent more Hispanic decedents beingreported in the survey, based on unweighted data. Higherreporting of Hispanic decedents in the questionnaire
Table 0 Percent of informant questionnaires in agreement with corresponding death certificate with regard to race. by race of decadenton death certificate and by age at death. interval between death and survey, and relationship of informant to decadent: NationalMortality Followback Survey, 1986
Case characteristics
All cases
Age
Under 3030-39 years40-49 years50-59 years60-69 years70-79 years80-89 years90 years and over
Interval between death and survey
22-25 weeks26-29 weeks30-32 weeks33-35 weeks36-38 weeks39-41 weeks42-44 weeks45-47 weeks48-51 weeks52 weeks or longer
Race of decedent on certificate
American
All races White Black Indian
979 982 980 929
965 968 962 '905967 967 975 957973 973 985 913977 981 985 869983 98 .. 6 982 954983 987 981 929985 98.8 984 925983 988 970 '964
991 990 992 '1000987 990 988 95.0988 992 983 89.. 5980 985 977 917977 982 97.5 915978 975 989 96.8967 967 968 953965 967 974 '808969 973 98 1 '862979 980 988 '100.0
982 98.6 98 1 91 1974 97.0 985 '964980 981 984 962962 963 968 '885979 986 977 '909966 971 989 '867
984 987 982 904977 979 982 933
Relationship
Decadent was death certificate informant"s-
SpouseParent
ChildSiblingOther relative
NonrelativeDeath certificate informant and survey respondent were
Both decedenfs spouse
Not both decedent's spouse
NOTE: Oregon, Nebraska. Nevada. and New Mexico were excluded from the comparability analysis in this report because Oregon's confidentialityrequirements precluded its participation in the 1986 National Mortality Followback Survey. and the primary matching criteria could not be applied forthe other three States because they reissue death certificate numbers after the processing of the Current Mortality Sample
6

992 973 992985 1000 98498S 1000 98,8982 "964 984993 "1000 993982 '944 984
994 976 994987 966 98.8
Table E Percent of informant questionnaires in agreement with corresponding death certificate with regard to Hispanic origin, byHispanic origin of decedent on death certificate and by race on survey questionnaire, interval between death and survey. andrelationship of informant to decedent: National Mortality Followback Survey, 1986
Hispanic origin of decedent on certificate
All Hispanic Non-Hispanic
Case characteristics origins origin origin
All cases 989 971 990
Race
\White 990 977 991
Black. 994 '1000 994
! American Indian 943 '1000 943
Interval between death and survey
22-25 weeks 988 "909 990
26-29 weeks 993 1000 993
30-32 weeks 99 1 '1000 99 1
33,35 weeks 996 "966 997
36-38 weeks 990 944 99.2
39-4 1 weeks 987 1000 986
42-44 weeks 989 95 1 99 1
45-47 weeks 983 '1000 982
48-51 weeks 974 "917 978
52 weeks or longer 986 977 987
Relationship
Decedent was death certificate informanfs-Spouse
ParentChildSiblingOther relativeNomelative
Death certificate informant and survey respondent wereBoth decedenfs spouseNot both decedenfs spouse
NOTES: Oregon. Nebraska. Nevada. and New Mexico were excluded from the comparability analysis in this report because Oregon's confidentialityrequirements precluded its participation in the 1986 National Mortality Fotlowback Survey. and the primary matching criteria could not be applied forthe other three States because they reissue death certificate numbers after the processing of the Current Mortality Sample
occurred for all races, intervals, and relationships ofinformant to decedent examined When both the deathcertificate informant and the questionnaire respondentwere the decedenfs spouse, there were 11 8 percentmore Hispanic decedents reported in the questionnaire
Marital status
There was also a high level of consistency of reportingbetween the death certificate and the questionnaire onmarital status of the decedent (95.0 percent) (table F)There was agreement in 984 percent of the cases for"married' marital status, but only 87 1 percent agreementfor wdivorced" marital status
7
The agreement on marital status was 96 6 percent forwhite decedents, 90.6 percent for black decedents, and92 9 percent for American Indian decedents There wasa slight decline in agreement on marital status as theinterval between death and survey increased
There was almost total agreement (993 percent) whenthe death certificate informant was the decedenfsspouse When the decedenfs spouse was both the deathcertificate informant and the questionnaire respondent,the agreement rate was 99.6 percent When this was notthe case, the agreement rate was 92 6 percent

Table F Percent of informant questionnaires in agreement with corresponding death certificate with regard to marital status, by maritalstatus of decedent on death certificate and by race on survey questionnaire. interval between death and survey, and relationship ofinformant to decedent: National Mortality Followback Survey, 1986
Marital status of decedent on certificate
All marital Never
Case characteristics statuses Married Widowed Divorced married
All cases 950 98.4 93 1 87 1 929
Race
White 986 990 956 907 94.081ack 906 964 873 766 91 1American Indian 929 982 925 830 87.7
Interval between death and survey
22-25 week~ 96 1 991 941 888 94326-29 weeks 972 99.4 956 922 96130-32 weeks 96 1 99 1 929 90.6 96733·35 weeks 965 993 942 897 95836-38 weeks 945 979 92 1 892 91 539-41 weeks 937 97.3 924 892 87842-44 weeks 930 970 913 82.8 92.. 545-47 weeks 926 970 923 807 89048-51 weeks 928 984 909 792 89752 weeks or longer 940 986 933 774 930
Relationship
Decedent was death certificate informant's-
Spouse 993 99.4 "875Parent 92 1 93.9 807 879 948Child 936 956 956 846 789Sibling 918 896 860 93.3 947Other relative 904 939 920 833 88.0Nonrelative 880 932 862 843 892
Death certificate informant and surveyrespondent were-
Both decedenfs spouse 996 997 "50.0Not both decedenfs spouse 926 948 932 87.4 93.1
NOTES: Oregon. Nebraska. Nevada. and New Mexico were excluded from the comparability analysis in this report because Oregon's confidentialityrequirements precluded its participation in the 1986 National Mortality Followback Survey. and the primary matching criteria could not be applied forthe other three States because they reissue death certificate numbers afler the processing of the Current Mortality Sample
Among the inconsistent cases. 12 9 percent had"divorced' reported on the death certificate Of these 207cases, 124 cases (59 9 percent) reported questionnairemarital status as 'married," 52 cases (25 1 percent)'widowed," and 31 cases (150 percent) "never married"(table 4)
OCCUPATION
The overall percent agreement for occupation based onthe major occupation groups shown was only 710percent (table G) As reported on the death certificate. therate was lowest for managerial and professionaloccupations (576 percent) and highest for farmingoccupations (81 9 percent) The consistency of reporting
8
was not appreciably affected by race of decedent. intervalbetween death and survey. or relationship of informant todecedent
For all occupational categories except managerial andprofessional. the percent of decedents in the category wasabout the same or higher for the questionnaire than forthe death certificate Based on unweighted data,comparisons showed 6 1 percent more technical, sales.and administrative; 1 3 percent more service; 16.3percent more farming; 52 percent more production. craft.and repair; 1.. 1 percent more operators, fabricators, andlaborers; and 80 6 percent more members of the ArmedForces on the questionnaire than on the death certificate

Table G Percent of informant questionnaires in agreement with corresponding death certificate with regard to occupation. byoccupation of decedent on death certificate and by race on survey questionnaire, interval between death and survey. and relationshipof informant to decedent: National Mortality Followback Survey, 1986
Occupation of decedent on certificate
Precision Operators,Managerial Technical production,. fabricators,
All and tialesr and craft, and and ArmedCase characteristics occupations professional edmirustrative Service Farming repa" laborers Forces
All cases 71 0 576 71 0 758 819 695 742 694Race
White 704 574 720 693 825 702 767 733Slack 736 61.3 694 826 79.7 688 70A '400American Indian 656 '625 '2S 6 '714 '889 '60.0 '696
Interval between
death and survey
22-25 weeks 696 556 656 '73:9 '875 567 755 '75026-29 weeks 725 57 1 766 76 1 763 612 81 1 '85730-32 weeks 668 568 61 1 651 906 71.7 570 '80.033-35 weeks 739 605 75.6 705 '79.3 794 80.6 'lOO 036-38 weeks 704 51 9 S 1 7 846 737 567 673 ;667
39-41 weeks 678 535 683 722 '952 65.8 68.1 '42.942-44 weeks 773 710 698 81 1 '810 871 776 '66745-47 weeks 707 '536 '57 1 '750 '917 '793 745 '50048-51 weeks 700 '545 '538 '944 '1000 '300 76.9 '100052 weeks or longer 600 '1000 '600 '833 '333 '50.0 '556
Relationship
Decedent was death certificate
informanfs-
Spouse 696 579 67.0 693 830 68.0 75A '900Parent 670 433 '667 '690 '692 688 759Child 673 '57 1 750 69A '857 '47 1 697 '250Sibling 718 '625 '62 5 '789 '429 '833 '75..0 ,-Other relative 81 1 '667 '889 '1000 '900 '667 '667 '1000Nonrelative '655 '250 '800 '1000 ,- '50.0 '77 8 '1000
Death certificate informant and
survey respondent were-
Both decedenfs spouse 697 582 669 670 838 674 768 'S95Not both decedenfs
spouse 720 562 735 795 81 6 717 730 '533
NOTES: Oregon, Nebraska, Nevada, and New Mexico were excluded from the comparability analysis in this report because' Oregon's confidentialityrequirements precluded its participation in the 1986 National Mortality FoJlowback Survey, and the primary matching criteria could not be apprted forthe other three States because they reissue death certificate numbers after the processing of the Current Mortality Sample
(table 5). However. there were 26 S percent fewerdecedents recorded as"managerial and professional'" onthe questionnaire. When the decedenfs spouse was boththe death certificate informant and the questionnairerespondent. there were 23.6 percent fewer decedentsrecorded as 'managerial and professional" on thequestionnaire
INDUSTRY
The rate of agreement between the death certificate andthe questionnaire based on the major groupings shownwas about the same for industry (744 percent) as foroccupation (table H) The agreement rate was highest forthe mining industry (795 percent) and lowest for the
9
public administration industry (623 percent) There wasno essential difference in consistency of reporting by raceof decedent or by whether the spouse of the decedentwas both the death certificate informant and thequestionnaire respondent The number of sample casesis too small to assess differences across intervals betweendeath and survey, or by relationship of informant todecedent (table 6).
In spite of the overall relatively low level of agreementbetween the questionnaire and the death certificate onindustry, the marginal distributions of industries for thequestionnaire and death certificate were very similar(table 6)

Table H Percent of informant questionnaires in agreement with corresponding death certificate with regard to industry. by industryof decedent on death certificate and by race on survey questionnaire. interval between death and survey. and relationship of informantto decedent: National Mortality FoHowback Survey, 1986
Industry of decedent on certificate
Transportation.Agriculture.. communica- Finilnce,
forestry. Con- tions, and insurance, PublicAll and struc- Manu- other public and real administra- Armed
Case characteristics industries fisheries Mining tion facturing utillties Trade estate Services tion Forces
All cases 744 784 795 743 770 752 696 736 750 623 684Race
White 743 771 780 78.7 771 764 705 771 711 649 688Black 752 807 '1000 641 762 71.7 656 '571 827 '615 '60.0American Indians 726 '875 '1000 '667 '857 '667 '750 '500 '750 '333
Interval betweendeath and survey
22~25 weeks 756 '864 '1000 '800 750 '783 '690 '750 696 '667 '100026-29 weeks 777 757 '571 667 833 739 69.1 '833 817 '792 '83330-32 weeks 753 867 '750 '724 780 '74.1 771 '769 720 '588 '66733·35 weeks 75 1 '77 8 '889 838 824 750 652 '769 694 '600 '100036-38 weeks 708 684 '875 625 736 794 676 '846 706 '529 '50039·41 weeks 734 '895 '400 '808 746 '684 77.1 '600 721 '733 '4294244 weeks 707 '773 '1000 '793 627 '643 658 '636 768 '643 '66745·47 weeks 749 '91 7 '100.0 '944 703 '833 '524 '500 846 '400 '50048-51 weeks 763 '1000 '500 800 '667 '714 '80.0 903 '25.0 '100.052 weeks or longer 683 '286 '40..0 '750 'lOaD '1000 '818 -
Relationship
Decedent was deathcertificate informant's-
Spouse 752 777 '708 779 '76.8 778 685 824 744 654 '89..5Parent 663 '700 '500 '704 722 '667 '593 '600 644 '600 '333Child 773 '900 'lOO 0 '667 833 '750 '77 8 '600 755 '625 '50.0Sibling 756 '429 '1000 '833 '750 '714 '62.5 '1000 '833 '100,0 ,-Other relative 800 '88.9 '100.0 '500 '750 '600 '77 8 '1000 '857 - '1000Nonrelative 815 '500 '833 '1000 '100.0 '1000 '750 'lOaD '1000
Death certificateinformant and surveyrespondent were-
Both decedent'sspouse 754 775 '714 776 784 786 664 844 723 676 '889
Not bothdecedent'sspouse 740 797 '850 721 758 730 717 615 764 51.9 '588
NOTE: Oregon. Nebraska. Nevada. and New Mexico were excluded from the comparability analysis in this report because Oregon's confidentialityrequirements precluded its participation in the 1986 National Mortality Followback Survey_ and the primary matching criteria could not be applied forthe other three States because they reissue death certificate numbers after the processing of the Current Mortality Sample
VETERAN STATUS
The agreement between the death certificate and thequestionnaire on veteran status Was high (96.7 percent)(table J) However. the rate of agreement for nonveteranswas higher than for veterans (98.3 percent versus 907percent). There was no essential difference in the rate ofagreement by race of decedent. interval between deathand survey. relationship of death certificate informant todecedent. or whether the spouse was both the deathcertificate informant and the questionnaire respondent,The percent reported as veteran was about the same forboth the death certificate and the questionnaire (20.5percent and 19. 9 percent. respectively) (table 7), Of the349 cases in disagreement on veteran status. 202 (579percent) classified the decedent as a veteran on the deathcertificate but as a nonveteran in the questionnaire, and147 (42 1 percent) classified the decedent as anonveteran on the death certificate but as a veteran onthe questionnaire.
10
PLACE OF DEATH
The consistency rate for hospital deaths (includinginpatient. outpatient, and emergency room patient) was883 percent (table K). Among those with "hospitalinpatient" reported on the death certificate as place ofdeath, questionnaire responses reported approximately87 percent died in the hospital excluding the emergencyroom, and 85 percent died in the hospital emergencyroom Among those classified on the death certificate as"hospital outpatient or in the emergency room." overone-third (365 percent) were recorded on thequestionnaire as having died at their own home. another'shome. or another place.
For those classified according to the death certificate asdead on arrival (DOA) at the hospital. questionnaireresponses showed 460 percent as having died in theiroWn home, 203 percent in another place. and 4.9 percentin another's home

Table.J Percent of informant questionnaires in agreement with corresponding death certificate with regard to veteran status, byveteran status of decedent on death certificate and by race on survey questionnaire. interval between death and survey. and relationshipof informant to decedent: National Mortality Followback Survey, 1986
Case characteristics
All cases
Race
White
BlackAmerican Indian
Interval between death and survey
22-25 weeks26-29 weeks30-32 weeks33-35 weeks36-38 weeks39-41 weeks42-44 weeks45-47 weeks48-51 weeks52 weeks or longer
Veteran status of decedent on certificateBoth
statuses Veteran Nonveteran
967 907 983
96.6 912 98.. 1971 900 985969 846 99 1
978 948 988963 905 97.897.0 91 1 98 .. 696.2 884 983964 922 97496.. 8 863 99.6972 926 982972 939 98097.1 91 5 98494.2 881 962
959 912 978968 91 1 98397.7 895 988969 917 98198 1 903 99 1953 848 982
95.8 91 2 977973 902 98.5
Relationship
Decedent was death certificate informant's-
Spouse
Parent
ChildSiblingOther relative
Nonrelative
Death certificate informant and survey respondent were
Both decedent's spous
Not both decedent"s spouse
NOTE: Oregon. Nebraska. Nevada. and New Mexico were excluded from the comparability analysis in this report because Oregon's confidentialityrequirements precluded its participation in the 1986 National Mortality Followback Survey. and the primary matching criteria could not be applied forthe other three States because they reissue death certificate numbers after the processing of the Current Mortality Sample
Of those decedents whose death certificates cited theirdying in another care institution, 92.9 percent died in anursing or personal~care home according to thequestionnaire, and 4 9 percent died in the hospitaLAmong those classified as "all other entries" on the deathcertificate, 726 percent were reported as dying in theirown home, 172 percent in another place, and 62 percentin another's home
DISCUSSION
Consistency in reporting between the death certificateand the followup questionnaire was excellent for race,Hispanic origin, marital status, and veteran statusHowever, in spite of overall high correspondence, therewere some areas of lesser agreement for these variables,For example. based on unweighted data, there were 218percent more American Indian decedents reported on thequestionnaire than there were on the death certificate
11
Similarly, while the overall level of agreement on maritalstatus was 950 percent. for those classified as divorcedon the death certificate, there was only 87 I-percentagreement with the questionnaire In addition, in spite ofan overall agreement rate of 989 percent on Hispanicorigin, 196 percent more Hispanic decedents werereported on the questionnaire than on the deathcertificate.
Although the agreement rate for exact age in years wasonly 77 5 percent. the agreement rose to 927 percentfor ages within 1 year and to 957 percent for ages within2 years There seems to be a small bias in the directionof the questionnaire age being older. This might be dueto some questionnaire respondents reporting what thedeceden"s age would have been at the time of the surveyrather than what it was at the time of death.

Table 1< Number of responses by place of death on death certificate and on National Mortality FoJlowback survey questionnaire:United States, 1986
Place of death on death certificateHospital
Dead onOutpatient Hospital arrival-
or status no Other All other hospitalResponse to questionnaire item emergency Dead on Status on care reported name not~Where did the person die?" Total Inpatient room arrival unknown certificate institutions entries given
All places 11.639 5.661 1.101 800 189 1367 2519
Hospital emergency room 1.148 480 503 99 35 11 20Hospital (excluding emergency room) 5.190 4.902 84 16 110 56 22On way to hospital 235 28 101 76 6 2 22Nursing or personal care home 1.480 117 11 40 4 1.270 38Own home 2.564 79 267 368 17 5 1.828Other place (undefined) 794 52 106 162 17 22 433Othe(s home ...... ...... 228 3 29 39 1 156
NOTE; Oregon. Nebraska. Nevada- and New Mexico were excluded from the comparability analysis in this report because Oregon-s confidentialityrequirements precluded its participation in the 1986 National Mortality Followback Survey. and the primary matching criteria could not be appliedfor the other three States because they reissue death certificate numbers after the processing of the Current Mortality Sample
Levels of agreement on age, race, Hispanic origin, maritalstatus, and veteran status were similar to those found intwo studies in which Census Bureau Population Studyinterview responses were compared to death certificateentries (17 -20)
The consistency rates in reporting on occupation andindustry were 7 LO percent and 744 percent.respectively. These low levels are consistent with priorresearch (3-16) The disagreements were not random foroccupation: For all occupational categories exceptmanagerial and professional, the percent of decedents inthe category was the same or higher for the questionnairethan for the death certificate However, there were 268percent fewer managers and professionals on thequestionnaire In contrast to occupation, marginaldistributions for industry were very similar for the deathcertificate and the questionnaire
It is possible that coding differences may have been asignificant factor in the lack of correspondence inoccupation and industry between the two sources Codingmany occupation and industry entries that were verygeneral such as 'telephone" and 'farm" was difficult Thesource documents were not reviewed to determinewhether differences were due to respondent reporting orto coding
There was good correspondence when the deathcertificate place of death was "hospital inpatient," but lessconsistency for entries reported on the death certificateas 'hospital outpatient' or "emergency room" There wasvery good correspondence for entries of health careinstitutions other than hospitals on the death certificateOverall, high rates of consistency between thequestionnaire and death certificate should add confidencein the interpretation and use of mortality statisticsHowever. even when marginal distributions are verysimilar. lower rates of agreement raise concern about
12
possible biases in the mortality data For example,American Indian decedents unidentified as such on thedeath certificate may have different characteristics fromthose identified as American Indian on the questionnaireOn the other hand. differences in marginal distributionsdo not necessarily lead to biases in assessing relationshipsamong specific variables If the data were weighted toproduce national estimates of the degree of overallcomparability, these rates would be slightly higher ingeneral because there was oversampling of some groupsthat had lower rates of agreement
Through the use of the 1986 NMFS, it is possible toexplore further the types and possible directions ofpotential biases in the relationships among variables.Additional analyses could also include examiningcomparability according to other important controlvariables including age, sex, and cause of death Thestandard death certificate was revised for use starting in19B9 It will be important for the next NMFS, planned for1993. to investigate whether there are any changes in thelevels of consistency in reporting
REFERENCES
Gittelsohn A. Royston PN. Annotated bibliography ofcause-of-death validation studies, 1958-80 NationalCenter for Health Statistics Vital Health Stat 2(89)1982
2 Rosenberg HM. The nature and accuracy ofcause-of-death data report of the Workshop onImproving Cause-of-Death Statistics. NationalCommittee on Vital and Health Statistics NationalCenter for Health Statistics 1989
3 Buechley R, Dunn JE. Linden G, Breslow L. Deathcertificate statement of occupation: its usefulness incomparing mortalities Public Health Rep71:1101-1 L 1956.

4 Alderson A Some sources of error in Britishoccupational mortality data Br.J Ind Med 29:245-541972
5 Wegman OH, Peters ..JM Oat cell lung cancer inselected occupations .. .1 Occup Med 20:793-961978
6 Frazier TM, Wegman OH Exploring the use of deathcertificates as a component of an occupational healthsurveillance system Am .1 Public Health 69:718-201979
7 Rosenberg HM, 8urnham 0, Spirtas R. Valdisera V.Information from the death certificate: assessment ofthe completeness of reporting In DelBene L,Scheuren F, eds. Statistical uses of administrativerecords with emphasis on mortality and disabilityresearch, pp. 83-9 Washington: Social SecurityAdministration, Office of Research and Statistics.1979
8 Rousch GC, Meigs .lW, I<elley .1, et al Sinonasalcancer and occupation: a case control study Am .1Epidemiol 111: 183-93 1980.
9 Swanson GM, Schwartz AG, Burrows RW Anassessment of occupation and industry data fromdeath certificates and hospital records forpopulation-based cancer surveillance Am .J PublicHealth 74:464-67 1984
10 Balarajan Comparison of occupations recorded atcancer registration and death Public Health99: 169-73 1985
11 Gute, Fulton JP Agreement of occupation andindustry data on Rhode Island death certificates withtwo alternate sources of information Public HealthRep 100:65-72. 1985
12 Steenland 1<, Beaumont .1 The accuracy of occupationand industry on death certificates .1 Occup Med26:288-96 1984
13 Schumacher MC Comparison of occupation andindustry information from death certificates andinterviews Am .1 Public Health 76:635-37 1986
14 Turner DW, Schumacher MC, West DW .. Comparisonof occupational interview data to death certificatedata in Utah Am ,J Ind Med 12:145-51 1987
13
15 Davis H The accuracy of industry data from deathcertificates for workplace homicide victims .. Am .1Public Health 78( 12): 1579-8 L 1988.
16 Schade WJ, Swanson GM Comparison of deathcertificate occupation and industry data with lifetimeoccupational histories obtained by interview:variations in the accuracy of death certificate entriesAm J Ind Med 14(2): 12 1-36 1988
17 Sorlie PO, Rogot E, Johnson NJ Validity ofdemographic characteristics on the death certificate.Epidemiology 3(2): 181-84 1992
18 Hambright TZ Comparability of age on the deathcertificate and matching census record, UnitedStates, May-August 1960. National Center for HealthStatistics. Vital Health Stat 2(29). 1968
19 Hambright TZ Comparability of marital status, race,nativity, and country of origin on the death certificateand matching census record. United States.May-August 1960 National Center for HealthStatistics Vital Health Stat 2(34). 1969
20 McCarthy MA Comparison of the classification ofplace of residence on death certificates and matchingcensus records, United States, May-August 1960National Center for Health Statistics Vital Health Stat2(30) 1969
2 L Seeman I, Poe GS, Powell-Griner E. Development,methods, and response characteristics of the NationalMortality Followback Survey. 1986 National Centerfor Health Statistics. Vital Health Stat 1(29). 1993
22 National Center for Health Statistics Public-use datatape documentation: National Mortality FollowbackSurvey, 1986 Hyattsville, Maryland: Public HealthService.. 1988
23 U.S Bureau of the Census. 1980 census ofpopulation: alphabetical index of industries andoccupations. Washington: U.s Department ofCommerce 1982