technical report - chrometco
TRANSCRIPT
Technical ReportOn the Rooderand Project in the North West ProvinceSouth Africa
Pursuant to SAMREC, SAMVAL and JSE Section 12 Listings Requirements
Report of the Independant Professional Expert – CPR
Prepared for:
Chrometco Ltd.70 Marshall StreetJohannesburg South Africa
Prepared by:
Independent Resource EstimationsSouth Africa
January 10th, 2011 Project Reference NumberIRES 1CH100201
Chrometco Ltd.70 Marshall Street
JohannesburgSouth Africa
Technical ReportOn the Rooderand Project in the North West ProvinceSouth Africa
Independent Resource Estimations11 & 13 Jupiter StreetWestonaria, South Africa1780
IRES Project Number 1CH100201January 10th, 2011
AuthorDexter S. Ferreira
Tel: +27-11-753-1355
E-mail: [email protected] Fax: +27-11-753-2854
Web site: www.ires.co.za
TEChnICAL REPORT On ThE ROODERAnD PROJECTIn ThE nORTh WEST PROVInCE
I I
The Directors
Chrometco Limited
Building 2, Country Club Estate
Woodlands Drive
Woodmead
South Africa
Dear Sirs,
SYNOPSIS (SV T2.1)This document will be included in the relevant Johannesburg Stock Exchange (“JSE”) documentation in full and thus this section is not intended to be issues or published as a Section 12.9(h) executive summary.
At the outset, it is extremely important to note that this CPR is based upon Chrometco’s opportunity to identify and evaluate all chrome seams in its licence areas. Chrome seams of the Bushveld are well known for their lateral geological continuity and invariably contain lower grade PGE’s. A notable feature of the Bushveld is the lateral grade continuity reflected in a relatively low variance chemistry. Therefore, Chrometco will evaluate the commercial opportunities afforded by this unique geology. This report includes borehole sampling information for both Chrome, mainly in portion 2 and the remainder of Rooderand 46JQ, and PGE information for the balance of the area. The depth values have been used to confirm the structural continuity of the chrome seam. Therefore the tonnages that have been calculated are considerably at a high level of confidence.
Within the DCM area, which represents approximately 25% of Chrometco’s mineral rights, the chrome resource tonnages are SAMREC compliant and have been classified into appropriate categories. The remaining area, or the 75% of Chrometco’s interest has been classified as Exploration Results only since the PGE boreholes did not intersect the chrome seams. However, the intersections of the Merensky Reef and UE2 have been used to confirm the structure of the area. Therefore, a chrome seam target has been indentified which is not SAMREC compliant.
In the event that shareholes vote against the sale of Rooderand, it is anticipated that Chrometco will undertake modern sampling and assay of the boreholes drilled in the larger area over the next few months. This will be done with the full cooperation of the owners of the boreholes and anticipates rapid conversion of these Exploration Results to a SAMREC code category, inferred or higher. It should also be noted that the company will seek to assay the boreholes from the DCM area for PGE’s to the extent that the full commercial opportunities for both chrome and PGE’s can be evaluated in future.
Purpose and Project OutlineThe directors of Chrometco Limited (“Chrometco” or “the Company”) requested that Independent Resource Estimations (“IRES”) prepare a Competent Person’s Report (“CPR”) compliant with the South African Mineral Resource Code (SAMREC), incorporating a valuation (“the Valuation”) compliant with the South African Code for the Reporting of Mineral Asset Valuation (the SAMVAL Code), and finally compliant with all the requirements of Section 12 Listings Requirements of the Johannesburg (“JSE”) Listings Requirements, for their Rooderand Project. Each section of the report is designated with the relevant SAMREC Code Table 1 reference number (SR T) and SAMVAL Code Table 2 reference number (SV T). This CPR incorporates the Valuation completed by Venmyn Rand (Pty) Limited (“Venmyn”) entitled: “Independent Valuation in Accordance with the SAMVAL Code on the Rooderand Project for Chrometco” by Mr. Derick de Wit of Venmyn.
Chrometco, a mining exploration and development company, acquired the Rooderand mining rights in 2004 and completed a limited amount of exploration. Chrometco subsequently entered into a conditional sales agreement to sell the said properties to DCM Chrome (Pty) Ltd. (“DCM”) in 2007.
12.9(h)iii
12.9(h)i & ii
I I I
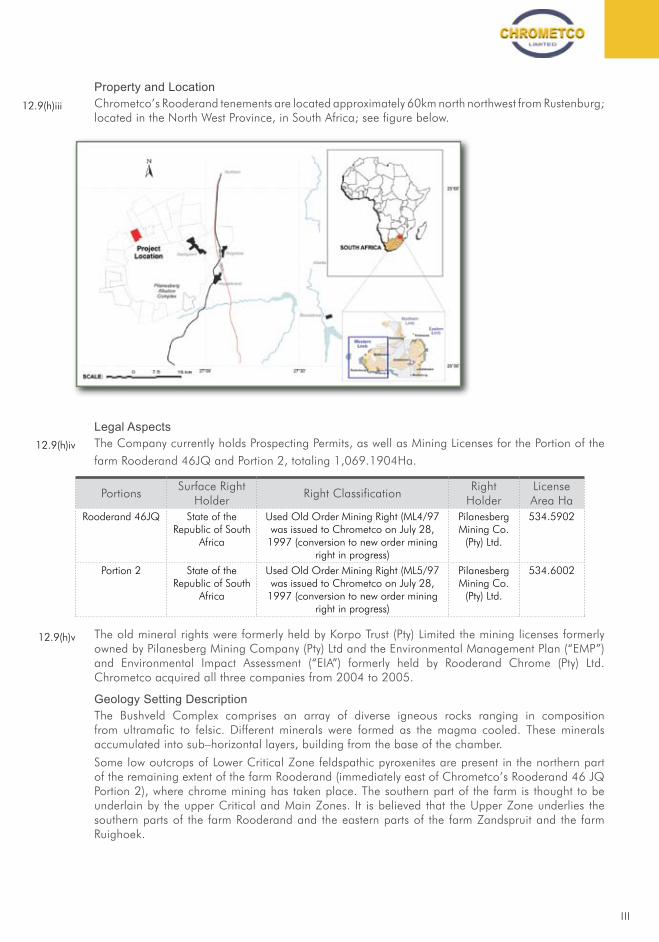
Property and LocationChrometco’s Rooderand tenements are located approximately 60km north northwest from Rustenburg; located in the North West Province, in South Africa; see figure below.
Legal AspectsThe Company currently holds Prospecting Permits, as well as Mining Licenses for the Portion of the farm Rooderand 46JQ and Portion 2, totaling 1,069.1904Ha.
PortionsSurface Right
HolderRight Classification
Right Holder
License Area Ha
Rooderand 46JQ State of the Republic of South
Africa
Used Old Order Mining Right (ML4/97 was issued to Chrometco on July 28,
1997 (conversion to new order mining right in progress)
Pilanesberg Mining Co.
(Pty) Ltd.
534.5902
Portion 2 State of the Republic of South
Africa
Used Old Order Mining Right (ML5/97 was issued to Chrometco on July 28,
1997 (conversion to new order mining right in progress)
Pilanesberg Mining Co.
(Pty) Ltd.
534.6002
The old mineral rights were formerly held by Korpo Trust (Pty) Limited the mining licenses formerly owned by Pilanesberg Mining Company (Pty) Ltd and the Environmental Management Plan (“EMP”) and Environmental Impact Assessment (“EIA”) formerly held by Rooderand Chrome (Pty) Ltd. Chrometco acquired all three companies from 2004 to 2005.
Geology Setting DescriptionThe Bushveld Complex comprises an array of diverse igneous rocks ranging in composition from ultramafic to felsic. Different minerals were formed as the magma cooled. These minerals accumulated into sub–horizontal layers, building from the base of the chamber.
Some low outcrops of Lower Critical Zone feldspathic pyroxenites are present in the northern part of the remaining extent of the farm Rooderand (immediately east of Chrometco’s Rooderand 46 JQ Portion 2), where chrome mining has taken place. The southern part of the farm is thought to be underlain by the upper Critical and Main Zones. It is believed that the Upper Zone underlies the southern parts of the farm Rooderand and the eastern parts of the farm Zandspruit and the farm Ruighoek.
12.9(h)iii
12.9(h)iv
12.9(h)v
TEChnICAL REPORT On ThE ROODERAnD PROJECTIn ThE nORTh WEST PROVInCE
IV
Exploration Program and BudgetChrometco acquired the Rooderand mining rights in early 2004 and when it listed in August 2005 the intention was to undertake further exploration work on this farm, with the ultimate aim of proving-up chromite mineral tonnage. Chrometco drilled 2 diamond and 24 percussion drillholes, and in doing this identified the outcrop of the MG4 seam over a strike length of 1.2km. Chrometco opened a bulk sample pit and undertook limited laboratory evaluation of the MG4 chrome seam material. Previous mining took place on the adjacent property which is up-dip of Chrometco’s Rooderand portion 2.
Key Environmental IssuesIRES is not aware of any environmental work, environmental assessments, environmental scoping study, environmental specialist studies or any environmental impact assessments that were performed either during or (post closure of the historical mines). Consequently, no opinion on the significant effect of environmental factors on the Project can be assessed until full environmental assessments have been undertaken during the next phase.
The environmental management plan (“EMP”) in support of the prospecting right application for the Project and the Environmental Impact Assessment (“EIA”) was approved for Rooderand Chrome and is available at the Company’s Head Office, so that the reader of this CPR can make a reasoned and balanced judgement regarding any potential liabilities, undertakings by the applicant and any additional requirements determined by the Regional Manager and agreed to by the Applicant.
Mineral Resources
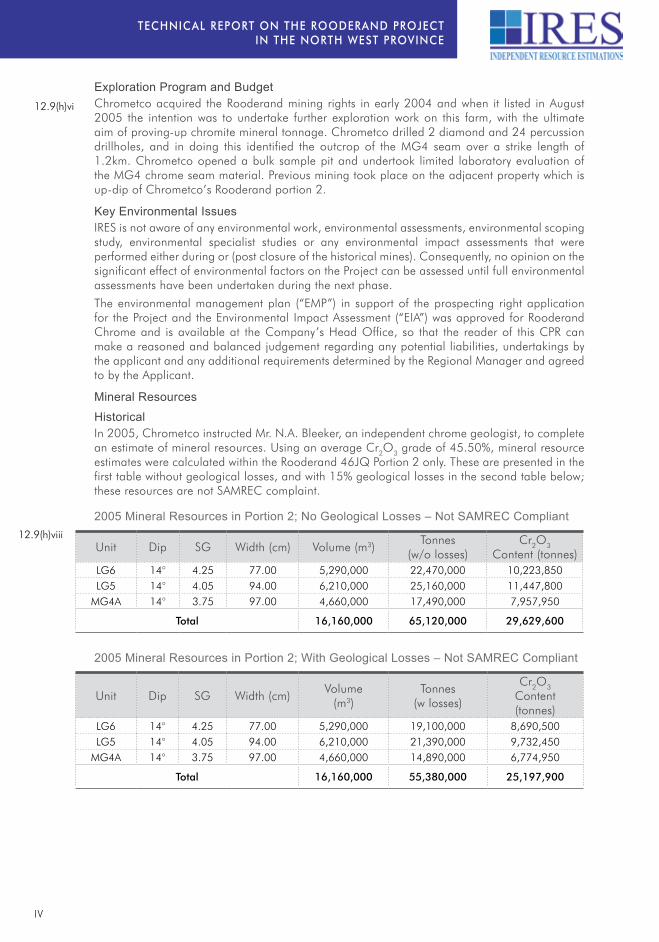
HistoricalIn 2005, Chrometco instructed Mr. N.A. Bleeker, an independent chrome geologist, to complete an estimate of mineral resources. Using an average Cr2O3 grade of 45.50%, mineral resource estimates were calculated within the Rooderand 46JQ Portion 2 only. These are presented in the first table without geological losses, and with 15% geological losses in the second table below; these resources are not SAMREC complaint.
2005 Mineral Resources in Portion 2; No Geological Losses – Not SAMREC Compliant
Unit Dip SG Width (cm) Volume (m3)Tonnes
(w/o losses)Cr2O3
Content (tonnes)LG6 14° 4.25 77.00 5,290,000 22,470,000 10,223,850LG5 14° 4.05 94.00 6,210,000 25,160,000 11,447,800
MG4A 14° 3.75 97.00 4,660,000 17,490,000 7,957,950
Total 16,160,000 65,120,000 29,629,600
2005 Mineral Resources in Portion 2; With Geological Losses – Not SAMREC Compliant
Unit Dip SG Width (cm)Volume
(m3)Tonnes
(w losses)
Cr2O3 Content (tonnes)
LG6 14° 4.25 77.00 5,290,000 19,100,000 8,690,500LG5 14° 4.05 94.00 6,210,000 21,390,000 9,732,450
MG4A 14° 3.75 97.00 4,660,000 14,890,000 6,774,950
Total 16,160,000 55,380,000 25,197,900
12.9(h)vi
12.9(h)viii

V
Current – Mineral CorporationIn late 2008, DCM hired Mineral Corporation to manage an exploration program which entailed the drilling of 25 surface drillholes. The results from this program were used to define SAMREC compliant mineral resource estimates. These are presented for Indicated Mineral Resources (first table below) and for Inferred Mineral Resources (second table below) and only represent approximately 25% of the total tenement area held by Chrometco. Geological losses of 20% to 30% have been applied on a block-by-block basis.
2008 Indicated Mineral Resources – As Per Mineral Corp. – SAMREC Compliant
Source Unit TonnesGrade Cr2O3
(%)
Cr2O3 Content (tonnes)
Open Pit LG5, LG6, LG7, MG2, MG3, MG4
2,008,958 37.10 745,244
Underground LG6, MG4A 6,662,671 39.42 2,626,098
Total 8,671,629 39.00 3,371,342
2008 Inferred Mineral Resources – As Per Mineral Corp. – SAMREC Compliant
Source Unit TonnesGrade Cr2O3
(%)
Cr2O3 Content (tonnes)
Open Pit MG2 213,764 35.36 75,587
Total 213,764 213,799.36 75,622.36
Exploration ResultsIn 2010, Mr. Bleeker was approached by the Directors of Chrometco to re-evaluate the potential resources taking congnisance of the work completed by the Mineral Corporation. Using drillhole information from Anglo Platinum and NKWE Platinum, depth values have been used to confirm the structural continuity of the individual chrome seams; therefore the tonnages that have been calculated are considerably at a high level of confidence. These have been categorized as an Exploration Results and are not SAMREC compliant and are shown in the table below.
Exploration Results – Balance of DCM Area – As Per Bleeker – Not SAMREC Compliant
UnitTonnes
(w losses)LG6 20,477,000LG5 16,591,459
MG4A 14,063,164
Total 51,131,623
Mineral ReservesNot applicable to this report.
TEChnICAL REPORT On ThE ROODERAnD PROJECTIn ThE nORTh WEST PROVInCE
VI
Independent Valuation (SV T1.1)Venmyn was commissioned by Chrometco to perform an independent valuation of the Rooderand Project and Venmyn applied both the cost and market valuation approaches. The SAMVAL Code definition states that the cost approach relies on historic and/or future expenditure on the Mineral Asset. A prospectivity enhancement multiplier (PEM) is a factor applied to the total cost of exploration, at different stages of exploration and project advancement. The magnitude of the PEM is determined by the level of sophistication of the exploration for which positive exploration results, applying the concept of successful efforts, have been obtained. Using the cost approach and a total historical and future amount of ZAR2.70m spent on the Project by Chrometco, as well as a PEM for historical mining of 5, Venmyn determined:
a “fair” (attributable) value for the Project of ZAR13.50m; and•
using a 10% deviation around the “fair” value, an upper and lower value of •ZAR14.85m and ZAR12.15m is determined, respectively.
In valuing the Project, using the market approach, Venmyn made use of a comparative valuation graph, consisting of a database of various, similar, “arm’s length” transactions, which are plotted in relation to their specific stage of exploration (the Venmyn Chromite Valuation Curve).
Using the Venmyn Chromite Valuation Curve, Venmyn determined a “fair” value of USD1.02/t and an upper and lower value range of USD1.44/t and USD0.59/t, respectively. To calculate the total project value, the contained Cr2O3 tonnes per Mineral Resource category are multiplied by the unit values.
Using the market approach and the Exploration Result and indicated Cr2O3 content of 23.265Mt and 3.371Mt, respectively, and spot exchange rate on 4th April 2011 of ZAR6.70/USD, Venmyn determined:
a “fair” (attributable) value for the Project of ZAR181.53m; and•
an upper and lower value of ZAR257.11m and ZAR105.96m, respectively.•
Concluding OpinionSince the market approach relies on similar, recent, “arm’s length” transactions, the Competent Valuator prefers the valuation results of the market approach. The concluding opinion of value (attributable) for the Project is based on the market approach as follows:
a “fair” (attributable) value for the Project of ZAR181.53m; and•
an upper and lower value of ZAR257.11m and ZAR105.96m, respectively.•
StatementAll requirements of Section 12.9 of the JSE Listings Requirements, the SAMREC Code (including Table 1), and the SAMVAL Code (including Table 2) have been complied with in preparing this report. This executive summary is a true reflection of the full Competent Person’s Report presented herein.
Capacity and IndependenceIRES prepared the report and it is signed off according to SAMREC by Mr. Dexter S. Ferreira, a consultant to IRES. Details of his qualifications and experience are contained within Appendix 21 of this report. IRES have previously completed Independent Reports for listings on the Vancouver, London, Johannesburg and Australian Stock Exchanges.
Scope of Work/Materiality/Limitations and ExclusionsThis CPR is based on 1) information supplied by Chrometco; 2) IRES’s knowledge of the associated geology; 3) site visits and data gathering visits to the permits held by Chrometco. All data held by Chrometco was released to IRES for review. IRES reviewed source data where possible but has relied on the accuracy of data as reported by previous companies. All requests
1 Appendices mentioned in this hard copy of the CPR are to be found in the electronic version of the report on the Chrometco Website www.chrometco.co.za
12.9(e)
12.9(h)xi
VI I
for information to the employees of Chrometco were addressed immediately where possible and a candid approach to all queries was in evidence throughout the review.
Full legal verification of license documents was not undertaken. At no time during the course of preparation of the CPR did IRES become aware of either withholding of information or of the changing of records to influence the conclusion of CPR. IRES have endeavored to ensure that no error of fact is contained within the CPR. Any such error is not intentional and is not a deliberate effort to mislead.
All opinions, findings and conclusions expressed in this report are those of IRES (with the exception of the Valuation which is that of Venmyn) and are based on information provided by Chrometco. Where possible, IRES has verified this information from independent sources in order to fully comply with the SAMREC Code SAMVAL requirements. IRES and its directors accept no liability for any losses arising from reliance upon the information presented herein. IRES have utilized information from the public domain, which, whilst it could not be verified, is considered to be from reliable sources. IRES and its directors accept no liability for any losses arising from reliance upon the information presented in this report.
RisksThe business of mining and mineral exploration, development and production by their nature contain operational risks. The business depends upon, amongst other things, successful prospecting programs and competent management. Profitability and asset values can be affected by unforeseen changes in operating circumstances and technical issues.
Factors such as political and industrial disruption, currency fluctuation, commodity prices and interest rates could have an impact on the project’s future operations, and potential revenue streams can also be affected by these factors. The majority of these factors are, and will be, beyond the control of any operating entity.
CopyrightCopyright in all documents, drawings and records whether manually or electronically produced, which form part of the submission and any subsequent report or project document shall vest in IRES. None of the documents, drawings or records may be used or applied in any manner, nor may they be reproduced or transmitted in any form or by any means whatsoever for or to any other person, without the prior written consent of IRES. While all reasonable efforts were taken by IRES to verify the information contained in this report, IRES does not accept responsibility for any inaccuracies in this regard, nor any action which might arise as a consequence thereof.
Yours faithfully,
Dexter S. FerreiraDirector of Independent Resource Estimations (IRES)BSc. (Geology), BEng. (Mining), Pri.Sci.Nat.
Independent Resource Estimations11 & 13 Jupiter StreetWestonaria, GautengRepublic of South [email protected]: +27 (0) 11 753-1355Fax: +27 (0) 11 753-2854
TEChnICAL REPORT On ThE ROODERAnD PROJECTIn ThE nORTh WEST PROVInCE
VI I I
Table of ContentsINTRODUCTION1. ..................................................................................................................1
Terms of Reference1.1 ...................................................................................................1Scope of Work1.2 ...........................................................................................................1Effective Date1.3 ............................................................................................................1Statement1.4 ..................................................................................................................1Units1.5 ..........................................................................................................................1Qualifications of Consultant1.6 ......................................................................................1Basis of Report1.7 ..........................................................................................................2
RELIANCE ON OTHER EXPERTS (SR T1.3(II))2. .................................................................2
LOCATION AND PROPERTY DESCRIPTION (SR T1.5, SR T1.7)3. .....................................2Location3.1 .....................................................................................................................2Tenements (SV T1.3)3.2 ................................................................................................3Lease Structure3.3 .........................................................................................................4Risks – Legal3.4 .............................................................................................................4
ACCESSIBILITY, CLIMATE, LOCAL RESOURCES AND 4. PHYSIOGRAPHY (SRT1.5 & SRT1.6) .................................................................................5
Accessibility4.1 ...............................................................................................................5Climate4.2 ......................................................................................................................5Local Resources4.3 .......................................................................................................5Infrastructure4.4 .............................................................................................................5Physiography4.5 ............................................................................................................5
HISTORY (SR T1.3, SR T8 & SV T1.4)5. ................................................................................6Exploration History5.1 ....................................................................................................6
Drilling5.1.1 ..........................................................................................................7
Current Exploration and Budget5.2 ................................................................................9
GEOLOGICAL SETTING (SR T2.3, SR T4.1, SR T8 & SV T1.5)6. ........................................9Regional Geology6.1 ......................................................................................................9Local and Property Geology6.2 ....................................................................................10
DEPOSIT TYPE AND MINERALIZATION (SRT2.3 & SRT4.1)7. ..........................................13Structural Interpretation 7.1 ..........................................................................................13
Regional Structure7.1.1 .....................................................................................13
Local Structure 7.1.2 .........................................................................................13
EXPLORATION (SR T2.1 – SRT2.3, SR T4.1 & SR T8)8. ....................................................15Geophysical Characterization8.1 .................................................................................16
Airborne Survey Details 8.1.1 ............................................................................17
Ix
Interpretation 8.1.2 ............................................................................................17
Radiometrics 8.1.2.1 ............................................................................17
Depth of weathering study 8.1.2.2 .......................................................19
Lineament study 8.1.2.3 ......................................................................19
Dyke study 8.1.2.4 ...............................................................................20Pilanesberg Age Dykes 8.1.2.4.1 .......................................20
DRILLING (SR T2.1 – SR T2.3, SR T3.1, SR T3.2 & SR T4.1)9. .........................................21Historical9.1 .................................................................................................................2120089.2 ........................................................................................................................22
SAMPLING METHOD AND APPROACH (SR T2.1, SR T3.1 – 10. SR T3.4 & SR T4.2) ............................................................................................................23
SAMPLE PREPARATION AND ANALYSIS (SR T2.4, SR T3.2 – 11. SR T3.4 & SR T4.2) ............................................................................................................24
Mineral Corporation11.1 .................................................................................................24Sample Preparation 11.1.1 ..................................................................................24
Assay technique 11.1.2 .......................................................................................24
Sample storage 11.1.3 ........................................................................................25
Retention policy for rejects and pulps 11.1.4 .......................................................25
Assaying protocol 11.1.5 .....................................................................................25
Blanks 11.1.5.1 ......................................................................................25
S11.1.5.2 tandards ................................................................................25
Laboratory standards 11.1.5.3 ...............................................................26
Pulp duplicates 11.1.5.4 ........................................................................26
Anglo Platinum11.1.6 ..........................................................................................26
Sample Preparation11.1.7 ...................................................................................27
Assaying Technique11.1.8 ...................................................................................27
DATA VERIFICATION (SR T2.1, SR T3.1 – SR T3.4 & SR T9)12. .........................................27 12.1 Results of the QA/QC programme ........................................................................27
Blanks 12.1.1 .......................................................................................................27
CRM analysis 12.1.2 ...........................................................................................28
Duplicate analysis – external 12.1.3 ....................................................................28
Laboratory internal duplicate analysis 12.1.4 ......................................................28
Conclusion 12.1.5 ................................................................................................28
Security12.2 ...................................................................................................................29
ADJACENT PROPERTIES (SR T1.3)13. ................................................................................29
MINERAL PROCESSING AND METALLURGICAL TESTING 14. (SR T3.2 SR T5.5 & SR T 5.6) ...........................................................................................30
TEChnICAL REPORT On ThE ROODERAnD PROJECTIn ThE nORTh WEST PROVInCE
x
MINERAL RESOURCE AND MINERAL RESERVE ESTIMATES 15. (SR T2.3, SR T2.4, SR T4.1, SR T4.2, SR T5.4, SR T5.7, SR T7, SR T8 & SV T1.6) ...............................................................................................................30
Mineral Resources15.1 ..................................................................................................30 Historical15.1.1 ....................................................................................................30
The Mineral Corporation15.1.2 ............................................................................31
Block Volume Calculation15.1.2.1 .........................................................34
Determination of Individual Seam Thickness15.1.2.2 ...........................35
Exploration Results15.1.3 ....................................................................................36
Summary15.1.4 ...................................................................................................38
Mineral Reserves (SR T5.4, SR T5.5 & SR T5.6)15.2 ...................................................39
ECONOMIC CONSIDERATIONS (SR T1.1, SR T5.1 – SR T5.8, 16. SR T6, SR T8 & SR T11) ....................................................................................................39
Economic Analysis (SR T1.1, SR T1.2, SRT1.7 to SR T1.17 & 16.1 SR T1.19) ................................................................................................................39
Purpose of the Report and Project Outline (SV T1.2)16.1.1 ...............................39
Scope of the Opinion and Reliance on Other Experts 16.1.2 (SV T 2.2, SV T2.11 & SV T2.13) ..............................................................39
Valuation (SV T2)16.1.3 ......................................................................................41
Executive Summary (SV T2.1)16.1.3.1 .................................................41
16.1.3.2 Concluding Opinion of Value ....................................................41
Introduction (SV T2.2)16.1.3.3 ..............................................................41
Scope of Work (SV T2.2)16.1.3.4 ..........................................................41
Identity and Tenure (SV T2.3)16.1.3.5 ...................................................41
History (SV T2.4)16.1.3.6 ......................................................................42
Geological Setting (SV T2.5)16.1.3.7 ....................................................42
Mineral Resources and Mineral Reserves 16.1.3.8 (SV T2.6) ..................................................................................42
Modifying Factors (SV T2.7)16.1.3.9 .....................................................42
Valuation Approaches and Methods 16.1.3.10 (SV T2.8) ..................................................................................42
Cost Valuation Approach16.1.3.10.1 ......................................43Market Valuation Approach16.1.3.10.2 ..................................43
Valuation Date (SV T2.9)16.1.3.11 ..........................................................44
Valuation Summary and Conclusions 16.1.3.12 (SV T2.10 & 2.15) .....................................................................44
Cost Valuation Approach16.1.3.12.1 ......................................44Market Approach16.1.3.12.2 ..................................................44
Valuation Assumptions (SV T2.10)16.1.3.13 ...........................................46
xI
Forward-looking Statements (SV T2.10)16.1.3.14 ..................................46
Sources of Information (SV T2.11)16.1.3.15 ...........................................47
Previous Valuations (SV T2.12)16.1.3.16 ................................................47
Competent Valuator’s Statements (SV T2.14)16.1.3.17 ..........................47
Identifiable Component Asset Values (SV T2.16)16.1.3.18 .....................49
1Historic Verification (SV T2.17)16.1.3.19 ...............................................49
Chromite Market Assessment (SV T2.18)16.1.3.20 ................................49
Audits and Reviews (SV T2.19)16.1.3.21 ................................................49
SUMMARY, CONCLUSIONS, INTERPRETATION (SVT2.10) 16.2 AND RANGES OF VALUES (SV T2.15) .................................................................49
ADDITIONAL REQUIREMENTS FOR TECHNICAL REPORTS ON DEVELOPMENT 17. POPERTIES AND PRODUCTION PROPERTIES (SR T5.1 – SR T5.8, & SR T10) .........................................................................................50
INTERPRETATION AND CONCLUSIONS18. .........................................................................50Interpretation18.1 ...........................................................................................................50
REFERENCES (SV T1.11)19. .................................................................................................51
TEChnICAL REPORT On ThE ROODERAnD PROJECTIn ThE nORTh WEST PROVInCE
xI I
List of TablesTable 1: Project Tenement Details ....................................................................................................... 4Table 2: Summary of the Modeled Remnant Magnetic Dykes ............................................................ 20Table 3: Chrometco – Rooderand 46JQ Portion 2 Drilling .................................................................. 21Table 4: DCM – Rooderand 46JQ Portion 2 Drilling ........................................................................... 22Table 5: Analytical Detection Limits for ALS Chemex Laboratory ....................................................... 24Table 6: Certified selected analyses of SARM 72 .............................................................................. 25Table 7: Target ranges for internal laboratory standard STSD-4 ........................................................ 26Table 8: Target ranges for internal laboratory standard SARM 5 ........................................................ 26Table 9: Target ranges for internal laboratory standard SCH-1 .......................................................... 26Table 10: Average Composition and Thicknesses of Chromitite Seams in Ruighoek ........................... 30Table 11: Mineral Resources in Portion 2 – No Geological Losses – Not SAMREC Compliant ............ 31Table 12: Mineral Resources in Portion 2 – With Geological Losses – Not SAMREC Compliant ......... 31Table 13: Indicated Mineral Resources in Rooderand 46JQ and Remainder Portion 2 – SAMREC
Compliant ............................................................................................................................. 31Table 14: Inferred Mineral Resources in Rooderand 46JQ and Remainder Portion 2 –
SAMREC Compliant ............................................................................................................. 32Table 15: Average Seam Thickness for Rooderand ............................................................................. 35Table 16: Exploration Results – Balance of DCM Area – As Per Bleeker – Not SAMREC Compliant ... 36Table 17: Indicated Mineral Resources – DCM Area – Mineral Corp. 2008 – SAMREC Compliant ...... 39Table 18: Exploration Target – Balance of DCM Area – Not SAMREC Compliant ................................ 39Table 19: Source Documentation ......................................................................................................... 40Table 20: Acceptable Methods of Mineral Project Valuation ................................................................. 42Table 21: PEMs for Exploration Projects .............................................................................................. 43Table 22: Historic and Future Exploration Expenditure ........................................................................ 44Table 23: Market Approach Valuation Summary .................................................................................. 46
List of FiguresFigure 1: Location Map ......................................................................................................................... 3Figure 2: Detailed Tenement Map ......................................................................................................... 4Figure 3: Regional Farm Boundary Map................................................................................................ 7Figure 4: Drillhole Location Map ........................................................................................................... 8Figure 5: Geological Map of the Bushveld Complex ............................................................................ 10Figure 6: General Stratigraphy of the Western Bushveld Sequence .................................................... 11Figure 7: Regional Geological Map ..................................................................................................... 12Figure 8 : Relief Shading and Landsat ................................................................................................. 14Figure 9 : Landsat and Structural Features .......................................................................................... 15Figure 10: Map Showing Chrometco Drillholes and Mining Pits ............................................................ 16Figure 11: Landsat Image ..................................................................................................................... 17Figure 12: Total Field Magnetics (left) and Terrain (right) ...................................................................... 18Figure 13: Composite Image of Rooderand ........................................................................................... 18Figure 14: Calculated Weathering Depths ............................................................................................. 19Figure 15: Modeled Pilanesberg Aged Dykes ........................................................................................ 20Figure 16: Drillhole Locations – All Holes .............................................................................................. 23Figure 17: LG Resource Block Plan – DCM Chrome – As Per Mineral Corporation .............................. 33Figure 18: MG Resource Block Plan – DCM Chrome – As Per Mineral Corporation.............................. 34Figure 19: Re-Calculated Exploration Results – Balance of DCM Chrome Area – As Per Bleeker ........ 37Figure 20: Re-Calculated Exploration Target Blocks – As Per Bleeker .................................................. 38Figure 21: Venmyn Chromite Valuation Curve Indicating the Project’s Value ........................................ 45
1
INTRODUCTION1.
The directors of Chrometco Limited (“Chrometco”) requested that Independent Resource Estimations (“IRES”) prepare a Competent Person’s Report (“CPR”) compliant with the South African Mineral Resource Code (“SAMREC”), incorporating a valuation (“the Valuation”) compliant with the South African Code for the Reporting of Mineral Asset Valuation (“SAMVAL”), and finally compliant with the new Section 12 Listings Requirements of the Johannesburg (“JSE”), for their Rooderand Project.
This CPR incorporates the Valuation completed by Venmyn Rand (Pty) Limited (“Venmyn”) entitled: “Independent Valuation in Accordance with the SAMVAL Code on the Rooderand Project for Chrometco” by Derick de Wit of Venmyn.
Terms of Reference1.1
This report has been prepared in accordance with the guidelines provided in SAMREC. The Competent Person, in terms of the SAMREC Code, responsible for this report is Mr. Dexter S. Ferreira, Senior Geostatistician and Mining Engineer at IRES.
Scope of Work1.2
The scope of work, undertaken by IRES, involved compiling all available information up to the end of January 9th, 2011 for the Client’s chrome assets, and assemble a Competent Persons Report compliant with SAMREC, SAMVAL and Section 12 requirements of the JSE.
Effective Date1.3
The effective date of this report is the 10th January, 2011.
Statement1.4
All requirements of Section 12.9 of the JSE Listings Requirements, the SAMREC Code (including Table 1, and the SAMVAL Code (including Table 2) have been complied with in preparing this report.
Units1.5
Unless explicitly stated, all units presented in this report are in the Système Internationale (i.e. metric tonnes, kilometers, meters, and centimeters).
Qualifications of Consultant1.6
Dexter S. Ferreira visited the Project in January 2011. During his visit Mr. Ferreira observed the Project’s current mining activities, and examined the outcropping of various chrome horizons within the pits. This report has been prepared based on a technical review by the author. Mr. Ferreira is a senior geostatistician with over 20 years experience in project evaluation internationally, including extensive involvement with mineral projects throughout Canada, South America and Africa. He is a member of the South African Council for Natural Scientific Professions, and qualifies as an ‘Expert’, ‘Competent Person’ and ‘Qualified Person’ as defined in National Instrument 43-101 and the JORC Code.
The author of this report has not, or has not previously had, any material interest in Chrometco or any of the mineral properties in which Chrometco has an interest. The relationship with Chrometco is solely one of professional association between client and independent consultant. This report is
12.9(a)
2.9(e)
12.9(c)
Technical ReportOn the Rooderand Project
TEChnICAL REPORT On ThE ROODERAnD PROJECTIn ThE nORTh WEST PROVInCE
2
prepared in return for professional fees based upon agreed commercial rates and the payment of these fees is in no way contingent on the results of this report.
Basis of Report1.7
IRES have prepared this report exclusively for Chrometco. The information presented, opinions and conclusions stated, have made use of information from the following documents:
Exploration Results and Mineral Resource Estimates for Chrome Deposits on the Farm •Rooderand 46JQ, by The Mineral Corporation, June, 2009;
A Competent Persons Report on the Mineral Assets of Chrometco Ltd, by Mr. N.A.Bleeker, •21st of March, 2005;
The report “Independent Valuation in Accordance With the SAMVAL Code on the Rooderand •Project For Chrometco”, by Mr. Derick R. de Wit, Venmyn Rand (Pty) Ltd., 6th of January, 2011;
Information available at the time of the preparation of the report as provided by •Chrometco;
Assumptions, conditions and qualifications as set forth in the report;•
Data, reports and opinions from third party entities.•
IRES has not independently conducted any title or other searches but has relied upon Chrometco for information on the status of the claims, property title, agreements and other pertinent conditions.
RELIANCE ON OTHER EXPERTS (SR T1.3(ii))2.
In compiling this CPR, IRES, made use and relied upon the independent opinion of the experts to the extent and context specified in the Table below. IRES has received full consent from the resepective authors to utilize their material.
Source Documentation
ExPERT COMPANYTYPE OF STUDY
DATE ExTENT OF RELIANCE
Bleeker, N.A. N.A. Bleeker Geological Services cc.
CPR March 2005 A Competent Persons Report on the mineral assets of Chrometco Limited for
the purpose of listing on the JSEMineral
CorporationThe Mineral Corporation CPR June 2009 Exploration Results and Mineral Resource
Estimates for Chrome Deposits on the Farm Rooderand 46JQ.
Bleeker, N.A. N.A. Bleeker Geological Services cc.
Memo November 2010
Recalculation of Potential Mineral Resources of Portion 2 and Remainder Extent of the Farm Rooderand 46JQ.
De Wit Venmyn Rand Valuation January 2011 Independent valuation of the Rooderand Project.
Full written permissions have been obtained from these authors to use their reports in the preparation of this CPR.
LOCATION AND PROPERTY DESCRIPTION (SR T1.5, SR T1.7)3.
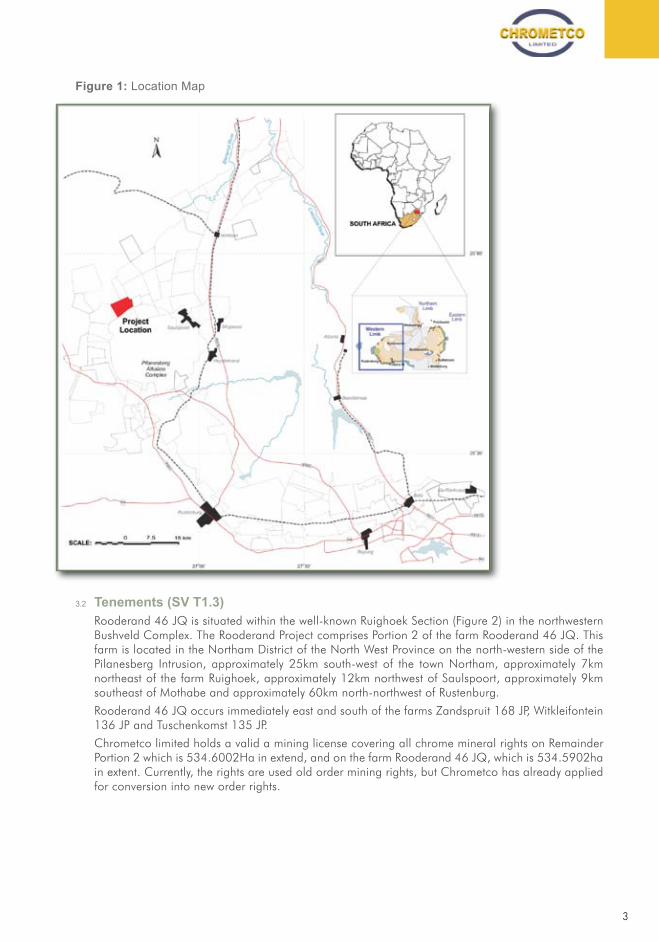
Location3.1
The Rooderand project is located approximately 60km north northwest of Rustenberg and can be accessed by route R565 from Rustenburg through Boshoek as well as the main road between Mabeskraal and Saulspoort; see Figure 1.
12.9(h)iii
3
Figure 1: Location Map
Tenements (SV T1.3)3.2
Rooderand 46 JQ is situated within the well-known Ruighoek Section (Figure 2) in the northwestern Bushveld Complex. The Rooderand Project comprises Portion 2 of the farm Rooderand 46 JQ. This farm is located in the Northam District of the North West Province on the north-western side of the Pilanesberg Intrusion, approximately 25km south-west of the town Northam, approximately 7km northeast of the farm Ruighoek, approximately 12km northwest of Saulspoort, approximately 9km southeast of Mothabe and approximately 60km north-northwest of Rustenburg.
Rooderand 46 JQ occurs immediately east and south of the farms Zandspruit 168 JP, Witkleifontein 136 JP and Tuschenkomst 135 JP.
Chrometco limited holds a valid a mining license covering all chrome mineral rights on Remainder Portion 2 which is 534.6002Ha in extend, and on the farm Rooderand 46 JQ, which is 534.5902ha in extent. Currently, the rights are used old order mining rights, but Chrometco has already applied for conversion into new order rights.

TEChnICAL REPORT On ThE ROODERAnD PROJECTIn ThE nORTh WEST PROVInCE
4
Lease Structure3.3
Chrometco currently holds the rights to the farm Remainder Rooderand 46JQ and Remaining Portion 2, in South Africa; a total of 1,069.1904Ha. See Table 1 a detailed description and Figure 1 and Figure 2 for their location.
Table 1: Project Tenement Details
PortionsSurface Right
HolderRight
ClassificationRight
HolderLicense Area Ha
Rooderand 46JQ State of the Republic of South Africa
Used Old Order Mining Right (ML4/97 was issued to Chrometco on July 28, 1997 (conversion to
new order mining right in progress)
Pilanesberg Mining Co.
(Pty) Ltd.
534.5902
Portion 2 State of the Republic of South Africa
Used Old Order Mining Right (ML5/97 was issued to Chrometco on July 28, 1997 (conversion to
new order mining right in progress)
Pilanesberg Mining Co.
(Pty) Ltd.
534.6002
Figure 2: Detailed Tenement Map
Risks – Legal3.4
The South African government has implemented a variety of laws which seek to redress the economic imbalances which arose through the apartheid laws. These laws are aimed at uplifting the previously disadvantaged groups through equity ownership, corporate social responsibility programs and employment equity legislation. The new minerals and mining laws for example provide for such black economic empowerment for the granting of mining rights.
5
One of the major legal risks is the conversion of its old order mineral rights into new order mining rights under the Minerals and Petroleum Resources Development Act No. 28 of 2002 (“the Act”). The Act has placed all mineral rights under the ownership of the state. Persons owning rights under the old legislation had until April 2009 to convert them into new order mining rights. In order to ensure that conversion takes place, Chrometco will comply with the mining charter in respect of broad based black economic empowerment. As of the date of this report, Chrometco’s rights conversion is still pending.
ACCESSIBILITY, CLIMATE, LOCAL RESOURCES AND PHYSIOGRAPHY (SRT1.5 & 4.
SRT1.6)
Accessibility4.1
This Project can be accessed by the R565 from Rustenburg through Boshoek as well as the main road between Mabeskraal and Saulspoort. The property is accessed by a surface all-weather internal road system and local gravel roads.
Climate4.2
The climate at Chrometco’s Rooderand area is typical of the South African Highveld; maximum temperatures in summer between 27°C to 38°C and minimum temperatures during winters between 7° to 11°C.
Precipitation is typically in the form of thunderstorms throughout summer. Although sudden downpours pose some risk of flooding in low-lying areas, most South African mines are exposed to this weather and precautionary measures are routine on most operations. The average annual rainfall is within the range of 380mm to 700mm, with the peak of the rainy season occurring in January. Winters are typically dry and sunny, while moderate climate means that exploration and mining operations can be undertaken throughout the year, without extraordinary measures.
Local Resources4.3
Throughout the exploration phases at the various concessions, the Company has given assistance to local artisanal miners to mine and process larger volumes of material.
In addition, the Company has drilled a number of boreholes for the provision of drinking water at various community sites.
Infrastructure4.4
Electricity may be sourced from a nearby 88kV power line on the farm Wilgespruit, which forms part of the ESKOM national grid and runs directly west of Rooderand; whilst water is mainly obtained from boreholes.
Physiography4.5
The prospect area is characterized by relatively low ground slope angles, mainly flat, slightly undulating topography with only one prominent topographical high, namely the Pilanesberg Complex Mountain which borders the property toward the south of the farm.
Rooderand lies at elevations of between 1085m to 1140m, and is mostly soil covered. An intermittent stream flows north-westwards along the western farm boundary from the Pilanesberg into the Motlhabe River, with the intermittent Bierspruit, Wilgespruit and Lesele non-perennial streams draining north-eastwards across the eastern part of the farm.
Most of the area is covered by surficial deposits (red clays, black turf etc.) derived from the weathering of the underlying Bushveld Complex and adjacent Pilanesberg Complex rocks.
TEChnICAL REPORT On ThE ROODERAnD PROJECTIn ThE nORTh WEST PROVInCE
6
HISTORY (SR T1.3, SR T8 & SV T1.4)5.
Chrometco acquired the Rooderand mining rights in early 2004 and when it listed in August 2005 the intention was to undertake further exploration work on this farm, with the ultimate aim of proving-up chromite mineral tonnage.
The company announced on 27 September, 2007, that it had entered into a conditional sales agreement with a private company, DCM Chrome (Pty) (“DCM”), for the Rooderand chrome project for R60m in cash. The farm Rooderand covers an area of 534.6ha and is underlain by three commercially viable chrome-bearing horizons, the LG6, the LG5 and the MG4 chromitite layers.
Exploration History5.1
Various small open-pit and underground mines have exploited chrome seams such as the LG1, LG2, LG5, LG6 and MG4A on the farms Ruighoek 169 JP, Vlakfontein 164 JP, Rooderand 46 JQ, Vogelstruisnek 173 JP, Groenfontein 138 JP and Palmietfontein 208 JP since the 1920’s. Two mines are still in operation, on the southern portion of the farm Ruighoek (S A Chrome’s Horizon Mine) and at the farm Groenfontein (Rustenburg Minerals/Assore mine). Samancor previously mined and operated (stopped end of 1999) a small ferrochrome smelter at their Bathlako Chrome Mine on the northern portion of the farm Ruighoek, where the housing and some mining infrastructure is still on care and maintenance; see Figure 3.
Northward projection of the chromitite seams onto the farms Zandspruit, Tuschenkomst and Rooderand is based on the distribution of mine workings.
In 2004 and 2005 aeromagnetic surveys were done on selected areas of the Pilanesberg Complex. These were high resolution surveys that enabled the delineation of transgressive faults and dykes within the area. The survey covered the Ruighoek, Witkeifontien, Palmietfontien and Tuschenkomst farms, and their results have been made available in the public domain.
7
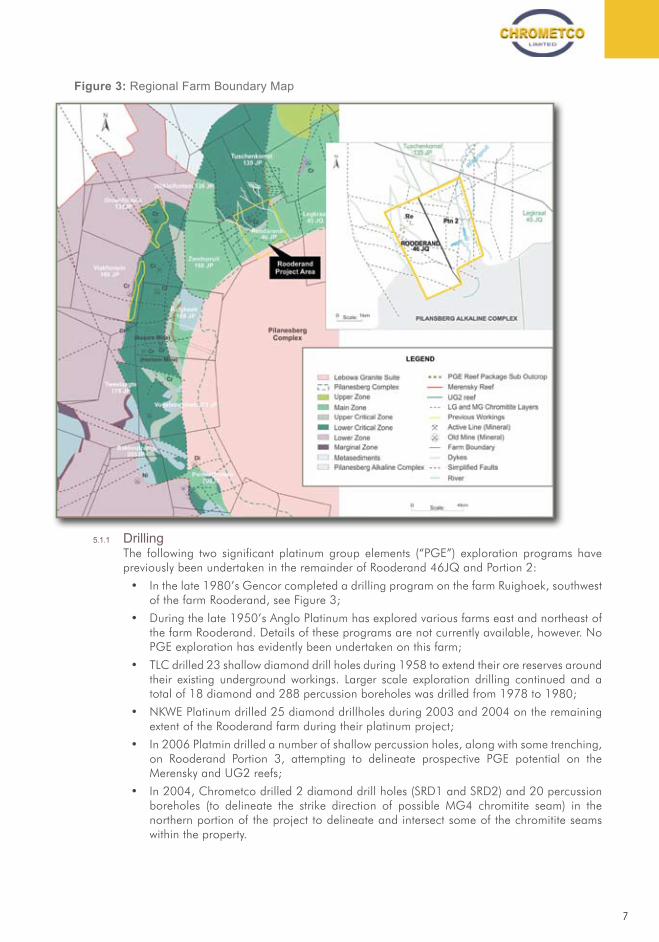
Figure 3: Regional Farm Boundary Map
Drilling5.1.1
The following two significant platinum group elements (“PGE”) exploration programs have previously been undertaken in the remainder of Rooderand 46JQ and Portion 2:
In the late 1980’s Gencor completed a drilling program on the farm Ruighoek, southwest •of the farm Rooderand, see Figure 3;
During the late 1950’s Anglo Platinum has explored various farms east and northeast of •the farm Rooderand. Details of these programs are not currently available, however. No PGE exploration has evidently been undertaken on this farm;
TLC drilled 23 shallow diamond drill holes during 1958 to extend their ore reserves around •their existing underground workings. Larger scale exploration drilling continued and a total of 18 diamond and 288 percussion boreholes was drilled from 1978 to 1980;
NKWE Platinum drilled 25 diamond drillholes during 2003 and 2004 on the remaining •extent of the Rooderand farm during their platinum project;
In 2006 Platmin drilled a number of shallow percussion holes, along with some trenching, •on Rooderand Portion 3, attempting to delineate prospective PGE potential on the Merensky and UG2 reefs;
In 2004, Chrometco drilled 2 diamond drill holes (SRD1 and SRD2) and 20 percussion •boreholes (to delineate the strike direction of possible MG4 chromitite seam) in the northern portion of the project to delineate and intersect some of the chromitite seams within the property.
TEChnICAL REPORT On ThE ROODERAnD PROJECTIn ThE nORTh WEST PROVInCE
8
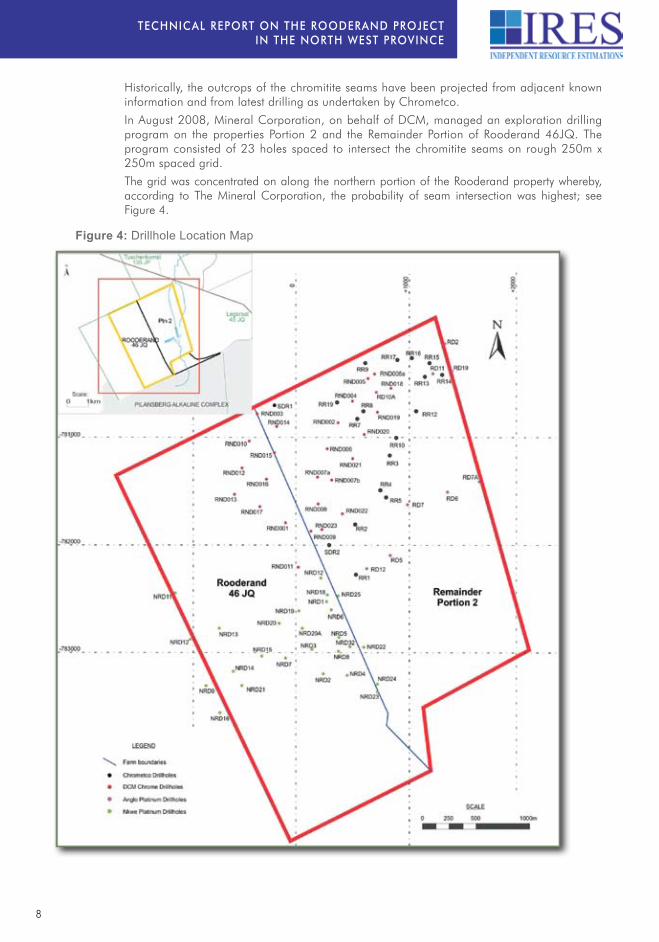
Historically, the outcrops of the chromitite seams have been projected from adjacent known information and from latest drilling as undertaken by Chrometco.
In August 2008, Mineral Corporation, on behalf of DCM, managed an exploration drilling program on the properties Portion 2 and the Remainder Portion of Rooderand 46JQ. The program consisted of 23 holes spaced to intersect the chromitite seams on rough 250m x 250m spaced grid.
The grid was concentrated on along the northern portion of the Rooderand property whereby, according to The Mineral Corporation, the probability of seam intersection was highest; see Figure 4.
Figure 4: Drillhole Location Map
9
Current Exploration and Budget5.2
Given that the most current exploration and resource delineation work has been only been completed within the DCM area (i.e. a small area on the northern part of Remainder Rooderand 46JQ and Portion 2), which represents a small portion of Chrometco’s mineral rights, the chrome resource tonnages are SAMREC compliant and have been classified into appropriate categories. The remaining area of Chrometco’s interest does not currently have any exploration work that has intersected chrome seams; the intersections of the Merensky Reef and UE2 have been used to confirm the structure of the area, which have identified chrome seam targets.
It is anticipated that Chrometco will undertake modern sampling and assay of the boreholes drilled in the larger area over the next few months. This will be done with the full cooperation of the owners of the boreholes and anticipates rapid conversion of these Exploration Results to a SAMREC code category, inferred or higher. It should also be noted that the company will seek to assay the boreholes from the DCM area for PGE’s to the extent that the full commercial opportunities for both chrome and PGE’s can be evaluated in future.
GEOLOGICAL SETTING (SR T2.3, SR T4.1, SR T8 & SV T1.5)6.
Regional Geology6.1
The Bushveld Complex is an extremely large, saucer–shaped, layered igneous intrusion occurring in the northern part of the country within the boundaries of South Africa.
The complex comprises an array of diverse igneous rocks ranging in composition from ultramafic to felsic. It is generally understood that the Bushveld Complex was formed by the repeated injection of magma into an enormous chamber. Due to the huge volumes of magma involved, cooling and subsequent mineral crystallization out of the magma was a slow process. Different minerals were formed as the magma cooled. These minerals accumulated into sub–horizontal layers, building from the base of the chamber. These processes were repeated by the intermittent replenishment and addition of existing and new magma as the case may be, thus producing a repetition of the mineral layering.
Some individual layers or groups of layers can be traced for hundreds of kilometers. This layered sequence, the Rustenburg Layered Suite, comprises five principal zones, the Marginal, Lower, Critical, Main and Upper Zones. The Bushveld Complex, dipping in general to the centre of the complex, is, horizontally, roughly clover–leaf shaped, consisting of four compartments or limbs, the western, eastern, northern and southern limbs, in order of economic importance; see Figure 5.
TEChnICAL REPORT On ThE ROODERAnD PROJECTIn ThE nORTh WEST PROVInCE
10
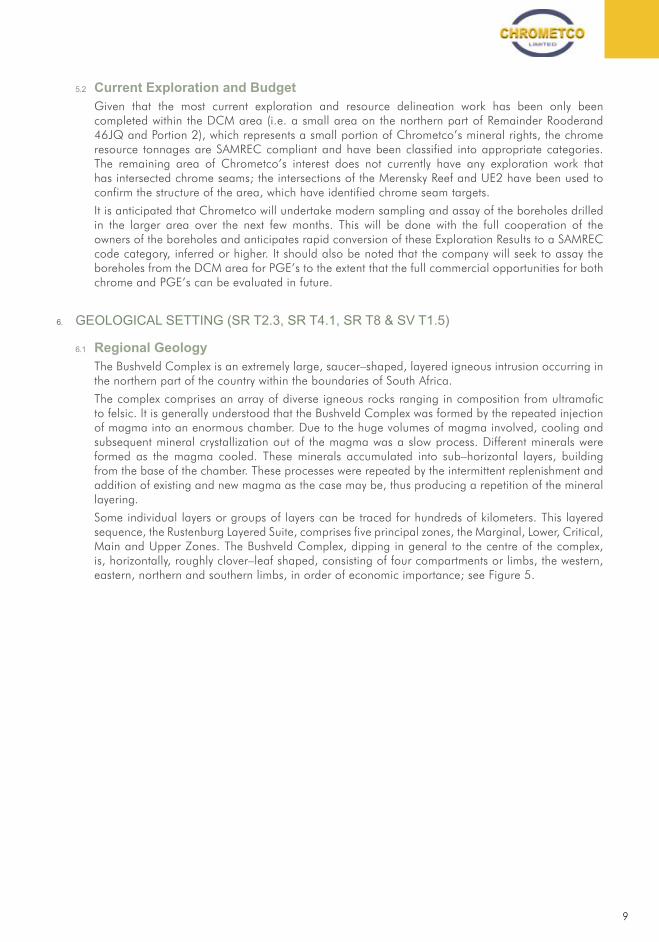
Figure 5: Geological Map of the Bushveld Complex
The Bushveld Complex is unique both in its size, covering an aerial extent of some 66,000sqkm and in the economic importance of its minerals. Contained within the well–layered ultramafic to mafic succession are two horizons in the Critical Zone which host economically exploitable quantities of precious metals, namely the Merensky Reef and the underlying UG2 Reef. These two economic horizons can be traced for hundreds of kilometers around the complex.
A significant geological feature in this area is the Pilanesberg alkaline Intrusion. This circular volcanic complex is 27km in diameter, and intruded the Bushveld Complex some 1.3 billion years ago. It is characterized by rugged topography at elevations of 1150m to over 1500m, compared with the surrounding flat-lying areas at 1050 to 1150m. Bushveld mafic and ultramafic rocks form a 10 to 20km wide belt around the western and northern side of this intrusion. These rocks are mainly from the Marginal, Lower, Critical and Main zones, and have a north to northeast strike with regional dips of between 8° to 25° to the east and southeast. Dips appear to increase from 8°
to 12° on the farm Ruighoek to 8° to 25° in the farm Rooderand area.
Local and Property Geology6.2
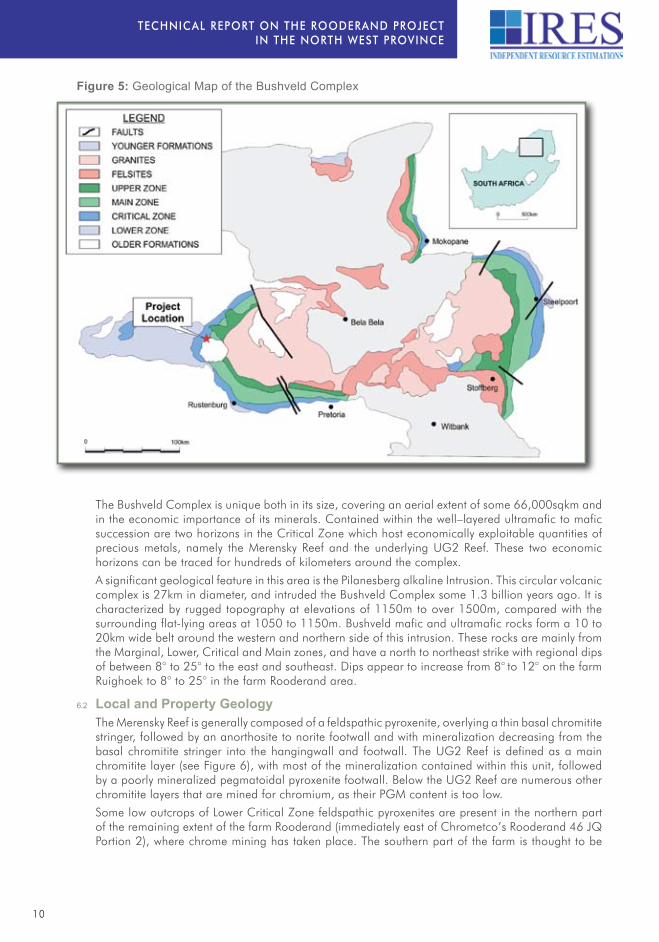
The Merensky Reef is generally composed of a feldspathic pyroxenite, overlying a thin basal chromitite stringer, followed by an anorthosite to norite footwall and with mineralization decreasing from the basal chromitite stringer into the hangingwall and footwall. The UG2 Reef is defined as a main chromitite layer (see Figure 6), with most of the mineralization contained within this unit, followed by a poorly mineralized pegmatoidal pyroxenite footwall. Below the UG2 Reef are numerous other chromitite layers that are mined for chromium, as their PGM content is too low.
Some low outcrops of Lower Critical Zone feldspathic pyroxenites are present in the northern part of the remaining extent of the farm Rooderand (immediately east of Chrometco’s Rooderand 46 JQ Portion 2), where chrome mining has taken place. The southern part of the farm is thought to be
11
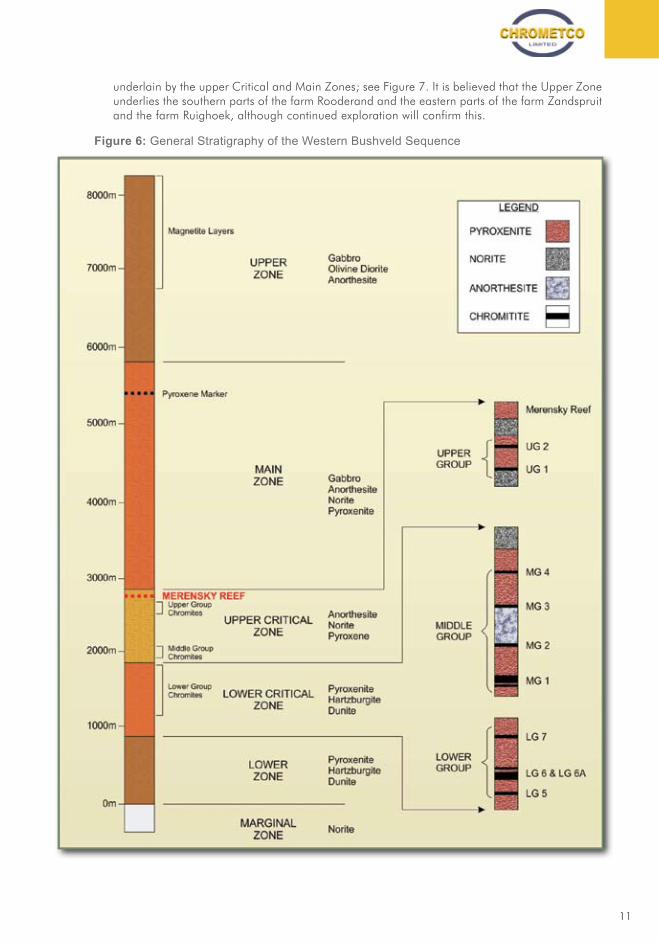
underlain by the upper Critical and Main Zones; see Figure 7. It is believed that the Upper Zone underlies the southern parts of the farm Rooderand and the eastern parts of the farm Zandspruit and the farm Ruighoek, although continued exploration will confirm this.
Figure 6: General Stratigraphy of the Western Bushveld Sequence
TEChnICAL REPORT On ThE ROODERAnD PROJECTIn ThE nORTh WEST PROVInCE
12
Recent percussion drilling indicated that the MG4 sub-outcrops within and that the LG chromitite seams sub-outcrops north of the project area.
The LG 5 chromitite seam consists of three chromitite layers with intercalated pyroxenite layers, both the LG 6 and MG4 consists of massive chrome layers with occasional thin pyroxenite lenses.
Figure 7: Regional Geological Map

13
DEPOSIT TYPE AND MINERALIZATION (SRT2.3 & SRT4.1)7.
The LG, MG and UG chromitite seams and Merensky Reef are all developed in the project area. From available data it appears that the UG2 is about 140m above the MG4, which is in turn 250m above the LG6 seam. The Critical-Main Zone contact is thought to be about 110m above the UG2 reef on this farm.
Small-scale open pit and underground mining of chromitite has been undertaken by TLC on the northern part (Remaining Extent) of the farm Rooderand, extending northwards onto the farm Witkleifontein (see Figure 7). The strike extent of these abandoned workings is approximately 2km. The chromitite seams have a northeast to north-northeast strike, with dips of 10
o
- 30° to the southeast and east-southeast.
The grade values obtained from TLC’s evaluation/exploration drilling on Rooderand 46 JQ REM are remarkably consistent down dip to about 200m in depth. Analyses were undertaken by three independent laboratories (TLC, Rock Labs Inc. and Steffen Robertson and Kirsten Ltd.). The average grade of the LG6 ore body is calculated as 44.30% Cr2O3, a Cr/Fe ratio of 1.57 and SiO2 of 2.71% over an average thickness of 90cm.
The LG6 and LG5 chromitite layers were intersected by one borehole SDR1, drilled by Chrometco and the average grades were 45.26% Cr2O3 and 24.42% Fe2O3 for the LG6 chromitite layer and 39.30% Cr2O3 and 18.78% Fe2O3 for LG5 chromitite layer. It was decided not to sample MG1 to MG3 chromitite layers intersected in SDR2 due to their thinness.
Structural Interpretation 7.1
Regional Structure 7.1.1
It is inferred that the structural deformation of the Bushveld Complex has occurred at an early stage of its intrusion and cooling history. Previously propagated fault-systems already in place were utilized to create the deep-seated crustal extension necessary for the emplacement of the Bushveld Complex. Amongst these fault systems are the Thabazimbi Murchison Lineament, the Vlakfontein Fault, the Rustenburg Fault, possibly the Steelpoort Fault and many others. These faults were re-activated, and propagated into the cooling Bushveld Complex. All prominent fault orientations are evident in the Bushveld Complex, but commonly exhibit smaller displacements than during their respective previous tectonic history.
The described fault orientations visible in the north-western Bushveld region have been re-activated during post-Bushveld and pre- and post-Pilanesberg times, as these fault orientations are evident within the Pilanesberg Complex. With Rooderand being so close to the Pilanesberg Complex, a considerabla amount of radial faulting and dyke emplacement has changed the orientation of the chroimitite seams. A number of faults were exposed during trenching and drilling acitiveyt on Ruighoek, Witkleifontein, Rooderand and Tuschenkomst. A number of these faults have a curved nature southwardly and end at the Pilanesberg Complex. Recent open pit observations at Rooderand substantiate the presence of these faults exhibiting a fluctuating dip from 0° to 40° whilst possessing a wide degree of variability in strke.
Local Structure 7.1.2
It is inferred from the aeromagnetic imagery that ENE-WSW striking faults, currently inhabited by positive magnetic dykes, exhibit a sinistral strike-slip displacement (Figure 8 and Figure 9). The NW-SE striking faults, which are currently inhibited by negative magnetic dykes, appear to be dextral in displacement. These faults are parallel to the Rustenburg Fault and are inferred to be related to it. This assumption would confirm the dextral displacement postulated by Bumby (1998). North-South striking faults are common, but are not inhibited by dykes. These faults appear to be sinistral in displacement; however, in the case of shallow dipping layers, the faults could be pure dip-slip dominated faults (i.e. normal faults).
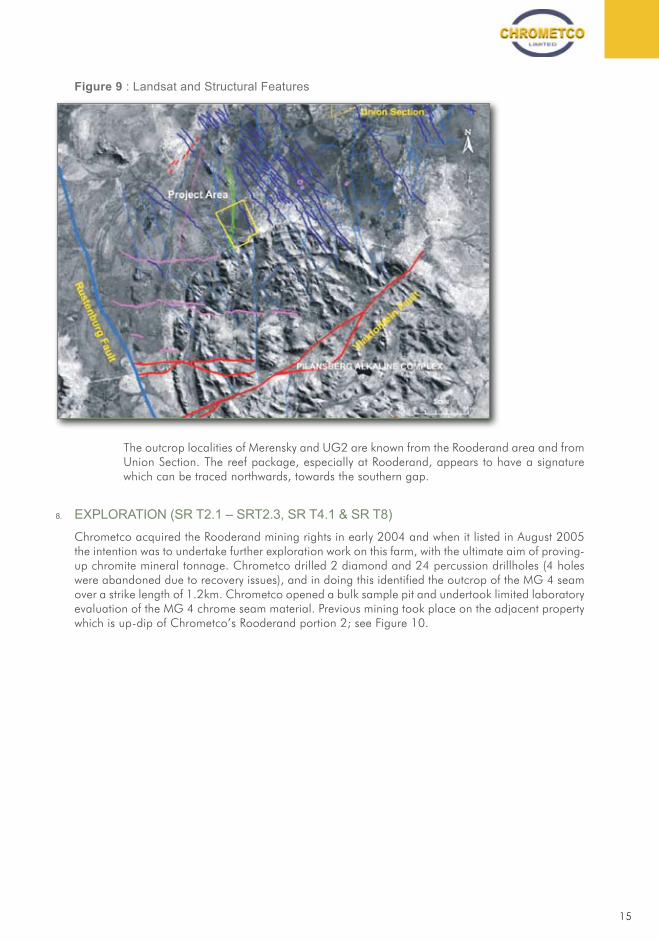
Figure 9 shows a black and white Landsat image overlain with structural features observed from aeromagnetic and Landsat data. The Union Section boundary in the north, negative dykes in blue, positive dykes in pink, faults in light blue, Merensky and UG2 outcrop in green.
TEChnICAL REPORT On ThE ROODERAnD PROJECTIn ThE nORTh WEST PROVInCE
14
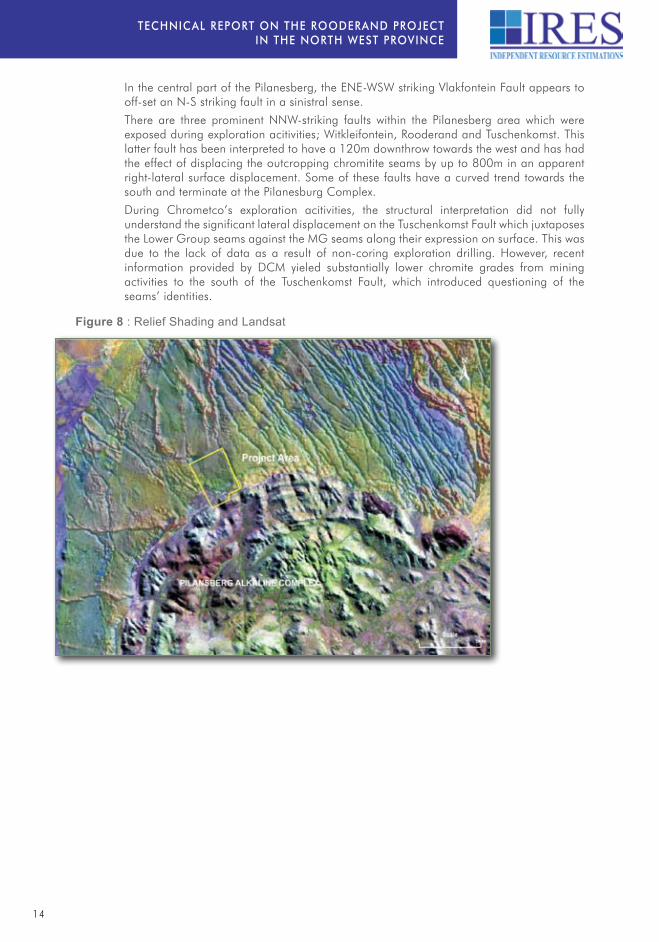
In the central part of the Pilanesberg, the ENE-WSW striking Vlakfontein Fault appears to off-set an N-S striking fault in a sinistral sense.
There are three prominent NNW-striking faults within the Pilanesberg area which were exposed during exploration acitivities; Witkleifontein, Rooderand and Tuschenkomst. This latter fault has been interpreted to have a 120m downthrow towards the west and has had the effect of displacing the outcropping chromitite seams by up to 800m in an apparent right-lateral surface displacement. Some of these faults have a curved trend towards the south and terminate at the Pilanesburg Complex.
During Chrometco’s exploration acitivities, the structural interpretation did not fully understand the significant lateral displacement on the Tuschenkomst Fault which juxtaposes the Lower Group seams against the MG seams along their expression on surface. This was due to the lack of data as a result of non-coring exploration drilling. However, recent information provided by DCM yieled substantially lower chromite grades from mining activities to the south of the Tuschenkomst Fault, which introduced questioning of the seams’ identities.
Figure 8 : Relief Shading and Landsat
15
Figure 9 : Landsat and Structural Features
The outcrop localities of Merensky and UG2 are known from the Rooderand area and from Union Section. The reef package, especially at Rooderand, appears to have a signature which can be traced northwards, towards the southern gap.
EXPLORATION (SR T2.1 – SRT2.3, SR T4.1 & SR T8)8.
Chrometco acquired the Rooderand mining rights in early 2004 and when it listed in August 2005 the intention was to undertake further exploration work on this farm, with the ultimate aim of proving-up chromite mineral tonnage. Chrometco drilled 2 diamond and 24 percussion drillholes (4 holes were abandoned due to recovery issues), and in doing this identified the outcrop of the MG 4 seam over a strike length of 1.2km. Chrometco opened a bulk sample pit and undertook limited laboratory evaluation of the MG 4 chrome seam material. Previous mining took place on the adjacent property which is up-dip of Chrometco’s Rooderand portion 2; see Figure 10.
TEChnICAL REPORT On ThE ROODERAnD PROJECTIn ThE nORTh WEST PROVInCE
16
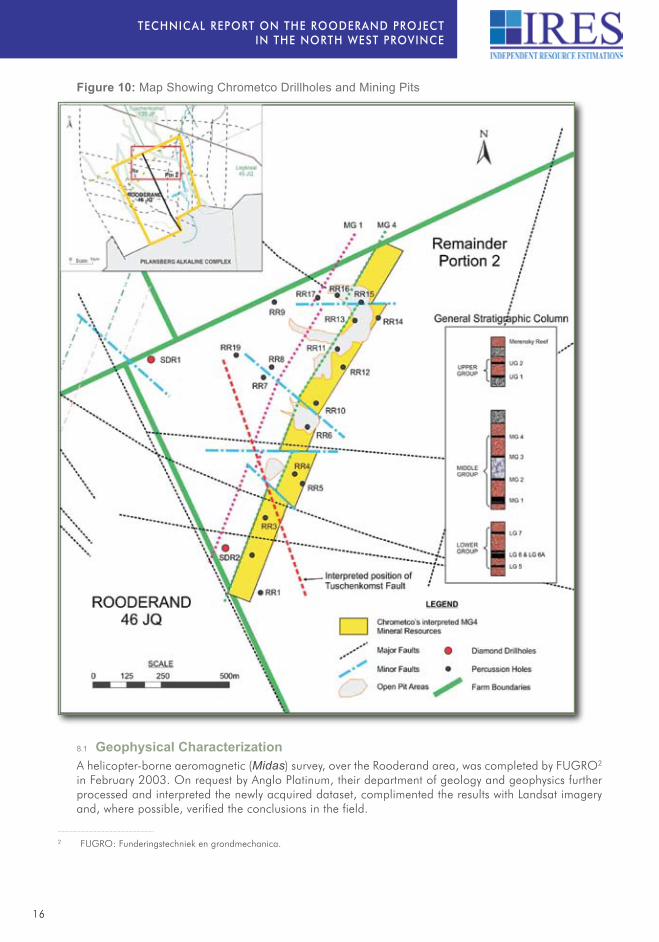
Figure 10: Map Showing Chrometco Drillholes and Mining Pits
Geophysical Characterization8.1
A helicopter-borne aeromagnetic (Midas) survey, over the Rooderand area, was completed by FUGRO2 in February 2003. On request by Anglo Platinum, their department of geology and geophysics further processed and interpreted the newly acquired dataset, complimented the results with Landsat imagery and, where possible, verified the conclusions in the field.
2 FUGRO: Funderingstechniek en grondmechanica.
17
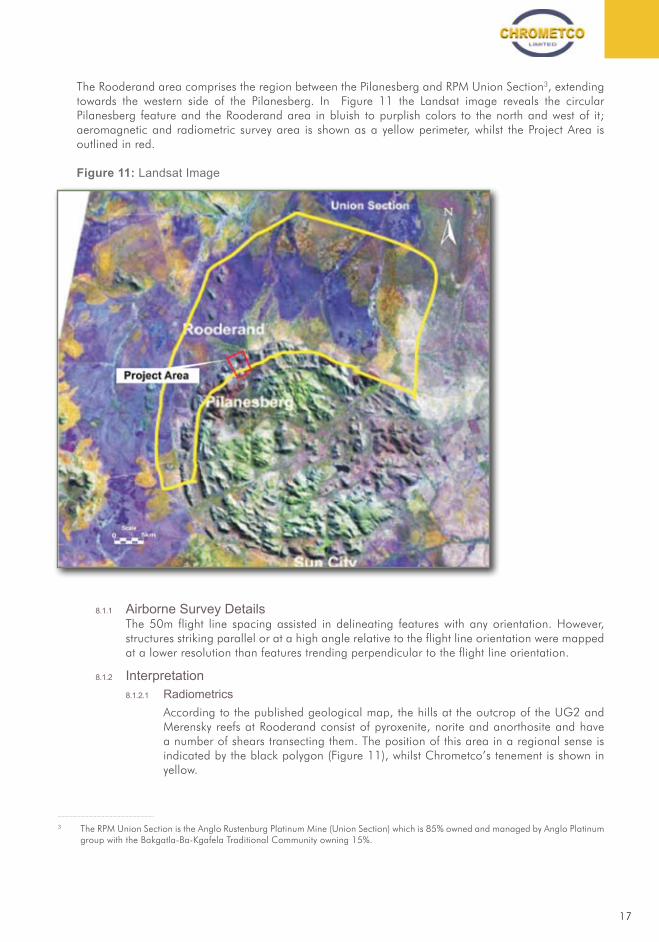
The Rooderand area comprises the region between the Pilanesberg and RPM Union Section3, extending towards the western side of the Pilanesberg. In Figure 11 the Landsat image reveals the circular Pilanesberg feature and the Rooderand area in bluish to purplish colors to the north and west of it; aeromagnetic and radiometric survey area is shown as a yellow perimeter, whilst the Project Area is outlined in red.
Figure 11: Landsat Image
Airborne Survey Details 8.1.1
The 50m flight line spacing assisted in delineating features with any orientation. However, structures striking parallel or at a high angle relative to the flight line orientation were mapped at a lower resolution than features trending perpendicular to the flight line orientation.
Interpretation 8.1.2
Radiometrics 8.1.2.1
According to the published geological map, the hills at the outcrop of the UG2 and Merensky reefs at Rooderand consist of pyroxenite, norite and anorthosite and have a number of shears transecting them. The position of this area in a regional sense is indicated by the black polygon (Figure 11), whilst Chrometco’s tenement is shown in yellow.
3 The RPM Union Section is the Anglo Rustenburg Platinum Mine (Union Section) which is 85% owned and managed by Anglo Platinum group with the Bakgatla-Ba-Kgafela Traditional Community owning 15%.
TEChnICAL REPORT On ThE ROODERAnD PROJECTIn ThE nORTh WEST PROVInCE
18
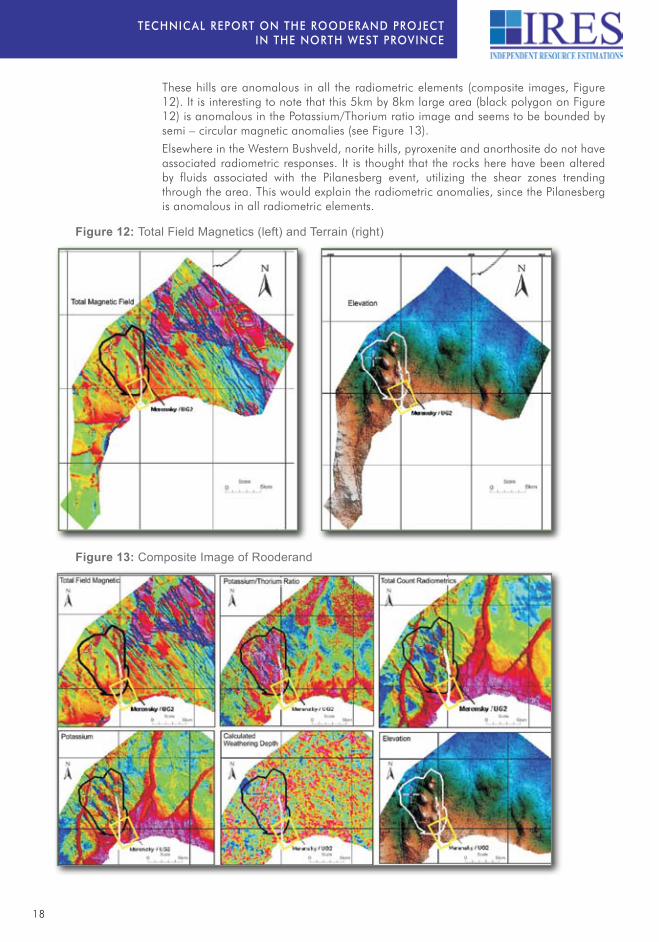
These hills are anomalous in all the radiometric elements (composite images, Figure 12). It is interesting to note that this 5km by 8km large area (black polygon on Figure 12) is anomalous in the Potassium/Thorium ratio image and seems to be bounded by semi – circular magnetic anomalies (see Figure 13).
Elsewhere in the Western Bushveld, norite hills, pyroxenite and anorthosite do not have associated radiometric responses. It is thought that the rocks here have been altered by fluids associated with the Pilanesberg event, utilizing the shear zones trending through the area. This would explain the radiometric anomalies, since the Pilanesberg is anomalous in all radiometric elements.
Figure 12: Total Field Magnetics (left) and Terrain (right)
Figure 13: Composite Image of Rooderand
19
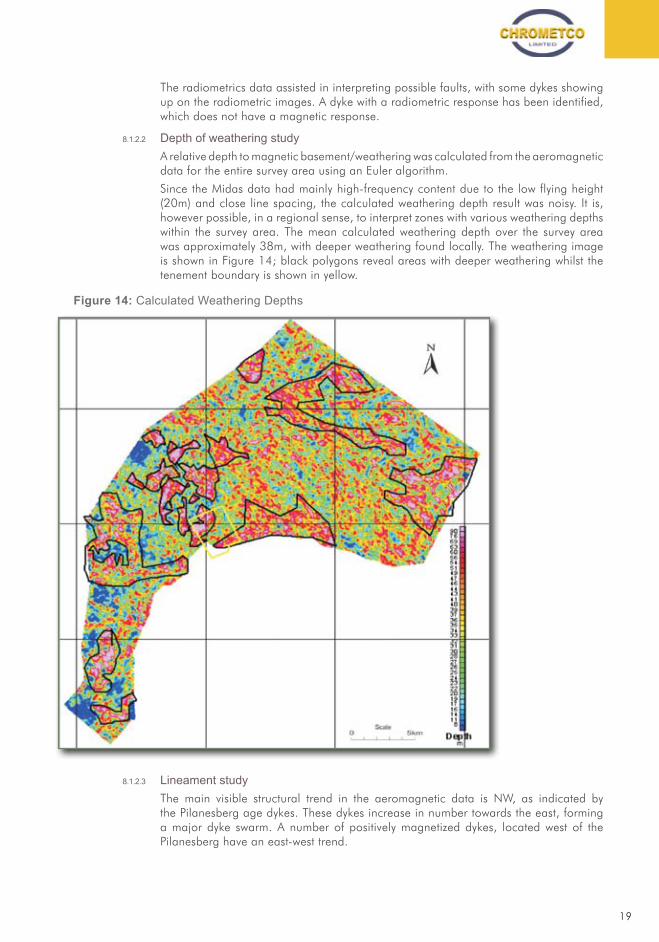
The radiometrics data assisted in interpreting possible faults, with some dykes showing up on the radiometric images. A dyke with a radiometric response has been identified, which does not have a magnetic response.
Depth of weathering study 8.1.2.2
A relative depth to magnetic basement/weathering was calculated from the aeromagnetic data for the entire survey area using an Euler algorithm.
Since the Midas data had mainly high-frequency content due to the low flying height (20m) and close line spacing, the calculated weathering depth result was noisy. It is, however possible, in a regional sense, to interpret zones with various weathering depths within the survey area. The mean calculated weathering depth over the survey area was approximately 38m, with deeper weathering found locally. The weathering image is shown in Figure 14; black polygons reveal areas with deeper weathering whilst the tenement boundary is shown in yellow.
Figure 14: Calculated Weathering Depths
Lineament study 8.1.2.3
The main visible structural trend in the aeromagnetic data is NW, as indicated by the Pilanesberg age dykes. These dykes increase in number towards the east, forming a major dyke swarm. A number of positively magnetized dykes, located west of the Pilanesberg have an east-west trend.
TEChnICAL REPORT On ThE ROODERAnD PROJECTIn ThE nORTh WEST PROVInCE
20
Dyke study 8.1.2.4
Pilanesberg Age Dykes 8.1.2.4.1
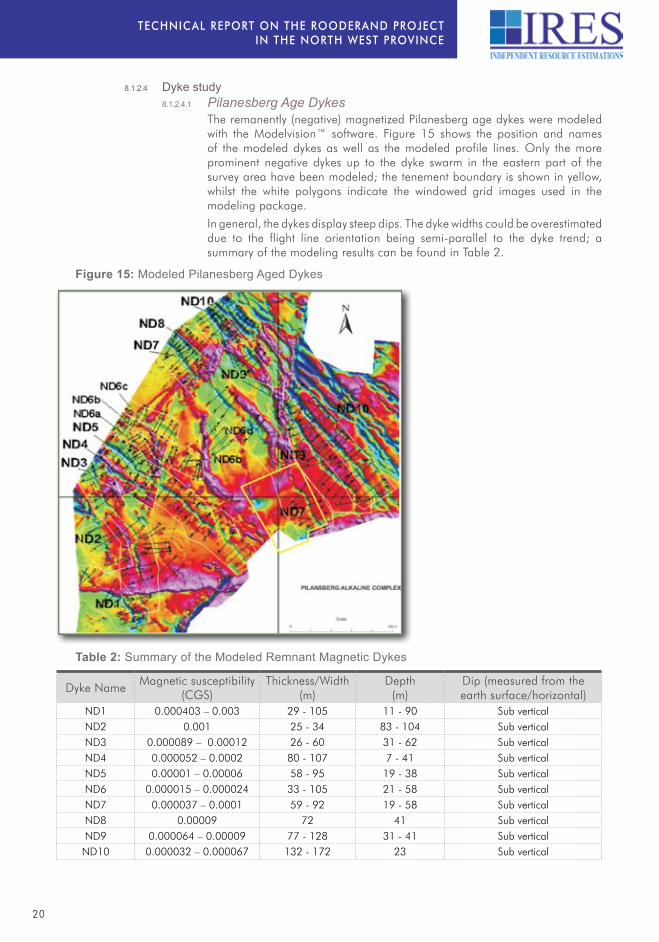
The remanently (negative) magnetized Pilanesberg age dykes were modeled with the Modelvision™ software. Figure 15 shows the position and names of the modeled dykes as well as the modeled profile lines. Only the more prominent negative dykes up to the dyke swarm in the eastern part of the survey area have been modeled; the tenement boundary is shown in yellow, whilst the white polygons indicate the windowed grid images used in the modeling package.
In general, the dykes display steep dips. The dyke widths could be overestimated due to the flight line orientation being semi-parallel to the dyke trend; a summary of the modeling results can be found in Table 2.
Figure 15: Modeled Pilanesberg Aged Dykes
Table 2: Summary of the Modeled Remnant Magnetic Dykes
Dyke NameMagnetic susceptibility
(CGS)Thickness/Width
(m)Depth
(m)Dip (measured from the earth surface/horizontal)
ND1 0.000403 – 0.003 29 - 105 11 - 90 Sub verticalND2 0.001 25 - 34 83 - 104 Sub verticalND3 0.000089 – 0.00012 26 - 60 31 - 62 Sub verticalND4 0.000052 – 0.0002 80 - 107 7 - 41 Sub verticalND5 0.00001 – 0.00006 58 - 95 19 - 38 Sub verticalND6 0.000015 – 0.000024 33 - 105 21 - 58 Sub verticalND7 0.000037 – 0.0001 59 - 92 19 - 58 Sub verticalND8 0.00009 72 41 Sub verticalND9 0.000064 – 0.00009 77 - 128 31 - 41 Sub verticalND10 0.000032 – 0.000067 132 - 172 23 Sub vertical

21
DRILLING (SR T2.1 – SR T2.3, SR T3.1, SR T3.2 & SR T4.1)9.
Historical9.1
Chrometco acquired the Rooderand mining rights in early 2004 and when it listed in August 2005 the intention was to undertake further exploration work on the Remainder of Rooderand 46JQ and Portion 2, with the ultimate aim of proving-up chromite mineral tonnage. Chrometco drilled 2 diamond and 24 percussion drillholes (see Table 3; 4 holes were abandoned due to recovery issues), and in doing this identified the outcrop of the MG 4 seam over a strike length of 1.2km. Chrometco opened a bulk sample pit and undertook limited laboratory evaluation of the MG 4 chrome seam material. Previous mining took place on the adjacent property which is up-dip of Chrometco’s Rooderand portion 2.
Table 3: Chrometco – Rooderand 46JQ Portion 2 Drilling
DrillholeCoordinates Chromitite
Unit Intersected
Hangingwall Elevation
x Y ZDepth below
collar (m)Elevation
above MSLSDR1 + 2779694 + 0417 1124.747 LG6 34.3 1090.447
LG5 70.47 1054.277SDR2 + 2780399 + 0060 1119.292 MG1/3 1119.292RR1 + 2780500 + 0000 1118.929 MG4 44 1074.929RR2 + 2780448 + 0450 1118.224 MG4 17 1101.224RR3 + 2780280 -0500 1118.027 MG4 34 1084.027RR4 + 2780105 -1108 1117.999 MG4 15 1102.999RR5 + 2780138 -1495 1118.152 MG4 35 1083.152RR6 + 2779915 -1525 1118.875 MG4 12 1106.875RR7 + 2779770 -0005 1119.733 -RR8 + 2779740 -0025 1119.742 MG1? 17 1102.742RR9 + 2779495 -0045 1121.445 -
RR10 + 2779852 -2050 1119.121 MG4 34 1085.121RR11 + 2779691 -2675 1119.674 MQ4 13 1106.674RR12 + 2779720 -0509 1119.398 MG4 29 1090.398RR13 + 2779530 -3020 1119.147 MG4 15 1104.147RR14 + 2779559 -3715 1119.293 MG4 35 1084.293RR15 + 2779514 -4100 1119.402 MG4 2 1117.402RR16 + 2779470 -3500 1119.811 MQ1/3 1119.811RR17 + 2779450 -2730 1119.903 -RR18 + 2779482 -2295 1120.011 -RR19 + 2779667 -2285 1121.127 -RR20 + 2779725 -0017 1119.239 MG1? 1119.239
20089.2
In 2008 DCM approached Mineral Corporation to manage an exploration drilling campaign on Portion2 and Remainder Portion of Rooderand 46JQ. The program was to focus on Cr2O3 potential of the area and to generate SAMREC complaint mineral resource estimates; see Figure 16.
The program consisted of the drilling of 23 holes to a maximum of 300m, on a 250m x 250m grid. The drilling was carried out by Altivex Mining and was supervised by the Mineral Corporation. All holes were collar surveyed and drilled vertically. Due to bad rock conditions and water loss, the
TEChnICAL REPORT On ThE ROODERAnD PROJECTIn ThE nORTh WEST PROVInCE
22
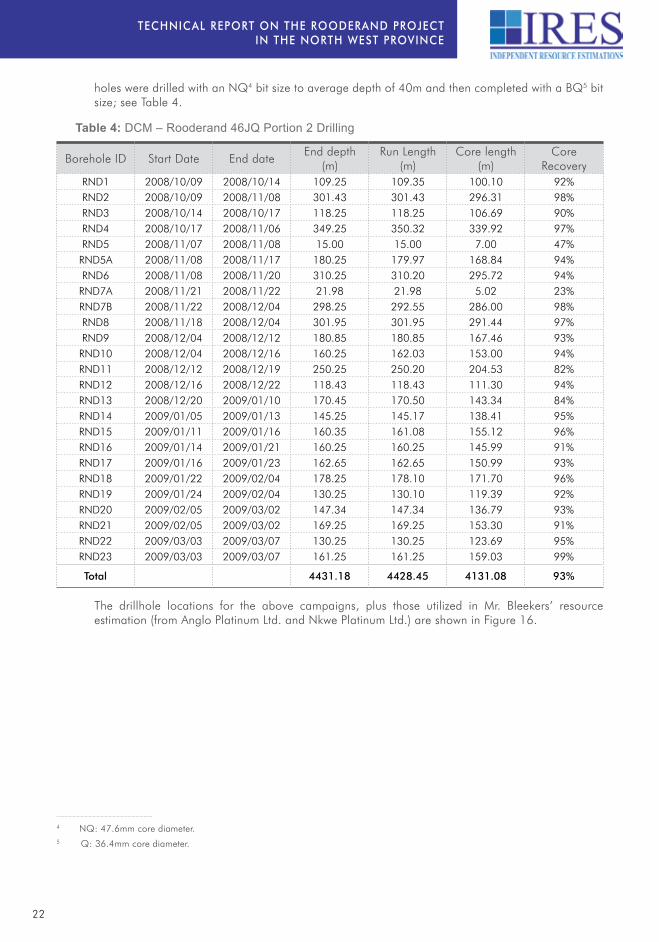
holes were drilled with an NQ4 bit size to average depth of 40m and then completed with a BQ5 bit size; see Table 4.
Table 4: DCM – Rooderand 46JQ Portion 2 Drilling
Borehole ID Start Date End dateEnd depth
(m)Run Length
(m)Core length
(m)Core
RecoveryRND1 2008/10/09 2008/10/14 109.25 109.35 100.10 92%RND2 2008/10/09 2008/11/08 301.43 301.43 296.31 98%RND3 2008/10/14 2008/10/17 118.25 118.25 106.69 90%RND4 2008/10/17 2008/11/06 349.25 350.32 339.92 97%RND5 2008/11/07 2008/11/08 15.00 15.00 7.00 47%
RND5A 2008/11/08 2008/11/17 180.25 179.97 168.84 94%RND6 2008/11/08 2008/11/20 310.25 310.20 295.72 94%
RND7A 2008/11/21 2008/11/22 21.98 21.98 5.02 23%RND7B 2008/11/22 2008/12/04 298.25 292.55 286.00 98%RND8 2008/11/18 2008/12/04 301.95 301.95 291.44 97%RND9 2008/12/04 2008/12/12 180.85 180.85 167.46 93%
RND10 2008/12/04 2008/12/16 160.25 162.03 153.00 94%RND11 2008/12/12 2008/12/19 250.25 250.20 204.53 82%RND12 2008/12/16 2008/12/22 118.43 118.43 111.30 94%RND13 2008/12/20 2009/01/10 170.45 170.50 143.34 84%RND14 2009/01/05 2009/01/13 145.25 145.17 138.41 95%RND15 2009/01/11 2009/01/16 160.35 161.08 155.12 96%RND16 2009/01/14 2009/01/21 160.25 160.25 145.99 91%RND17 2009/01/16 2009/01/23 162.65 162.65 150.99 93%RND18 2009/01/22 2009/02/04 178.25 178.10 171.70 96%RND19 2009/01/24 2009/02/04 130.25 130.10 119.39 92%RND20 2009/02/05 2009/03/02 147.34 147.34 136.79 93%RND21 2009/02/05 2009/03/02 169.25 169.25 153.30 91%RND22 2009/03/03 2009/03/07 130.25 130.25 123.69 95%RND23 2009/03/03 2009/03/07 161.25 161.25 159.03 99%
Total 4431.18 4428.45 4131.08 93%
The drillhole locations for the above campaigns, plus those utilized in Mr. Bleekers’ resource estimation (from Anglo Platinum Ltd. and Nkwe Platinum Ltd.) are shown in Figure 16.
4 NQ: 47.6mm core diameter.5 Q: 36.4mm core diameter.

23
Figure 16: Drillhole Locations – All Holes
SAMPLING METHOD AND APPROACH (SR T2.1, SR T3.1 – SR T3.4 & SR T4.2)10.
In terms of this section on sampling the methods and approaches for the work carried out on the DCM chrome are presented. At the same time, the methods and approaches for these companies that have drilled boreholes for PGEs is also presented. However the importance of combining this information is the ability to use the intersection depth to verify the structure of the whole of Chrometco’s Mineral Rights.
The more recent sampling on the DCM drillholes was carried out by a geologist from Mineral Corporation. Core sampling was guided predominately by chromitite seam lithology. The entire seam, from its upper to lower contact, was split and sampled at 50cm lengths. A minimum of 18cm core sample width was collected for the assay laboratory in order to ensure adequate material for assaying.
TEChnICAL REPORT On ThE ROODERAnD PROJECTIn ThE nORTh WEST PROVInCE
24
The following is from the document “Exploration Results and Mineral Resource Estimates for Chrome Deposits on the Farm Rooderand 46JQ, by The Mineral Corporation”, and is included herein for completeness (a complete copy of the said report can be found in Appendix 8 at www.chrometco.co.za).
SAMPLE PREPARATION AND ANALYSIS (SR T2.4, SR T3.2 – SR T3.4 & SR T4.2)11.
Mineral Corporation11.1
Core samples were processed by ALS Chemex, located at 3 Friesland Drive, Long Meadow Business Park South, Edenvale, Gauteng, South Africa. ALS Chemex is a reputable laboratory that is accredited by SANAS (ISO 17025) for the analysis of Cr and other major and minor element oxides. Samples were taken from all 23 drillholes from the DCM Chromes’ drilling campaign at chromite intersections.
Sample Preparation 11.1.1
Standard laboratory procedures involving jaw crushing and ring pulverizing were employed in preparation of the core and blank samples.
Assay technique 11.1.2
Rooderand samples were assayed by means of the xRF technique, which included a package of analyses for SiO2, Al2O3, Fe2O3, CaO, MgO, Na2O, K2O, Cr2O3, TiO2, MnO, P2O5, SrO, BaO, and Loss on Ignition (LOI).
Samples for whole rock analysis by xRF are fused using a lithium borate fusion. The melt is then poured into a mould and cooled to yield a solid glass disk. The disks can then be analyzed and the elements determined by comparison with standard reference materials.
The analysis of all the major oxides in a geological matrix is referred to as whole rock analysis, because the expectation is that for non-mineralized rocks, the sum of the major oxides should be close to 100% of the total composition of the sample. xRF is a non-destructive instrumental technique widely used for whole rock analysis. For high precision whole rock analysis xRF preferred and reports the major and minor elements as oxide, loss on ignition is also reported.
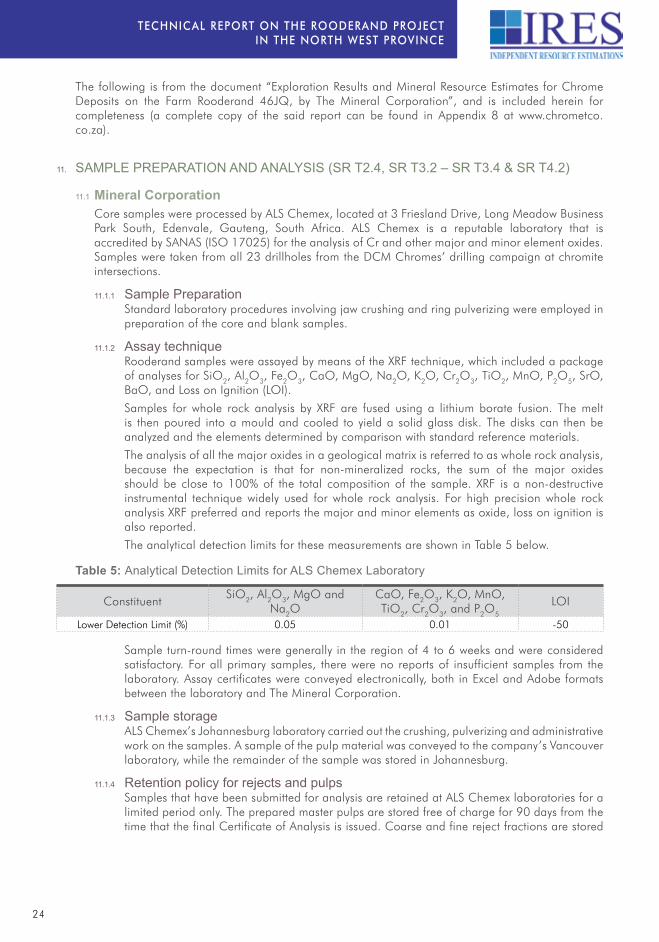
The analytical detection limits for these measurements are shown in Table 5 below.
Table 5: Analytical Detection Limits for ALS Chemex Laboratory
ConstituentSiO2, Al2O3, MgO and
Na2OCaO, Fe2O3, K2O, MnO, TiO2, Cr2O3, and P2O5
LOI
Lower Detection Limit (%) 0.05 0.01 -50
Sample turn-round times were generally in the region of 4 to 6 weeks and were considered satisfactory. For all primary samples, there were no reports of insufficient samples from the laboratory. Assay certificates were conveyed electronically, both in Excel and Adobe formats between the laboratory and The Mineral Corporation.
Sample storage 11.1.3
ALS Chemex’s Johannesburg laboratory carried out the crushing, pulverizing and administrative work on the samples. A sample of the pulp material was conveyed to the company’s Vancouver laboratory, while the remainder of the sample was stored in Johannesburg.
Retention policy for rejects and pulps 11.1.4
Samples that have been submitted for analysis are retained at ALS Chemex laboratories for a limited period only. The prepared master pulps are stored free of charge for 90 days from the time that the final Certificate of Analysis is issued. Coarse and fine reject fractions are stored
25
free of charge for the first 45 days. Monthly charges are levied for sample storage when the free period is expired. All pulp and coarse rejects were collected by The Mineral Corporation’s representative and stored at the company’s offices in Bryanston, Johannesburg.
Assaying protocol 11.1.5
An assaying QA and QC protocol was applied to Rooderand samples, which involved repeats from preceding sample batches, certifiable and commercially available standard reference material (“CRM”) and “blank” samples derived from acceptable source lithologies known to contain negligible quantities of contaminant elements. These were inserted into the sample stream to check for laboratory accuracy, precision and cross-contamination.
Assay results for standards, blanks and duplicates are reported on the sampling and assay spreadsheet in their original sample positions as submitted to ALS Chemex by The Mineral Corporation.
Blanks 11.1.5.1
A supply of crushed Magaliesberg Quartzite, obtained from Rolfes Silica near Brits provided source material for sample blanks. Rolfes Silica is reportedly a leading silica supplier in South Africa, specializing in the beneficiation of a wide variety of high quality silica products. A detailed assay of the crushed quartzite indicates >98% SiO2 content (data provided by Rolfes Silica).
Blank samples were introduced at regular intervals into the sample stream and constituted 5% of total samples submitted to the laboratory.
As part of its internal QA/QC procedures, the laboratory introduced its own blank material for analysis into the sample stream. Further details regarding the source of the blank material are unknown. Assays of these blanks were distributed with the core sample results.
Standards 11.1.5.2
The SARM 72 CRM standard used to determine laboratory accuracy and precision was obtained from Mintek Laboratory (“Mintek”) in Randburg, Johannesburg. Mintek is accredited with ISO 17025 and is a specialist company focusing on mineral and metallurgical technology, including the manufacture of certified reference materials.
The original material from which the standard was prepared was sourced from Anglo Platinum mines and comprises high grade UG2 reef with substantial chromite content.
Certified analyses of SARM 72 with respect to Cr2O3, Fe and SiO2 are as shown below in Table 6.
Table 6: Certified selected analyses of SARM 72
MaterialCertified average
value %95% confidence
intervalInter-laboratory standard
deviationNumber of analyses
Cr2O3 31.0 30.0 - 32.0 1.61 13Fe 17.8 17.2 - 18.4 0.91 12
SiO2 14.1 13.6 - 14.6 0.85 12
The Fe% declared in Mintek’s reference sheet has been back-calculated from total Fe2O3 using a factor of 0.6994.
100g charges of SARM 72 standard were introduced into the sample stream at 20 sample intervals, equivalent to 5% of total samples submitted.

TEChnICAL REPORT On ThE ROODERAnD PROJECTIn ThE nORTh WEST PROVInCE
26
Laboratory standards 11.1.5.3
As part of its internal QA/QC procedures, the laboratory introduced its own CRMs for analysis into the sample streams. Three standards were used for the three separate sample batches submitted by The Mineral Corporation.
For the first batch (covering boreholes RND1 to RND12) the internal standards used were referred to as STSD-4 and were introduced at the rate of approximately 7% of total samples submitted, at positions guided by the laboratory’s procedures.
The target ranges (deemed to represent the 95% confidence limits) for Cr2O3, Fe and SiO2 are shown in Table 7.
Table 7: Target ranges for internal laboratory standard STSD-4
Material Lower value % Upper value %Cr2O3 <0.01 0.02Fe2O3 5.41 6.00SiO2 55.95 61.86
For the second and third batches of samples submitted, internal standards SARM 5 and SCH-1 were used. These covered boreholes RND13 to RND23 and were introduced at the rate of approximately 7% of total samples submitted, at undetermined positions.
The target ranges (deemed to represent the 95% confidence limits) for Cr2O3, Fe and SiO2 are declared in Table 8 and Table 9.
Table 8: Target ranges for internal laboratory standard SARM 5
Material Lower value % Upper value %Cr2O3 3.32 3.70Fe2O3 Not stated Not statedSiO2 Not stated Not stated
Table 9: Target ranges for internal laboratory standard SCH-1
Material Lower value % Upper value %Cr2O3 Not stated Not statedFe2O3 82.48 91.18SiO2 7.68 8.50
Assays of these internal standards were distributed with the core sample results.
Pulp duplicates 11.1.5.4
The Mineral Corporation retrieved the reject pulps from the first batch of samples submitted to ALS Chemex and selected 10% of these for re-submission in the second batch of samples under new sample IDs to check for laboratory accuracy and precision. Selection was determined to some extent by the availability of remaining pulp material for re-analysis.
Approximately 3% of submitted samples for each batch submitted were re-analyzed by ALS Chemex as internal duplicates.
Anglo Platinum11.2
The methods and approaches utilized by Anglo Platinum (“Anglo”) are presented below. Although Anglo was not exploring for chrome, but rather for PGEs, the importance of this information are the intersection depths which were utilized to verify the structure of the whole of Chrometco’s Mineral Rights.
27
Sampling of the reefs was done in 20cm sample intervals, increasing to 50cm to ensure adequate sampling of the mineralization in the more erratically mineralized zones. Sample breaks are made on the basis of geology and natural breaks in the core.
Mineralized zones are identified by the presence of disseminated sulphides and in the case of the mineralization in the MRFW anorthosite, by a distinct alteration. For a typical hole intersecting all four of the main reefs, approximately 100 samples were collected.
Drill core samples are marked, split by means of a 2mm thick diamond saw blade and each sample is given a unique sample number. All logging and sampling data is electronically captured. Half core is submitted for analysis and the remaining half marked and stored for future reference or test work.
Sample Preparation11.2.1
Each sample was bagged by Platmin in labeled polyurethane bags, with a sample ticket inside the bag, and the bags were compiled into batches no greater than 100 samples, for dispatch to the ISO accredited SGS Lakefield Laboratory Services (SGS) in Johannesburg, South Africa (ISO/IEC 17025).
A complete paper trail of instructions to the laboratory, delivery to and reception of the samples at the laboratory was inspected by independent consultants SRK and found to be adequate. The samples are dried diamond drill core that is crushed in a jaw crusher prior to the removal of aliquots for analysis. All equipment is cleaned between samples to prevent contamination. The known sample mass of the crushed sample is weighed and added with flux to a numbered crucible.
Assaying Technique11.2.2
The Anglo samples were assayed by means of the xRF technique, which included a package of analyses for SiO2, Al2O3, Fe2O3, CaO, MgO, Na2O, K2O, Cr2O3, TiO2, MnO, P2O5, SrO, BaO, and Loss on Ignition (“LOI”).
Samples for whole rock analysis by xRF were fused using a lithium borate fusion. The melt is then poured into a mould and cooled to yield a solid glass disk. The disks were then be analyzed and the elements determined by comparison with standard reference materials.
DATA VERIFICATION (SR T2.1, SR T3.1 – SR T3.4 & SR T9)12.
Results of the QA/QC programme 12.1
All the information was tabulated in order of sample number and shows the original positions of CRMs and blank placement in the sample stream.
Blanks 12.1.1
Elevated levels of laboratory sample contamination were evident in six of the seven blank samples submitted in the first sample batch. This was especially noticeable for Cr2O3 with an outlying value of 3.1% Cr2O3 recorded in sample F2100. Remaining elevated assays averaged 0.2% Cr2O3.
Subsequent contamination was at lower levels throughout the remainder of the first batch and in subsequent batches. The graphed data indicates the likelihood of a background value of approximately 0.6% Fe2O3 content of the blank material supplied by Rolfes Silica.
While the elevated levels of contamination in the first sample batch cannot be condoned, The Mineral Corporation is of the opinion that this does not materially affect the Cr2O3 or Fe2O3
values of the chromitite seams which are at very high levels relative to those recorded in the blank assays.
All internal laboratory blanks returned Cr2O3 and Fe2O3 values of less than 0.01%.
TEChnICAL REPORT On ThE ROODERAnD PROJECTIn ThE nORTh WEST PROVInCE
28
CRM analysis 12.1.2
Mean deviation analysis has been conducted for Cr2O3, Fe2O3 and SiO2 on the SARM 72 standard using data from all three batches submitted for analysis.
Assay results of SARM 72 indicate that between Fe2O3 grades of 17.2% and 17.6%, error in the analytical procedure was between 2% and 6%. Laboratory error in analysis of Cr2O3 for grades between 30% and 33% was ±4%. Laboratory error in analysis of SiO2 for grades between 13.5% and 14.1% was ±4%. The Mineral Corporation noted that all the analyses for Fe2O3
and SiO2 were underestimated compared with the SARM 72 average value, while all but one of the thirteen Cr2O3 standards indicated overestimation compared with the SARM 72 standard.
The assay results from sample no. F2211, which was the first standard sample submitted in the third batch, were responsible for the Cr2O3, Fe2O3 and SiO2 outlier values on the three graphs.
The mean assay value of the Cr2O3 standards, at 31.97%, lies at the extreme upper end of the 95% confidence range declared by Mintek (Table 5). The mean assay value for Fe (back- calculated from Fe2O3) at 16.9% lies just outside the 95% confidence range declared by Mintek of 17.2%-17.8% (Table 5) but falls within the 90% confidence range. The mean assay value for SiO2 at 13.62% lies just on the lower limit of the 95% confidence range declared by Mintek of 13.6%-14.6%.
The results of the mean deviation analysis indicate varying but minor degrees of laboratory bias dependent upon the elements being investigated.
The Mineral Corporation concluded from this investigation that, notwithstanding some minor concerns, laboratory precision was generally within acceptable limits.
Duplicate analysis – external 12.1.3
Graphs indicated that at between 14% and 28% Fe2O3, the precision of the results has less than 5% error in the analytical procedure. Whilst other plots indicated that for chromite analysis, at between 19% and 45% Cr2O3, the precision of the results has less than 10% error in the analytical procedure.
Similarly for silica, at between 3% and 30% SiO2, precision of results has less than 14% error in the analytical procedure. Eight of the nine samples are less than 9%.
The overall precision in the analysis of between-batch duplicate samples is reasonably expected to be limited to those levels indicated which relate to laboratory precision of CRMs. Any improvement on this precision cannot reasonably be expected from duplicate samples.
The results of the between-batch duplicate assays indicate precision levels that fall outside the ranges of the CRMs, which is an expected observation.
The analyses of duplicate samples present a sufficiently wide range of values, providing a good indication of overall laboratory precision for Cr2O3, Fe2O3 and SiO2.
The Mineral Corporation concluded that precision and accuracy errors in laboratory duplicate analysis do not impact materially on the assays used to guide the resource estimation process.
Laboratory internal duplicate analysis 12.1.4
Precision of assay results for all elements analyzed lies within 1%, with a single exception of 1.8%. This indicates a high degree of in-batch laboratory precision.
The increased variability shown in the between-batch duplicate assays can be ascribed to homogenization problems in the sample preparation process. However, The Mineral Corporation believes that this does not have a material impact on the acceptability of assays used in the resource estimation process.
Conclusion 12.1.5
QA/QC procedures adopted for DCM Chromes’ exploration programme were sufficient to ascertain that sample assays are of reasonable accuracy and precision.
29
Security12.2
A location for the on-site core yard was chosen away from mining operations in order to avoid contamination by airborne dust from nearby open-pit chromite mining. The core boxes were stacked in an area between the mining contractors’ site office and workspace; this location provided ample security and was far enough away from mining operations to prevent contamination. The core boxes were stacked and covered with heavy-gauge plastic sheeting as an added precaution against contamination and to protect the often friable chromite seams from the effects of the weather. After each hole had been logged and sampled the core trays were moved to a secure container on site provided by DCM.
Core logging was carried out upon completion of each borehole once drillers’ depth checks had been reconciled to the satisfaction of the site geologist and all core had been appropriately marked. Water was provided from a bowser supplied by the mining contractors. Rock type, apparent stratigraphic dip, alteration, structure and other pertinent geological information was captured during this process.
The core boxes were stacked on a flat raised area created between the mining contractor’s site office and work space; this location was chosen by DCM on the advice of The Mineral Corporation as it provided adequate security against unwarranted access. Core was stored permanently on site at DCM’s site office.
ADJACENT PROPERTIES (SR T1.3)13.
The structurally complex nature around Rooderand has been the center of man mining activities; especially west of the Pilanesberg Complex where the outcropping LG6 seam has been mined at several localities. These producing mines include xstrata’s Horizon Mine, the Ruighoek Mine and the defunct Ntuane Mine. In addition, various small open pit operations, along with some underground mines, have exploited the chromitites elsewhere in the region. The northward projection of the seam outcrops on and to the north of Rooderand is based largely on the aerial distribution of these old surface workings. In the 1950s, Anglo American explored various farms to the northeast of Rooderand, but no potential for PGEs was noted. Mining of the LG6 chromite seam just below surface was carried out in the late 1950s and into the 1960s. This mining was informed by the drilling of 23 shallow percussion holes by TLC to delineate the down-dip continuity of the chromitite seam for mine planning purposes. Surface extraction of the LG5 to a depth of a few metres and along 100m of strike was also carried out adjacent to the LG6 operations. There are many platinum mines and projects on the western limb of the Bushveld Complex. North and adjacent to Rooderand is one mineralized area namely the Tuschenkomst property; the Union Section area that is approximately 20km further to the northeast. The Union Section is of the older mines of Anglo Platinum’s Rustenburg Platinum Mines (Pty) Ltd (“RPM”).In 2006 Barrick acquired the Sedibelo property and declared, in 2008, a Measured and Indicated Resource of 3,8Moz of Pt at 3,47g/t, and 1,7Moz of Pd at 1,59g/t, with a further 5,3Moz of Pt and 2,5Moz of Pd in the inferred category. Pilanesberg Platinum Mines (“PPM”) is situated around the northwestern edge of the Pilanesberg Alkaline Complex, approximately 60km northwest of the city of Rustenburg and adjacent to the Sedibelo project of Barrick Africa (previously Placer Dome). PPM comprises the farms from north to south; Tuschenkomst 135JP (Tuschenkomst), Witkleifontein 136JP (Witkleifontein), and Ruighoek 169JP (Ptn 2, 3, 4, 6, 9, 15 and Ptn 1, now split into RE 1, 10, 11, 12, 13 and 14) (Ruighoek). Tuschenkomst, Witkleifontein are contiguous and comprise the northern part of PPM, with Ruighoek comprising the southern part. The northern and southern parts of PPM are separated by the farm Zandspruit 168JP, approximately 4km in length, which is held by Rustenburg Platinum Mines, a subsidiary of Anglo Platinum Limited (Anglo Platinum).Nkwe Platinum Limited’s (“Nkwe”) Rooderand prospect is located north of the Pilanesberg Alkaline Complex. According to Nkwe, the prospect contains 1.1km confirmed UG2 open pit potential, for a
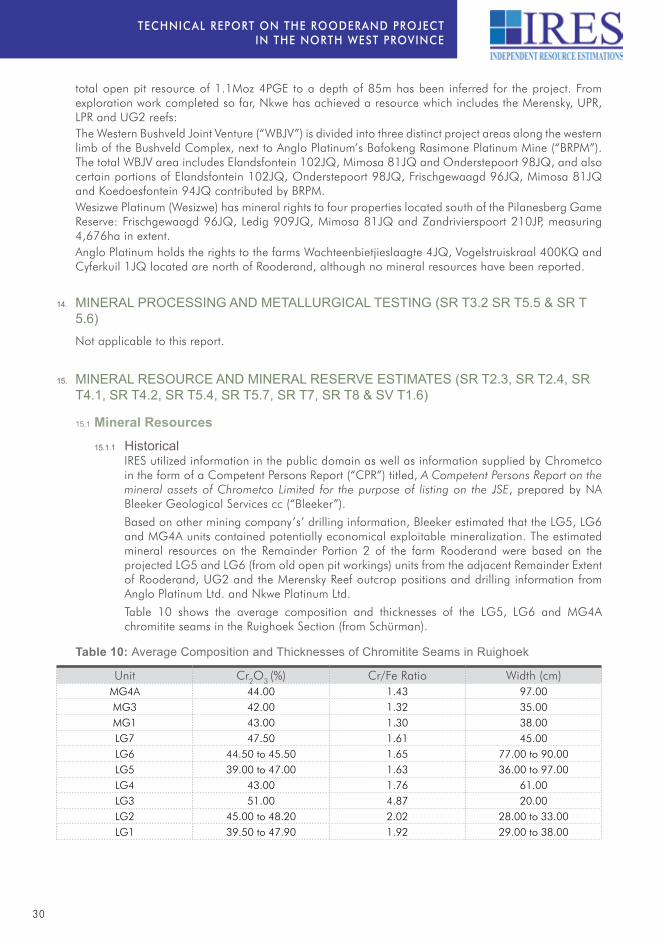
TEChnICAL REPORT On ThE ROODERAnD PROJECTIn ThE nORTh WEST PROVInCE
30
total open pit resource of 1.1Moz 4PGE to a depth of 85m has been inferred for the project. From exploration work completed so far, Nkwe has achieved a resource which includes the Merensky, UPR, LPR and UG2 reefs:The Western Bushveld Joint Venture (“WBJV”) is divided into three distinct project areas along the western limb of the Bushveld Complex, next to Anglo Platinum’s Bafokeng Rasimone Platinum Mine (“BRPM”). The total WBJV area includes Elandsfontein 102JQ, Mimosa 81JQ and Onderstepoort 98JQ, and also certain portions of Elandsfontein 102JQ, Onderstepoort 98JQ, Frischgewaagd 96JQ, Mimosa 81JQ and Koedoesfontein 94JQ contributed by BRPM.Wesizwe Platinum (Wesizwe) has mineral rights to four properties located south of the Pilanesberg Game Reserve: Frischgewaagd 96JQ, Ledig 909JQ, Mimosa 81JQ and Zandrivierspoort 210JP, measuring 4,676ha in extent. Anglo Platinum holds the rights to the farms Wachteenbietjieslaagte 4JQ, Vogelstruiskraal 400KQ and Cyferkuil 1JQ located are north of Rooderand, although no mineral resources have been reported.
MINERAL PROCESSING AND METALLURGICAL TESTING (SR T3.2 SR T5.5 & SR T 14.
5.6)Not applicable to this report.
MINERAL RESOURCE AND MINERAL RESERVE ESTIMATES (SR T2.3, SR T2.4, SR 15.
T4.1, SR T4.2, SR T5.4, SR T5.7, SR T7, SR T8 & SV T1.6)
Mineral Resources15.1
Historical15.1.1
IRES utilized information in the public domain as well as information supplied by Chrometco in the form of a Competent Persons Report (“CPR”) titled, A Competent Persons Report on the mineral assets of Chrometco Limited for the purpose of listing on the JSE, prepared by NA Bleeker Geological Services cc (“Bleeker”).
Based on other mining company’s’ drilling information, Bleeker estimated that the LG5, LG6 and MG4A units contained potentially economical exploitable mineralization. The estimated mineral resources on the Remainder Portion 2 of the farm Rooderand were based on the projected LG5 and LG6 (from old open pit workings) units from the adjacent Remainder Extent of Rooderand, UG2 and the Merensky Reef outcrop positions and drilling information from Anglo Platinum Ltd. and Nkwe Platinum Ltd.
Table 10 shows the average composition and thicknesses of the LG5, LG6 and MG4A chromitite seams in the Ruighoek Section (from Schürman).
Table 10: Average Composition and Thicknesses of Chromitite Seams in Ruighoek
Unit Cr2O3 (%) Cr/Fe Ratio Width (cm)MG4A 44.00 1.43 97.00MG3 42.00 1.32 35.00MG1 43.00 1.30 38.00LG7 47.50 1.61 45.00LG6 44.50 to 45.50 1.65 77.00 to 90.00LG5 39.00 to 47.00 1.63 36.00 to 97.00LG4 43.00 1.76 61.00LG3 51.00 4.87 20.00LG2 45.00 to 48.20 2.02 28.00 to 33.00LG1 39.50 to 47.90 1.92 29.00 to 38.00
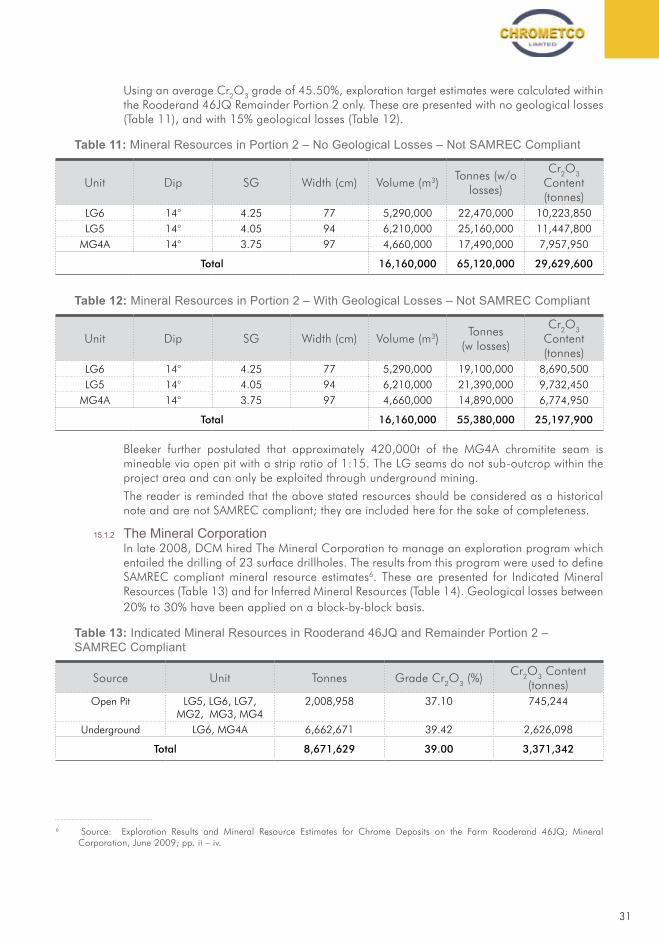
31
Using an average Cr2O3 grade of 45.50%, exploration target estimates were calculated within the Rooderand 46JQ Remainder Portion 2 only. These are presented with no geological losses (Table 11), and with 15% geological losses (Table 12).
Table 11: Mineral Resources in Portion 2 – No Geological Losses – Not SAMREC Compliant
Unit Dip SG Width (cm) Volume (m3)Tonnes (w/o
losses)
Cr2O3 Content (tonnes)
LG6 14° 4.25 77 5,290,000 22,470,000 10,223,850LG5 14° 4.05 94 6,210,000 25,160,000 11,447,800
MG4A 14° 3.75 97 4,660,000 17,490,000 7,957,950
Total 16,160,000 65,120,000 29,629,600
Table 12: Mineral Resources in Portion 2 – With Geological Losses – Not SAMREC Compliant
Unit Dip SG Width (cm) Volume (m3)Tonnes
(w losses)
Cr2O3 Content (tonnes)
LG6 14° 4.25 77 5,290,000 19,100,000 8,690,500LG5 14° 4.05 94 6,210,000 21,390,000 9,732,450
MG4A 14° 3.75 97 4,660,000 14,890,000 6,774,950
Total 16,160,000 55,380,000 25,197,900
Bleeker further postulated that approximately 420,000t of the MG4A chromitite seam is mineable via open pit with a strip ratio of 1:15. The LG seams do not sub-outcrop within the project area and can only be exploited through underground mining.
The reader is reminded that the above stated resources should be considered as a historical note and are not SAMREC compliant; they are included here for the sake of completeness.
The Mineral Corporation15.1.2
In late 2008, DCM hired The Mineral Corporation to manage an exploration program which entailed the drilling of 23 surface drillholes. The results from this program were used to define SAMREC compliant mineral resource estimates6. These are presented for Indicated Mineral Resources (Table 13) and for Inferred Mineral Resources (Table 14). Geological losses between 20% to 30% have been applied on a block-by-block basis.
Table 13: Indicated Mineral Resources in Rooderand 46JQ and Remainder Portion 2 – SAMREC Compliant
Source Unit Tonnes Grade Cr2O3 (%)Cr2O3 Content
(tonnes)Open Pit LG5, LG6, LG7,
MG2, MG3, MG42,008,958 37.10 745,244
Underground LG6, MG4A 6,662,671 39.42 2,626,098
Total 8,671,629 39.00 3,371,342
6 Source: Exploration Results and Mineral Resource Estimates for Chrome Deposits on the Farm Rooderand 46JQ; Mineral Corporation, June 2009; pp. ii – iv.
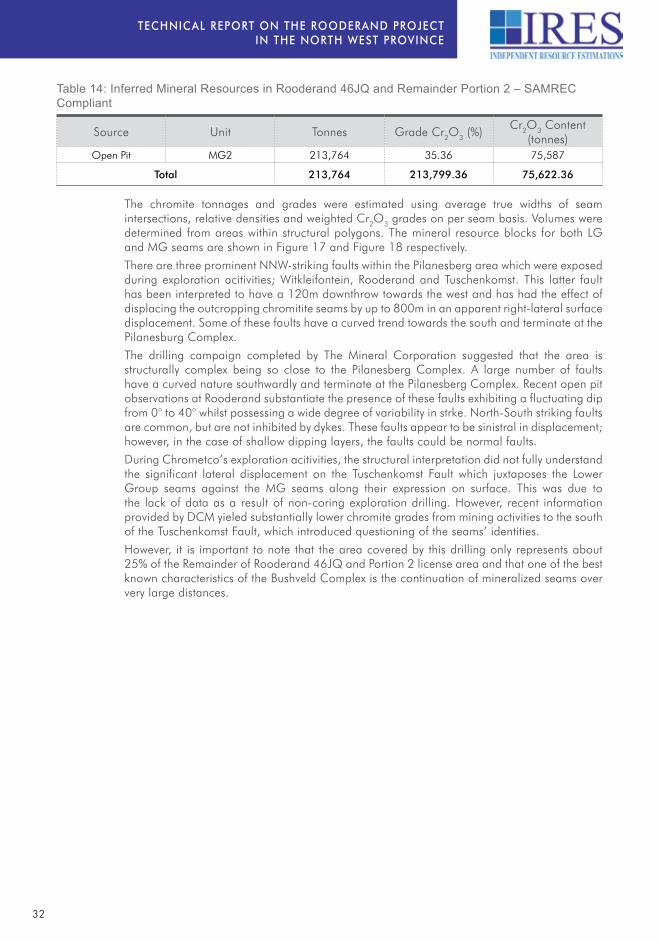
TEChnICAL REPORT On ThE ROODERAnD PROJECTIn ThE nORTh WEST PROVInCE
32
Table 14: Inferred Mineral Resources in Rooderand 46JQ and Remainder Portion 2 – SAMREC Compliant
Source Unit Tonnes Grade Cr2O3 (%)Cr2O3 Content
(tonnes)Open Pit MG2 213,764 35.36 75,587
Total 213,764 213,799.36 75,622.36
The chromite tonnages and grades were estimated using average true widths of seam intersections, relative densities and weighted Cr2O3 grades on per seam basis. Volumes were determined from areas within structural polygons. The mineral resource blocks for both LG and MG seams are shown in Figure 17 and Figure 18 respectively.
There are three prominent NNW-striking faults within the Pilanesberg area which were exposed during exploration acitivities; Witkleifontein, Rooderand and Tuschenkomst. This latter fault has been interpreted to have a 120m downthrow towards the west and has had the effect of displacing the outcropping chromitite seams by up to 800m in an apparent right-lateral surface displacement. Some of these faults have a curved trend towards the south and terminate at the Pilanesburg Complex.
The drilling campaign completed by The Mineral Corporation suggested that the area is structurally complex being so close to the Pilanesberg Complex. A large number of faults have a curved nature southwardly and terminate at the Pilanesberg Complex. Recent open pit observations at Rooderand substantiate the presence of these faults exhibiting a fluctuating dip from 0° to 40° whilst possessing a wide degree of variability in strke. North-South striking faults are common, but are not inhibited by dykes. These faults appear to be sinistral in displacement; however, in the case of shallow dipping layers, the faults could be normal faults.
During Chrometco’s exploration acitivities, the structural interpretation did not fully understand the significant lateral displacement on the Tuschenkomst Fault which juxtaposes the Lower Group seams against the MG seams along their expression on surface. This was due to the lack of data as a result of non-coring exploration drilling. However, recent information provided by DCM yieled substantially lower chromite grades from mining activities to the south of the Tuschenkomst Fault, which introduced questioning of the seams’ identities.
However, it is important to note that the area covered by this drilling only represents about 25% of the Remainder of Rooderand 46JQ and Portion 2 license area and that one of the best known characteristics of the Bushveld Complex is the continuation of mineralized seams over very large distances.
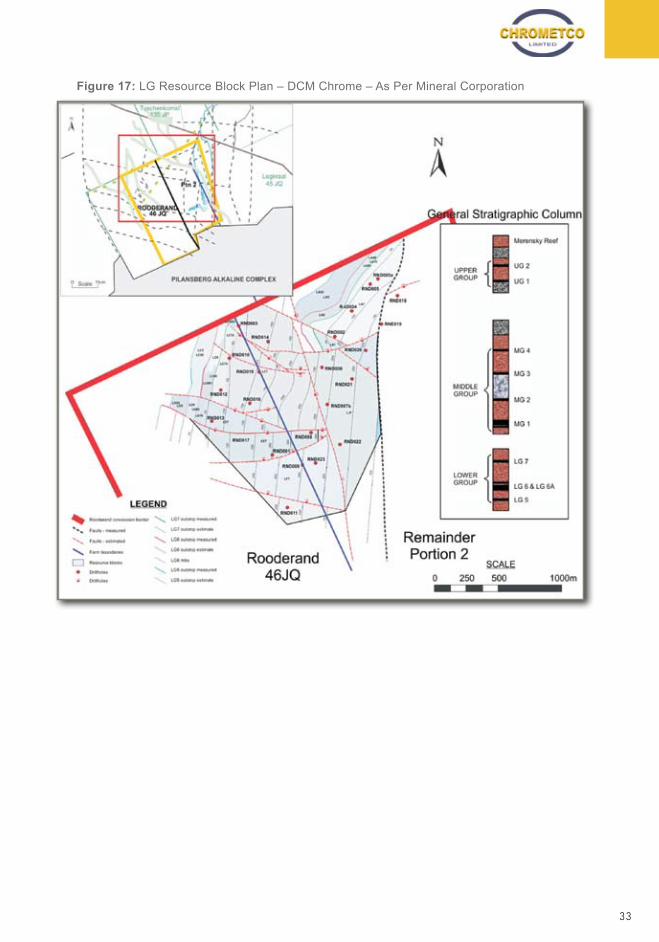
33
Figure 17: LG Resource Block Plan – DCM Chrome – As Per Mineral Corporation

TEChnICAL REPORT On ThE ROODERAnD PROJECTIn ThE nORTh WEST PROVInCE
34
Figure 18: MG Resource Block Plan – DCM Chrome – As Per Mineral Corporation
The following is a brief description of the resource estimation methodology as utilized by Mineral Corporation. The following is from the document “Exploration Results and Mineral Resource Estimates for Chrome Deposits on the Farm Rooderand 46JQ, by The Mineral Corporation”, and is included herein for completeness (a complete copy of the said report can be found in Appendix 8 on the Chrometco website www.chrometco.co.za).
Block Volume Calculation15.1.2.1
Polygons were constructed in ArcGIS using individual seam outcrops and bounding faults shown in Figure 38 and Figure 39. The extent of polygons around the boundary of the Area of Interest was limited by the criteria of borehole influence, outcrops and structure as reported previously.
Polygon outlines were digitized and the resultant areal extent in m2 placed in a spreadsheet. Block names have been defined by three characters, which denote

35
to which Group the seam belongs, the individual structure polygon and the individual seam portion. Portions denoted by a suffix „R‟ are used only when part of the block has been depleted by open pit mining, and refers to the area of the remaining resource within the structure polygon.
Average apparent dips for each polygon have been estimated from contour intervals, which themselves are based on borehole intersection depths. Average on-seam area has been defined using simple trigonometry based on the seam plans.
Determination of Individual Seam Thickness15.1.2.2
Western Bushveld chromitite seams generally display remarkable lateral consistency between the Rustenburg and Amandelbult sections, but are noted for local scale thickness variability which usually results from internal silicate (mainly pyroxenite) content. Total chromitite seam thicknesses at Rooderand corroborate this general trend, with some seams (notably the LG5) displaying a higher degree of internal variability than others.
In the case of multiple layer seams (LG5, MG3 and MG4), both total seam thickness (determined from the base of the lowest chromitite seam to the top of the highest seam) and thickness of the main chromitite seam were calculated. Total seam thickness may include significant quantities of internal pyroxenite, which will lower the total seam grade substantially.
Seam intersections that were recorded as faulted or partially missing were excluded from average thickness calculations. Overall average seam thicknesses using unfaulted and complete intersections are presented in Table 15.
Table 15: Average Seam Thickness for Rooderand7
SeamAverage chromitite
main seam thickness (m)
Average total seam thickness (m)
LG5 0.27 0.73LG6 0.72 0.96LG7 0.18 0.36MG1 1.06 1.06MG2 0.34 0.36
MG3A 0.35 0.35MG3B 0.31 0.31
MG3 total 0.67 1.25MG4A 0.98 0.98MG4B 0.56 0.56
Seam thickness isopach maps were constructed which were aimed at determining if trends existed within DCM Chrome’s exploration area.
It is noted that due to the small number of borehole intersections, no observable trend in individual seam thickness across Remainder Portion 2 and Rooderand 46JQ could be established. Contouring of this data provided no meaningful basis on which to determine if a trend in the data exists. The low variability of seam thickness across the property is also indicated through statistical analysis.
7 Exploration Results and Mineral Resource Estimates for Chrome Deposits on the Farm Rooderand 46JQ, The Mineral Corporation, page 30.
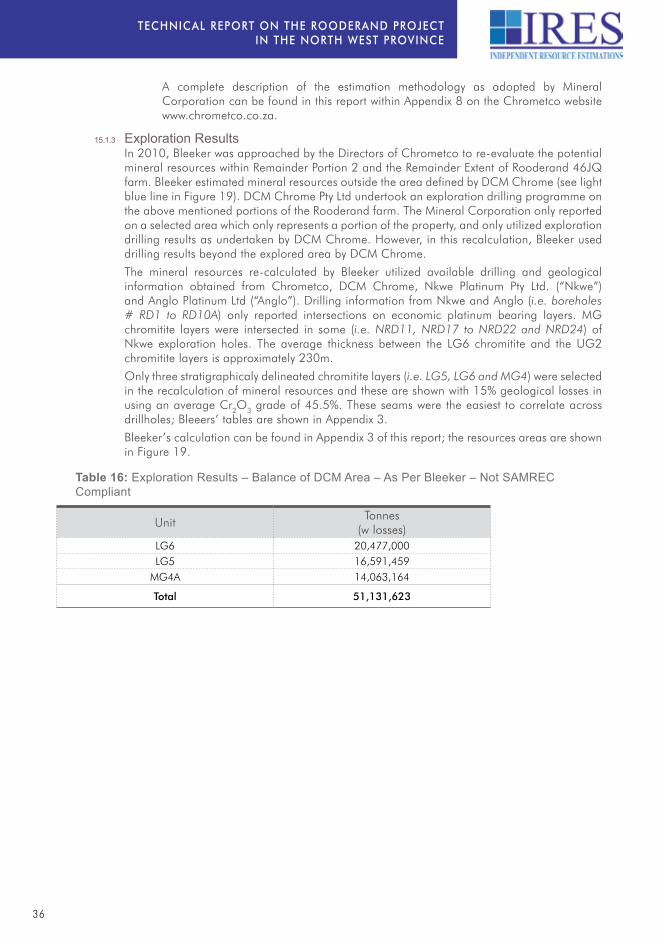
TEChnICAL REPORT On ThE ROODERAnD PROJECTIn ThE nORTh WEST PROVInCE
36
A complete description of the estimation methodology as adopted by Mineral Corporation can be found in this report within Appendix 8 on the Chrometco website www.chrometco.co.za.
Exploration Results15.1.3
In 2010, Bleeker was approached by the Directors of Chrometco to re-evaluate the potential mineral resources within Remainder Portion 2 and the Remainder Extent of Rooderand 46JQ farm. Bleeker estimated mineral resources outside the area defined by DCM Chrome (see light blue line in Figure 19). DCM Chrome Pty Ltd undertook an exploration drilling programme on the above mentioned portions of the Rooderand farm. The Mineral Corporation only reported on a selected area which only represents a portion of the property, and only utilized exploration drilling results as undertaken by DCM Chrome. However, in this recalculation, Bleeker used drilling results beyond the explored area by DCM Chrome.
The mineral resources re-calculated by Bleeker utilized available drilling and geological information obtained from Chrometco, DCM Chrome, Nkwe Platinum Pty Ltd. (“Nkwe”) and Anglo Platinum Ltd (“Anglo”). Drilling information from Nkwe and Anglo (i.e. boreholes # RD1 to RD10A) only reported intersections on economic platinum bearing layers. MG chromitite layers were intersected in some (i.e. NRD11, NRD17 to NRD22 and NRD24) of Nkwe exploration holes. The average thickness between the LG6 chromitite and the UG2 chromitite layers is approximately 230m.
Only three stratigraphicaly delineated chromitite layers (i.e. LG5, LG6 and MG4) were selected in the recalculation of mineral resources and these are shown with 15% geological losses in using an average Cr2O3 grade of 45.5%. These seams were the easiest to correlate across drillholes; Bleeers’ tables are shown in Appendix 3.
Bleeker’s calculation can be found in Appendix 3 of this report; the resources areas are shown in Figure 19.
Table 16: Exploration Results – Balance of DCM Area – As Per Bleeker – Not SAMREC Compliant
UnitTonnes
(w losses)LG6 20,477,000LG5 16,591,459
MG4A 14,063,164
Total 51,131,623
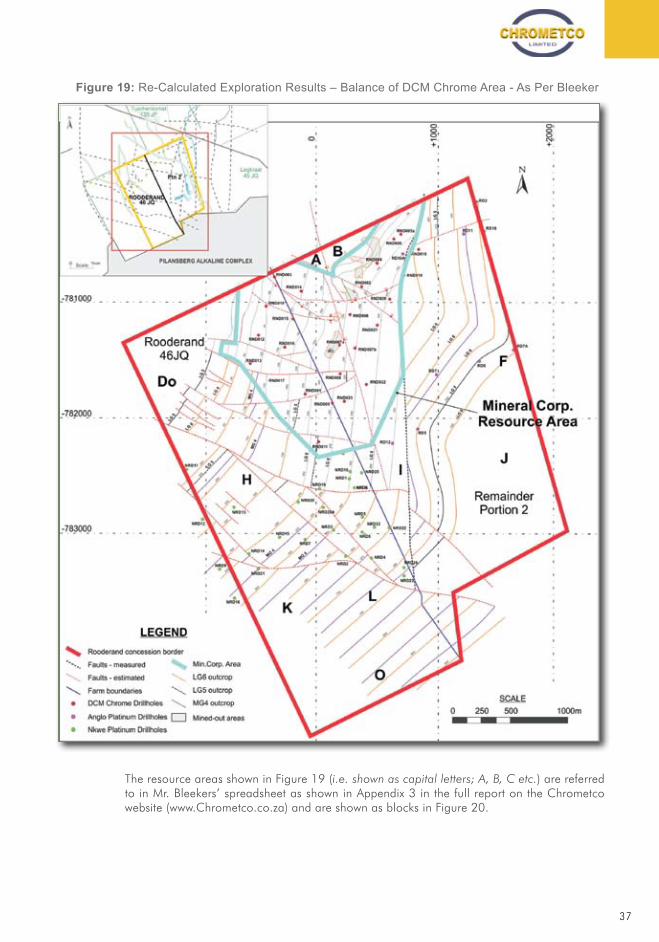
37
Figure 19: Re-Calculated Exploration Results – Balance of DCM Chrome Area - As Per Bleeker
The resource areas shown in Figure 19 (i.e. shown as capital letters; A, B, C etc.) are referred to in Mr. Bleekers’ spreadsheet as shown in Appendix 3 in the full report on the Chrometco website (www.Chrometco.co.za) and are shown as blocks in Figure 20.
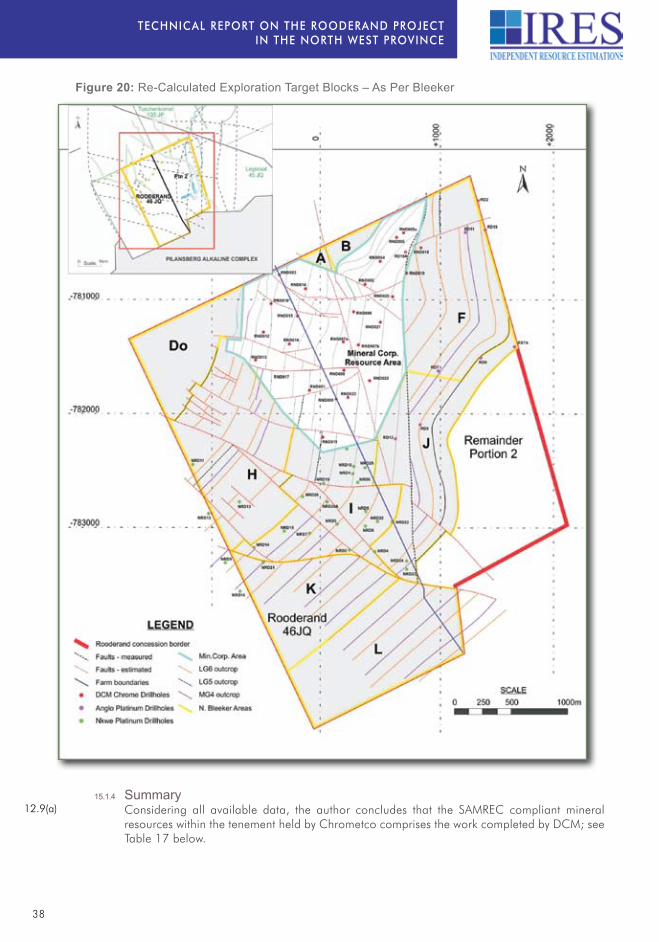
TEChnICAL REPORT On ThE ROODERAnD PROJECTIn ThE nORTh WEST PROVInCE
38
Figure 20: Re-Calculated Exploration Target Blocks – As Per Bleeker
Summary15.1.4
Considering all available data, the author concludes that the SAMREC compliant mineral resources within the tenement held by Chrometco comprises the work completed by DCM; see Table 17 below.
12.9(a)
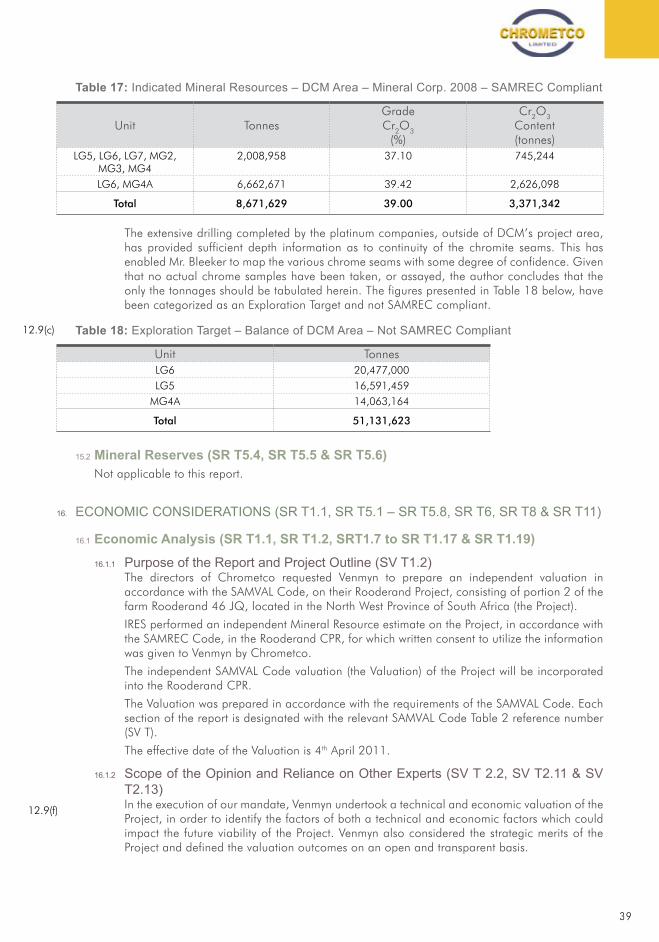
39
Table 17: Indicated Mineral Resources – DCM Area – Mineral Corp. 2008 – SAMREC Compliant
Unit TonnesGrade Cr2O3
(%)
Cr2O3 Content (tonnes)
LG5, LG6, LG7, MG2, MG3, MG4
2,008,958 37.10 745,244
LG6, MG4A 6,662,671 39.42 2,626,098
Total 8,671,629 39.00 3,371,342
The extensive drilling completed by the platinum companies, outside of DCM’s project area, has provided sufficient depth information as to continuity of the chromite seams. This has enabled Mr. Bleeker to map the various chrome seams with some degree of confidence. Given that no actual chrome samples have been taken, or assayed, the author concludes that the only the tonnages should be tabulated herein. The figures presented in Table 18 below, have been categorized as an Exploration Target and not SAMREC compliant.
Table 18: Exploration Target – Balance of DCM Area – Not SAMREC Compliant
Unit TonnesLG6 20,477,000LG5 16,591,459
MG4A 14,063,164
Total 51,131,623
Mineral Reserves (SR T5.4, SR T5.5 & SR T5.6)15.2
Not applicable to this report.
ECONOMIC CONSIDERATIONS (SR T1.1, SR T5.1 – SR T5.8, SR T6, SR T8 & SR T11)16.
Economic Analysis (SR T1.1, SR T1.2, SRT1.7 to SR T1.17 & SR T1.19)16.1
Purpose of the Report and Project Outline (SV T1.2)16.1.1
The directors of Chrometco requested Venmyn to prepare an independent valuation in accordance with the SAMVAL Code, on their Rooderand Project, consisting of portion 2 of the farm Rooderand 46 JQ, located in the North West Province of South Africa (the Project).
IRES performed an independent Mineral Resource estimate on the Project, in accordance with the SAMREC Code, in the Rooderand CPR, for which written consent to utilize the information was given to Venmyn by Chrometco.
The independent SAMVAL Code valuation (the Valuation) of the Project will be incorporated into the Rooderand CPR.
The Valuation was prepared in accordance with the requirements of the SAMVAL Code. Each section of the report is designated with the relevant SAMVAL Code Table 2 reference number (SV T).
The effective date of the Valuation is 4th April 2011.
Scope of the Opinion and Reliance on Other Experts (SV T 2.2, SV T2.11 & SV 16.1.2
T2.13)In the execution of our mandate, Venmyn undertook a technical and economic valuation of the Project, in order to identify the factors of both a technical and economic factors which could impact the future viability of the Project. Venmyn also considered the strategic merits of the Project and defined the valuation outcomes on an open and transparent basis.
12.9(c)
12.9(f)
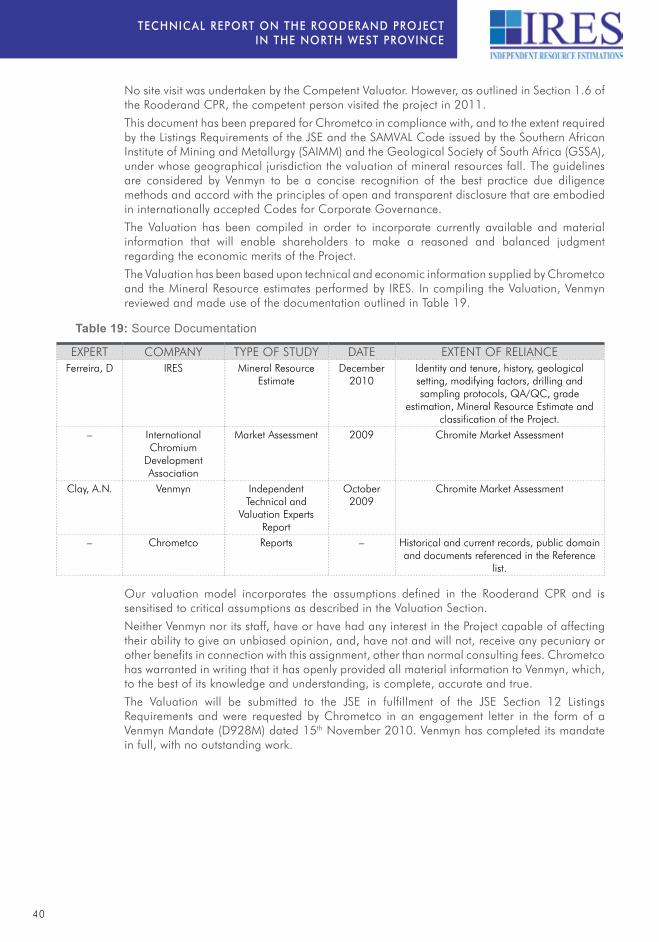
TEChnICAL REPORT On ThE ROODERAnD PROJECTIn ThE nORTh WEST PROVInCE
40
No site visit was undertaken by the Competent Valuator. However, as outlined in Section 1.6 of the Rooderand CPR, the competent person visited the project in 2011.
This document has been prepared for Chrometco in compliance with, and to the extent required by the Listings Requirements of the JSE and the SAMVAL Code issued by the Southern African Institute of Mining and Metallurgy (SAIMM) and the Geological Society of South Africa (GSSA), under whose geographical jurisdiction the valuation of mineral resources fall. The guidelines are considered by Venmyn to be a concise recognition of the best practice due diligence methods and accord with the principles of open and transparent disclosure that are embodied in internationally accepted Codes for Corporate Governance.
The Valuation has been compiled in order to incorporate currently available and material information that will enable shareholders to make a reasoned and balanced judgment regarding the economic merits of the Project.
The Valuation has been based upon technical and economic information supplied by Chrometco and the Mineral Resource estimates performed by IRES. In compiling the Valuation, Venmyn reviewed and made use of the documentation outlined in Table 19.
Table 19: Source Documentation
ExPERT COMPANY TYPE OF STUDY DATE ExTENT OF RELIANCEFerreira, D IRES Mineral Resource
EstimateDecember
2010Identity and tenure, history, geological setting, modifying factors, drilling and sampling protocols, QA/QC, grade
estimation, Mineral Resource Estimate and classification of the Project.
– International Chromium
Development Association
Market Assessment 2009 Chromite Market Assessment
Clay, A.N. Venmyn Independent Technical and
Valuation Experts Report
October 2009
Chromite Market Assessment
– Chrometco Reports – Historical and current records, public domain and documents referenced in the Reference
list.
Our valuation model incorporates the assumptions defined in the Rooderand CPR and is sensitised to critical assumptions as described in the Valuation Section.
Neither Venmyn nor its staff, have or have had any interest in the Project capable of affecting their ability to give an unbiased opinion, and, have not and will not, receive any pecuniary or other benefits in connection with this assignment, other than normal consulting fees. Chrometco has warranted in writing that it has openly provided all material information to Venmyn, which, to the best of its knowledge and understanding, is complete, accurate and true.
The Valuation will be submitted to the JSE in fulfillment of the JSE Section 12 Listings Requirements and were requested by Chrometco in an engagement letter in the form of a Venmyn Mandate (D928M) dated 15th November 2010. Venmyn has completed its mandate in full, with no outstanding work.
41
Valuation (SV T2)16.1.3
Executive Summary (SV T2.1)16.1.3.1
Venmyn was commissioned by Chrometco to perform an independent valuation of the Rooderand Project and Venmyn applied both the cost and market valuation approaches. The SAMVAL Code definition states that the cost approach relies on historic and/or future expenditure on the Mineral Asset. A prospectivity enhancement multiplier (PEM) is a factor applied to the total cost of exploration, at different stages of exploration and project advancement. The magnitude of the PEM is determined by the level of sophistication of the exploration for which positive exploration results, applying the concept of successful efforts, have been obtained. Using the cost approach and a total historical and future amount of ZAR2.70m spent on the Project by Chrometco, as well as a PEM for historical mining of 5, Venmyn determined:
a “fair” (attributable) value for the Project of ZAR13.50m; and•
using a 10% deviation around the “fair” value, an upper and lower value of •ZAR14.85m and ZAR12.15m is determined, respectively.
In valuing the Project, using the market approach, Venmyn made use of a comparative valuation graph, consisting of a database of various, similar, “arm’s length” transactions, which are plotted in relation to their specific stage of exploration (the Venmyn Chromite Valuation Curve).
Using the Venmyn Chromite Valuation Curve, Venmyn determined a “fair” value of USD1.02/t and an upper and lower value range of USD1.44/t and USD0.59/t, respectively. To calculate the total project value, the contained Cr2O3 tonnes per Mineral Resource category are multiplied by the unit values.
Using the market approach and the Exploration Result and indicated Cr2O3 content of 23.265Mt and 3.371Mt, respectively, and spot exchange rate on 4th April 2011 of ZAR6.70/USD, Venmyn determined:
a “fair” (attributable) value for the Project of ZAR181.53m; and•
an upper and lower value of ZAR257.11m and ZAR105.96m, respectively.•
Concluding Opinion of Value16.1.3.2
Since the market approach relies on similar, recent, “arm’s length” transactions, the Competent Valuator prefer the valuation results of the market approach. The concluding opinion of value (attributable) for the Project is based on the market approach as follows:
a “fair” (attributable) value for the Project of ZAR181.53m; and•
an upper and lower value of ZAR257.11m and ZAR105.96m, respectively.•
Introduction (SV T2.2)16.1.3.3
Venmyn was commissioned by Chrometco to perform an independent valuation of the Project.
The valuation was compiled in accordance with the reporting and assessment criteria stipulated for Mineral Asset Valuations in the SAMVAL Code (2008). The valuation was performed on a 100% attributable basis.
Scope of Work (SV T2.2)16.1.3.4
The scope of work was to complete an independent SAMVAL Code compliant valuation of the Project.
Identity and Tenure (SV T2.3)16.1.3.5
See Sections 3.2 & 3.3 of the Rooderand CPR.
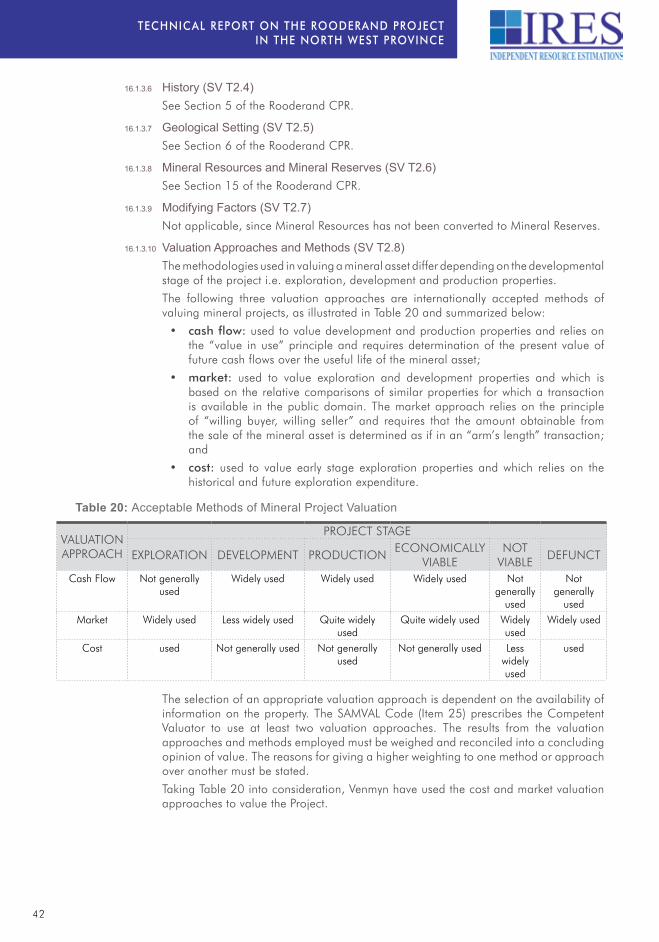
TEChnICAL REPORT On ThE ROODERAnD PROJECTIn ThE nORTh WEST PROVInCE
42
History (SV T2.4)16.1.3.6
See Section 5 of the Rooderand CPR.
Geological Setting (SV T2.5)16.1.3.7
See Section 6 of the Rooderand CPR.
Mineral Resources and Mineral Reserves (SV T2.6)16.1.3.8
See Section 15 of the Rooderand CPR.
Modifying Factors (SV T2.7)16.1.3.9
Not applicable, since Mineral Resources has not been converted to Mineral Reserves.
Valuation Approaches and Methods (SV T2.8)16.1.3.10
The methodologies used in valuing a mineral asset differ depending on the developmental stage of the project i.e. exploration, development and production properties.
The following three valuation approaches are internationally accepted methods of valuing mineral projects, as illustrated in Table 20 and summarized below:
cash flow:• used to value development and production properties and relies on the “value in use” principle and requires determination of the present value of future cash flows over the useful life of the mineral asset;
market:• used to value exploration and development properties and which is based on the relative comparisons of similar properties for which a transaction is available in the public domain. The market approach relies on the principle of “willing buyer, willing seller” and requires that the amount obtainable from the sale of the mineral asset is determined as if in an “arm’s length” transaction; and
cost:• used to value early stage exploration properties and which relies on the historical and future exploration expenditure.
Table 20: Acceptable Methods of Mineral Project Valuation
VALUATION APPROACH
PROJECT STAGE
ExPLORATION DEVELOPMENT PRODUCTIONECONOMICALLY
VIABLENOT
VIABLEDEFUNCT
Cash Flow Not generally used
Widely used Widely used Widely used Not generally
used
Not generally
usedMarket Widely used Less widely used Quite widely
usedQuite widely used Widely
usedWidely used
Cost used Not generally used Not generally used
Not generally used Less widely used
used
The selection of an appropriate valuation approach is dependent on the availability of information on the property. The SAMVAL Code (Item 25) prescribes the Competent Valuator to use at least two valuation approaches. The results from the valuation approaches and methods employed must be weighed and reconciled into a concluding opinion of value. The reasons for giving a higher weighting to one method or approach over another must be stated.
Taking Table 20 into consideration, Venmyn have used the cost and market valuation approaches to value the Project.
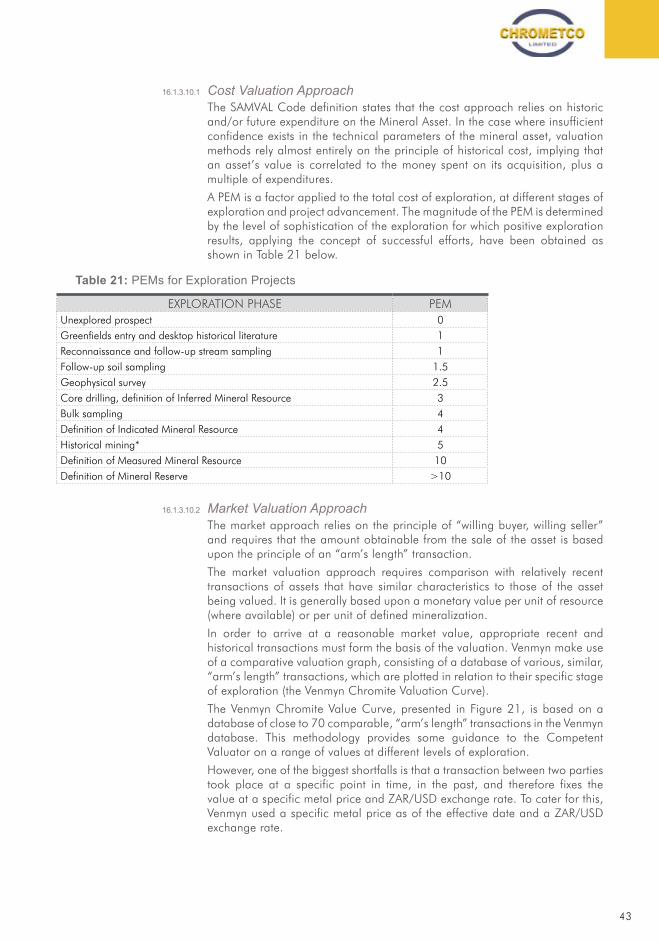
43
Cost Valuation Approach16.1.3.10.1
The SAMVAL Code definition states that the cost approach relies on historic and/or future expenditure on the Mineral Asset. In the case where insufficient confidence exists in the technical parameters of the mineral asset, valuation methods rely almost entirely on the principle of historical cost, implying that an asset’s value is correlated to the money spent on its acquisition, plus a multiple of expenditures.
A PEM is a factor applied to the total cost of exploration, at different stages of exploration and project advancement. The magnitude of the PEM is determined by the level of sophistication of the exploration for which positive exploration results, applying the concept of successful efforts, have been obtained as shown in Table 21 below.
Table 21: PEMs for Exploration Projects
ExPLORATION PHASE PEMUnexplored prospect 0Greenfields entry and desktop historical literature 1Reconnaissance and follow-up stream sampling 1Follow-up soil sampling 1.5Geophysical survey 2.5Core drilling, definition of Inferred Mineral Resource 3Bulk sampling 4Definition of Indicated Mineral Resource 4Historical mining* 5Definition of Measured Mineral Resource 10Definition of Mineral Reserve >10
Market Valuation Approach16.1.3.10.2
The market approach relies on the principle of “willing buyer, willing seller” and requires that the amount obtainable from the sale of the asset is based upon the principle of an “arm’s length” transaction.
The market valuation approach requires comparison with relatively recent transactions of assets that have similar characteristics to those of the asset being valued. It is generally based upon a monetary value per unit of resource (where available) or per unit of defined mineralization.
In order to arrive at a reasonable market value, appropriate recent and historical transactions must form the basis of the valuation. Venmyn make use of a comparative valuation graph, consisting of a database of various, similar, “arm’s length” transactions, which are plotted in relation to their specific stage of exploration (the Venmyn Chromite Valuation Curve).
The Venmyn Chromite Value Curve, presented in Figure 21, is based on a database of close to 70 comparable, “arm’s length” transactions in the Venmyn database. This methodology provides some guidance to the Competent Valuator on a range of values at different levels of exploration.
However, one of the biggest shortfalls is that a transaction between two parties took place at a specific point in time, in the past, and therefore fixes the value at a specific metal price and ZAR/USD exchange rate. To cater for this, Venmyn used a specific metal price as of the effective date and a ZAR/USD exchange rate.
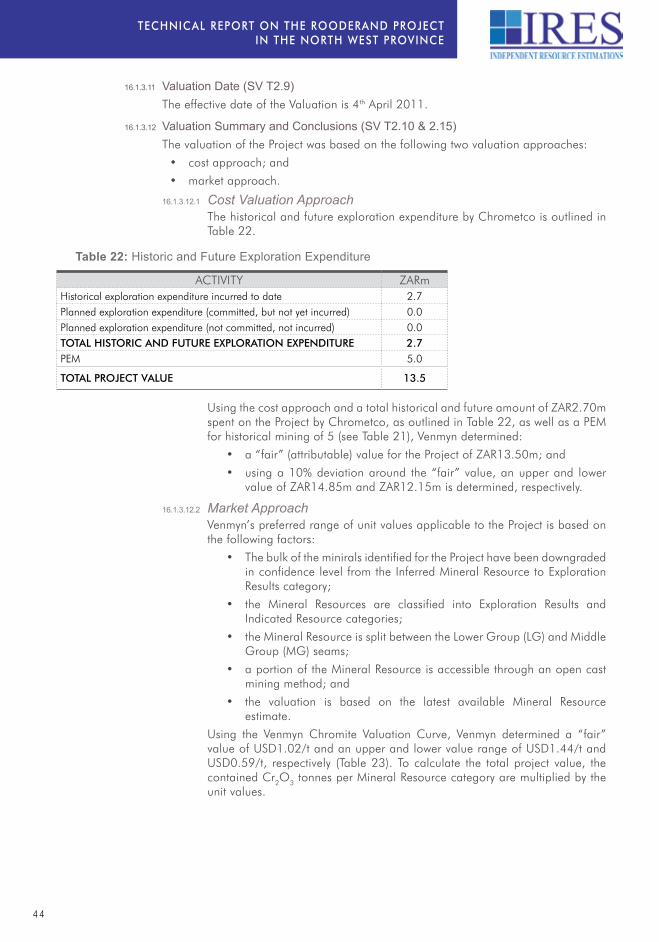
TEChnICAL REPORT On ThE ROODERAnD PROJECTIn ThE nORTh WEST PROVInCE
44
Valuation Date (SV T2.9)16.1.3.11
The effective date of the Valuation is 4th April 2011.
Valuation Summary and Conclusions (SV T2.10 & 2.15)16.1.3.12
The valuation of the Project was based on the following two valuation approaches:
cost approach; and•
market approach.•
Cost Valuation Approach16.1.3.12.1
The historical and future exploration expenditure by Chrometco is outlined in Table 22.
Table 22: Historic and Future Exploration Expenditure
ACTIVITY ZARmHistorical exploration expenditure incurred to date 2.7Planned exploration expenditure (committed, but not yet incurred) 0.0Planned exploration expenditure (not committed, not incurred) 0.0TOTAL hISTORIC AnD FUTURE EXPLORATIOn EXPEnDITURE 2.7PEM 5.0
TOTAL PROJECT VALUE 13.5
Using the cost approach and a total historical and future amount of ZAR2.70m spent on the Project by Chrometco, as outlined in Table 22, as well as a PEM for historical mining of 5 (see Table 21), Venmyn determined:
a “fair” (attributable) value for the Project of ZAR13.50m; and•
using a 10% deviation around the “fair” value, an upper and lower •value of ZAR14.85m and ZAR12.15m is determined, respectively.
Market Approach16.1.3.12.2
Venmyn’s preferred range of unit values applicable to the Project is based on the following factors:
The bulk of the minirals identified for the Project have been downgraded •in confidence level from the Inferred Mineral Resource to Exploration Results category;
the Mineral Resources are classified into Exploration Results and •Indicated Resource categories;
the Mineral Resource is split between the Lower Group (LG) and Middle •Group (MG) seams;
a portion of the Mineral Resource is accessible through an open cast •mining method; and
the valuation is based on the latest available Mineral Resource •estimate.
Using the Venmyn Chromite Valuation Curve, Venmyn determined a “fair” value of USD1.02/t and an upper and lower value range of USD1.44/t and USD0.59/t, respectively (Table 23). To calculate the total project value, the contained Cr2O3 tonnes per Mineral Resource category are multiplied by the unit values.
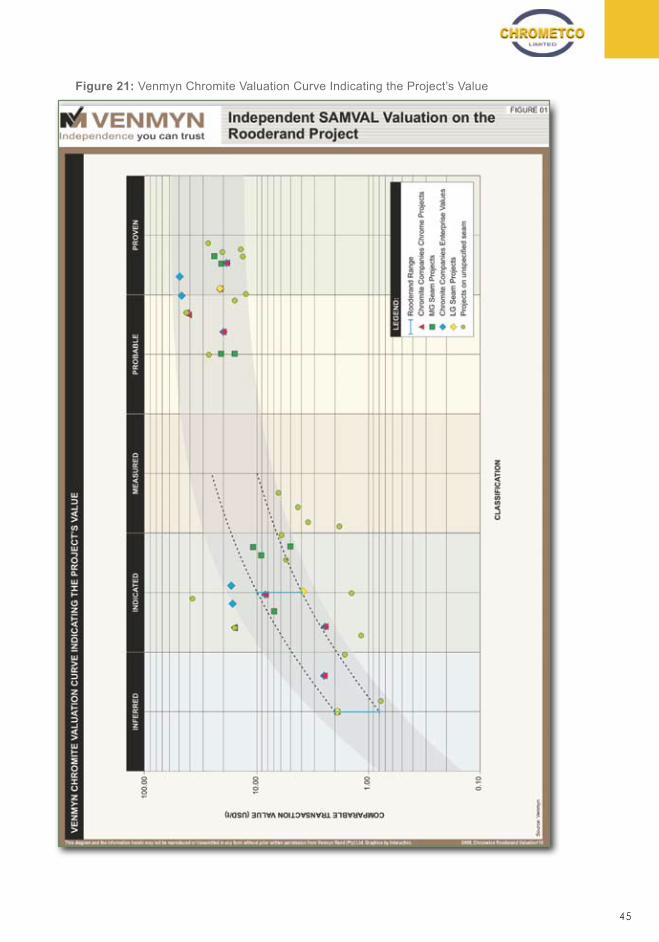
45
Figure 21: Venmyn Chromite Valuation Curve Indicating the Project’s Value
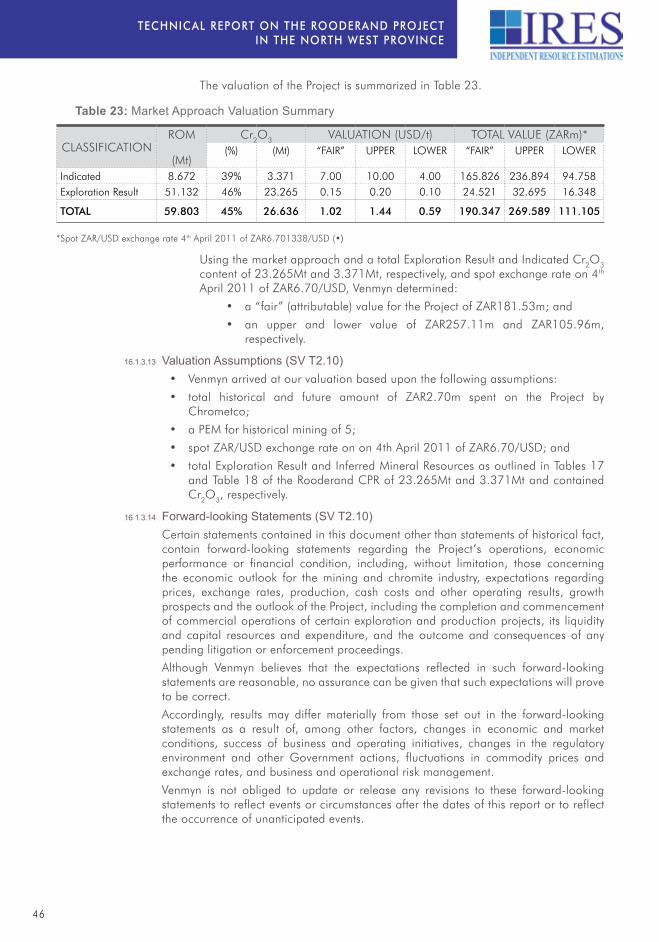
TEChnICAL REPORT On ThE ROODERAnD PROJECTIn ThE nORTh WEST PROVInCE
46
The valuation of the Project is summarized in Table 23.
Table 23: Market Approach Valuation Summary
CLASSIFICATIONROM
(Mt)
Cr2O3 VALUATION (USD/t) TOTAL VALUE (ZARm)*(%) (Mt) “FAIR” UPPER LOWER “FAIR” UPPER LOWER
Indicated 8.672 39% 3.371 7.00 10.00 4.00 165.826 236.894 94.758Exploration Result 51.132 46% 23.265 0.15 0.20 0.10 24.521 32.695 16.348
TOTAL 59.803 45% 26.636 1.02 1.44 0.59 190.347 269.589 111.105
*Spot ZAR/USD exchange rate 4thApril2011ofZAR6.701338/USD(•)
Using the market approach and a total Exploration Result and Indicated Cr2O3 content of 23.265Mt and 3.371Mt, respectively, and spot exchange rate on 4th April 2011 of ZAR6.70/USD, Venmyn determined:
a “fair” (attributable) value for the Project of ZAR181.53m; and•
an upper and lower value of ZAR257.11m and ZAR105.96m, •respectively.
Valuation Assumptions (SV T2.10)16.1.3.13
Venmyn arrived at our valuation based upon the following assumptions:•
total historical and future amount of ZAR2.70m spent on the Project by •Chrometco;
a PEM for historical mining of 5;•
spot ZAR/USD exchange rate on on 4th April 2011 of ZAR6.70/USD; and•
total Exploration Result and Inferred Mineral Resources as outlined in Tables 17 •and Table 18 of the Rooderand CPR of 23.265Mt and 3.371Mt and contained Cr2O3, respectively.
Forward-looking Statements (SV T2.10)16.1.3.14
Certain statements contained in this document other than statements of historical fact, contain forward-looking statements regarding the Project’s operations, economic performance or financial condition, including, without limitation, those concerning the economic outlook for the mining and chromite industry, expectations regarding prices, exchange rates, production, cash costs and other operating results, growth prospects and the outlook of the Project, including the completion and commencement of commercial operations of certain exploration and production projects, its liquidity and capital resources and expenditure, and the outcome and consequences of any pending litigation or enforcement proceedings.
Although Venmyn believes that the expectations reflected in such forward-looking statements are reasonable, no assurance can be given that such expectations will prove to be correct.
Accordingly, results may differ materially from those set out in the forward-looking statements as a result of, among other factors, changes in economic and market conditions, success of business and operating initiatives, changes in the regulatory environment and other Government actions, fluctuations in commodity prices and exchange rates, and business and operational risk management.
Venmyn is not obliged to update or release any revisions to these forward-looking statements to reflect events or circumstances after the dates of this report or to reflect the occurrence of unanticipated events.
47
Sources of Information (SV T2.11)16.1.3.15
In arriving at our opinion Venmyn relied upon the following principal sources of information:
spot ZAR/USD exchange rate of ZAR6.70/USD as published on •http://www.exchange-rates.org/history/ZAR/USD/T;
the Chromite Market Assessment was based on certain supply and demand tables •published by the International Chromium Development Association (ICDA) and previous public domain reports published by Venmyn;
independent SAMREC Code compliant Mineral Resource estimation on the Project •by IRES (Dexter S. Ferreira, December 2010);
future economic information based upon analysts’ forecasts and most recent •Reuters consensus views as determined by various contributing economists;
all technical data was sourced from Chrometco or public domain documents;•
discussions with Chrometco management with respect to head grades, mining •and production rates, recoveries and price forecasts;
discussions with Chrometco directors and management on prevailing market, •economic, legal and other conditions which may affect underlying value;
publicly available information relating to the mining sector; and•
publicly available information relating to Chrometco that Venmyn deemed to •be relevant, including company announcements, analysts’ reports and media articles.
The information above was sourced from:
directors and management of Chrometco and their advisors; and•
third party sources, insofar as such information related to publicly available •economic, market and other data applicable to or potentially influencing the value of the Project.
Previous Valuations (SV T2.12)16.1.3.16
Venmyn is not aware of any previous valuations of the Project in the public domain.
Competent Valuator’s Statements (SV T2.14)16.1.3.17
I, Andrew Neil Clay, M.Sc.(Geol), M.Sc.(Min.Eng) Dip.Bus.M, MSAIMM, FAusIMM, FGSSA, MAIMA,SPE, Pr.Sci.Nat (400105/88):
do hereby certify that:
1. I am the Managing Director of Venmyn Rand (Pty) Limited
First Floor, Block GRochester Place173 Rivonia RoadSandton. 2146South Africa
2. I have more than 30 years experience in the minerals industry, from field geology, research, and mineral resource management to commercial due diligence and evaluation of a wide range of local and international mineral assets. In addition, I have more than 20 years of experience working with commercial banks and financial institutions on transactions in the minerals industry, and have been involved in the preparation of numerous codes and rules for compliance and reporting in the public domain.
3. I am a member/fellow of the following professional associations:

TEChnICAL REPORT On ThE ROODERAnD PROJECTIn ThE nORTh WEST PROVInCE
48
CLASS PROFESSIONAL SOCIETYREGISTRATION
YEARAdvisor JSE Limited Listings Advisory Committee 2005Issuer JSE Issuer Services 2008
Member JSE Issuer Mining Sub-committee 2009Associate Member Society of Petroleum Engineers (3445293) 2009
Member South African Institute of Directors (041397) 2004Fellow Geological Society of South Africa 2003
Member American Institute of Mineral Appraisers 2002Member South African Institute of Mining and Metallurgy 1998Fellow Australasian Institute of Mining and Metallurgy (111988) 1994
Member Natural Scientist Institute of South Africa 1988Member Investment Analysts Society of South Africa 1990Advisor JSE Limited Listings Advisory Committee 2005Issuer JSE Issuer Services 2008
Member JSE Issuer Mining Sub-committee 2009
4. To the best of my knowledge, information and belief, the report contains all scientific and technical information required to be disclosed to make the report not misleading.
5. To the best of my knowledge, information and belief all facts presented in the report are correct.
6. I am independent of (the enquiring Company) and its subsidiaries, have no bias with respect to the assets that are the subject of the report, have no present or prospective interest in the subject, property or asses, or the parties involved with this assignment.
7. I have read the definition of “competent valuator” set out in the SAMREC Code and certify that be reason of my education, affiliation with a professional association (as defined in the SAMREC Code) and past relevant work experience, I fulfill the requirements to be a Valuator for the purposes of SAMREC Code and SAMVAL Code.
8. I have not made a personal inspection of the Project.
Dated this 4th May 2011 at Johannesburg, South Africa,
A.n. CLAY
MAnAGInG DIRECTOR
Pr Sci Nat, MSAIMM, FAusIMM, FGSSA, MAIMA
M.Sc. (Geol.), M.Sc. (Min. Eng.), Dip. Bus. M.
49
Identifiable Component Asset Values (SV T2.16)16.1.3.18
N/A
Historic Verification (SV T2.17)16.1.3.19
N/A
Chromite Market Assessment (SV T2.18)16.1.3.20
The Chromite Market Assessment is presented in Appendix 5.
Audits and Reviews (SV T2.19)16.1.3.21
Venmyn is not aware of any audits or reviews that were performed on the Project.
SUMMARY, CONCLUSIONS, INTERPRETATION (SVT2.10) AND RANGES OF 16.2
VALUES (SV T2.15)The technical and economic review of the Project by Venmyn has highlighted the following interpretations and conclusions:
the independent Valuation was prepared in accordance with the requirements of the JSE •Listings Requirements SAMREC Code and the SAMVAL Code;
all requirements of Section 12.9 of the JSE Listings Requirements and the SAMVAL Code •(including Table 2) have been complied in completing the Valuation;
Venmyn have used the cost and market valuation approaches to value the Project;•
Since the market approach relies on similar, recent, “arm’s length” transactions, the •Competent Valuator prefer the valuation results of the market approach. The concluding opinion of value (attributable) for the Project is based on the market approach having a “fair” (attributable) value for the Project of ZAR181.53m; and an upper and lower value of ZAR257.11m and ZAR105.96m, respectively; and
Venmyn has completed its mandate in full, with no outstanding work.•
Yours faithfully
A.n. CLAY
MAnAGInG DIRECTOR
Pr Sci Nat, MSAIMM, FAusIMM, FGSSA, MAIMA
M.Sc. (Geol.), M.Sc. (Min. Eng.), Dip. Bus. M.
Effective Date: 1st December 2010
12.9(e)
12.9(a)
TEChnICAL REPORT On ThE ROODERAnD PROJECTIn ThE nORTh WEST PROVInCE
50
ADDITIONAL REQUIREMENTS FOR TECHNICAL REPORTS ON DEVELOPMENT 17.
POPERTIES AND PRODUCTION PROPERTIES (SR T5.1 – SR T5.8, & SR T10)Not applicable to this report.
INTERPRETATION AND CONCLUSIONS18.
Interpretation18.1
The technical review of the Rooderand project by IRES has highlighted the following interpretations and conclusions:
the Competent Persons Report was prepared in accordance with the requirements of the •SAMREC Code;
all requirements of Section 12.9 of the JSE Listings Requirements and the SAMREC Code •(including Table 1) have been complied in completing the CPR;
the historical exploration data are not of sufficient quality and validity to be considered •SAMREC Code (2007) compliant Mineral Resource estimation, since they were estimated by extrapolating neighbouring seam development and not on a comprehensive drilling program. As a result an Exploration Result has been declared;
the Indicated Mineral Resources as estimated by The Mineral Corporation in 2008 and •presented in their CPR in mid 2009 are considered by the author to be of sufficient quality and validity to be SAMREC Code (2007) compliant. These should be considered the Mineral Resources for the northern portion of Portion 2 since they are based on a comprehensive drilling and sampling campaign;
the re-estimated mineral resources as calculated by Mr. N.A. Bleeker in late 2010 and •revised in April 2011 Exploration Results. Given the continuous nature of the chrome seams, and the depth data from former PGE drilling campaigns, these figures are considered to be sufficient to be classified as Exploration Results; and
IRES have completed its mandate in full, with no outstanding work.•
Yours faithfully
D.S. Ferreira
BSc (Geology), BEng (Mining), Pr.Sci.Nat.
DIRECTOR OF IRES
Effective Date: 10th January 2011
51
REFERENCES (SV T1.11)19.
Anhaeusser, C.R. & Maske, S., Eds. (1986): Mineral Deposits of Southern Africa. Vols I & II. Geol.Soc.S.Afr. 2376 pp.
Bleeker, N.A. (2002). A Competent Persons Report on the mineral assets of Chrometco Limited for the purpose of listing on the JSE, N.A. Bleeker Geological Services cc.
Bumby, AJ, Eriksson, PG & Van Der Merwe, R (1998): Compressive deformation in the floor rock to the Bushveld Complex (South Africa): evidence from the Rustenburg Fault Zone. Jour. of Afr. Earth Sci., Vol. 27, No. ¾, pp. 307-330.
Davison, G.E. (1997): A Report for Rustenburg Platinum Mines and Amplats. Pilanesberg Seismic Survey: First Interpretation.
Gough, D.I. (1956): A study of the Palaeomagnetism of the Pilanesberg dykes, Mon. At. Roy. Soc. Geophys. Suppl., 7, 196-213
Hattingh, P.J. (1986a): The palaeomagnetism of the main zone in the western Bushveld Complex, Earth and Planetary Science Letters, 79, 447-452.
Hattingh, P.J. (1986b): The Palaeomagnetism of the Main Zone of the Eastern Bushveld Complex, Tectonophysics, 124, 271-295.
Hattingh, P.J. (1986c): The Palaeomagnetism of the Merensky Reef Footwall Rocks of the Bushveld Complex, Transactions of the Geological Society of South Africa, 89, 1-8
Hattingh, P.J. (1989): Palaeomagnetism of the upper zone of the Bushveld Complex, Tectonophysics, 165, 131-142.
Hattingh, P.J. (1990): Palaeomagnetism of granites in the Bushveld Complex, South African Journal of Geology, 93(3), 519.
Hattingh, P.J. (1991): The magnetic susceptibility of the mafic rocks of the Bushveld Complex, South African Journal of Geology, 94(2/3), 132-136.
Hattingh, P.J. & Pauls, N.D. (1994): New Palaeomagnetic results from the northern Bushveld Complex of South Africa. Precambrian Research, 69, 229-240.
Maré, L.P., Oosthuizen, B.C. & Tabane, L.R. (2001): South African Geophysical Atlas, Volume IV, Physical properties of South African Rocks, Version III, October 2001. Council for Geoscience.
Mineral Corporation (2009): Exploration Results and Mineral Resource Estimates for Chrome Deposits on the Farm Rooderand 46JQ. Document prepared on behalf of DCMchrome (Pty) Ltd.
Schürman, L. W. et.al., The Mineral Resources of South Africa, Sixth Edition, Handbook 16, Edited by Wilson,.M.G.C. and Anhaesser, C.R, Council for Geoscience, page 100.
References to the Chromite Market Assessment is outlined in the following table:
AUTHOR DATE TITLE SOURCEAssore 2010 Review of Operations http://www.assore.comChitando, W 2010 State of the Mining Sector in
Zimbabwe- an Industry PerspectivePresentattion for Mining Indaba Harare on 15th September 2010
Chromex 2010 Chromex Mining pls Acquisition of Waylox Mining (Pvt) Ltd
http://www.londonstockexchange.com
Creamer, M 2010 Merafe/xstrata to build R1bn Tswelopele chrome-fines plant
http://www.miningweekly.com
Department of Mineral Resources
2010 Mineral Production and Sales Statistics Department of Mineral Resources
TEChnICAL REPORT On ThE ROODERAnD PROJECTIn ThE nORTh WEST PROVInCE
52
AUTHOR DATE TITLE SOURCEIndustrial Minerals undated Chromite http://www.indimin.comIndustrial Minerals 2011 Price Briefing : Week 4- rare
earths,chromite, bentonitehttp://www.indimin.com
International Chromium Development Association (ICDA)
Accessed February 2010
International Chromium Development Association
http://icdachromium.com
Seccombe, A 2009 Junior Chrome Producers up in Arms http://www.miningmx.comSBB Daily Briefing 2011 2010 World Stainless Output a
Record High, Data Suggestshttp://www.icdachromium.com

Chrometco Ltd.70 Marshall Street
JohannesburgSouth Africa
Independent Resource Estimations11 & 13 Jupiter StreetWestonaria, South Africa1780
www.chrometco.co.za