technical report - der.wa.gov.au · technical report may 2009 w e s t e r n ... 1.1 nature and...
TRANSCRIPT

Ambient Monitoring ofParticulate Matter in Kalgoorlie, 2006-2007
Technical Report
May 2009
WE
S
TE
R N A U S TR
A
LIA
TH
E G
OV E R N M
EN
T O
F
2009
164-
0509
-WEB
Ambient monitoring of Particulate Matter in Kalgoorlie
2006-2007
Technical report
Prepared by Olga Prokopenko and Farah Adeeb
Email: [email protected]
May 2009

Ambient monitoring of particulate matter in Kalgoorlie, 2006 - 2007 Technical Report
2
Acknowledgments We acknowledge Kalgoorlie Consolidated Gold Mines’ assistance in supplying the PM10 data and additional information. We also thank Wayne Astill and Fiona Westcott from Goldfields Regional Services Division of the Department of Environment and Conservation for their review of the draft report.

Ambient monitoring of particulate matter in Kalgoorlie, 2006 - 2007 Technical Report
3
TABLE OF CONTENTS Definitions and abbreviations...........................................................................6 SUMMARY ......................................................................................................7
1.0 INTRODUCTION .......................................................................................8 1.1 Nature and health impacts of particulate matter.............................. ..........9
1.2 Major PM10 emission sources in the region............................................... 9 2.0 SAMPLING LOCATIONS AND MONITORING METHOD.......................10 3.0 RESULTS AND DISCUSSION ................................................................13
3.1 Meteorological conditions (1 January 2006 - 31 December 2007) ...........13
3.2 Comparison with Air NEPM standard.......................................................15
3.3 PM10 concentration at Kalgoorlie’s monitoring stations during period from January 2006 to December 2007...................................................................17
3.3.1 Seasonal variations......................................................................19
3.3.2 Monthly variations of particulate matter concentration……………24
3.3.3 Diurnal variations .........................................................................26
3.4 Back trajectories ......................................................................................28
3.5 Inter site comparison................................................................................29
3.6 Comparison with stations across the State ..............................................31 CONCLUSION...............................................................................................31
Bibliography.................................................................................................33

Ambient monitoring of particulate matter in Kalgoorlie, 2006 - 2007 Technical Report
4
List of figures
Figure 1 Kalgoolie region showing the metropolitan area, PM10 and meteorological monitoring sites and major industry particulates sources ......12
Figure 2 PM10 daily maximum average concentration versus Air NEPM standard.........................................................................................................16
Figure 3 Annual daily peak of PM10, 2006....................................................18
Figure 4 Annual daily peak of PM10, 2007.....................................................18
Figure 5 Seasonal wind roses for MEX monitoring site in 2006 ...................22
Figure 6 Seasonal wind roses for MEX monitoring site in 2007 ...................23
Figure 7 Monthly particulate matter concentration at BSY, 2006 .................24
Figure 8 Monthly particulate matter concentration at HGC, 2006.................24
Figure 9 Monthly particulate matter concentration at BSY, 2007 ..................25
Figure 10 Monthly particulate matter concentration at HGC, 2007................25
Figure 11 Summer diurnal variation in particulate matter concentration, 2006.......................................................................................................................27
Figure 12 Winter diurnal variation in particulate matter concentration, 2006........................................................................................................................27 Figure 13 Summer diurnal variation in particulate matter concentration, 2007.......................................................................................................................27 Figure 14 Winter diurnal variation in particulate matter concentration, 2007.28 Figure 15 Frequency distribution in difference of concentration....................30
Ambient monitoring of particulate matter in Kalgoorlie, 2006 - 2007 Technical Report
5
List of tables Table 1 PM10 emissions reported to the NPI (2006/2007)…………………….9 Table 2 Summary of meteorological parameters recorded by Bureau of meteorology at Kalgoorlie-Boulder Airport (2006-2007)……………………… 14 Table 3 Particulate matter, as PM10, 24-hour average concentration and compliance, 2006-2007……………………………………………………………16 Table 4 Annual average concentration of PM10 during 2006-2007, (µg/m³)…17 Table 5 Summary of PM10 concentration in Kalgoorlie 2006-2007, (µg/m³)...17 Table 6 Summer/winter particulate matter concentration as PM10 in Kalgoorlie, µg/m³.………………………………………………………………......19 Table 7 Descriptive statistics for seasonal PM10 concentration, 2006 ..........20 Table 8 Descriptive statistics for seasonal PM10 concentration, 2007 ..........20 Table 9 Difference in concentration between sites .......................................29 Table 10 T-test: Two-sample assuming unequal variances..........................29 Table 11 Summary of PM10 concentration and number of exceedences in Kalgoorlie, Perth and Geraldton during 2006-2007........................................31 Appendices Appendix1 PM10 exceedences on 1 May 2006 in Kalgoorlie ........................35 Appendix 2 PM10 exceedences on 15 August 2006 in Kalgoorlie .................36 Appendix 3 PM10 exceedences on16 September 2006 in Kalgoorlie............37 Appendix 4 PM10 exceedences on 11 October 2006 in Kalgoorlie ...............39 Appendix 5 PM10 exceedences on 18 October 2006 in Kalgoorlie ………....39 Appendix 6 PM10 exceedences on 4 February 2007 in Kalgoorlie …….......39 Appendix 7 PM10 exceedences on 26 March 2007 in Kalgoorlie ..................41 Appendix 8 PM10 exceedences on 22 May 2007 in Kalgoorlie .....................42 Appendix 9 PM10 exceedences on 26 August 2007 in Kalgoorlie .................43 Appendix 10 PM10 exceedences on 24 November 2007 in Kalgoorlie …….44 Appendix 11 PM10 exceedences on 5 December 2007 in Kalgoorlie ……...45 Appendix 12 PM10 exceedences on 8 December 2007 in Kalgoorlie ……...46 Appendix 13 PM10 exceedences on 26 July 2006 in Kalgoorlie …………….47 Appendix 14 PM10 exceedences at HGC monitoring site in Kalgoorlie………………………………..………………………………………… 49 Appendix 15 Instrument specifications……………………………………...…..54 Appendix 16-17 Wind speed and wind direction frequency distribution…….55

Ambient monitoring of particulate matter in Kalgoorlie, 2006 - 2007 Technical Report
6
Definitions and abbreviations Air NEPM Ambient Air Quality National Environmental Protection Measure Ambient air The external air environment, does not include the air
environment inside buildings or structures BAM Beta Attenuation Monitor BoM Bureau of Meteorology BSY Boulder Shire Yard Monitoring Station DEC Department of Environment and Conservation HGC Hannans Golf Course Monitoring Station KCGM Kalgoorlie Consolidated Gold Mines MEX Metals Explorations Monitoring Station NEPC National Environment Protection Council NPI National Pollutant Inventory percentile A value that divides a sample of data into 100 groups containing equal number of observations, for example, the 90th is a value above which 10% or (10/100) and below which 90% (or 90/100) of all observations fall. PM10 Particulate matter with an equivalent aerodynamic diameter of 10 microns or less. PRC Peer Review Committee
TEOM Tapered Element Oscillating Microbalance
WHO World Health Organisation
µg/m3 Micrograms per cubic metre

Ambient monitoring of particulate matter in Kalgoorlie, 2006 - 2007 Technical Report
7
SUMMARY The City of Kalgoorlie-Boulder is located approximately 600 kilometres east of Perth in the Western Australian Goldfields. The city’s population is 30,000. Kalgoorlie, Boulder and surrounding suburbs form one local government area, the City of Kalgoorlie-Boulder. Kalgoorlie-Boulder is a major industrial and mining centre in the Goldfields region. The combination of the dry climate, storage of mine waste near the city, unsealed roads and degraded land within and surrounding the city have all contributed to the dust problem. The dust or solid airborne particles are generated and dispersed into the air by processes such as handling, crushing and grinding of organic or inorganic materials such as rock, ore, coal or grain and stockpiling of materials. This report provides an assessment of ambient particulate matter with an aerodynamic diameter of up to 10 µm (i.e. PM10) and examines the need for future monitoring in the Kalgoorlie region. Data for analysis of PM10 were obtained from two monitoring sites, Hannans Golf Club (HGC) and Boulder Shire Yard (BSY) for the period from January 2006 to December 2007. These monitoring sites are operated by Kalgoorlie Consolidated Gold Mines (KCGM) and established to comply with regulatory conditions. BSY monitoring site is located in a “hot spot”, while HGC is to measure background PM10 concentration. Comparison of the data from non-NEPM BSY and HGC sites with the Air NEPM standard presented in this report is for indicative purpose only. An overview of findings is provided below.
• Particulate Matter levels at BSY monitoring station, located in the vicinity
of industrial sources, did not breach the standard set by the Air NEPM as there were five exceedences of PM10 concentration in 2006. However in 2007 the Air NEPM Goal of no more than 5 five days of PM10 concentration above 50 µg/m3 was not achieved.
• Concentrations at HGC monitoring station, located on the northern
outskirts of Kalgoorlie area, did not meet the Air NEPM standard in 2007 due to intensive local impact around the site. The number of exceedences registered at HGC is twice as many as the number of exceedences at BSY monitoring station.
• On average, 60% cases of elevated PM10 concentration in Kalgoorlie
were associated with windblown dust, while 40% could be due to anthropogenic emissions for example industry, wood heaters, etc.
• When compared to other cities in Western Australia (i.e. Perth,
Geraldton) Kalgoorlie has the highest number of exceedences for the same period (2006-2007).
Based on the analysis of PM10 data from two monitoring stations in Kalgoorlie it is recommended to continue ambient monitoring of PM10 to determine long

Ambient monitoring of particulate matter in Kalgoorlie, 2006 - 2007 Technical Report
8
term trends. The Department of Environment and Conservation is proactively selecting a suitable site for installation of PM10 monitoring station in Kalgoorlie. The results of this monitoring could be a basis for the evaluation of particulate management strategies in the Kalgoorlie airshed. There is also need for further work to better quantify and manage the sources of particles.
1.0 INTRODUCTION The terms “particle pollution” or “particulate matter” (PM) refer to solid particles and liquid droplets found in the air. These solid and liquid particles come in a wide range of sizes. The size of particulate matter is measured in micrometres (µm) which is 1/1,000,000 of a metre. Particulate matter is often classified into size fractions, namely, Total Suspended Particulates (TSP), PM10 and PM2.5. PM2.5 is particulate matter with an aerodynamic diameter of up to 2.5 µm. All references to the particulate matter in the report refers to the PM10 is particulate matter with an aerodynamic diameter of up to 10 µm micrometres, where dust refers to particulates in general. PM10 was identified by the National Environment Protection Council (NEPC) as one of the six major pollutants affecting ambient air quality. Kalgoorlie-Boulder is a Western Australian city located about 600 km east of Perth, with a population of 30,000. Kalgoorlie is the largest urban, industrial and mining centre in the Goldfields-Esperance region and is a naturally dusty place.
Kalgoorlie-Boulder has a dry climate, with hot summers and cool winters. The average annual rainfall is 260 mm, which occurs over an average of 65 days during the year. While the average rainfall is fairly evenly distributed annually, there is considerable variation from year to year. January is the hottest month with an average maximum temperature of 33.6 °C. By contrast, winters are mild with July average maximum and minimum temperatures being 16.5 °C and 4.8 °C, respectively (BoM, 2008).
With a significant number of sources that affect ambient air quality in Kalgoorlie there has been a long history of complaints about dust from the open pit and tailings disposal areas which were identified by the National Pollutant Inventory (NPI) as major contributors to particulate matter within the air shed. The Kalgoorlie NPI trial (DEP, 1999) results provide a broad picture of the emissions of NPI substances within Kalgoorlie. These emissions were estimated for major industrial sources, as well as minor sources, including motor vehicles, aircraft, locomotives, commercial premises and households. The Department of Environment and Conservation (DEC) has initiated a study on upgrading the air diffuse emission inventory for the Kalgoorlie-Boulder region. The results of this study will be available in late 2009.

Ambient monitoring of particulate matter in Kalgoorlie, 2006 - 2007 Technical Report
9
This report assesses the monitored PM10 concentrations in Kalgoorlie for the period 2006-2007. The main objectives of this study are:
• Investigate the concentration of PM10 and compare with the Australian standard;
• Determine any diurnal and seasonal patterns of PM10; • Identify the main emission sources; • Examine the need for future monitoring and broadening of the current
monitoring network in the Kalgoorlie-Boulder region; • Comparison with other monitoring sites in Western Australia.
1.1 Nature and health impacts of particulate matter Many anthropogenic and natural sources emit particulate matter directly or emit other pollutants which react in the atmosphere to form particulate matter. Generally, any activity which involves burning of materials or any dust generating activities are sources of particulate matter. The relative contribution of each source type varies from day to day, depending on meteorological conditions and quantities of emission from mobile and stationary sources. The range of adverse health effects associated with particulate matter pollution is broad and includes various respiratory, cardiopulmonary, and cardiovascular diseases such as asthma, bronchitis, emphysema and mortality from a variety of causes (US EPA, 1996 a, b). Some people are more sensitive than others – for example, the elderly and those suffering from pre-existing heart or lung disease. The young are also sensitive, with evidence of increased frequency of respiratory tract infections, coughing and wheezing following exposure to airborne particles. Recent research has also linked exposure to relatively low concentrations of particulate matter with premature death (WHO, 2003).
1.2 Major PM10 emission sources in the region The PM10 emissions from industrial facilities in the Kalgoorlie-Boulder region are presented in Table 1.
Ambient monitoring of particulate matter in Kalgoorlie, 2006 - 2007 Technical Report
10
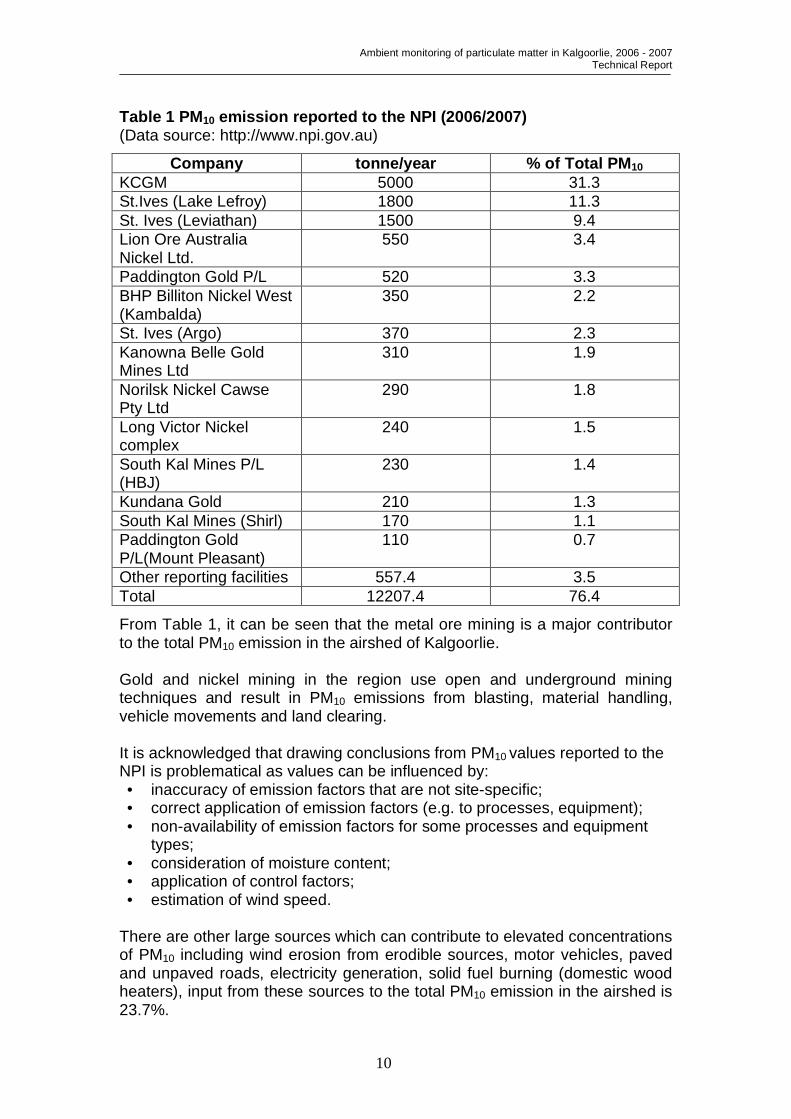
Table 1 PM10 emission reported to the NPI (2006/2007) (Data source: http://www.npi.gov.au)
Company tonne/year % of Total PM10 KCGM 5000 31.3 St.Ives (Lake Lefroy) 1800 11.3 St. Ives (Leviathan) 1500 9.4 Lion Ore Australia Nickel Ltd.
550 3.4
Paddington Gold P/L 520 3.3 BHP Billiton Nickel West (Kambalda)
350 2.2
St. Ives (Argo) 370 2.3 Kanowna Belle Gold Mines Ltd
310 1.9
Norilsk Nickel Cawse Pty Ltd
290 1.8
Long Victor Nickel complex
240 1.5
South Kal Mines P/L (HBJ)
230 1.4
Kundana Gold 210 1.3 South Kal Mines (Shirl) 170 1.1 Paddington Gold P/L(Mount Pleasant)
110 0.7
Other reporting facilities 557.4 3.5 Total 12207.4 76.4
From Table 1, it can be seen that the metal ore mining is a major contributor to the total PM10 emission in the airshed of Kalgoorlie. Gold and nickel mining in the region use open and underground mining techniques and result in PM10 emissions from blasting, material handling, vehicle movements and land clearing. It is acknowledged that drawing conclusions from PM10 values reported to the NPI is problematical as values can be influenced by: • inaccuracy of emission factors that are not site-specific; • correct application of emission factors (e.g. to processes, equipment); • non-availability of emission factors for some processes and equipment
types; • consideration of moisture content; • application of control factors; • estimation of wind speed.
There are other large sources which can contribute to elevated concentrations of PM10 including wind erosion from erodible sources, motor vehicles, paved and unpaved roads, electricity generation, solid fuel burning (domestic wood heaters), input from these sources to the total PM10 emission in the airshed is 23.7%.
Ambient monitoring of particulate matter in Kalgoorlie, 2006 - 2007 Technical Report
11
2.0 SAMPLING LOCATIONS AND MONITORING METHOD
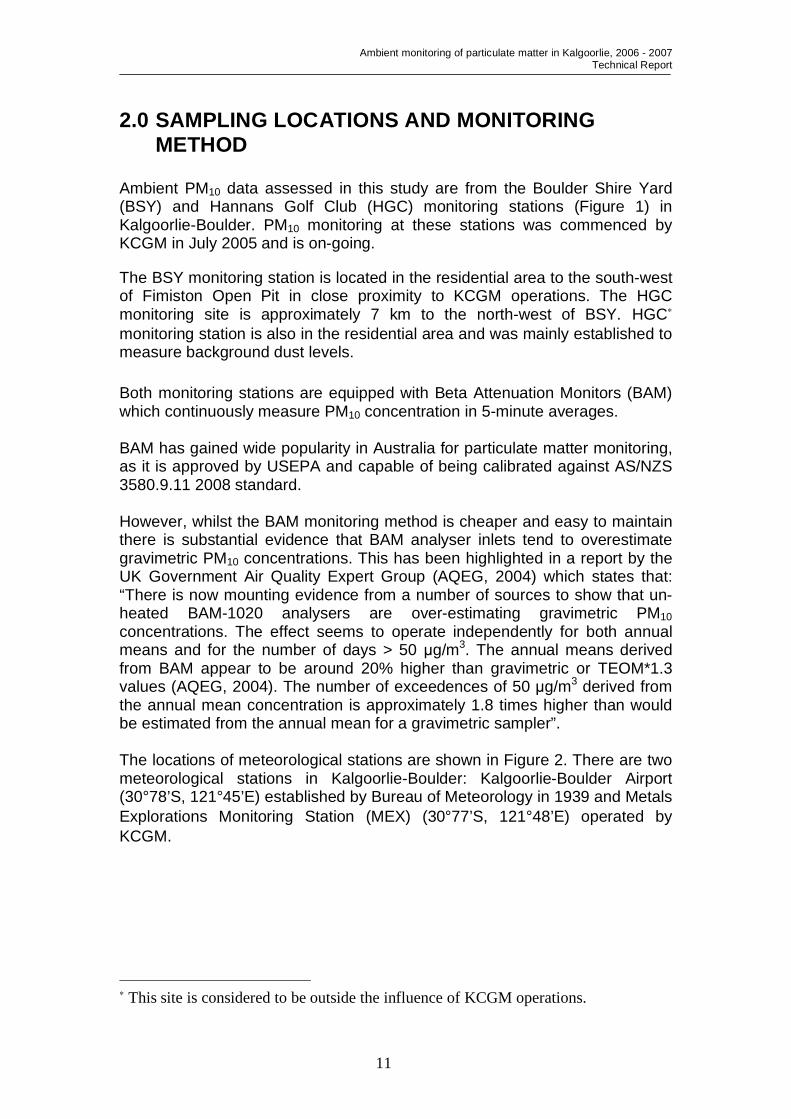
Ambient PM10 data assessed in this study are from the Boulder Shire Yard (BSY) and Hannans Golf Club (HGC) monitoring stations (Figure 1) in Kalgoorlie-Boulder. PM10 monitoring at these stations was commenced by KCGM in July 2005 and is on-going.
The BSY monitoring station is located in the residential area to the south-west of Fimiston Open Pit in close proximity to KCGM operations. The HGC monitoring site is approximately 7 km to the north-west of BSY. HGC∗ monitoring station is also in the residential area and was mainly established to measure background dust levels. Both monitoring stations are equipped with Beta Attenuation Monitors (BAM) which continuously measure PM10 concentration in 5-minute averages. BAM has gained wide popularity in Australia for particulate matter monitoring, as it is approved by USEPA and capable of being calibrated against AS/NZS 3580.9.11 2008 standard. However, whilst the BAM monitoring method is cheaper and easy to maintain there is substantial evidence that BAM analyser inlets tend to overestimate gravimetric PM10 concentrations. This has been highlighted in a report by the UK Government Air Quality Expert Group (AQEG, 2004) which states that: “There is now mounting evidence from a number of sources to show that un-heated BAM-1020 analysers are over-estimating gravimetric PM10 concentrations. The effect seems to operate independently for both annual means and for the number of days > 50 µg/m3. The annual means derived from BAM appear to be around 20% higher than gravimetric or TEOM*1.3 values (AQEG, 2004). The number of exceedences of 50 µg/m3 derived from the annual mean concentration is approximately 1.8 times higher than would be estimated from the annual mean for a gravimetric sampler”. The locations of meteorological stations are shown in Figure 2. There are two meteorological stations in Kalgoorlie-Boulder: Kalgoorlie-Boulder Airport (30°78’S, 121°45’E) established by Bureau of Meteorology in 1939 and Metals Explorations Monitoring Station (MEX) (30°77’S, 121°48’E) operated by KCGM.
∗ This site is considered to be outside the influence of KCGM operations.

Ambient monitoring of particulate matter in Kalgoorlie, 2006 - 2007 Technical Report
12
Figure 1 Kalgoorlie region showing the metropolitan area, PM10 and meteorological monitoring sites and major industry particulates sources

Ambient monitoring of particulate matter in Kalgoorlie, 2006 - 2007 Technical Report
13
3.0 RESULTS AND DISCUSSION The ambient data for PM10 from HGC and BSY monitoring sites in Kalgoorlie-Boulder have been analysed for the period 1 January 2006 to 31 December 2007. Data capture for each year ranged from 95 to 100 % and is considered sufficient to enable comparison against the Air NEPM standard. The high data availability also allows for calculation of seasonal effects on the behaviour of airborne particles (NEPC, 2001 b). For 2006-2007, the following statistics were calculated on the 24-hour data:
• Annual average; • Maximum concentration of PM10 during the year; • Second highest concentration; • Sixth highest concentration; • 99th, 98th, 95th and 90th percentiles; • Median.
To perform the data analysis in this report the raw data from the monitoring sites was converted from 5-minute averages into 1-hour averages. Each hourly average concentration was calculated by averaging all available measurements taken within the hour. Daily (i.e. 24-hour average) values refer to concentrations calculated from midnight to midnight. The 1-hour and 24-hour means were not calculated unless a minimum of 75% of the observations were available for the period studied (NEPC, 2001a).
Days for the period 1 January 2006 to 31 December 2007 when the Air NEPM Standard of 50 µg/m3 was exceeded were analysed to ascertain which direction particles came from on these days. Plots and back trajectories for these days are included in Appendices 1-14.
3.1 Meteorological conditions (1 January 2006 - 31 December 2007) Meteorological parameters measured at the Kalgoorlie-Boulder Airport by the Bureau of Meteorology have been analysed and seasonal minimum, average and maximum values derived. Table 2 contains a summary of the meteorological parameters that describe main features of the weather in Kalgoorlie-Boulder for the study period (2006-2007). Table 2 shows that predominant wind directions in summer, autumn and spring range from north-east to south-east during 2006-2007. Winter months are characterized by lower frequency of south-eastern winds and increasing of wind from north-west. The most common wind speed in Kalgoorlie for the observed period is <5m/s (light). The relative humidity is at its lowest (37-47%) during summer and spring. Severe deficiencies in rainfall (i.e. rainfalls in the lowest 5% of historical totals)

Ambient monitoring of particulate matter in Kalgoorlie, 2006 - 2007 Technical Report
14
were registered for the Kalgoorlie for the period from 1 June 2006 to 30 November 2007 (BoM, 2008). These deficiencies could possibly lead to the increased occurrence of dust storms in the region. The seasonal average wind speed estimated for both studied years is very similar. However, air temperature was slightly higher (i.e. 4%) in summer and autumn and lower (i.e. 6%) in winter and spring of 2007 in comparison with 2006 values. Average relative humidity was found to be lower (i.e.12%) in 2007 for all seasons with the exception of winter.
Table 2 Summary of meteorological parameters recorded by Bureau of Meteorology at Kalgoorlie-Boulder Airport derived from hourly observations (2006-2007) Measured Values
Season Meteorological parameters
Min 2006/2007
Max 2006/2007
Mean±Std error 2006/2007
Wind Speed (m/s) 0/0 15.0/12.8 3.0±0.04/3.4±0.04 Air Temperature (Co) -0.2/0.8 31.5/28.8 12.6±0.12/11.6±0.10 Relative Humidity (%) 5/7 100/100 53±0.46/57±0.49 Rainfall (mm) 0/0 7.4/20.2 0.1±0.02/0.3±0.03
Winter
Total mean rainfall (mm) 2.3/19.5
Predominant Wind Direction (degrees) 2006
W-NW(270-315˚) N-NE(360-45˚) SE-S(135-180˚)
Predominant Wind Direction (degrees) 2007
NW-N(315-360˚) W-NW(270-315˚)
Wind Speed (m/s)
0/0 14.4/12.2 4.3±0.05/4.2±0.04
Air Temperature (Co)
5.1/4.2 40.3/41.2 20.7±0.15/19.9±0.15
Relative Humidity (%)
6/3 96/96 41±0.43/37±0.43
Rainfall (mm) 0/0 6.2/6.0 0.2±0.02/0.1±0.01
Spring
Total mean rainfall (mm)
10.1/4.2
Predominant Wind Direction (degrees) 2006
E-SE(90-135˚),SE-S(135-180˚),SW-W(225-270˚)
Predominant Wind Direction (degrees) 2007
E-SE(90-135˚),SE-S(135-180˚),SW-W(225-270˚)
Wind Speed (m/s)
0/0 11.4/11.7 4.7±0.04/4.5±0.04 Summer
Air Temperature (Co)
10.9/9.6 44.1/44.3 24.4±0.13/25.3± 0.15
Relative Humidity (%)
4/4 100/100 47±0.49/40±0.43
Rainfall (mm) 0/0 27.2/41.2 0.6±0.06/0.7±0.08
Total mean rainfall (mm)
27.1/32.1
Predominant Wind Direction SE-S(135-180˚),NE-N(45-90˚)

Ambient monitoring of particulate matter in Kalgoorlie, 2006 - 2007 Technical Report
15
(degrees) 2006 Predominant Wind Direction (degrees) 2007
E-SE(90-135˚),SE-S(135-180˚)
Wind Speed (m/s)
0/0 13.9/10.8 3.2±0.04/3.4±0.04
Air Temperature (Co)
2.6/1.7 37.7/41.1 18.0±0.13/18.8±0.14
Relative Humidity (%)
8/5 98/99 53±0.43/49±0.44
Rainfall (mm) 0/0 61.8/22.2 0.3±0.07/0.2±0.04
Autumn
Total mean rainfall (mm)
23.9/9.7
Predominant Wind Direction (degrees) 2006
E-SE(90-135˚),SE-S(135-180˚)
Predominant Wind Direction (degrees) 2007
E-SE(90-135˚),SE-S(135-180˚)
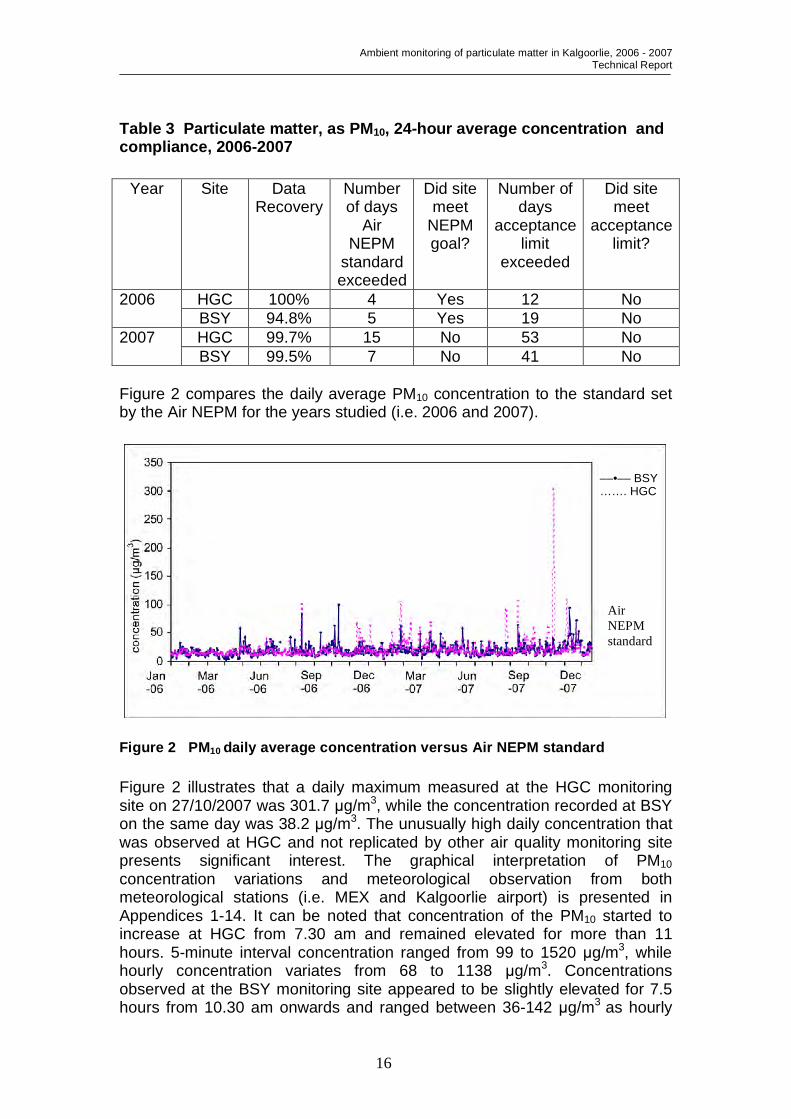
3.2 Comparison with Air NEPM standard All the valid ambient PM10 data for the period of 2006-2007 were compared to the standard established in the Air NEPM (i.e. 50 µg/m3 as 24-hour average) and the screening acceptance limit+. The results are discussed below. Table 3 shows the comparison of the daily average PM10 concentrations with the requirements of the Air NEPM standard and its acceptance limit. The daily average PM10 concentration exceeded the Air NEPM standard of 50 µg/m³ on four occasions at HGC monitoring site and five exceedences were registered at BSY in 2006. In 2007 at BSY the Air NEPM standard was breached seven times, while fifteen occurrences of concentration above the Air NEPM standard were noted at HGC. The results presented in Table 3 demonstrate that Kalgoorlie’s monitoring stations, HGC and BSY met the Air NEPM goal (i.e. allowed 5 exceedences per year) in 2006. However in 2007 the number of days with a concentration of particulate matter higher than 50 µg/m³ was above the goal. Neither site met the acceptance limit set by the Peer Review Committee of the National Environmental Protection Council (NEPC, 2001a) for the years studied.
+ It is noted that BSY and HGC monitoring sites do not necessarily comply with screening criteria (i.e. acceptance limit equal 32.5 µg/m3 that is 65% of Air NEPM standard) outlined by Peer Review Committee (PRC, 2001a). Therefore comparison with acceptance limit is for indicative purpose only.
Ambient monitoring of particulate matter in Kalgoorlie, 2006 - 2007 Technical Report
16
Table 3 Particulate matter, as PM10, 24-hour average concentration and compliance, 2006-2007
Year Site Data Recovery
Number of days
Air NEPM
standard exceeded
Did site meet
NEPM goal?
Number of days
acceptance limit
exceeded
Did site meet
acceptance limit?
HGC 100% 4 Yes 12 No 2006 BSY 94.8% 5 Yes 19 No HGC 99.7% 15 No 53 No 2007 BSY 99.5% 7 No 41 No
Figure 2 compares the daily average PM10 concentration to the standard set by the Air NEPM for the years studied (i.e. 2006 and 2007).
Figure 2 PM10 daily average concentration versus Air NEPM standard Figure 2 illustrates that a daily maximum measured at the HGC monitoring site on 27/10/2007 was 301.7 µg/m3, while the concentration recorded at BSY on the same day was 38.2 µg/m3. The unusually high daily concentration that was observed at HGC and not replicated by other air quality monitoring site presents significant interest. The graphical interpretation of PM10 concentration variations and meteorological observation from both meteorological stations (i.e. MEX and Kalgoorlie airport) is presented in Appendices 1-14. It can be noted that concentration of the PM10 started to increase at HGC from 7.30 am and remained elevated for more than 11 hours. 5-minute interval concentration ranged from 99 to 1520 µg/m3, while hourly concentration variates from 68 to 1138 µg/m3. Concentrations observed at the BSY monitoring site appeared to be slightly elevated for 7.5 hours from 10.30 am onwards and ranged between 36-142 µg/m3 as hourly
Air NEPM standard
––•–– BSY ……. HGC

Ambient monitoring of particulate matter in Kalgoorlie, 2006 - 2007 Technical Report
17
and 30-163 µg/m3 as 5-minute interval concentration. The unusually high concentration was due to earthworks present in the vicinity of HGC monitoring site. As there is no Air NEPM standard for annual concentration of PM10, the annual average concentration was compared to the WHO standard of 20 µg/m³ (WHO, 2005). As can be seen from Table 4, the annual average concentration of PM10 in 2006 was lower than the WHO standard for both stations. In 2007 the annual average concentration exceeded the WHO standard by 17% at HGC and by 9% at BSY monitoring site. Table 4 Annual average concentration of PM10 during 2006-2007, (µg/m3)
Year Monitoring site Annual average ± Std.Error
HGC 16.9±0.19 2006 BSY 17.8±0.27 HGC 23.4±0.44 2007 BSY 21.8±0.25
3.3 PM10 concentration at Kalgoorlie’s monitoring stations during period from January 2006 to December 2007 The following section provides an analysis of PM10 concentration at HGC and BSY monitoring sites in Kalgoorlie from January 2006 to December 2007. Table 5 provides a statistical summary of PM10 concentration at the Kalgoorlie monitoring sites. Descriptive statistics presented in Table 5 show that the maximum concentration of PM10 at the HGC monitoring site is consistently higher than at BSY, while the second and 6th highest values vary from year to year. In 2007 median dust concentration is slightly higher at both monitoring sites in comparison with 2006. The second and the sixth highest concentrations are higher at different stations from year to year. So in 2006, listed values are higher at BSY, and demonstrate an opposite pattern in 2007. Such a difference underlines the possibility of local factors (i.e. residential development activities, etc) influencing PM10 at HGC while at the same time BSY values indicate a close dependence from industrial emissions (i.e. Super Pit, light industry, etc) especially for the days when wind is favourable.
Table 5 Summary of PM10 concentration in Kalgoorlie 2006-2007, (µg/m³) Year Site Max 2nd
highest 6th
highest 90th
percentile Median Minimum
HGC 102.1 66.6 39.7 23.0 15.5 7.0 2006 BSY 99.6 82.5 43.7 26.5 16.1 3.4 HGC 301.7 108.0 67.8 37.0 19.1 6.0 2007 BSY 93.2 71.5 53.2 33.7 19.5 4.7

Ambient monitoring of particulate matter in Kalgoorlie, 2006 - 2007 Technical Report
18
The annual daily peak concentration (maximum, 99th percentile, 98th, 95th and 90th) varies for Kalgoorlie stations over the same period and is shown in Figures 3 and 4.
Figure 3 Annual daily peak of PM10, 2006
Figure 4 Annual daily peak of PM10, 2007
Although annual daily peaks have a similar trend and a high correlation (97-99%) BSY peak values are slightly higher than HGC for 2006, but in 2007 this difference changed and HGC’s values were substantially higher than BSY’s. Correlation of the 24-hour average PM10 concentration is relatively lower (46%), underlying the high possibility of local features influencing the concentration of particulate matter concentration at both stations.

Ambient monitoring of particulate matter in Kalgoorlie, 2006 - 2007 Technical Report
19
3.3.1 Seasonal variations The dataset for 2006-2007 had a high percentage data recovery (i.e. 95-100%). This enabled analysis of possible seasonal effects on pollutant behaviour and was divided into summer (i.e. January, February, December) and winter (i.e. June, July, August) sections to determine variation. Table 6 illustrates PM10 concentration during summer and winter 2006 and 2007. It can be seen from Table 6 that for both stations maximum PM10 concentration is higher during the winter season in 2006 (i.e. 102.1 µg/m3 for HGC and 82.5 µg/m3 for BSY). Average daily concentration of PM10 was also higher in winter than in summer with slight variability at the HGC monitoring station (i.e. winter-17.9 µg/m3, summer-16.6 µg/m3) and with a greater difference between values at BSY (i.e. winter-21.2 µg/m3, summer-16.6 µg/m3). Table 6 Summer/winter particulate matter concentration as PM10 in Kalgoorlie, µg/m3
2006 2007 Monitoring site
Summer Winter Summer Winter
Max 32.1 82.5 71.5 63.8 Min 6.6 8.7 4.7 7.3
BSY
Mean±Std. error
16.6±0.56 21.2±1.21 22.4±1.14 17.7±0.91
Median 16.2 18.7 19.3 16.2 Max 62.6 102.1 103.7 106.3 Min 7.0 9.2 5.9 8.4
HGC
Mean±Std. error
16.6±0.72 17.9±1.12 24.4±1.55 18.5±1.46
Median 15.8 15.5 20.0 14.9 The summer and winter average concentration for 2007 exhibits an opposite pattern in comparison with concentration measured in 2006. As depicted in Table 6, PM10 concentration monitored at Kalgoorlie’s stations during 2007 was higher in summer and lower in winter. Average concentration of particulate matter at BSY is 22.4 µg/m3 in summer and 17.7 µg/m3 in winter. Concentration measures at HGC shows a similar behaviour with the highest value for summer (i.e. 24.4 µg/m3) and the lowest (i.e. 18.5 µg/m3) for winter. The PM10 data from BSY and HGC monitoring sites for 2006-2007 have been subdivided further by seasons and day (7am-6pm) and night time (7pm-6am). This analysis allows testing of the hypothesis that pollutant behaviour is different at opposite times of the day in the different seasons. The descriptive statistics for particulate matter concentration during day and night time for the period from 1 January 2006 to 31 of December 2007 are shown in the Table 7 and 8.
Ambient monitoring of particulate matter in Kalgoorlie, 2006 - 2007 Technical Report
20
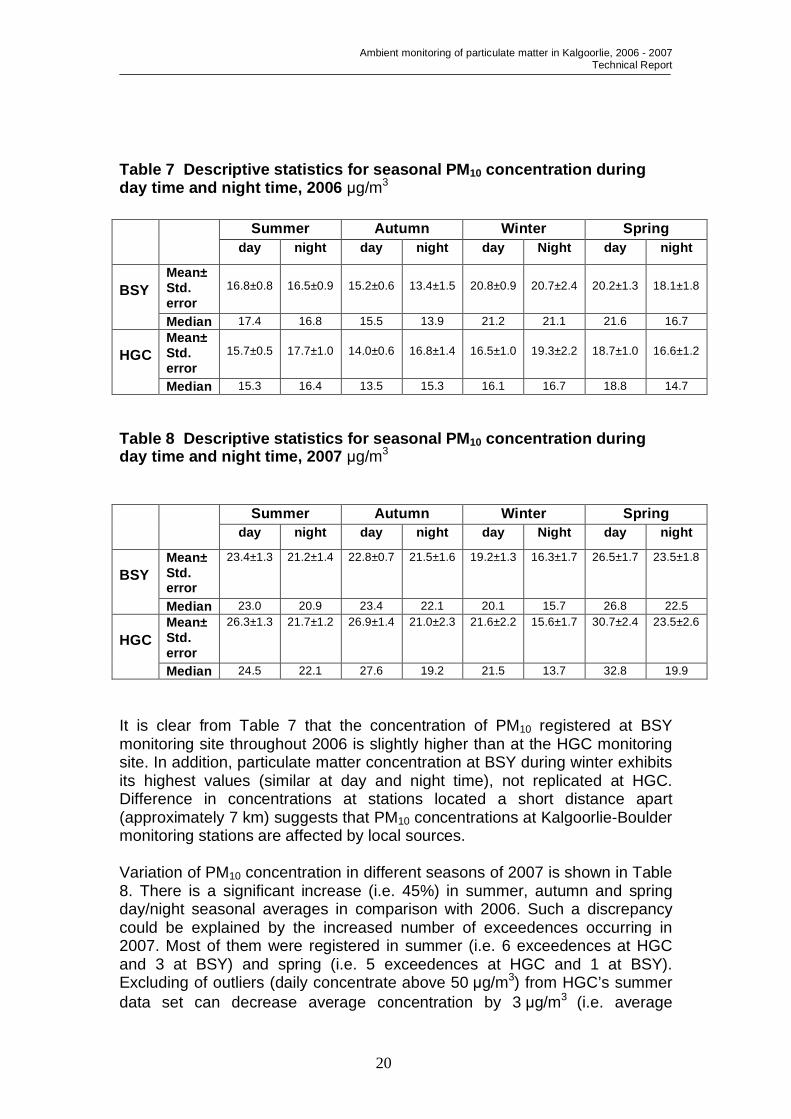
Table 7 Descriptive statistics for seasonal PM10 concentration during day time and night time, 2006 µg/m3
Summer Autumn Winter Spring day night day night day Night day night
Mean± Std. error
16.8±0.8
16.5±0.9
15.2±0.6
13.4±1.5
20.8±0.9
20.7±2.4
20.2±1.3
18.1±1.8
BSY
Median 17.4 16.8 15.5 13.9 21.2 21.1 21.6 16.7 Mean± Std. error
15.7±0.5
17.7±1.0
14.0±0.6
16.8±1.4
16.5±1.0
19.3±2.2
18.7±1.0
16.6±1.2
HGC
Median 15.3 16.4 13.5 15.3 16.1 16.7 18.8 14.7
Table 8 Descriptive statistics for seasonal PM10 concentration during day time and night time, 2007 µg/m3
Summer Autumn Winter Spring
day night day night day Night day night
Mean± Std. error
23.4±1.3 21.2±1.4 22.8±0.7 21.5±1.6 19.2±1.3 16.3±1.7 26.5±1.7 23.5±1.8 BSY
Median 23.0 20.9 23.4 22.1 20.1 15.7 26.8 22.5 Mean± Std. error
26.3±1.3 21.7±1.2 26.9±1.4 21.0±2.3 21.6±2.2 15.6±1.7 30.7±2.4 23.5±2.6 HGC
Median 24.5 22.1 27.6 19.2 21.5 13.7 32.8 19.9 It is clear from Table 7 that the concentration of PM10 registered at BSY monitoring site throughout 2006 is slightly higher than at the HGC monitoring site. In addition, particulate matter concentration at BSY during winter exhibits its highest values (similar at day and night time), not replicated at HGC. Difference in concentrations at stations located a short distance apart (approximately 7 km) suggests that PM10 concentrations at Kalgoorlie-Boulder monitoring stations are affected by local sources. Variation of PM10 concentration in different seasons of 2007 is shown in Table 8. There is a significant increase (i.e. 45%) in summer, autumn and spring day/night seasonal averages in comparison with 2006. Such a discrepancy could be explained by the increased number of exceedences occurring in 2007. Most of them were registered in summer (i.e. 6 exceedences at HGC and 3 at BSY) and spring (i.e. 5 exceedences at HGC and 1 at BSY). Excluding of outliers (daily concentrate above 50 µg/m3) from HGC’s summer data set can decrease average concentration by 3 µg/m3 (i.e. average
Ambient monitoring of particulate matter in Kalgoorlie, 2006 - 2007 Technical Report
21
concentration in summer 2007 at HGC is 24.4 µg/m3) and decreasing concentration registered for spring by 6 µg/m3 (i.e. concentration for spring 2007 at HGC is 27.0 µg/m3). Seasonal wind roses (Figure 5 and 6) compiled for Kalgoorlie-Boulder show that in winter wind speed varies in the range of 0-9 m/s with 1.6-2.3% of calm conditions (wind speed <0.5 m/s) recorded under prevailing wind direction from west-north-west. In contrast wind roses compiled for the summer season illustrate that prevailing wind direction is from north-east to south-east and similar range of wind speed with just 0.3 % of calm recorded. Furthermore, the occurrence of wind gusts is more frequent in summer than in winter as illustrated in Appendices 16 and 17. This indicates that the likely cause of the elevated PM10 concentration in summer is the emissions from industrial sources located along prevailing wind direction (i.e. north-east-south-east) as well as the dust storms that are more frequent in summer. PM10 concentration during winter is more likely affected not just by industrial emissions but also by emissions from wood heaters, as indicated by wind roses and frequency distribution of wind directions presented in Appendices 16 and 17.

Ambient monitoring of particulate matter in Kalgoorlie, 2006 - 2007 Technical Report
22
Figure 5 Seasonal wind roses for MEX monitoring site in 2006
Winter – 100% Data Recovery
Autumn – 100% Data Recovery Summer – 99.9% Data Recovery
Spring – 100% Data Recovery

Ambient monitoring of particulate matter in Kalgoorlie, 2006 - 2007 Technical Report
23
Figure 6 Seasonal wind roses for MEX monitoring site in 2007
Winter – 100% Data Recovery
Autumn – 100% Data Recovery Summer – 99.9% Data Recovery
Spring – 100% Data Recovery

Ambient monitoring of particulate matter in Kalgoorlie, 2006 - 2007 Technical Report
24
3.3.2 Monthly variations of particulate matter concentration
The daily average PM10 data from the selected BAM sites are summarized on a monthly basis in Figures 7 to 10. Two different patterns are readily identified: a summer minimum and winter maximum for 2006; and a late spring /early summer maximum and winter minimum for 2007. In particular the maximum concentration at BSY monitoring site in 2006 was recorded in October (i.e. 99.6 µg/m3) with the second highest equal to 82.5 µg/m3 in August, as shown by Figure 7. It can be seen from Figure 8 that HGC monitoring site for the same year recorded a maximum particulate matter concentration in August (i.e. 102.1 µg/m3) and the following highest concentration of 66.6 µg/m3 in November. The number of exceedences at BSY and HGC monitoring sites during 2006 did not breach the Air NEPM goal.
Figure 7 Monthly particulate matter concentration at BSY, 2006
Figure 8 Monthly particulate matter concentration at HGC, 2006

Ambient monitoring of particulate matter in Kalgoorlie, 2006 - 2007 Technical Report
25
In 2007 seven occurrences of concentration above the Air NEPM standard were recorded at BSY monitoring site in Kalgoorlie, two of them monitored in December, one in November (the highest, 93.2 µg/m3) with one occurrence registered in February, March, May and August. The monthly variation of particulate matter concentration is presented in Figure 9.
Figure 9 Monthly particulate matter concentration at BSY, 2007. Figure 10 shows monthly variability in particulate matter concentration at HGC monitoring site in Kalgoorlie during 2007.
Figure 10 Monthly particulate matter concentration at HGC, 2007. A total of fifteen days when concentration was above 50 µg/m3 were registered at HGC monitoring site during 2007. There is no definite pattern of high events occurring that could be identified, as exceedences were scattered throughout the year: four in February; one in January and September; two in March, August, October and November.

Ambient monitoring of particulate matter in Kalgoorlie, 2006 - 2007 Technical Report
26
As can be seen from Figure 10, daily concentration at the HGC monitoring site in October 2007 reached 301.7 µg/m3. It must be noted that uncharacterised high levels of concentration (hourly concentration ranged from 68 µg/m3 to 1138 µg/m3) remained for 13 hours with concentration between 2pm and 3pm above 1000 µg/m3 (Appendix 14). Concentration at BSY monitoring site on the same day was 38.2 µg/m3 (hourly concentration remained slightly elevated for 7 hours, ranges from 54.3 to 142.5 µg/m3).
To determine the monthly variability of wind that is considered to be a main factor in particulate matter distribution, monthly wind speed and wind direction frequency distributions were estimated based on data from the MEX meteorological station. The station is located approximately 1.8 km north of BSY (Appendix 16 and 17). Appendices 16-17 include frequency distribution of monthly wind directions for 2006-2007. It can be seen that a predominant north-east-south-eastern wind (67.5-135˚) occurred in summer months and transitional periods between seasons (March, November) by 65% on average. The lowest frequency of south-eastern wind directions is estimated for August (16%). Winter months are indicated by the lower frequency of south-eastern winds and increasing frequency of wind from north-west (202-315˚) that reached its maximum in August (54-58%). Calm wind conditions are less frequent (1-14%) with maximum (i.e. 13.6-15.5%) in May. Moderate wind speed 1-5 m/s dominate with a frequency of 80% and over. High wind speed >5m/s presented by a 10-20% frequency in August-January and occur less frequently in May-July (0.3-5%). Highest wind gusts occurred more often in November-January due to summer thunderstorms which are known to be a cause of dust storms contributing to elevated particulate levels.
3.3.3 Diurnal variations
Hourly BAM data was used to examine diurnal variability in PM10 concentrations. Figures 11 to 14 show the average diurnal pattern for both stations monitoring PM10 concentration in summer and winter during 2006-2007.
Standard error that has the property of increasing as the variability of the data increases, and decreasing as the sample size increases, plotted together with hourly particulate concentrations show how closely concentration is congregated around the (imaginary) regression line. Generally there was a close correlation and lower standard error found between concentrations monitored from 9 am to 3 pm during summer for both stations. In winter particulate concentration is relatively lower (9.5-11.5 µg/m3) in the early morning hours and reached its peak (26-34 µg/m3) at 7-9 pm.

Ambient monitoring of particulate matter in Kalgoorlie, 2006 - 2007 Technical Report
27
Figure 11 Summer diurnal variation in particulate matter concentration, 2006
Figure 12 Winter diurnal variation in particulate matter concentration, 2006
Figure 13 Summer diurnal variation in particulate matter concentration, 2007

Ambient monitoring of particulate matter in Kalgoorlie, 2006 - 2007 Technical Report
28
Figure 14 Winter diurnal variation in particulate matter concentration, 2007 Less variable PM10 concentration during summer is likely to be due to higher wind speed and emissions mainly distributed under north-east-south-east directions while more varying concentration during winter may be influenced by emission from west-north-west and north-east-south-east directions dispersed slowly under higher frequency of lower wind speed.
3.4 Back trajectories Daily average PM10 concentration exceeded the Air NEPM standard (which is 50 µg/m³) on 12 occasions at BSY and 19 times at HGC during the period from January 2006 to December 2007 (Table 3). A total of five exceedences were recorded in 2006 at BSY and four at HGC. In 2007 seven were recorded at BSY and fifteen at HGC. To investigate the relationship between PM10 and wind characteristics, which are considered to be one of the most important explanatory variables, wind trajectories were back-plotted for those days when PM10 exceeded the relevant 24-hour standard (Results are shown in Appendices 1-14). Wind direction indicates the trajectory or path of air pollutants from the source to the receptor. Wind speed determines the distance from the source to the receptor and the time the ambient pollutants will take to reach the receptor. The back-trajectories enable identification of where the pollution was sourced from on the given day. Each occurrence of high particulate matter concentration was tested by using all available information (wind speed, wind direction, wind backward trajectories). The results are presented in Appendices 1-14. An investigation of PM10 exceedences (>50 µg/m3) showed that the predominant cause of particulates elevated level is due to the windblown
Ambient monitoring of particulate matter in Kalgoorlie, 2006 - 2007 Technical Report
29
dusts curried by strong winds, but dust generated from mining activities can also occur (18/10/2006, 24/11/2007). It must be noted that wind trajectories were only plotted for the days when concentration exceeded Air NEPM standard at the BSY monitoring station. Moreover wind profiles using data from MEX meteorological station were plotted for the days when particulate matter concentration exceeded relevant Air NEPM standard at the HGC site to get a better understanding of exceedences; advice from the Bureau of Meteorology and observation data from Kalgoorlie airport BoM site were used for the high concentration occurrences interpretation (Appendix 14).
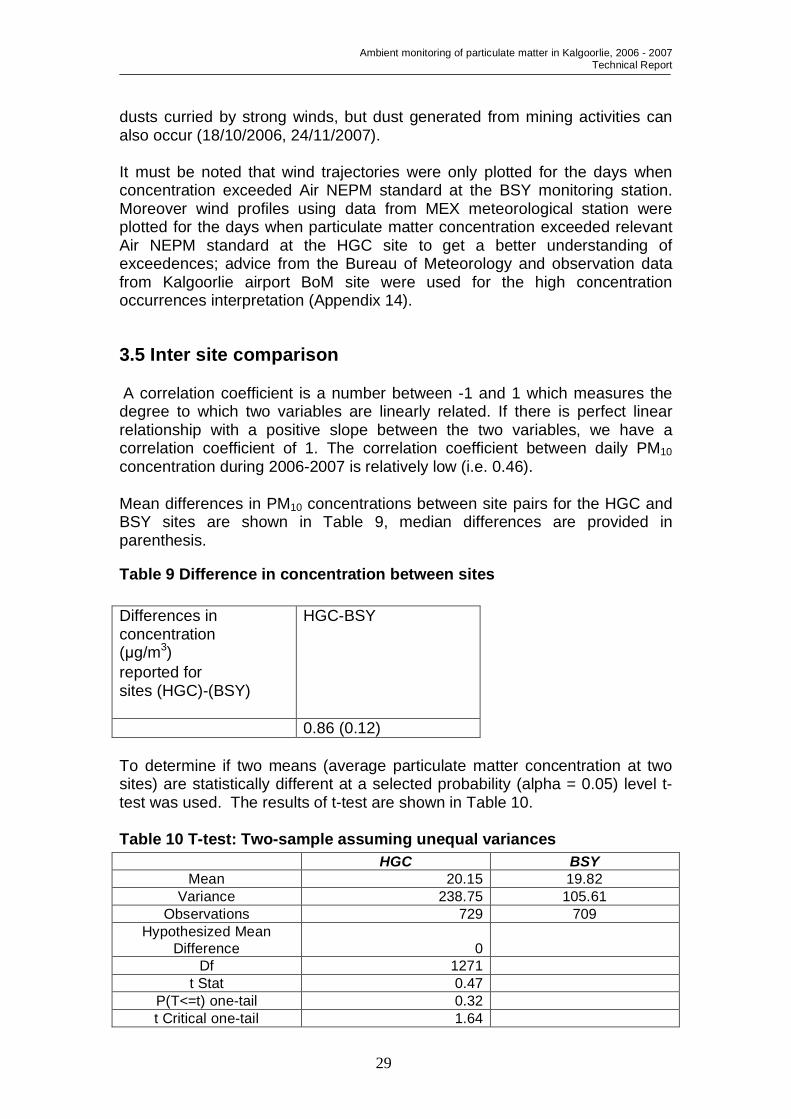
3.5 Inter site comparison
A correlation coefficient is a number between -1 and 1 which measures the degree to which two variables are linearly related. If there is perfect linear relationship with a positive slope between the two variables, we have a correlation coefficient of 1. The correlation coefficient between daily PM10 concentration during 2006-2007 is relatively low (i.e. 0.46).
Mean differences in PM10 concentrations between site pairs for the HGC and BSY sites are shown in Table 9, median differences are provided in parenthesis.
Table 9 Difference in concentration between sites Differences in concentration (µg/m3) reported for sites (HGC)-(BSY)
HGC-BSY
0.86 (0.12)
To determine if two means (average particulate matter concentration at two sites) are statistically different at a selected probability (alpha = 0.05) level t-test was used. The results of t-test are shown in Table 10.
Table 10 T-test: Two-sample assuming unequal variances HGC BSY
Mean 20.15 19.82 Variance 238.75 105.61
Observations 729 709 Hypothesized Mean
Difference 0 Df 1271
t Stat 0.47 P(T<=t) one-tail 0.32 t Critical one-tail 1.64
Ambient monitoring of particulate matter in Kalgoorlie, 2006 - 2007 Technical Report
30
P(T<=t) two-tail 0.64 t Critical two-tail 1.96
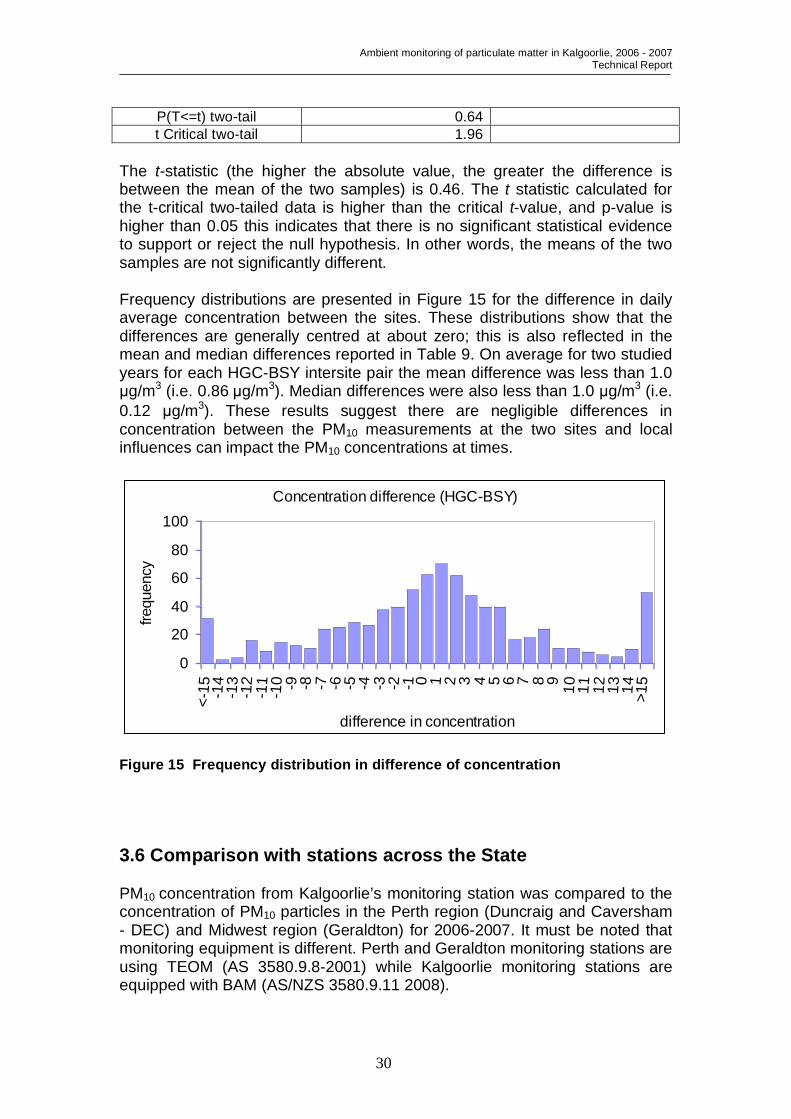
The t-statistic (the higher the absolute value, the greater the difference is between the mean of the two samples) is 0.46. The t statistic calculated for the t-critical two-tailed data is higher than the critical t-value, and p-value is higher than 0.05 this indicates that there is no significant statistical evidence to support or reject the null hypothesis. In other words, the means of the two samples are not significantly different. Frequency distributions are presented in Figure 15 for the difference in daily average concentration between the sites. These distributions show that the differences are generally centred at about zero; this is also reflected in the mean and median differences reported in Table 9. On average for two studied years for each HGC-BSY intersite pair the mean difference was less than 1.0 µg/m3 (i.e. 0.86 µg/m3). Median differences were also less than 1.0 µg/m3 (i.e. 0.12 µg/m3). These results suggest there are negligible differences in concentration between the PM10 measurements at the two sites and local influences can impact the PM10 concentrations at times.
Concentration difference (HGC-BSY)
0
20
40
60
80
100
<-15 -14
-13
-12
-11
-10 -9 -8 -7 -6 -5 -4 -3 -2 -1 0 1 2 3 4 5 6 7 8 9 10 11 12 13 14 >15
difference in concentration
frequ
ency
Figure 15 Frequency distribution in difference of concentration
3.6 Comparison with stations across the State
PM10 concentration from Kalgoorlie’s monitoring station was compared to the concentration of PM10 particles in the Perth region (Duncraig and Caversham - DEC) and Midwest region (Geraldton) for 2006-2007. It must be noted that monitoring equipment is different. Perth and Geraldton monitoring stations are using TEOM (AS 3580.9.8-2001) while Kalgoorlie monitoring stations are equipped with BAM (AS/NZS 3580.9.11 2008).
Ambient monitoring of particulate matter in Kalgoorlie, 2006 - 2007 Technical Report
31
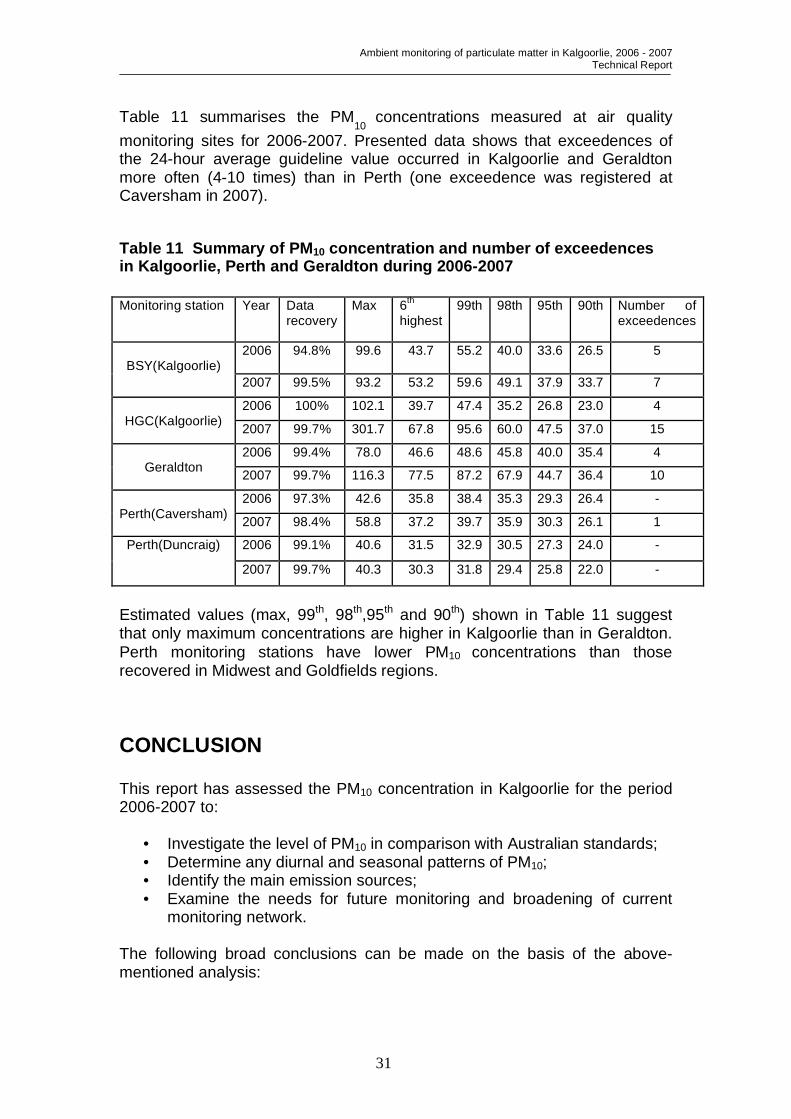
Table 11 summarises the PM10
concentrations measured at air quality monitoring sites for 2006-2007. Presented data shows that exceedences of the 24-hour average guideline value occurred in Kalgoorlie and Geraldton more often (4-10 times) than in Perth (one exceedence was registered at Caversham in 2007).
Table 11 Summary of PM10 concentration and number of exceedences in Kalgoorlie, Perth and Geraldton during 2006-2007 Monitoring station Year Data
recovery Max 6th
highest 99th 98th 95th 90th Number of
exceedences
2006 94.8%
99.6 43.7 55.2 40.0 33.6 26.5 5 BSY(Kalgoorlie)
2007 99.5% 93.2 53.2 59.6 49.1 37.9 33.7 7
2006 100% 102.1 39.7 47.4 35.2 26.8 23.0 4 HGC(Kalgoorlie) 2007 99.7% 301.7 67.8 95.6 60.0 47.5 37.0 15
2006 99.4% 78.0 46.6 48.6 45.8 40.0 35.4 4 Geraldton 2007 99.7% 116.3 77.5 87.2 67.9 44.7 36.4 10
2006 97.3% 42.6 35.8 38.4 35.3 29.3 26.4 - Perth(Caversham) 2007 98.4% 58.8 37.2 39.7 35.9 30.3 26.1 1
2006 99.1% 40.6 31.5 32.9 30.5 27.3 24.0 - Perth(Duncraig)
2007 99.7% 40.3 30.3 31.8 29.4 25.8 22.0 -
Estimated values (max, 99th, 98th,95th and 90th) shown in Table 11 suggest that only maximum concentrations are higher in Kalgoorlie than in Geraldton. Perth monitoring stations have lower PM10 concentrations than those recovered in Midwest and Goldfields regions.
CONCLUSION This report has assessed the PM10 concentration in Kalgoorlie for the period 2006-2007 to:
• Investigate the level of PM10 in comparison with Australian standards; • Determine any diurnal and seasonal patterns of PM10; • Identify the main emission sources; • Examine the needs for future monitoring and broadening of current
monitoring network. The following broad conclusions can be made on the basis of the above-mentioned analysis:

Ambient monitoring of particulate matter in Kalgoorlie, 2006 - 2007 Technical Report
32
• The annual average PM10 concentration at both KGCM stations was lower than the World Health Organization standard by 13.3% in 2006, however in 2007 average PM10 concentration was above the standard by 13%.
• The BSY monitoring site (located closer to the major industrial emission sources) met the Air NEPM goal in 2006 as there were only five days when daily PM10 concentration exceeded the Air NEPM standard. The number of allowed exceedences at HGC was also below the Air NEPM goal.
• During 2007 neither monitoring sites in Kalgoorlie met the Air NEPM goal
of no more than five days of PM10 concentration above 50 µg/m3. There were 7 days at BSY and 15 at HGC, respectively when PM10 concentration exceeded the Air NEPM standard.
• The majority (60%) of exceedences recorded in Kalgoorlie (from both
monitoring sites) are associated with windblown dusts during 2006-2007. • During 2006-2007 on average, minimum PM10 (9.5-11.5 µg/m3)
concentration was observed during early morning hours (5-7 am) and reached its highest values (26-34 µg/m3) between 3 and 7 pm in summer and between 7 and 11 pm in winter.
• PM10 concentration in Kalgoorlie when compared to the concentration
monitored at other stations across the state showed that:
• Maximum concentration values observed for Kalgoorlie are higher than accordant PM10 concentration observed for Perth and Geraldton. • Geraldton PM10 data exhibits a higher daily peak concentration than
Kalgoorlie and Perth for the same period.
Based on the analysis of PM10 data from two monitoring sites in Kalgoorlie-Boulder region it is suggested that monitoring be continued at these sites. On-going PM10 monitoring will ensure that particulate matter concentration which could be of concern to human health in the region of interest is under control, in light of the rapid expansion of the industry.
There is also need to develop a strategy for on-going management of particle emissions in the Kalgoorlie-Boulder region.

Ambient monitoring of particulate matter in Kalgoorlie, 2006 - 2007 Technical Report
33
Bibliography Air Quality Expert Group (AQEG), 2004, Particulate Matter in the United Kingdom, Department for the Environment, Food and Rural Affairs, London. <http://www.defra.gov.uk/environment/airquality/aqeg> DEC 2001, National Environment Protection Measure for Ambient Air Quality. Monitoring Plan for Western Australia, Perth, Western Australia. DEC 2007, Western Australia Air Monitoring Report 2006, Technical Report AQM (Un-published report), Perth, Western Australia. DEC 2008, Western Australia Air Monitoring Report 2007, Technical Report AQM (Un-published report), Perth, Western Australia. Environ 2007, Ambient Particulate Metals for Kalgoorlie Consolidated Gold Mines, Environ Australia Pty Ltd. <superpit.com.au/uploaded/publications/KCGM Ambient Particulate Metals> Environmental Protection Authority (EPA) 2007, Bulletin 1273: Fimiston Gold Mine Operations Extension (Stage 3) and Mine Closure Planning, Kalgoorlie Consolidated Gold Mines Pty Ltd, EPA, Perth, Western Australia, December 2007. http://www.epa.wa.gov.au/docs/2612_Bul1273_KCKM_FimistonPER.pdf Kalgoorlie Consolidate Gold Mines (KCGM) 2007, Environmental Review Fimiston Operations Extension (Stage3) and Mine Closure Planning. Response to Public Submission. <www.epa.wa.gov.au/docs/KCGMFinalResponse_PER_Subs_071123.pdf> NEPC 2007, Review of the National Environment Protection (ambient Air Quality) Measure. Discussion Paper prepared for the National Environment Protection Council. NEPC 2003, National Environment Protection (Ambient Air Quality) Measure. Office of Legislative Drafting, Attorney-General’s Department, Canberra. NEPC 2001a, National Environmental Protection Council (ambient Air Quality) Measure Technical Paper No. 4 Screening Procedures. <www.ephc.gov.au/nepms/air/pdf/TP4_Screening_Procedures_Revised 2001.pdf > NEPC 2001b, National Environment Protection (Ambient Air Quality) Measure Technical Paper No. 5 Data Collection and Handling. <www.ephc.gov.au/nepms/air/pdf/TP5_Data_Collection.pdf >

Ambient monitoring of particulate matter in Kalgoorlie, 2006 - 2007 Technical Report
34
Thermo Electron Corporation Environmental Instruments (TECEI) 2004, Series FH62C14 Continuous ambient particulate monitor. USEPA automated equivalent PM10 method: EQPM-1102-150 CARB approved CAS for PM10 and PM2.5. Instruction manual P/N 100230-00. <www.thermo.com/eid> US EPA 1996a, AP-42 Compilation of Air Pollutant Emission Factors Vol 1 Stationary Point and Area Sources, United States Environmental Protection Agency. US EPA 1996b, Air Quality Criteria for Particulate Matter, Office of Research and Development, Environmental Protection Agency, EPA 600/P-99/002a, b and c. Western Australian Department of Environmental Protection, 1999, National Pollutant Inventory NPI Trial. World Health Organization (WHO) 2005, Air Quality guidelines for particulate matter, ozone, nitrogen dioxide and sulphur dioxide. World Health Organization (WHO) 2003, Health aspects of Air pollution with particulate matter, ozone and nitrogen dioxide, Report on a WHO Working Group, Bonn, Germany 2003. WEBSITES
http://www.bom.gov.au/weather/wa/kalgoorlie/climate.shtml
www.npi.gov.au
www.epa.wa.gov.au
www.ephc.gov.au/nepms/air/air_nepm.html
http://portal.environment.wa.gov.au/
www.euro.who.int/document/e79097.pdf
http://www1.superpit.com.au/

Ambient monitoring of particulate matter in Kalgoorlie, 2006 - 2007 Technical Report
35
Appendix 1 - PM10 exceedences on 1 May 2006 in Kalgoorlie
Hourly measurements of particiulate matter (1/05/2006)
0
200
400
600
800
1 3 5 7 9 11 13 15 17 19 21 23
local standard time
conc
µg/
m3
Hourly measurements of wind speed and
direction (1/05/2006)
0
0.5
1
1.5
2
1 3 5 7 9 11 13 15 17 19 21 23
local standard time
win
d sp
eed
(m/s
)
0
60
120
180
240
300
360
win
d di
rect
ion
(deg
rees
)
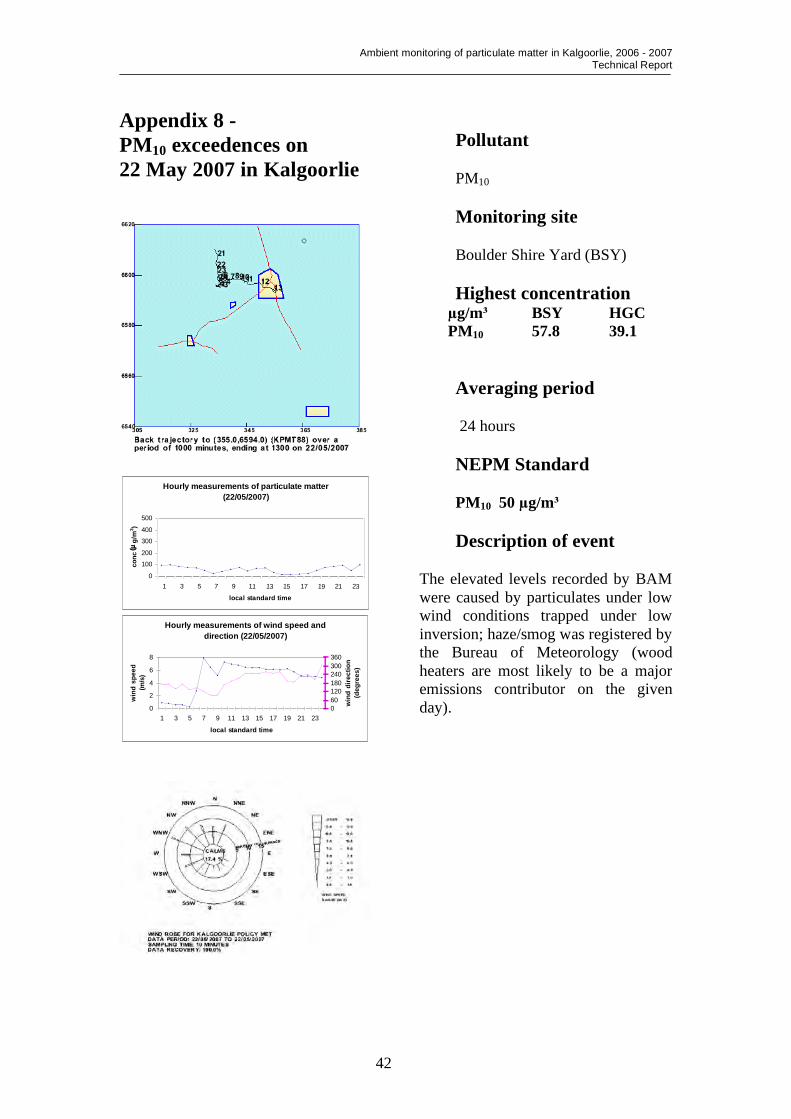
Pollutant PM10
Monitoring site Boulder Shire Yard (BSY) Highest concentration µg/m³ BSY HGC PM10 59.0 24.1 Averaging period 24 hours NEPM Standard PM10 50 µg/m³ Description of event Light southerly wind evolved dust from source located in the nearest vicinity to the monitoring device as indicated by wind rose and back-trajectory.
Ambient monitoring of particulate matter in Kalgoorlie, 2006 - 2007 Technical Report
36
Appendix 2 - PM10 exceedences on 15 August 2006 in Kalgoorlie
Hourly measurements of particulate matter (15/08/2006)
0
200
400
600
800
1 3 5 7 9 11 13 15 17 19 21 23
local standard time
conc
(µg/
m3 )
HGCBSY
Hourly measurements of wind speed and direction (15/08/2006)
0
2
4
6
8
10
12
1 3 5 7 9 11 13 15 17 19 21 23
local standard time
win
d sp
eed
(m/s
)
0
60
120
180
240
300
360
win
d di
rect
ion
(deg
rees
)
Pollutant PM10
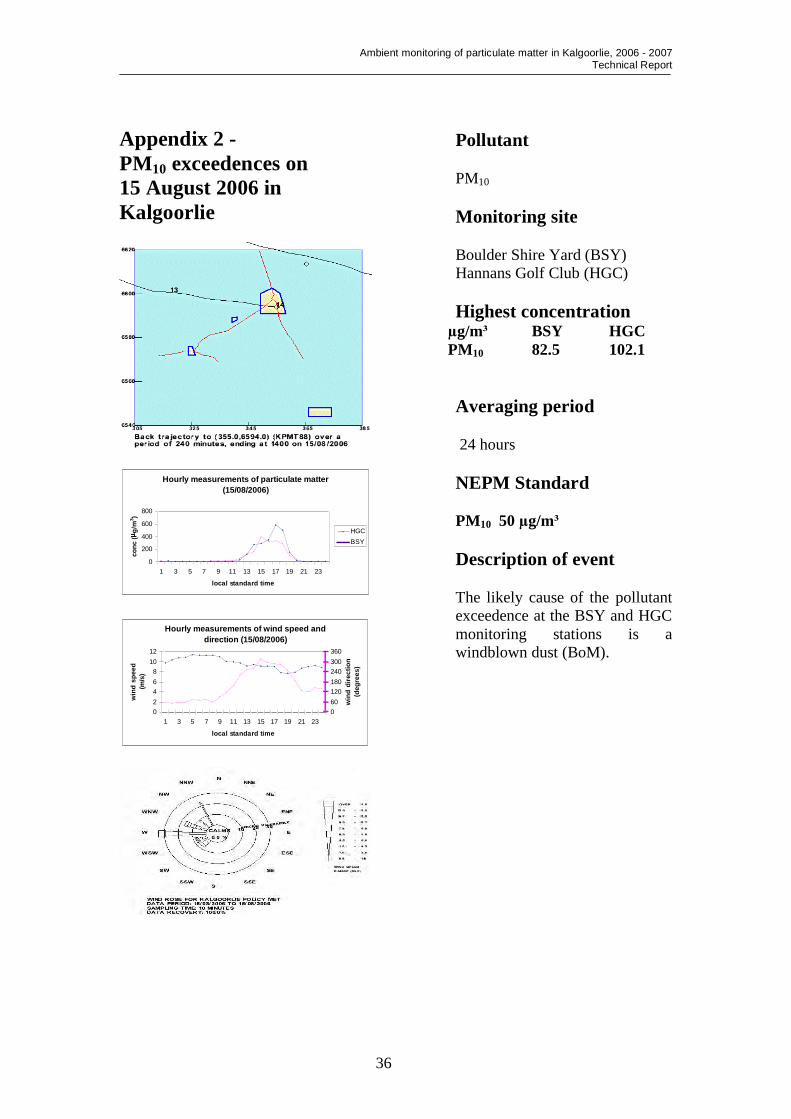
Monitoring site Boulder Shire Yard (BSY) Hannans Golf Club (HGC) Highest concentration µg/m³ BSY HGC PM10 82.5 102.1 Averaging period 24 hours NEPM Standard PM10 50 µg/m³ Description of event The likely cause of the pollutant exceedence at the BSY and HGC monitoring stations is a windblown dust (BoM).
Ambient monitoring of particulate matter in Kalgoorlie, 2006 - 2007 Technical Report
37
Appendix 3 - PM10 exceedences on 16 September 2006 in Kalgoorlie
Hourly measurements of particulate matter (16/09/2006)
0
100
200
300
400
500
1 3 5 7 9 11 13 15 17 19 21 23
local standard time
conc
(µg/
m3 )
Hourly measurements of wind speed and
direction (16/09/2006)
0
2
4
6
8
1 3 5 7 9 11 13 15 17 19 21 23
local standard time
win
d sp
eed
(m/s
)
0
60
120
180
240
300
360
win
d di
rect
ion
(deg
rees
)
Pollutant PM10
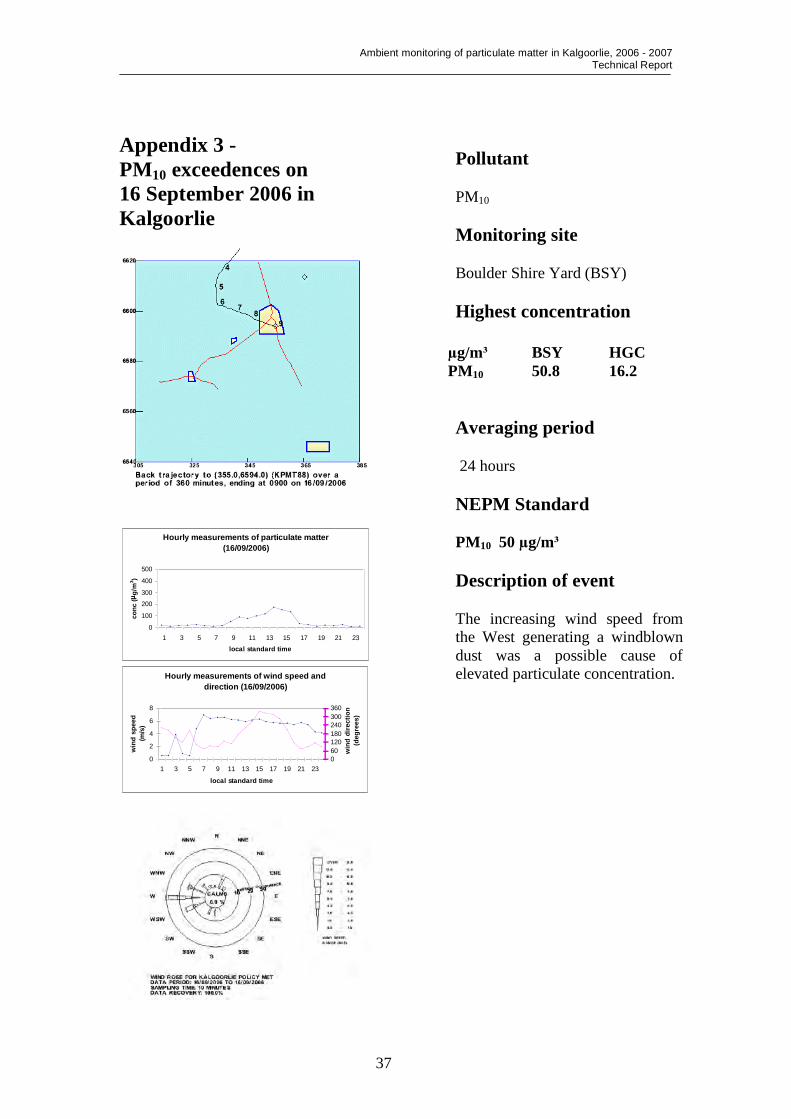
Monitoring site Boulder Shire Yard (BSY) Highest concentration µg/m³ BSY HGC PM10 50.8 16.2 Averaging period 24 hours NEPM Standard PM10 50 µg/m³ Description of event The increasing wind speed from the West generating a windblown dust was a possible cause of elevated particulate concentration.

Ambient monitoring of particulate matter in Kalgoorlie, 2006 - 2007 Technical Report
38
Appendix 4 - PM10 exceedences on 11 October 2006 in Kalgoorlie
Hourly measurements of particulate matter (11/10/2006)
0
100
200
300
400
500
1 3 5 7 9 11 13 15 17 19 21 23
local standard time
conc
(µg/
m3 )
Hourly measurements of wind speed and
direction (11/10/2006)
0
2
4
6
8
10
1 3 5 7 9 11 13 15 17 19 21 23
local standard time
win
d sp
eed
(m/s
)
0
60
120
180
240
300
360
win
d di
rect
ion
(deg
rees
)
Pollutant PM10
Monitoring site Boulder Shire Yard (BSY) Highest concentration µg/m³ BSY HGC PM10 63.5 35.0 Averaging period 24 hours NEPM Standard PM10 50 µg/m³ Description of event The increasing wind speed from the West that evolved a windblown dust was a possible cause of elevated particulate concentration.

Ambient monitoring of particulate matter in Kalgoorlie, 2006 - 2007 Technical Report
39
Appendix 5 - PM10 exceedences on 18 October 2006 in Kalgoorlie
Hourly measurements of particulate matter
(18/10/2006)
0
300
600
900
1200
1500
1 3 5 7 9 11 13 15 17 19 21 23
local standard time
conc
(µg/
m3 )
Hourly measurements of wind speed and direction (18/10/2006)
0
1
2
3
4
1 3 5 7 9 11 13 15 17 19 21 23
local standard time
win
d sp
eed
(m/s
)
0
60
120
180
240
300
360
win
d di
rect
ion
(deg
rees
)
Pollutant PM10
Monitoring site Boulder Shire Yard (BSY) Highest concentration µg/m³ BSY HGC PM10 99.6 15.1 Averaging period 24 hours NEPM Standard PM10 50 µg/m³ Description of event
The likely cause of the elevated particulates level at the monitoring station was an emission from Super Pit as indicated by back trajectory and wind rose.

Ambient monitoring of particulate matter in Kalgoorlie, 2006 - 2007 Technical Report
40
Appendix 6 - PM10 exceedences on 4 February 2007 in Kalgoorlie
Hourly measurements of particulate matter (04/02/2007)
0
200
400
600
800
1 3 5 7 9 11 13 15 17 19 21 23
local standard time
conc
µg/
m3
HGCBSY
Hourly measurements of wind speed and
direction (4/02/2007)
0
2
4
6
8
10
1 3 5 7 9 11 13 15 17 19 21 23
local standard time
win
d sp
eed
(m/s
)
0
60
120
180
240
300
360
win
d di
rect
ion
(deg
rees
)
Pollutant PM10
Monitoring site Boulder Shire Yard (BSY) Highest concentration µg/m³ BSY HGC PM10 62.4 103.7 Averaging period 24 hours NEPM Standard PM10 50 µg/m³ Description of event
The likely cause of the elevated particulate level at the monitoring stations in Kalgoorlie was dust blown over the monitoring device by increased gusty winds emitted from the source located at the SE .

Ambient monitoring of particulate matter in Kalgoorlie, 2006 - 2007 Technical Report
41
Appendix 7 - PM10 exceedences on 26 March 2007 in Kalgoorlie
Horly measurements of particulate matter (26/03/2007)
0
100
200
300
400
500
1 3 5 7 9 11 13 15 17 19 21 23
local standard time
conc
(µg/
m3 )
Houly measurements of wind speed and
direction (26/03/2007)
0
2
4
6
8
1 3 5 7 9 11 13 15 17 19 21 23
local standard time
win
d sp
eed
(m/s
)
0
60
120
180
240
300
360
win
d di
rect
ion
(deg
rees
)
Pollutant PM10
Monitoring site Boulder Shire Yard (BSY) Highest concentration µg/m³ BSY HGC PM10 51.3 37.4 Averaging period 24 hours NEPM Standard PM10 50 µg/m³ Description of event
The likely cause of elevated particulate matter concentration registered at the monitoring site was a gusty north-west wind blowing dust over the monitoring site.
Ambient monitoring of particulate matter in Kalgoorlie, 2006 - 2007 Technical Report
42
Appendix 8 - PM10 exceedences on 22 May 2007 in Kalgoorlie
Hourly measurements of particulate matter (22/05/2007)
0
100
200
300
400
500
1 3 5 7 9 11 13 15 17 19 21 23
local standard time
conc
(µg/
m3 )
Hourly measurements of wind speed and
direction (22/05/2007)
0
2
4
6
8
1 3 5 7 9 11 13 15 17 19 21 23
local standard time
win
d sp
eed
(m/s
)
0
60
120
180
240
300
360
win
d di
rect
ion
(deg
rees
)
Pollutant PM10
Monitoring site Boulder Shire Yard (BSY) Highest concentration µg/m³ BSY HGC PM10 57.8 39.1 Averaging period 24 hours NEPM Standard PM10 50 µg/m³ Description of event
The elevated levels recorded by BAM were caused by particulates under low wind conditions trapped under low inversion; haze/smog was registered by the Bureau of Meteorology (wood heaters are most likely to be a major emissions contributor on the given day).
Ambient monitoring of particulate matter in Kalgoorlie, 2006 - 2007 Technical Report
43
Appendix 9 - PM10 exceedences on 26 August 2007 in Kalgoorlie
Hourly measurements of particulate matter
(26/08/2007)
0100200300400500600
1 3 5 7 9 11 13 15 17 19 21 23
local standard time
conc
(µg
/m3 )
HGCBSY
Hourly measurements of wind speed and
direction (26/08/2007)
0
2
4
6
8
10
1 3 5 7 9 11 13 15 17 19 21 23
local standard time
win
d sp
eed
(m/s
)
0
60
120
180
240
300
360
win
d di
rect
ion
(deg
rees
)
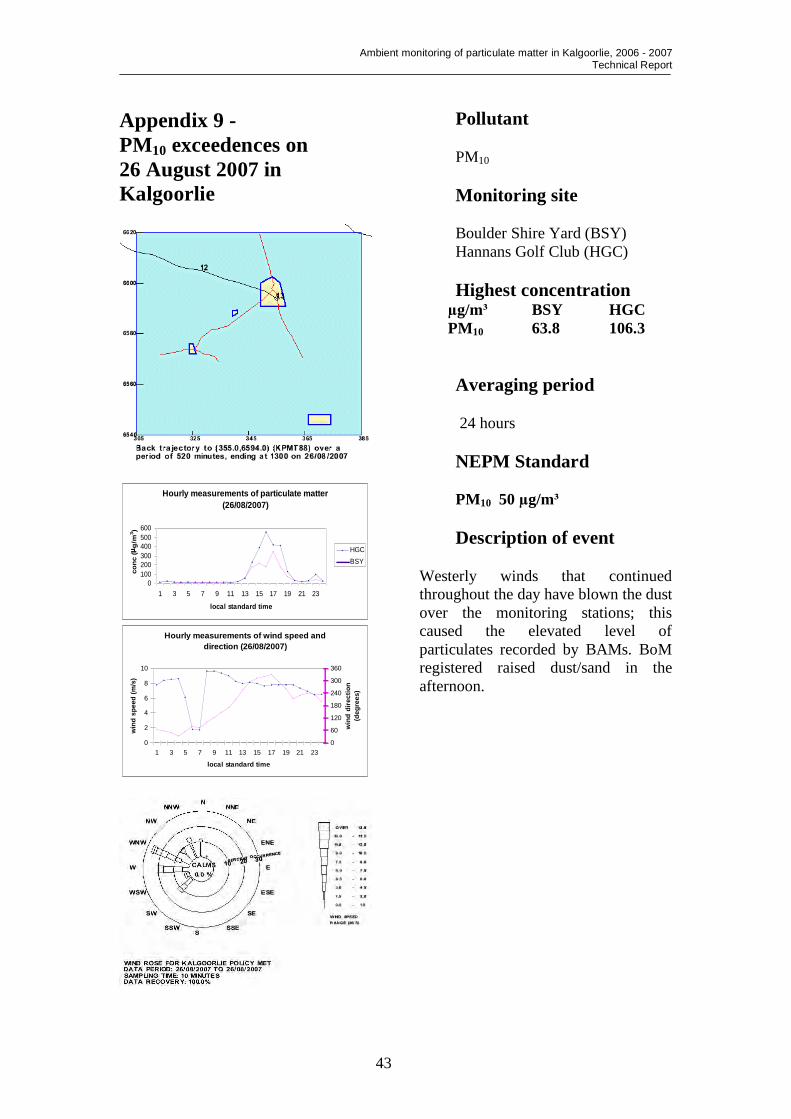
Pollutant PM10
Monitoring site Boulder Shire Yard (BSY) Hannans Golf Club (HGC) Highest concentration µg/m³ BSY HGC PM10 63.8 106.3 Averaging period 24 hours NEPM Standard PM10 50 µg/m³ Description of event
Westerly winds that continued throughout the day have blown the dust over the monitoring stations; this caused the elevated level of particulates recorded by BAMs. BoM registered raised dust/sand in the afternoon.

Ambient monitoring of particulate matter in Kalgoorlie, 2006 - 2007 Technical Report
44
Appendix 10- PM10 exceedences on 24 November 2007 in Kalgoorlie
Hourly measurement of particulate matter
(24/11/2007)
0200400600800
10001200
1 3 5 7 9 11 13 15 17 19 21 23
local standard time
conc
(µg/
m3 )
HGCBSY
Hourly measurements of wind speed and
direction (24/11/2007)
0
1
2
3
4
5
6
7
1 3 5 7 9 11 13 15 17 19 21 23
local standard time
win
d sp
eed
(m/s
)
0
60
120
180
240
300
360
win
d di
rect
ion
(deg
rees
)
Pollutant PM10
Monitoring site Boulder Shire Yard (BSY) Hannans Golf Club (HGC) Highest concentration µg/m³ BSY HGC PM10 93.2 51.7 Averaging period 24 hours NEPM Standard PM10 50 µg/m³ Description of event
The likely cause of elevated particulate levels at the monitoring station was an emission from Super Pit and Waste Dumps as indicated by back trajectory and wind rose.

Ambient monitoring of particulate matter in Kalgoorlie, 2006 - 2007 Technical Report
45
Appendix 11- PM10 exceedences on 5 December 2007 in Kalgoorlie
Hourly measurements of particulate matter (5/12/2007)
0100200300400500600
1 3 5 7 9 11 13 15 17 19 21 23
local standard time
conc
(µg/
m3 )
HGCBSY
Hourly measurements of wind speed and
direction (5/12/2007)
0
1
2
3
4
5
6
7
8
1 3 5 7 9 11 13 15 17 19 21 23
local standard time
win
d sp
eed
(m/s
)
0
60
120
180
240
300
360
win
d di
rect
ion
(deg
rees
)
Pollutant PM10
Monitoring site Boulder Shire Yard (BSY) Hannans Golf Club (HGC) Highest concentration µg/m³ BSY HGC PM10 71.5 55.6 Averaging period 24 hours NEPM Standard PM10 50 µg/m³ Description of event
Emission from residential development trapped under inversion registered by BoM (haze).

Ambient monitoring of particulate matter in Kalgoorlie, 2006 - 2007 Technical Report
46
Appendix 12- PM10 exceedences on 8 December 2007 in Kalgoorlie
Hourly measurements of particulate matter (8/12/2007)
0
100
200
300
400
500
1 3 5 7 9 11 13 15 17 19 21 23
local standard time
conc
(µg/
m3 )
Hourly measurements of wind speed and
direction (8/12/2007)
0
1
2
3
4
5
6
7
1 3 5 7 9 11 13 15 17 19 21 23
local standard time
win
d sp
eed
(m/s
)
0
60
120
180
240
300
360
win
d di
rect
ion
(deg
rees
)
Pollutant PM10
Monitoring site Boulder Shire Yard (BSY) Highest concentration µg/m³ BSY HGC PM10 53.2 29.9 Averaging period 24 hours NEPM Standard PM10 50 µg/m³ Description of event
The likely causes of elevated concentration of particulate matter in Kalgoorlie were dust devils recorded by BoM blowing dust over the monitoring site.

Ambient monitoring of particulate matter in Kalgoorlie, 2006 - 2007 Technical Report
47
Appendix 13 - PM10 exceedences on 26 July 2006 in Kalgoorlie
Hourly measurement of particulate matter (26/07/2006)
0
100
200
300
400
500
600
1 3 5 7 9 11 13 15 17 19 21 23
local standard time
conc
(µg/
m3 )
Hourly measurements of wind speed and direction (26/07/2006)
0
0.5
1
1.5
2
1 3 5 7 9 11 13 15 17 19 21 23
local standard time
win
d sp
eed
(m/s
)
0
60
120
180
240
300
360
win
d di
rect
ion
(deg
rees
)
Pollutant PM10
Monitoring site Boulder Shire Yard (BSY) Highest concentration µg/m³ BSY HGC PM10 56.6* 34.7 *(54.2% of daily data) Averaging period 24 hours NEPM Standard PM10 50 µg/m³ Description of event
The likely cause of the particulates elevated level at the monitoring station was an emission from wood heaters accumulated under lower wind conditions (low ambient temperatures have proved an assumption that heater usage was in its maximum throughout the day, average T=9.6, min=1.9, max=16.9, BoM data).

Ambient monitoring of particulate matter in Kalgoorlie, 2006 - 2007 Technical Report
48
Appendix 14 - PM10 exceedences at HGC monitoring site in Kalgoorlie HGC 20/11/2006 - 66.6 µg/m³ BSY 20/11/2006 - 18.1 µg/m³ (High concentration possible due to increased SSW wind)
Hourly measurements of particulate matter (20/11/2006) at HGC
0
100
200
300
1 3 5 7 9 11 13 15 17 19 21 23
local standard time
conc
(µg/
m3 )
Hourly measurements of wind speed and
direction (20/11/2006)
0
2
4
6
8
1 3 5 7 9 11 13 15 17 19 21 23
local standard time
win
d sp
eed
(m/s
)
060120180240300360
win
d di
rect
ion
(deg
rees
)
WS WD HGC 24/11/2006 - 56.7 µg/m³ BSY 24/11/2006 - 24.0 µg/m³ -(exceedence possibly due to gusty winds smoothed by light virga)
Horly measurement of particulate matter (24/11/2006) at HGC
0
100
200
1 3 5 7 9 11 13 15 17 19 21 23
local standard time
conc
(µg/
m3 )
Hourly measurements of wind speed and
direction (24/11/2006)
0
2
4
6
8
1 3 5 7 9 11 13 15 17 19 21 23
local standard time
win
d sp
eed
(m/s
)
060120180240300360
win
d di
rect
ion
(deg
rees
)
WS WD
HGC 13/12/2006 - 62.6 µg/m³ BSY 13/12/2006 - 20.9 µg/m³ - (some local dusts storm involved after passage of cold front)
Hourly measurements of particulate matter (13/12/2006) at HGC
0
200
400
1 3 5 7 9 11 13 15 17 19 21 23
local standard time
conc
(µg/
m3 )
Hourly observation of wind speed and direction
(13/12/2006)
0
2
4
6
8
1 3 5 7 9 11 13 15 17 19 21 23
win
d sp
eed
(m/s
)
060120180240300360
win
d di
rect
ion
(deg
rees
)
WS WD

Ambient monitoring of particulate matter in Kalgoorlie, 2006 - 2007 Technical Report
49
HGC 19/01/2007 – 50.2 µg/m³ BSY 19/01/2007 - 13.8 µg/m³ (Gusty wind)
Hourly measurements of particulate matter (19/01/2007) at HGC
0
100
200
1 3 5 7 9 11 13 15 17 19 21 23
local standard time
con
c (µ
g/m
3 )
Hourly measurements of wind speed and direction (19/01/2007)
02
46
8
1 3 5 7 9 11 13 15 17 19 21 23
local standard time
win
d sp
eed(
m/s
)
060120180240300360
win
d di
rect
ion
(deg
rees
)
WS WD HGC 3/02/2007- 57.2 µg/m³ BSY 3/02/2007 - 29.0 µg/m³ (no evidence – peak in concentration under NE wind direction)
Hourly measurements of particulate matter (3/02/2007) at HGC
0
100
200
1 3 5 7 9 11 13 15 17 19 21 23
local standard time
conc
(µg/
m3 )
Hourly measurements of wind speed and
direction (3/02/2007)
0123456
1 3 5 7 9 11 13 15 17 19 21 23
local standard time
win
d sp
eed
(m/s
)
060120180240300360
win
d di
rect
ion
(deg
rees
)
WS WD
HGC 20/02/2007 - 56.5 µg/m³ BSY 20/02/2007 - 25.2 µg/m³ (Raised dust in the afternoon -BoM)
Hourly measurements of particulate matter (20/02/2007) at HGC
0
100
200
1 3 5 7 9 11 13 15 17 19 21 23
local standard time
conc
(µg/
m3)
Hourly measurements of wind speed and direction (20/02/2007)
012345
1 3 5 7 9 11 13 15 17 19 21 23
local standard time
win
d sp
eed
(m/s
)050100150200250300
win
d di
rect
ion
(deg
rees
)
WS WD HGC 21/02/2007 - 65.4 µg/m³ BSY 21/02/2007 - 32.3 µg/m³ (Haze between 9am-12pm, afternoon thunderstorm)
Hourly measurements of particulate matter (21/02/2007) at HGC
0
100
200
300
400
500
1 3 5 7 9 11 13 15 17 19 21 23
local standard time
conc
(µg/
m3 )
Hourly measurements of wind speed and
direction (21/02/2007)
0123456
1 3 5 7 9 11 13 15 17 19 21 23
local standard time
win
d sp
eed
(m/s
)
0
100
200
300
400
win
d di
rect
ion
(deg
rees
)
WS WD

Ambient monitoring of particulate matter in Kalgoorlie, 2006 - 2007 Technical Report
50
HGC 9/03/2007 - 58.8 µg/m³ BSY 9/03/2007 - 48.4 µg/m³ (no evidence, likely cause an increased concentration-wind gusts)
Hourly measurements of particulate matter (9/03/2007) at HGC
0
200
400
1 3 5 7 9 11 13 15 17 19 21 23
local standard time
conc
(µg/
m3 )
Hourly measurements of wind speed and direction (9/03/2007)
02468
10
1 3 5 7 9 11 13 15 17 19 21 23
local standard time
win
d sp
eed
(m/s
)
060120180240300360
win
d di
rect
ion
(deg
rees
)
WS WD HGC 27/03/2007 - 67.8 µg/m³ BSY 27/03/2007 - 37.5 µg/m³ (no evidence)
Hourly measurements of particulate matter (27/03/2007) at HGC
0
200
400
600
1 3 5 7 9 11 13 15 17 19 21 23
local standard time
conc
(µg/
m3 )
Hourly measurements of wind speed and
direction (27/03/2007)
0
2
4
6
8
1 3 5 7 9 11 13 15 17 19 21 23
local standard time
win
d sp
eed
(m
/s)
060120180240300360
win
d di
rect
ion
(deg
rees
)
WS WD
HGC 6/08/2007 - 90.7 µg/m³ BSY 6/08/2007 - 31.6 µg/m³ (Raised dust/sand in afternoon due to gusts)
Hourly measurements of particulate matter (6/08/2007) at HGC
0
200
400
600
800
1 3 5 7 9 11 13 15 17 19 21 23
local standard time
conc
(µg/
m3 )
Hourly measurements of wind speed and directions (6/08/2007)
02468
1012
1 3 5 7 9 11 13 15 17 19 21 23
local standard time
win
d sp
eed
(m/s
)060120180240300360
win
d di
rect
ion
(deg
rees
)
WS WD HGC 23/09/2007 - 58.6 µg/m³ BSY 23/09/2007 -28.6 µg/m³ (dust devils -BoM)
Hourly measurements of particulate matter (23/09/2007) at HGC
0
200
400
600
1 3 5 7 9 11 13 15 17 19 21 23
local standard time
conc
(µg/
m3 )
Hourly measurements of wind speed and
direction (23/09/2007)
012345
1 3 5 7 9 11 13 15 17 19 21 23
local standard time
win
d sp
eed
(m/s
)
060120180240300360
win
d di
rect
ion
(deg
rees
)
WS WD
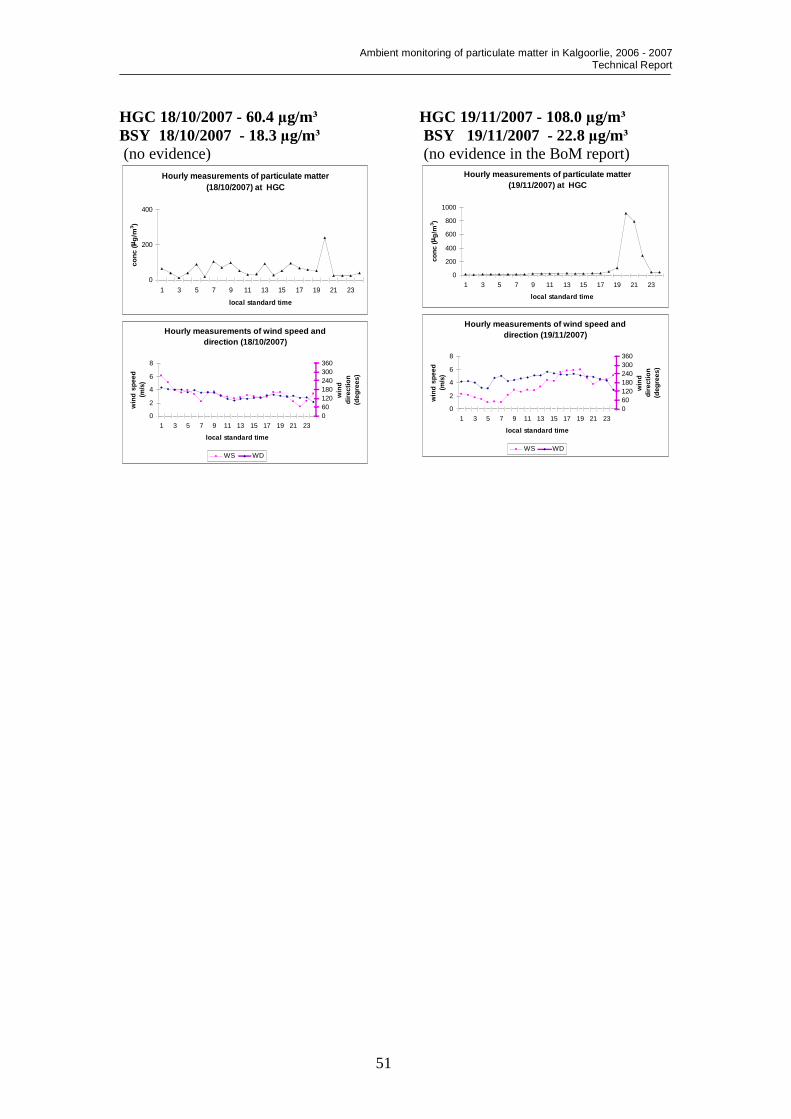
Ambient monitoring of particulate matter in Kalgoorlie, 2006 - 2007 Technical Report
51
HGC 18/10/2007 - 60.4 µg/m³ BSY 18/10/2007 - 18.3 µg/m³ (no evidence)
Hourly measurements of particulate matter (18/10/2007) at HGC
0
200
400
1 3 5 7 9 11 13 15 17 19 21 23
local standard time
conc
(µg/
m3 )
Hourly measurements of wind speed and
direction (18/10/2007)
0
2
4
6
8
1 3 5 7 9 11 13 15 17 19 21 23
local standard time
win
d sp
eed
(m/s
)
060120180240300360
win
d di
rect
ion
(deg
rees
)
WS WD
HGC 19/11/2007 - 108.0 µg/m³ BSY 19/11/2007 - 22.8 µg/m³ (no evidence in the BoM report)
Hourly measurements of particulate matter (19/11/2007) at HGC
0
200
400
600
800
1000
1 3 5 7 9 11 13 15 17 19 21 23
local standard time
conc
(µg/
m3 )
Hourly measurements of wind speed and
direction (19/11/2007)
0
2
4
6
8
1 3 5 7 9 11 13 15 17 19 21 23
local standard timew
ind
spee
d (m
/s)
060120180240300360
win
d di
rect
ion
(deg
rees
)
WS WD
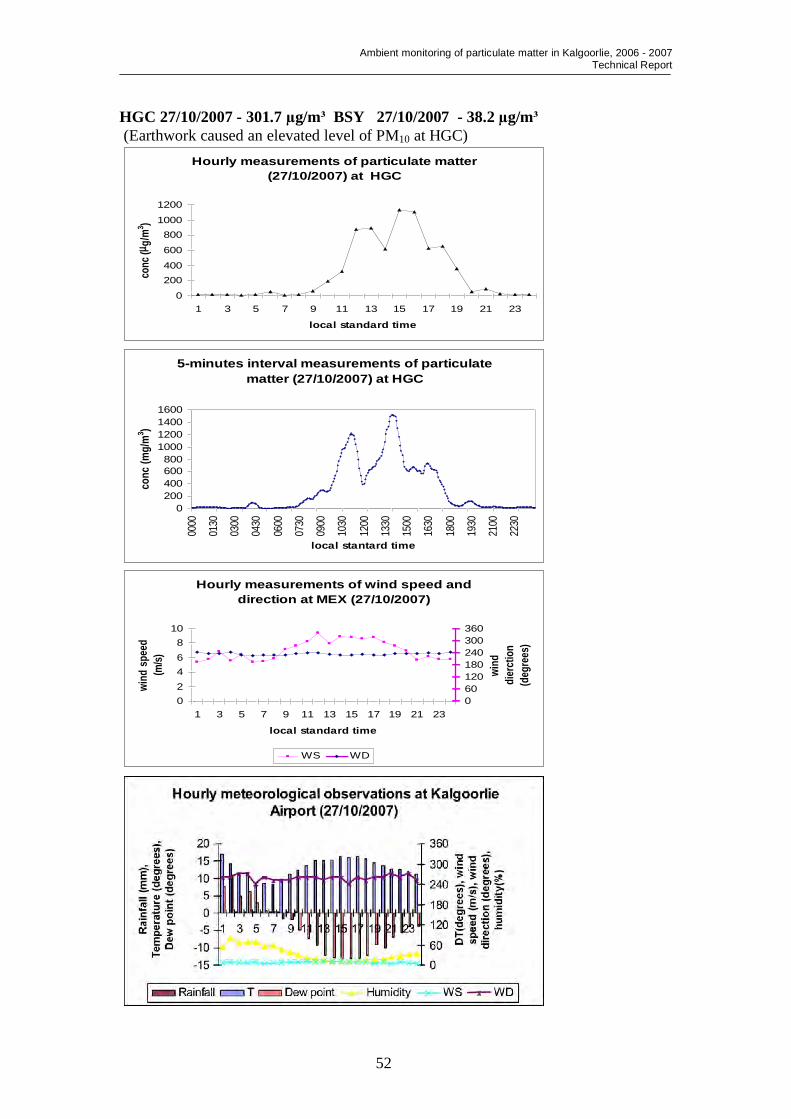
Ambient monitoring of particulate matter in Kalgoorlie, 2006 - 2007 Technical Report
52
HGC 27/10/2007 - 301.7 µg/m³ BSY 27/10/2007 - 38.2 µg/m³ (Earthwork caused an elevated level of PM10 at HGC)
Hourly measurements of particulate matter (27/10/2007) at HGC
0
200
400
600
800
1000
1200
1 3 5 7 9 11 13 15 17 19 21 23
local standard time
conc
(µg/
m3 )
5-minutes interval measurements of particulate
matter (27/10/2007) at HGC
0
200
400
600
800
1000
1200
1400
1600
0000
0130
0300
0430
0600
0730
0900
1030
1200
1330
1500
1630
1800
1930
2100
2230
local stantard time
conc
(mg/
m3 )
Hourly measurements of wind speed and
direction at MEX (27/10/2007)
02468
10
1 3 5 7 9 11 13 15 17 19 21 23
local standard time
wind
spe
ed
(m/s)
060120180240300360
wind
di
erct
ion
(deg
rees
)
WS WD
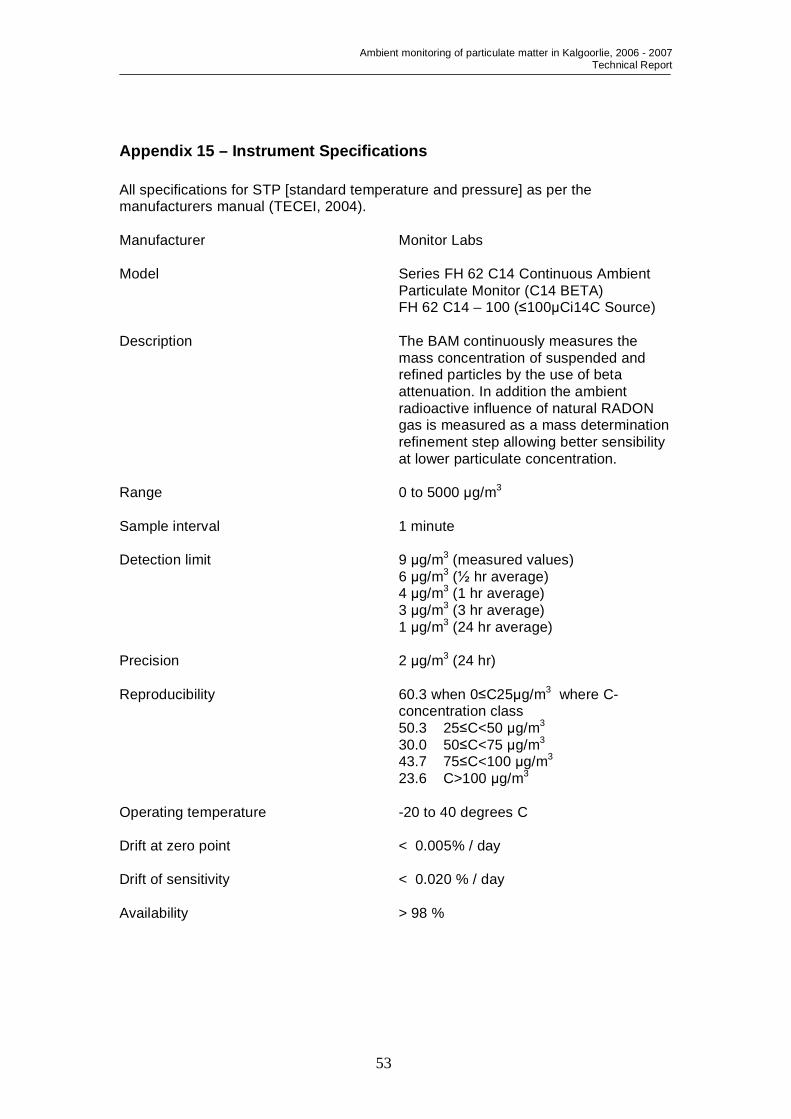
Ambient monitoring of particulate matter in Kalgoorlie, 2006 - 2007 Technical Report
53
Appendix 15 – Instrument Specifications All specifications for STP [standard temperature and pressure] as per the manufacturers manual (TECEI, 2004). Manufacturer Monitor Labs Model Series FH 62 C14 Continuous Ambient Particulate Monitor (C14 BETA) FH 62 C14 – 100 (≤100µCi14C Source) Description The BAM continuously measures the
mass concentration of suspended and refined particles by the use of beta attenuation. In addition the ambient radioactive influence of natural RADON gas is measured as a mass determination refinement step allowing better sensibility at lower particulate concentration.
Range 0 to 5000 µg/m3 Sample interval 1 minute Detection limit 9 µg/m3 (measured values) 6 µg/m3 (½ hr average) 4 µg/m3 (1 hr average) 3 µg/m3 (3 hr average) 1 µg/m3 (24 hr average) Precision 2 µg/m3 (24 hr) Reproducibility 60.3 when 0≤C25µg/m3 where C-
concentration class 50.3 25≤C<50 µg/m3 30.0 50≤C<75 µg/m3 43.7 75≤C<100 µg/m3 23.6 C>100 µg/m3
Operating temperature -20 to 40 degrees C Drift at zero point < 0.005% / day Drift of sensitivity < 0.020 % / day Availability > 98 %
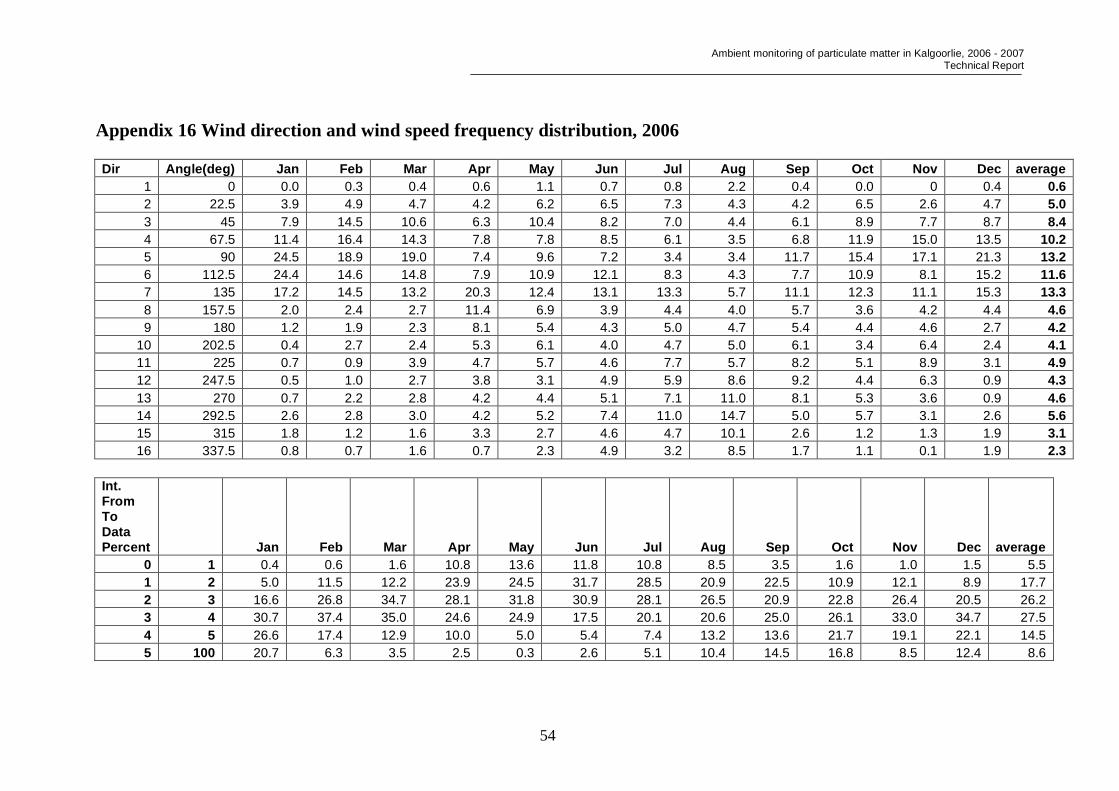
Ambient monitoring of particulate matter in Kalgoorlie, 2006 - 2007 Technical Report
54
Appendix 16 Wind direction and wind speed frequency distribution, 2006 Dir Angle(deg) Jan Feb Mar Apr May Jun Jul Aug Sep Oct Nov Dec average
1 0 0.0 0.3 0.4 0.6 1.1 0.7 0.8 2.2 0.4 0.0 0 0.4 0.6 2 22.5 3.9 4.9 4.7 4.2 6.2 6.5 7.3 4.3 4.2 6.5 2.6 4.7 5.0 3 45 7.9 14.5 10.6 6.3 10.4 8.2 7.0 4.4 6.1 8.9 7.7 8.7 8.4 4 67.5 11.4 16.4 14.3 7.8 7.8 8.5 6.1 3.5 6.8 11.9 15.0 13.5 10.2 5 90 24.5 18.9 19.0 7.4 9.6 7.2 3.4 3.4 11.7 15.4 17.1 21.3 13.2 6 112.5 24.4 14.6 14.8 7.9 10.9 12.1 8.3 4.3 7.7 10.9 8.1 15.2 11.6 7 135 17.2 14.5 13.2 20.3 12.4 13.1 13.3 5.7 11.1 12.3 11.1 15.3 13.3 8 157.5 2.0 2.4 2.7 11.4 6.9 3.9 4.4 4.0 5.7 3.6 4.2 4.4 4.6 9 180 1.2 1.9 2.3 8.1 5.4 4.3 5.0 4.7 5.4 4.4 4.6 2.7 4.2
10 202.5 0.4 2.7 2.4 5.3 6.1 4.0 4.7 5.0 6.1 3.4 6.4 2.4 4.1 11 225 0.7 0.9 3.9 4.7 5.7 4.6 7.7 5.7 8.2 5.1 8.9 3.1 4.9 12 247.5 0.5 1.0 2.7 3.8 3.1 4.9 5.9 8.6 9.2 4.4 6.3 0.9 4.3 13 270 0.7 2.2 2.8 4.2 4.4 5.1 7.1 11.0 8.1 5.3 3.6 0.9 4.6 14 292.5 2.6 2.8 3.0 4.2 5.2 7.4 11.0 14.7 5.0 5.7 3.1 2.6 5.6 15 315 1.8 1.2 1.6 3.3 2.7 4.6 4.7 10.1 2.6 1.2 1.3 1.9 3.1 16 337.5 0.8 0.7 1.6 0.7 2.3 4.9 3.2 8.5 1.7 1.1 0.1 1.9 2.3
Int. From To Data Percent Jan Feb Mar Apr May Jun Jul Aug Sep Oct Nov Dec average
0 1 0.4 0.6 1.6 10.8 13.6 11.8 10.8 8.5 3.5 1.6 1.0 1.5 5.5 1 2 5.0 11.5 12.2 23.9 24.5 31.7 28.5 20.9 22.5 10.9 12.1 8.9 17.7 2 3 16.6 26.8 34.7 28.1 31.8 30.9 28.1 26.5 20.9 22.8 26.4 20.5 26.2 3 4 30.7 37.4 35.0 24.6 24.9 17.5 20.1 20.6 25.0 26.1 33.0 34.7 27.5 4 5 26.6 17.4 12.9 10.0 5.0 5.4 7.4 13.2 13.6 21.7 19.1 22.1 14.5 5 100 20.7 6.3 3.5 2.5 0.3 2.6 5.1 10.4 14.5 16.8 8.5 12.4 8.6

Ambient monitoring of particulate matter in Kalgoorlie, 2006 - 2007 Technical Report
55
Appendix 17 Wind direction and wind speed frequency distribution, 2007 Dir Angle(deg) Jan Feb Mar Apr May Jun Jul Aug Sep Oct Nov Dec average
1 0 0.9 0.0 0.4 0.6 0.5 2.4 2.6 5.3 1.8 0.1 0.1 0.4 1.3 2 22.5 6.3 3.1 8.0 4.5 2.4 4.6 6.9 4.9 2.9 1.3 1.4 1.5 4.0 3 45 9.0 4.6 10.7 5.3 4.2 6.4 7.8 3.8 5.2 5.0 5.3 5.1 6.0 4 67.5 8.8 13.1 13.0 10.0 4.0 8.9 6.5 4.2 3.2 8.5 15.2 7.0 8.5 5 90 12.5 18.5 17.2 8.5 3.1 12.8 3.2 3.1 3.9 7.7 13.4 15.7 10.0 6 112.5 10.4 12.5 14.8 7.8 5.0 16.6 5.4 2.2 3.6 11.7 9.2 16.4 9.6 7 135 15.1 14.8 10.3 12.1 6.7 10.2 2.0 5.8 7.4 16.9 21.1 15.8 11.5 8 157.5 6.5 3.9 5.0 6.0 7.5 2.9 1.6 4.6 5.0 8.8 7.6 9.1 5.7 9 180 7.0 6.7 4.2 7.9 6.5 3.3 2.6 7.6 5.7 3.5 3.2 4.2 5.2
10 202.5 4.4 4.3 2.7 6.0 8.1 0.1 2.0 6.5 8.9 6.1 4.7 6.1 5.0 11 225 6.3 3.9 4.2 5.0 9.2 2.4 9.2 4.5 8.8 5.9 4.5 4.6 5.7 12 247.5 3.6 3.4 1.6 5.7 11.7 4.3 11.3 7.8 14.6 10.4 4.2 4.9 7.0 13 270 3.2 4.8 4.5 7.1 11.6 5.7 15.5 8.5 11.8 5.4 2.8 4.7 7.1 14 292.5 3.6 3.9 2.0 6.7 12.1 7.9 12.5 14.0 10.0 4.9 3.2 2.6 7.0 15 315 1.2 2.1 0.7 4.6 4.7 4.7 8.4 9.0 3.9 2.6 2.6 0.9 3.8 16 337.5 0.9 0.4 0.5 2.4 2.7 6.7 2.6 8.4 3.2 1.2 1.5 0.9 2.6
Int. From To Data Percent Jan Feb Mar Apr May Jun Jul Aug Sep Oct Nov Dec average
0 1 0.7 2.1 3.4 5.8 14.5 5.6 5.7 10.1 5.6 1.6 1.3 2.7 4.9 1 2 12.0 14.6 11.5 28.1 34.7 23.8 21.0 20.1 19.2 14.0 9.7 12.2 18.4 2 3 24.0 22.5 25.0 27.7 26.5 31.8 25.5 27.1 25.2 17.7 21.7 16.0 24.2 3 4 29.4 28.9 29.3 25.0 15.9 24.9 20.8 24.6 24.4 28.2 36.4 29.1 26.4 4 5 23.0 21.2 20.2 9.9 4.2 11.6 16.2 9.3 11.0 22.9 23.9 19.4 16.1 5 100 10.9 10.7 10.6 3.5 4.2 2.4 10.9 8.8 16.0 15.5 7.0 20.7 10.1

Ambient monitoring of particulate matter in Kalgoorlie, 2006 - 2007 Technical Report
56