technical report documentation page 1. report no. 2 ... · research and technology implementation...
TRANSCRIPT

Technical Report Documentation Page 1. Report No. FHWA/TX-09/5-4577-03-P1
2. Government Accession No.
3. Recipient's Catalog No.
4. Title and Subtitle PAVE-IR OPERATOR’S MANUAL VERSION 1.3
5. Report Date December 2008 Published: June 2009
6. Performing Organization Code
7. Author(s) Stephen Sebesta, Wenting Liu, and Tom Scullion
8. Performing Organization Report No. Product 5-4577-03-P1
9. Performing Organization Name and Address Texas Transportation Institute The Texas A&M University System College Station, Texas 77843-3135
10. Work Unit No. (TRAIS) 11. Contract or Grant No. Project 5-4577-03
12. Sponsoring Agency Name and Address Texas Department of Transportation Research and Technology Implementation Office P. O. Box 5080 Austin, Texas 78763-5080
13. Type of Report and Period Covered Product: August 2007-September 2008 14. Sponsoring Agency Code
15. Supplementary Notes Project performed in cooperation with the Texas Department of Transportation and the Federal Highway Administration. Project Title: Pilot Implementation of Thermal Segregation Detection Systems with GPS Capabilities URL: http://tti.tamu.edu/documents/5-4577-03-P1.pdf 16. Abstract This product updates the prior user’s manual for Pave-IR to reflect changes in hardware and software made to accommodate collection of GPS data simultaneously during the collection of thermal profiles. The current Pave-IR system described in this manual attaches to the paver and collects and displays the thermal profile of the hot-mix construction operation in real time as the paving train progresses. The system also records the GPS coordinates of each temperature scan, so that the limits of the profile and the location of anomalous areas can be reliably documented. 17. Key Words Segregation, Hot-Mix Asphalt, Infrared Imaging, Quality Control, Pave-IR
18. Distribution Statement No restrictions. This document is available to the public through NTIS: National Technical Information Service Springfield, Virginia 22161 http://www.ntis.gov
19. Security Classif.(of this report) Unclassified
20. Security Classif.(of this page) Unclassified
21. No. of Pages 32
22. Price
Form DOT F 1700.7 (8-72) Reproduction of completed page authorized


PAVE-IR OPERATOR’S MANUAL
Version 1.3
A Thermal Imaging System for Evaluating Hot-Mix Asphalt Paving Operations
by Stephen Sebesta, Wenting Liu, P.E., and Tom Scullion, P.E.
Product 5-4577-03-P1
Texas Transportation Institute
December 2008 Published: June 2009


v
ACKNOWLEDGMENTS The Texas Department of Transportation (TxDOT) and the Federal Highway Administration sponsored the work leading to the development of the Pave-IR system described in this manual. Magdy Mikhail, P.E., served as the project director. Gerry Harrison at the Texas Transportation Institute (TTI) fabricated the hardware for the thermal imaging system. DISCLAIMER
This document reflects the views of the authors, who are responsible for the facts and the accuracy of the data presented herein. The contents do not necessarily reflect the official view or policies of the Federal Highway Administration (FHWA) or the Texas Department of Transportation (TxDOT). This manual does not constitute a standard, specification, or regulation. Tom Scullion, P.E. (Texas, # 62683) supervised the project. PROJECT DETAILS Project Number: 5-4577-03 Project Title: Pilot Implementation of Thermal Segregation Detection Systems with GPS Capabilities TxDOT Project Director: Magdy Mikhail, P.E. Research Supervisor: Tom Scullion, P.E., TTI, (979) 845-9910, [email protected] Researchers: Stephen Sebesta, TTI, (979) 458-0194, [email protected] Wenting Liu, P.E., TTI, (979) 845-5943, [email protected]


vii
TABLE OF CONTENTS List of Figures .............................................................................................................................. viii
Introduction ......................................................................................................................................1
Components of the Pave-IR System ................................................................................................2
Power Management .........................................................................................................................4
System Check Procedures before Departing for Project Site ..........................................................4
Installation of the Pave-IR System ..................................................................................................4
Collecting Data ..............................................................................................................................10
Viewing Data .................................................................................................................................11
Sensor Calibration ..........................................................................................................................11
Pave-IR Software Guide ................................................................................................................12
Support Information .......................................................................................................................24
viii
LIST OF FIGURES 1. Components of Pave-IR System ................................................................................................3
2. Part 12: Trimble DSM232 System ............................................................................................4
3. Part 13: GPS Antenna Mount ...................................................................................................4
4. DMI Mount Attached to Paver Wheel Hub ...............................................................................6
5. IR Bar Mounts with IR Bars Installed .......................................................................................7
6. Master Control Cable Connected to IR Bars .............................................................................8
7. Proper Connections at Master Control Box ...............................................................................8
8. Installed DMI .............................................................................................................................9
9. Installing GPS Antenna..............................................................................................................9
10. GPS Receiver Hookup .............................................................................................................10
11. Pave-IR Main Menu Screen .....................................................................................................12
12. Project Information Screen ......................................................................................................13
13. Options Screen .........................................................................................................................14
14. View Parameters Screen ..........................................................................................................15
15. DMI Calibration Main Screen .................................................................................................16
16. DMI Calibration Start Screen ..................................................................................................17
17. Beginning Screen for DMI Calibration ....................................................................................17
18. End Calibration Screen for DMI ..............................................................................................18
19. Line Graph of Sensor Readings with Check Sensors Command .............................................18
20. Field Sens Verified Screen .......................................................................................................19
21. PAVE-GPSIR in Data Collection Mode ..................................................................................19
22. Bad Sensor Screen ...................................................................................................................20
23. Viewed Data File .....................................................................................................................21
24. Data File Viewed in Segment ..................................................................................................22
25. Bar Chart Display ....................................................................................................................23
26. GPS Setting Screen ..................................................................................................................24
1
INTRODUCTION
Welcome to the world of thermal imaging. Thermal imaging of hot-mix asphalt (HMA) overlays as they are placed began around 1996 with the use of infrared cameras. Through years of research, many agencies determined uniformity of mat placement temperature immediately behind the screed provides a method to evaluate the uniformity and overall quality of hot-mix paving operations. With the Pave-IR (infrared) system, an infrared sensor bar replaces infrared cameras for thermal imaging. The Pave-IR system provides for reduced investment cost, simpler operation, more thorough data collection, and improved data processing capabilities, when compared to infrared cameras.
This manual provides Pave-IR operators with instructions for installing the Pave-IR Version 1.3 hardware and using the Pave-IR software package to collect and view thermal imaging data with the Pave-IR system. Pave-IR Version 1.3 upgrades prior version 1.2 to include GPS capabilities. As with version 1.2, version 1.3 mounts to the footplate of the paver and therefore does not require operators to propel the device.
2
COMPONENTS OF THE PAVE-IR SYSTEM
The Pave-IR system consists of the part numbers listed below and is illustrated in Figures 1 – 3. The quantity of each component follows in parentheses.
1- Master Control Box (1) (Figure 1) 2- Master Power Cable (1; not shown in photo) 3- Master Control Cable (1) (Figure 1) 4- IR bar Supports (4) (Figure 1) 5- IR bars each with 5 sensors (2) (Figure 1) 6- Distance Measuring Instrument (DMI) (1) (Figure 1) 7- DMI Mount (1) (Figure 1) 8- DMI Cable (1) (Figure 1) 9- Laptop Computer with Data Acquisition Card and Pave-IR Software (1; not shown in photo) 10- Data Transfer Cable (1) (Figure 1) 11- Allen head cap screws (8; already installed in IR bar Supports) 12- Trimble DSM 232 GPS System (1) (Figure 2) 13- GPS Antenna mount (1) (Figure 3) 14- 12 VDC deep-cycle battery (1; not shown in photo)

Fi
gure
1. C
ompo
nent
s of P
ave-
IR S
yste
m.
3
1
10
4
8
3
6 7
5

4
Figure 2. Part 12: Trimble DSM232 System.
Figure 3: Part 13: GPS Antenna Mount.
POWER MANAGEMENT
Pave-IR Version 1.3 uses 12 volts direct current (VDC) to power the Master Control Box. The Master Control Box contains an inverter for powering the laptop computer. However, it is good practice to charge laptop computer batteries before going to the field. SYSTEM CHECK PROCEDURES BEFORE DEPARTING FOR PROJECT SITE
Perform the following procedures before departing with the Pave-IR system to help field operations go smoothly:
• Verify all components of the Pave-IR system are on hand. • Charge the computer batteries (see Power Management section). • Verify operation of system by connecting to a 12-VDC source.
INSTALLATION OF THE PAVE-IR SYSTEM
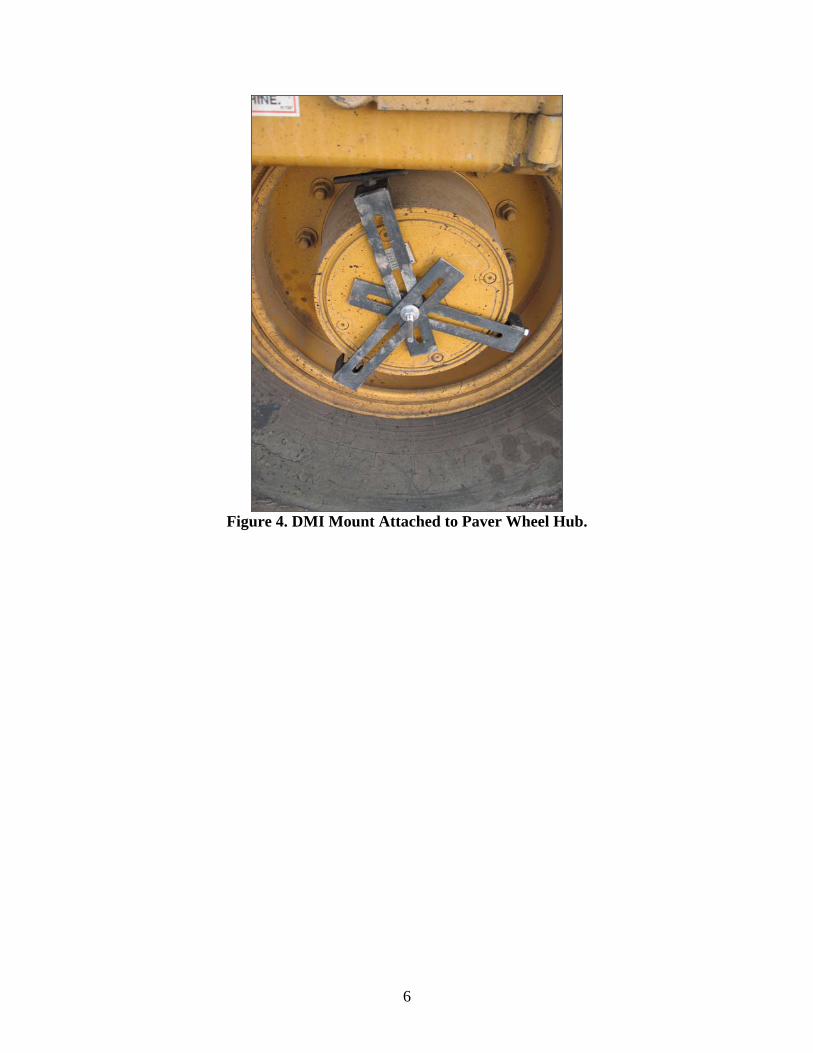
• Attach the DMI mount to the hub on the paver wheel (See Figure 4). Each leg of the mount should be at a 120° angle to the adjacent legs, and the stud should be centered over the wheel hub.
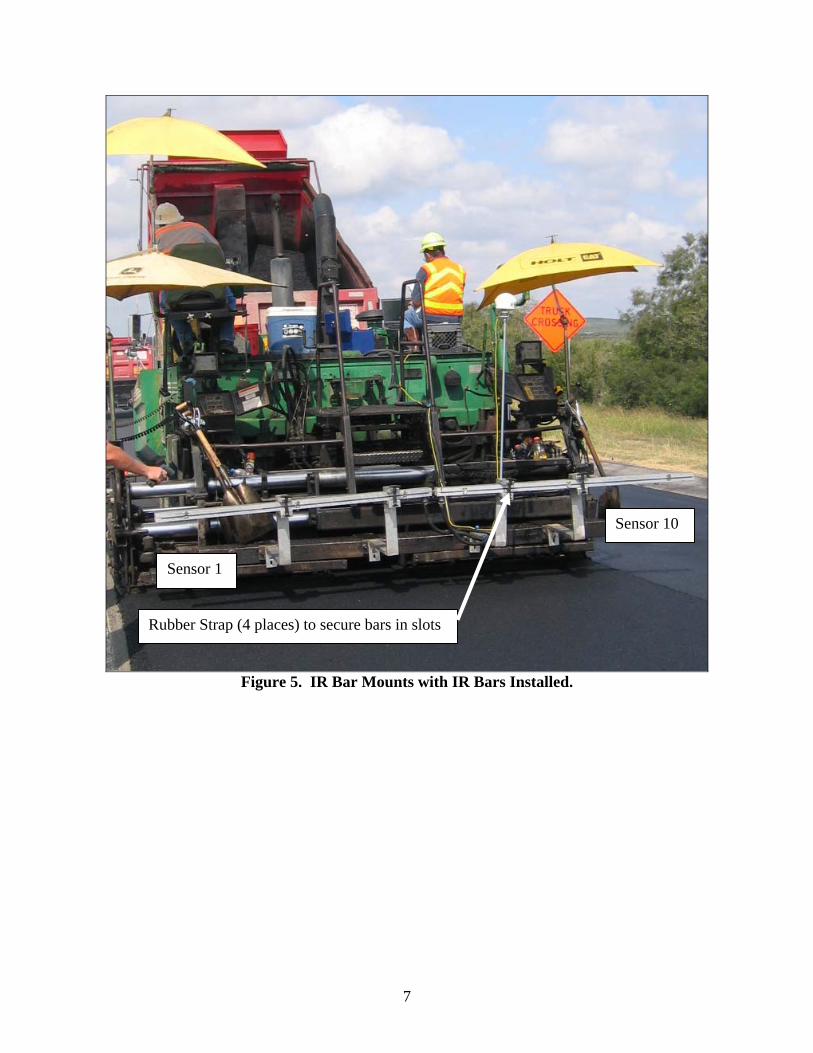
• Install the IR bar mounts onto the footplate of the paver, and secure by tightening the Allen head cap screws (See Figure 5).
5
• Install the IR bars onto the IR bar mounts by sliding the bars into the slots on the bar mounts then securing the rubber straps. As you face the paver from the footplate, sensor 1 should be on the outermost left position and sensor 10 on the outermost right position (See Figure 5). The IR bars should be mounted such that sensors 1 and 10 are no closer than 1 foot from the outside edge of the HMA mat, and both sensors should be approximately equidistant from the outer edges of the paver screed.
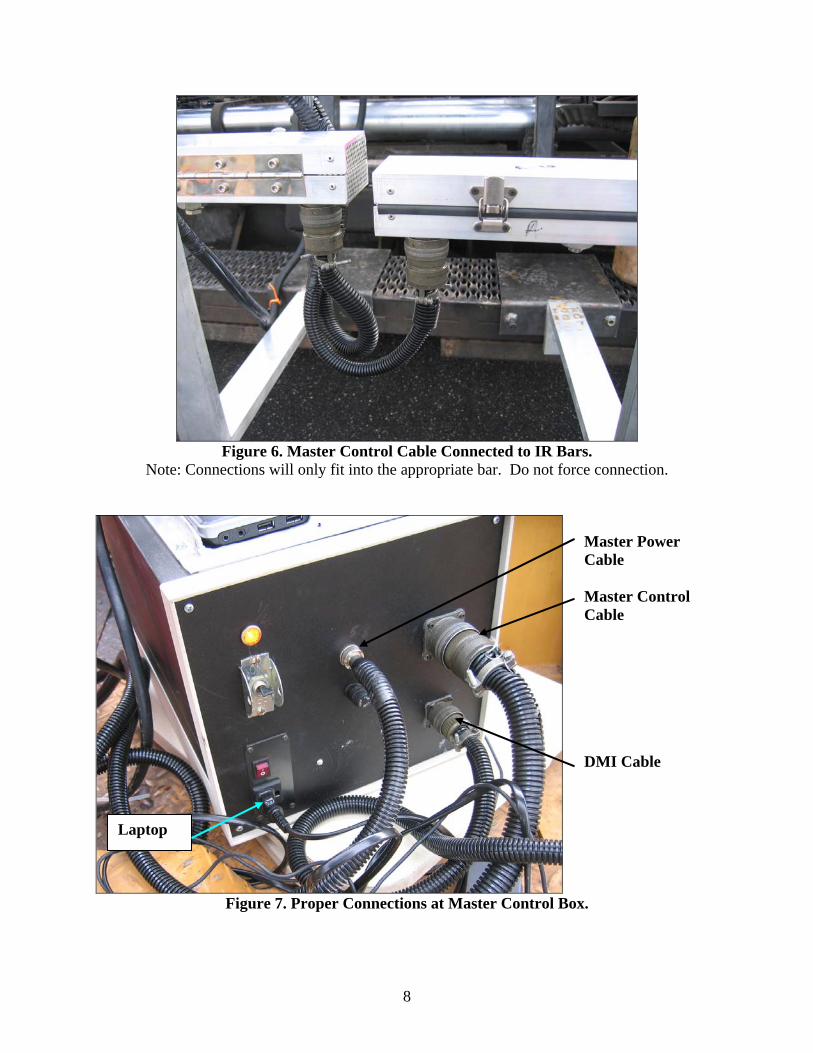
• Connect the Master Control Cable to the IR bars (See Figure 6). • Place the Master Control Box and the laptop computer onto the operator’s platform of the
paver. • Connect the Master Control Cable to the Master Control Box (See Figure 7). • Plug the laptop computer into the AC outlet on the Master Control Box (See Figure 7). • Install the DMI onto the DMI mount. Secure the DMI to the paver body to prevent the
DMI housing from rotating (See Figure 8). Securing the DMI housing often requires adaptation to the particular paver model and may necessitate various magnetic bases or other miscellaneous fastening devices. Tighten the setscrew securing the DMI to the stud on the DMI Mount.
• Connect the DMI cable to the DMI (See Figure 8). • Connect the DMI cable to the Master Control Box (See Figure 7). • Connect the Data Transfer Cable between the back of the Master Control Box and the
Data Acquisition Card in the laptop computer. • Install the GPS antenna cable to the antenna, then secure the antenna to the top of the
antenna mount (See Figure 9). • Slide the antenna mount into the clamps on the IR bar mount (see Figure 9). • Place the GPS receiver box with the Master Control Box on the paver deck and connect
the antenna and signal/power cable to the GPS receiver box (See Figure 10). • Connect the GPS signal cable to the computer serial port, or use a serial to USB adaptor
to connect the GPS signal cable to the computer’s USB port (See Figure 10). • Connect the GPS power leads to the 12 VDC battery (See Figure 10). • Connect the Master Power Cable to the Master Control Box (See Figure 7). • Connect the alligator clamps on the Master Power Cable to the appropriate positive and
negative battery terminals. First connect the red clamp to the positive battery post, then connect the black clamp to the negative battery post (See Figure 10).
6
Figure 4. DMI Mount Attached to Paver Wheel Hub.
7
Figure 5. IR Bar Mounts with IR Bars Installed.
Sensor 1
Sensor 10
Rubber Strap (4 places) to secure bars in slots
8
Figure 6. Master Control Cable Connected to IR Bars.
Note: Connections will only fit into the appropriate bar. Do not force connection.
Figure 7. Proper Connections at Master Control Box.
Master Power Cable Master Control Cable DMI Cable
Laptop

9
Figure 8. Installed DMI.
Figure 9. Installing GPS Antenna.
DMI
DMI Cable
Connect antenna cable to antenna, secure antenna to mount with magnetic base, then slide antenna mount into brackets on IR bar support.

10
Figure 10. GPS Receiver Hookup.
COLLECTING DATA
• Install the Pave-IR system according to the installation instructions provided in this
manual. • Turn on the Master Control Box by moving the power toggle switch to the ON position.
An illuminated light indicates system power. • Turn on the computer and launch the Pave-IR GPS software by double clicking on the
PAVE-GPSIR shortcut icon on the desktop. • Set up the GPS collection by pressing the GPS Setting button. Select the port from the
drop-down menu that matches the port that the GPS signal cable is connected to. The computer’s Device Manager can be used to identify which port is correct.
• Verify the sensors are operating by pressing either the Check Sensor or the Field Sensor Verify buttons. Press Q to quit the verification function.
• Check the data collection parameters by selecting Options from the Options drop-down menu.
o Select the desired data collection mode. Using the Distance mode and a sample rate of 2 inches per scan is recommended.
Serial to USB adaptor
Signal/Power Cable connection to GPS
Receiver Box
GPS power hookup
Antenna Cable Connection
Master Power Cable Hookup
11
o In the Target box, set the target temperature to the specified or typical measured mat placement temperature. Set the maximum and minimum temperature ranges to the desired values. Values of 25 °F for both ranges are recommended.
o Select the desired Y axis scale values. For most paving projects a scale of 225 to 325 °F or 200 to 350 °F works well.
o Press Ok when finished setting the data collection options. • Set up the data file and input any desired comments by selecting Project Information
from the Options drop-down menu. Press Ok when finished with inputting the desired information.
• Initiate data collection by pressing the Test button. • At the desired stop location, press Q to cease data collection. • For more details about setting up options and using the Pave-IR software, refer to the
Pave-IR software guide in this manual. VIEWING DATA
• To view data just collected, select the View Data File or the View in Segment buttons. If more data exists than PAVE-GPSIR can display on one screen, use the back and forward buttons to scroll through the thermal plots.
• To view a different data file, first open the file by pressing the Open File button and then selecting the appropriate file.
• To view a histogram of the measured temperatures in an entire data file, press the Bar Chart button.
• For more complete details, along with computer screen illustrations, see the Pave-IR software guide in this manual.
SENSOR CALIBRATION
The infrared sensors should be calibrated at least once yearly to ensure accurate data are obtained. Contact either the TxDOT project director or a member of the research team to make arrangements for system calibration. The Support Information section of this manual on page 24 contains this contact information.

12
PAVE-IR SOFTWARE GUIDE
The PAVE-GPSIR software package provides Pave-IR operators a simple, flexible, and powerful pavement analysis tool to use with the Pave-IR system. This portion of the Pave-IR operator’s manual presents details for using the PAVE-GPSIR software package. This section of the manual is divided according to functions within each drop-down menu in the PAVE-GPSIR software package. Upon launching PAVE-GPSIR, the main menu screen shown in Figure 11 appears.
Figure 11. Pave-IR Main Menu Screen.
Options Menu
The Options pull-down menu contains functions for inputting project information, options for data acquisition control and display, and items to select the desired view parameters as described next.
Project Information Input the desired data file name, project name, and other pertinent information to identify the data file in the Project Information Screen as shown in Figure 12. Press Ok when finished.
Rewind Forward Save to File

13
Figure 12. Project Information Screen.
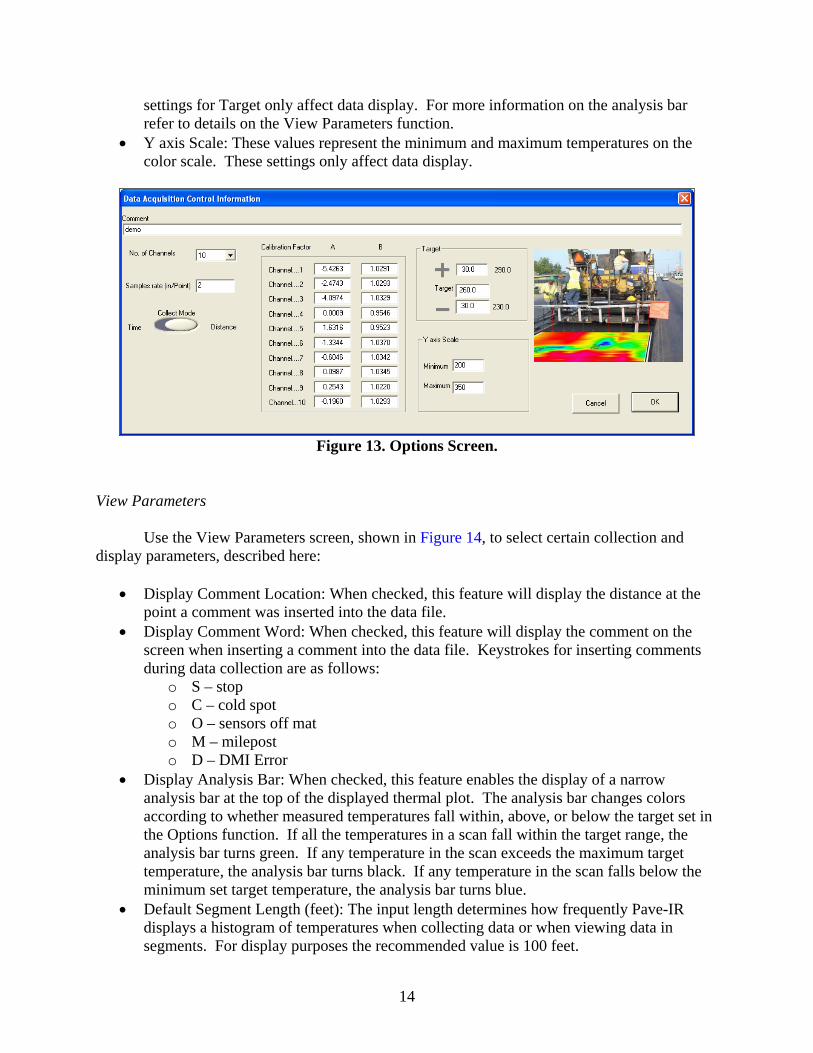
Options Use the Options screen to select the data collection mode, target temperature window, and Y axis scale. The Options screen as shown in Figure 13 contains the following:
• No. of Channels: This value contains the number of sensors, which for the current Pave-IR system is 10. Do not change this value.
• Samples Rate: This value determines the rate at which Pave-IR records data. This value uses inches per point for distance mode or points per second for time mode.
• Collect Mode: This button selects whether Pave-IR records data in distance or time mode. Data collection in the distance mode is recommended, with a sampling rate of 2 inches per point.
• Calibration Factor: These values are the calibration factors for each sensor. These factors are read from an external calibration file and cannot be overridden in the PAVE-GPSIR software.
• Target: This value represents the target placement temperature in °F. The + and – boxes set the maximum and minimum target temperatures according to deviations from the target. For example, if the input target temperature is 275 °F and both + and – boxes are set at 25 °F, the maximum temperature will be 300 °F and the minimum will be 250 °F. PAVE-GPSIR uses these values to determine what color the analysis bar displays. The
14
settings for Target only affect data display. For more information on the analysis bar refer to details on the View Parameters function.
• Y axis Scale: These values represent the minimum and maximum temperatures on the color scale. These settings only affect data display.
Figure 13. Options Screen.
View Parameters
Use the View Parameters screen, shown in Figure 14, to select certain collection and display parameters, described here:
• Display Comment Location: When checked, this feature will display the distance at the point a comment was inserted into the data file.
• Display Comment Word: When checked, this feature will display the comment on the screen when inserting a comment into the data file. Keystrokes for inserting comments during data collection are as follows:
o S – stop o C – cold spot o O – sensors off mat o M – milepost o D – DMI Error
• Display Analysis Bar: When checked, this feature enables the display of a narrow analysis bar at the top of the displayed thermal plot. The analysis bar changes colors according to whether measured temperatures fall within, above, or below the target set in the Options function. If all the temperatures in a scan fall within the target range, the analysis bar turns green. If any temperature in the scan exceeds the maximum target temperature, the analysis bar turns black. If any temperature in the scan falls below the minimum set target temperature, the analysis bar turns blue.
• Default Segment Length (feet): The input length determines how frequently Pave-IR displays a histogram of temperatures when collecting data or when viewing data in segments. For display purposes the recommended value is 100 feet.

15
• Number of Insert Point: This value determines the number of temperature interpolations between sensors used in construction of the thermal plot.
• Mark Label Space (feet): This value sets the label spacing across the longitudinal axis of the displayed data.
• Color Scale Display: This selection determines the number of color scale legends displayed. When No Color Scale is checked, a color scale legend is not displayed when viewing data. If One Color Scale is checked, a single color scale legend is displayed adjacent to the first row’s thermal plot. If Multi Color Scale is selected, Pave-IR displays a color scale adjacent to each displayed thermal profile.
Figure 14. View Parameters Screen.
Tools Menu
The Tools drop-down menu contains a sensor calibration and DMI calibration function. Sensor Calibration requires a blackbody source and should be coordinated through the TxDOT project director. The DMI calibration is described next. DMI Calibration
Upon selecting DMI Calibration, the screen shown in Figure 15 appears. PAVE-GPSIR displays the current calibration factor in the Cal Factor (pulse/kfeet) box. This factor shows the current calibration factor in units of number of counts per 1000 feet.

16
Figure 15. DMI Calibration Main Screen.
The DMI Calibration main screen provides access to the following options:
• Calibration: Press this button to activate the calibration routine. The calibration start screen shown in Figure 16 will appear. Perform the following steps to calibrate the DMI:
o Select and mark start and stop locations at least 100 feet apart to perform the calibration.
o Install Pave-IR onto the paver. o Have the contractor line up the centerline of the paver wheel hub with the
calibration start location. o Press the Start button; the screen shown in Figure 17 appears. o Have the contractor drive the paver toward the stop location. Pave-IR will display
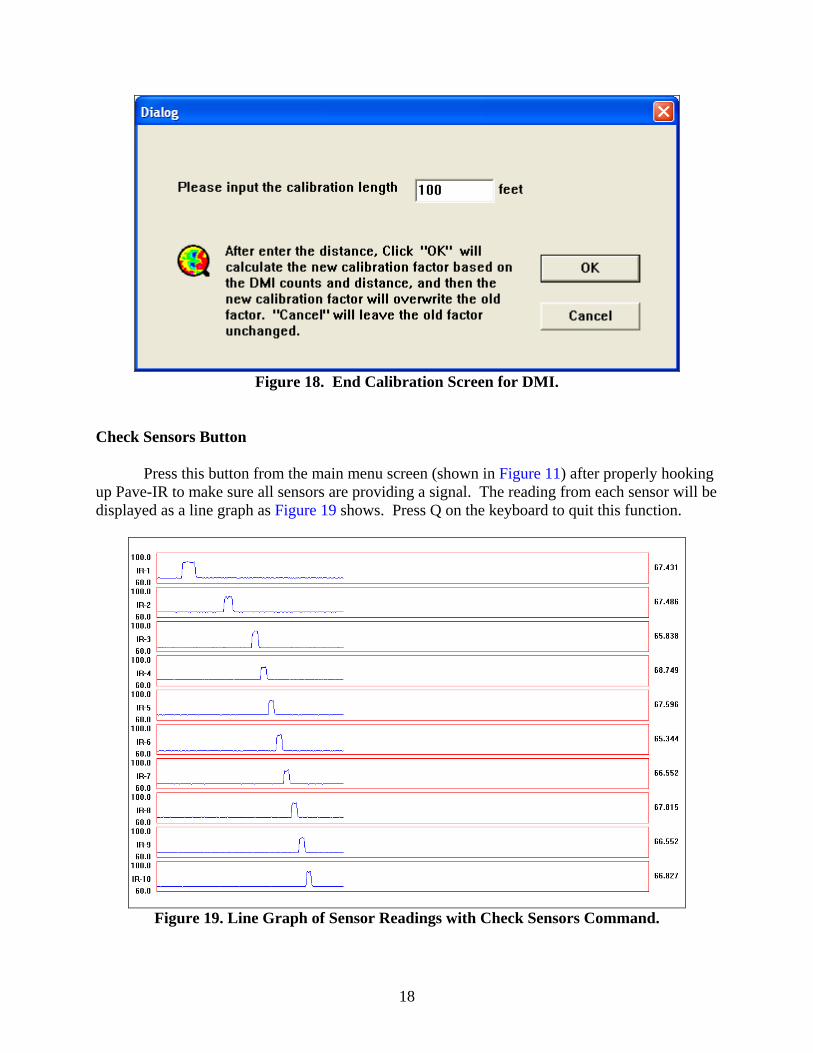
the number of counts from the DMI in the DMI Pulse Count box. o Stop the paver with the centerline of the wheel hub at the stop location. o Press the End Calibration button; the screen shown in Figure 18 will appear. o The box marked Please Input the Calibration Length displays the computed
distance (in feet) traveled based upon the old calibration factor. If the actual distance traveled varies from this value, type in the actual distance then press Ok.
o Pave-IR returns to the DMI Calibration Main Screen, as shown in Figure 16, with the newly determined calibration factor displayed.
• Save: Press this button to save the calibration factor displayed. • Ok: Press this button to save the calibration factor displayed and exit to the Pave-IR main
menu.

17
Figure 16. DMI Calibration Start Screen.
Figure 17. Beginning Screen for DMI Calibration.
18
Figure 18. End Calibration Screen for DMI.
Check Sensors Button
Press this button from the main menu screen (shown in Figure 11) after properly hooking up Pave-IR to make sure all sensors are providing a signal. The reading from each sensor will be displayed as a line graph as Figure 19 shows. Press Q on the keyboard to quit this function.
Figure 19. Line Graph of Sensor Readings with Check Sensors Command.
19
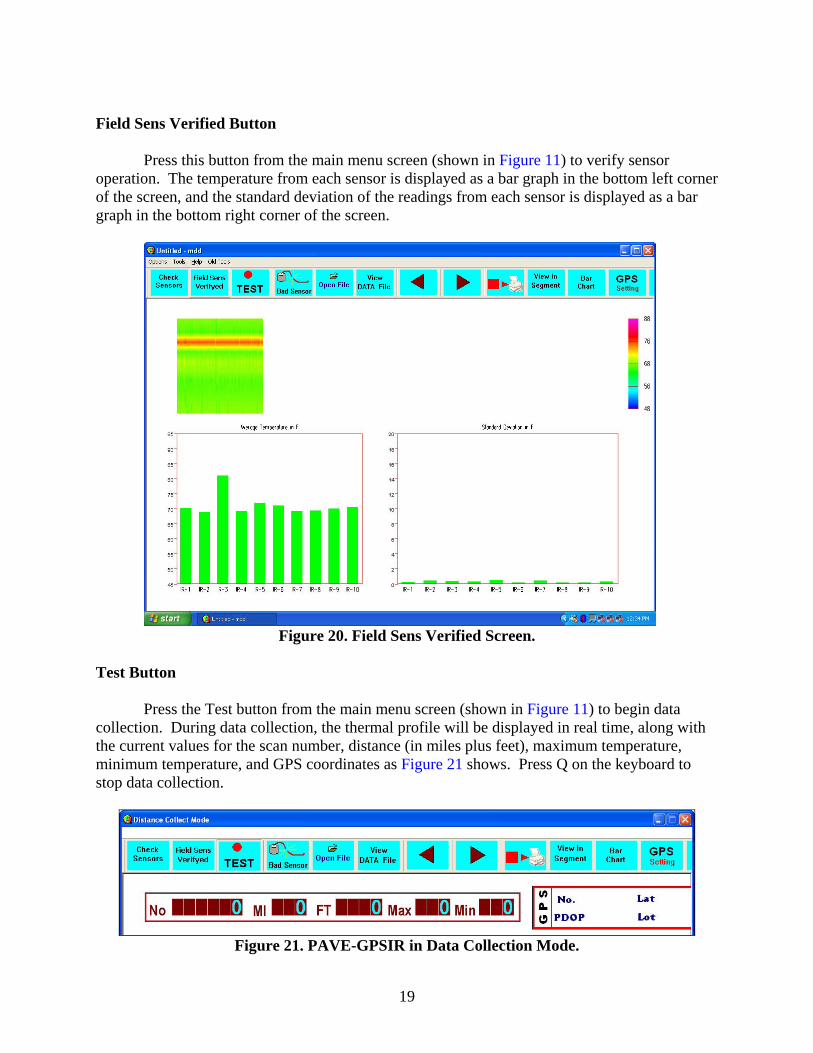
Field Sens Verified Button
Press this button from the main menu screen (shown in Figure 11) to verify sensor operation. The temperature from each sensor is displayed as a bar graph in the bottom left corner of the screen, and the standard deviation of the readings from each sensor is displayed as a bar graph in the bottom right corner of the screen.
Figure 20. Field Sens Verified Screen.
Test Button Press the Test button from the main menu screen (shown in Figure 11) to begin data collection. During data collection, the thermal profile will be displayed in real time, along with the current values for the scan number, distance (in miles plus feet), maximum temperature, minimum temperature, and GPS coordinates as Figure 21 shows. Press Q on the keyboard to stop data collection.
Figure 21. PAVE-GPSIR in Data Collection Mode.

20
Bad Sensor Button If after collecting data it is discovered that a sensor was not working properly, use this button from the main menu screen to eliminate that sensor from the data display. For example, sometimes a loose connection results in a sensor with extreme amount of noise. Checking that sensor in the Bad Sensor screen as shown in Figure 22 will result in PAVE-GPSIR eliminating that sensor from the display. In place of the bad sensor, PAVE-GPSIR interpolates between the two sensors surrounding the bad sensor.
Figure 22. Bad Sensor Screen.
Open File Button Use this button to select a previously-collected data file to open for review. View Data File Button Press this button to view the thermal profile of the currently-loaded data file. The thermal plot as shown in Figure 23 appears. The GPS coordinates will be updated in the GPS box according to the position of the cursor on the thermal plot.

21
Figure 23. Viewed Data File.
Rewind and Forward Buttons
Use these buttons to scroll forward or backward through the thermal plots if more data exist than Pave-IR can display on one screen. Save to File Button Press this button to save the screen as a bitmap image. View in Segment Button Press this button to view the thermal profile in segments, with a histogram of temperatures displayed for each segment as Figure 24 shows. The segment length is defined in the View Parameters screen Figure 14 showed.

22
Figure 24. Data File Viewed in Segment.
Bar Chart Button
Press this button to display a histogram of all the measured temperatures in the entire data file as Figure 25 shows. The Y axis scale setting in the Options screen that Figure 13 showed determines the displayed temperature range of the bar chart.

23
Figure 25. Bar Chart Display.
GPS Setting Button Press this button to set the GPS data collection settings. The selections for Baud, Parity, Data Bits, Stop Bits, and Flow should be 9600, none, 8, 1, and none, as shown in Figure 26. The COM Port selected must match the COM Port that the GPS signal cable is connected to on the computer. Use the computer’s Device Manager to identify the correct port, then select that port from the COM Port drop-down menu in the GPS Setting screen.

24
Figure 26. GPS Setting Screen.
SUPPORT INFORMATION
The Texas Transportation Institute developed Pave-IR in cooperation with the Texas Department of Transportation and the Federal Highway Administration. More details of the project can be found in Report FHWA/TX-05/0-4577-2 and FHWA/TX-06/5-4577-01-1. For technical assistance, or for information about hardware or software updates, please contact the project director or one of the members of the research team. The project director was:
• Magdy Mikhail, P.E., Texas Department of Transportation, (512) 465-3686, [email protected]
Texas Transportation Institute researchers developing and testing Pave-IR include:
• Tom Scullion, P.E., (979) 845-9910, [email protected] • Stephen Sebesta, (979) 458-0194, [email protected] • Wenting Liu, P.E., (979) 845-5943, [email protected] • Gerry Harrison, (979) 845-2365, [email protected]