technical report - harvard university
TRANSCRIPT

2009-2012
Technical Report Creation and Dissemination of Upper-elementary Mathematics Assessment Modules National Science Foundation Math and Science Partnership Program (NSF 08-525)

2
Technical Report National Science Foundation Math and Science Partnership Program (NSF 08-525) 2009–2012
Creation and Dissemination of Upper-elementary Mathematics Assessment Modules
Judy J. Hickman, Jianbin Fu, Heather C. Hill
September 2012
This document provides information on the grades 4 and 5 mathematics test modules developed
as a joint Harvard/ETS venture from 2009 to 2012. Hundreds of items that were initially
developed were then culled by a series of reviews, revisions, pilot tests, cognitive interviews, and
field tests. The result of these efforts yielded eight final test modules that are intended to be used
to help measure gains resulting from teacher professional development, and also to be sensitive
to variation in teachers’ mathematical knowledge for teaching and instruction. Importantly, these
modules are aligned with the grade 4 and grade 5 Common Core mathematics standards1, and
can thus reveal important patterns in student achievement with respect to those standards.
The first section of this report describes the item development and pilot design phase of the
project. The next section describes the actual piloting, cognitive interviews, and test construction
phases that followed item development. The final section includes the psychometric analyses
conducted on the eight test forms implemented in the Spring 2012 administration, including (a)
classical item statistics, (b) item calibration and equating using the two-parameter item response
theory (IRT) model (i.e., generalized partial credit model, GPCM; Muraki, 1992), and (c) the
creation of the raw score to scale score conversion table for each test form.
Item Development and Pilot Design
The items described in this report were written between 2009 and 2011. The development of the
items contained in the eight test modules was guided by three content-specific advisory panels
(Number and Operations, Algebra, and Geometry/Measurement). The advisory panels each met
for two days (at separate times) in Cambridge, Massachusetts to discuss relevant research related
to the specific content, to help define appropriate developmental models for student
understanding, and to create exemplar items to be used to facilitate the development of many
more items by ETS assessment specialists. In designing test items, there were five initial goals.
Specifically, items should:
represent central ideas in the subject matter;
focus on the meaning of facts and procedures;
allow accurate placement of students on developmental maps;
require more complex responses than traditional multiple-choice problems; and
be written in a “Plain English” style in order to increase accessibility to a wider range of
students.
1 For more information about the Common Core State Standards for Mathematics (CCSSM), go to the following
website: http://www.corestandards.org/assets/CCSSI_Math%20Standards.pdf

3
One of the more challenging aspects of this project was designing machine-scorable items for a
pencil-and-paper format that would still allow educators to assess the level of understanding a
student has for the content being assessed. Out of this challenge came the idea to present “nested
sets” of items that would be scored using a rubric that is tied to the development model of the
particular content. In other words, students would respond to a set of items, and the set would be
scored as a single item (often a multiple-point item) rather than as discrete items. An example of
this type of “nested set” is shown in Figure 1.
Figure 1. (Grade 4, Form G)
For numbers 2124, state whether or not each figure has 2
5 of its whole shaded.
21. (Y) Yes (N) No
22. (Y) Yes (N) No
23. (Y) Yes (N) No
24. (Y) Yes (N) No
This item is more complex than a traditional multiple-choice item in that a student has to
evaluate each part separately and decide whether the fraction 2/5 can take different forms.
Because two points are assigned to this problem, the item can also provide feedback at the item
level as to the depth of understanding a student has about simple fractions. The total number of
ways to respond to this item is sixteen. “Guessing” the correct combination of responses is much
less likely than it would be for a traditional four-option multiple-choice item. The correct
response for this item will receive 2 points, and the points will be earned based on the level of
understanding the student has demonstrated. The scoring rubric used for this item follows in
Figure 2.

4
Figure 2.
Scoring Rubric
Responses to this item will receive 0-2 points, based upon the following:
2 points: YNYN The student has a solid understanding of 2/5 as well as an
equivalent form of 2/5.
1 point: YNNN, YYNN, YYYN The student has only a basic understanding
of 2/5. Either the student doesn’t recognize an equivalent fraction for 2/5
or doesn’t understand that all 5 parts must be equal-sized in item #23.
0 points: YYYY, YNNY, NNNN, NNYY, NYYN, NYNN, NYYY, YYNY, YNYY,
NYNY, NNYN, NNNY The student demonstrates inconsistent
understanding of 2/5 or answers “Y” to item #25, clearly showing a
misunderstanding of what 2/5 means. Figure #25 is considered a
“disqualifier,” and an answer of “Y” to this part of the item would cancel out
any other correct responses as “guesses” on the part of the student.
Not all of the items in the eight test modules are in “nested sets” like the example shown above.
Some items are indeed traditional multiple-choice items, partly because they are familiar to
students and partly because the concepts being assessed didn’t justify assigning a value of more
than a single point. Another type of item used in these modules is a gridded-response item. The
student essentially has to determine the solution and then grid-in a series of bubbles to show
his/her answer. An example of this type of “gridded-response” item is shown in Figure 3.
Figure 3. (Grade 5, Form M)
27. Look at the following number line.
What decimal number is represented by point P ?
The student responds to this type of item by writing the answer (in this case, 3.5) in the boxes at
the top of the grid and then filling in the corresponding circles below each number. It should be
noted that while the intent was to make the answer document a truly scannable document, all
0 1 2 3 4
P

5
documents were actually read and reported by a key entry vendor (100% double reads). The
instruction given to the vendor was to record the bubbled-in response unless none existed. If the
student wrote the correct response in the boxes above the grid but did not mark the
corresponding circles, the student’s response was still recorded.
Once the content, types of items, and developmental models were decided upon, ETS assessment
specialists proceeded to write, review, and revise items. Harvard educators, as well as advisory
panel members, provided additional guidance and reviews throughout the development cycle.
When this project began in 2009, the Common Core State Standards for Mathematics (CCSSM)
were not yet available. Therefore, the NCTM focal points were used to determine the content in
each of the three domains. After the CCSSM were released in 2010, another review of the items
already developed was conducted, and only those items that were also aligned to the new
Common Core standards made it into the final test modules.
Piloting, Cognitive Interviews, and Test Construction
In June of 2009, the first of three advisory panels was convened to discuss topics related to
Algebra. Several developmental models were discussed, and prototype items were reviewed. It
was agreed at the first meeting that items/tasks should be designed to:
primarily assess one strand;
be contextualized where appropriate;
gather evidence from multiple developmental levels;
employ a set of questions that relate to one another; and
develop, where possible, the idea of fluency within a strand.
Members of the Algebra panel2 also suggested items from their own research. Immediately
following the two-day meeting, work began on creating a bank of items measuring algebraic
concepts.
In August of 2009, the second advisory panel was convened to discuss topics related to Number
and Operations. The panel worked to define levels of development and competency/fluency with
respect to multi-digit multiplication and division of whole numbers. Additionally, models and
prototype items concerning rational numbers (decimals, fractions, and percents) were reviewed,
and suggestions were made to pursue the development of items involving addition and
subtraction of rational numbers, as well as various representations of rational numbers. As with
the Algebra panel, members of the Number and Operations advisory group3 were asked to create
prototype items from their own research. Again, work began immediately following this two-day
meeting to create a bank of items measuring the Number and Operations domain.
From its inception, the ultimate goal of this project was to produce a set of test modules that
could be used to gauge growth in three mathematical domains: Algebra, Number/Operations, and
2 Maria Blanton, Bárbara M. Brizuela, Al Cuoco, Eric Knuth
3 Mindy S. Kalchman, Dick Lesh, Ed Silver, Tad Watanabe

6
Geometry/Measurement. However, in order to take the novel approach to assess students’
knowledge more deeply than traditional multiple-choice items generally allow, and still use a
machine-scorable format, the developers decided to move forward by creating five initial test
modules that included a mix of Number/Operations items and Algebra items. As noted below,
we reaffirmed this decision over the next several years of assessment development and piloting,
meaning that the eight forms we described above contain a mix of these three topic areas, and
report only one overall scale score for each student.
The initial five forms were piloted with nearly 200 students (93 from grade 4 and 99 from grade
5) at Florida State University School (FSUS). FSUS is a K-12 research school with a student
population demographically controlled to mirror the population of the entire state of Florida. By
choosing this school for pilot testing, a good balance of gender, racial/ethnic background, and
intellectual abilities4 of students was obtained. The following information provides some
specifics of this first round of pilot testing:
All five test modules were randomly administered to both grade 4 and grade 5 students.
The number of items on these modules ranged from a low of 34 to a high of 45.
All test modules were administered in the students’ classrooms by co-PI Judy Hickman
over a period of one week.
A series of sample items5 was given to students immediately prior to the administration
of the test modules.
Only eight students failed to complete the test modules in 45 minutes or less. Students
were allowed to leave items blank if they did not understand how to respond.
Ten fourth-grade students and ten fifth-grade students were individually interviewed
following the administration of the test modules (within 1 day) to gain insight into
students’ thinking about the items.
All students were encouraged to make comments on their test booklets concerning items
they liked, didn’t like, didn’t understand, were confused about, and so forth. All
comments were compiled and reviewed.
Following this initial round of pilot testing, items were revised and more items were written to
fill in gaps in development for the Number/Operations and Algebra domains. The next phase
involved moderate-scale field testing of test modules that followed a specific design. Four test
modules (Forms A, B, C, D) were constructed that were each 50 items6 in length. Items assessing
Number/Operations concepts made up roughly 60% of each form, while items assessing Algebra
concepts made up the remaining 40% of each form.
Several elementary schools in Leon County, Florida, were selected for field testing. Again, co-PI
Judy Hickman administered all the field tests over a two-week period in the Spring of 2010.
Having a single test administrator helped to ensure consistency in the conditions in which
4 IQ testing is administered to all enrollees at FSUS in order to control for intellectual variance.
5 Sample items were necessary to give students the opportunity to ask about how to respond to both grid-in type
items and “nested” item sets in which more than one answer could be correct. 6 While the sequencing on these tests indicates 50 items, the scoring will show 25–31 items because of the variance
in the number of “nested sets” of items on each test form. As shown in Figure 1, a single item may cross four
sequence numbers.
7
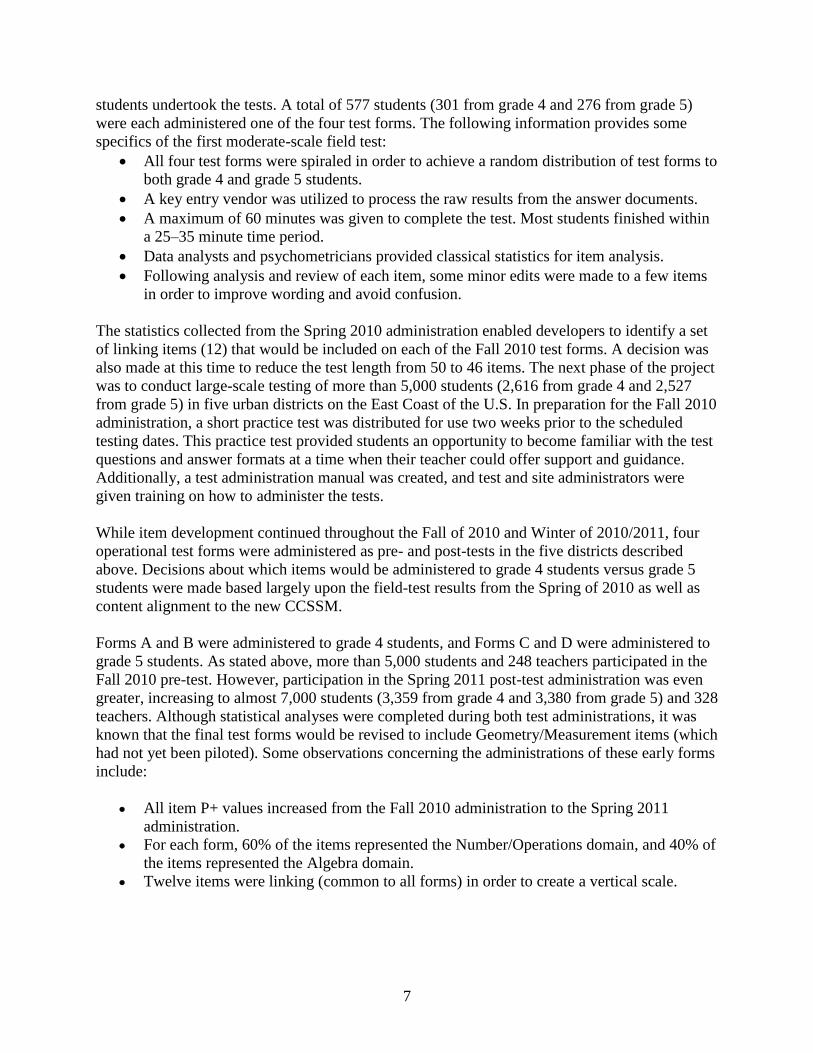
students undertook the tests. A total of 577 students (301 from grade 4 and 276 from grade 5)
were each administered one of the four test forms. The following information provides some
specifics of the first moderate-scale field test:
All four test forms were spiraled in order to achieve a random distribution of test forms to
both grade 4 and grade 5 students.
A key entry vendor was utilized to process the raw results from the answer documents.
A maximum of 60 minutes was given to complete the test. Most students finished within
a 25–35 minute time period.
Data analysts and psychometricians provided classical statistics for item analysis.
Following analysis and review of each item, some minor edits were made to a few items
in order to improve wording and avoid confusion.
The statistics collected from the Spring 2010 administration enabled developers to identify a set
of linking items (12) that would be included on each of the Fall 2010 test forms. A decision was
also made at this time to reduce the test length from 50 to 46 items. The next phase of the project
was to conduct large-scale testing of more than 5,000 students (2,616 from grade 4 and 2,527
from grade 5) in five urban districts on the East Coast of the U.S. In preparation for the Fall 2010
administration, a short practice test was distributed for use two weeks prior to the scheduled
testing dates. This practice test provided students an opportunity to become familiar with the test
questions and answer formats at a time when their teacher could offer support and guidance.
Additionally, a test administration manual was created, and test and site administrators were
given training on how to administer the tests.
While item development continued throughout the Fall of 2010 and Winter of 2010/2011, four
operational test forms were administered as pre- and post-tests in the five districts described
above. Decisions about which items would be administered to grade 4 students versus grade 5
students were made based largely upon the field-test results from the Spring of 2010 as well as
content alignment to the new CCSSM.
Forms A and B were administered to grade 4 students, and Forms C and D were administered to
grade 5 students. As stated above, more than 5,000 students and 248 teachers participated in the
Fall 2010 pre-test. However, participation in the Spring 2011 post-test administration was even
greater, increasing to almost 7,000 students (3,359 from grade 4 and 3,380 from grade 5) and 328
teachers. Although statistical analyses were completed during both test administrations, it was
known that the final test forms would be revised to include Geometry/Measurement items (which
had not yet been piloted). Some observations concerning the administrations of these early forms
include:
All item P+ values increased from the Fall 2010 administration to the Spring 2011
administration.
For each form, 60% of the items represented the Number/Operations domain, and 40% of
the items represented the Algebra domain.
Twelve items were linking (common to all forms) in order to create a vertical scale.

8
While all forms showed signs of a speededness issue7, the Spring rates of omission at the
end of the test were much reduced.
In the Fall administration, the test forms were alternated throughout the classroom.
Students who were administered Form A in the pre-test were assigned Form B in the
post-test (and vice versa). The same controls were put in place for Forms C and D.
Scale scores were assigned to students in order to show growth from the pre-test to the
post-test.
Students showed some difficulty in responding to the gridded-response items (high omit
rates), though this was less of an issue in the post-test administration.
o Gridded-response items presented a unique experience for most students.
o Greater emphasis was placed on making sure that teachers provided students with
the practice test before the Spring administration so students would know how to
properly respond to such item types.
Concurrent with the Spring 2011 operational administration, pilot testing of six new test modules
(Forms P, Q, S, V, W, and X) was conducted. These new modules included geometry items; the
last of the three advisory panels was convened in June of 2010, with panel members suggesting
prototype items and insights from their own work.8 Item development began following this
meeting, with the advantage that by that time, drafts of the CCSSM were available and could
play a role in the review process. By spring of 2011, these items were ready for pilot in Florida
schools. Co-PI Judy Hickman was again the test administrator. The modules were randomly
assigned and administered to 252 grade 4 students and 196 grade 5 students in May 2011. Each
module contained a mix of 46 Geometry/Measurement and Number/Operations items. Informal
interviews were conducted with more than 30 students immediately following the administration
of the pilot-test modules. The main takeaway from the interviews was that some
Geometry/Measurement concepts were not yet being taught in the schools. Since the CCSSM
were still relatively new at the time, it was not a surprising finding.
Statistics were compiled for the new Geometry/Measurement and Number/Operations items in
preparation for the compilation of the final eight test modules. While initially it was planned for
test modules to be constructed to measure each of the three domains separately, it was
determined that a better test design would be to keep all three domains together in the final test
modules. While the developers agreed that there is a potential use for testing a student’s
knowledge in each of these domains separately, it was decided to keep all three domains together
and report a single score per student. A factor in this decision was the possibility that while some
students would be administered a test containing more familiar Number/Operations topics, a
student who is administered a Geometry/Measurement test might be more prone to giving up
when faced with many items that test unfamiliar or challenging concepts.
Since individual item statistics are contained in the tables in the next section of this report,
researchers could of their own accord create mini-testlets in order to assess understanding in
these domains separately. Of course, such a change in the format of any test would need to come
7 A test is considered to exhibit “speededness” issues if there is evidence (omit rates greater than 5%) that students
are running out of time toward the end of the test. 8 Michael Battista, Jack Smith, Grayson Wheatley

9
with the usual disclaimer that statistics may not hold true for such a dramatic change in test
design.
The next step was to create a test blueprint for the final eight test modules. Because much of the
elementary mathematics curriculum is focused on the Number/Operations domain, a higher
percentage of test items was allocated to measure this content area than either the Algebra or
Geometry/Measurement domains. While slight variances occurred across the eight forms (due to
differences in the number of items and the available points of the “nested” sets), the approximate
percentage of items on each test form, by domain, is: Number/Operations 50%, Algebra 25%,
and Geometry/Measurement 25%. The linking set was also modified to reflect similar
percentages.
Relying upon the statistics from the 2010/2011 test forms, items were again evaluated to see
whether they were good candidates for inclusion on the final form. Some minor edits were made
to a few items—again, to make the items clearer for students. The result was eight test modules:
four modules (Forms F, G, H, and J) to be administered to grade 4 students, and four modules
(Forms K, L, and M, N) to be administered to grade 5 students. These forms contained between
26 and 29 items (counting “nested sets” as one item). These eight test modules were
administered in Fall 2011 to 3,265 grade 4 students and 2,963 grade 5 students, and then in
Spring 2012 to 3,080 grade 4 students and 2,840 grade 5 students (see below for more details on
the sample). As noted by the n-counts, some attrition occurred between the pre- and post-test
administrations. However, 84% of the classroom teachers enrolled in either the NCTE or Math
Solutions study since Fall 2010 were still part of the study in Spring 2012. Observations related
to these two operational administrations include:
As many grade 5 students as possible who had participated in the original administrations
in Fall 2010/Spring 2011 were included in the Fall 2011/Spring 2012 administrations in
order to evaluate the effectiveness of the vertical scale.
Spiraling of the test forms occurred during the administration of the pre-test, and care
was taken to make sure students did not receive the same form in the post-test
administration.
The reliabilities of the test forms range from a low of 0.82 to a high of 0.89.
Speededness was still an issue for all test forms, though lower rates of omits were
observed than when the original test modules were administered in Fall 2010/Spring
2011.
In summary, the result is that there are eight final test forms that are believed to be good
instruments for measuring student growth across the domains of Number/Operations, Algebra,
and Geometry/Measurement. These eight forms have been prepared for use and have answer
documents and keys. They are included in the final PDF packet of materials available from the
Harvard Graduate School of Education. A test administration manual and practice test are also
included in the packet of test materials. All of the materials can be reprinted for use for
educational purposes only, not for commercial ventures.
10
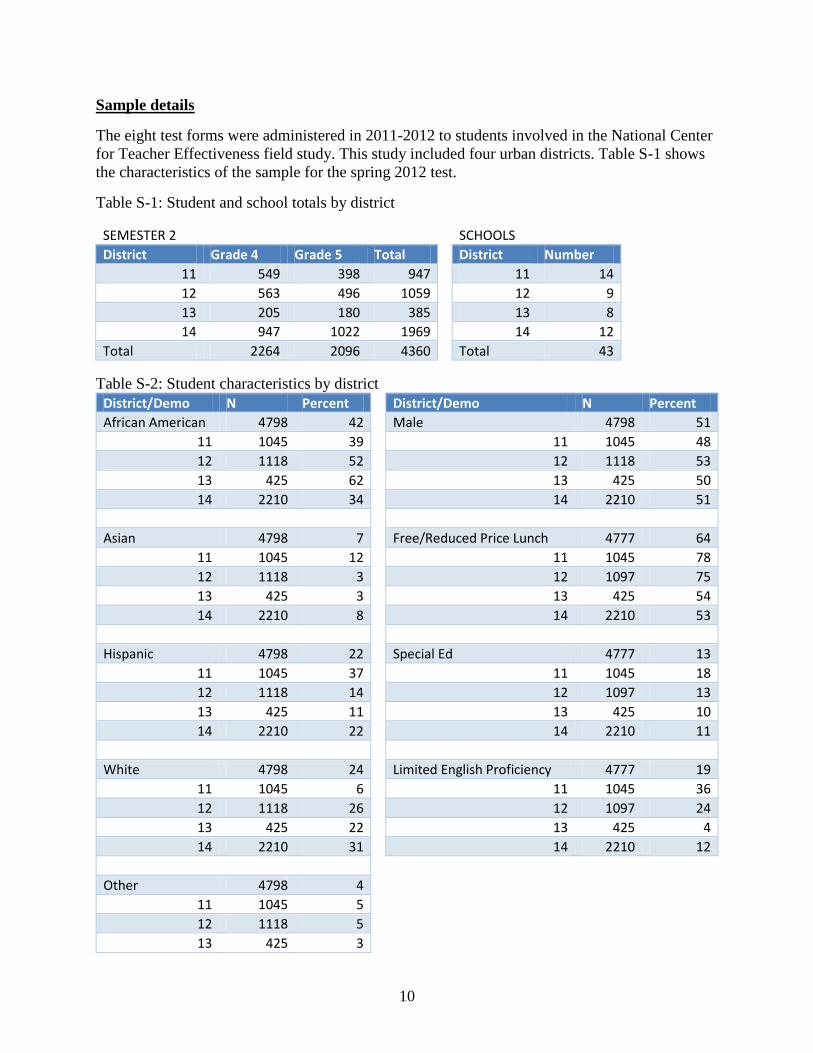
Sample details
The eight test forms were administered in 2011-2012 to students involved in the National Center
for Teacher Effectiveness field study. This study included four urban districts. Table S-1 shows
the characteristics of the sample for the spring 2012 test.
Table S-1: Student and school totals by district
SEMESTER 2 District Grade 4 Grade 5 Total
11 549 398 947
12 563 496 1059
13 205 180 385
14 947 1022 1969
Total 2264 2096 4360
SCHOOLS District Number
11 14
12 9
13 8
14 12
Total 43
Table S-2: Student characteristics by district
District/Demo N Percent
African American 4798 42
11 1045 39
12 1118 52
13 425 62
14 2210 34
Asian 4798 7
11 1045 12
12 1118 3
13 425 3
14 2210 8
Hispanic 4798 22
11 1045 37
12 1118 14
13 425 11
14 2210 22
White 4798 24
11 1045 6
12 1118 26
13 425 22
14 2210 31
Other 4798 4
11 1045 5
12 1118 5
13 425 3
District/Demo N Percent
Male 4798 51
11 1045 48
12 1118 53
13 425 50
14 2210 51
Free/Reduced Price Lunch 4777 64
11 1045 78
12 1097 75
13 425 54
14 2210 53
Special Ed 4777 13
11 1045 18
12 1097 13
13 425 10
14 2210 11
Limited English Proficiency 4777 19
11 1045 36
12 1097 24
13 425 4
14 2210 12

11
14 2210 4
Psychometric Analyses
Our psychometric analyses had three major goals:
1. Determine the characteristics of test items and forms
2. Equate forms to one another
3. Ensure vertical equating between test forms covering grades 4 and 5.
For the statistical analyses reported below, only the sample from the Spring 2012 administration
was used because items performed better in the Spring 2012 administration than in the Fall 2011
administration. We attribute the better item performance to the fact that test forms were designed
to cover material taught in each grade; using these test forms prior to students learning the
material likely increased measurement error. The following categories of students were
excluded from the calibration analyses: (a) those taking the same test forms in the Fall and
Spring administrations, and (b) those attempting fewer than 10 items. In all analyses, omitted
responses were treated as 0s, and not-reached responses were treated as missing.
Classical Item Statistics
To determine the characteristics of test items and forms, we conducted both classical test theory
analyses and Item Response Theory analyses. Tables 1–8 describe these classical test theory
statistics, including the sample size (N), mean, standard deviation, P+ value (mean/max possible
item score), omit rate, and not-reached rate for each item in the eight test forms, respectively. All
item statistics were within reasonable ranges except that all test forms appeared to have a
speededness issue, as the not-reached rates were quite high toward the end of the test for all
forms.

12
Table 1.
Grade 4 Form F: Item Statistics
Item ID N Mean SD P+
Polyserial
item-total
correlation
Omit rate
(%)
Not reached
rate (%)
HVD10130 716 .51 .50 .51 .59 .14 .00
HVD10017 716 1.29 .79 .65 .45 .70 .00
HVD90101 716 .78 .42 .78 .42 .42 .00
HVD10129 716 .69 .46 .69 .67 .00 .00
HVD90229 716 .15 .36 .15 .55 3.77 .00
HVD30055 716 .46 .50 .46 .74 3.35 .00
HVD10125 716 .72 .45 .72 .70 2.37 .14
HVD10325 716 .76 .43 .76 .70 .70 .28
HVD30066 716 .36 .48 .36 .24 1.40 .28
HVD30079 716 .69 .46 .69 .59 1.96 .28
HVD30056 716 .57 .50 .57 .46 1.12 .28
HVD30019 716 .66 .47 .66 .49 2.37 .56
HVD30085 716 .53 .50 .53 .59 1.68 .56
HVD10134 716 .94 .80 .47 .48 .84 1.12
HVD30050 716 .49 .77 .25 .54 2.23 1.54
HVD10021 716 .77 .81 .26 .69 1.26 2.79
HVD10119 716 .82 .39 .82 .67 .70 4.19
HVD10033 716 .60 .49 .60 .64 1.82 4.47
HVD30024 716 .80 .86 .40 .66 0.84 5.59
HVD90110 716 .58 .49 .58 .58 1.12 7.26
HVD10032 716 .42 .49 .42 .43 1.82 8.66
HVD90042 716 .38 .49 .38 .48 .42 9.64
HVD10123 716 .69 .46 .69 .64 2.23 10.89
HVD10091 716 .54 .50 .54 .61 .84 12.29
HVD30046 716 .37 .48 .37 .40 2.65 13.69
HVD30246 716 .39 .49 .39 .62 .28 14.53
HVD30346 716 .13 .33 .13 .68 .14 16.48
Note. P+ = mean/max possible item score.

13
Table 2.
Grade 4 Form G: Item Statistics
Item ID N Mean SD P+
Polyserial
item-total
correlation
Omit rate
(%)
Not reached
rate (%)
HVD10289 780 .77 .42 .77 .64 1.67 .00
HVD10017 780 1.23 .82 .62 .47 .38 .00
HVD90101 780 .76 .43 .76 .35 .51 .00
HVD10204 780 .78 .79 .39 .50 1.03 .00
HVD30004 780 .37 .48 .37 .64 2.56 .00
HVD10125 780 .67 .47 .67 .70 3.46 .00
HVD10325 780 .75 .43 .75 .71 .90 .00
HVD30066 780 .37 .48 .37 .33 2.18 .13
HVD10001 780 .77 .42 .77 .55 .51 .26
HVD30040 780 .50 .50 .50 .43 1.92 .64
HVD30081 780 .24 .43 .24 .20 2.18 1.03
HVD30085 780 .57 .50 .57 .60 1.28 1.03
HVD10134 780 .94 .79 .47 .51 1.28 1.15
HVD10019 780 1.10 .53 .55 .53 .13 1.28
HVD10107 780 .64 .48 .64 .73 3.21 1.67
HVD10307 780 .38 .49 .38 .70 3.33 2.31
HVD10407 780 .22 .42 .22 .58 3.85 2.82
HVD10507 780 .50 .50 .50 .44 3.08 2.95
HVD10119 780 .82 .39 .82 .62 1.28 3.33
HVD10033 780 .57 .49 .57 .64 1.92 3.97
HVD30018 780 .93 .77 .47 .53 .64 4.36
HVD30063 780 .18 .38 .18 .49 2.18 5.00
HVD10032 780 .38 .49 .38 .44 1.41 5.90
HVD90042 780 .36 .48 .36 .45 .51 7.44
HVD30036 780 .24 .43 .24 .46 2.31 8.85
HVD10091 780 .50 .50 .50 .57 .51 9.62
HVD30046 780 .34 .47 .34 .47 3.08 11.54
HVD30246 780 .45 .50 .45 .53 .64 13.33
HVD30346 780 .10 .30 .10 .63 .51 14.10
Note. P+ = mean/max possible item score.

14
Table 3.
Grade 4 Form H: Item Statistics
Item ID N Mean SD P+
Polyserial
item-total
correlation
Omit rate
(%)
Not reached
rate (%)
HVD30082 771 .52 .50 .52 .42 .91 .00
HVD10017 771 1.23 .80 .62 .54 .52 .00
HVD90101 771 .78 .41 .78 .39 .65 .00
HVD10047 771 1.32 .77 .66 .59 1.82 .00
HVD90229 771 .16 .37 .16 .60 5.58 .00
HVD30065 771 .46 .50 .46 .68 3.63 .00
HVD10125 771 .70 .46 .70 .73 2.98 .26
HVD10325 771 .77 .42 .77 .79 .78 .26
HVD30066 771 .38 .49 .38 .32 1.95 .26
HVD10040 771 1.24 .73 .41 .62 .00 .26
HVD30008 771 .66 .47 .66 .31 1.69 .52
HVD10134 771 1.02 .79 .51 .53 1.17 .52
HVD30042 771 .93 .88 .47 .72 1.17 .78
HVD30005 771 .14 .34 .14 .63 4.41 1.17
HVD10026 771 .39 .49 .39 .56 4.28 1.56
HVD30057 771 .12 .33 .12 .47 4.28 2.08
HVD30078 771 .23 .42 .23 .58 .91 2.33
HVD10119 771 .82 .38 .82 .62 1.69 2.46
HVD10033 771 .59 .49 .59 .68 1.17 3.11
HVD10102 771 .60 .63 .30 .35 .39 4.28
HVD30077 771 .53 .50 .53 .16 .39 5.58
HVD10032 771 .42 .49 .42 .37 1.56 7.65
HVD90042 771 .33 .47 .33 .38 .91 8.82
HVD10123 771 .73 .44 .73 .66 1.95 10.25
HVD10091 771 .50 .50 .50 .47 .39 10.89
HVD30046 771 .39 .49 .39 .54 2.08 12.19
HVD30246 771 .40 .49 .40 .59 .00 14.40
HVD30346 771 .12 .32 .12 .66 .00 15.69
Note. P+ = mean/max possible item score.

15
Table 4.
Grade 4 Form J: Item Statistics
Item ID N Mean SD P+
Polyserial
item-total
correlation
Omit rate
(%)
Not reached
rate (%)
HVD30083 785 .51 .50 .51 .53 1.02 .00
HVD10017 785 1.26 .82 .63 .58 .00 .00
HVD90101 785 .76 .43 .76 .49 .64 .00
HVD10100 785 1.35 .55 .68 .44 .51 .00
HVD30028 785 .59 .49 .59 .48 .76 .00
HVD30075 785 .69 .46 .69 .55 1.27 .00
HVD10125 785 .68 .47 .68 .70 3.31 .13
HVD10325 785 .76 .43 .76 .70 .64 .13
HVD30066 785 .35 .48 .35 .29 1.78 .13
HVD30039 785 .87 .84 .44 .66 3.06 .13
HVD10134 785 1.01 .80 .51 .58 1.15 .25
HVD30001 785 .51 .62 .26 .35 1.53 .76
HVD30005 785 .12 .33 .12 .75 5.86 2.04
HVD10014 785 .73 .45 .73 .52 1.78 2.29
HVD10314 785 .50 .50 .50 .69 3.31 2.80
HVD10414 785 .45 .50 .45 .53 3.57 3.57
HVD10119 785 .80 .40 .80 .63 .89 3.82
HVD10033 785 .58 .49 .58 .63 1.02 4.33
HVD10102 785 .51 .63 .26 .32 0.38 4.59
HVD30077 785 .46 .50 .46 .07 .76 5.35
HVD10032 785 .43 .50 .43 .49 1.53 6.24
HVD90042 785 .38 .49 .38 .43 .76 7.39
HVD10123 785 .70 .46 .70 .66 1.91 8.15
HVD10091 785 .50 .50 .50 .52 .76 8.79
HVD30046 785 .36 .48 .36 .50 3.06 11.21
HVD30246 785 .44 .50 .44 .58 .00 12.48
HVD30346 785 .13 .34 .13 .74 .00 14.39
Note. P+ = mean/max possible item score.

16
Table 5.
Grade 5 Form K: Item Statistics
Item ID N Mean SD P+
Polyserial
item-total
correlation
Omit rate
(%)
Not reached
rate (%)
HVD10131 700 .67 .47 .67 .70 .29 .00
HVD30035 700 .31 .46 .31 .54 .57 .00
HVD10037 700 .78 .79 .39 .63 .57 .00
HVD30095 700 .44 .50 .44 .52 .57 .00
HVD30027 700 .55 .50 .55 .59 1.43 .00
HVD30006 700 .46 .50 .46 .54 .71 .00
HVD30306 700 .10 .31 .10 .53 1.57 .00
HVD10125 700 .81 .39 .81 .62 2.00 .00
HVD10325 700 .86 .35 .86 .69 .00 .00
HVD30066 700 .53 .50 .53 .50 .43 .00
HVD30090 700 .47 .50 .47 .58 .43 .14
HVD30069 700 .57 .50 .57 .62 1.57 .29
HVD10203 700 .54 .50 .54 .46 .57 .29
HVD30031 700 .69 .46 .69 .61 1.00 .29
HVD10134 700 1.22 .82 .61 .53 .00 .57
HVD10043 700 .98 .77 .49 .67 .29 .86
HVD30255 700 .66 .47 .66 .70 .57 2.29
HVD30020 700 .21 .40 .21 .60 1.71 2.71
HVD30091 700 .45 .50 .45 .46 2.00 3.14
HVD10119 700 .84 .37 .84 .64 .57 4.00
HVD10033 700 .71 .46 .71 .72 1.14 4.43
HVD10011 700 1.02 .56 .51 .37 .43 5.00
HVD30043 700 .83 .89 .42 .63 .29 5.43
HVD30194 700 .67 .47 .67 .56 1.00 7.14
HVD10106 700 .50 .50 .50 .57 .29 7.57
HVD30046 700 .53 .50 .53 .64 1.86 8.29
HVD30246 700 .55 .50 .55 .52 .71 9.14
HVD30346 700 .34 .47 .34 .73 .43 9.43
HVD10026 700 .56 .50 .56 .63 .00 11.86
Note. P+ = mean/max possible item score.

17
Table 6.
Grade 5 Form L: Item Statistics
Item ID N Mean SD P+
Polyserial
item-total
correlation
Omit rate
(%)
Not reached
rate (%)
HVD90204 728 .73 .44 .73 .51 .27 .00
HVD30033 728 .37 .48 .37 .56 .00 .00
HVD30013 728 .95 .86 .48 .59 .55 .00
HVD10025 728 .51 .50 .51 .69 .00 .00
HVD30052 728 .35 .48 .35 .66 .82 .00
HVD10122 728 .72 .45 .72 .61 1.24 .00
HVD10322 728 .39 .49 .39 .57 2.47 .00
HVD10125 728 .80 .40 .80 .71 2.34 .14
HVD10325 728 .86 .34 .86 .72 .14 .14
HVD30066 728 .54 .50 .54 .50 .41 .27
HVD30049 728 .70 .46 .70 .58 .69 .41
HVD30041 728 .44 .50 .44 .72 .41 .55
HVD30030 728 .45 .50 .45 .49 .41 .69
HVD30080 728 .30 .46 .30 .42 1.24 .82
HVD10134 728 1.20 .80 .60 .56 .27 .82
HVD10023 728 2.02 .92 .67 .74 .00 .82
HVD10345 728 .49 .50 .49 .65 1.79 .96
HVD30022 728 .32 .47 .32 .52 1.37 1.65
HVD10118 728 .74 .44 .74 .73 1.37 2.34
HVD10119 728 .88 .32 .88 .65 .27 2.75
HVD10033 728 .66 .47 .66 .67 1.37 3.02
HVD10011 728 1.04 .57 .52 .39 .14 3.30
HVD30043 728 .89 .92 .45 .73 .41 3.98
HVD30063 728 .47 .50 .47 .51 .69 4.40
HVD10108 728 .37 .48 .37 .56 .14 4.95
HVD30046 728 .51 .50 .51 .58 1.92 5.49
HVD30246 728 .53 .50 .53 .57 .41 5.91
HVD30346 728 .28 .45 .28 .72 .55 6.46
HVD30017 728 .28 .45 .28 .62 .00 7.28
Note. P+ = mean/max possible item score.

18
Table 7.
Grade 5 Form M: Item Statistics
Item ID N Mean SD P+
Polyserial
item-total
correlation
Omit rate
(%)
Not reached
rate (%)
HVD10111 704 .63 .48 .63 .68 .00 .00
HVD30069 704 .51 .50 .51 .61 1.42 .00
HVD10132 704 1.36 .65 .45 .46 .14 .00
HVD30093 704 .32 .47 .32 .51 .28 .00
HVD10124 704 .54 .50 .54 .39 .99 .00
HVD10122 704 .77 .42 .77 .71 1.28 .00
HVD10322 704 .43 .50 .43 .68 2.41 .00
HVD10125 704 .80 .40 .80 .67 1.85 .00
HVD10325 704 .87 .33 .87 .70 .28 .00
HVD30066 704 .54 .50 .54 .47 .85 .00
HVD10029 704 1.20 .85 .60 .66 .71 .00
HVD10134 704 1.20 .83 .60 .63 .43 .43
HVD10043 704 .92 .75 .46 .66 .14 .57
HVD30060 704 .39 .49 .39 .67 1.42 1.28
HVD30016 704 .34 .47 .34 .49 1.28 1.42
HVD30174 704 .12 .33 .12 .60 1.70 1.56
HVD10119 704 .86 .35 .86 .53 .43 1.70
HVD10033 704 .71 .46 .71 .71 .99 1.85
HVD10011 704 1.03 .56 .52 .31 .14 1.85
HVD30047 704 .98 .58 .49 .54 .43 2.70
HVD30079 704 .77 .42 .77 .61 .85 3.69
HVD10106 704 .51 .50 .51 .46 .43 4.55
HVD30046 704 .52 .50 .52 .61 1.14 5.54
HVD30246 704 .54 .50 .54 .54 .43 5.54
HVD30346 704 .28 .45 .28 .67 .43 5.54
HVD90942 704 .36 .48 .36 .55 .00 7.24
Note. P+ = mean/max possible item score.

19
Table 8.
Grade 5 Form N: Item Statistics
Item ID N Mean SD P+
Polyserial
item-total
correlation
Omit rate
(%)
Not reached
rate (%)
HVD10012 691 .85 .35 .85 .57 .43 .00
HVD30074 691 .73 .44 .73 .55 .43 .00
HVD30032 691 1.06 .87 .53 .68 .29 .00
HVD30048 691 .73 .45 .73 .54 .58 .00
HVD30071 691 .47 .50 .47 .70 1.16 .00
HVD30006 691 .47 .50 .47 .58 .58 .00
HVD30306 691 .12 .33 .12 .66 1.59 .00
HVD10125 691 .79 .41 .79 .70 2.17 .00
HVD10325 691 .85 .36 .85 .71 .14 .00
HVD30066 691 .48 .50 .48 .52 .43 .00
HVD30025 691 .39 .49 .39 .58 .29 .00
HVD30088 691 .38 .48 .38 .51 .14 .00
HVD10203 691 .52 .50 .52 .40 .58 .00
HVD10024 691 .42 .49 .42 .38 1.45 .00
HVD10134 691 1.19 .81 .60 .56 .00 .14
HVD10023 691 2.01 .94 .67 .74 .29 .29
HVD10045 691 .34 .47 .34 .73 3.47 .72
HVD10086 691 .45 .50 .45 .68 4.78 1.16
HVD30062 691 .55 .50 .55 .47 .72 2.17
HVD10119 691 .85 .35 .85 .68 .72 2.32
HVD10033 691 .67 .47 .67 .71 .14 2.46
HVD10011 691 1.03 .57 .52 .43 .00 2.46
HVD30043 691 .76 .88 .38 .62 .43 2.75
HVD30090 691 .43 .50 .43 .56 1.01 3.62
HVD10108 691 .47 .50 .47 .55 .29 5.21
HVD30046 691 .53 .50 .53 .67 2.03 6.51
HVD30246 691 .54 .50 .54 .62 .43 6.80
HVD30346 691 .38 .49 .38 .74 .43 7.53
HVD30055 691 .50 .50 .50 .76 .00 9.55
Note. P+ = mean/max possible item score.
20
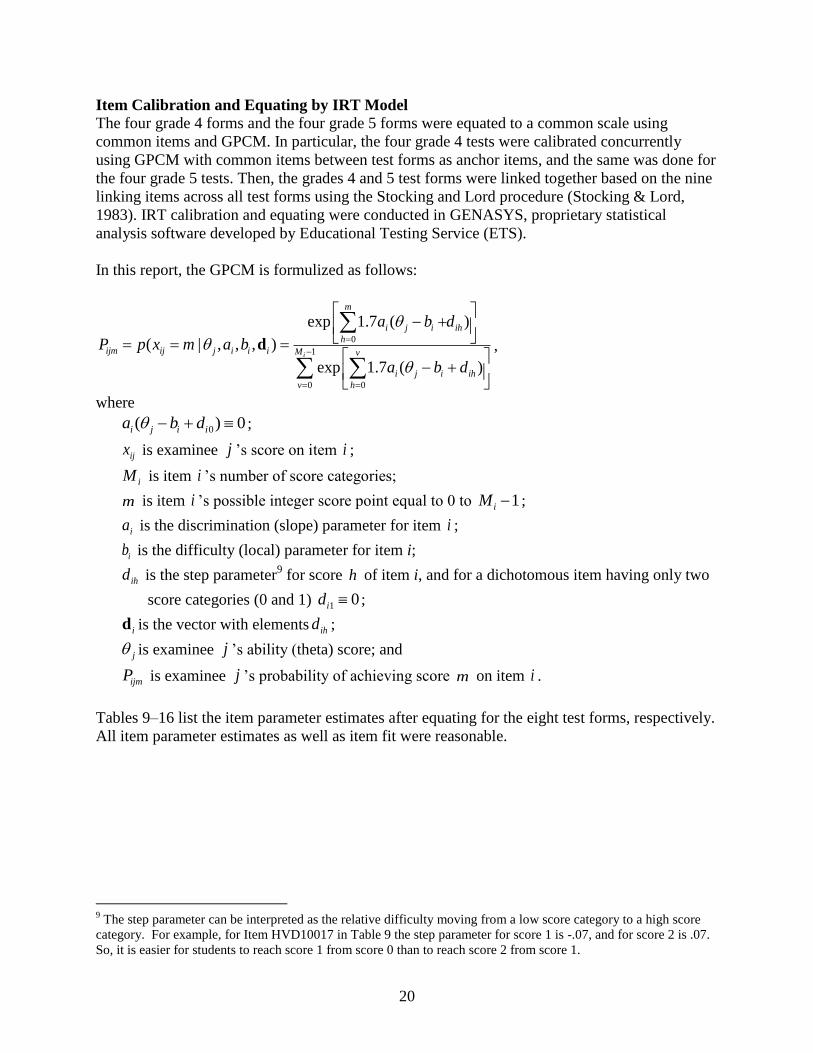
Item Calibration and Equating by IRT Model
The four grade 4 forms and the four grade 5 forms were equated to a common scale using
common items and GPCM. In particular, the four grade 4 tests were calibrated concurrently
using GPCM with common items between test forms as anchor items, and the same was done for
the four grade 5 tests. Then, the grades 4 and 5 test forms were linked together based on the nine
linking items across all test forms using the Stocking and Lord procedure (Stocking & Lord,
1983). IRT calibration and equating were conducted in GENASYS, proprietary statistical
analysis software developed by Educational Testing Service (ETS).
In this report, the GPCM is formulized as follows:
0
1
0 0
exp 1.7 ( )
( | , , , )
exp 1.7 ( )i
m
i j i ih
h
ijm ij j i i i M v
i j i ih
v h
a b d
P p x m a b
a b d
d ,
where
0( ) 0i j i ia b d ;
ijx is examinee j ’s score on item i ;
iM is item i ’s number of score categories;
m is item i ’s possible integer score point equal to 0 to 1iM ;
ia is the discrimination (slope) parameter for item i ;
ib is the difficulty (local) parameter for item i;
ihd is the step parameter9 for score h of item i, and for a dichotomous item having only two
score categories (0 and 1) 1 0id ;
id is the vector with elements ihd ;
j is examinee j ’s ability (theta) score; and
ijmP is examinee j ’s probability of achieving score m on item i .
Tables 9–16 list the item parameter estimates after equating for the eight test forms, respectively.
All item parameter estimates as well as item fit were reasonable.
9 The step parameter can be interpreted as the relative difficulty moving from a low score category to a high score
category. For example, for Item HVD10017 in Table 9 the step parameter for score 1 is -.07, and for score 2 is .07.
So, it is easier for students to reach score 1 from score 0 than to reach score 2 from score 1.

21
Table 9.
Grade 4 Form F: GPCM Item Parameter Estimates
Item ID
Discrimination
( ia )
Difficulty
( ib )
Step parameter
for score 1
( 1id )
Step parameter
for score 2
( 2id )
Step parameter
for score 3
( 3id )
Estimate SE Estimate SE Estimate SE Estimate SE Estimate SE
HVD10130 .69 .07 -.07 .07
HVD10017 .31 .02 -.82 .06 -.07 .10 .07 .08
HVD90101 .39 .03 -1.98 .15
HVD10129 .87 .09 -.77 .08
HVD90229 .72 .06 1.74 .11
HVD30055 1.19 .10 .10 .05
HVD10125 1.11 .05 -.70 .03
HVD10325 1.18 .06 -.93 .03
HVD30066 .23 .02 1.45 .17
HVD30079 .67 .08 -.90 .10
HVD30056 .46 .06 -.38 .11
HVD30019 .49 .06 -.89 .13
HVD30085 .72 .05 -.21 .05
HVD10134 .36 .02 .09 .04 .48 .07 -.48 .08
HVD30050 .37 .03 1.38 .12 -1.01 .17 1.01 .21
HVD10021 .74 .05 1.17 .05 1.35 .07 -.61 .11 -.74 .18
HVD10119 .92 .05 -1.19 .05
HVD10033 .89 .04 -.25 .03
HVD30024 .56 .04 .49 .06 -.25 .11 .25 .12
HVD90110 .73 .07 -.15 .07
HVD10032 .46 .03 .68 .06
HVD90042 .47 .03 .98 .07
HVD10123 .86 .05 -.55 .04
HVD10091 .63 .03 .20 .04
HVD30046 .56 .03 .93 .06
HVD30246 .75 .04 .56 .04
HVD30346 1.10 .07 1.76 .06

22
Table 10.
Grade 4 Form G: GPCM Item Parameter Estimates
Item ID Discrimination Difficulty
Step parameter
for score 1
( 1id )
Step parameter
for score 2
( 2id )
Estimate SE Estimate SE Estimate SE Estimate SE
HVD10289 .83 .09 -1.16 .10
HVD10017 .31 .02 -.82 .06 -.07 .10 .07 .08
HVD90101 .39 .03 -1.98 .15
HVD10204 .32 .03 .71 .11 .29 .16 -.29 .19
HVD30004 .82 .08 .48 .07
HVD10125 1.11 .05 -.70 .03
HVD10325 1.18 .06 -.93 .03
HVD30066 .23 .02 1.45 .17
HVD10001 .62 .07 -1.38 .14
HVD30040 .43 .05 .00 .10
HVD30081 .22 .04 3.20 .65
HVD30085 .72 .05 -.21 .05
HVD10134 .36 .02 .09 .04 .48 .07 -.48 .08
HVD10019 .61 .03 -.39 .07 1.93 .12 -1.93 .10
HVD10107 1.16 .11 -.47 .05
HVD10307 1.10 .10 .38 .05
HVD10407 .82 .08 1.19 .11
HVD10507 .48 .05 .04 .09
HVD10119 .92 .05 -1.19 .05
HVD10033 .89 .04 -.25 .03
HVD30018 .40 .04 .29 .08 .63 .12 -.63 .14
HVD30063 .57 .07 1.92 .21
HVD10032 .46 .03 .68 .06
HVD90042 .47 .03 .98 .07
HVD30036 .52 .06 1.62 .19
HVD10091 .63 .03 .20 .04
HVD30046 .56 .03 .93 .06
HVD30246 .75 .04 .56 .04
HVD30346 1.10 .07 1.76 .06

23
Table 11.
Grade 4 Form H: GPCM Item Parameter Estimates
Item ID
Discrimination
( ia )
Difficulty
( ib )
Step parameter
for score 1
( 1id )
Step parameter
for score 2
( 2id )
Step parameter
for score 3
( 3id )
Estimate SE Estimate SE Estimate SE Estimate SE Estimate SE
HVD30082 .39 .05 -.10 .12
HVD10017 .31 .02 -.82 .06 -.07 .10 .07 .08
HVD90101 .39 .03 -1.98 .15
HVD10047 .46 .04 -.82 .08 .34 .14 -.34 .11
HVD90229 .72 .06 1.74 .11
HVD30065 .92 .08 .18 .06
HVD10125 1.11 .05 -.70 .03
HVD10325 1.18 .06 -.93 .03
HVD30066 .23 .02 1.45 .17
HVD10040 .48 .02 -.18 .07 3.61 .20 -4.30 .25 .69 .28
HVD30008 .29 .05 -1.39 .26
HVD10134 .36 .02 .09 .04 .48 .07 -.48 .08
HVD30042 .59 .04 .17 .05 -.28 .10 .28 .10
HVD30005 1.08 .08 1.60 .07
HVD10026 .64 .07 .55 .09
HVD30057 .57 .08 2.41 .27
HVD30078 .75 .07 1.28 .11
HVD10119 .92 .05 -1.19 .05
HVD10033 .89 .04 -.25 .03
HVD10102 .25 .02 2.55 .15 1.71 .13 -1.71 .24
HVD30077 .13 .03 .60 .25
HVD10032 .46 .03 .68 .06
HVD90042 .47 .03 .98 .07
HVD10123 .86 .05 -.55 .04
HVD10091 .63 .03 .20 .04
HVD30046 .56 .03 .93 .06
HVD30246 .75 .04 .56 .04
HVD30346 1.10 .07 1.76 .06

24
Table 12.
Grade 4 Form J: GPCM Item Parameter Estimates
Item ID
Discrimination
( ia )
Difficulty
( ib )
Step parameter
for score 1
( 1id )
Step parameter
for score 2
( 2id )
Estimate SE Estimate SE Estimate SE Estimate SE
HVD30083 .56 .05 -.03 .08
HVD10017 .31 .02 -.82 .06 -.07 .10 .07 .08
HVD90101 .39 .03 -1.98 .15
HVD10100 .38 .02 -2.01 .11 2.76 .30 -2.76 .12
HVD30028 .49 .05 -.49 .10
HVD30075 .60 .06 -.93 .11
HVD10125 1.11 .05 -.70 .03
HVD10325 1.18 .06 -.93 .03
HVD30066 .23 .02 1.45 .17
HVD30039 .52 .04 .30 .06 .11 .10 -.11 .11
HVD10134 .36 .02 .09 .04 .48 .07 -.48 .08
HVD30001 .24 .03 2.82 .24 1.75 .19 -1.75 .37
HVD30005 1.08 .08 1.60 .07
HVD10014 .63 .07 -1.03 .11
HVD10314 .94 .08 .02 .06
HVD10414 .56 .06 .33 .09
HVD10119 .92 .05 -1.19 .05
HVD10033 .89 .04 -.25 .03
HVD10102 .25 .02 2.55 .15 1.71 .13 -1.71 .24
HVD30077 .13 .03 .60 .25
HVD10032 .46 .03 .68 .06
HVD90042 .47 .03 .98 .07
HVD10123 .86 .05 -.55 .04
HVD10091 .63 .03 .20 .04
HVD30046 .56 .03 .93 .06
HVD30246 .75 .04 .56 .04
HVD30346 1.10 .07 1.76 .06

25
Table 13.
Grade 5 Form K: GPCM Item Parameter Estimates
Item ID
Discrimination
( ia )
Difficulty
( ib )
Step parameter
for score 1
( 1id )
Step parameter
for score 2
( 2id )
Estimate SE Estimate SE Estimate SE Estimate SE
HVD10131 .80 .07 -.07 .08
HVD30035 .48 .05 1.95 .15
HVD10037 .42 .03 1.41 .08 .50 .13 -.50 .15
HVD30095 .43 .05 1.12 .12
HVD30027 .54 .05 .45 .10
HVD30006 .48 .04 .94 .07
HVD30306 .57 .05 3.39 .18
HVD10125 .83 .04 -.76 .05
HVD10325 .92 .05 -1.10 .06
HVD30066 .40 .02 .55 .06
HVD30090 .52 .04 1.04 .07
HVD30069 .58 .04 .51 .06
HVD10203 .32 .03 .50 .11
HVD30031 .60 .06 -.30 .11
HVD10134 .33 .01 .05 .05 .08 .09 -.08 .08
HVD10043 .52 .03 .89 .05 .88 .08 -.88 .08
HVD30255 .84 .07 .06 .08
HVD30020 .59 .07 2.52 .16
HVD30091 .39 .04 1.21 .13
HVD10119 .73 .04 -1.11 .07
HVD10033 .85 .04 -.05 .04
HVD10011 .29 .01 .73 .07 3.13 .11 -3.13 .11
HVD30043 .41 .01 1.23 .04 -.89 .09 .89 .10
HVD30194 .59 .05 .07 .10
HVD10106 .49 .04 .86 .07
HVD30046 .68 .03 .76 .04
HVD30246 .58 .03 .69 .04
HVD30346 .89 .04 1.64 .04
HVD10026 .71 .06 .74 .08

26
Table 14.
Grade 5 Form L: GPCM Item Parameter Estimates
Item ID
Discrimination
( ia )
Difficulty
( ib )
Step parameter
for score 1
( 1id )
Step parameter
for score 2
( 2id )
Step parameter
for score 3
( 3id )
Estimate SE Estimate SE Estimate SE Estimate SE Estimate SE
HVD90204 .46 .05 -.86 .17
HVD30033 .53 .05 1.41 .11
HVD30013 .34 .03 .82 .09 -.24 .17 .24 .17
HVD10025 .77 .07 .63 .07
HVD30052 .69 .06 1.43 .09
HVD10122 .73 .05 -.52 .07
HVD10322 .62 .04 1.15 .06
HVD10125 .83 .04 -.76 .05
HVD10325 .92 .05 -1.10 .06
HVD30066 .40 .02 .55 .06
HVD30049 .55 .05 -.47 .12
HVD30041 .87 .07 .92 .07
HVD30030 .40 .04 1.05 .12
HVD30080 .36 .04 2.28 .22
HVD10134 .33 .01 .05 .05 .08 .09 -.08 .08
HVD10023 .59 .03 -.38 .04 1.73 .13 -.52 .08 -1.21 .07
HVD10345 .68 .06 .77 .08
HVD30022 .46 .05 1.90 .15
HVD10118 .99 .09 -.30 .08
HVD10119 .73 .04 -1.11 .07
HVD10033 .85 .04 -.05 .04
HVD10011 .29 .01 .73 .07 3.13 .11 -3.13 .11
HVD30043 .41 .01 1.23 .04 -.89 .09 .89 .10
HVD30063 .47 .05 .97 .11
HVD10108 .52 .04 1.28 .08
HVD30046 .68 .03 .76 .04
HVD30246 .58 .03 .69 .04
HVD30346 .89 .04 1.64 .04
HVD30017 .62 .07 1.99 .12
27
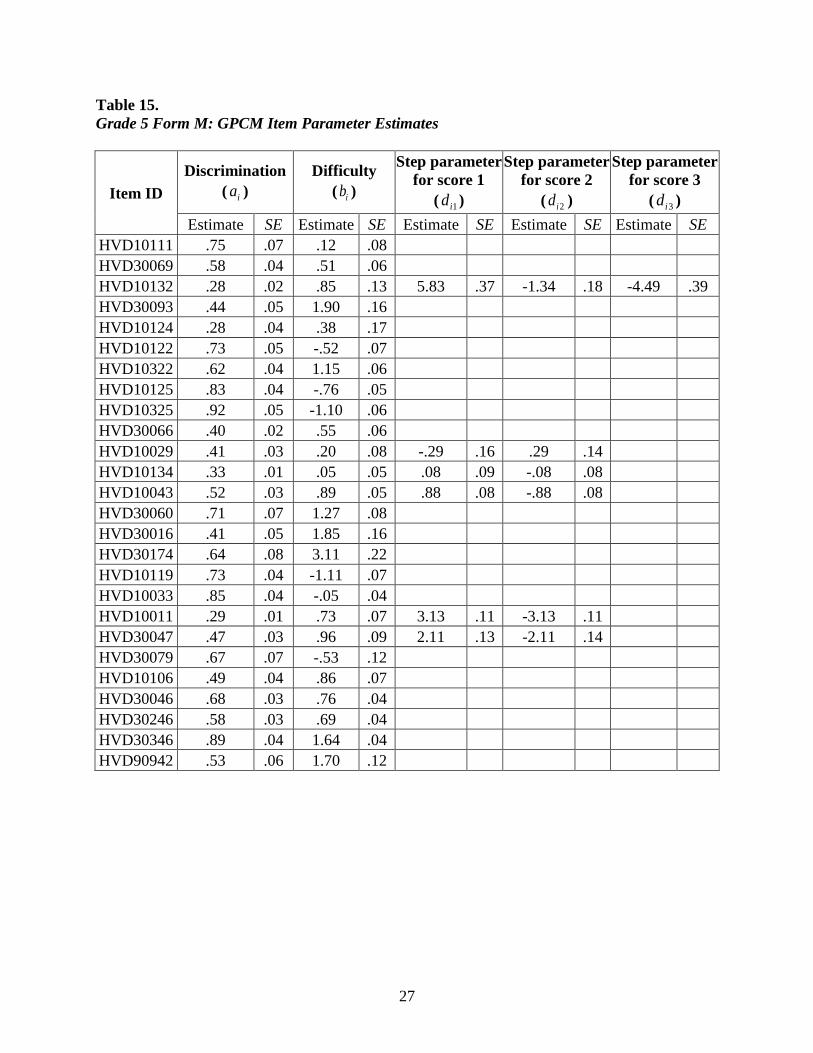
Table 15.
Grade 5 Form M: GPCM Item Parameter Estimates
Item ID
Discrimination
( ia )
Difficulty
( ib )
Step parameter
for score 1
( 1id )
Step parameter
for score 2
( 2id )
Step parameter
for score 3
( 3id )
Estimate SE Estimate SE Estimate SE Estimate SE Estimate SE
HVD10111 .75 .07 .12 .08
HVD30069 .58 .04 .51 .06
HVD10132 .28 .02 .85 .13 5.83 .37 -1.34 .18 -4.49 .39
HVD30093 .44 .05 1.90 .16
HVD10124 .28 .04 .38 .17
HVD10122 .73 .05 -.52 .07
HVD10322 .62 .04 1.15 .06
HVD10125 .83 .04 -.76 .05
HVD10325 .92 .05 -1.10 .06
HVD30066 .40 .02 .55 .06
HVD10029 .41 .03 .20 .08 -.29 .16 .29 .14
HVD10134 .33 .01 .05 .05 .08 .09 -.08 .08
HVD10043 .52 .03 .89 .05 .88 .08 -.88 .08
HVD30060 .71 .07 1.27 .08
HVD30016 .41 .05 1.85 .16
HVD30174 .64 .08 3.11 .22
HVD10119 .73 .04 -1.11 .07
HVD10033 .85 .04 -.05 .04
HVD10011 .29 .01 .73 .07 3.13 .11 -3.13 .11
HVD30047 .47 .03 .96 .09 2.11 .13 -2.11 .14
HVD30079 .67 .07 -.53 .12
HVD10106 .49 .04 .86 .07
HVD30046 .68 .03 .76 .04
HVD30246 .58 .03 .69 .04
HVD30346 .89 .04 1.64 .04
HVD90942 .53 .06 1.70 .12

28
Table 16.
Grade 5 Form N: GPCM Item Parameter Estimates
Item ID
Discrimination
( ia )
Difficulty
( ib )
Step parameter
for score 1
( 1id )
Step parameter
for score 2
( 2id )
Step parameter
for score 3
( 3id )
Estimate SE Estimate SE Estimate SE Estimate SE Estimate SE
HVD10012 .54 .08 -1.65 .25
HVD30074 .51 .05 -.72 .15
HVD30032 .46 .03 .54 .07 -.15 .14 .15 .13
HVD30048 .48 .05 -.74 .16
HVD30071 .76 .07 .83 .08
HVD30006 .48 .04 .94 .07
HVD30306 .57 .05 3.39 .18
HVD10125 .83 .04 -.76 .05
HVD10325 .92 .05 -1.10 .06
HVD30066 .40 .02 .55 .06
HVD30025 .50 .05 1.38 .12
HVD30088 .40 .04 1.59 .15
HVD10203 .32 .03 .50 .11
HVD10024 .27 .04 1.45 .20
HVD10134 .33 .01 .05 .05 .08 .09 -.08 .08
HVD10023 .59 .03 -.38 .04 1.73 .13 -.52 .08 -1.21 .07
HVD10045 .80 .07 1.47 .08
HVD10086 .73 .07 .97 .08
HVD30062 .40 .04 .44 .13
HVD10119 .73 .04 -1.11 .07
HVD10033 .85 .04 -.05 .04
HVD10011 .29 .01 .73 .07 3.13 .11 -3.13 .11
HVD30043 .41 .01 1.23 .04 -.89 .09 .89 .10
HVD30090 .52 .04 1.04 .07
HVD10108 .52 .04 1.28 .08
HVD30046 .68 .03 .76 .04
HVD30246 .58 .03 .69 .04
HVD30346 .89 .04 1.64 .04
HVD30055 .96 .08 .90 .07

29
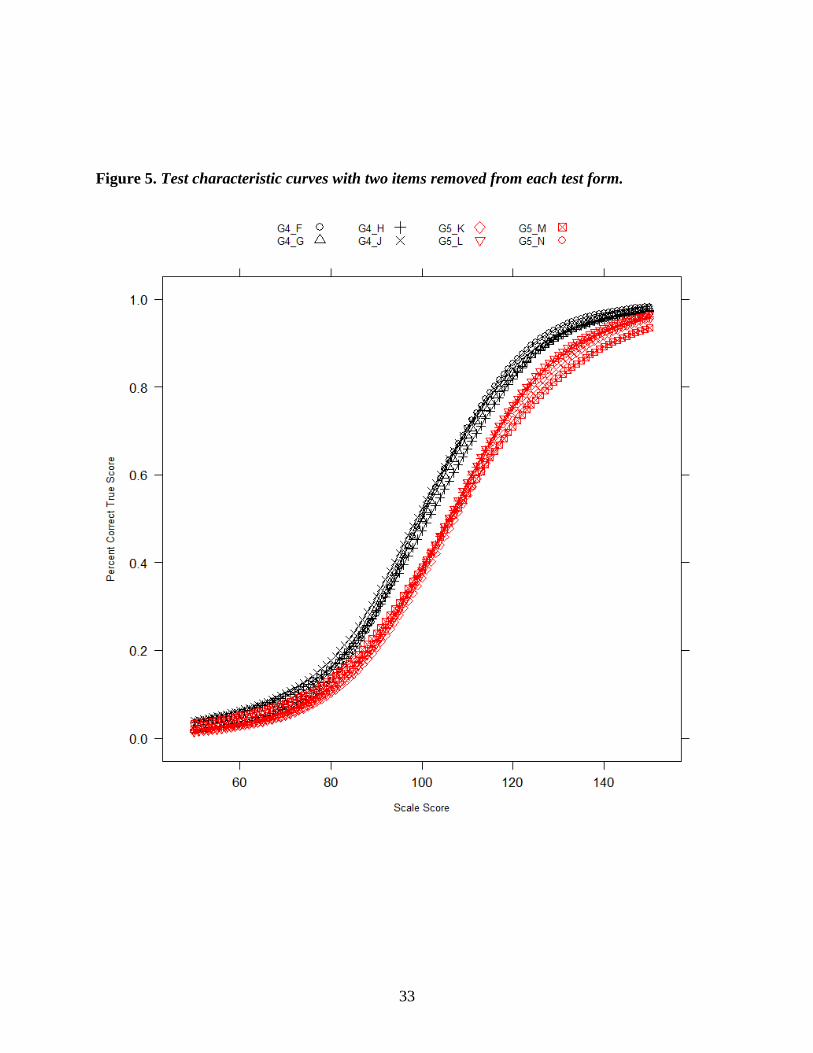
Raw Score to Scale Score Conversion Tables
In creating raw score to scale score conversion tables, it was found that removing two difficult
items from each grade 4 form and two easy items from each grade 5 forms would increase scale
separation between grades 4 and 5 test forms and improve the face validity of the vertical scale
across grades 4 and 5. In addition, shortening the test should help to mitigate the apparent
speededness issue of each original test form. Table 17 lists the items removed from each form as
well as their item statistics. Note that the criterion for removing items was primarily based on
item difficulty parameter estimates.
Table 18 compares the reliabilities (Cronbach’s alpha) for each test form with all items included
and with two items removed. The reliabilities were virtually the same for each test form;
therefore, removing items had a negligible effect on test reliabilities. Table 19 compares the
means of item discrimination and difficulty parameter estimates for each test form with all items
included and with two items removed. It shows that within-grade test forms were more similar
than across-grade test forms in terms of item parameter estimates, as the means of item
discrimination and difficulty parameter estimates were closer among within-grade test forms
than across-grade test forms. Removing two items from each form did widen the gap of test
difficulties between grades 4 and 5 test forms, as evidenced by the fact that the overall mean
difference of difficulty parameter estimates between grades 4 and 5 increased from 0.38 with all
items included to 0.66 with two items removed from each form. The increasing differences of
test difficulties between grades 4 and 5 test forms are also easily seen in the test characteristic
curves (TCC; see Figures 4 and 5 for test forms with all items included and with two items
removed from each form, respectively). The TCC plots draw scale scores against expected
percents correct of IRT true scores for each test form10
; for a given scale score, an examinee gets
higher percent correct of IRT true score for an easy test than for a hard test.
Table 20 shows the raw score to scale score conversion tables for all eight test forms with two
items removed from each form. A scoring table includes raw scores, the corresponding IRT scale
scores, and their standard errors. Note that scale scores were predefined to have a population
mean of 100 and standard deviation of 10 in grade 4.
10
That percents correct of IRT true scores rather than IRT true scores were used in the TCC plots is to facilitate the
comparisons among different test forms because they have different maximum total raw scores (hence, different
maximum IRT true scores).

30
Table 17.
Items Removed in Creating Scoring Tables
Form
First Item Removed Second Item Removed
Harvard
ID
Discri
mination
Diffi
culty
P+
value
Max
score
Harvard
ID
Discri
mination
Diffi
culty
P+
value
Max
score
F HVD90229 .72 1.74 .15 1 HVD30050 .37 1.38 .25 2
G HVD30081 .22 3.20 .24 1 HVD30063 .57 1.92 .18 1
H HVD10102 .25 2.55 .30 2 HVD30057 .57 2.41 .12 1
J HVD30001 .24 2.82 .26 2 HVD10102 .25 2.55 .26 2
K HVD30031 .60 -.30 .69 1 HVD10131 .80 -.07 .67 1
L HVD90204 .46 -.86 .73 1 HVD10122 .73 -.52 .72 1
M HVD30079 .67 -.53 .77 1 HVD10122 .73 -.52 .77 1
N HVD10012 .54 -1.65 .85 1 HVD30048 .48 -.74 .73 1
Table 18.
Comparison of Reliabilities (Cronbach’s Alpha)
Form All items Two items removed
F 0.85 0.84
G 0.83 0.83
H 0.82 0.82
J 0.82 0.83
K 0.87 0.86
L 0.89 0.88
M 0.85 0.84
N 0.88 0.88

31
Table 19.
Comparison of Mean Item Discrimination and Difficulty Parameter Estimates
Grade Form All items Two items removed
Discrimination Difficultya
Discrimination Difficultya
4
F .68 .16 .69 .02
G .65 .20 .67 .06
H .62 .27 .64 .07
J .62 .21 .64 -.13
Total .64 .21 .66 .01
5
K .58 .71 .57 .77
L .61 .54 .61 .61
M .58 .63 .57 .70
N .58 .50 .58 .61
Total .59 .59 .58 .67 a
Weighted mean of item difficulty parameter estimates by maximum item scores.

32
Figure 4. Test characteristic curves with all items included.
33
Figure 5. Test characteristic curves with two items removed from each test form.

34
Table 20.
Raw Score to Scale Score Conversion Table with Two Items Removed from Each Form
Raw
scores
Form F Form G Form H Form J Form K Form L Form M Form N
Scale
score CSEM
Scale
score CSEM
Scale
score CSEM
Scale
score CSEM
Scale
score CSEM
Scale
score CSEM
Scale
score CSEM
Scale
score CSEM
0 40 24 40 22 40 21 40 22 45 23 45 21 45 22 45 21
1 61 13 57 14 47 18 46 19 62 14 62 13 49 20 59 14
2 71 8 67 9 61 12 62 12 73 9 72 9 66 12 70 9
3 76 7 73 7 70 9 70 9 79 7 78 7 74 8 76 7
4 80 5 77 6 75 7 76 7 83 6 82 6 79 7 80 6
5 83 5 80 5 79 6 80 6 86 5 85 5 83 6 84 6
6 85 4 83 5 83 5 83 5 89 5 87 5 86 5 87 5
7 87 4 85 4 85 5 85 5 91 5 90 4 89 5 89 5
8 89 4 87 4 88 4 87 4 93 4 92 4 91 5 91 5
9 91 4 89 4 90 4 89 4 95 4 94 4 94 5 93 4
10 92 4 91 4 91 4 91 4 97 4 96 4 96 5 95 4
11 94 3 92 4 93 4 93 4 99 4 97 4 98 4 97 4
12 95 3 94 4 95 4 95 4 101 4 99 4 100 4 99 4
13 97 3 96 4 97 4 96 4 102 4 101 4 102 4 101 4
14 98 3 97 4 98 4 98 4 104 4 102 4 104 4 102 4
15 100 3 99 4 100 4 100 4 106 4 104 4 106 4 104 4
16 101 4 100 4 101 4 101 4 107 4 105 4 107 4 105 4
17 103 4 102 4 103 4 103 4 109 4 107 4 109 4 107 4
18 104 4 103 4 105 4 105 4 110 4 108 4 111 5 108 4
19 106 4 105 4 106 4 107 4 112 4 110 4 113 5 110 4
20 108 4 106 4 108 4 109 4 114 4 111 4 115 5 111 4
21 110 4 108 4 110 4 111 4 116 4 113 4 118 5 113 4
22 112 4 110 4 112 4 113 5 118 5 114 4 120 5 115 4
23 114 4 112 4 113 4 116 5 120 5 116 4 123 5 116 4
24 116 5 114 4 115 4 119 5 122 5 118 4 125 6 118 4
25 118 5 116 5 117 4 122 6 124 5 120 5 128 6 120 5
26 121 5 118 5 120 5 126 7 127 6 122 5 132 7 122 5
27 125 6 121 5 122 5 132 9 130 6 124 5 137 8 125 5
28 130 8 124 6 125 6 145 17 134 7 127 6 142 9 128 6
29 139 13 128 7 129 7 160 26 138 8 131 7 150 12 132 7
30 160 24 134 9 134 9
144 10 135 8 164 18 136 8
31
145 15 146 16
155 14 141 10 170 21 143 10
32
160 22 160 25
170 20 153 15
155 15
33
170 23
170 22
Note. CSEM = conditional standard error of measurement.

35
Validity
The main goal of student assessment development was to produce an instrument that would be
sensitive to teachers’ MKT. In a study conducted by the National Center for Teacher
Effectiveness, value-added scores constructed from these assessments did significantly correlate
with teachers’ MKT (r=0.15, significant at p<0.01, n=288). This correlation was higher than
between MKT and value-added estimates constructed from state assessments (r=0.06, p < 0.32,
n=291).
Student outcomes, as measured by this assessment, also correlated with other related constructs
of interest. The correlation between performance on the NCTE test and the state test, where both
tests were taken by our sample in the spring of 2012, is 0.69. The correlation between teacher
value-added scores constructed with NCTE and state tests is 0.51. Table 20 shows the
relationship between other key predictors and 2012 spring student outcomes on the this test,
controlling for fall achievement, their demographic characteristics, peer and school aggregates,
and district fixed effects. Each coefficient is entered into the model separately, but combined for
presentation.
Regression Coefficients, Controlling for Student Prior Achievement, Demographics, Peer and School aggregates, District fixed effects, and Teacher Clustering
Outcome: Student's 2012 spring test score
Predictors Regression Coefficient p-value
2012 State Math Test Score 0.51 0
Student Reports of Efficacy and Perseverance in mathematics 0.097 0
Student Reports of Happiness and Love of Math 0.08 0
Student Reports of Problem Behavior -0.048 0
Student Score on Bullying Construct -0.033 0.003
Student's Teacher's Richness 0.04 0.1
Student's Teacher's Working With Student Ideas 0.055 0.002
Student's Teacher's MQI-T Score 0.045 0.006
Outcomes on the spring NCTE test are associated with students’ spring score on the state math
test; their own reports of efficacy and perseverance in math, and their love of math. Student
performance in spring is negatively related to reports of problem behavior and bullying within
their classroom. Student performance on the spring NCTE test is also predicted by an
observational measure of the extent to which teachers work with student ideas, and an
observational measure of the mathematical quality of instruction (MQI-T). Teacher richness, in
the sense that instruction is focused on mathematical meaning or practices, is marginally
significantly related to students’ spring outcomes on the NCTE test.

36
References
Muraki, E. (1992). A generalized partial credit model: Application of an EM algorithm. Applied
Psychological Measurement, 16, 159–176.
Stocking, M. L., & Lord, F. (1983). Developing a common metric in item response theory.
Applied Psychological Measurement, 7, 201–210.