technical report on the mel zinc-lead-barite...
TRANSCRIPT

TECHNICAL REPORT
ON THE
MEL ZINC-LEAD-BARITE PROPERTY
WATSON LAKE MINING DISTRICT SOUTHEAST YUKON
NTS Map 95D/6
60˚23’ North Latitude; 127˚20’ West Longitude
PREPARED FOR:
BENZ MINING CORP.
606 – 909 Burrard Street
Vancouver, British Columbia, V6Z 2N2
BY
H. Leo King, P. Geo. H. LEO KING & ASSOCIATES INC.
3633 Somerset Cres. Surrey, B.C.
AND
G. H. Giroux, P. Eng., M.A.Sc.
GIROUX CONSULTANTS LTD. 982 Broadview Dr.
North Vancouver, B.C. V7H 2G1
Effective Date: March 20, 2017

Page | i
Table of Contents Page
1.0 Summary ....................................................................................................................................... 1
1.1 Geology and Mineralization .................................................................................................. 1
1.2 History and Exploration ......................................................................................................... 2
1.3 Historical Metallurgical Test Work......................................................................................... 3
1.4 Mineral Resource Estimates ................................................................................................. 3
1.5 Barite Marketing Studies ....................................................................................................... 4
1.6 Interpretation and Conclusions ............................................................................................. 5
1.7 Recommendations ................................................................................................................ 6
2.0 Introduction .................................................................................................................................... 6
3.0 Reliance on Other Experts ............................................................................................................ 7
4.0 Property Location and Description ................................................................................................ 7
5.0 Accessibility, Climate, Local Resources, Infrastructure and Physiography .................................. 9
6.0 History ......................................................................................................................................... 10
6.1 Historical Resource Estimates ............................................................................................ 20
6.2 Historical Metallurgical Test Work....................................................................................... 21
6.3 Barite Marketing Studies ..................................................................................................... 22
7.0 Geological Setting and Mineralization ......................................................................................... 23
7.1 Geological Setting ............................................................................................................... 23
7.2 Mineralization ...................................................................................................................... 25
7.2.1 Mel Main Zone ............................................................................................................... 26
7.2.2 Jeri Zone ........................................................................................................................ 26
7.2.3 Jeri North Zone .............................................................................................................. 27
7.2.4 Mel East Zone ................................................................................................................ 28
8.0 Deposit Type .............................................................................................................................. 28
9.0 Exploration .................................................................................................................................. 29
10.0 Drilling ....................................................................................................................................... 29
11.0 Sample Preparation, Analysis and Security ................................................................................ 29
12.0 Data Verification .......................................................................................................................... 29
13.0 Mineral Processing and Metallurgical Testing ............................................................................ 30
14.0 Mineral Resource Estimates ....................................................................................................... 30
14.1 Introduction ...................................................................................................................... 30
14.2 Geological Solid ............................................................................................................... 30
14.3 Data Analysis ................................................................................................................... 32
14.4 Composites ...................................................................................................................... 36

Page | ii
cont./Table of Contents Page
14.5 Variography...................................................................................................................... 37
14.6 Block Model ..................................................................................................................... 38
14.7 Bulk Density ..................................................................................................................... 40
14.8 Grade Interpolation .......................................................................................................... 41
14.9 Classification .................................................................................................................... 42
14.10 Model Verification ............................................................................................................ 49
15.0 Market Studies ............................................................................................................................ 54
16.0 Environmental Studies, Permitting and Social or Community Impact......................................... 54
17.0 Adjacent Properties ..................................................................................................................... 54
18.0 Other Relevant Data and Information ......................................................................................... 54
19.0 Interpretation and Conclusions ................................................................................................... 55
20.0 Recommendations ...................................................................................................................... 57
21.0 References .................................................................................................................................. 62
22.0 Certificates of Authors
22.1 Certificate and Consent of H. Leo King .............................................................................. 65
22.2 Certificate and Consent of G. H. Giroux ............................................................................. 66
Illustrations
Fig. 4.1 Location Map .................................................................................................... after page 7
Fig. 4.2 Claim Location .................................................................................................. after page 7
Fig. 6.1 Mel Main Zone Compilation ............................................................................ after page 10
Fig. 6.2 Jeri Zone Compilation .................................................................................... after page 10
Fig. 6.3 Jeri North Zone Compilation ........................................................................... after page 10
Fig. 6.4 Mel East Zone Compilation ............................................................................ after page 10
Fig. 6.5 Drill Section through Mel Main Zone ............................................................... after page 17
Fig. 6.6 Jeri North Zone – Pb and Zn in soils .............................................................. after page 20
Fig. 7.1 Tectonic Setting ............................................................................................... after page 23
Fig. 7.2 Regional Geology ............................................................................................ after page 23
Fig. 7.3 Regional Cross Sections ................................................................................. after page 23
Fig. 7.4 Property Geology and Mineralization ............................................................. after page 25
Fig. 7.5 Comparative Stratigraphic Sections at Mineral Zones .................................... after page 26
Fig. 7.6 Longitudinal Section of Grade X Thickness Contours – Mel Main Zone......... after page 26
Fig. 14.1 Isometric view looking W showing Mineralized Solid in red, Barite Shell in blue, surface topography, overburden surface & drill hole traces ............. 31
Fig. 14.2 Isometric view looking NW showing Mineralized Solid in red, Barite Shell in blue, surface topography, overburden surface & drill hole traces ............. 31
Fig. 14.3 Scatter Plots for Original Assays versus Duplicates ......................................................... 33
Fig. 14.4 Lognormal cumulative frequency plot for Zn in Mineralized Solid ..................................... 35

Page | iii
cont./Table of Contents Page
Fig. 14.5 View looking NW showing block model with overburden in brown, Mineralized Solid in red, Barite Shell in blue and drill hole traces ................................................................. 39 Fig. 14.6 Scatter plot of Lab SG vs Combined Pb + Zn + Ba% ....................................................... 40
Fig. 14.7 Long sections showing estimated Zn, Pb and Ba% blocks colour coded by grade ......... 46
Fig. 14.8 Section 10100N showing composites and estimated Zn blocks ....................................... 50
Fig. 14.9 Section 10000N showing composites and estimated Zn blocks ....................................... 50
Fig. 14.10 Section 9900N showing composites and estimated Zn blocks ......................................... 52
Fig. 14.11 Section 9800N showing composites and estimated Zn blocks ......................................... 53
Tables
Table 1.1 Mel Main Zone – Inferred Resource within Mineralization Solid using a
Zn Equivalent cut-off ........................................................................................................... 3
Table 4.1 Mel Property – Claim Status ................................................................................................ 7
Table 6.1 Historical Exploration Work ............................................................................................... 12
Table 6.2 Historical Mineral Resource Estimates ............................................................................. 21
Table 7.1 Regional Lithological Units ................................................................................................ 24
Table 14.1 Original Assays compared with Duplicate ¼ Core Assays ............................................... 32
Table 14.2 Assay Statistics sorted by Geological Domains ................................................................ 34
Table 14.3 Zinc Populations within Mineralized Solids ....................................................................... 34
Table 14.4 Capping Levels for each Domain ...................................................................................... 35
Table 14.5 Capped Assay Statistics for all Domains .......................................................................... 36
Table 14.6 Composite Statistics for all Domains ................................................................................. 37
Table 14.7 Semivariogram Parameters for all Variables in all Domains ............................................. 38
Table 14.8 Ordinary Kriging Parameters for Zinc in all Domains ........................................................ 41
Table 14.9 Mel Main Zone – Inferred Resource within Mineralized Solid using a Zn cut-off .............. 45
Table 14.10 Mel Main Zone – Inferred Resource within Mineralized Solid using a Zn Equivalent
cut-off ................................................................................................................................. 47
Table 14.11 Mel Main Zone – Inferred Barite Resource Above 700 meter Elevation ........................... 48
Table 14.12 Mel Main Zone – Inferred Resource within Mineralized Solid using a Zn Equivalent cut-off above 700 meter level ........................................................ 48
Table 14.13 Comparison of composites vs estimated blocks ............................................................... 49
Table 20.1 Proposed Budget for Phase 1 Exploration at Mel Property .............................................. 58
Table 20.2 Proposed Budget for Phase 2 Exploration at Mel Property …..…………………………… 61
Appendices
Appendix I Listing of all Drill Holes
Appendix II List of Significant Intercepts
Appendix III Semi-variogram Models ........................................................................................................

Page | 1
1.0 SUMMARY
Benz Mining Corp. (“Benz”) retained H. Leo King & Associates Inc. and Giroux
Consultants Ltd. to complete a National Instrument 43-101 (“NI 43-101”) Technical Report for
the purpose of supplying updated summary information on the Mel property as well as providing
a current resource estimate for the Mel Main Zone and making recommendations for further
exploration.
This Technical Report was written in compliance with the disclosure and reporting
requirements set forth in the Canadian Securities Administrator’s NI 43-101, Companion Policy
43-101 CP and Form 43-101 F1.
This Technical Report provides a current independent resource estimate for the Mel
Main Zone, which is the most advanced of four exploration targets on the Mel property. No
drilling has been completed on the Property since the issue of the 2014 NI 43-101 technical
report for Silver Range (King and Giroux, 2014), and therefore this resource is still current. The
zinc equivalent cut-off used for resource reporting has been adjusted to reflect current metal
price forecasts.
The Mel property is located in southeast Yukon and consists of 576 mineral claims.
Benz has the option to purchase 100% interest in the Property, which is subject only to two (2),
1% net smelter return royalties. One of the royalties is limited to metals only, and the other
royalty can be bought out for a cash payment of $1 million.
The mineral claims comprising the Mel property are referred to as the “Property”
throughout this Technical Report. The Property encompasses an area of 11,451 hectares and
is located 80 kilometers east-northeast of the town of Watson Lake. The Property extends 47
km south from the main exploration targets to the Alaska Highway, following the route of a
proposed haulage road.
1.1 GEOLOGY AND MINERALIZATION
The Property is underlain by a Cambrian to Ordovician-age sequence of marine
sediments with minor coeval volcanic rocks, which host stratabound zinc-lead-barite
mineralization. The host stratigraphy is broadly folded into a north-trending overturned syncline.
This synclinal structure has been disrupted by north and northeast-trending faults having both
vertical and lateral displacements.
Four zones of zinc-rich mineralization have been identified on the Property – the Mel
Main, Jeri, Jeri North and Mel East Zones. All of the zones occur within the same general part
of the stratigraphic section, but there are local variations. At the Mel Main Zone and in the
southern parts of the Jeri and Mel East Zones, the zinc-rich mineralization is hosted within

Page | 2
stratigraphic intervals that are underlain by crypto-grained limestone and overlain by a
distinctive phyllite/mudstone unit which grades upward into a wavy-banded argillaceous
limestone. At the Jeri North Zone, the equivalent stratigraphic interval contains zinc
mineralization in a massive chert horizon that is overlain by a volcanic flow and volcaniclastic
sequence, then by wavy-banded argillaceous limestone. Three (3) of the 4 sediment-hosted
zinc-rich zones discovered to date, the Mel Main, Jeri, and Jeri North Zones, have been tested
by drilling.
At the Mel Main Zone, mineralization consists of coarse-grained sphalerite and galena
disseminated throughout a mixture of mudstone, silica, carbonate and coarse crystalline barite.
Minor amounts of fine-grained, sparsely disseminated pyrite occur locally, but overall, pyrite
accounts for less than 2% of the sulphides. The Mel Main Zone has a strike length of about 700
meters and extends from surface to a depth of at least 500 meters. It remains open to
extension at depth and has potential for a significant increase in size.
The mineralization at the Mel Main, Jeri, Jeri North and Mel East Zones is sediment-
hosted, stratabound and epigenetic. It has not been reliably categorized as to its deposit type.
The zones exhibit certain features that are characteristic of carbonate replacement, sedimentary
exhalative and unconformity/karst-related deposits, but none of these models is an ideal fit for
the mineralization on the Property.
1.2 HISTORY AND EXPLORATION
The Property was first staked by prospectors J. Melynchuk and T. Flint in 1967 and it
has subsequently been explored by a number of owners and operators, including Newmont
Mining Corporation Ltd., Granby Mining Corp., St. Joseph Exploration Ltd., Sulpetro Ltd.,
Novamin Resources Ltd., Barytex Resources Ltd., Cominco Ltd., Kobex Minerals Inc., and most
recently Silver Range Resources (Silver Range).
Exploration activities have included numerous soil geochemical surveys, geophysical
surveys (IP, gravity, VLF and magnetics), LIDAR surveys, trenching, diamond drilling,
metallurgical test work, and several resource estimations. A 1989 pre-feasibility study by
Sandwell Swan Wooster Inc. concluded that the Mel Main Zone was potentially viable and
provided recommendations for further exploration and development.
To date, a total of 90 diamond drill holes (16,759 m) have been completed on the
Property. The Mel Main Zone has been systematically drill tested but remains open to depth.
The Jeri and Jeri North Zones have received limited, reconnaissance-level drilling, and the Mel
East Zone is untested by drilling.

Page | 3
1.3 HISTORICAL METALLURGICAL TESTWORK
Preliminary metallurgical testing on drill core from the Mel Main Zone by Lakefield
Research in 1979 indicates that after grinding to 100 mesh, the mineralization responded well to
flotation and yielded concentrates ranging from 60.9% to 64.7% zinc, 78.0% to 79.6% lead, and
90.3% to 94.4% barite with recoveries of 90.3% to 96.2% for zinc, 97.7% to 98.0% for lead, and
88.0% to 90.0% for barite. A later, larger scale test was done for barite concentrate market
evaluation. A concentrate grading 95.1% barite, with a recovery of 92.6%, was produced from
12 kilograms of feed grading 53.5% barite.
1.4 MINERAL RESOURCE ESTIMATES
The Inferred Mineral Resource for the Mel Main Zone comprises 5,280,000 tonnes
grading 6.51% zinc (Zn), 1.86% lead (Pb) and 45.05% barite (BaSO4). This resource is stated
above a 5.0% zinc-equivalent (ZnEQ%) cut-off grade. A summary of Inferred Mineral
Resources at various zinc-equivalent cut-off grades is provided in Table 1.1.
The Mel Main Zone mineral resource estimate was completed by Gary Giroux, P. Eng.,
MASc. of Giroux Consulting Ltd. Mr. Giroux is a qualified person and independent of Benz,
based on the guidelines provided by NI 43-101.
TABLE 1.1 Mel Main Zone – Inferred Resource within Mineralization Solid using a Zn
Equivalent cut-off
Cut-Off Tonnes > Cut-off Grade > Cut-off
(ZnEQ%) (Tonnes) Zn(%) Pb(%) ZnEQ(%) BaSO4(%)
3.5 5,610,000 6.31 1.82 8.15 44.24
4.0 5,550,000 6.35 1.83 8.19 44.33
4.5 5,440,000 6.42 1.84 8.28 44.70
5.0 5,280,000 6.51 1.86 8.38 45.05
5.5 5,100,000 6.60 1.88 8.49 45.07
6.0 4,840,000 6.71 1.91 8.64 44.94
6.5 4,460,000 6.87 1.96 8.84 44.71
7.0 3,970,000 7.08 2.00 9.10 44.59
Data generated during the various drill programs conducted at Mel Main Zone were
independently reviewed by Giroux Consultants Ltd. In 2012, 107 pieces of drill core were
selected and re-sampled by taking ¼ of the core. In general, the duplicate assays match the
original assays very well and show no analytical bias.
The resource estimate for the Mel Main Zone was initiated using a wire-frame 3D solid
model in “GEMS.” Three-dimensional solids were manually digitized from the available drill data
and were used to constrain the interpolation of mineralization. The model was constructed

Page | 4
based upon mineralogical boundaries and structural controls. Two solids were created, each
representing a separate mineralogical domain (“Mineralized Solid” and “Barite Shell”).
Drill holes were “passed through” these geological solids with the entry and exit points
recorded. Using this information, the assays were “back-tagged” with different codes if inside or
outside the solids. Of the 64 supplied drill holes, 48 intersected the Mineralized Solid.
A block model with dimensions 10 meters north-south, 5 meters east-west and 5 meters
vertical was superimposed over the domain solids. For each block, the percentage below
surface topography and within each mineralized solid was recorded.
The bulk density for rock within the Mel Main Zone was established from 47 specific
gravity determinations. A specific gravity for each domain was calculated by using a regression
equation and the estimated values for lead, zinc and barite in the two mineralized domains and
the waste domain. A nominal specific gravity of 1.8 was applied to overburden.
Uniform, two meter long, down-hole composites were produced to honour the
Mineralized Solids and Barite Shell. Grades for the elements of interest were interpolated into
blocks within the Mineralized Solid and Barite Shell using Ordinary Kriging. The kriging exercise
was completed in a series of four passes. Appropriate block model validation techniques for
resource estimation at this stage of project development were applied.
1.5 BARITE MARKETING STUDIES
A historical barite marketing study was carried out on the Property by MineStart
Management Inc. in 1989 to evaluate potential marketability of barite products (Slim, 1989).
This study concluded that the Property offers potential for production of large tonnages with an
overall grade of 52% barite. Due to its location, the Property could provide a competitive
advantage over barite from more distant sources. In addition to revenue from barite sales, the
study also noted potential capital cost benefits due to a reduction in the size of a tailings
disposal facility.
World Industrial Minerals completed a recent marketing study in September 2014
(Guilinger, 2014) for Silver Range. This study concluded, based on a review of historical test
work, that the Property should be able to produce a saleable barite product. Based on current
market demand, it recommended at an initial sales rate of 50,000 metric tonnes per year, at a
price of $100 USD/tonne (Free on Board (FOB) mine site) should be achievable. The study
also noted potential concerns with regards to mercury, cadmium and base metal concentrations
in the barite product, and recommended that follow-up test work be conducted to verify
acceptable metal levels.

Page | 5
1.6 INTERPRETATION AND CONCLUSIONS
The zinc-lead-barite zones on the Property are sediment-hosted, stratabound and
epigenetic and occur at a recognizable stratigraphic interval.
The host rocks are Cambrian to Ordovician-age marine carbonate and clastic sediments
with minor volcanic rocks, which are broadly folded into a north-trending, overturned syncline
that is cut by a number of north and northeast-trending faults having both vertical and lateral
displacements.
The Mel Main Zone consists of zinc-lead-barite mineralization that occurs on the western
limb of the syncline within a lensoid body of mudstone, silica and carbonate. The mineralized
body is underlain by crypto-grained limestone and overlain by a distinctive phyllite/mudstone
unit that grades upward into wavy-banded argillaceous limestone.
An Inferred Resource at the Mel Main Zone is estimated at 5,280,000 tonnes of 6.51%
Zn, 1.86% Pb and 45.05% barite using a 5% zinc equivalent cut-off. In-fill drilling to up-grade
the resource is warranted. The deposit is open to extension down dip, with potential for a
significant increase in tonnage.
The Jeri Zone, located 4 kilometers northeast of the Mel Main Zone, is situated on the
eastern limb of the same syncline that hosts the zinc-lead-barite mineralization at the Mel Main
Zone. At the Jeri Zone, the crypto-grained limestone unit that lies in the footwall of the Mel Main
Zone has been altered to zinc-bearing hydrothermal dolomite and silicified dolomite. The zinc
mineralization has been exposed by limited trenching and shallow drilling, and there is potential
for additional discoveries within this thick dolomitized section of limestone. An untested
geophysical anomaly at the south end of the Jeri Zone is interpreted to be located at the base of
the dolomitized limestone and represents an attractive drill target.
At Jeri North Zone, located five kilometers north of the Jeri Zone on the same limb of the
syncline, coarse-grained sphalerite occurs within a chert unit that is capped by a volcanic flow
and tuff sequence. The mineralized chert rests on the same crypto-grained limestone that
forms the base of the Mel Main Zone. The chert unit and volcanic sequence are not present at
the Mel Main and Jeri Zones.
There is untested potential within a three kilometer long portion of the favorable
stratigraphy, which lies between the Jeri and Jeri North Zones, and within another four kilometer
long section that extends northward from the Jeri North Zone.
The Mel East Zone consists of zinc showings that are interpreted to occur along a
faulted off-set or fold repeated section of the same stratigraphic sequence that hosts the Mel

Page | 6
Main, Jeri and Jeri North Zones. Anomalous zinc-lead soil geochemistry and a coincident IP
anomaly have defined a target that has not yet been tested by drilling or trenching.
Based on the amount and nature of the mineralization discovered to date, it is concluded
that the Property offers attractive potential for extension of known zones and discovery of
additional zinc-rich mineralization. Exploration at the Mel Main Zone has outlined a mineral
resource of potential economic interest and initial metallurgical test work has produced
encouraging results. Further work within and around the Mel Main, Jeri, Jeri North and Mel East
Zones is warranted.
1.7 RECOMMENDATIONS
Benz should conduct additional mapping, sampling, trenching and diamond drilling to
determine the potential for expansion along strike and down-dip of the Mel Main Zone.
Trenching and drilling should also be done to further assess the potential of the Jeri, Jeri North
and Mel East Zones. Further metallurgical test work and specific gravity studies should be
undertaken using core from diamond drilling. Environmental, geotechnical and heritage
baseline studies should be initiated. Road access and airstrip maintenance should be
undertaken in conjunction with the exploration.
The proposed work outlined above should be completed in two phases. The Phase 1
budget is estimated to be $149,820, and the Phase 2 budget to be $1,831,500.
2.0 INTRODUCTION
This Technical Report has been prepared at the request of the Management of Benz
Mining Corp. (Benz) in order to summarize results of historic exploration on the Property and
provide an updated Inferred Mineral Resource estimate for the Mel Main Zone. The mineral
resource estimate was prepared using drill data compiled during 2011 and 2012 by Kobex
Minerals Inc., and by Silver Range Resources (Silver Range) in 2014 and 2015, from diamond
drill programs carried out on the Mel Main Zone during the period from 1973 to 1994.
This Technical Report was written in compliance with disclosure and reporting
requirements set forth in the Canadian Securities Administration’s current “Standards of
Disclosure for Mineral Projects” under the provisions of NI 43-101, Companion Policy 43-101CP
and Form 43-101F1.
Zinc-lead-barite mineralization was first discovered on the Property by prospectors in
1967. Exploration work has been carried out on the Property intermittently over a period of 45
years by a number of companies. The most recent exploration was done in 2012.
The 257 mineral claims covering the main areas of interest on the Property, the “Core
Claims”, were purchased by Silver Range from Kobex Minerals Inc. in June 2014.

Page | 7
Subsequently another 319 claims were staked along two access routes extending from the Core
Claims to the Alaska Highway.
In March 2017 Benz obtained the right to purchase 100% interest in the Property from
Silver Range for a total consideration of $2,700,000. Benz is currently listed on the NEX board
of the TSX Venture Exchange (TSX-V) and has completed this Technical Report in partial
fulfillment of requirements to graduate to and be listed on the TSX-V. The 257 core claims are
subject to a 1% Net Smelter Return (“NSR”) royalty payable to Whirlwind Capital Ltd. on metals
produced from the Core Claims and a second 1% NSR royalty payable to Kobex Minerals Inc.
on any minerals or metals produced from the Core Claims, which can be purchased for a sum of
$1 million.
H. Leo King, P. Geo., was retained to prepare Sections 1 to 13 inclusive and Sections 15
to 21 inclusive of this Technical Report. Giroux Consultants Ltd. was retained to prepare the
mineral resource estimate as set out in Section 14. H. Leo King supervised several exploration
programs on the Property during the period from 1976 to 1989 and managed exploration
programs during 1993, 1994 and 1995. He last visited the Property on June 7, 2012.
Subsequent to his last visit, Silver Range completed aerial photography, LIDAR topographic
surveys, heritage studies, barite marketing studies and a resource estimation.
3.0 RELIANCE ON OTHER EXPERTS
This Technical Report includes information from public documents, assessment reports,
metallurgical test work, historical and current mineral resource estimates and literature sources
cited in Section 21. Mineral claim information was provided by the office of the Yukon Mining
Recorder at Watson Lake. Approximate claim locations shown on government claim maps and
referred to on maps that accompany this Technical Report have not been verified.
4.0 PROPERTY LOCATION AND DESCRIPTION
The Property is located 80 kilometers east-northeast of the town of Watson Lake, Yukon
in the Watson Lake Mining District, as shown in Figure 4.1.
The Property is located on NTS 95D/6 map sheet (Otter Creek). The Core Claims are
centered at latitude 60˚ 23’N and longitude 127˚ 20’W, and at UTM coordinates 6,694,000N and
591,000E (NAD 83 – Zone 9). The south limit to the Property is approximately latitude 60˚ 00’N
and the north limit is approximately latitude 60˚ 28’N. The east limit to the Property is
approximately longitude 127˚ 17’W and the west limit is approximately longitude 127˚ 46’W.
The Property consists of 576 mineral claims covering approximately 11,451 hectares. A
list of the claims and information regarding them is shown in Table 4.1. The claim locations
shown on Figure 4.2 were taken from claim map 95D/6, which was produced by Natural
Resources Canada, using National Topographic Data Base 2003.

March 2017

6,650,000
6,660,000
6,670,000
6,680,000
6,690,000
6,700,000
6,650,000
6,660,000
6,670,000
6,680,000
6,690,000
6,700,000
570,000
580,000
590,000
600,000
570,000
580,000
590,000
600,000
1,032,196
600
1,000
1,200
700
1,300
1,400
1,500
600
ANDY 4YA72512
SAM 4YB46144
RALFO 7YA66945
MUMBO 6YA66982
MEL 70YE60070
MEL 69YE60069
SAM 81YB46221
MEL 126YE60126
SAM 24YB46164
MEL 88YE60088
TOMI 5YA66973
MEL 210YE60480
MEL 209YE60479
RALFO 6YA66944
MEL 292YE60562
HOSE 6YA66924
MEL 150YE60150MEL 149
YE60149
CHUNGO 8YA66953
MEL 175YE60175
MEL 197YE60467
DAVE 1YA72501
JEAN 13Y 74420
JEAN 12Y 74419
MEL 265YE60535
MEL 233YE60503
MEl 223YE60493
MEL 178YE60178
MEL 13YE60013
MEL 51YE60051
MEL 288YE60558
MUMBO 1YA66977
MEL 167YE60167
SAM 49YB46189
SAM 50YB46190
SAM 60YB46200
MEL 113YE60113
SAM 17YB46157
MEL 196YE60466
JEAN 19Y 74426
WET 14Y 83322
JEAN 9Y 72965
MEL 250YE60520
MEL 249YE60519
MEL 235YE60505
MEl 225YE60495
SIN 2YA66990
SIN 1YA66989
WET 16Y 83324
ANDY 5YA72513
MEL 45YE60045
MEL 291YE60561
MEL 207YE60477
KELI 3YA66844
MEL 213YE60483
MEl 218YE60488
MUMBO 7YA66983
MEL 253YE60523
MEL 137YE60137
MEL 23YE60023
MEL 194YE60464
OTT 8YA66961
MEL 158YE60158
MEL 26YE60026
SAM 83YB46223
JEAN 1Y 72731
MEL 313YE60583
JEAN 3Y 72733
MEL 134YE60134
EDY 3YA66964
WET 5Y 83313
JEAN 10Y 72966
BOZ 4YA66988
MEL 191YE60461
MEL 135YE60135
SIN 4YA66992
SAM 23YB46163
TOMI 4YA66972
DAVE 2YA72502
MEL 139YE60139 MEL 140
YE60140
MEL 181YE60181
MEL 4YE60004
SAM 40YB46180SAM 39
YB46179
SAM 1YB46141
MEL 63YE60063
MEL 105YE60105
MEL 95YE60095
MEL 82YE60082
WET 15Y 83323
MEL 7YE60007
SAM 75YB46215
MEL 237YE60507
MEl 227YE60497
KELI 2YA66843
MEL 262YE60532
HOSE 3YA66921
KELI 1YA66842
SAM 54YB46194
SAM 64YB46204
SIN 8YA66996
JERI 6YA66936
MEL 204YE60474
MEL 128YE60128
MEL 189YE60459
MEL 190YE60460
MEL 145YE60145
MEL 202YE60472
MEL 16Y 22235
SAM 48YB46188
MEL 50YE60050
MEL 49YE60049
MEL 11YE60011
SAM 80YB46220SAM 79
YB46219
KELI 7YA66929
KELI 8YA66930
MEL 173YE60173
MEL 147YE60147
MEL 241YE60511
MEL 101YE60101
MEL 91YE60091
WET 13Y 83321
MEL 271YE60541MEL 87
YE60087
SAM 44YB46184
MEL 308YE60578
WET 1Y 83309
WET 2Y 83310
MEL 248YE60518
MEL 247YE60517
MEL 316YE60586
MEL 44YE60044
MEL 242YE60512
MEL 33YE60033
SAM 77YB46217
MEL 97YE60097
MEL 107YE60107
MEL 300YE60570
MEL 299YE60569
JEAN 11Y 74418
JONI 6YA66851
MEL 36YE60036
MEL 280YE60550
MEL 279YE60549
JONI 8YA66853
MEL 177YE60177
SAM 76YB46216
MUMBO 5YA66981
MEL 297YE60567
MEL 81YE60081
JERI 7YA66937
DAVE 7YA72507
MEL 77YE60077
MEL 211YE60481
MEL 2YE60002
MEL 174YE60174
WET 31Y 83331
MEL 12YE60012
MEL 251YE60521
MEL 184YE60184
JEAN 14Y 74421
ANDY 3YA72511
MEL 302YE60572
MEL 305YE60575
JERI 4YA66934
SAM 43YB46183
MEL 8YE60008
MEL 119YE60119 MEL 120
YE60120
MEL 284YE60554
JEAN 4Y 72734
SAM 28YB46168
MEL 286YE60556
MEL 28YE60028
MEL 78YE60078
MEL 61YE60061
MEL 261YE60531
JEAN 8Y 72964
MEL 66YE60066
JEAN 2Y 72732
MEL 14YE60014
MEL 5YE60005
JERI 8YA66938
MEL 53YE60053
SOV 5YA28604
OTT 5YA66958
MEL 307YE60577
JONI 4YA66849
JONI 5YA66850
MEL 67YE60067
ANDY 2YA72510
ANDY 1YA72509
MEL 125YE60125
MEL 19YE60019
MEL 20YE60020
MEL 35YE60035
RALFO 1YA66939RALFO 2
YA66940
YANG 6YA67002
YANG 5YA67001
MEL 243YE60513
MEL 298YE60568
MEL 25YE60025
MEL 182YE60182
DAVE 6YA72506
SAM 51YB46191
SAM 61YB46201
JEAN 7Y 72963
JEAN 5Y 72961
MEL 94YE60094
MEL 104YE60104
DAVE 5YA72505
MEL 154YE60154
WET 27Y 83327
MEL 58YE60058
MEL 133YE60133
MEL 246YE60516
WET 30Y 83330
WET 29Y 83329
MEL 141YE60141
MUMBO 4YA66980
MUMBO 3YA66979
MEL 47YE60047
MEL 188YE60188
SAM 69YB46209
SAM 70YB46210
SAM 59YB46199
SAM 86YB46226
ANDY 7YA72515
CHUNGO 2YA66947
JEAN 21Y 74428
MEL 12Y 22231
KELI 4YA66845
MEL 100YE60100
MEL 89YE60089
MEL 90YE60090
SAM 18YB46158
MEL 21YE60021
JONI 2YA66847
MEL 289YE60559 MEL 290
YE60560
MEL 254YE60524
SAM 6YB46146
MEL 83YE60083
MEL 282YE60552
MEL 314YE60584
MEL 259YE60529
MEL 260YE60530
TOMI 8YA66976
SAM 33YB46173
WET 26Y 83326
CHUNGO 1YA66946
SIN 6YA66994
SOV 3YA28602
OTT 6YA66959
OTT 7YA66960
CHUNGO 6YA66951
MEL 72YE60072
MEL 38YE60038
SAM 31YB46171
SAM 53YB46193
SAM 63YB46203
SAM 2YB46142
BOZ 2YA66986
EDY 4YA66965
KELI 6YA66928
SAM 36YB46176
MEL 3YE60003
SAM 68YB46208
SAM 58YB46198
MEL 136YE60136
WET 25Y 83325
MEL 186YE60186
MEL 256YE60526
MEL 55YE60055
SAM 25YB46165
EDY 5YA66966
MEL 76YE60076
MEL 295YE60565
JONI 7YA66852
JONI 3YA66848
SAM 14YB46154
MEL 238YE60508
MEL 228YE60498
MEL 57YE60057
JEAN 15Y 74422
MEL 172YE60172
MEL 214YE60484
MEL 62YE60062
MEL 117YE60117
MEL 106YE60106
MEL 96YE60096
MEL 118YE60118
TOMI 2YA66970
TOMI 1YA66969
CHUNGO 4YA66949CHUNGO 5
YA66950
SAM 45YB46185
SAM 46YB46186
MEL 10YE60010
MEL 9YE60009
MEL 151YE60151
MEL 212YE60482
JERI 3YA66933
MEL 112YE60112
WET 9Y 83317
MEL 143YE60143
MEL 41YE60041
MEl 222YE60492
MEL 232YE60502
MEL 285YE60555
MEL 152YE60152
SOV 4YA28603
ANDY 6YA72514
SAM 37YB46177
MEL 46YE60046
MEL 27YE60027
OTT 1YA66954
MEL 131YE60131
MEL 60YE60060
MEL 59YE60059
DAVE 8YA72508
MEL 92YE60092
MEL 102YE60102
MEL 301YE60571
MEL 155YE60155
MEL 318YE60588
RALFO 4YA66942
MEL 52YE60052
MEL 159YE60159 MEL 160
YE60160
BOZ 3YA66987
MEL 234YE60504
MEl 224YE60494
MEl 215YE60485
SAM 84YB46224
MEL 192YE60462
DAVE 4YA72504
SAM 10YB46150
MEL 183YE60183
SAM 9YB46149
MEL 276YE60546
MEL 171YE60171
YANG 1YA66997
MEL 255YE60525
MEL 54YE60054
MEL 111YE60111
JERI 1YA66931
HOSE 8YA66926
MEL 296YE60566
MEL 124YE60124
SAM 16YB46156
MEL 229YE60499
MEL 239YE60509
MEL 240YE60510
CHUNGO 3YA66948
MEL 205YE60475
MEL 138YE60138
MEL 80YE60080
MEL 79YE60079
RALFO 5YA66943
WET 3Y 83311
MEL 287YE60557
MEL 231YE60501
MEl 221YE60491
BOZ 1YA66985
EDY 7YA66968
WET 8Y 83316
HOSE 4YA66922
OTT 4YA66957
MEL 264YE60534
MEL 15Y 22234
MEL 40YE60040
MEL 39YE60039
MEL 114YE60114
MEL 132YE60132
MEL 71YE60071
MEL 267YE60537
MEL 270YE60540
MEL 269YE60539
SAM 42YB46182
MEL 148YE60148
JEAN 18Y 74425
MEL 244YE60514
SAM 11YB46151
SAM 78YB46218
MEL 252YE60522
MEL 310YE60580MEL 309
YE60579
SAM 66YB46206
SAM 56YB46196
MEL 185YE60185
HOSE 2YA66920
HOSE 1YA66919
SAM 29YB46169
SAM 30YB46170
MEL 165YE60165
MEL 22YE60022
MEL 14Y 22233
SAM 21YB46161
SAM 41YB46181
MEL 37YE60037
SAM 15YB46155
MEL 294YE60564
MUMBO 8YA66984
MEL 273YE60543
SAM 65YB46205
SAM 55YB46195
MEL 17YE60017
MEl 226YE60496
MEL 236YE60506
EDY 6YA66967
JONI 1YA66846
MEL 193YE60463
SIN 3YA66991
WET 7Y 83315
DAVE 3YA72503
SAM 22YB46162
SAM 34YB46174
MEL 311YE60581
WET 4Y 83312
SAM 71YB46211
MUMBO 2YA66978
SAM 27YB46167
SAM 12YB46152
MEL 127YE60127
MEL 195YE60465
MEL 32YE60032
MEL 93YE60093
MEL 103YE60103
JERI 5YA66935
WET 6Y 83314
MEL 86YE60086
MEL 187YE60187
MEL 208YE60478
ANDY 8YA72516
YANG 2YA66998
SAM 82YB46222
MEL 43YE60043
MEL 18YE60018
SAM 3YB46143
SAM 47YB46187
MEL 1YE60001
MEL 278YE60548
JEAN 17Y 74424
MEL 130YE60130
MEL 129YE60129
SOV 1YA28600
MEL 156YE60156
MEL 206YE60476
MEL 315YE60585
EDY 2YA66963
MEl 216YE60486
MEL 31YE60031
SAM 72YB46212
JEAN 16Y 74423
JEAN 20Y 74427
MEL 258YE60528
MEL 257YE60527
SIN 7YA66995
MEL 56YE60056
MEL 74YE60074
MEL 303YE60573
WET 11Y 83319
WET 12Y 83320
MEL 169YE60169 MEL 170
YE60170
MEL 245YE60515
MEL 142YE60142
WET 32Y 83332
HOSE 7YA66925
MEL 281YE60551
TOMI 3YA66971
HOSE 5YA66923
MEL 30YE60030
MEL 29YE60029
SAM 26YB46166
SAM 13YB46153
SAM 73YB46213
MEL 34YE60034
TOMI 7YA66975
MEL 306YE60576
MEL 99YE60099
MEL 110YE60110
MEL 109YE60109
SOV 2YA28601
MEL 163YE60163
MEL 122YE60122
JERI 2YA66932
MEL 98YE60098
MEL 108YE60108
SAM 32YB46172
MEL 115YE60115
SAM 85YB46225
MEL 15YE60015
SAM 38YB46178
SAM 7YB46147
YANG 4YA67000
SAM 5YB46145
SAM 35YB46175
OTT 2YA66955
MEL 73YE60073
MEL 146YE60146
MEL 268YE60538
MEL 312YE60582
MEL 200YE60470
CHUNGO 7YA66952
MEL 168YE60168
MEL 199YE60469
MEL 176YE60176
YANG 3YA66999
MEL 161YE60161
MEL 293YE60563
MEL 277YE60547
MEL 84YE60084
WET 28Y 83328
JOE 2YA45270
JOE 1YA45269
MEL 48YE60048
MEL 201YE60471
MEL 272YE60542
MEL 203YE60473
MEL 317YE60587
MEL 157YE60157
MEL 304YE60574
MEL 85YE60085
MEL 283YE60553
MEL 153YE60153
MEL 275YE60545
SAM 74YB46214
MEL 263YE60533
MEL 42YE60042
MEL 16YE60016
MEL 274YE60544
MEL 116YE60116
MEL 24YE60024
SAM 67YB46207
SAM 57YB46197
MEL 11Y 22230
MEL 68YE60068
MEL 166YE60166
MEL 65YE60065
TOMI 6YA66974
MEL 64YE60064
MEL 121YE60121
MEl 220YE60490
MEL 230YE60500
MEl 219YE60489
KELI 5YA66927
SIN 5YA66993
SOV 6YA28605
SAM 52YB46192
SAM 62YB46202
SAM 8YB46148
OTT 3YA66956
MEL 144YE60144
JEAN 6Y 72962
MEL 6YE60006
SAM 19YB46159
SAM 20YB46160
MEL 162YE60162
MEL 75YE60075
MEL 198YE60468
MEl 217YE60487
MEL 164YE60164
WET 10Y 83318
MEL 266YE60536
RALFO 3YA66941
MEL 13Y 22232
MEL 123YE60123
EDY 1YA66962
MEL 179YE60179 MEL 180
YE60180
FIGURE 4.2
CLAIM LOCATIONS
FILE: ..2017/MEL DATE: MARCH 2017
MEL PROPERTY
SILVER RANGE RESOURCES LTD.
UTM ZONE 9, NAD 83, 095D/03, 04 & 06, Contour line intervals 100 m
H.LEO KING & ASSOCIATES INC.
0 10kilometers
Mel claimsRoad

Page | 8
In March 2017, Benz obtained the right to purchase 100% interest in the Property for total
consideration of $2,700,000, payable in increments annually over 5 years, with $475,000
required to be paid in cash and the balance of $2,225,000 payable in shares or cash at the
Company’s election. The Property is subject only to a 1% NSR royalty payable on metal
production from the Core Claims to Whirlwind Capital Ltd. and a second 1% NSR royalty
payable on mineral and metal production from the Core Claims to Kobex Minerals Inc., which
can be purchased for a sum of 1 million dollars ($1,000,000).
In Yukon, mineral claims can be maintained in good standing by performing approved
exploration work to a dollar value of one hundred dollars ($100) per claim per year or by
payment of $100 in lieu of work per claim per year. Exploration and development expenditures
in the current anniversary year may be applied to a maximum of five (5) future anniversary
years, and those anniversary years may be added to any previous surplus anniversary years.
Sufficient expenditures have been filed to keep all claims within Yukon, comprising the Property
in good standing until at least April 3, 2024. One claim, located in British Columbia, is set to
expire on November 13, 2017.
Exploration work in the Yukon is subject to the Mining Land Use Regulations of the
Yukon Quartz Mining Act and to the Yukon Environmental and Socio-Economic Act. Yukon
Environmental and Socio-Economic Assessment Board recommendations must be issued and a
Mining Land Use approval must be obtained, before advanced exploration may be conducted.
A Mining Land Use Approval and Approved Operating Plan (LQ00431) was issued for
the Property in August 2015 allowing for exploration activities to be conducted to August 2025.
Pre-season and post-season reports are required to be filed each year.
The Property is subject to regular inspections by Mining Land Use officials. There are
no known environmental liabilities except to reclaim roads prior to the expiration of the current
Mining Land Use approval. The author does not know of any surface rights impediments to the
Property.
The Property is located within the traditional territory of the Kaska First Nation, which
has not yet signed a Land Claims agreement with the governments of Yukon and Canada.
TABLE 4.1 MEL PROPERTY – CLAIM STATUS
Claim Name Grant Number Mining District Expiry Date Owner(1)
Andy 1-8 YA72509-YA72516 Watson Lake April 3, 2024 AC 81
Boz 1-4 YA66985-YA66988 Watson Lake April 3, 2024 AC 81
Chungo 1-8 YA66946-YA66953 Watson Lake April 3, 2024 AC 81
Dave 1-8 YA72501-YA72508 Watson Lake April 3, 2024 AC 81
Edy 1-7 YA66962-YA66968 Watson Lake April 3, 2024 AC 81
Hose 1-8 YA66919-YA66926 Watson Lake April 3, 2024 AC 81
Jean 1-4 Y72731-Y72734 Watson Lake April 3, 2024 AC 81
5-10 Y72961-Y72966 Watson Lake April 5, 2024 AC 81

Page | 9
11-21 Y74418-Y74428 Watson Lake April 3, 2024 AC 81
Jeri 1-8 YA66931-YA66938 Watson Lake April 3, 2024 AC 81
Joe 1-2 YA45269-YA45270 Watson Lake April 3, 2024 AC 81
Joni 1-8 YA66846-YA66853 Watson Lake April 3, 2024 AC 81
Keli 1-4 YA66842-YA66845 Watson Lake April 3, 2024 AC 81
5-8 YA66927-YA66930 Watson Lake April 3, 2024 AC 81
MELBC(2) 1032196 B.C. November 13, 2017 AC 81)
Mel 1-188(2) YE60001-YE60188 Watson Lake April 3, 2024 AC 81
189-318(2) YE60459-YE60588 Watson Lake April 3, 2024 AC 81
Mel 11-16 Y22230-Y22235 Watson Lake April 3, 2024 AC 81
Mumbo 1-8 YA66977-YA66984 Watson Lake April 3, 2024 AC 81
Ott 1-8 YA66954-YA66961 Watson Lake April 3, 2024 AC 81
Ralfo 1-7 YA66939-YA66945 Watson Lake April 3, 2024 AC 81
Sam 1-86 YB46141-YB46226 Watson Lake April 3, 2024 AC 81
Sin 1-8 YA66989-YA66996 Watson Lake April 3, 2024 AC 81
Sov 1-6 YA28600-YA28605 Watson Lake April 3, 2024 AC 81
Tomi 1-8 YA66969-YA66976 Watson Lake April 3, 2024 AC 81
Wet 1-16 Y83309-Y83324 Watson Lake April 3, 2024 AC 81
25-32 Y83225-Y83332 Watson Lake April 3, 2024 AC 81
Yang 1-6 YA66997-YA67002 Watson Lake April 3, 2024 AC 81
(1) AC 81 – Archer Cathro and Associates (1981) Ltd. (2) Claims NOT subject to any NSR
The claims are registered in the name of Archer Cathro, which holds them in trust for Benz.
5.0 ACCESSIBILITY, CLIMATE, LOCAL RESOURCES, INFRASTRUCTURE
AND PHYSIOGRAPHY
The Property is located about 400 kilometers east of the city of Whitehorse, in southeast
Yukon. Access to the Property is by helicopter or fixed wing aircraft from the town of Watson
Lake, located on the Alaska Highway about 80 kilometers to the west-southwest of the Property.
Seasonal access is provided by a bush trail/winter road, which is approximately 47 kilometers
long and leaves the Alaska Highway at a point 77 kilometers by road east of Watson Lake,
following a northerly route through the gentle terrain to the Property. A 640 meter long airstrip,
which requires minor repair, is located on the Property.
The Alaska Highway provides a link to the Port of Skagway located 670 kilometers by
road to the west of the Property. Rail access is available at the town of Fort Nelson, 510
kilometers by road to the southeast. The communities of Lower Post and Watson Lake, are the
nearest population centers.
The climate at the Property is characterized by long, cold winters and short, moderate
summers. Precipitation is moderate and winter snow accumulation is in the order of 80

Page | 10
centimeters. Drilling can be carried out in all seasons, but is not recommended during the
spring break-up.
With the exception of a single claim located in BC, the surface rights are held by the
government of Yukon and water rights are under jurisdiction of the Territorial Water Board. Any
mining operation would require regulatory approvals. There is no electrical power available at
the Property. However, a large thermal coal resource is located 10 kilometers north of the
Property. Water from small lakes and streams on the Property provide sufficient water for camp
and diamond drilling requirements. There are ample areas suitable for potential plant sites,
tailings storage and waste disposal on the Property.
The majority of supplies and services required for mineral exploration and mining are
available in Whitehorse. Many supplies and services are also available in Watson Lake
including hotels, restaurants, stores, a hospital, an airport, charter aircraft and heavy equipment.
The Property is situated within the Liard Plateau on the southern fringe of the Logan
Mountains. The terrain is characterized by subdued topography with local elevations ranging
from 900 meters at valley bottoms to 1,200 meters at hill tops. The Property is entirely below
tree line, and vegetation consists of spruce, pine and balsam with willow and alder comprising
much of the understory. Most of the area is in varying stages of regeneration following forest
fires.
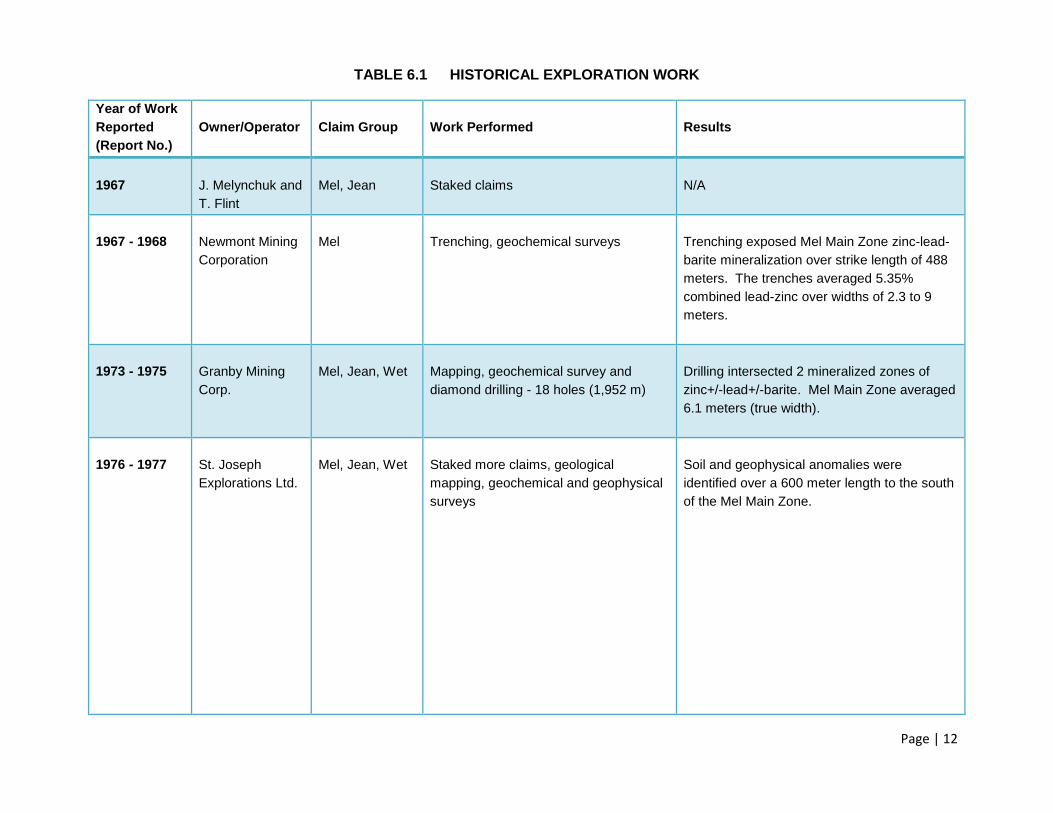
6.0 HISTORY
Historical exploration was largely compiled from assessment reports submitted to the
Yukon Mining Recorder and from internal company reports and memorandum. A summary of
historical exploration work on the Property is provided in Table 6.1.
Extensive exploration work was carried out on the Property by several operators at
various times between 1967 and 1997. The Property was dormant from 1997 to 2012. Results
of previous exploration work, including location and extent of known mineralization,
geochemical and geophysical anomalies, trenches and drill holes, are illustrated on Figures 6.1,
6.2, 6.3, and 6.4.
The Property was first staked by prospectors in 1967 and was subsequently acquired by
Empire Metals Corporation Ltd. (“Empire”). Newmont Mining Corporation (“Newmont”) optioned
the Property and conducted a program of trenching and soil geochemical surveys in 1968. Five
trenches dug by Newmont exposed the Mel Main Zone zinc-lead-barite mineralization over a
strike length of 488 meters. Samples taken from the trenches averaged 5.3% combined lead-
zinc over widths from 2.3 to 9 meters.
In September 1973, Newmont dropped its option and the Property reverted to Empire.
Granby Mining Corp. (“Granby”) then optioned the Property, and between 1974 and 1975, it
conducted a diamond drill program of 18 holes (1,952 meters). Granby’s drilling intersected two
parallel, north-striking, barite-sphalerite-galena zones the, Mel Main Zone and Mel Main North

March 2017

March 2017

March 2017

March 2017

Page | 11
Extension (Figure 6.1). Mineralized intervals in the Mel Main Zone reportedly averaged 6.1
meters true width, but only weak mineralization was intersected in the Mel Main Extension
(Chisholm, 1973 and Wilkinson, 1975).
In January 1976, Empire changed its name to Sovereign Metals Corporation Ltd.
(“Sovereign”). Later that year, St. Joseph Explorations Ltd. (“St. Joseph”) optioned the Property
from Sovereign and conducted geological mapping, geochemical and geophysical surveys.
During 1978 and 1979, St. Joseph completed a 19-hole diamond drill program totaling 4,054
meters (Miller, 1977 and 1979). Preliminary metallurgical testing conducted on drill core from
the Mel Main Zone by Lakefield Research in 1978 yielded concentrates ranging from 60.9% to
64.7% Zn, 78.0% to 79.6% Pb and 90.3% to 94.4% barite.
In 1981, St. Joseph sold its 51% interest in the Property to Sulpetro Ltd. Following the
sale, Sulpetro Minerals Ltd. (“Sulpetro”) was established to hold the Property. Regional
exploration conducted by Sulpetro in 1981 led to the discovery of the Mel East Zone, a zinc
showing located 7.3 kilometers northeast of the Mel Main Zone (Miller and Blanchflower, 1982).
Limited geochemical surveys conducted by Sulpetro over the next two years defined a large
zinc soil anomaly in the area of the Mel East Zone.
Geological mapping and geochemical soil sampling conducted in 1984 between the Mel
Main Zone and the Mel East Zone recognized a zinc showing at the Jeri Zone, located 4
kilometers north-northeast of the Mel Main Zone. During 1985, Sulpetro drilled 10 holes totaling
1,009 meters to test the Jeri Zone (Miller, 1985). Nine (9) of the 10 holes drilled over a strike
length of 550 meters intersected zinc mineralization. Significant zinc values were intersected in
4 of the holes: 3.37 meters of 13.11% Zn in Hole J-85-1, 4.5 meters of 7.96% Zn in Hole J-85-2,
2 meters of 14.6% Zn in Hole J-85-4 and 4.24 meters of 3.78% Zn in Hole J-85-5. Later that
year, Sulpetro sold its interest to Novamin Resources Ltd. (“Novamin”), which in 1987 drill-
tested the Mel Main Zone at depth with 7 holes totaling 2,012 meters. Drill results indicated that
the zinc-lead-barite mineralization continued to a depth of 490 meters below surface (Miller,
1987). Breakwater Resources Ltd. purchased Novamin in 1988, thus obtaining joint ownership
of the Property with Barytex Resources Corp. (“Barytex”), formerly Sovereign.
In 1989, Barytex conducted a soil geochemical survey near the Jeri Zone and completed
four diamond drill holes (663 meters) on the Mel Main Zone. The drill program consisted of in-
fill drilling at the north end of the Mel Main Zone and confirmed the continuity of the
mineralization (Miller, 1989).
Page | 12
TABLE 6.1 HISTORICAL EXPLORATION WORK
Year of Work
Reported
(Report No.)
Owner/Operator
Claim Group
Work Performed
Results
1967
J. Melynchuk and
T. Flint
Mel, Jean
Staked claims
N/A
1967 - 1968
Newmont Mining
Corporation
Mel
Trenching, geochemical surveys
Trenching exposed Mel Main Zone zinc-lead-
barite mineralization over strike length of 488
meters. The trenches averaged 5.35%
combined lead-zinc over widths of 2.3 to 9
meters.
1973 - 1975
Granby Mining
Corp.
Mel, Jean, Wet
Mapping, geochemical survey and
diamond drilling - 18 holes (1,952 m)
Drilling intersected 2 mineralized zones of
zinc+/-lead+/-barite. Mel Main Zone averaged
6.1 meters (true width).
1976 - 1977
St. Joseph
Explorations Ltd.
Mel, Jean, Wet
Staked more claims, geological
mapping, geochemical and geophysical
surveys
Soil and geophysical anomalies were
identified over a 600 meter length to the south
of the Mel Main Zone.

Page | 13
Year of Work
Reported
(Report No.)
Owner/Operator
Claim Group
Work Performed
Results
1978 - 1979
St. Joseph
Explorations Ltd.
Mel, Jean, Wet,
Sov
Diamond drilling – 19 holes (4,054 m),
metallurgical test work
Mineral resource* estimated at 4,782,380
tonnes of 5.61% zinc 2.05% lead, 52.1%
barite.
Metallurgical testing yielded concentrates
ranges from 60.9% to 64.7% zinc, 78.0% to
79.6% lead, and 90.3% to 94.4% barite.
1981 - 1983
Sulpetro Minerals
Ltd.
Joni, Keli, Edy,
Hose, Jeri, Sin,
Ott, Tomi, Yang,
Ralfo, Mumbo,
Chungo and
Boz
Regional exploration, geochemical
surveys, IP & gravity surveys
Mel East Zone zinc mineralization discovered.
Large zinc soil anomaly defined in area of Mel
East Zone.
1984
Sulpetro Minerals
Ltd.
Joni, Keli, Edy,
Hose, Jeri, Sin,
Ott, Tomi, Yang,
Ralfo, Mumbo,
Chungo and
Boz
Soil and silt sampling
Smithsonite discovered at Jeri Zone
1985
Sulpetro Minerals
Ltd.
Jeri, Sin
Diamond drilling (drilling on Jeri & Sin
claims) – 10 holes (1,009.8 m)
Surface mapping and diamond drilling at the
Jeri Zone showed significant zinc
mineralization & alteration over a strike length
of 550m and through a vertical range of at
least 100m. Mineralization included 13.11%
zinc over 3.37m within silicified and
dolomitized limestone

Page | 14
Year of Work
Reported
(Report No.)
Owner/Operator
Claim Group
Work Performed
Results
1985
Sulpetro Inc.
Wet, Jean,
Yang, Tomi,
Ott, Sin, Jeri
Airstrip constructed, upgraded access
road, and constructed tote road to Jeri
Zone
Airstrip built and 5.5 km tote road completed
to Jeri Zone
1987
Novamin
Resources Inc.
Jean
Diamond drilling - 7 holes (2,012 m)
Drilling extended the Mel Main Zone
zinc-lead-barite mineralization to depth of
490m. Mineral resource* estimated at
5,581,030 tonnes grading 6.63% Zn, 1.92%
Pb, & 49.64% barite
1989
Barytex Resources
Corp./
Breakwater
Resources Ltd.
Jean
Diamond drilling - 4 holes (663m).
Carried-out pre-feasibility study and
barite marketing study.
Mineral resource* estimated at 5,687,993
tonnes grading 6.77% Zn, 1.92% Pb, and
51.1% barite
Marketing study results encouraging
1990
Barytex Resources
Corp./Breakwater
Resources Ltd.
Jean
Diamond drilling - 11 holes (1,552 m),
bulldozer stripping of Mel Main Zone.
Resource estimate completed based on
48 intersections from 42 diamond drill
holes by Nevin Sadlier-Brown Goodbrand
Ltd.
Additional metallurgical test work by
Westcoast Mineral Testing Inc.
Stripping exposed north end of Mel Main
Zone. Drill indicated mineral resource* at
5,238,000 tonnes grading 7.86% Zn,
2.09%Pb, & 48.98% barite was estimated
for the Mel Main Zone.
Metallurgical test work confirmed earlier
results.

Page | 15
Year of Work
Reported
(Report No.)
Owner/Operator
Claim Group
Work Performed
Results
1993
International
Barytex Resources
Ltd.
Jeri, Sin,
Hose, Andy &
Sam
11 trenches excavated on Jeri Zone,
geological mapping, staked 86 Sam
claims, soil sampling on Jeri North Zone
Geological mapping traced favorable contact
hosting Jeri Zone zinc mineralization over 9
kilometers. Zinc mineralization was exposed
over a 2.5 kilometer section of the Jeri Zone.
Assay results for Trench 4 averaged 10.7%
Zn over a 5m wide zone and in Trench 5, a
5m wide zone averaged 16.5% Zn.
1994
International
Barytex Resources
Ltd.
Jean
Diamond drilling - 6 holes (3,122 m)
completed on Mel Main Zone.
Soil sampling north of Mel Main Zone and
Jeri North Zone.
Geophysical survey to south of Mel Main
Zone.
Mineral resource* estimated by the company
at 6,778,000 tonnes grading 7.1%Zn, 2.03%
Pb & 54.69% barite
1995
International
Barytex Resources
Ltd.
Jean & Sam
Diamond drilling - 8 holes (847.6m)
completed on Jeri North Zone. 2 holes
(317.5m) drilled on Jean claims south of
Mel Main Zone. Geophysical and
geochemical surveys.
Jeri North Zone drilling intersected zinc
mineralization. Hole J-95-5 intersected 15.6%
Zn over 5.1m (core length) and Hole J-95-4
intersected 9.9% Zn over 5m (core length). IP
conductors and soil geochemical anomalies
(Zn + Pb) were outlined along Jeri Zone
horizon.

Page | 16
Year of Work
Reported
(Report No.)
Owner/Operator
Claim Group
Work Performed
Results
1996
Cominco Ltd.
Sam, Jean
Diamond drilling - 6 holes (1,189m) on
Jeri North Zone tested mineralized
horizon over 1,000m strike length. 1 hole
drilled to south of Mel Main Zone. Soil
sampling completed over 5.6 km of
favorable Zn mineralized horizon on Jeri
North Zone. Soil sampling on Mel East
Zone.
Hole J-96-10 drilled on the Jeri North Zone,
200m to the south of J-95-4 & J-95-5,
intersected 12.38% Zn over a 3m core length.
To south of Mel Main Zone a diamond drill
hole tested an IP anomaly but did not intersect
the favorable contact zone.
Soil sampling on Mel East Zone returned
anomalous zinc results in an area 1,400m
long by 150m wide.
1997
Cominco Ltd.
Jean, Sam,
Joni
IP resistivity and soil geochemical surveys
in 3 areas: south of Mel Main Zone; Mel
East Zone; and southern part of Jeri
Zone. Magnetic & gravity surveys
conducted south of Mel Main Zone.
Diamond drilling – 2 holes (360.9m)
tested geophysical conductors located
1.5 km south of Mel Main Zone.
A number of geophysical and geochemical
anomalies were identified in all zones
surveyed.
Carbonaceous mudstones were interpreted to
be the source for the geophysical anomalies.
2012
Kobex Minerals Inc.
Sam
Geochemical soil survey on Jeri North
Zone.
Anomalous Zn in soil values were confirmed
at several locations within the north trending
Jeri North Zone. The soil survey results
increased the resolution of the soil
geochemical coverage.
2014-2015 Silver Range
Resources
All LIDAR survey and aerial photographs
Resource estimation on Mel Main Zone
and a barite marketing study
Inferred Mineral Resource was produced.
* Mineral resources reported in this table are historic in nature and described in Section 6.1

Page | 17
In 1990, Barytex conducted an in-fill drill program consisting of 11 diamond drill holes
totaling 1,552 meters plus surface stripping. Drilling between previous, widely-spaced holes
aided in the design of an open-pit (Miller, 1990).
A resource estimate, based on 48 intersections from 42 diamond drill holes, was
prepared by consultants Nevin Sadlier-Brown Goodbrand Ltd. in a report dated October 9, 1990
(Croft, 1990). Additional metallurgical test work by Westcoast Mineral Testing Inc. generally
confirmed earlier metallurgical results (Hawthorn, 1990).
In November 1992, Barytex was reorganized and the company’s name changed to
International Barytex Resources Ltd. (“IBX”).
During 1993, IBX staked another 86 claims to cover the northerly strike extension of the
Jeri Zone and established 66 line-kilometers of grid. Geological mapping traced the favorable
contact hosting the Jeri Zone zinc mineralization for a strike length of over 9 kilometers and
discovered the Jeri North Zone. Eleven (11) trenches excavated in 1993, exposed
mineralization along a 2.5 kilometers section of the Jeri Zone. The most significant assay
results from trench sampling were obtained from trench 5, where a 5 meter wide interval
averaged 16.5% Zn and in trench 4, where a 5 meter wide interval averaged 10.7% Zn (King,
1994a). At the Jeri North Zone, on the northern extension of the Jeri Zone, reconnaissance soil
sampling was carried out on lines spaced 1,000 meters apart from section 166N to 206N. Soil
samples were taken at 25 meter intervals along section lines that crossed the favorable contact
zone.
In 1994, IBX established grid lines spaced 100 meters apart from line 130N to 152N at
the Jeri North Zone. Soil samples were collected at 25 meter intervals along lines that crossed
the favorable contact zone. A total of 59 soil samples were taken. The soil sampling revealed
anomalous zinc and lead values along the favorable contact (King, 1994b).
In 1994, six additional drill holes totaling 3,122 meters were drilled by IBX at the Mel
Main Zone. Higher grade intersections were obtained from those holes, with some intersections
grading in excess of 12% combined lead-zinc. The highest grade intersection assayed 19.72%
zinc over an estimated true thickness of 5.16 meters (King, 1994b). This was the last drilling
completed on the Mel Main Zone, and it remains open to extension down dip. A representative
drill section through the Mel Main Zone is shown in Figure 6.5.
Geophysical surveys including magnetic, very-low-frequency (“VLF”) and IP surveys
were carried out by IBX in 1994 over the southerly projection of the Mel Main Zone. VLF and
magnetic coverage extended from lines 82N to 96N and IP surveys were conducted on lines
82N to 84N, 88N + 50N and 89N to 91N. The IP survey outlined a chargeability and resistivity
anomaly on line 84N that is on-strike with the Mel Main Zone. The geophysical work was
carried out by S.J.V. Consultants Ltd., a geophysical contractor.
Reconnaissance soil sampling was also carried out by IBX in 1994 on-strike and to the
north of the Mel Main Zone from 114N to 134N. Samples were taken along grid lines spaced

March 2017

Page | 18
200 meters apart. Sample density varied from 10 meter to 20 meter spacing along the lines. A
total of 54 soil samples were collected. No anomalous zinc or lead values were returned from
this soil sampling (King, 1994b).
At the Jeri North Zone, soil sampling was done across a 2 kilometer long segment of the
favorable contact between crypto-grained limestone and wavy-banded limestone in 1994 by
IBX. Samples were taken at 25 meter intervals along lines spaced 200 meters apart.
Anomalous soil geochemical zinc and lead values were returned on most lines sampled. Two
zinc soil geochemical anomalies were outlined; one extending from line 131N to 143N, and the
other from line 150N to 152N (Figure 6.3). IP geophysical surveys were carried out over lines
135N and 136N within one of these zinc soil anomalies. Strong chargeability highs were
outlined on both lines, coincident with the zinc anomaly that marks the favorable contact
between wavy-banded limestone and the underlying crypto-grained limestone (King, 1994b)
In 1995, an IP survey was conducted by IBX on lines 85N and 86N, approximately one
kilometer south of the Mel Main Zone. This survey defined coincident chargeability and
resistivity anomalies that extend to the north of an anomaly first identified on line 84N during the
1994 survey (Figure 6.1). Two diamond drill holes (317.5m) were completed on Section 85N in
an attempt to explain the IP anomaly outlined on lines 84N to 86N. Minor graphite was noted in
the core along several shear zones, which may explain the IP anomaly. However, the targeted
contact zone between the wavy-banded limestone and the crypto-grained limestone was not
intersected (King, 1995).
Geochemical and geophysical surveys were conducted in 1995 by IBX at the Jeri North
Zone. IP surveys were carried out on grid lines spaced 100 meters apart from lines 131N to
142N. Strong chargeability highs and corresponding resistivity lows, partially coincident with
anomalous zinc soil geochemical values, were outlined over a strike length of 1,100 meters
(Figure 6.3).
A program of diamond drilling was carried out in 1995 by IBX to test the coincident IP
and geochemical anomalies at the Jeri North Zone. Eight (8) widely-spaced drill holes, totaling
847.6 meters, tested the anomalous zone over a strike length of 2 kilometers. This drilling
intersected a sequence of intermediate volcanic flows and volcaniclastic sediments that are
overlain by the relatively thin unit of calcareous phyllite/mudstone that forms the base of the
wavy-banded limestone throughout much of the Property. A massive chert unit up to 5 meters
thick was intersected below the volcanic-volcaniclastic sequence. In places, the chert rests
directly on the basal crypto-grained limestone unit but on other sections it is separated from the
crypto-grained limestone by a dolomitic horizon. Sphalerite was encountered mainly within the
chert unit, with lesser amounts occurring in an overlying ash layer and in the underlying
dolomitic horizon. Five (5) of the 8 holes drilled intersected zinc mineralization, with two of
these holes yielding high zinc assays: 15.6% Zn over a core length of 5.1 meters in hole J-95-5
and 9.9% Zn over a core length of 5 meters in hole J-95-4 (King, 1995).

Page | 19
In 1996, Cominco Ltd. (“Cominco”), under an option agreement with IBX, began
exploration work on the Property. Work was carried out on the Jeri North and Mel East Zones
and in an area immediately south of the Mel Main Zone.
One diamond drill hole was drilled 1.5 kilometers south of the Mel Main Zone to test an
IP anomaly believed to represent the southern extension of the favorable mineralized horizon
hosting the Mel Main Zone. This drill hole did not reach the favorable contact zone.
At the Jeri North Zone, exploration work included six diamond drill holes totaling 1,189
meters. These holes further tested zinc mineralization discovered in 1995. Drill hole J-96-10,
located 200 meters south along strike of holes J-95-4 and J-95-5 encountered 12.38% Zn over
a 3.0 meter core length. The other five holes drilled within this area intersected lower grade
mineralization (Senft, 1996).
Cominco conducted additional soil sampling in 1996 to the north of the Jeri North Zone
along grid lines from 149N to 224N. Several anomalous samples lie along the projected trace of
the mineralized horizon.
At the Mel East Zone, Cominco conducted a soil sampling program to confirm the
presence of the large zinc anomaly identified by Sulpetro during its 1983 exploration program.
Strong zinc values were outlined over an area 1,400 meters long by 150 meters wide and open
to the north, south and east. This anomaly is coincident with the favorable contact hosting the
zinc showing referred to as the Mel East Zone and represents an attractive drill target.
In 1997, Cominco completed soil sampling in three areas on the Property. Four lines of
soil sampling were completed south of the Mel Main Zone on lines 87N to 90N. Three lines of
soil sampling were also completed at the Jeri Zone at 50 meter intervals along lines spaced 200
meters apart. A total of 39 samples were collected. In the area of the Mel East Zone, a single
contour line of soil sampling totaling 39 samples was completed to cover the southern extension
of the mineralized horizon (Senft and Hall, 1998).
During 1997, Cominco conducted IP and resistivity surveys in three areas: south of the
Mel Main Zone, the Mel East Zone area, and an area in the southern part of the Jeri Zone. In
addition, a magnetic survey and a limited gravity survey were conducted south of the Mel Main
Zone. The geophysical program identified anomalies in all three areas surveyed. A compilation
of the geophysical surveys carried on the Mel Main, Jeri, Jeri North and Mel East Zones are
shown on Figures 6.1, 6.2, 6.3, and 6.4 respectively. Two drill holes totaling 360.9 meters
tested geophysical conductors located 1.5 kilometers south of the Mel Main Zone. These holes
intersected carbonaceous mudstones, which are interpreted to be a source for the geophysical
anomalies, but neither of these drill holes cut the favorable contact that hosts the Mel Main
Zone.
In 2012, Kobex Minerals Inc. (“Kobex”) carried out a soil sampling program on a portion
of the Jeri North Zone (Livingstone, 2012 and King, 2013). A total of 229 soil samples were
collected and analyzed to fill in gaps in the 1996 soil sampling carried out at the Jeri North Zone

Page | 20
by Cominco. Samples were collected from four separate grids along east-west lines spaced
100 meter apart, with soil sampling stations spaced at 50 meter intervals.
Of the 229 samples collected, 12 returned anomalous zinc values, 12 returned
anomalous lead values and 12 returned anomalous barium values. Results of the 2012 soil
sampling program confirm the presence of elevated zinc in soils within all 4 of the previously
established grids at the Jeri North Zone and extended 2 of the areas of anomalous zinc values
(Figure 6.6). Lead values are typically low.
To date a total of 90 diamond drill holes (16,759 meters) have been drilled on the Mel
property. Appendix I contains data concerning locations, orientations and lengths of the drill
holes. Appendix II lists the significant mineralized intervals in the holes.
In June 2014, Sliver Range purchased the Property from Kobex, and in September
2014, Breakwater sold its NSR royalty to Whirlwind Capital Ltd.
In 2015, Silver Range completed LIDAR, aerial photography and heritage surveys, a
barite marketing study and updated the mineral resource estimate (Stevens, 2015).
As of March 2017, Benz has the right to acquire 100% interest in the Property from
Silver Range.
6.1 HISTORICAL RESOURCE ESTIMATES
Several historical resource estimates have been made for the Mel Main Zone, based on
drilling results from that zone. A summary of the historical mineral resource estimates is
provided in Table 6.2.
Most of the resource estimates were completed by company personnel during the
course of drilling carried out from 1975 to 1994. The exception was an independent resource
estimate, made by Nevin Sadlier-Brown Goodbrand Ltd. in October 1990.
All of the historical mineral resource estimates were calculated using a polygonal
method or Inverse Distance Squared interpolation techniques.
Specific gravity determinations were applied to individual samples within mineralized
intersections, which were then used to calculate a weighted average grade of the intersection.
The true width of the intersection was obtained from measurements of contact angles compared
with geological cross sections.
The intersection grades and thicknesses were used to calculate a resource by the
“Inverse Distance Squared” technique. In this method, the influence exerted by any drill hole
intersection on an arbitrary block is inversely proportional to the square of the distance from the
center point of the block.

March 2017

Page | 21
TABLE 6.2 HISTORICAL MINERAL RESOURCE ESTIMATES
Date
Status
Company/
Estimator
Category
Tonnes
(millions)
Zinc
(%)
Lead
(%)
Barite
(%)
1975 Historical Granby not specified 2.6 5.35 1.93 54.6
1979 Historical St. Joseph
Explorations
not specified 4.782 5.61 2.05 52.1
1984 Historical Novamin
Resources
not specified 5.581 6.63 1.92 49.64
1989 Historical Barytex
Resources
not specified 5.687 6.77 1.92 51.1
1990 Historical Barytex
Resources/Nevin
Sadlier-Brown
Goodbrand
Drill Indicated
5.238 7.86 2.09 49.98
1994 Historical Int’l Barytex
Resources
Indicated 6.778 7.1 2.03 54.69
2009 Historical Kobex Minerals Indicated 6.778 7.1 2.03 54.69
The historical resource estimates reported herein are sourced from internal company
memorandum and the October 1990 consultant’s report by Nevin Sadlier-Brown Goodbrand Ltd.
The resource estimates listed herein are historical in nature and a Qualified Person has not
done sufficient work to classify these historical resource estimates as current mineral resources.
Benz is not treating the historical resource estimates as current mineral resources.
The author notes that the historical resource estimates reported by various previous
owners of the Property cannot be relied upon, and are quoted for historical purposes only.
However, these historical resource estimates do provide an indication of zinc-lead-barite
mineralization potential on the Mel Main Zone.
The mineral resource reported herein (see Section 14) supersedes all historical resource
estimates.
6.2 HISTORICAL METALLURGICAL TESTWORK
Preliminary metallurgical testing on core from the Mel Main Zone by Lakefield Research
in 1976 (Wyslouzil and Bulatovic, 1976) indicated that after grinding to 100 mesh, the
mineralization responded well to flotation and yielded concentrates ranging from 60.9% to
64.7% zinc, 78.0% to 79.6% lead, and 90.3% to 94.4% barite with recoveries of 90.3% to 96.2%
for zinc, 97.7% to 98.0% for lead, and 88.0% to 90.0% for barite. A later, larger scale test was
done for barite concentrate marketing evaluation. A concentrate grading 95.1% barite with a
recovery of 92.6% was produced from 12 kilograms of feed grading 53.5% barite.

Page | 22
Further metallurgical testing on core from the Mel Main Zone by Westcoast Mineral
Testing (WMT) in 1990 (Hawthorn, 1990) mainly duplicated the results achieved by Lakefield
Research in 1976, except that a small portion of the zinc reported to the lead concentrate,
resulting in a 10% zinc content in an otherwise clean lead concentrate. Optical microscopy of
the lead concentrate indicated that through proper regrinding and reagent manipulation, the zinc
grade of the lead concentrate could be reduced to less than 3%. WMT also measured the
composite sample’s specific gravity to be 3.5 and the grindability to be very low at 6.4 kWh/t.
6.3 BARITE MARKETING STUDIES
A historical barite marketing study was completed in 1989 by MineStart Management
Inc. (Slim, 1989) and concluded that barite from the Property demonstrated positive potential as
a saleable by-product. The study noted that barite demand is highly cyclical, with the vast
majority of barite consumption occurring as part of oil and gas drilling. For any development of
the Property, MineStart noted that a good stockpile would be important, as barite purchasers will
want demonstration of continuous supply. Considering barite as a by-product also enables
stockpiling for more favorable market conditions, and separates the economics of barite sales
from those of the main minerals. Sales of barite products were deemed to be particularly
attractive for the Property as they would not only provide an additional revenue stream, but also
reduce capital costs due to less need for tailings disposal capability.
World Industrial Minerals completed a new barite marketing study in September 2014
(Guilinger, 2014). This study examined historical data from metallurgical test work on the
Property and investigated current market trends, pricing and sales opportunities throughout
North America. Based on data from flotation tests conducted in the 1980s, the study found that
the Property should be able to produce a barite product with sufficient grade to meet the
specifications for drilling mud, chemical and construction applications (>94% BaSO4). However,
while the historical test work showed that the necessary grade could be achieved, there were
concerns regarding the mercury, cadmium and base metal content of the barite concentrate,
which were not specified in the historical test work results. The study recommended follow-up
analysis and test work to determine probable lead, zinc, cadmium and mercury contents of the
barite concentration with respect to specifications and requirements for use in drilling fluids.
Based on the location of the Property, the 2014 study concluded that barite sales would
likely be restricted to western Canadian and Alaskan markets. Current production facilities are
very limited in this region, and demand is high due to on-going oil and gas operations. The
study recommends that an initial sales rate of 50,000 metric tonnes per year would be
reasonable, and not too disruptive to existing import markets. This figure does not currently
assume any sales to Alaska, which it notes are feasible and should be evaluated more through
further study. Based on analysis of 2013 pricing, a sales price of $100 USD per metric tonne
(FOB mine site) is recommended. The study also suggests that potential synergies may exist
with the under-utilized Fireside Minerals barite grinding plant in Watson Lake.

Page | 23
7.0 GEOLOGICAL SETTING AND MINERALIZATION
7.1 GEOLOGICAL SETTING
The Property is located within Selwyn Basin, a tectonic element comprising deep water
clastic rocks and chert with minor carbonate and volcanic strata, which accumulated along the
North American continental margin during Neoproterozoic and Paleozoic time. Selwyn Basin
extends from Alaska through Yukon and western Northwest Territories into British Columbia
(Figure 7.1). The basin is bounded to the northeast by a carbonate platform (MacDonald
Platform), which comprises the near-shore facies of ancient North America (Abbott et al, 1986).
In the area of the Property, Selwyn Basin lies east of units belonging to Cassiar, Slide
Mountain and Yukon-Tanana Terranes, which are pericratonic and oceanic terranes that were
formed along the western margin of ancient North America in Paleozoic time. Deformation and
metamorphism associated with accretion of these and other allochthonous terranes was
initiated in Middle Jurassic and culminated in Tertiary time. The resulting
transpressional/transextensional orogenic belt is referred to as the Cordilleran orogen (Nelson
and Colpron, 2007).
Post-accretion strike-slip movement along the Tintina Fault resulted in about 450
kilometers of dextral offset, dismembering various terranes within the orogenic belt (Murphy and
Mortensen, 2003). The Property is located about 40 kilometers northeast of the Tintina Fault.
The Property is situated on the Coal River map sheet (NTS 95D), which was mapped by
the Geological Survey of Canada in 1967 (Gabrielse and Blusson, 1969). More detailed
mapping was conducted in the immediate vicinity of the Property by the Department of Indian
and Northern Affairs in the early 1970s (Carne, 1976) and the Yukon Geological Survey in 2006
and 2007 (Pigage, 2008). Pigage’s maps and report incorporate many observations made by
economic and academic geologists, who worked on the Property or studied rocks and minerals
taken from it. The following description of the regional geological setting is primarily based upon
Pigage’s report.
The Property lies immediately north of the boundary between Selwyn Basin and
MacDonald Platform, near the junction between the main body of Selwyn Basin and the easterly
trending Meilleur River Embayment (Figure 7.1). Eight, predominantly sedimentary units,
ranging from Neoproterozoic to Lower Carboniferous, have been mapped in the area. All of
these units have been deformed with east-verging, asymmetric, north-trending folds related to
easterly-directed thrust faults (Figures 7.2 and 7.3). Interpretation of the fold pattern indicates
amplitudes of 500 to 2000 meters. Northeasterly-trending normal faults are younger than the
folds and thrust faults. The period of compressional deformation started later than Early
Triassic and ended before Late Eocene, based on evidence from adjacent map sheets (Pigage,
2008).

?
?
Ala
ska
Pacific Ocean
Yukon Territory
55 N
60 N
140
W
130
o
W
120
o
W
o
o
o
BritishColumbiaNorthwestTerritories
Richardsontrough Lac Des
Boisplatorm
Babbag ebas in
Po r c u pin ep l a t f o r m
B l ac k s t o n et r o u g h
Cassiarplatform
Tintina faultN
as
ina
ba
sin
Blackwaterplatform
Ke
ch
ika
tro ugh
Kakwaplatform
Rootbasin
Ma
cd
on
al
d
Pl
at
fo
rm
200km
Mei rle vl rntemmbEi eu
aR
y
C AA N A D
Yukon
WatsonLake
Se
l wy
ba
sin
n
Liard Line
Beaufort
Sea
General distribution of preserved ‘North American’ Ordovician and Silurian platform facies
General distribution of preserved ‘North American’ Ordovician and Silurian basin facies
Mine or advanced deposit owned by other parties
Howard’s Pass
Tom
Jason
Mel Property
Cirque
Pigage, L.C., 2008. Preliminary bedrock geology for NTS 95D/6 (Otter Creek area), southeast Yukon. In: Yukon
Exploration and Geology 2007, D.S. Emond, L.R. Blackburn, R.P. Hill and L.H. Weston (eds.), Yukon Geological
Survey, p. 237-255.
Location of Mel Project in southeast Yukon. General distribution of Ordovician-Silurian platform carbonate and basinal shale facies for Canadian Cordillera and Alaska are indicated. Modified from Cecile et al. (1997).
Robb Lake
Goz
Faro
McMillanSilvertip
H.LEO KING & ASSOCIATES INC.
TECTONIC SETTING
MEL PROPERTY
FILE: P:/2017/MEL DATE: MARCH 2017
SILVER RANGE RESOURCES LTD.
FIGURE 7.1
After Pigage, L.C., (2008).

FIGURE 7.2
REGIONAL GEOLOGY
FILE: ..2017/MEL DATE: MARCH 2017
MEL PROPERTY
SILVER RANGE RESOURCES LTD.
UTM ZONE 9, NAD 83, 095d/03, 04 & 05
H. LEO KING & ASSOCIATES INC.
0 10 km
DCBR Besa River FormationDEVONIAN-CARBONIFEROUS
SDC Carbonate - bedded grey to black dolostone or grey limestone; includesMuncho-McConnell, Stone and Dunedin formations; locally includesSilurian Nonda Formation
SILURIAN-DEVONIAN
SDRR Road River Group (undivided)
OSU Sunblood FormationORDOVICIAN
EOV Basalt / gabbro - vesicular and amygdaloidal, dark green basalt;medium crystalline, massive gabbro
CAMBRIAN-ORDOVICIAN
EOR Rabbitkettle Formationgrey to brownish grey, silty to nodular limestone with lesserinterbeds of indistinctly bedded, pale grey limestone
EOR1
PEV Vampire FormationNEOPROTEROZOIC-LOWER CAMBRIAN
PEN Narchilla Formation (Hyland Group)
Rabbitkettle Formationlight grey, fine-grained, indistinctly bedded, resistant limestone
anticline (upright, overturned)
syncline (upright, overturned)
geological contactthrust fault
normal fault
property boundary
After Pigage, L.C., (2008)

H.LEO KING & ASSOCIATES INC.
REGIONAL CROSS-SECTIONS
MEL PROPERTY
FILE: P:/2017/MEL DATE: MARCH 2017
SILVER RANGE RESOURCES LTD.
FIGURE 7.3
After Pigage, L.C., (2008).

Page | 24
Table 7.1 shows the names, ages and general lithologies for the units that occur near
the Property. All of the known mineral occurrences on the Property lie within the Rabbitkettle
Formation. Where present, argillaceous rocks typically exhibit pervasive axial-planar slaty
cleavage.
Table 7.1 Regional Lithological Units
Age Unit Name Lithological Description
Devonian-Carboniferous Besa River Formation (DCBR) Tan-orange to tan-weathering,
striped, greenish-grey generally
noncalcarous argillaceous
siltstone with some beds of dark
grey siltstone and localized
argillaceous sandstone and
limestone conglomerate.
Silurian-Devonian MacDonald Platform carbonates
(SDc)
Thick assemblage of carbonate
rocks including several locally
undifferentiated formations.
Silurian-Devonian Road River Group (SDRR) Thick bedded, noncalcarous,
graptolitic, dull black, silty shale
and underlying thinly interbedded
black chert and grey-weathering
black silty dolostone.
Ordovician Sunblood Formation (OSu) Predominantly thick-bedded, pale
grey, laminated to bioturbated
dolostone interbedded with thick-
bedded dark grey, bioturbated
dolostone.
Cambrian-Ordovician Rabbitkettle Formation (ЄOR &
ЄOR 1)
ЄOR – light grey to brownish-
grey weathering, silty to
argillaceous, locally nodular
limestone, informally called
“wavy-banded limestone”, with
interbeds of pale grey, fine
grained massive limestone.
ЄOR1 – local subunit of up to
150 meters thick, massive light
grey to off-white, very fine
grained limestone.
Neoproterozoic Vampire Formation (pЄV) Dark grey-green, fissile,
pinstriped, noncalcarous, silty
phyllite and massive, cream-grey
weathering, quartz sandstone
with minor conglomerate.
Neoproterozoic Narchilla Formation
Hyland Group (pЄN)
Medium green to silvery-tan
weathering, thin-bedded,

Page | 25
noncalcarous phyllite sometimes
with interbeds of white, fine-
grained, laminated quartz
sandstone; occasionally green
phyllite with local maroon phyllite
interbeds.
Figure 7.4 illustrates geology in and around the main areas of interest on the Property,
along with the locations of the known mineral zones, all of which are located within or atop Unit
ЄOR1, a sub-unit of the Rabbitkettle Formation. Three (3) of the 4 main areas of interest occur
within a north-trending syncline that is cored by Sunblood Formation. The Mel Main Zone lies
on the western, overturned limb of the syncline, while the Jeri and Jeri North Zones are on the
eastern limb. The exposure of the Unit ЄOR1 at the Mel East Zone could represent a second
limestone horizon or a folded repeat or faulted-offset of the horizon observed at the Jeri and Jeri
North Zones. The faulted-offset option is favored by economic geologists who have worked on
the Property.
On the Property, Unit ЄOR1 is up to 150 meters thick and consists of massive light grey
to off-white, crypto-grained limestone that typically contains faint, white calcite and tan siderite
veinlets. It is sandwiched within a thicker section of Unit ЄOR wavy-banded, argillaceous
limestone. At the Mel Main Zone, Unit ЄOR1 is overlain by an up to 20 meter thick lens of
mineralized rock, which is capped by a 10 to 45 meter thick layer of pale green to cream
noncalcarous phyllite to mudstone. The lensy phyllite/mudstone subunit is also present in the
southern part of the Jeri Zone and at the Mel East Zone. At the Jeri North Zone, Unit ЄOR1 is
locally overlain by a mineralized chert horizon that lies at the base of a 30 meter thick section of
Unit ЄOv basaltic flows and tuffs.
7.2 MINERALIZATION
Three (3) of the 4 zones of mineralization that have been identified on the Property occur
within strata deposited directly atop Unit ЄOR1, while the fourth zone (Jeri Zone) is hosted
mainly within hydrothermally altered rocks that are thought to be equivalent to the Unit ЄOR1
crypto-grained limestone. The Mel Main Zone is exposed within the western limb of the main
syncline on the Property, while the Jeri and Jeri North are located 3 kilometers apart on the
eastern limb of the syncline. The Mel East Zone lies within a separate horizon of Unit ЄOR1 or
a fold repeated or faulted-offset of the horizon that hosts the Jeri and Jeri North Zones. Three
(3) of the zinc-rich zones, the Mel Main, Jeri and Jeri North Zones, have been tested by drilling.
The zinc-lead-barite mineralization at the Mel Main Zone and zinc showings at the south-
end of the Jeri Zone and in the Mel East Zone, all occur within a stratigraphic sequence
consisting of underlying Unit ЄOR1 crypto-grained limestone and overlying phyllite/mudstone
subunit, which grades upward into Unit ЄOR wavy-banded argillaceous limestone. The
stratigraphic sequence hosting the Jeri North Zone is similar except that the mineralization
occurs in a chert horizon, between the basal crypto-grained limestone unit and an overlying

A
B
JERI NORTH
MEL EAST
JERI
MEL MAIN
0 2 5 km
Sunblood formation
Mineralized horizon
Fault
Claim boundary
127°
25’
127°
15’
60° 28’
60° 20’
7
7
7
Rabbitkettle formation - cryptograined limestone
Rabbitkettle dolomite formation - wavy-banded
0 2 5 km
H.LEO KING & ASSOCIATES INC.
PROPERTY GEOLOGY AND MINERALIZATION
MEL PROPERTYFILE: P:/2017/MEL DATE: MARCH 2017
SILVER RANGE RESOURCES LTD.
FIGURE 7.4
PLAN VIEW
CROSS SECTION
A BMEL EASTJERI
7
MEL MAIN

Page | 26
volcanic flow and volcaniclastic sequence that is capped by the wavy-banded argillaceous
limestone. The stratigraphic sections at the various zones are compared on Figure 7.5, and the
zones are individually described in the following sub-sections.
7.2.1 Mel Main Zone
At the Mel Main Zone, mineralization consists of coarse-grained sphalerite, galena and
barite disseminated throughout a mixture of mudstone, silica and carbonate. Minor amounts of
fine-grained, sparsely disseminated pyrite occur locally, but overall, pyrite accounts for less than
2% of the sulphides.
The Mel Main Zone is a disc-shaped and stratigraphically controlled body, which rests
disconformably on unaltered crypto-grained limestone. The mineralization is located on the
steeply dipping, western limb of a major syncline and is slightly deformed by a secondary fold
(Figure 6.5).
Trenching and diamond drilling have delineated the mineralized zone over a strike length
of about 700 meters and from surface to a depth of 500 meters down dip. The true thickness of
the zone varies from less than 1 meter at each end to a maximum of 17.9 meters in the central
portion.
In the upper part of the zone, the central portion of the mineralized body consists of
massive barite with moderate zinc and lead contents. The highest grade zinc and lead values
occur at the margins of the zone where it thins and barite content decreases. The zone narrows
at a depth of about 400 meters below surface and then widens again to form an hour-glass
pattern. Below 500 meters, the mineralized body appears to thicken again and there is
corresponding increase in barite content. The mineralized zone remains open to extension at
depth (Figure 7.6).
7.2.2 Jeri Zone
Mineralization at the Jeri Zone is atypical on the Property because it is hosted in altered,
limestone considered to be the equivalent of the crypto-grained limestone, which underlines the
Mel Main Zone. The zinc mineralization in the Jeri Zone is, in part, discordant to bedding and is
hosted in hydrothermal dolomite and silicified dolomite. This type of strong footwall alteration is
exposed along the eastern fold limb of the main syncline for a strike length of about 8
kilometers.
At the Jeri Zone, the footwall limestone is locally silicified, dolomitized, and brecciated at,
and immediately beneath, the contact with the overlying phyllite/mudstone. The altered and
brecciated limestone commonly contains zinc minerals, smithsonite and sphalerite.
Geochemically elevated lead values have been reported, but no economically significant lead
mineralization has been identified. Barite is present as a gangue mineral in quartz veins but
does not appear to be sufficiently abundant to be economically important. The presence of the
zinc carbonate mineral, smithsonite, suggests that some zinc mineralization may be secondary.

MEL MAIN ZONE JERI ZONE JERI NORTH ZONE MEL EAST ZONE
EOR EOR EOR EOR
EOR1
Zn/Pb/Ba in carbonate & silica
EOR EOR EOREOR
EOV
EOR1 EOR1
Phyllite/ mudstone
Phyllite/ mudstone
EOR1 with Zn
H. LEO KING & ASSOCIATES INC.
COMPARATIVE STRATIGRAPHIC SECTIONS OF MINERALIZED ZONES
MEL PROPERTYFILE: P:/2017/MEL DATE: MARCH 2017
SILVER RANGE RESOURCES LTD.
FIGURE 7.5
150 m
1-20 m
10-40 m30 m
3-5 m Zn in chert
Dolomitized and silicified
EOV
EOR1
EOR
Noncalcaerous phyllite/mudstone
Basaltic volcanic flows and volcaniclastics
Cryptograined limestone
Wavy-banded argillaceous limestone
Silicified and dolomitized limestone with zinc
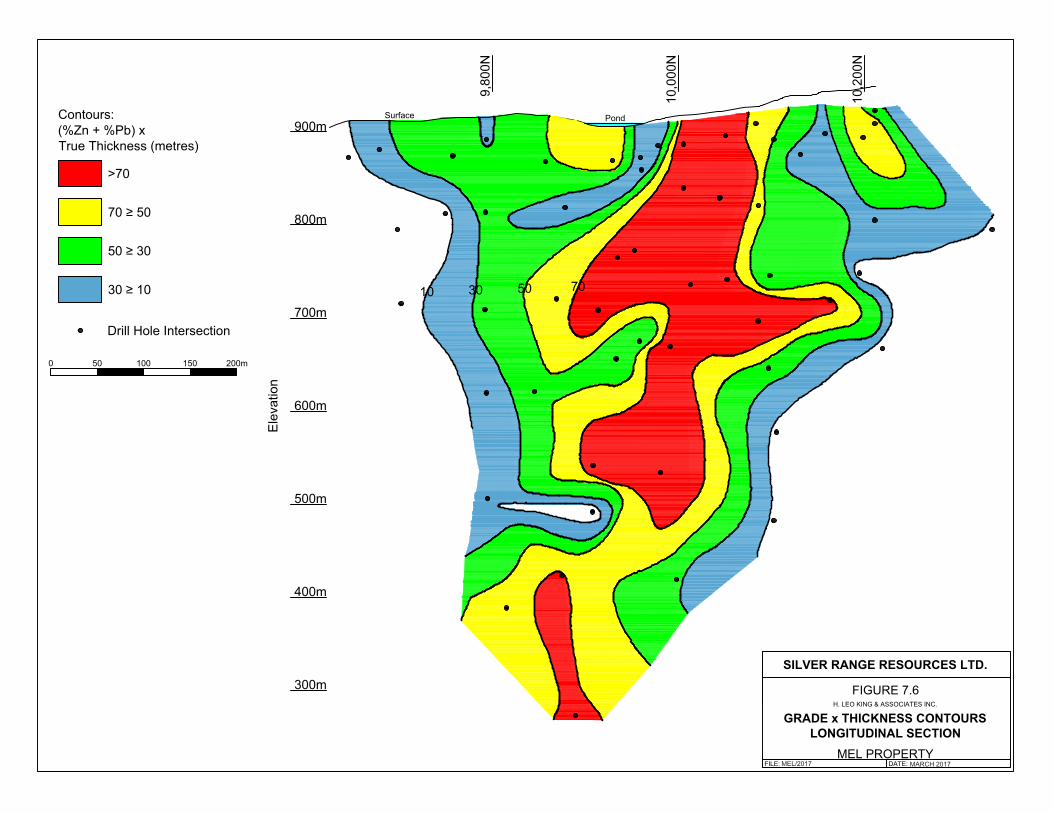
MEL/2017 MARCH 2017

Page | 27
Ten (10) holes totaling 1,009 meters have tested the Jeri Zone. Nine of the holes, drilled
over a strike length of 550 meters, intersected zinc mineralization. Significant intersections of
smithsonite and sphalerite from the drilling include 3.37 meters of 13.11% Zn in Hole J-85-1, 4.5
meters of 7.96% Zn in Hole J-85-2 and 2 meters of 14.6% Zn in Hole J-85-4.
Eleven (11) trenches were excavated across the Jeri Zone along a 2.5 kilometer
segment of the favorable horizon. Significant zinc values were obtained from: Trench No. 3,
which assayed 5.3% Zn over a sample width of 7 meters; Trench No. 4, which returned 10.5%
Zn over a sample width of 5 meters; and, Trench No. 5, which returned 16.5% Zn over a sample
width of 5 meters. The mineralization in trenches consisted of disseminated smithsonite and
minor sphalerite hosted in silicified and dolomitized limestone. The work conducted to date on
the Jeri Zone is not sufficient to allow a resource estimate.
About three kilometers of favorable stratigraphy between the Jeri and Jeri North Zones
remains to be tested by trenching or drilling.
7.2.3 Jeri North Zone
Geological mapping has traced the altered limestone horizon hosting the Jeri Zone for 8
kilometers northward through the Jeri North Zone, where diamond drilling discovered zinc
mineralization within an extensive chert horizon, which overlies cryptograined limestone and
underlies volcanic flows and tuffs. The best drill results were from: Hole J-95-4, which
intersected 9.9% Zn over 5 meters (4.7 meters estimated true width); and, Hole J-95-5, which
was drilled on the same section line and intersected 15.6% Zn over 5.1 meters (3.1 meters
estimated true width) 70 meters down dip from the J-95-4 intersection.
Sphalerite occurs mostly within the chert horizon but also occurs in lesser amounts
within an overlying ash layer and underlying dolomitized limestone. The sphalerite within the
chert is very coarse grained where observed in drill core.
In 1996, additional drilling was completed in an attempt to expand the zone of zinc
mineralization intersected in Holes J-95-4 and J-95-5. One of these holes, J-96-10, was drilled
on-strike 656.17 feet to the south of J-95-4 and intersected two intervals containing significant
sphalerite. One interval assayed 3.39% Zn over 2.1 meters of core length, and the other
interval returned 12.38% Zn over 3.0 meters of core length. However, holes that tested further
down dip and on-strike of the above-mentioned intersections failed to encounter significant zinc
mineralization, thus limiting the potential size of the known zone to about 400 meters in strike
length and 100 meters down dip.
The discovery of zinc mineralization at the Jeri North Zone indicates there is potential for
discovery of additional deposits of stratigraphically controlled zinc mineralization elsewhere
along the east limb of the syncline on the Property.

Page | 28
7.2.4 Mel East Zone
At the Mel East Zone, zinc mineralization occurs as smithsonite at the contact between
crypto-grained limestone and wavy-banded limestone on a faulted-offset(?) segment of the
eastern fold limb. Three grab samples taken in 1981 from three separate small outcrops
averaged 9.6% Zn. Subsequent soil sampling revealed a 1,400 meter long, zinc-in-soil
geochemical anomaly that coincides with the projected surface trace of the mineralized contact.
No trenching or diamond drilling have been done at the Mel East Zone.
8.0 DEPOSIT TYPE
The zinc-lead-barite mineralization at the Property differs somewhat from zone to zone
and is difficult to definitively categorize as a specific deposit type. The zones show certain
characteristics that are consistent with carbonate replacement deposit (“CRD”) model but also
exhibits features common to sedimentary exhalite (“SEDEX”) and karst/unconformity in-filling,
Mississippi Valley-type (“MVT”) deposits. None of the deposit models is a perfect fit for any of
the mineral zones on the Property. The main characteristics of the CRD, SEDEX, and MVT
models are briefly summarized in the following paragraphs.
CRD mineralization results from high-temperature alteration of limestone strata. Most of
these deposits contain pyritic ores with zinc-lead-silver as ubiquitous metals. They are
epigenetic and although stratabound, commonly exhibit discordant features (Titley, 1993).
Silicification is the primary alteration of the carbonate minerals in the host limestone, and barite
is often present in the ore assemblage. Mines with CRD mineralization are common in the
Cordillera of Mexico and southwestern USA. The Silvertip deposit in northern British Columbia
and the McMillian deposit in southeastern Yukon (Figure 7.1) are local examples of CRD
mineralization.
SEDEX mineralization forms stratabound, tabular to lensoid beds of predominantly
sulphide minerals that are deposited on the seafloor in basins near exhalative centers occurring
along deep-seated faults or fracture zones acting as conduits for mineral-rich brines (Carne and
Cathro, 1982). Those deposits are mainly enriched in zinc, lead and silver and feature iron
sulphides, sphalerite, galena and often barite interbedded with basinal sedimentary rocks. Most
SEDEX deposits are syngenetic and are hosted in reduced facies, fine-grained sedimentary
rocks that consist predominantly of carbonaceous chert and shale (Goodfellow and Lydon,
2007). There are numerous large SEDEX deposits in Selwyn Basin of Yukon and northern
British Columbia including the mines of the Faro district and the Howard’s Pass, Tom, Jason
and Cirque deposits (Figure 7.1).
MVT deposits contain low temperature, epigenetic, lead-zinc±silver minerals that occur
with dolomite, calcite and quartz gangue as open space filling within platform carbonate
sequences. The mineralization is stratabound and mostly consists of galena, sphalerite, pyrite
and marcasite. Barite and fluorite are often present (Alldrick et al, 2005). The Goz deposit on

Page | 29
east-central Yukon and Robb Lake deposit in northern British Columbia are local examples of
MVT mineralization (Figure 7.1).
The mineral zones at the Property are all stratabound and are hosted in a predominantly
carbonate formation within a generally basinal sequence of rocks. Galena-lead ratios from
mineralization collected in the Mel Main and Jeri Zones are more radiogenic than those from
material that define the Canadian Cordilleran shale curve (Godwin and Sinclair, 1982 and
Godwin et al, 1988). The galena-lead data for mineralization from the Property is consistent
with Devonian-Mississippian deposition, which would make it an epigenetic event, because the
host strata are Cambrian-Ordovician Rabbitkettle Formation. This factor favors an CRD or MVT
model for mineralization at the Property (Pigage, 2008). Nelson and Colpron (2007) argue that
there is a possible genetic link between SEDEX deposits formed in Selwyn Basin and MVT
deposits found in adjacent carbonate platform sequences. They suggest that both types of
mineralization could be deposited from metal-enriched hydrothermal brines emanating from
deep-seated extensional structures located along active boundaries between basinal and
platform settings.
9.0 EXPLORATION
Aside from aerial photographic surveys and Light Intensity Distance and Range (LIDAR)
surveys, flown in summer and fall 2014 to document historical work areas, no exploration work
was conducted on the Property by Silver Range.
Benz has recently acquired the Property and, as of the date of this report, has not yet conducted
any exploration work or other studies.
10.0 DRILLING
No drilling was conducted on the Property by Silver Range, the prior owner, nor has any
drilling been completed by Benz.
11.0 SAMPLE PREPARATION, ANALYSIS AND SECURITY
No sampling of soil or rock has been conducted on the Property by the, the prior owner,
nor has any sampling been completed by Benz.
12.0 DATA VERIFICATION
Geological and geotechnical logging of drill holes was recorded as hard copy and later
transcribed into a digital data base on Excel spreadsheets. The drill hole data base, includes
drill collar coordinates, elevations of collars, down-hole survey data, rock types and assay data
for all 90 drill holes completed on the Property.
Visual comparison of hard copy and digital data was conducted on selected holes to
ensure accuracy. Any discrepancies identified were corrected.

Page | 30
The author, H. Leo King, a qualified person, has been directly involved in managing
exploration work at the Property since 1975. The work included managing diamond drilling,
trenching, geochemical soil sampling and geological mapping programs. He has reviewed all
technical information in the Company’s files with respect to exploration work carried out on the
Property. In 2011 and 2012, he participated in compilation of digital files for all drilling carried
out on the Property.
The author believes that the historical data used in the compilation is adequate for the
purposes of the mineral resource estimation that forms part of this Technical Report.
13.0 MINERAL PROCESSING AND METALLURGICAL TESTING
No metallurgical test processing or metallurgical testing has been carried out on samples
from the Property by Silver Range, the prior owner, nor by Benz, the current owner. Historical
metallurgical testing on drill core from the Mel Main Zone is described in Section 6.2 of this
Technical Report.
14.0 MINERAL RESOURCE ESTIMATE
14.1 INTRODUCTION
At the request of Miloje Vicentijevic, President and CEO of Benz Mining Corp. (“Benz”),
Giroux Consultants Ltd. was contracted to complete resource estimates on the Mel Main
Deposit, located 80 kilometers east-northeast of Watson Lake and 47 kilometers north of the
Alaska Highway in southeastern Yukon. The resource was estimated by Gary Giroux, P.Eng.
MASc., who is a qualified person and independent of Benz, based on the tests outlined in NI 43-
101.
The data base supplied for this resource has an effective date of November 12, 2014 and
contained information on 64 diamond drill holes. A list of the drill holes used in the resource
calculation is contained in Appendix I of this Technical Report. Since the issue of the 2014
report, no drilling has been completed on the Property and therefore this resource is still current.
The zinc equivalent cut-off used for resource reporting has been adjusted to reflect current
metal price forecasts.
14.2 GEOLOGICAL SOLID
At the Property, Cambrian to Ordovician marine sediments and similar age volcanic
rocks host zinc-lead-barite mineralization. The main host units are carbonate and clastic
sediments that are broadly folded in a north-south trending, overturned syncline. Four (4)
sediment-hosted, zinc-rich zones have been identified on the Property: the Mel Main, Jeri, Jeri
North and Mel East Zones.
A geological solid for the Mel Main Zone (the “Mineralized Solid”) was provided by
Matthew Dumala, P.Eng. from Archer, Cathro & Associates (1981) Limited. In addition, a Barite

Page | 31
Shell solid that surrounds the Mineralized Solid in places, an overburden surface and a
topographic surface were provided.
Figures 14.1 and 14.2 show isometric views of the Mineralized Solid and Barite Shell, surface
topography, overburden surface and drill hole traces.
Figure 14.1: Isometric view looking W showing Mineralized Solid in red, Barite Shell in
blue, surface topography, overburden surface and drill hole traces.

Page | 32
Figure 14.2: Isometric view looking NW showing Mineralized Solid in red, Barite Shell in
blue, surface topography, overburden surface and drill hole traces.
14.3 DATA ANALYSIS
Drill hole collars, down-hole surveys and assays for 64 drill holes were supplied for the
Mel Main Zone resource estimate. Two lead assays reported as <0.05% were replaced with
values of 0.03%. Eight (8) lead and zinc assays reported as <0.01% were replaced with values
of 0.01%. Two (2) lead assays reported at 0.00% were set to 0.01%. Barium assays reported
as not sampled were set to 0.01% in 2 cases. Ten (10) barium assays reported as 0.00% were
set to 0.01%. A table of significantly mineralized intercepts appears in Appendix II of this
Technical Report.
There were 15 gaps within the from-to sequence that were filled with 0.01% for each
variable.
Spot checks were completed on 53% of the assays by comparing original assay
certificates with the digital assays reported. A total of 5 errors were found with most 2nd decimal
errors. This represents a 2% error rate which is reasonable.
In 2012, 107 selected pieces of core were re-sampled by taking a ¼ core. Holes
sampled ranged from 87-4 to 94-48. The results are compared in Table 14.1.
Table 14.1: Original assays compared with Duplicate ¼ core assays
Variable Number Mean Grade S. D. Minimum Value
Maximum Value
Coef. of Variation
Zn (%) 107 6.28 5.57 0.01 29.20 0.89
Dup. Zn (%) 107 6.32 5.42 0.02 31.22 0.86
Pb (%) 107 2.12 3.11 0.01 15.75 1.47
Dup. Pb (%) 107 1.94 2.94 0.01 17.77 1.52
Ba (%) 107 31.47 17.48 0.05 59.61 0.55
Dup. Ba (%) 107 27.29 13.67 0.03 51.81 0.50
Scatter plots are shown for all variables in Figure 14.3. In each case the best fit
regression line is slightly below the equal value line. For each variable, this is due to a few
outliers where the second ¼ core sample was less than the original assay. Since the duplicate
sample was ½ the size of the original these few outliers are not unexpected. In general, the
duplicate assays match the originals very well and show no analytical bias.
Drill holes were “passed through” the Mineralized Solid and Barite Shell with the
intersections of drill holes with solids recorded. Of the 64 supplied drill holes, 48 intersected the
Mineralized Solid. Data for all drill holes are shown in Appendices I and II of this Technical
Report, with data for the 48 holes that intersected the Mineralized Solid at the Mel Main Zone
highlighted.
The assays were then back-tagged with a code for mineralized zone (MIN), barite
envelope (BA) and waste assigned. The domain interpretation was checked by comparing the

Page | 33
domain boundaries with original assays. Assay statistics for each of the three domains are
shown in Table 14.2.
It should be noted that all coordinates are in a local mine grid and should be converted
to UTM coordinates in the future.
Figure 14.3: Scatter plots for Original assays versus Duplicates
Scatter Plot - ZN ORIG. VS DUP.
0
5
10
15
20
25
30
35
40
ZN (%)
0
5
10
15
20
25
30
35
40
ZN
(%
) -
Du
plic
ate
0.9377 R107 N
Scatter Plot - PB ORIG. VS DUP.
0
5
10
15
20
PB (%)
0
5
10
15
20
PB
(%
) -
Du
plic
ate
0.8694 R107 N
Scatter Plot - BA ORIG. VS DUP.
0
10
20
30
40
50
60
BA (%)
0
10
20
30
40
50
60
BA
(%
)Duplic
ate
0.7653 R107 N
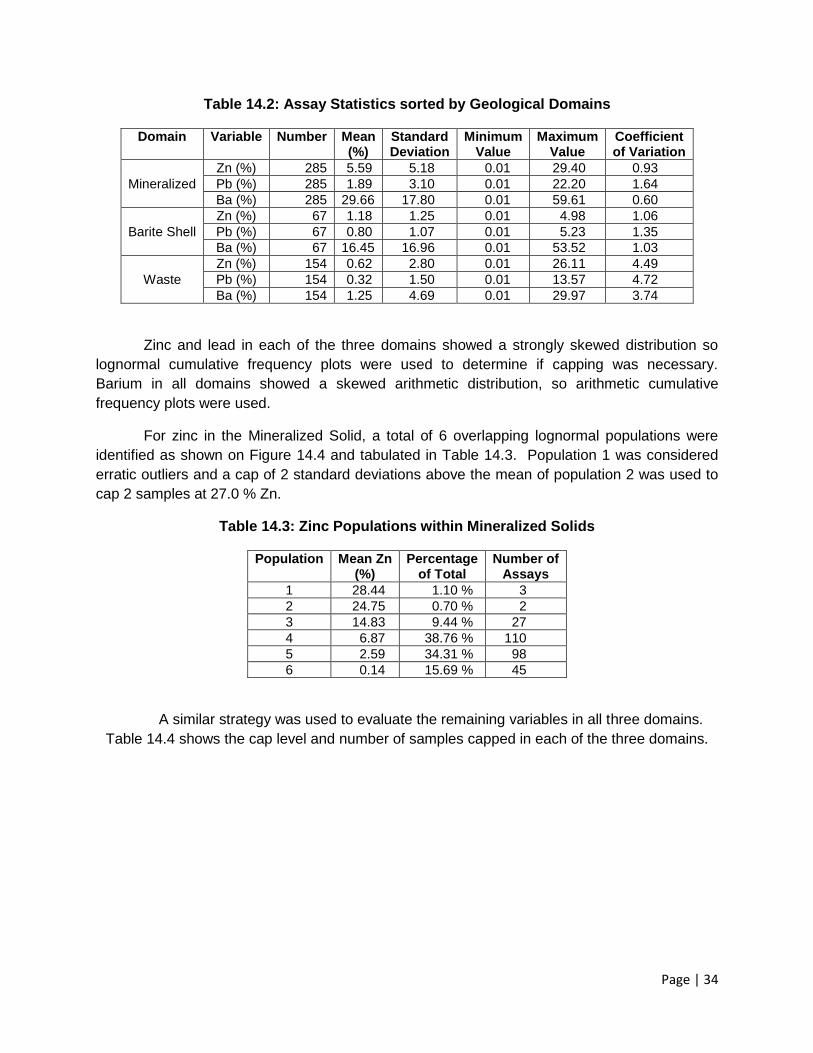
Page | 34
Table 14.2: Assay Statistics sorted by Geological Domains
Domain Variable Number Mean (%)
Standard Deviation
Minimum Value
Maximum Value
Coefficient of Variation
Mineralized
Zn (%) 285 5.59 5.18 0.01 29.40 0.93
Pb (%) 285 1.89 3.10 0.01 22.20 1.64
Ba (%) 285 29.66 17.80 0.01 59.61 0.60
Barite Shell
Zn (%) 67 1.18 1.25 0.01 4.98 1.06
Pb (%) 67 0.80 1.07 0.01 5.23 1.35
Ba (%) 67 16.45 16.96 0.01 53.52 1.03
Waste
Zn (%) 154 0.62 2.80 0.01 26.11 4.49
Pb (%) 154 0.32 1.50 0.01 13.57 4.72
Ba (%) 154 1.25 4.69 0.01 29.97 3.74
Zinc and lead in each of the three domains showed a strongly skewed distribution so
lognormal cumulative frequency plots were used to determine if capping was necessary.
Barium in all domains showed a skewed arithmetic distribution, so arithmetic cumulative
frequency plots were used.
For zinc in the Mineralized Solid, a total of 6 overlapping lognormal populations were
identified as shown on Figure 14.4 and tabulated in Table 14.3. Population 1 was considered
erratic outliers and a cap of 2 standard deviations above the mean of population 2 was used to
cap 2 samples at 27.0 % Zn.
Table 14.3: Zinc Populations within Mineralized Solids
Population Mean Zn (%)
Percentage of Total
Number of Assays
1 28.44 1.10 % 3
2 24.75 0.70 % 2
3 14.83 9.44 % 27
4 6.87 38.76 % 110
5 2.59 34.31 % 98
6 0.14 15.69 % 45
A similar strategy was used to evaluate the remaining variables in all three domains.
Table 14.4 shows the cap level and number of samples capped in each of the three domains.

Page | 35
Figure 14.4: Lognormal cumulative frequency plot for Zn in Mineralized Solid
Table 14.4: Capping levels for each domain
Domain Variable Cap Level Number Capped
Mineralized Solid
Zn 27.0 % 2
Pb 16.6 % 2
Ba 58.4 % 2
Barite Shell
Zn 4.0 % 2
Pb 4.7 % 1
Ba 50.0 % 1
Waste
Zn 2.5 % 8
Pb 0.9 % 9
Ba 9.0 % 7

Page | 36
The assays statistics after capping are tabulated below.
Table 14.5: Capped Assay Statistics for all Domains
Domain Variable Number Mean (%)
Standard Deviation
Minimum Value
Maximum Value
Coefficient of Variation
Mineralized Solid
Zn (%) 285 5.57 5.11 0.01 27.00 0.92
Pb (%) 285 1.86 2.93 0.01 16.60 1.57
Ba (%) 285 29.65 17.80 0.01 58.40 0.58
Barite Shell
Zn (%) 67 1.15 1.18 0.01 4.00 1.02
Pb (%) 67 0.79 1.04 0.01 4.70 1.32
Ba (%) 67 16.40 16.84 0.01 50.00 1.03
Waste
Zn (%) 154 0.25 0.65 0.01 2.50 2.56
Pb (%) 154 0.11 0.25 0.01 0.90 2.25
Ba (%) 154 0.70 2.15 0.01 9.00 3.09
14.4 COMPOSITES
The mineralized intervals in all drill holes ranged from a minimum of 1.3 meters to a
maximum of 31.2 meter. Within the Mineralized Solid, a composite length of 2.0 meters was
selected to best represent the data. Within the surrounding Barite Shell the sampled intervals
ranged from a minimum of 0.15 meter to a maximum of 12.45 meter. Within the Barite Shell, a
composite length of 1.0 meter was used. For external waste a composite length of 5 meter was
used. For all domains, down-hole composites were formed from boundary to boundary.
Samples less than ½ the composite length at the domain boundaries were combined with
adjoining samples to produce a uniform support of Comp. Len. ± ½ Comp. Len.
Of note, the entire drill core from an upper Mineralized Solid interval in drill hole 78-6
from 22.75 to 44.50 and in drill hole 78-7 from 26.0 to 43.07 was shipped to Lakefield in March
1978 for metallurgical tests. These intervals were combined at Lakefield and a single assay
was taken, which ran 3.87% Zn, 2.49% Pb and 30.3 % Ba. These intervals had this average
grade inserted for the estimation only. As adding a constant grade for these 2 meter
composites would add a level of continuity that does not exist, they were omitted from the
variography.

Page | 37
The composite statistics for each domain are tabulated below.
Table 14.6: Composite Statistics for all Domains
Domain Comp. Length
Variable Number Mean (%)
Standard Deviation
Minimum Value
Maximum Value
Coefficient of Variation
Mineralized Solid
2.0 m
Zn (%) 265 5.90 4.37 0.01 26.80 0.74
Pb (%) 265 1.72 2.06 0.01 10.94 1.20
Ba (%) 265 29.80 14.94 0.01 57.30 0.50
Barite Shell 1.0 m
Zn (%) 133 0.95 1.06 0.01 4.00 1.12
Pb (%) 133 0.67 0.87 0.01 4.70 1.30
Ba (%) 133 15.90 16.87 0.01 50.00 1.06
Waste 5.0 m
Zn (%) 2,119 0.02 0.07 0.01 1.74 4.44
Pb (%) 2,119 0.01 0.04 0.01 1.10 2.95
Ba (%) 2,119 0.03 0.30 0.01 9.00 11.18
Within the Mineralized Solid, zinc and lead had lognormal distributions while the barium
distribution was arithmetic. A correlation matrix was produced for variables within the
Mineralized Solid.
Zinc Lead Barium
Zinc 1.0000
Lead 0.4381 1.0000
Barium 0.4672 0.1824 1.0000
14.5 VARIOGRAPHY
Pairwise relative semivariograms for zinc, lead and barium were produced within the
Mineralized Solid domain. In each case anisotropy was demonstrated with the longest ranges
along strike and down dip. There were not enough pairs in the across dip direction to model so
a nominal range was applied. Nested spherical models were fit to each variable. The nugget-
to-sill ratio for zinc and barium were a reasonable 33% and 35%, respectively. The nugget-to-
sill ratio for lead was quite high at 60% indicating higher sample variability for lead.
For the Barite Shell domain, there were insufficient data points to model, so the
semivariograms produced for the Mineralized Domain were applied.
Within the external Waste Domain isotropic spherical nested models were fit to each
variable.
The semivariograms are attached as Appendix III of this Technical Report, and the
parameters are summarized in Table 14.7.

Page | 38
Table 14.7: Semivariogram Parameters for all variables in all Domains
Domain Variable Az. / Dip C0 C1 C2 Short Range (m)
Long Range (m)
Mineralized Solid & Barite Shell
Zn
0 / 0
0.30 0.15 0.45
30.0 80.0
270 / -15 5.0 10.0
90 / -75 20.0 150.0
Pb
0 / 0
0.78 0.20 0.32
60.0 160.0
270 / -15 5.0 10.0
90 / -75 20.0 150.0
Ba
0 / 0
0.30 0.10 0.45
50.0 110.0
270 / -15 5.0 10.0
90 / -75 40.0 110.0
Waste
Zn Omni Directional 0.008 0.015 0.010 20.0 300.0
Pb Omni Directional 0.005 0.015 0.010 20.0 300.0
Ba Omni Directional 0.010 0.020 0.005 20.0 300.0
Where C0 = Nugget Effect, C1 = Short Range Structure and C2 = Long Range Structure
14.6 BLOCK MODEL
A block model with dimensions 10.0 meters N-S, 5.0 meters E-W and 5.0 meters vertical
was superimposed over the domain solids. For each block the percentage below surface
topography, above the overburden-rock surface interface and within each of the Mineralized
Solid and Barite Shell domains was recorded. Material outside of the solids was coded as
waste. The block model origin was as follows.
Lower Left corner of Model
9920 East Size of column = 5 meters Number of columns = 67
9600 North Size of row = 10 meters Number of rows = 66
Top of Model
965 Elevation Size of level = 5 meters Number of levels = 150
No Rotation.

Page | 39
Figure 14.5: View looking NW showing block model with overburden in brown,
Mineralized Solid in red, Barite Shell in blue and drill hole traces.

Page | 40
14.7 BULK DENSITY
A total of 47 specific gravity determinations were made by ACME Analytical Laboratories
Ltd. in 1994 from drill core pulps in holes 94-44 and 94-46 to 49. The results are plotted below
against the combined value of Pb + Zn + Ba% in the sample. The correlation coefficient at
0.986 is very good and a best fit polynomial regression line fits the data very well. A specific
gravity for each domain was calculated by using this regression equation and the estimated
values for Pb, Zn and Ba% in each of the three domains. A nominal specific gravity of 1.8 was
applied to overburden. The specific gravity for a given block was then a weighted average as
shown below.
SG_Block = (% Min * SG_Min) + (%BS * SG_BS) + (%Was * SG_Was) + (%OB * 1.8)
% Below Topo
It is recommended that future drill campaigns take regular specific gravity measurements
on drill core from waste, barite envelope and mineralized zone material to test the relationship
between grade and density. Specific gravities from pulps measure the density of just the
mineralization present and assume zero porosity.
Figure 14.6: Scatter plot of Lab SG vs Combined Pb + Zn + Ba %
y = 0.0002x2 + 0.0128x + 2.7134R² = 0.9857
0
0.5
1
1.5
2
2.5
3
3.5
4
4.5
5
0 10 20 30 40 50 60 70
Me
asu
red
SG
fro
m L
ab
Combined Pb + Zn + Ba %
SG (LAB) vs Combined Pb+Zn+Ba
SG
Poly. ( SG )

Page | 41
14.8 GRADE INTERPOLATION
Grades for zinc, lead and barium were interpolated into blocks using Ordinary Kriging.
Kriging was completed on each domain independently using only the composites from the
domain being estimated to prevent the smoothing of grades across domain contacts. For each
domain kriging was completed in a series of 4 passes with the search ellipsoid used in each
pass oriented in the plane of the anisotropy with dimensions tied to the semi-variogram of the
variable being estimated. In the first pass the dimensions of the search ellipsoid were set to ¼
of the semi-variogram range with a minimum of 4 composites required to estimate a block. A
maximum of 3 composites were allowed from any given drill hole to ensure that a minimum of 2
drill holes were used to estimate a block. For blocks not estimated in Pass 1 a second pass
using ½ the semi-variogram range was used. A third pass at the full range and a fourth at twice
the range completed the kriging exercise. For all passes the maximum number of composites
used was set at 12 and if more than 12 were found the closest 12 were used. A fifth pass for
both the mineralized solid and barite shell filled in some blanks by relaxing the minimum number
of composites to 2 and setting the maximum number per hole to 4.
The kriging parameters for zinc in each domain are tabulated below along with the
number of blocks estimated in each pass.
Table 14.8: Ordinary Kriging Parameters for Zinc in all Domains
Domain Pass Number Estimated
Az / Dip Dist. (m)
Az / Dip Dist. (m)
Az / Dip Dist. (m)
Mineralized Solid
1 78 0 / 0 20.0 270 / -15 2.5 90 / -75 37.5
2 986 0 / 0 40.0 270 / -15 5.0 90 / -75 75.0
3 5,959 0 / 0 80.0 270 / -15 10.0 90 / -75 150.0
4 8,015 0 / 0 160.0 270 / -15 20.0 90 / -75 300.0
5 1,008 0 / 0 160.0 270 / -15 20.0 90 / -75 300.0
Barite Shell
1 1 0 / 0 20.0 270 / -15 2.5 90 / -75 37.5
2 283 0 / 0 40.0 270 / -15 5.0 90 / -75 75.0
3 2241 0 / 0 80.0 270 / -15 10.0 90 / -75 150.0
4 3420 0 / 0 160.0 270 / -15 20.0 90 / -75 300.0
5 540 0 / 0 160.0 270 / -15 20.0 90 / -75 300.0
Waste
1 13,023 Omni Directional 75.0
2 3,064 Omni Directional 150.0
3 138 Omni Directional 300.0
While only material within the Mineralized Solid is reported for zinc and lead and only
material within the Mineralized Solid and Barite Shell is reported for barite the waste was also
estimated to allow for reasonable levels of dilution to be added when a mining plan is applied.

Page | 42
14.9 CLASSIFICATION
Based on the study herein reported, delineated mineralization of the Mel Main Deposit is
classified as a resource according to the following definitions from NI 43-101 and from CIM
(2014):
“In this Instrument, the terms "Mineral Resource", "Inferred Mineral Resource", "Indicated Mineral Resource" and "Measured Mineral Resource" have the meanings ascribed to those terms by the Canadian Institute of Mining, Metallurgy and Petroleum, as the CIM Definition Standards (May 2014) on Mineral Resources and Mineral Reserves adopted by CIM Council, as those definitions may be amended.”
The terms Measured, Indicated and Inferred are defined by CIM (2014) as follows:
“A Mineral Resource is a concentration or occurrence of solid material of economic interest in or on the Earth’s crust in such form, grade or quality and quantity that there are reasonable prospects for eventual economic extraction. The location, quantity, grade or quality, continuity and other geological characteristics of a Mineral Resource are known, estimated or interpreted from specific geological evidence and knowledge, including sampling.”
“The term Mineral Resource covers mineralisation and natural material of intrinsic economic interest which has been identified and estimated through exploration and sampling and within which Mineral Reserves may subsequently be defined by the consideration and application of Modifying Factors. The phrase ‘reasonable prospects for economic extraction’ implies a judgement by the Qualified Person in respect of the technical and economic factors likely to influence the prospect of economic extraction. The Qualified Person should consider and clearly state the basis for determining that the material has reasonable prospects for eventual economic extraction. Assumptions should include estimates of cut-off grade and geological continuity at the selected cut-off, metallurgical recovery, smelter payments, commodity price or product value, mining and processing method and mining, processing and general and administrative costs. The Qualified Person should state if the assessment is based on any direct evidence and testing. Interpretation of the word ‘eventual’ in this context may vary depending on the commodity or mineral involved. For example, for some coal, iron, potash deposits and other bulk minerals or commodities, it may be reasonable to envisage ‘eventual economic extraction’ as covering time periods in excess of 50 years. However, for many gold deposits, application of the concept would normally be restricted to perhaps 10 to 15 years, and frequently to much shorter periods of time.”
Inferred Mineral Resource
“An ‘Inferred Mineral Resource’ is that part of a Mineral Resource for which quantity and grade or quality are estimated on the basis of limited geological evidence and sampling. Geological evidence is sufficient to imply but not verify geological and grade or quality continuity. An Inferred Mineral Resource has a lower level of confidence than that

Page | 43
applying to an Indicated Mineral Resource and must not be converted to a Mineral Reserve. It is reasonably expected that the majority of Inferred Mineral Resources could be upgraded to Indicated Mineral Resources with continued exploration.”
“An ‘Inferred Mineral Resource’ is based on limited information and sampling gathered through appropriate sampling techniques from locations such as outcrops, trenches, pits, workings and drill holes. Inferred Mineral Resources must not be included in the economic analysis, production schedules, or estimated mine life in publicly disclosed Pre-Feasibility or Feasibility Studies, or in the Life of Mine plans and cash flow models of developed mines. Inferred Mineral Resources can only be used in economic studies as provided under NI 43-101.”
“There may be circumstances, where appropriate sampling, testing, and other measurements are sufficient to demonstrate data integrity, geological and grade/quality continuity of a Measured or Indicated Mineral Resource, however, quality assurance and quality control, or other information may not meet all industry norms for the disclosure of an Indicated or Measured Mineral Resource. Under these circumstances, it may be reasonable for the Qualified Person to report an Inferred Mineral Resource if the Qualified Person has taken steps to verify the information meets the requirements of an Inferred Mineral Resource.”
Indicated Mineral Resource
“An ‘Indicated Mineral Resource’ is that part of a Mineral Resource for which quantity, grade or quality, densities, shape and physical characteristics are estimated with sufficient confidence to allow the application of Modifying Factors in sufficient detail to support mine planning and evaluation of the economic viability of the deposit. Geological evidence is derived from adequately detailed and reliable exploration, sampling and testing and is sufficient to assume geological and grade or quality continuity between points of observation. An Indicated Mineral Resource has a lower level of confidence than that applying to a Measured Mineral Resource and may only be converted to a Probable Mineral Reserve.”
“Mineralisation may be classified as an Indicated Mineral Resource by the Qualified Person when the nature, quality, quantity and distribution of data are such as to allow confident interpretation of the geological framework and to reasonably assume the continuity of mineralisation. The Qualified Person must recognise the importance of the Indicated Mineral Resource category to the advancement of the feasibility of the project. An Indicated Mineral Resource estimate is of sufficient quality to support a Preliminary Feasibility Study which can serve as the basis for major development decisions.”
Measured Mineral Resource
“A Measured Mineral Resource is that part of a Mineral Resource for which quantity, grade or quality, densities, shape, and physical characteristics are estimated with confidence sufficient to allow the application of Modifying Factors to support detailed mine

Page | 44
planning and final evaluation of the economic viability of the deposit. Geological evidence is derived from detailed and reliable exploration, sampling and testing and is sufficient to confirm geological and grade or quality continuity between points of observation. A Measured Mineral Resource has a higher level of confidence than that applying to either an Indicated Mineral Resource or an Inferred Mineral Resource. It may be converted to a Proven Mineral Reserve or to a Probable Mineral Reserve.”
“Mineralisation or other natural material of economic interest may be classified as a Measured Mineral Resource by the Qualified Person when the nature, quality, quantity and distribution of data are such that the tonnage and grade or quality of the mineralisation can be estimated to within close limits and that variation from the estimate would not significantly affect potential economic viability of the deposit. This category requires a high level of confidence in, and understanding of, the geology and controls of the mineral deposit.”
Modifying Factors
“Modifying Factors are considerations used to convert Mineral Resources to Mineral Reserves. These include, but are not restricted to, mining, processing, metallurgical, infrastructure, economic, marketing, legal, environmental, social and governmental factors.”
Within the Mel Main Zone surface mapping and drill hole interpretation were used to
establish the limits of the Mineralized Solid and hence geological continuity. Grade continuity
can be quantified by semi-variogram analysis. By orienting the search ellipse in the directions
of maximum continuity, as established by variography, the grade continuity can be utilized to
classify the resource.
For the Mel Main Zone the drill hole density is still too coarse to classify any blocks
measured or indicated. All blocks are classified as Inferred at this time.
The resource is first presented using a zinc cut-off in Table 14.9.

Page | 45
Table 14.9: Mel Main Zone – Inferred Resource within Mineralized Solid using a Zn Cut-off
Cut-off (Zn%)
Tonnes > Cut-off
(tonnes)
Grade > Cut-off
Zn (%) Pb (%) Ba (%) Barite% (BaSO4)*
2.0 5,630,000 6.30 1.82 25.99 44.15
2.5 5,580,000 6.34 1.82 26.07 44.29
3.0 5,430,000 6.44 1.82 26.44 44.92
3.5 5,260,000 6.54 1.82 26.39 44.83
4.0 5,050,000 6.65 1.80 26.33 44.73
4.5 4,680,000 6.84 1.78 26.32 44.72
5.0 4,150,000 7.11 1.75 26.16 44.44
5.5 3,530,000 7.44 1.71 26.04 44.24
6.0 2,850,000 7.85 1.67 25.67 43.61
6.5 2,240,000 8.28 1.65 25.48 43.29
7.0 1,730,000 8.73 1.65 25.00 42.48
* % Barite (BaSO4) = % Ba x 1.699
As shown by the correlation matrix in section 14.3 there is poor correlation between all
three variables. This is also shown in Figure 14.7 where a long section shows zinc, lead and
barium, each colour coded by estimated block grades within the Mineralized Solid. Clearly the
highest zinc areas are not necessarily the highest lead or barium areas. As a result, using a
zinc cut-off is not the best way to present the data.

Page | 46
Figure 14.7: Long sections showing estimated Zn, Pb and Ba blocks colour coded by
grade
0.0 < Zn < 2.0%2.0 <= Zn < 4.0%4.0 <= Zn < 6.0 %6.0 <= Zn < 8.0 %8.0 <= Zn < 10.0%10.0 % < Zn
0.0 < Ba < 10.0%10.0 <= Ba < 20.0%20.0 <= Ba < 30.0 %30.0 <= Ba < 40.0 %40.0 <= Ba < 50.0%50.0 % < Ba
0.0 < Pb < 1.0%1.0 <= Pb < 2.0%2.0 <= Pb < 3.0 %3.0 <= Pb < 4.0 %4.0 <= Pb < 5.0%5.0 % < Pb

Page | 47
The zinc-lead resource will most probably be an underground mining target while some
of the barite might be accessible by open pit. As a result, the resources are presented in two
ways. A zinc equivalent can be determined as follows:
CIBC1 Long term price Recovery (Lakefield, 1978) Factor
Zinc - US$1.01/lb. 90.3 % 20.11
Lead – US$0.94/lb. 97.7 % 20.25
Note 1 CIBC Global Mining Group Feb. 24, 2017 Long Term price forecast.
ZnEQ = (Zn % x 20.11) + (Pb % x 20.25)
20.11
Note barium is not included in the Zn Equivalent due to possible different mining
scenarios. The barite resource within both the Mineralized Solid and Barite Shell is presented
separately with a barite cut-off and only above the 700 meters level as it is unlikely the material
below this level would be economic.
At this time, no economic studies have been completed and an economic cut-off is
unknown. Assuming open pit mining costs of $3.50/t, underground mining costs of $65.00/t,
processing costs (including G&A) of $27.00, downstream costs (transportation and treatment) of
$44.50/t, metal prices of $1.01 for Zn & $0.94 for Pb and an exchange rate of 1.22 a reasonable
ZnEQ cut-off might be 3.0 % for the open pit and 5.0 % for underground.
This resource will have to be evaluated in a PEA at some point to determine how much
of the resource could be mineable.
Table 14.10: Mel Main Zone – Inferred Resource within Mineralized Solid using a Zn
Equivalent Cut-off
Cut-off (ZnEQ %)
Tonnes > Cut-off (tonnes)
Grade > Cut-off
Zn (%) Pb (%) ZnEQ (%) BaSO4 (%)
2.0 5,640,000 6.29 1.82 8.12 44.12
2.5 5,640,000 6.30 1.82 8.13 44.13
3.0 5,640,000 6.30 1.82 8.13 44.14
3.5 5,610,000 6.31 1.82 8.15 44.24
4.0 5,550,000 6.35 1.83 8.19 44.33
4.5 5,440,000 6.42 1.84 8.28 44.70
5.0 5,280,000 6.51 1.86 8.38 45.05
5.5 5,100,000 6.60 1.88 8.49 45.07
6.0 4,840,000 6.71 1.91 8.64 44.94
6.5 4,460,000 6.87 1.96 8.84 44.71
7.0 3,970,000 7.08 2.00 9.10 44.59

Page | 48
Table 14.11: Mel Main Zone – Inferred Barite Resource Above 700 meter Elevation
Cut-off (BaSO4 %)
Tonnes > Cut-off (tonnes)
Grade > Cut-off
BaSO4 (%) Zn (%) Pb (%)
20.0 3,350,000 48.44 4.96 1.70
21.0 3,340,000 48.57 4.97 1.71
22.0 3,320,000 48.72 4.98 1.71
23.0 3,290,000 48.93 5.00 1.71
24.0 3,270,000 49.09 5.02 1.72
25.0 3,250,000 49.25 5.03 1.72
26.0 3,230,000 49.38 5.04 1.73
27.0 3,210,000 49.56 5.06 1.73
28.0 3,180,000 49.75 5.07 1.74
29.0 3,150,000 49.95 5.09 1.74
30.0 3,100,000 50.25 5.11 1.75
35.0 2,850,000 51.84 5.22 1.80
40.0 2,500,000 53.81 5.31 1.85
45.0 2,019,000 56.49 5.35 1.92
50.0 1,503,200 59.59 5.39 1.98
The zinc equivalent resource above the 700 meter level is shown in Table 14.12.
Table 14.12: Mel Main Zone – Inferred Resource within Mineralized Solid using a Zn
Equivalent Cut-off above the 700 meter level
Cut-off (ZnEQ %)
Tonnes > Cut-off (tonnes)
Grade > Cut-off
Zn (%) Pb (%) ZnEQ (%) BaSO4 (%)
2.0 2,780,000 5.98 1.94 7.93 52.80
2.5 2,770,000 5.98 1.94 7.93 52.83
3.0 2,770,000 5.98 1.94 7.94 52.85
3.5 2,760,000 5.99 1.95 7.95 52.92
4.0 2,740,000 6.02 1.96 8.00 53.00
4.5 2,690,000 6.07 1.98 8.06 53.13
5.0 2,630,000 6.12 2.00 8.13 53.31
5.5 2,530,000 6.21 2.02 8.24 53.43
6.0 2,400,000 6.32 2.05 8.38 53.55
6.5 2,200,000 6.46 2.10 8.58 53.51
7.0 1,950,000 6.65 2.14 8.81 53.50

Page | 49
14.10 MODEL VERIFICATION
The block model was verified in a number of ways. First the composite values were
statistically compared to the estimated blocks within the Mineralized Solid and Barite Shell. The
results shown below in Table 14.12 are reasonable considering the amount of data available.
Table 14.13: Comparison of composites vs estimated blocks
Domain Variable Composites Kriged Blocks
Number Mean C.V. Number Mean C.V.
Mineralized Solid
Zn (%) 265 5.90 0.74 16,050 6.14 0.35
Pb (%) 265 1.72 1.20 16,050 1.79 0.54
Ba (%) 265 29.80 0.50 16,050 23.32 0.52
Barite Shell
Zn (%) 133 0.95 1.12 6,394 0.90 0.59
Pb (%) 133 0.67 1.30 6,394 0.65 0.67
Ba (%) 133 15.90 1.06 6,394 13.78 0.63
Within the Mineralized Solid, a second test was made by re-estimating all blocks with
some percentage of Mineralized Solid present using Inverse Distance Squared interpolation and
a similar search strategy. The results from 16,050 blocks showed at a zero cut-off the OK
model contained 0.61% less pounds of zinc, 5.42% more pounds of lead and 3.9% less pounds
of barium than the ID2 model.
Finally, the estimated kriged grades were visually compared to composite grades on a
series of east-west cross sections. Four example sections are shown below as Figures 14.8 to
14.11. The results compared well with no bias indicated.

Page | 50
Figure 14.8: Section 10100 N showing composites and estimated Zn blocks
20
0
20
0
30
0
30
0
40
0
40
0
50
0
50
0
60
0
60
0
70
0
70
0
80
0
80
0
90
0
90
0
10
00
10
00
9900E
9900E
10000E
10000E
10100E
10100E
10200E
10200E
10300E
10300E
74_1
75_11
79_2
79_6
87_6
89_30
94_49
3.90
3.97
3.31
3.17
3.69
3.95
3.33
3.40
3.43
3.50
3.44
3.49
3.51 3.34
3.38
3.42 3.29
3.31
5.63
5.45 5.63 5.74
4.70 5.53 5.63
4.86 4.39 5.51
4.07 5.20 4.49
5.34 4.30 4.52 4.61
5.83 4.47
4.65
4.80
5.87
5.61
5.91
4.41
5.52
5.39 5.40
5.82 5.22
4.98 5.28
5.11 5.10
4.51 4.37 4.31
5.84 4.82 4.04
4.74
4.78
4.39
5.86 4.78
4.88 4.73
4.92 4.69 4.47
5.73 4.55
4.90 4.74
4.92
4.63
4.94
4.92 5.62 4.89
5.86
5.90 5.45
5.85 5.32
5.76
5.59
5.48
5.28 5.91
5.67
5.67
5.66
5.74 4.79 4.83
4.92 4.76
5.98 5.12 4.45
4.96 4.39 4.86 5.54
4.98 4.64 5.34 5.82
5.03 5.89 4.61
5.81 5.38
5.11
5.69
5.60
5.64
5.79 5.52
5.84 4.46
5.77 5.70
4.42
5.57
4.40
5.49
4.47
4.39
5.39
4.38
4.34
5.43
6.36
6.22
6.19 7.51
7.45 7.92
7.10 6.72
6.70
6.98 6.05
7.88
7.16
7.92 7.13
7.62
6.08
6.17
6.00
6.27
6.09
6.13
6.10 6.25
6.55
6.09 7.71
7.35
7.24 7.70
7.91 7.07 6.60
6.95 6.55 7.06
6.97 6.62 7.59
6.83
6.98 6.48
7.61
7.61
7.63 7.61 7.11
7.61 7.13 6.84
7.61 6.93
7.05
7.11 7.87
6.82 7.20
7.68 6.31
7.91
6.00 6.18
6.86
6.72 6.13
6.26 6.37
6.11
6.02
6.13
6.28
6.20
6.29
6.28
6.38
6.62
6.20
6.52
8.14
8.78 8.55
8.09
9.66
8.74 8.54
8.78
8.08
8.07
9.13
9.10
9.14 8.34
9.06
8.76
8.12
8.10
8.38
10.63
10.32 10.45
11.56 11.00
11.07 12.06
10.64 11.88
10.26 10.62
11.08
MEL MINERALIZED SOLID - SECTION 10100 N - SHOWING ZN (%)
LEGEND
0.0 < Zn < 2.0 %
2.0 <= Zn < 4.0 %
4.0 <= Zn < 6.0 %
6.0 <= Zn < 8.0 %
8.0 <= Zn < 10.0 %
10.0 % <= Zn

Page | 51
Figure 14.9: Section 10000 N showing composites and estimated Zn blocks
20
0
20
0
30
0
30
0
40
0
40
0
50
0
50
0
60
0
60
0
70
0
70
0
80
0
80
0
90
0
90
0
10
00
10
00
9900E
9900E
10000E
10000E
10100E
10100E
10200E
10200E
10300E
10300E
74_2
74_3
78_3
78_4
78_6
79_1
79_7
87_5
90_43
94_47
3.39
3.16
3.76 3.76
3.52
3.37
3.24 3.63 3.11
3.84
3.97
3.75 3.61
3.68
3.92
2.96
3.88
2.91
2.95
3.74
3.55 2.96
3.21
3.83 3.16
3.06
2.92 3.58
2.76 3.20
3.14
5.67 5.35
5.49 5.67 5.42 5.30
4.50 5.48 5.68 5.35 5.00
4.52 5.47 5.81 5.27
5.17 4.38 4.85 5.48 5.67
4.87 5.08 4.30 4.50 5.49
5.01 4.49 4.45 4.25
4.41 4.72 5.04 4.36
4.61 4.95
4.31 4.81
4.76 5.11
4.30 5.96
4.51
4.42 4.47
5.03
5.89 4.41
4.31
5.72
4.39 4.06
4.15 4.14
4.56
5.62 4.60
4.40
5.66
5.36
5.51
5.39
5.53 4.90
4.11
4.50 4.62
4.60 5.90
4.72 4.86 4.56
4.89
5.36 5.92
5.90 5.50 5.44
5.75 5.38 5.26 5.90
5.85 5.76 5.14 4.83
5.55 4.83 5.39 5.18 4.13
5.44 4.83 5.10 5.12 5.21 4.50
4.83 4.90 5.19 4.42
4.84 5.23 4.31 5.04 4.72
5.11 4.12 4.70 5.70 4.86
5.21 4.54 4.51
4.53
5.15 4.95
4.80
4.50
5.98
5.04
5.62
5.64 4.97
4.30
4.25
4.68 4.19
5.36 4.32
4.09
4.50 5.26
4.89 5.15
4.59
4.53 4.74
4.67 5.30
5.30 5.30
5.69 4.84 4.89
4.88 4.80
5.05
6.78
6.18
6.36
6.24
7.41
6.24
6.06
6.27
7.64 7.69
6.94
6.25
6.59
7.91
6.33 7.15
7.11 6.63 7.31
7.47
7.00 6.82
7.14 6.71 6.27
6.96 6.46 6.94
6.81 6.39
6.99 7.27 6.70
7.03
7.05 7.25
6.92 7.61 6.46
6.04
6.29
6.29 6.08
6.29 6.20
6.29
6.63 6.29 7.00
7.45 6.52
6.38 6.83
7.31 6.41
6.29 6.22
6.81 6.12
6.89
7.13
6.90 6.91
6.88
6.86
7.20 6.84
7.50 6.87
6.84
6.91
7.22
6.83
6.86
7.11
7.68
6.97
7.41
7.07
7.72
6.85
7.22
7.96
7.47
6.24
7.72
6.93
7.61
6.93
7.89
6.08
6.75
8.34
8.07
8.36
8.40
9.42
8.81
8.17
8.86
9.30
8.12
8.56
8.01
8.57
8.13
9.18 9.15
9.59
9.57 9.16
8.25
8.20
9.93
9.85
9.11
9.38
9.41
8.06
8.65
9.81
8.77
9.91
8.20
9.29
8.61
9.83
8.90 9.42
9.97 8.46
8.91
9.71 8.69
9.45
8.50 8.81
9.20 8.89
9.64 9.49
8.45 8.50
8.74
9.15 8.88 8.02
9.46 9.52 8.40
8.48 8.81
9.15
9.37
8.53 8.27
8.78
9.16
8.33
10.01
10.23
10.33 11.81
11.03
10.44
10.67
10.88 11.88
10.04 11.35
11.02
11.41
11.71 12.15
12.61 12.62
12.48
12.36
12.65
13.39
10.67
11.23
11.35
11.41 10.95
11.48 11.86
12.30
12.38 10.70
11.81 11.88
12.84
13.11
12.69 11.33
12.35
12.62
12.35
10.95
11.78
10.41
11.15
11.76
10.19
10.69 13.99
14.09
MEL MINERALIZED SOLID - SECTION 10000 N - SHOWING ZN (%)
LEGEND
0.0 < Zn < 2.0 %
2.0 <= Zn < 4.0 %
4.0 <= Zn < 6.0 %
6.0 <= Zn < 8.0 %
8.0 <= Zn < 10.0 %
10.0 % <= Zn
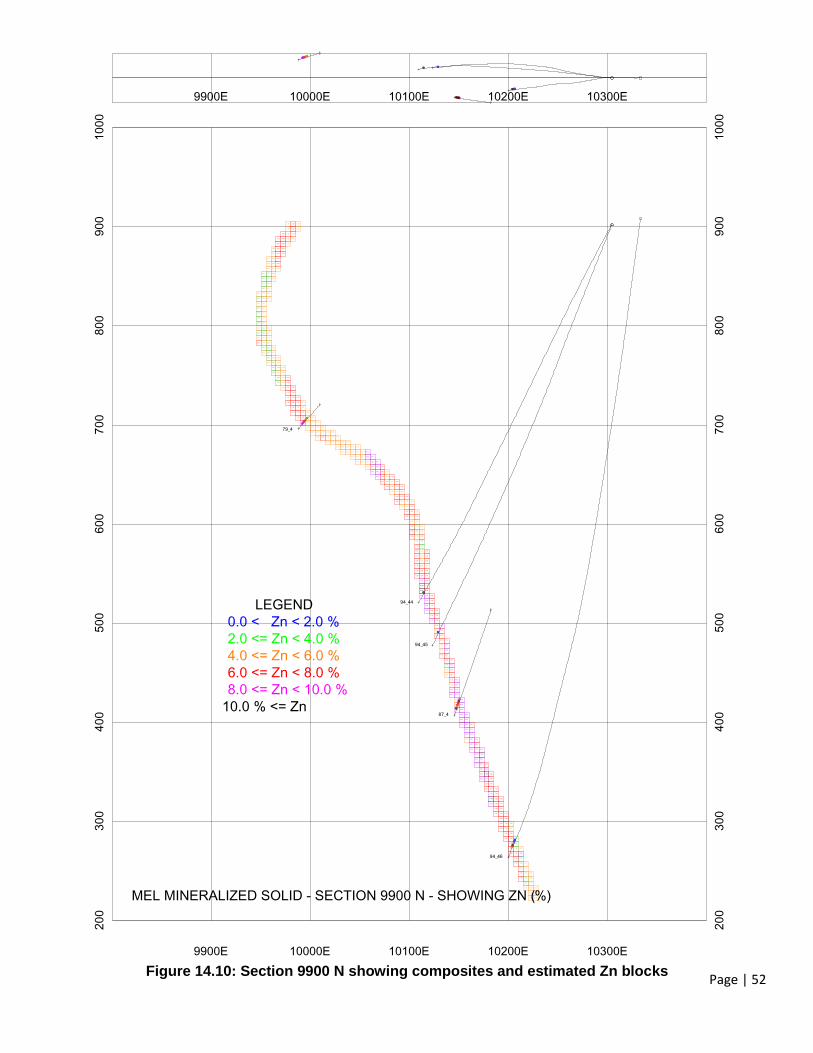
Page | 52
Figure 14.10: Section 9900 N showing composites and estimated Zn blocks
20
0
20
0
30
0
30
0
40
0
40
0
50
0
50
0
60
0
60
0
70
0
70
0
80
0
80
0
90
0
90
0
10
00
10
00
9900E
9900E
10000E
10000E
10100E
10100E
10200E
10200E
10300E
10300E
79_4
87_4
94_44
94_45
94_46 1.94
3.41 3.77
3.25 3.81
3.27 3.81
3.26
3.86 3.97
3.99
3.33
3.52
3.06
3.44
3.35 3.49
3.71
3.99
3.74 3.32
3.97
3.09
3.40
3.51 3.89
3.78
3.96
3.33
2.45
2.44
2.42
2.41
3.68
3.66
2.32
2.86
3.76
2.47
2.68
2.13
2.73
5.69 5.80
5.69 5.80
5.82
5.69
5.87
5.96
5.37
4.76 5.28
4.48 5.28
4.04 5.10 5.95
4.86
4.73
4.16
4.27 4.13 4.70
4.84
4.06 4.04
4.14
4.11
4.11
4.04
4.27 4.30
4.12
5.32 4.09
4.15
4.13
5.28 4.12
4.03 5.82
4.23 5.39
5.93
4.06 5.99
5.90
5.41
5.60
5.95
4.79
4.97
4.53
4.55 4.65
4.79 4.68 5.19
5.10 4.60 5.13 5.70
4.61 5.03 4.91 5.49 5.50
4.64 5.48 5.61 5.10
5.70 5.90 5.10 5.68 4.01
5.10 5.70 5.83 4.10 4.20
5.37 5.63 4.10 4.62 4.21
4.10 4.54 4.21
4.11 4.21 4.21
4.21
5.27
5.12
5.94 5.91
5.64
5.42 5.87 5.90
5.30 5.63 5.89
5.49 5.90
5.83
5.62
5.68 5.89
5.83
5.83
5.58
5.68
5.48
5.47
5.74
5.42
5.26
5.18
5.78
5.40
5.88
5.70
4.53
4.79
4.45
4.67
5.01
4.81
4.83 5.67
5.40
5.17
5.41 5.07 5.92
5.17 5.74
5.46 5.55
6.26
6.26
6.66 6.13
7.35 6.66 6.30
6.79 6.66
6.37 6.68
6.31 7.33
6.30
6.27
6.41
6.73
6.64
6.13 7.03
6.10 7.08
7.02 6.22
6.28 6.85 7.26
6.23 7.37
6.14 7.37 6.14
7.23 7.39
7.66
6.44
7.99 7.19
7.62
7.78 6.03
7.51 6.21
7.24 6.13 7.86
6.35 6.12 6.63
6.24
6.63
6.13 6.91
6.46 6.39
6.02
6.36
6.80 6.39
6.10
6.53 6.39
7.09 6.36
7.68 6.26
7.75 6.07
7.70 7.94 7.74
7.29 7.64 6.91
6.96
7.16
7.29
7.95
7.64
7.70
6.56 8.00
7.80 7.48
6.86
6.44
7.61
6.93 6.82
6.72 7.13
7.53 6.45
6.42 7.53
7.39
7.21
7.15
6.15
7.69
6.43
6.94
6.58
6.86
7.20
6.68 6.86
6.94
7.25 6.98
6.92
6.47 6.86
6.87 6.81 7.07
7.00
6.92 6.96
6.84 7.17
6.79 7.11
6.78 7.01 6.64
6.90 7.26
6.82 7.23
6.76 7.12
6.97 6.76
6.85 7.38
7.30
7.07
6.88 7.48
7.28
7.16
6.27
7.60
7.19
8.12
8.09 9.07
9.25 8.01
8.60
8.62 8.63
9.10
9.53
8.99 8.32
9.40
9.64
9.69
8.47
8.32
8.47
8.02
8.82
8.00
8.08
8.03
8.27 8.14
8.42
8.52
8.22 8.43
9.62 8.38
8.58
8.22 8.63
8.50 8.11
8.43 8.36
8.51
8.50
8.63 8.28
8.80
8.23 8.80
8.17
8.22
8.60 8.71
8.20
8.70
10.26
10.62
11.99
11.90
11.96
MEL MINERALIZED SOLID - SECTION 9900 N - SHOWING ZN (%)
LEGEND
0.0 < Zn < 2.0 %
2.0 <= Zn < 4.0 %
4.0 <= Zn < 6.0 %
6.0 <= Zn < 8.0 %
8.0 <= Zn < 10.0 %
10.0 % <= Zn

Page | 53
Figure 14.11: Section 9800 N showing composites and estimated Zn blocks
20
0
20
0
30
0
30
0
40
0
40
0
50
0
50
0
60
0
60
0
70
0
70
0
80
0
80
0
90
0
90
0
10
00
10
00
9900E
9900E
10000E
10000E
10100E
10100E
10200E
10200E
10300E
10300E
74_5
75_9
79_11
79_12
79_8
79_9
87_7
94_48
3.08
3.19
3.22
3.49
3.49
3.47
3.43
4.84 5.30
5.32 4.07
5.30 5.13
4.83
5.33
5.09
4.91
4.81
4.75
4.72
4.72 4.95
5.97 4.74
4.75
5.43 4.73
5.43 5.17
4.59 5.99 4.88
4.75
5.43 5.18
5.43 5.19 4.90
4.86
5.18
5.19
5.27
4.99
5.01
5.16 4.49
5.35 4.93 4.46
4.95 4.42 4.21
4.48 4.80
4.80
4.13
4.13 4.28
4.35 5.01
4.48 5.69
4.48 5.70 5.76
5.66 5.88 5.94
5.74 5.05
6.00 5.24
5.91 5.11 5.92
5.03 5.49
5.33
5.13
5.62
5.42
5.15
5.91
5.48
5.18
5.94
5.72
5.20
4.89 5.96
5.78
5.43
4.89 5.89
5.05 5.70
5.74 5.02
5.50 4.64
4.71
4.20 5.20
5.26 4.89
5.42 4.43
5.76 4.46
4.42
5.92 4.63
4.89
4.02 5.41
4.38 5.46
4.50
4.02
4.35
4.46
4.07
5.63 4.36
5.58 4.45
5.56
4.18
4.47
5.46
5.55
5.44
5.32
5.37 5.66
5.50
5.44
5.49
5.76 5.71
5.62
5.60
5.64
5.87 5.77
5.73
5.74
5.79
5.99
5.86
5.88
6.23 7.67
6.27 6.71
6.30 6.18
6.83
7.11 6.60
7.47 6.77
7.35 6.99
6.04 6.91
7.19
6.08
6.00
6.01
6.95
6.01 6.64
6.53
7.44
6.14
6.65
6.83
6.22 6.83
6.22 6.83 6.03 6.31
6.03 6.31 6.31
6.44 6.31 6.99
6.31 7.23
6.42
6.72 6.06
6.72 6.20
6.29
6.47
6.16 6.55 6.09
6.19 6.06
7.03
6.51
6.49
6.97 6.64
6.47 6.39
6.52
6.55
6.45 6.24
6.38
6.45
6.40
6.23
6.32
6.31
6.18
6.21
6.25
6.24
6.33
6.39 6.21
6.13
6.25
6.22 6.04
7.94
7.36
7.48 6.03
7.01 7.90
6.70
7.45
6.39
6.53
7.15 6.63
6.43
7.18
7.45
6.64
6.13
7.16
6.88 6.04
9.22 9.22
8.85 8.93
8.82 8.91
8.75 8.89
8.49 8.08
8.48 8.12
8.48 8.50
8.59
8.34 9.53
9.32
9.00
9.77
9.58
8.21
8.02
10.25
10.08
MEL MINERALIZED SOLID - SECTION 9800 N - SHOWING ZN (%)
LEGEND
0.0 < Zn < 2.0 %
2.0 <= Zn < 4.0 %
4.0 <= Zn < 6.0 %
6.0 <= Zn < 8.0 %
8.0 <= Zn < 10.0 %
10.0 % <= Zn

Page | 54
15.0 MARKET STUDIES
The most recent barite marketing study was completed in September 2014 by World
Industrial Minerals for Silver Range (Guilinger, 2014) and is described in more detail in Section
6.3.
Based on the location of the Property, the 2014 study concluded that barite sales would
likely be restricted to western Canadian and Alaskan markets. Current production facilities are
very limited in this region, and demand is high due to on-going oil and gas operations. The
study recommends that an initial sales rate of 50,000 metric tonnes per year would be
reasonable, and not too disruptive to existing import markets. This figure does not currently
assume any sales to Alaska, which it notes are feasible and should be evaluated more through
further study. Based on analysis of 2013 pricing, a sales price of $100 USD per metric tonne
(FOB mine site) is recommended. The study also suggests that potential synergies may exist
with the under-utilized Fireside Minerals barite grinding plant in Watson Lake.
16.0 ENVIRONMENTAL STUDIES, PERMITTING AND SOCIAL OR
COMMUNITY IMPACT
There are no known environmental, permitting, or title issues regarding the Property that
may affect the mineral resource. The government of Yukon is supportive of mining, which
historically has had an important economic impact on the territory.
In March 2015, Silver Range completed a Heritage Resource Overview Assessment
(HROA) for the Mel claims, however, a detailed field study was not completed (Kaufmann and
Heffner, 2015). It is recommended a Heritage Resources Impact Assessment (HRIA) be
completed over areas identified as having elevated potential to contain heritage resources.
17.0 ADJACENT PROPERTIES
There are no known mineral occurrences or deposits within the immediate vicinity of the
Property that are not covered by the mineral claims comprising the Property, and no claims,
except the Property claims, are shown as currently in good standing on claim map 95D/06.
Banyan Gold Corp.’s, Hyland Gold project is located 19 km west of the Mel property and
comprises sediment hosted, structurally controlled gold mineralization. This mineralization is
not representative of mineralization found on the Mel Property.
18.0 OTHER RELEVANT DATA AND INFORMATION
There is no additional information or explanation necessary to make this Technical
Report understandable and not misleading.

Page | 55
19.0 INTERPRETATION AND CONCLUSIONS
The Mel Main Zone is a zinc-lead-barite deposit hosted within Cambrian to Ordovician
marine sediments. Mappable units of carbonate and clastic sediments are broadly folded into a
north-south trending, overturned syncline. The Mel Main Zone occurs on the western limb of
the syncline within a lensy stratigraphic horizon, which is underlain by crypto-grained limestone
and overlain by a distinctive phyllite/mudstone unit that grades upward into wavy-banded,
argillaceous limestone.
Diamond drilling at the Mel Main Zone has outlined an Inferred Mineral Resource
estimated at 5,280,000 tonnes of 6.51% Zn, 1.86% Pb and 45,05% barite using a 5% Zn-
Equivalent cut-off. In-fill drilling to up-grade the resource to an Indicated Mineral Resource is
warranted.
The overturned and steeply dipping deposit is open to extension down dip, with potential
for a significant increase in tonnage. Three other zones of zinc-rich mineralization are also
present on the Property, but no mineral resource estimates have been made for them.
The Jeri Zone is located about 4 kilometers northeast of the Mel Main Zone on the
eastern limb of the same syncline that hosts the zinc-lead-barite mineralization at the Mel Main
Zone. At the Jeri Zone, unusually strong alteration of the footwall carbonate rocks to zinc-
bearing, hydrothermal dolomite and silicified dolomite has been exposed for several kilometers
along the fold limb.
The Jeri Zone has been tested by trenching and diamond drilling over a strike length of
550 meters. The drilling has intersected encouraging zinc values, including 13.11% Zn over
3.37 meters, within the larger zone of silicified and dolomitized limestone.
Trenching at the Jeri Zone has exposed smithsonite and minor sphalerite mineralization
over widths of 5 meters to 7 meters. Sampling has yielded high zinc values in 3 of 10 trenches,
with mineralized exposures grading from 5.3% Zn over a sample width of 7 meters to 16.5% Zn
over a sample width of 5 meters.
There is potential for the discovery of additional zinc mineralization within the thick
dolomitized section of limestone that hosts the Jeri Zone. An untested geophysical anomaly at
the south end of the Jeri Zone, interpreted to be located at the base of the dolomitized
limestone, represents a particularly attractive drill target.
The Jeri North Zone lies 3 kilometers north of the Jeri Zone on the eastern limb of the
same syncline that hosts the Mel Main Zone. At the Jeri North Zone, coarse-grained sphalerite
occurs within a chert unit below a volcanic flow and volcaniclastic sequence that grades
upwards into wavy-banded limestone. This mineralized chert unit rests on the same crypto-
grained limestone that forms the base of the Mel Main Zone. The chert and volcanic sequence
seen at the Jeri North Zone is not present at the Mel Main and Jeri Zones.

Page | 56
Diamond drilling at the Jeri North Zone resulted in the discovery of promising zinc
mineralization. One hole intersected 9.9% Zn over a core length of 5 meters and another hole,
drilled deeper on the same section, intersected 15.6% Zn over a core length of 5.1 meters.
Although additional drilling on the Jeri North Zone did not extend the zone of zinc mineralization
beyond an estimated 400 meters of strike extent, there is significant potential within untested
portions of the favorable horizon.
Geological mapping, trenching, geophysical and geochemical surveys and diamond
drilling at the Jeri and Jeri North Zones have traced the favorable zinc-bearing horizon along the
east limb of the syncline for a length of 8 kilometers. Additional drilling is warranted to evaluate
several untested targets.
The Mel East Zone is another showing of zinc mineralization, located 3 kilometers
northeast of the Jeri Zone. It is believed to be hosted in a faulted-offset of the same
stratigraphic sequence that hosts the Mel Main, Jeri and Jeri North Zones. The Mel East Zone
has not been trenched or drilled. Anomalous zinc-lead soil geochemistry and a coincident IP
anomaly have defined a drill target.
The mineralized zones on the Property have been variously categorized as carbonate-
replacement, sedimentary exhalative and unconformity or karst-related. Although the zones
exhibit certain characteristics that are consistent with each of these deposit types, they also
show features that are inconsistent with each deposit type. Regardless, the mineralization
occurs in a predictable stratigraphic setting, which has made historical exploration successful
and will help guide future work.
Exploration conducted to date at the Mel Main Zone has defined a mineral resource of
potential economic interest, and historical metallurgical test work has produced encouraging
results. Further work on the Mel Main, Jeri, Jeri North and Mel East Zones is warranted.

Page | 57
20.0 RECOMMENDATIONS
At a minimum two phases of exploration are proposed at the Mel Property. Both phases
could potential be expanded with the allocation of additional expenditures depending on the
results obtained during these initial programs.
20.1 Phase I
The objectives of the Phase I exploration work include:
• Trace the on-strike extensions of the Mel Main zone
• Trace the on-strike extension of the Jeri and Jeri North mineralization, specifically in
the 3.0 km interval between these two zones
• Identify potential drill targets along the strike extensions of the Mel Main and Jeri to
Jeri North mineralizes trends
The principal exploration activities required to achieve these objectives include
mapping, trenching and soil and rock sampling. Mapping and soil geochemical sampling
will be conducted along strike of the Mel Main and between the Jeri and Jeri North
zones. In the case of the Mel strike extensions, surface conditions are more favourable
for tracing this zone to the north; to the south swampy ground may make this more
challenging and drilling may be the only way to trace Mel Main. Where suitable
strategically placed trenches, utilizing a helicopter portable CANDIG excavator, will be
undertaken for the Mel Main strike extensions. Ground conditions are favourable for a
systematic trenching program between Jeri and Jeri North with initial trenching to be
spaced approximately 200m apart. Trenches are expected to be between 50 to 75 m
long. Rock sampling of visible mineralization and associated alteration will be
undertaken where encountered in trenches and outcrop exposures for all areas.
A budget for the above-mentioned Phase I Program is estimated at $149,820 as
presented in Table 20.1. It is estimated that the program would take 20 days to
complete.

Page | 58
TABLE 20.1
PROPOSED BUDGET FOR PHASE 1 EXPLORATION AT MEL PROPERTY
Activity Cost ($)
Mechanical (CANDIG) Trenching (230 hrs. @ $150/hr.) 34,500
Helicopter Support ($1,500/hr. includes fuel) 6,000
Aircraft Support (3 weeks, 4 flights x $750/trip) 3,000
Assaying (500 samples @ $30/sample) 15,000
Room & Board (4 persons x 23 days x $155/day) 14,260
Labour (mapping and sampling) 37,500
Fuel 1,590
Expediting, Safety & Accounting 6,500
Quad rental 4,000
Supervision and report preparation 9,500
131,850
Consultant’s administration fee 4,350
Sub-total
136,200
Contingency (10%) 13,620
TOTAL (excluding taxes)
149,820

Page | 59
20.2 Phase II
Principal Objectives:
Mel Main Zone - test targets that have potential to increase the current Inferred Resource.
Mel Main Zone - confirm continuity of mineralized grades and widths in the upper portion of the Inferred Resource.
Additional Objectives:
Jeri and Jeri North zones Define in detail the lateral extent of any mineralization identified from the Phase I
trenching program; Explore for mineralization along the immediate 2.0 km strike direction to the north
of Jeri North Identify potential drill targets for future testing based on trenching results.
Complete the Heritage Resources Impact Assessment initiated by Silver Range for the Property Holdings as part of the ongoing permitting requirements.
Activities: Mel Main Zone
Diamond drilling will be the main activity to test targets that could potentially increase the resource. Areas with potential to increase the resource include on-strike extensions to the north and south of the Mel Main Zone and extension of the current Inferred Resource at depth. Final diamond drill hole locations will be determined during site surveys and mapping completed during Phase I. Drilling recommendations include:
Step-out drilling along the northern strike projection of the Mel Main Zone. Ground conditions appear more permissive in this direction for relatively shallow holes. Approximately 600 m of drilling are recommended in four to six holes.
Ground conditions (presence of swamps) make tracing the south strike projection of the Mel Main Zone difficult using trenching, consequently drilling appears as the only way to test this area. Two to four holes are recommended to test this southern extension for a minimum of 400 m and a maximum of 800 m of drilling. Drilling and placement of the third and fourth holes will depend on the results of the first two step-out holes.
Two to four drill holes are recommended to test the projected depth extension of Mel Main mineralization below the current limits of the Inferred Resource. If results for the first two holes are positive, then the second two holes should be completed to help define the grade and size potential of this extension of the mineralization. The total anticipated drill meterage is approximately 2700 m.
Complete five confirmation drill holes within the upper 200 m of the current Inferred Resource for a total of approximately 750 m of drilling. The main idea is to test the grade and width continuity of the mineralization.

Page | 60
Multi-element analysis of the mineralization should be undertaken on strategically selected samples. This type of information is useful for exploration, metallurgical evaluations and environmental assessments. Jeri and Jeri North
The recommended work plan for Jeri and Jeri N includes additional trenching, mapping and rock sampling, as follows.
Recommendations to follow-up mineralization identified in the 3.0 km interval between Jeri and Jeri North from the Phase I trenching program include:
In-fill trenching spaced 100m apart to define the lateral limits of mineralization found during Phase I trenching. Rock sampling of exposed mineralization. An estimate 250 to 300 m of in-fill trenching is anticipated.
Selection of drill targets will be based on the trench results.
Prior surface mapping and continuity of the prospective stratigraphic package suggests that the northern strike extension of the Jeri North Zone warrants additional exploration. A work proposal is recommended to explore for mineralization for approximately 2.0 km north on strike from Jeri North. Field activities would consist primarily of geological mapping, surface trenching and rock sampling. Initial trenching to be spaced approximately 200 m apart with trenches anticipated to be 50 to 75 m long; work progress is expected to be one trench per day. An estimated 300 to 500 m of trenching is anticipated for this program. Rock sampling of visible mineralization and associated alteration will be undertaken where encountered in trenches and outcrop exposures. Heritage Studies
A Heritage Resources Impact Assessment (HRIA) is required under the terms of the exploration work permit and is a follow-up on the Heritage Resource Overview Assessment (HROA) completed by Silver Range in 2015. It is recommended an HRIA be completed over areas previously identified as having elevated potential to contain heritage resources. An HRIA requires on-site field work by a qualified contractor. Duration of Recommended Phase II Program
Phase II field exploration activities are anticipated to take approximately seven
weeks. Mobilization of equipment and materials will be done in advance of the Phase II
field program. A report of results will be prepared after receipt of all analytical and
assay data following the Phase II program. A budget for the above-mentioned Phase II
Program is estimated at $1,831,500 as presented in Table 20.2.

Page | 61
TABLE 20.2
PROPOSED BUDGET FOR PHASE 2 EXPLORATION AT MEL PROPERTY
Activity Cost ($)
Diamond Drilling 4,850 m (includes fuel, core boxes, mob/demob)
565,000
Helicopter Support (includes fuel) 142,000
Fixed Wing 71,000
Excavator and Bulldozer (including fuel and operator) 84,000
Camp, Rentals and Consumables 226,000
Labour 250,000
Assaying (1,500 samples) 66,000
Logistics, and Health and Safety 88,000
Senior Supervision, Report Preparation and Accounting 59,000
Heritage Resources Impact Assessment 20,000
1,571,000
Consultant’s Administration Fee 94,000
Sub-total
1,665,000
Contingency (10%) 166,500
TOTAL (excluding taxes)
1,831,500

Page | 62
21.0 REFERENCES
Abbott, J.G., Gordey, S.P., Tempelman-Kluit, D.J., 1986. Setting of stratiform, sediment-hosted lead-zinc deposits in Yukon and northern British Columiba; in: Mineral Deposits of Northern Cordillera, J.A. Morin (ed.), Canadian Institute of Mining and Metallurgy, Special Volume 37, p. 1-18.
Alldrick, D., Sangster, D., Fonseca, A., Bradshaw, G. 2005. Mississippi Valley (MVT) Pb-Zn; Mineral Deposit Profiles, Yukon Geological Survey.
Carne, R.C. 1976. Geology of the Stratabound barite-lead-zinc Deposit on the Mel and Jean claim group, Coal River, Yukon; Department of Indian and Northern Affairs, EGS Report 1976-16.
Carne, R.C and Cathro R.J., 1982. Sedimentary Exhalative (sedex) zinc-lead-silver deposits, northern Canadian Cordillera; CIM Bulletin, April 1982, Volume 75, No 840.
Chisholm, E.O. 1973. Assessment report describing geological mapping and geochemical sampling report; prepared for The Granby Mining Company Ltd.
Croft, S.A.S, 1990. 1990 Exploration Program on Mel property Watson Lake Mining District, Yukon; report prepared by Nevin Sadlier-Brown Goodbrand Ltd.
Gabrielse, H. Blusson, S., 1969. Geology of Coal River map-area, Yukon Territory and District of Mackenzie (95D); geological Survey of Canada, Paper 68-38, 22p.
Godwin, C.I., Gabites, J.E., Andrew, A., 1988. Leadtable: a galena lead isotope data base for the Canadian Cordillera, with a guide to its use by explorationists; British Columbia Ministry of Energy, Mines and Petroleum Resources, Paper 1988-4, 188p.
Godwin, C.I., Sinclair, A.J., 1982. Average lead isotope growth curve for shale-hosted zinc-lead deposits, Canadian Cordillera; Economic Geology, vol. 77, p. 675-689.
Goodfellow, W.D. and Lydon, J.W., 2007. Sedimentary Exhalative (SEDEX) Deposits; in Mineral Deposits of Canada: A Synthesis of Major deposit Types, District Metallogeny, the Evolution of Geological Provinces, and Exploration Methods, Special Publication No. 5, Edition by W.D Goodfellow, Geological Association of Canada, Mineral Deposits Division, pp. 553-579.
Guilinger, J., 2014. World Industrial Minerals, 2014; Market Evaluation Mel Barite Deposit, Yukon Territory.
Hawthorn, G., 1990. Progress Report # 1, Metallurgical Testing, Mel Property, Yukon Territory; report for Barytex Resources Corp.
King, H. L., 1994a. Assessment Report on 1993 Exploration Program Mel property, Yukon; report for International Barytex Resources Ltd.
1994b. Assessment report on 1994 Exploration Program Mel property, Watson Lake Mining Division, Yukon; report for International Barytex Resources Ltd.
1995. Assessment report on diamond drilling, Mel property, Yukon; report prepared for International Barytex Resources Ltd.
2013. Assessment report on soil geochemical survey, Jeri North Zone, Mel property, Yukon; report prepared for Kobex Minerals Inc.

Page | 63
King, H.L. and Giroux, G.H., 2014. Technical Report on the Mel Zinc-Lead-Barite Property; report prepared for Silver Range Resources Ltd.
Livingston, C. 2012. Memo on Soil geochemical sampling program on the Jeri North Zone, Mel property; memo prepared for Kobex Minerals Inc. by Apex Geoscience Ltd.
Kaufmann, G. and Heffner, T., 2015. Heritage Resources Overview Assessment for the Mel Claim Area, Southeastern Yukon; report prepared for Silver Range Resources Ltd.
Miller, D.C., 1977. Assessment report on geological and geochemical surveys, Mel, Jean and
Wet claims, Yukon; report prepared for St. Joseph Explorations Ltd.
1979. Assessment report on diamond drilling, Mel property; report prepared for St. Joseph Exploration Ltd.
1985. Diamond Drilling Report on the Jeri and Sin claims, Mel Property, Yukon; report prepared for Novamin Resources Inc.
1987. Report on Diamond Drilling, Mel Property, Yukon; report prepared for Novamin Resources Inc.
1989. Report on the Mel property, Watson Lake Mining Division, Yukon; report prepared for Barytex Resources Corp.
1990. Report on the Mel property, Watson Lake Mining Division, Yukon; report prepared for Barytex Resources Corp.
Miller, D.C., J. D. Blanchflower, 1982. Geological and geochemical report on Joni, et al claims; report prepared for Sulpetro Minerals Limited.
Morris, et al., 1989. Prefeasibility Report for a lead, zinc, barite mine on Mel property, Yukon; report prepared for Barytex Resources Corp. by Sandwell Swan Wooster Inc.
Murphy, D.C., Mortenson, J.K., 2003. Late Paleozoic and Mesozoic features constrain displacement on Tintina Fault and limit large-scale orogeny-parallel displacement in the Northern Cordillera; GAC-MAC-SEG Joint Annual Meeting, May 25-28, 2013, Abstracts, vol. 28, abstract 151.
Nelson, J., Colpron, M., 2007. Tectonics and metallogeny of the British Columbia, Yukon and Alaskan Cordillera, 1.8 Ga to present; in: Mineral Deposits of Canada: A synthesis of major deposit-types, district metallogeny, the evolution of geological province, and exploration methods, W.D. Goodfellow (ed.), Geological Association of Canada, Mineral Deposits, Division, Special Publication No. 5, p. 755-791.
Pigage, L.C., 2008. Preliminary bedrock geology for NTS 95D/6 (Otter Creek area), Southeast Yukon; in: Yukon Exploration and Geology, 2007, D. S. Emond, L.R Blackburn, R. P. Hill and L.H Western (eds), Yukon Geological Survey, p. 237-255.
Senft, D.A., 1996. Exploration program, Mel property, diamond drilling and soil geochemistry; report prepared for Cominco Ltd.
Senft, D.A., Hall, D.C., 1998. 1997 Exploration program, Mel property, line-cutting, geophysics, soil geochemistry and diamond drilling, Watson Lake Mining Division, Yukon; report prepared for Cominco Ltd.

Page | 64
Slim, B.A., 1989. Barytex Market, a preliminary review of the barytex mineral market in North America; report prepared for Barytex Resources Corp.
Stevens, J., 2015. Aerial Photography, LIDAR Topographic Surveys, Heritage Study, Barite Marketing Study, Resource Estimation and Scoping Study; Assessment report prepared for Silver Range Resources Ltd.
Titley, S.R., 1993. Characteristics of high-temperature, carbonate-hosted massive sulphide ores in the United States, Mexico and Peru; in: Mineral Deposit Modelling, R.V Kirkham, W.D. Sinclair, R.I. Thorpe, and J.M. Duke (eds), Geological Association of Canada, Special Paper 40, p. 585-614.
Wilkinson, W.J., 1975. Report on Empire Metals option (Otter Lake), diamond drill program; report prepared for Granby Mining Corp.
Wyslouzil, D.M., Bulatovic, S., 1976. Recovery of Lead, Zinc and Barite on Mel Core Samples, Progress Report No. 1, Lakefield Research of Canada Limited.; report prepared for St. Joseph Explorations Limited

Page | 65
22.0 CERTIFICATES OF AUTHORS
22.1 Certificate and Consent of H. Leo King
I, H. Leo King, of 3633 Somerset Crescent, Surrey, British Columbia do hereby certify that:
1) I am consulting geologist with an office at 3633 Somerset Crescent, Surrey, British Columbia.
2) I graduated from University of Saskatchewan in 1961 with a B.A. (geology) and in 1966 with a
M.A. (Geology).
3) I am a member in good standing of the Association of Professional Engineers and
Geoscientists of the Province of British Columbia (Registration No. 18991).
4) I am a member in good standing of the Professional Engineers Ontario (Registration No.
23847015).
5) I have practiced my profession continuously since 1965. I have over 40 years of experience
in minerals exploration and mining geology.
6) I have read the definition of “qualified person” set out in the NI 43-101.
7) I am responsible for the preparation of Sections 1.0 (excluding Section 1.4) to 13.0 inclusive
and Sections 15.0 to 21.0 inclusive of this Technical Report titled “Technical Report on the
Mel Zinc-Lead-Barite Property and dated March 20, 2017.
8) I have supervised several exploration programs on the Mel property during the period from
1976 to 1989 and more recently managed exploration programs during 1993, 1994 and 1995.
9) As of the date of this certificate, to the best of my knowledge, information and belief, the
portions of this Technical Report for which I am responsible contain all scientific and technical
information that is required to be disclosed to make that portion of this Technical Report not
misleading.
10) I am independent of Benz Mining Corp. applying all of the tests in section 1.5 of NI 43-101.
11) I have read NI 43-101 and Form 43-101F1, and this Technical Report has been prepared in
compliance with that instrument and form.
12) I consent to the public filing of this Technical Report with any stock exchange and other
regulatory authority and its publication by them for regulatory purposes, including electronic
publication in the public company files on their websites accessible by the public.
Dated this 20h day of March, 2017.
(signed) “H.Leo King” (sealed)
H. Leo King, P. Geo.

Page | 66
22.2 Certificate of G. H. Giroux
I, G.H. Giroux, of North Vancouver, British Columbia do hereby certify that:
1) I am a consulting geological engineer with an office at 982 Broadview Dr. North Vancouver, British Columbia.
2) I graduated from the University of British Columbia in 1970 with a B.A. Sc. and in 1984 with a M.A. Sc., both in Geological Engineering.
3) I am a member in good standing of the Association of Professional Engineers and Geoscientists of the Province
of British Columbia.
4) I have practiced my profession continuously since 1970. I have over 41 years of experience estimating mineral resources. I have previously completed resource estimations on a variety of silver-lead-zinc deposits including the Wolverine, Keno Hill and Logan Deposits in Yukon.
5) I have read the definition of “qualified person” set out in NI 43-101 and certify that by reason of education,
experience, independence and affiliation with a professional association, I meet the requirements of an independent Qualified Person as defined in NI 43-101.
6) I am responsible for the preparation of Section 14 and Section 1.4 of the Technical Report titled “Technical Report
on the Mel Zinc-Lead-Barite Property” and dated March 20,, 2017. I have not visited the property.
7) I have not previously worked on this deposit.
8) As of the date of this certificate, to the best of my knowledge, information and belief, the portion of the Technical Report for which I am responsible contains all scientific and technical information that is required to be disclosed to make that portion of the Technical Report not misleading.
9) I am independent of the issuer applying all of the tests in section 1.5 of NI 43-101.
10) I have read NI 43-101 and Form 43-101F1, and the Technical Report has been prepared in compliance with that
instrument and form.
11) I consent to the public filing of this Technical Report with any stock exchange and other regulatory authority and its publication by them for regulatory purposes, including electronic publication in the public company files on their websites accessible by the public.
Dated this 20th day March, 2017.
(signed) “G.H. Giroux” (sealed)
G.H. Giroux, P.Eng., MASc.

Appendix I – Listing of all Drill Holes

Zone Hole Northing Easting Hole Length (m) Elevation (m)
Main 74_1 10087.1 9955.1 62.65 928.7
Main 74_2 10005.9 9938.7 52.13 911.0
Main 74_3 10005.9 9937.2 92.07 910.9
Main 74_4 9928.3 9938.2 48.17 906.5
Main 74_5 9789.3 9954.0 51.52 921.8
Main 74_6 9637.0 9970.4 64.33 914.7
Main 74_7 10339.7 9770.2 118.29 912.3
Main 74_8 10214.5 9944.2 74.24 950.7
Main 75_9 9790.0 9895.8 146.65 930.6
Main 75_10 9926.5 9862.0 283.84 926.7
Main 75_11 10083.5 9880.5 126.52 911.6
Main 75_12 10216.1 9866.8 157.01 913.4
Main 75_13 10341.2 9958.4 202.13 935.1
Mel North 75_14 10524.0 9986.2 130.18 1077.8
Mel North 75_15 10647.5 9985.4 151.52 1101.0
Main 75_16 10655.4 9869.7 50.30 1093.8
Main 75_17 10479.0 9863.8 53.66 1011.4
Main 75_18 10492.2 9732.5 102.44 913.8
Main 78_1 9400.0 9935.0 215.50 915.0
Main 78_2 9000.0 9925.0 46.30 900.0
Main 78_3 10006.0 9847.6 29.60 926.0
Main 78_4 10005.0 9878.1 299.00 914.0
Main 78_5 9200.0 9985.2 102.43 902.0
Main 78_6 10005.9 9962.5 200.00 887.2
Main 78_7 9928.3 9958.9 157.62 880.5
Main 79_1 10003.5 9879.6 114.90 912.9
Main 79_2 10087.6 9998.9 231.30 918.0
Main 79_3 10213.4 10002.3 306.60 942.1
Main 79_4 9931.8 10145.0 262.12 903.2
Main 79_5 9931.8 10145.0 275.23 903.2
Main 79_6 10072.6 10252.8 336.20 904.2
Main 79_7 10003.3 10141.6 260.00 903.3
Main 79_8 9789.8 10040.8 206.30 902.1
Main 79_9 9784.0 10224.8 321.80 902.3
Main 79_10 9710.8 10121.1 213.30 904.2
Main 79_11 9823.1 10075.3 289.30 901.8
Main 79_12 9814.9 9871.4 169.20 936.2
Main 87_1 9399.1 10107.1 133.20 905.4
Main 87_2 8943.0 10045.4 38.71 900.2
Main 87_3 8943.0 10045.4 66.75 900.2
Main 87_4 9861.1 10287.2 515.72 902.2
Main 87_5 10006.1 10227.9 399.59 902.5
Main 87_6 10089.6 10216.3 448.06 912.7
Main 87_7 9787.1 10229.9 409.96 902.3
Main 89_30 10097.3 9974.5 184.10 927.4
Main 89_31 10157.3 9985.4 220.06 935.0
Main 89_32 10198.6 9988.0 204.22 942.1
Main 89_33 10049.3 9973.4 54.56 919.0
Main 90_34 10039.1 9895.6 143.56 909.8
Appendix I - Listing of All Drill Holes
Holes used in Resource Estimate for the Mel Main Zone are highlighted

Zone Hole Northing Easting Hole Length (m) Elevation (m)
Main 90_35 9850.2 9973.7 203.00 918.4
Main 90_36 9751.0 9981.1 167.03 910.9
Main 90_37 9698.6 9929.9 142.07 922.2
Main 90_38 9742.0 9944.3 133.23 921.2
Main 90_39 9674.9 9970.6 64.63 912.2
Main 90_40 10129.5 9943.1 134.10 935.2
Main 90_41 9959.2 9955.6 152.70 904.2
Main 90_42 9959.2 9955.8 249.02 904.2
Main 90_43 9959.5 9955.9 43.28 904.2
Main 94_44 9900.0 10304.0 428.90 902.2
Main 94_45 9900.0 10304.0 462.10 902.2
Main 94_46 9900.0 10333.0 660.30 908.5
Main 94_47 10000.0 10376.0 542.50 903.3
Main 94_48 9805.5 10259.0 542.90 905.4
Main 94_49 10100.0 10222.0 359.00 912.8
Mel South SM 95-1 8500.0 10035.0 212.10 Unknown
Mel South SM 95-2 8500.0 9970.0 105.40 Unknown
Mel South SM 96-3 8500.0 -85.0 336.50 910.0
Jerri North J-95-1 13206.0 -456.0 146.90 1120.0
Jerri North J-95-2 13410.0 -414.0 126.80 1160.0
Jerri North J-95-3 13800.0 -450.0 117.00 1160.0
Jerri North J-95-4 14200.0 -650.0 104.80 975.0
Jerri North J-95-5 14200.0 -650.0 139.00 975.0
Jerri North J-95-6 14400.0 -650.0 87.20 1030.0
Jerri North J-95-7 15200.0 -650.0 50.60 1020.0
Jerri North J-95-8 15200.0 -800.0 75.30 1060.0
Jerri North J-96-9 14200.0 -790.0 218.20 950.0
Jerri North J-96-10 14000.0 -700.0 218.20 1030.0
Jerri North J-96-11 14408.0 -655.0 105.50 955.0
Jerri North J-96-12 14000.0 -700.0 244.10 1030.0
Jerri North J-96-13 13800.0 -521.0 181.70 1140.0
Jerri North J-96-14 13400.0 -510.0 221.30 1200.0
Jerri J-85-1 10015.5 9953.9 98.14 1107.0
Jerri J-85-2 9947.2 9925.9 105.77 1103.1
Jerri J-85-3 9947.2 9925.9 148.44 1103.1
Jerri J-85-4 9897.5 9925.3 99.69 1090.4
Jerri J-85-5 9897.5 9925.3 90.53 1090.4
Jerri J-85-6 10282.9 9931.2 118.87 1098.9
Jerri J-85-7 10331.8 9954.4 89.00 1093.1
Jerri J-85-8 10413.1 9942.6 85.95 1083.7
Jerri J-85-9 9795.9 9924.1 105.77 1065.1
Jerri J-85-10 9305.0 9396.0 67.66 960.0

Appendix II – List of Significant Intercepts

Hole From (m) To (m) Length (m) Pb% Zn% Ba% BaSO4%
74_1 37.03 41.61 4.58 4.01 7.52 38.25 64.99
incl. 39.47 41.61 2.14 7.35 8.11 38.25 64.99
And 42.37 44.20 1.83 0.70 5.16 38.25 64.99
74_2 33.83 47.40 13.57 2.16 4.83 37.13 63.08
incl. 33.83 35.66 1.83 0.17 9.31 37.13 63.08
and 39.93 41.76 1.83 5.70 4.14 37.13 63.08
74_4 37.03 47.24 10.21 1.05 5.86 26.72 45.40
incl. 38.40 40.39 1.99 0.19 8.10 28.42 48.29
and 44.81 46.63 1.82 5.33 7.92 28.42 48.29
74_5 46.02 48.92 2.90 1.44 8.53 38.60 65.58
incl. 46.02 47.55 1.53 0.10 12.25 38.60 65.58
and 47.55 48.01 0.46 8.10 9.10 38.60 65.58
74_6 57.15 58.67 1.52 1.90 3.11 0.00 0.00
74_8 66.29 70.87 4.58 2.87 8.99 32.07 54.49
incl. 66.75 68.28 1.53 3.53 9.87 32.07 54.49
and 68.28 69.04 0.76 0.45 19.73 32.07 54.49
and 69.04 70.33 1.29 3.15 6.60 32.07 54.49
75_9 131.67 134.42 2.75 0.60 4.70 37.96 64.49
And 134.72 139.60 4.88 2.65 8.35 36.78 62.49
incl. 137.16 139.60 2.44 4.85 10.40 36.78 62.49
And 142.19 144.02 1.83 2.15 3.95 12.00 20.39
75_11 107.59 124.05 16.46 2.21 3.17 31.35 53.26
incl. 110.64 113.69 3.05 0.18 6.67 29.58 50.25
and 116.28 118.11 1.83 6.10 6.70 46.37 78.78
and 122.22 124.05 1.83 8.20 0.80 43.43 73.79
75_12 145.39 151.49 6.10 1.15 5.66 21.07 35.80
incl. 146.61 148.74 2.13 1.95 12.40 29.95 50.89
75_13 198.12 198.88 0.76 1.15 13.50 NS NS
78_6 166.21 191.26 25.05 1.96 4.14 46.28 78.63
incl. 166.21 167.03 0.82 7.01 0.06 50.56 85.90
and 171.60 172.52 0.92 0.17 5.31 43.81 74.43
and 179.22 180.14 0.92 0.11 5.14 51.00 86.65
and 181.97 187.15 5.18 7.67 6.17 42.89 72.88
and 188.06 191.26 3.20 0.04 12.11 36.70 62.35
78_7 128.32 148.44 20.12 2.05 4.92 37.60 63.87
incl. 128.32 131.92 3.60 8.66 6.64 36.54 62.08
and 135.27 140.21 4.94 1.40 5.68 45.05 76.54
and 141.12 142.04 0.92 0.03 11.80 36.94 62.76
and 142.95 144.78 1.83 1.10 7.98 36.30 61.68
79_1 86.20 104.00 17.80 0.24 7.29 33.08 56.20
incl. 89.00 92.00 3.00 0.01 13.00 27.93 47.45
and 95.00 98.00 3.00 0.01 7.16 45.69 77.63
and 101.00 104.00 3.00 1.14 13.90 22.09 37.53
79_2 222.00 230.40 8.40 1.69 13.46 14.99 25.47
Appendix II - List of Significant Intercepts

Hole From (m) To (m) Length (m) Pb% Zn% Ba% BaSO4%
incl. 222.00 223.00 1.00 5.73 4.78 17.40 29.56
and 223.00 229.00 6.00 1.36 16.20 17.45 29.65
and 229.00 230.40 1.40 0.26 7.94 2.72 4.62
79_3 22.05 28.90 6.85 4.44 4.44 28.58 48.55
And 283.00 292.91 9.91 0.86 1.74 0.10 0.17
incl. 283.00 285.00 2.00 0.41 4.78 0.07 0.12
79_4 246.68 255.80 9.12 2.97 6.63 36.90 62.69
incl. 250.00 255.80 5.80 3.47 8.67 38.70 65.75
79_5 260.25 269.30 9.05 0.00 3.23 28.15 47.82
incl. 266.35 269.30 2.95 0.00 5.92 29.80 50.63
79_6 328.84 331.52 2.68 7.86 7.76 1.85 3.14
incl. 328.84 329.63 0.79 10.40 1.70 1.13 1.92
and 329.63 330.57 0.94 12.50 20.20 1.79 3.04
79_7 245.40 255.80 10.40 4.60 4.34 21.85 37.12
incl. 245.40 246.30 0.90 19.50 7.16 22.30 37.89
and 246.30 251.00 4.70 5.11 3.96 29.71 50.48
and 253.20 255.10 1.90 3.19 10.10 33.60 57.09
79_8 198.80 201.30 2.50 0.84 13.50 8.06 13.69
79_9 312.90 313.80 0.90 7.06 14.80 0.10 0.17
79_11 277.20 285.70 8.50 1.41 4.46 18.73 31.83
incl. 277.20 280.00 2.80 1.24 5.06 0.32 0.54
and 282.50 285.70 3.20 2.60 6.04 40.50 68.81
79_12 157.75 161.30 3.55 1.67 3.82 14.29 24.29
87_4 489.60 509.93 20.33 0.17 6.74 26.45 44.94
incl. 499.60 501.60 2.00 0.03 29.20 14.83 25.20
and 501.60 507.20 5.60 0.02 7.16 35.79 60.81
and 508.00 509.93 1.93 0.02 13.60 29.59 50.27
87_5 388.96 394.10 5.14 2.31 23.17 0.04 0.06
87_6 439.30 440.40 1.10 0.38 8.72 0.08 0.14
87_7 401.05 403.10 2.05 1.59 8.19 0.22 0.37
89_30 31.50 47.90 16.40 0.93 5.74 34.94 59.36
incl. 32.40 36.30 3.90 0.39 5.96 33.40 56.75
and 37.90 40.00 2.10 0.70 14.40 34.00 57.77
and 40.00 46.00 6.00 1.94 5.48 38.13 64.79
And 165.40 180.00 14.60 0.88 3.85 26.65 45.29
incl. 165.40 166.50 1.10 3.46 4.56 12.59 21.39
and 170.00 179.10 9.10 0.79 4.80 23.68 40.23
89_31 33.10 47.24 14.14 1.23 1.63 22.24 37.79
incl. 46.00 47.24 1.24 5.52 0.04 4.77 8.10
And 205.70 216.40 10.70 2.29 7.95 23.25 39.50
incl. 205.70 207.70 2.00 6.36 6.30 23.00 39.08
and 207.70 212.00 4.30 2.15 6.35 30.74 52.23
and 212.00 215.70 3.70 0.58 11.99 18.92 32.14
89_32 44.30 65.68 21.38 2.51 4.09 26.15 44.43
incl. 44.30 50.20 5.90 1.68 6.46 34.09 57.92
and 50.20 55.70 5.50 4.01 5.97 40.75 69.23
and 58.50 60.00 1.50 10.90 4.60 31.60 53.69

Hole From (m) To (m) Length (m) Pb% Zn% Ba% BaSO4%
And 189.30 195.25 5.95 1.58 2.68 31.03 52.72
incl. 193.35 195.25 1.90 1.83 5.64 35.73 60.71
89_33 25.15 43.60 18.45 0.34 8.58 35.41 60.17
incl. 25.15 32.25 7.10 0.55 6.54 42.86 72.82
and 32.25 35.40 3.15 0.04 26.80 14.11 23.97
And 158.10 171.30 13.20 2.17 7.79 40.03 68.00
incl. 158.10 161.10 3.00 6.09 5.41 31.32 53.21
and 167.10 171.30 4.20 2.09 12.87 37.18 63.16
90_34 79.90 114.10 34.20 0.58 8.76 31.25 53.10
incl. 79.90 84.50 4.60 0.12 7.29 35.46 60.25
and 84.50 87.50 3.00 0.53 17.24 35.71 60.67
and 87.50 90.50 3.00 0.04 24.76 21.61 36.72
and 90.50 93.50 3.00 0.02 14.87 30.49 51.80
and 102.50 108.50 6.00 2.15 5.91 28.36 48.18
and 108.50 111.10 2.60 0.04 13.34 13.76 23.38
90_35 46.70 59.70 13.00 2.11 5.34 36.23 61.55
incl. 49.85 52.90 3.05 1.16 6.16 36.82 62.56
and 52.90 56.69 3.79 3.70 7.80 42.55 72.29
And 187.50 199.00 11.50 3.51 4.30 40.58 68.94
incl. 188.70 198.10 9.40 3.64 5.04 46.63 79.22
90_36 30.90 57.75 26.85 1.82 4.27 26.45 44.95
incl. 33.30 39.30 6.00 0.40 8.46 38.54 65.48
and 42.30 45.30 3.00 4.36 7.89 34.98 59.43
and 56.14 57.75 1.61 5.23 4.98 23.42 39.79
90_38 110.70 112.65 1.95 0.56 2.22 29.31 49.80
90_39 45.58 48.93 3.35 0.73 9.76 0.44 0.75
90_40 60.55 71.60 11.05 0.43 3.33 31.76 53.95
incl. 63.60 66.40 2.80 0.08 8.47 21.10 35.85
90_41 47.62 53.40 5.78 0.19 2.53 35.47 60.26
And 102.95 105.68 2.73 9.91 2.55 29.97 50.92
And 124.90 146.69 21.79 2.37 6.04 35.41 60.16
incl. 124.90 126.87 1.97 10.72 3.93 11.37 19.32
and 126.87 128.94 2.07 3.71 4.97 27.85 47.32
and 130.17 137.50 7.33 3.03 8.51 35.67 60.61
and 140.00 143.26 3.26 0.03 12.81 34.98 59.43
90_42 36.00 39.30 3.30 1.74 8.24 21.57 36.66
And 235.70 242.70 7.00 0.45 3.33 23.79 40.43
90_43 29.27 37.65 8.38 1.78 2.80 21.85 37.13
incl. 30.80 34.10 3.30 3.16 6.35 33.35 56.66
94_44 395.80 397.50 1.70 5.77 17.78 0.11 0.19
incl. 396.50 397.50 1.00 7.15 26.11 0.10 0.17
And 409.05 411.05 2.00 7.77 11.92 0.07 0.11
incl. 409.05 410.15 1.10 13.57 16.53 0.08 0.14
And 415.90 419.00 3.10 8.11 13.15 0.08 0.14
incl. 416.15 417.15 1.00 15.75 16.93 0.07 0.12
and 417.15 418.15 1.00 9.09 15.31 0.08 0.14
94_45 447.45 447.95 0.50 1.13 1.39 0.08 0.14
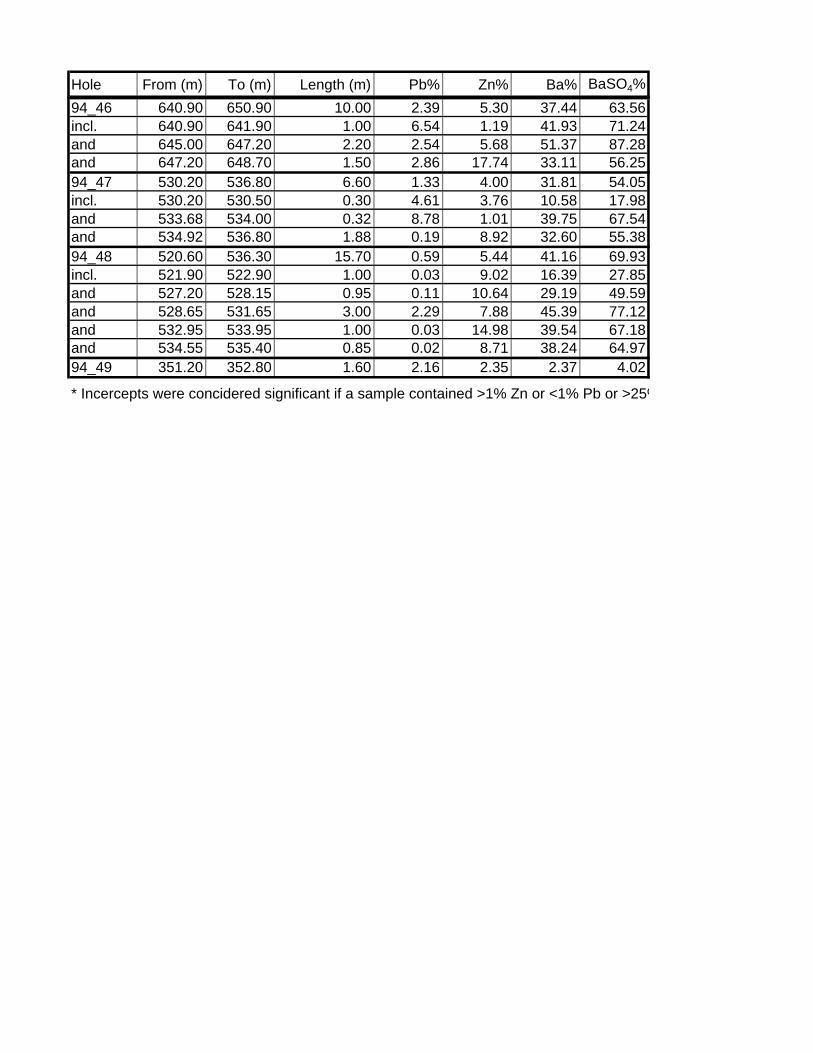
Hole From (m) To (m) Length (m) Pb% Zn% Ba% BaSO4%
94_46 640.90 650.90 10.00 2.39 5.30 37.44 63.56
incl. 640.90 641.90 1.00 6.54 1.19 41.93 71.24
and 645.00 647.20 2.20 2.54 5.68 51.37 87.28
and 647.20 648.70 1.50 2.86 17.74 33.11 56.25
94_47 530.20 536.80 6.60 1.33 4.00 31.81 54.05
incl. 530.20 530.50 0.30 4.61 3.76 10.58 17.98
and 533.68 534.00 0.32 8.78 1.01 39.75 67.54
and 534.92 536.80 1.88 0.19 8.92 32.60 55.38
94_48 520.60 536.30 15.70 0.59 5.44 41.16 69.93
incl. 521.90 522.90 1.00 0.03 9.02 16.39 27.85
and 527.20 528.15 0.95 0.11 10.64 29.19 49.59
and 528.65 531.65 3.00 2.29 7.88 45.39 77.12
and 532.95 533.95 1.00 0.03 14.98 39.54 67.18
and 534.55 535.40 0.85 0.02 8.71 38.24 64.97
94_49 351.20 352.80 1.60 2.16 2.35 2.37 4.02
* Incercepts were concidered significant if a sample contained >1% Zn or <1% Pb or >25%

Appendix III – Semi-variogram Models

Mel Main Zone Mineralized Intervals – Zn-AZ 0 DIP 0

Mel Main Zone Mineralized Intervals – Zn-AZ 90 DIP -75

Mel Main Zone Mineralized Intervals – Pb-AZ 0 DIP 0

Mel Main Zone Mineralized Intervals – Pb-AZ 90 DIP -75

Mel Main Zone Mineralized Intervals – Ba-AZ 0 DIP 0

Mel Main Zone Mineralized Intervals – Ba-AZ 90 DIP-75

Mel Main Zone Waste Intervals – Zn-Omni Directional

Mel Main Zone Waste Intervals – Pb-Omni Directional

Mel Main Zone Waste Intervals – Ba-Omni Directional