technical report on the mesquite gold mine, california, u.s.a
TRANSCRIPT

Technical Report on the Mesquite Gold Mine, California, U.S.A.California, U.S.A.
Effective Date: December 31, 2019Report Date: April 27, 2020
Prepared for Equinox Gold Corp. by
AGP Mining Consultants Inc.#246-132K Commerce Park DriveBarrie, ON L4N 0Z7 Canada
Authors:Bruce Davis, FAusIMMNathan Robison, PEAli Shahkar, P. Eng.Robert Sim, P. Geo.Jefferey Woods, SME MMASGordon Zurowski, P.Eng.

IMPORTANT NOTICE
This report was prepared as National Instrument 43‐101 Technical Report for
Equinox Gold Corp. (Equinox) by AGP Mining Consultants Inc. (AGP). The
quality of information, conclusions, and estimates contained herein is
consistent with the level of effort involved in AGP’s services, based on i)
information available at the time of preparation, ii) data supplied by outside
sources, and iii) the assumptions, conditions, and qualifications set forth in this
report. This report is intended for use by Equinox subject to terms and
conditions of their contract with AGP. Their contract permits Equinox to file
this report as a Technical Report with Canadian Securities Regulatory
Authorities pursuant to National Instrument 43‐101 Standards of Disclosure
for Mineral Projects. Except for the purposes legislated under applicable
Canadian provincial, territorial, and federal securities law, any other use of this
report by any third party is at that party’s sole risk.

MESQUITE GOLD MINE, CALIFORNIA, U.S.A. TECHNICAL REPORT ON THE MESQUITE GOLD MINE, CALIFORNIA, U.S.A.
T O C | 1‐1
27/04/2020
Contents
1 SUMMARY ...................................................................................................................... 1‐1
1.1 Location and Access ............................................................................................................... 1‐1
1.2 Mineral Tenure, Surface Rights and Royalties ....................................................................... 1‐1
1.2.1 Mineral Tenure ....................................................................................................................1‐1 1.2.2 Surface Rights ......................................................................................................................1‐2 1.2.3 Royalties ..............................................................................................................................1‐2
1.3 Environment .......................................................................................................................... 1‐3
1.4 Geological Setting and Mineralization ................................................................................... 1‐3
1.5 Exploration Status .................................................................................................................. 1‐4
1.6 Drilling .................................................................................................................................... 1‐4
1.7 Sample Preparation, Analyses and Security .......................................................................... 1‐4
1.7.1 Sample Preparation .............................................................................................................1‐4 1.7.2 Analysis................................................................................................................................1‐4 1.7.3 Security ................................................................................................................................1‐4
1.8 Data Verification .................................................................................................................... 1‐5
1.9 Mineral Resource Estimate .................................................................................................... 1‐5
1.10 Mineral Processing and Metallurgical Testing ....................................................................... 1‐8
1.11 Mineral Reserves Estimate .................................................................................................... 1‐9
1.12 Mine Plan ............................................................................................................................. 1‐10
1.13 Processing ............................................................................................................................ 1‐11
1.14 Markets ................................................................................................................................ 1‐11
1.15 Capital and Operating Costs ................................................................................................ 1‐12
1.16 Financial Analysis ................................................................................................................. 1‐12
1.17 Conclusions .......................................................................................................................... 1‐12
1.18 Recommendations ............................................................................................................... 1‐13
2 INTRODUCTION ............................................................................................................... 2‐1
2.1 Qualified Persons ................................................................................................................... 2‐1
2.2 Site Visits and Scope of Personal Inspection ......................................................................... 2‐1
2.3 Effective Dates ....................................................................................................................... 2‐2
2.4 Information Sources and References ..................................................................................... 2‐2
2.5 Previous Technical Reports .................................................................................................... 2‐3
3 RELIANCE ON OTHER EXPERTS ........................................................................................ 3‐1
4 PROPERTY DESCRIPTION AND LOCATION ........................................................................ 4‐1
4.1 Location.................................................................................................................................. 4‐1
4.2 Land Tenure ........................................................................................................................... 4‐2
4.2.1 Mineral Rights .....................................................................................................................4‐2

MESQUITE GOLD MINE, CALIFORNIA, U.S.A. TECHNICAL REPORT ON THE MESQUITE GOLD MINE, CALIFORNIA, U.S.A.
T O C | 1‐2
27/04/2020
4.3 Agreements and Encumbrances ............................................................................................ 4‐5
4.4 Surface Rights ........................................................................................................................ 4‐5
4.4.1 Mesquite Owned Property ..................................................................................................4‐5 4.4.2 State of California Property .................................................................................................4‐5 4.4.3 Unpatented Mining Claims/Public Lands ............................................................................4‐5 4.4.4 Los Angeles County Sanitation District (LACSD) Landfill .....................................................4‐6
4.5 Royalties ................................................................................................................................. 4‐6
5 ACCESSIBILITY, CLIMATE, LOCAL RESOURCES, INFRASTRUCTURE, AND PHYSIOGRAPHY ............................................................................................................... 5‐1
5.1 Accessibility ............................................................................................................................ 5‐1
5.2 Climate ................................................................................................................................... 5‐1
5.3 Physiography .......................................................................................................................... 5‐1
5.4 Local Resources ...................................................................................................................... 5‐1
5.5 Infrastructure ......................................................................................................................... 5‐2
5.5.1 Electrical Power ...................................................................................................................5‐2 5.5.2 Water ..................................................................................................................................5‐2 5.5.3 Heap Leach Pad ...................................................................................................................5‐2
6 HISTORY .......................................................................................................................... 6‐1
7 GEOLOGICAL SETTING AND MINERALIZATION ................................................................. 7‐1
7.1 Regional Geology ................................................................................................................... 7‐1
7.2 Property Geology ................................................................................................................... 7‐5
7.3 Stratigraphy ........................................................................................................................... 7‐5
7.4 Structure ................................................................................................................................ 7‐5
7.5 Alteration ............................................................................................................................... 7‐5
7.6 Mineralization ........................................................................................................................ 7‐8
8 DEPOSIT TYPES ................................................................................................................ 8‐1
9 EXPLORATION ................................................................................................................. 9‐1
10 DRILLING ....................................................................................................................... 10‐1
10.1 Drilling by Previous Operators ............................................................................................. 10‐1
10.2 Reverse Circulation Drilling and Logging by Gold Fields ...................................................... 10‐3
10.3 Core Drilling and Logging by Gold Fields .............................................................................. 10‐3
10.4 Twin Hole Comparison by Gold Fields ................................................................................. 10‐3
10.5 Reverse Circulation Sampling by Gold Fields ....................................................................... 10‐5
10.6 Diamond Drill Core Sampling by Gold Fields ....................................................................... 10‐5
10.7 Blasthole Drilling .................................................................................................................. 10‐5
10.8 Comments Regarding Sampling Method and Approach by Gold Fields .............................. 10‐5
10.9 Drilling by WMMI ................................................................................................................. 10‐6
10.10 Reverse Circulation Sampling by WMMI ............................................................................. 10‐6

MESQUITE GOLD MINE, CALIFORNIA, U.S.A. TECHNICAL REPORT ON THE MESQUITE GOLD MINE, CALIFORNIA, U.S.A.
T O C | 1‐3
27/04/2020
10.11 Diamond Drill Logging and Sampling by WMMI .................................................................. 10‐6
11 SAMPLE PREPARATION, ANALYSES, AND SECURITY ....................................................... 11‐1
11.1 Pre‐WMMI ........................................................................................................................... 11‐1
11.1.1 Sample Security .................................................................................................................11‐1 11.1.2 Drill Sample Preparation and Analysis ..............................................................................11‐1 11.1.3 Quality Assurance/Quality Control, Check Samples, Check Assays...................................11‐2
11.2 WMMI .................................................................................................................................. 11‐4
11.2.1 Sample Security .................................................................................................................11‐4 11.2.2 Sample Preparation and Analysis ......................................................................................11‐4 11.2.3 Quality Assurance/Quality Control ...................................................................................11‐6 11.2.4 Certified Reference Material .............................................................................................11‐6 11.2.5 Blank Samples ...................................................................................................................11‐9 11.2.6 Field Duplicates .............................................................................................................. 11‐10 11.2.7 Pulp Duplicates ............................................................................................................... 11‐11 11.2.8 Results from 2019 Drilling .............................................................................................. 11‐13
11.3 Conclusions ........................................................................................................................ 11‐13
12 DATA VERIFICATION ...................................................................................................... 12‐1
12.1 Bulk Samples by Gold Fields ................................................................................................ 12‐1
12.2 Other Early Gold Fields Data Checks .................................................................................... 12‐1
12.3 IMC Data Comparison and Comments ................................................................................ 12‐2
12.4 Checks .................................................................................................................................. 12‐2
12.5 Comparisons to Production Records ................................................................................... 12‐2
12.6 Conclusion ............................................................................................................................ 12‐2
13 MINERAL PROCESSING AND METALLURGICAL TESTING ................................................. 13‐1
13.1 Metallurgical Testing ........................................................................................................... 13‐1
13.1.1 Historical Testing ...............................................................................................................13‐1 13.1.2 Recent Column Testing: Site Run Column Tests‐ Heap Leach Feed ..................................13‐1
13.2 Production Data 2007 to 2019 ............................................................................................. 13‐3
13.3 Recommendations ............................................................................................................... 13‐5
14 MINERAL RESOURCE ESTIMATES ................................................................................... 14‐1
14.1 In‐situ Resource Estimate .................................................................................................... 14‐1
14.1.1 Introduction ......................................................................................................................14‐1 14.1.2 Available Data ...................................................................................................................14‐2 14.1.3 Geologic Model, Domains, and Coding .............................................................................14‐3 14.1.4 Compositing ......................................................................................................................14‐5 14.1.5 Exploratory Data Analysis ..................................................................................................14‐5 14.1.6 Basic Statistics by Domain .................................................................................................14‐5 14.1.7 Contact Profiles .................................................................................................................14‐6 14.1.8 Conclusions and Modeling Implications ............................................................................14‐8 14.1.9 Grade Shells.......................................................................................................................14‐9 14.1.10 Bulk Density Data ........................................................................................................... 14‐10 14.1.11 Evaluation of Outlier Grades .......................................................................................... 14‐10

MESQUITE GOLD MINE, CALIFORNIA, U.S.A. TECHNICAL REPORT ON THE MESQUITE GOLD MINE, CALIFORNIA, U.S.A.
T O C | 1‐4
27/04/2020
14.1.12 Variography .................................................................................................................... 14‐11 14.1.13 Model Setup and Limits ................................................................................................. 14‐12 14.1.14 Interpolation Parameters ............................................................................................... 14‐13 14.1.15 Validation ....................................................................................................................... 14‐13 14.1.16 Visual Inspection ............................................................................................................ 14‐14 14.1.17 Model Checks for Change of Support ............................................................................ 14‐14 14.1.18 Comparison of Interpolation Methods .......................................................................... 14‐15 14.1.19 Swath Plots (Drift Analysis) ............................................................................................ 14‐17 14.1.20 Resource Classification ................................................................................................... 14‐20 14.1.21 In‐situ Mineral Resources ............................................................................................... 14‐20
14.2 Mineral Resource Estimate of Waste Dumps .................................................................... 14‐25
14.2.1 Introduction ................................................................................................................... 14‐25 14.2.2 Sample Data ................................................................................................................... 14‐25 14.2.3 Approach to Developing the Waste Dump Resource Block Model ................................ 14‐26 14.2.4 Estimate of Waste Dump Mineral Resources ................................................................. 14‐27 14.2.5 Conclusions and Comments on Waste Dump Mineral Resources ................................. 14‐32
14.3 In‐situ and Waste Dump Mineral Resources ..................................................................... 14‐33
14.4 Comparison with Previous Resource Estimates ................................................................ 14‐37
14.5 Recommendations ............................................................................................................. 14‐41
15 MINERAL RESERVE ESTIMATES ...................................................................................... 15‐1
15.1 Summary .............................................................................................................................. 15‐1
15.2 Mining Method and Mining Costs ....................................................................................... 15‐3
15.2.1 Geotechnical Considerations ............................................................................................15‐3 15.2.2 Economic Pit Shell Development ......................................................................................15‐3 15.2.3 Cut‐off Grade.....................................................................................................................15‐4 15.2.4 Dilution ..............................................................................................................................15‐4 15.2.5 Pit Design ..........................................................................................................................15‐5 15.2.6 Mine Reserves Statement .................................................................................................15‐5
16 MINING METHODS ........................................................................................................ 16‐1
16.1 Introduction ......................................................................................................................... 16‐1
16.2 Geologic Model .................................................................................................................... 16‐1
16.3 Geotechnical Information .................................................................................................... 16‐2
16.4 Economic Pit Shell Development ......................................................................................... 16‐5
16.5 Dilution Calculation .............................................................................................................. 16‐6
16.6 Pit Design ............................................................................................................................. 16‐6
16.7 Mine Schedule ................................................................................................................... 16‐10
16.8 Mine Plan Sequence .......................................................................................................... 16‐11
17 RECOVERY METHODS .................................................................................................... 17‐1
17.1 Process Plant ........................................................................................................................ 17‐1
17.1.1 Summary ...........................................................................................................................17‐1 17.2 Water Services ..................................................................................................................... 17‐4

MESQUITE GOLD MINE, CALIFORNIA, U.S.A. TECHNICAL REPORT ON THE MESQUITE GOLD MINE, CALIFORNIA, U.S.A.
T O C | 1‐5
27/04/2020
18 PROJECT INFRASTRUCTURE ........................................................................................... 18‐1
18.1 Electrical Power ................................................................................................................... 18‐1
18.2 Water ................................................................................................................................... 18‐1
18.3 Heap Leach Pad .................................................................................................................... 18‐1
18.4 Site Layout ........................................................................................................................... 18‐1
19 MARKET STUDIES AND CONTRACTS .............................................................................. 19‐1
19.1 Markets ................................................................................................................................ 19‐1
19.2 Gold Price ............................................................................................................................. 19‐1
19.3 Contracts .............................................................................................................................. 19‐1
20 ENVIRONMENTAL STUDIES, PERMITTING, AND SOCIAL OR COMMUNITY IMPACT ........ 20‐1
20.1 Environmental Issues ........................................................................................................... 20‐1
20.2 Project Permitting ................................................................................................................ 20‐1
20.3 Social and Community Requirements .................................................................................. 20‐2
20.4 Mine Closure Requirements and Reclamation Costs ........................................................... 20‐2
21 CAPITAL AND OPERATING COSTS .................................................................................. 21‐1
21.1 Capital Cost Estimates ......................................................................................................... 21‐1
21.1.1 Sustaining Capital ..............................................................................................................21‐1 21.1.2 Capital Cost Summary .......................................................................................................21‐1
21.2 Operating Cost Estimates .................................................................................................... 21‐1
21.2.1 Mine Operating Costs ........................................................................................................21‐1 21.2.2 Process Operating Costs ....................................................................................................21‐2 21.2.3 General and Administrative Operating Costs ....................................................................21‐2 21.2.4 Refining Costs ....................................................................................................................21‐2
22 ECONOMIC ANALYSIS .................................................................................................... 22‐1
23 ADJACENT PROPERTIES ................................................................................................. 23‐1
24 OTHER RELEVANT DATA AND INFORMATION ................................................................ 24‐1
24.1 Waste Dumps ....................................................................................................................... 24‐1
24.2 Rainbow Pit .......................................................................................................................... 24‐2
24.3 Reworking of Leach Pads ..................................................................................................... 24‐2
24.4 Leach Pad Expansion ............................................................................................................ 24‐2
25 INTERPRETATION AND CONCLUSIONS ........................................................................... 25‐1
26 RECOMMENDATIONS .................................................................................................... 26‐1
26.1 Geotechnical ........................................................................................................................ 26‐1
26.2 Process and Metallurgy ....................................................................................................... 26‐1
26.2.1 Laboratory .........................................................................................................................26‐1 26.2.2 Metallurgy .........................................................................................................................26‐1 26.2.3 Heap Leaching ...................................................................................................................26‐1
26.3 Mineral Resources ............................................................................................................... 26‐2
MESQUITE GOLD MINE, CALIFORNIA, U.S.A. TECHNICAL REPORT ON THE MESQUITE GOLD MINE, CALIFORNIA, U.S.A.
T O C | 1‐6
27/04/2020
26.4 Mine Planning ...................................................................................................................... 26‐2
27 REFERENCES .................................................................................................................. 27‐1
28 CERTIFICATE OF AUTHORS ............................................................................................. 28‐1
28.1 Bruce M. Davis, FAusIMM .................................................................................................... 28‐1
28.2 Robert Sim, P.Geo. ............................................................................................................... 28‐2
28.3 Gordon Zurowski, P.Eng. ...................................................................................................... 28‐3
28.4 Jefferey L. Woods, SME MMAS ............................................................................................ 28‐4
28.5 Ali Shahkar, P. Eng. .............................................................................................................. 28‐5
28.6 Nathan Earl Robison, PE ....................................................................................................... 28‐7
Tables
Table 1‐1: Mesquite Mine Mineral Resources Exclusive of Mineral Reserves – December 31,2019 ........................1‐7 Table 1‐2: Mesquite Mine Mineral Reserves – December 31, 2019 .........................................................................1‐9 Table 2‐1: Dates of Site Visits and Areas of Responsibility ........................................................................................2‐2 Table 6‐1: Historic Production ...................................................................................................................................6‐3 Table 6‐2: Production 2007‐2019 Equinox– Mesquite Mine, U.S.A. .........................................................................6‐4 Table 9‐1: Examples of Initial Samples Collected from Waste Dumps in 2018 .........................................................9‐2 Table 10‐1: Twin Hole Comparison ..........................................................................................................................10‐4 Table 11‐1: Certified Reference Material ................................................................................................................11‐6 Table 12‐1: Comparison of Block Estimates from Decline vs. Drill Holes ...............................................................12‐1 Table 13‐1 Mesquite Mine Production 2007 ‐ 2019 ................................................................................................13‐4 Table 13‐2: Mesquite Mine 2019 Year End Data .....................................................................................................13‐5 Table 14‐1: Top‐Cut and Restricted Outlier Threshold Limits By Domain ............................................................ 14‐11 Table 14‐2: Summary Gold Grade (oz/t) Statistics By Domain ............................................................................. 14‐11 Table 14‐3: Correlogram Parameters for Gold ..................................................................................................... 14‐12 Table 14‐4: Block Model Limits ............................................................................................................................. 14‐13 Table 14‐5: Interpolation Parameters .................................................................................................................. 14‐13 Table 14‐6: Estimate of In‐situ Mineral Resources Inclusive of Mineral Reserves as at Dec 31, 2019 .................. 14‐21 Table 14‐7: Estimate of In‐situ Mineral Resources Inclusive of Mineral Reserves as at Dec 31, 2019 (metric) .... 14‐21 Table 14‐8: Sensitivity of In‐situ Mineral Resources Inclusive of Mineral Reserves as at December 31, 2019 .... 14‐22 Table 14‐9: Estimate of In‐situ Mineral Resources Exclusive of Mineral Reserves as at Dec 31, 2019 ................ 14‐24 Table 14‐10: Estimate of In‐situ Mineral Resources Exclusive of Mineral Reserves as at Dec 31, 2019 (metric) 14‐24 Table 14‐11: Estimate of Waste Dump Mineral Resources Inclusive of Mineral Reserves ................................... 14‐28 Table 14‐12: Estimate of Indicated Mineral Resources Inclusive of Mineral Reserves by Waste Dump Area ...... 14‐30 Table 14‐13: Estimate of Inferred Mineral Resources Inclusive of Mineral Reserves by Waste Dump Area ........ 14‐31 Table 14‐14: Estimate of Waste Dump Mineral Resources Exclusive of Mineral Reserves ................................... 14‐32 Table 14‐15: Estimate of Mineral Resources Inclusive of Mineral Reserves as at Dec 31, 2019 ........................... 14‐34 Table 14‐16: Estimate of Mineral Resources Inclusive of Mineral Reserves as at Dec 31, 2019 (metric) ............. 14‐34 Table 14‐17 : Estimate of Mineral Resources Exclusive of Mineral Reserves as at Dec 31, 2019 ......................... 14‐36 Table 14‐18: Estimate of Mineral Resources Exclusive of Mineral Reserves as at Dec 31, 2019 (metric) ............ 14‐36 Table 14‐19: Comparison of Resources Inclusive of Reserves Dec. 31, 2019 vs. Dec. 31, 2018 ........................... 14‐37 Table 14‐20: Comparison of Resources Inclusive of Reserves Dec. 31, 2019 vs. Dec. 31, 2018 (metric) ............. 14‐38 Table 14‐21: Comparison of Resources Exclusive of Reserves Dec. 31, 2019 vs. Dec. 31, 2018 .......................... 14‐40

MESQUITE GOLD MINE, CALIFORNIA, U.S.A. TECHNICAL REPORT ON THE MESQUITE GOLD MINE, CALIFORNIA, U.S.A.
T O C | 1‐7
27/04/2020
Table 14‐22: Comparison of Resources Exclusive of Reserves Dec. 31, 2019 vs. Dec. 31, 2018 (metric) ............ 14‐41 Table 15‐1: Proven and Probable Reserves (Imperial Units) ...................................................................................15‐2 Table 15‐2: Proven and Probable Reserves (Metric Units) ......................................................................................15‐2 Table 15‐3: Pit Optimization Parameters ................................................................................................................15‐4 Table 15‐4: Mesquite Mine Reserve Cut‐off Grades ...............................................................................................15‐4 Table 15‐5: Proven and Probable Reserves – Summary for Mesquite Mine ...........................................................15‐6 Table 15‐6: Proven and Probable Reserves – by Pit and Waste Dump Area ...........................................................15‐7 Table 16‐1: Geological Model Details ......................................................................................................................16‐1 Table 16‐2: Mesquite Mine Resources(inclusive of reserves) – December 31, 2019 ..............................................16‐2 Table 16‐3: VW2 Slope Criteria ................................................................................................................................16‐4 Table 16‐4: Pit Optimization Parameters ................................................................................................................16‐5 Table 16‐5: Final Design – Phase Tons and Grade ...................................................................................................16‐7 Table 16‐6: Mesquite Mine Reserve Cut‐off Grades ...............................................................................................16‐7 Table 16‐7: Mine Production 2007 – 2022 (Actual and Mine Plan(Highlighted)) ................................................. 16‐11 Table 20‐1: Environmental Permits Matrix ..............................................................................................................20‐4 Table 21‐1: LOM Capital Costs .................................................................................................................................21‐1 Table 21‐2: Mine Operating Costs ‐ $/ton moved ...................................................................................................21‐2 Table 21‐3: Process Operating Costs ‐ $/t ore processed ........................................................................................21‐2 Table 21‐4: G&A Costs ‐ $/t ore processed .............................................................................................................21‐2
Figures
Figure 4‐1: Location Map ...........................................................................................................................................4‐1 Figure 4‐2: Plan of Operations ...................................................................................................................................4‐3 Figure 4‐3: Claim Map ...............................................................................................................................................4‐4 Figure 7‐1: Regional Geology Map ............................................................................................................................7‐3 Figure 7‐2: Stratigraphic Section ...............................................................................................................................7‐4 Figure 7‐3: Property Geology .....................................................................................................................................7‐6 Figure 7‐4: Typical Cross Section ...............................................................................................................................7‐7 Figure 10‐1: Drill Hole Location Plan ......................................................................................................................10‐2 Figure 11‐1: Assay Lab Sample Preparation and Assaying Procedure .....................................................................11‐3 Figure 11‐2: Sample Preparation Flow Chart ..........................................................................................................11‐5 Figure 11‐3: Control Charts – Certified Reference Material ....................................................................................11‐7 Figure 11‐4: Field Duplicates ‐ Split Core .............................................................................................................. 11‐10 Figure 11‐5: Field Duplicates ‐ Rotary Splits ......................................................................................................... 11‐11 Figure 11‐6: Pulp Duplicates – Split Core .............................................................................................................. 11‐12 Figure 11‐7: Pulp Duplicates – Rotary Splits ......................................................................................................... 11‐12 Figure 13‐1: Column Test Fire Assay Head Grade Distribution ................................................................................13‐2 Figure 13‐2: Column Test Calculated Head Grades – (Extracted + Tail Sieve Assay) ...............................................13‐2 Figure 13‐3: Column Test Calculated Au Recovery Based on Calculated Head Grades ...........................................13‐3 Figure 13‐4: Annual Apparent Au Recovery: Annual Ounces Recovered/ Annual Ounces Stacked .........................13‐4 Figure 13‐5: Restart to Date Cumulative Au Recovery .............................................................................................13‐5 Figure 14‐1: Drill Hole Plan – 2019 Drilling in Red ...................................................................................................14‐2 Figure 14‐2: Planview Showing Main Lithology Units (excluding Tertiary cover) ....................................................14‐4 Figure 14‐3: Vertical Section (Looking East) Showing the Oxidation Category Wireframes ....................................14‐4 Figure 14‐4: Boxplots for Gold (ppm) by Lithology ...................................................................................................14‐6

MESQUITE GOLD MINE, CALIFORNIA, U.S.A. TECHNICAL REPORT ON THE MESQUITE GOLD MINE, CALIFORNIA, U.S.A.
T O C | 1‐8
27/04/2020
Figure 14‐5: Contact Plot Between BG and HBG .....................................................................................................14‐7 Figure 14‐6: Contact Plot Between MG and HBG ....................................................................................................14‐7 Figure 14‐7: Grade Shells Divided Into Three Structural Blocks ..............................................................................14‐8 Figure 14‐8: Plan View Showing Extent of Area Domains .......................................................................................14‐9 Figure 14‐9: Change of Support Curves ................................................................................................................ 14‐15 Figure 14‐10: Grade‐Tonnage Comparison of OK, ID, and NN Models At Brownie .............................................. 14‐16 Figure 14‐11: Grade‐Tonnage Comparison of OK, ID, and NN Models At Vista East 2 ......................................... 14‐16 Figure 14‐12: Swath Plots Comparing OK, ID2, and NN Models at BRO ............................................................... 14‐18 Figure 14‐13: Swath Plots Comparing OK, ID2, and NN Models at VE2 ................................................................ 14‐19 Figure 14‐14: Plan View Showing Drill Holes in Waste Dump Areas ..................................................................... 14‐26 Figure 14‐15: Plan View Showing the Distribution of Waste Dump Mineral Resources Inclusive of Mineral Reserves by Class ……… ......................................................................................................................................................... 14‐29 Figure 16‐1: Mesquite Mine Pit Areas .....................................................................................................................16‐8 Figure 16‐2: Ultimate Pit Configuration...................................................................................................................16‐9 Figure 16‐3: End of 2020....................................................................................................................................... 16‐12 Figure 16‐4: End of 2021....................................................................................................................................... 16‐13 Figure 16‐5: End of 2022 (ultimate limits) ............................................................................................................ 16‐14 Figure 17‐1: Heap Leach Carbon Circuit Process Flowsheet ...................................................................................17‐2 Figure 17‐2: Adsorption Plant Process Flowsheet ..................................................................................................17‐3 Figure 18‐1: Overall Site Layout – December 31, 2019 ...........................................................................................18‐2 Figure 24‐1: Mine Expansion Potential Targets .......................................................................................................24‐1

MESQUITE GOLD MINE, CALIFORNIA, U.S.A. TECHNICAL REPORT ON THE MESQUITE GOLD MINE, CALIFORNIA, U.S.A.
T O C | 1‐9
27/04/2020
Glossary
Units of Measure
Above mean sea level ................................................................................................. amsl
Acre ............................................................................................................................ ac
Ampere ....................................................................................................................... A
Annum (year) .............................................................................................................. a
Billion .......................................................................................................................... B
Billion tons .................................................................................................................. Bt
Billion years ago .......................................................................................................... Ga
British thermal unit..................................................................................................... BTU
Centimetre .................................................................................................................. cm
Cubic centimetre ........................................................................................................ cm3
Cubic feet per minute ................................................................................................. cfm
Cubic feet per second ................................................................................................. ft3/s
Cubic foot ................................................................................................................... ft3
Cubic inch ................................................................................................................... in3
Cubic metre ................................................................................................................ m3
Cubic yard ................................................................................................................... yd3
Coefficients of Variation ............................................................................................. CVs
Day .............................................................................................................................. d
Days per week ............................................................................................................ d/wk
Days per year (annum) ............................................................................................... d/a
Dead weight tons ........................................................................................................ DWT
Decibel adjusted ......................................................................................................... dBa
Decibel ........................................................................................................................ dB
Degree ........................................................................................................................ °
Degrees Celsius ........................................................................................................... °C
Diameter ..................................................................................................................... ø
Dollar (American) ....................................................................................................... US$
Dollar (Canadian) ........................................................................................................ C$
Dry metric ton ............................................................................................................ dmt
Foot ............................................................................................................................ ft
Gallon ......................................................................................................................... gal
Gallons per minute (US) ............................................................................................. gpm
Gigajoule ..................................................................................................................... GJ
Gigapascal ................................................................................................................... GPa
Gigawatt ..................................................................................................................... GW
Gram ........................................................................................................................... g
Grams per litre ............................................................................................................ g/L
Grams per tonne ........................................................................................................ g/t

MESQUITE GOLD MINE, CALIFORNIA, U.S.A. TECHNICAL REPORT ON THE MESQUITE GOLD MINE, CALIFORNIA, U.S.A.
T O C | 1‐10
27/04/2020
Greater than ............................................................................................................... >
Hectare (10,000 m2) ................................................................................................... ha
Hertz ........................................................................................................................... Hz
Horsepower ................................................................................................................ hp
Hour ............................................................................................................................ h
Hours per day ............................................................................................................. h/d
Hours per week .......................................................................................................... h/wk
Hours per year ............................................................................................................ h/a
Inch ............................................................................................................................. "
Kilo (thousand) ........................................................................................................... k
Kilogram...................................................................................................................... kg
Kilograms per cubic metre .......................................................................................... kg/m3
Kilograms per hour ..................................................................................................... kg/h
Kilograms per square metre ....................................................................................... kg/m2
Kilometre .................................................................................................................... km
Kilometres per hour .................................................................................................... km/h
Kilopascal .................................................................................................................... kPa
Kiloton (imperial) or Kilotonne (metric) ..................................................................... kt
Kilovolt ........................................................................................................................ kV
Kilovolt‐ampere .......................................................................................................... kVA
Kilovolts ...................................................................................................................... kV
Kilowatt ...................................................................................................................... kW
Kilowatt hour .............................................................................................................. kWh
Kilowatt hours per tonne (metric ton) ....................................................................... kWh/t
Kilowatt hours per year .............................................................................................. kWh/a
Less than ..................................................................................................................... <
Litre ............................................................................................................................. L
Litres per minute ........................................................................................................ L/min
Megabytes per second ............................................................................................... Mb/sec
Megapascal ................................................................................................................. MPa
Megavolt‐ampere ....................................................................................................... MVA
Megawatt ................................................................................................................... MW
Metre .......................................................................................................................... m
Metres above sea level .............................................................................................. masl
Metres Baltic sea level ................................................................................................ mbsl
Metres per minute ..................................................................................................... m/min
Metres per second ..................................................................................................... m/s
Microns ....................................................................................................................... µm
Milligram .................................................................................................................... mg
Milligrams per litre ..................................................................................................... mg/L
Millilitre ...................................................................................................................... mL
Millimetre ................................................................................................................... mm
Million ......................................................................................................................... M

MESQUITE GOLD MINE, CALIFORNIA, U.S.A. TECHNICAL REPORT ON THE MESQUITE GOLD MINE, CALIFORNIA, U.S.A.
T O C | 1‐11
27/04/2020
Million bank cubic metres .......................................................................................... Mbm3
Million tons ................................................................................................................. Mt
Minute (plane angle) .................................................................................................. '
Minute (time) ............................................................................................................. min
Month ......................................................................................................................... mo
Ounce ......................................................................................................................... oz
Ounces per ton ……………………………………………………………………………………………………… oz/t
Pascal .......................................................................................................................... Pa
Centipoise ................................................................................................................... mPa∙s
Parts per million ......................................................................................................... ppm
Parts per billion .......................................................................................................... ppb
Percent ....................................................................................................................... %
Pound(s) ..................................................................................................................... lb
Pounds per square inch .............................................................................................. psi
Revolutions per minute .............................................................................................. rpm
Second (plane angle) .................................................................................................. "
Second (time) ............................................................................................................. sec
Specific gravity ............................................................................................................ SG
Square centimetre ...................................................................................................... cm2
Square foot ................................................................................................................. ft2
Square inch ................................................................................................................. in2
Square kilometre ........................................................................................................ km2
Square metre .............................................................................................................. m2
Thousand tons ............................................................................................................ kt
Three Dimensional...................................................................................................... 3D
Ton (2,000 lbs – imperial) ……………………………………………………………………………………... t
Tonne (1,000 kg – metric table dependant) ............................................................... t
Tons per day (imperial) ............................................................................................... t/d
Tons per hour (imperial) ............................................................................................. t/h
Tons per year (imperial) ............................................................................................. t/a
Tons seconds per hour metre cubed .......................................................................... ts/hm3
Total ............................................................................................................................ T
Volt ............................................................................................................................. V
Week........................................................................................................................... wk
Weight/weight ............................................................................................................ w/w
Wet metric ton ........................................................................................................... wmt

MESQUITE GOLD MINE, CALIFORNIA, U.S.A. TECHNICAL REPORT ON THE MESQUITE GOLD MINE, CALIFORNIA, U.S.A.
T O C | 1‐12
27/04/2020
Abbreviations and Acronyms
Absolute Relative Difference ...................................................................................... ABRD
Acid Base Accounting ................................................................................................. ABA
Acid Rock Drainage ..................................................................................................... ARD
Aluminum ……………………………………………………………………………………………………………… Al
Arsenic …………………………………………………………………………………………………………………... As
Atomic Absorption Spectrophotometer ..................................................................... AAS
Atomic Absorption...................................................................................................... AA
British Columbia ......................................................................................................... BC
Calcium ……………………………………………………………………………………………………………………. Ca
Canadian Institute of Mining, Metallurgy, and Petroleum ......................................... CIM
Carbon‐in‐leach .......................................................................................................... CIL
Caterpillar’s® Fleet Production and Cost Analysis software ....................................... FPC
Certified Reference Material ……………………………………………………………………………………. CRM
Chromium ……………………………………………………………………………………………………………… Cr
Closed‐circuit Television ............................................................................................. CCTV
Coefficient of Variation .............................................................................................. CV
Copper …………………………………………………………………………………………………………………... Cu
Copper equivalent ...................................................................................................... CuEq
Counter‐current decantation ..................................................................................... CCD
Cyanide Soluble .......................................................................................................... CN
Diamond Drill Hole ………………………………………………………………………………………………... DD
Digital Elevation Model .............................................................................................. DEM
Direct leach ................................................................................................................. DL
Distributed Control System ........................................................................................ DCS
Drilling and Blasting .................................................................................................... D&B
Environmental Management System ......................................................................... EMS
Flocculant ................................................................................................................... floc
Free Carrier ................................................................................................................. FCA
Gemcom International Inc. ......................................................................................... Gemcom
General and administration ........................................................................................ G&A
Gold equivalent .......................................................................................................... AuEq
Heating, Ventilating, and Air Conditioning ................................................................. HVAC
High Pressure Grinding Rolls ...................................................................................... HPGR
Indicator Kriging ......................................................................................................... IK
Inductively Coupled Plasma Atomic Emission Spectroscopy ...................................... ICP‐AES
Inductively Coupled Plasma........................................................................................ ICP
Inspectorate America Corp. ........................................................................................ Inspectorate
Interior Cedar – Hemlock ........................................................................................... ICH
Internal rate of return ................................................................................................ IRR
International Congress on Large Dams ....................................................................... ICOLD
Inverse Distance Squared ........................................................................................... ID2

MESQUITE GOLD MINE, CALIFORNIA, U.S.A. TECHNICAL REPORT ON THE MESQUITE GOLD MINE, CALIFORNIA, U.S.A.
T O C | 1‐13
27/04/2020
Inverse Distance Cubed .............................................................................................. ID3
Iron …………………………………………………………………………………………………………………………. Fe
Land and Resource Management Plan ....................................................................... LRMP
Lerchs‐Grossman ........................................................................................................ LG
Life‐of‐mine ................................................................................................................ LOM
Light Detection and Ranging ……………………………………………………………………………………. LIDAR
Load‐haul‐dump ......................................................................................................... LHD
Locked cycle tests ....................................................................................................... LCTs
Loss on Ignition ........................................................................................................... LOI
Magnesium …………………………………………………………………………………………………………… Mg
Manganese …………………………………………………………………………………………………………… Mn
Micron …………………………………………………………………………………………………………………... μm
Metal Mining Effluent Regulations ............................................................................. MMER
Methyl Isobutyl Carbinol ............................................................................................ MIBC
Metres East ................................................................................................................. mE
Metres North .............................................................................................................. mN
Mineral Deposits Research Unit ................................................................................. MDRU
National Instrument 43‐101 ....................................................................................... NI 43‐101
Nearest Neighbour ..................................................................................................... NN
Net Invoice Value ....................................................................................................... NIV
Net Present Value ....................................................................................................... NPV
Net Smelter Prices ...................................................................................................... NSP
Net Smelter Return ..................................................................................................... NSR
Neutralization Potential ............................................................................................. NP
Nickel ………………………………………………………………………………………………………………………. Ni
Official Community Plans ........................................................................................... OCPs
Operator Interface Station ......................................................................................... OIS
Ordinary Kriging .......................................................................................................... OK
Organic Carbon ........................................................................................................... org
Piaba ……………………………………………………………………………………………………………………... PBA
Potassium ……………………………………………………………………………………………………………… K
Potassium Amyl Xanthate ........................................................................................... PAX
Predictive Ecosystem Mapping ................................................................................... PEM
Preliminary Assessment ............................................................................................. PA
Preliminary Economic Assessment ............................................................................. PEA
Qualified Persons ........................................................................................................ QPs
Quality assurance ....................................................................................................... QA
Quality control ............................................................................................................ QC
Reference Material ………………………………………………………………………………………………... RM
Reverse Circulation ………………………………………………………………………………………………... RC
Rhenium ..................................................................................................................... Re
Rock Mass Rating ........................................................................................................ RMR ‘76
Rock Quality Designation............................................................................................ RQD

MESQUITE GOLD MINE, CALIFORNIA, U.S.A. TECHNICAL REPORT ON THE MESQUITE GOLD MINE, CALIFORNIA, U.S.A.
T O C | 1‐14
27/04/2020
SAG Mill/Ball Mill/Pebble Crushing ............................................................................ SABC
Semi‐autogenous Grinding ......................................................................................... SAG
Sodium ……………………………………………………………………………………………………………………. Na
Standards Council of Canada ...................................................................................... SCC
Stanford University Geostatistical Software Library .................................................. GSLIB
Tailings storage facility ............................................................................................... TSF
Terrestrial Ecosystem Mapping .................................................................................. TEM
Total dissolved solids .................................................................................................. TDS
Total Suspended Solids ............................................................................................... TSS
Tunnel boring machine ............................................................................................... TBM
Underflow ................................................................................................................... U/F
Valued Ecosystem Components ................................................................................. VECs
Vanadium ……………………………………………………………………………………………………………… V
Waste rock facility ...................................................................................................... WRF
Water balance model ................................................................................................. WBM
Work Breakdown Structure ........................................................................................ WBS
Workplace Hazardous Materials Information System ................................................ WHMIS
X‐Ray Fluorescence Spectrometer ............................................................................. XRF

MESQUITE GOLD MINE, CALIFORNIA, U.S.A. TECHNICAL REPORT ON THE MESQUITE GOLD MINE, CALIFORNIA, U.S.A.
T O C | 1‐1
27/04/2020
Forward Looking Statements
This Technical Report, including the economics analysis, contains forward‐looking statements within the meaning of the United States Private
Securities Litigation Reform Act of 1995 and forward‐looking information within the meaning of applicable Canadian securities laws. While these
forward‐looking statements are based on expectations about future events as at the effective date of this Report, the statements are not a
guarantee of Equinox Gold Corp.’s future performance and are subject to risks, uncertainties, assumptions and other factors, which could cause
actual results to differ materially from future results expressed or implied by such forward‐looking statements. Such risks, uncertainties, factors,
and assumptions include, amongst others but not limited to metal prices, mineral resources, smelter terms, labour rates, consumable costs, and
equipment pricing. There can be no assurance that forward‐looking statements will prove to be accurate, as actual results and future events
could differ materially from those anticipated in such statements.

MESQUITE GOLD MINE, CALIFORNIA, U.S.A. TECHNICAL REPORT ON THE MESQUITE GOLD MINE, CALIFORNIA, U.S.A.
P a g e | 1‐1
27/04/2020
1 SUMMARY
Equinox Gold Corp. (Equinox) retained independent industry consultants to prepare a Technical Report to update the Mineral Resources and Mineral Reserves on the Mesquite Mine near Brawley, Imperial County, California, U.S.A.
Equinox is an intermediate gold mining company with an operating asset in the Mesquite Mine in the United States and also owns other mines and development projects in the United States, Mexico, and Brazil. Equinox completed the acquisition of Western Mesquite Mines, Inc. (WMMI), from New Gold Inc (New Gold), on October 30, 2018. WMMI, Equinox’s wholly‐owned subsidiary, holds a 100% interest in the property and operates the mine. The major assets and facilities of WMMI are an open pit gold heap leach mining operation with a carbon‐in‐column (CIC) processing circuit. A smelting furnace, assay and metallurgical laboratories, administration building, truck shop facility, and other required infrastructure are also located on the mine site.
The Mesquite Mine received regulatory approval to begin mining operations on July 2, 2007, after the issuance of the air quality permit from the Imperial County Air Pollution Control District. Commercial production at the Mesquite Mine recommenced in January 2008 and has been operating continuously since. In 2019, the mine produced 125,736 ounces of gold.
The preparation of the report was led by AGP Mining Consultants Inc. (AGP) but includes contributions by Woods Process Services, LLC (Woods), Lions Gate Geological Consulting (LGGC), SIM Geological Inc. (SGI), BD Resource Consulting Inc. (BDRC) and Robison Engineering Company Inc. (Robison).
1.1 Location and Access
The Mesquite Mine is located approximately 35 miles to the east of the town of Brawley, California, and about 52 miles northwest of the city of Yuma, Arizona. The property is at Latitude 33° 03’ North and Longitude 114° 59’ West. Access to the property is from California State Highway 78 and then north along a paved private road into the Mesquite Mine. The property is approximately 24 miles north of the border with Mexico and 16 miles west of the border with the State of Arizona.
1.2 Mineral Tenure, Surface Rights and Royalties
1.2.1 Mineral Tenure
The mineral rights at the Mesquite Mine consist of 265 unpatented and 53 patented mining lode claims, 97 unpatented and 122 patented mill site claims, 658 acres of California State leased land, and a lease of a portion of the 4,275 acres of adjacent private land owned by the Los Angeles County Sanitation District (LACSD).

MESQUITE GOLD MINE, CALIFORNIA, U.S.A. TECHNICAL REPORT ON THE MESQUITE GOLD MINE, CALIFORNIA, U.S.A.
P a g e | 1‐2
27/04/2020
All the aforementioned properties are controlled by WMMI and are collectively identified as the Mesquite Plan of Operations Area. The claims located on federally owned lands are administered by the Bureau of Land Management (BLM).
Patented mining lode claims and patented mill site claims on U.S. Federal Land represent a secure title to the land. Unpatented mining and mill site claims do not have a termination date as long as annual assessment work is maintained and the land is held for mining purposes. The Federal fee land is leased by WMMI and can also be maintained indefinitely as long as the annual maintenance fees are paid.
1.2.2 Surface Rights
The surface ownership of patented mining claims, which are identified as Imperial County Assessor’s parcels, have all the general rights of surface ownership as fee land. WMMI also owns patented claims and mill sites south of the mine property for water supply wells.
WMMI has surface operation rights within the leased parcel of the State of California Property.
The lode claims and mill sites maintained by WMMI provide the general right for surface management and operations, subject to environmental permitting and other compliance activities unique to public lands. However, under California’s Environmental Quality Act (CEQA) authority, which generally mirrors the National Environmental Policy Act (NEPA) requirements the BLM is tasked to administer, there is little practical difference in operations and reclamation requirements regardless of whether the land is public or private.
The LACSD is constructing a landfill facility adjacent to, and overlying portions of, the existing Mesquite Mine property. The landfill project will be located on private land owned by LACSD. Under the agreement, WMMI has retained the right to explore, mine, extract, process, market and sell ore, and otherwise conduct mining and processing activities, anywhere within the Mesquite Mine property for an initial period through 2024 with automatic extensions until 2078. LACSD has the right to utilize portions of the overburden stockpiles and spent ore from the leach pads for use as daily cover for the landfill, as well as for construction materials for general purposes as well as liner design. This material will be jointly used by both LACSD and WMMI, but WMMI will have priority.
1.2.3 Royalties
Most of the mineral reserves planned for future mining at Mesquite Mine will be subject to a 0.5% to 2% production royalty due Franco‐Nevada Corporation and a 2% production royalty due Glamis Associates depending on the claim group. Claims jointly owned by Franco‐Nevada Corp. and Glamis will pay a 1% royalty to Franco‐Nevada and a 2% royalty to Glamis Associates. The average royalty per year is 2.6 % to the combination of Franco‐Nevada Corp. and Glamis Associates.
WMMI also pays a 6% to 9% net smelter royalty (depending on the relevant gold price) to the California State Lands Commission (CSLC) on production from certain California State leased lands under a Mineral Extraction Lease between WMMI and the CSLC. The royalty percentages are calculated as follows:

MESQUITE GOLD MINE, CALIFORNIA, U.S.A. TECHNICAL REPORT ON THE MESQUITE GOLD MINE, CALIFORNIA, U.S.A.
P a g e | 1‐3
27/04/2020
below $1,300 per troy ounce of gold, the royalty is 6%
from $1,300 to $1,800 per troy ounce of gold, the royalty is 7%
from $1,800 to $3,600 per troy ounce of gold, the royalty is 8%
above $3,600 per troy ounce of gold, the royalty increases to a maximum of 9%
1.3 Environment
WMMI received regulatory approval to resume mining operations on July 2, 2007, after the issuance of the air quality permit from the Imperial County Air Pollution Control District.
Equinox is in possession of all required permits and authorizations from federal, state, and local agencies to operate current facilities and activities. WMMI reports that the operation is in compliance with all issued permits.
AGP is not aware of any environmental liabilities on the property. AGP is not aware of any other significant factors and risks that may affect access, title, or the right or ability to operate on the property.
Reclamation plans have been developed by Equinox and approved by the applicable regulatory agencies. The plans have the specific objective of leaving the land in a useful, safe, and stable configuration capable of supporting native plant life, providing wildlife habitat, maintaining watershed functions, and supporting limited livestock grazing.
The current estimate for reclamation of all currently developed and foreseeable mining activities through 2022 is $21.0 million, as reported in the Asset Retirement Obligation (ARO) financial accounting of Equinox. At the same time, Equinox currently maintains seven separate bonds totaling $26.3 million to guarantee that proposed and approved reclamation activities will be fully funded and performed.
1.4 Geological Setting and Mineralization
The Mesquite Mine district lies on the southwest flank of the Chocolate Mountains, in amphibolite grade metamorphic rocks of the upper plate of the Vincent‐Chocolate Mountain Thrust. These upper plate rocks represent a fragment of Precambrian and Mesozoic continental crust that has an extremely complex geological history. The Mesquite Mine comprises two subparallel, Oligocene‐age deposits: Big Chief – Vista (Big Chief, Cholla, Lena, Rubble Ridge, Panhandle, and Vista) and Rainbow (Cherokee, Rainbow, and East Rainbow). Gold mineralization is hosted in Mesozoic gneisses that are intruded by biotite/muscovite rich granites. The district is covered by a thin veneer (0‐300 ft.) of Tertiary and Quaternary sediments, shed from the south slope of the Chocolate Mountains. Gold mineralization is bound by post‐mineral faulting related to the Neogene San Andreas fault system.

MESQUITE GOLD MINE, CALIFORNIA, U.S.A. TECHNICAL REPORT ON THE MESQUITE GOLD MINE, CALIFORNIA, U.S.A.
P a g e | 1‐4
27/04/2020
1.5 Exploration Status
There are a number of exploration targets within the footprint of the Mesquite Mine operation boundaries. Equinox has plans to test a number of targets in 2020.
Historic waste dump material, placed during periods of lower gold price and high cut‐off grade, will be drilled to assess gold grade and economic potential. Reverse circulation (RC) drilling will be conducted in the dump areas in 2020 to the standard required to convert any delineated mineralized material into mineral resources that can be considered for conversion to mineral reserves.
RC in‐fill drilling will also be conducted in select in‐pit targets to increase mineral resource confidence for classification and potential for conversion to mineral reserves.
1.6 Drilling
Drilling on the Mesquite Mine property has totalled approximately 3.3 million ft. in 9,728 holes of which WMMI drilled approximately 514,955 ft. in 1,700 holes. Of the total holes drilled to date, 118 holes in the database were exploratory in nature, and tested for satellite deposits.
The holes were mostly drilled vertically. In general, the disseminated mineralization is flat‐lying or with a moderate 16° southwest dip and therefore the vertical drilling provides an appropriate measure of the true thickness of mineralization.
1.7 Sample Preparation, Analyses and Security
1.7.1 Sample Preparation
Preparation protocols applied to the samples collected from drilling have produced sub‐samples of decent quality and are appropriate for assay analysis.
1.7.2 Analysis
The assay process has been monitored by quality assurance and control programs during all drilling and sampling campaigns. The assay results produced have been shown to be of decent quality and appropriate for use in resource estimation.
1.7.3 Security
Sample security protocols have been applied to all drilling and sampling by the various exploration and operating entities from the beginning of the operation. During that time there have been no security breaches or security incidents. All samples have been securely handled, transported, and processed.

MESQUITE GOLD MINE, CALIFORNIA, U.S.A. TECHNICAL REPORT ON THE MESQUITE GOLD MINE, CALIFORNIA, U.S.A.
P a g e | 1‐5
27/04/2020
1.8 Data Verification
Bechtel Corporation (1984) reported that Gold Fields Limited (Gold Fields) compared the results of reverse circulation (RC) and core drilling and concluded there was no bias in either type of drilling. During the initial reserve estimation, Gold Fields also made a comparison of block estimates based on drill holes with block estimates based on four or more bulk samples within each block. The mean grades of 50 blocks were within 2%. In addition, Gold Fields made a comparison of the grade estimates for 1,122 blocks based on 141 ft. spaced drilling with grade estimates of the same blocks based on drill spacing averaging less than 100 ft. The difference in the means of the block estimates was less than 1%, although individual blocks did not compare well.
Independent Mining Consultants Inc. (IMC) in 2006 did a comparison of the drilling data with the blasthole data by pairing drill hole composites with the closest blasthole within 10 ft. The summary statistics compared well, indicating good agreement between these two key data sets.
IMC (2006) believed the sampling database at Mesquite Mine was adequate to develop the resource model, mineral resource estimate, and ultimately the mineral reserve estimate to the level of accuracy required for the feasibility study at that time.
Mine Development Associates (MDA) completed an analysis that indicated the possibility that the RC data are slightly high biased compared to core. IMC proposed that, if this was true, it had been accounted for in the resource modelling, mostly due to, in the opinion of IMC, fairly aggressive grade capping. The comparison of blasthole data to RC data does not show this bias.
Original assay results from the individual drill programs are located in the hard copy files containing drill hole logs and assay sheets. In 2014 Roscoe Postle Associates Inc. (RPA) compared the assays from the original assay certificates with the entries in two diamond drill logs and found no errors.
The data is adequate to use as the basis for mineral resource estimation and mineral reserve definition.
1.9 Mineral Resource Estimate
Mineral Resources at Mesquite are comprised of in‐situ resources (as in previous years) and the newly added waste dump resources.
The Mesquite In‐situ Mineral Resource estimate was prepared by Ali Shahkar, P.Eng. of LGGC. The Waste Dump Mineral Resource estimate was completed by Robert Sim, P.Geo. of SGI. Bruce Davis, FAusIMM, of BDRC assisted both Ali Shahkar and Robert Sim. The resource estimate presented in this report is based on a database provided by Equinox on January 13, 2020, which included the results of drilling campaigns and re‐logging and geological interpretations carried out by Equinox in 2019. Mineral resources presented in this report are based on the resource‐limiting pit, mining (or mined‐out) surface and topographic surface as of December 31, 2019.

MESQUITE GOLD MINE, CALIFORNIA, U.S.A. TECHNICAL REPORT ON THE MESQUITE GOLD MINE, CALIFORNIA, U.S.A.
P a g e | 1‐6
27/04/2020
The resource limiting ultimate pit shell is derived using an assumed gold price of $1,500 per ounce, 2020 budget operating costs and metallurgical recoveries of 75% for oxide (OXD) and oxide‐transition (OXD‐TR) and 35% for transition and non‐oxide (NOX) and non‐oxide‐transition (NOX‐TR) rocks. The mineral resources contained within the resource limiting ultimate pit shell exhibit reasonable prospects for eventual economic extraction as required under NI 43‐101.
The mineral resources at the Mesquite Mine deposit have been classified in accordance with the CIM Definition Standards for Mineral Resources and Mineral Reserves (May 2014). The classification criteria are based on the distance‐to‐sample data and are based on the relative degree of confidence in the block grade estimate. These parameters are, in part, based on the prior production history and information at this operation.
The mineral resources, exclusive of mineral reserves, are listed in Table 1‐1. Resources have been segregated based on oxide type. The base case cut‐off grade for OXD/OXD‐TR material is 0.0025 oz/t Au and 0.0053 oz/t Au for NOX/NOX‐TR material. Waste dump resources are reported at a cut‐off grade of 0.004 oz/t gold, which is currently used for mining of waste dump material.
There are no known factors related to mining, metallurgical, infrastructure, environmental, permitting, legal, title, taxation, socio‐economic, marketing, or political issues which could materially affect the mineral resource. The eastern extent of the mineral resource, referred to as the Rainbow area, encroaches on an existing public roadway and full extraction of the full resource in the area would require moving the existing road. There are no known reasons that full access to the resource in this area could not be achieved in the future.

MESQUITE GOLD MINE, CALIFORNIA, U.S.A. TECHNICAL REPORT ON THE MESQUITE GOLD MINE, CALIFORNIA, U.S.A.
P a g e | 1‐7
27/04/2020
Table 1‐1: Mesquite Mine Mineral Resources Exclusive of Mineral Reserves – December 31,2019
Measured Indicated Measured and Indicated Inferred
Type COG Tons Au Cont. Tons Au Cont. Tons Au Cont. Tons Au Cont.
(oz/t) (kt) (oz/t) koz Au (kt) (oz/t) koz Au (kt) (oz/t) koz Au (kt) (oz/t) koz Au
OXD, OXD‐TR 0.0025 ‐ ‐ ‐ 9,373 0.012 110 9,373 0.012 110 11,855 0.012 139
NOX, NOX‐TR 0.0053 22 0.021 0 16,702 0.017 291 16,724 0.017 292 11,571 0.015 176
Waste Dump 0.004 ‐ ‐ ‐ 5,794 0.005 30 5,794 0.005 30 29,134 0.007 195
Combined ‐ 22 0.021 0 31,868 0.014 432 31,890 0.014 432 52,560 0.010 510
Notes:
Mineral resources restricted between December 31, 2019 reserve pit designs and ultimate resource limiting pit shell based on a gold price of $1500
per ounce, mining cost of $1.45, processing cost of $2.05.
OXD and OXD/TR have an assumed recovery of 75% and cut‐off grade of 0.0025 oz/t. NOX and NOX‐TR have an assumed recovery of 35% and cut‐
off grade of 0.0053 oz/t
Waste Dump material has an assumed recovery of 75% and cut‐off grade of 0.004 oz/t.
Ali Shahkar P.Eng. is the QP responsible for the in‐situ mineral resource estimation.
Robert Sim, P.Geo. is the QP responsible for the waste dump mineral resource estimation.

MESQUITE GOLD MINE, CALIFORNIA, U.S.A. TECHNICAL REPORT ON THE MESQUITE GOLD MINE, CALIFORNIA, U.S.A.
P a g e | 1‐8
27/04/2020
Mineral Resources that are not Mineral Reserves do not have demonstrated economic viability. There is no certainty that all or any part of the Mineral Resources will be converted into Mineral Reserves. Inferred resources have a greater amount of uncertainty as to their existence and whether they can be mined legally or economically. It is reasonably expected that a majority of resources in the Inferred category could be upgraded to Indicated (or Measured) mineral resource with continued exploration.
1.10 Mineral Processing and Metallurgical Testing
Previous operators of the Mesquite Mine have completed several metallurgical test work programs focused on heap leaching. Programs have been completed on‐site and also by industry recognized commercial laboratories.
As part of the heap leach control, and operating philosophy at the Mesquite Mine, column tests are conducted on material corresponding to different production periods. Recently these have been based on mined ore blocks. These column tests are conducted on composite samples of the heap leach feed and run on an as‐received basis with no size reduction or additional lime added.
These testing programs include at a minimum the following:
Direct Head Analyses, including:
o Column Test Fire Assay Head Assays o Column Test Cyanide Soluble Head Assays o Column Test Feed Sieve Analysis with Assays
Column Test Analyses, including:
o Daily solution analyses: effluent volume pH, free cyanide, and gold o Column Test Fire Assay Tail Assays o Column Test Cyanide Soluble Tail Assays o Column Test Tailing Sieve Analysis with Assays
At the completion of the column test leach cycle, the column charges are emptied, air dried and sampled for tail screen assays. The tail screen assay results are used to calculate the head grade which is the basis for the recovery calculation.
Mean gold recoveries for the Heap Leach Feed column tests was 68.1% gold with a median gold recovery of 71.1%. The gold recovery ranged between 40.2% and 96.6%, with an upper quartile of 79.7%. It should be noted that poor metallurgical response observed in the low recovery column tests appear to be a function of short leach cycles, i.e. 40 to 50 days and/or issues with leach solution chemistry, primarily pH.
The relevant production data to be considered is from the period between July 2007, when the mine reopened, and year‐end 2019. During this period approximately 215 million tons of ore containing 2,595,300 oz of gold have been placed on the heap leach pads with an average grade of 0.0121 oz/t Au. By December 2019, a total of 1,626,600 oz of gold had been produced, having
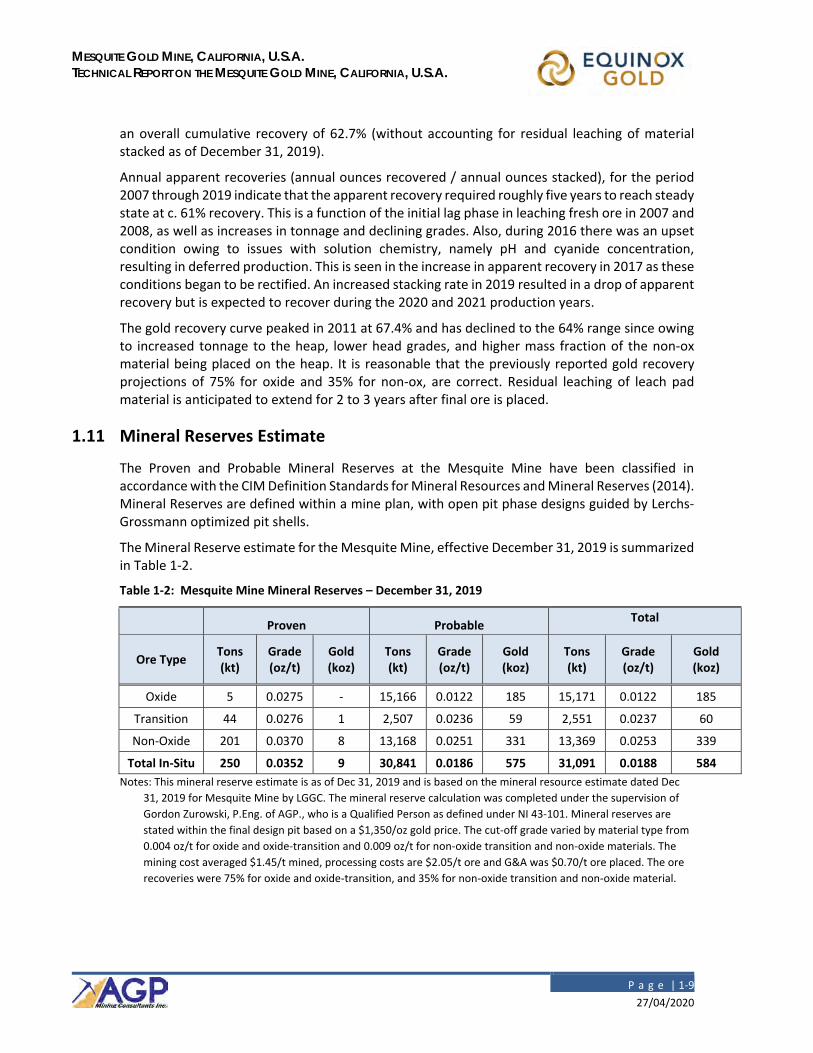
MESQUITE GOLD MINE, CALIFORNIA, U.S.A. TECHNICAL REPORT ON THE MESQUITE GOLD MINE, CALIFORNIA, U.S.A.
P a g e | 1‐9
27/04/2020
an overall cumulative recovery of 62.7% (without accounting for residual leaching of material stacked as of December 31, 2019).
Annual apparent recoveries (annual ounces recovered / annual ounces stacked), for the period 2007 through 2019 indicate that the apparent recovery required roughly five years to reach steady state at c. 61% recovery. This is a function of the initial lag phase in leaching fresh ore in 2007 and 2008, as well as increases in tonnage and declining grades. Also, during 2016 there was an upset condition owing to issues with solution chemistry, namely pH and cyanide concentration, resulting in deferred production. This is seen in the increase in apparent recovery in 2017 as these conditions began to be rectified. An increased stacking rate in 2019 resulted in a drop of apparent recovery but is expected to recover during the 2020 and 2021 production years.
The gold recovery curve peaked in 2011 at 67.4% and has declined to the 64% range since owing to increased tonnage to the heap, lower head grades, and higher mass fraction of the non‐ox material being placed on the heap. It is reasonable that the previously reported gold recovery projections of 75% for oxide and 35% for non‐ox, are correct. Residual leaching of leach pad material is anticipated to extend for 2 to 3 years after final ore is placed.
1.11 Mineral Reserves Estimate
The Proven and Probable Mineral Reserves at the Mesquite Mine have been classified in accordance with the CIM Definition Standards for Mineral Resources and Mineral Reserves (2014). Mineral Reserves are defined within a mine plan, with open pit phase designs guided by Lerchs‐Grossmann optimized pit shells.
The Mineral Reserve estimate for the Mesquite Mine, effective December 31, 2019 is summarized in Table 1‐2.
Table 1‐2: Mesquite Mine Mineral Reserves – December 31, 2019
Proven Probable
Total
Ore Type Tons (kt)
Grade (oz/t)
Gold (koz)
Tons (kt)
Grade (oz/t)
Gold (koz)
Tons (kt)
Grade (oz/t)
Gold (koz)
Oxide 5 0.0275 ‐ 15,166 0.0122 185 15,171 0.0122 185
Transition 44 0.0276 1 2,507 0.0236 59 2,551 0.0237 60
Non‐Oxide 201 0.0370 8 13,168 0.0251 331 13,369 0.0253 339
Total In‐Situ 250 0.0352 9 30,841 0.0186 575 31,091 0.0188 584
Notes: This mineral reserve estimate is as of Dec 31, 2019 and is based on the mineral resource estimate dated Dec
31, 2019 for Mesquite Mine by LGGC. The mineral reserve calculation was completed under the supervision of
Gordon Zurowski, P.Eng. of AGP., who is a Qualified Person as defined under NI 43‐101. Mineral reserves are
stated within the final design pit based on a $1,350/oz gold price. The cut‐off grade varied by material type from
0.004 oz/t for oxide and oxide‐transition and 0.009 oz/t for non‐oxide transition and non‐oxide materials. The
mining cost averaged $1.45/t mined, processing costs are $2.05/t ore and G&A was $0.70/t ore placed. The ore
recoveries were 75% for oxide and oxide‐transition, and 35% for non‐oxide transition and non‐oxide material.

MESQUITE GOLD MINE, CALIFORNIA, U.S.A. TECHNICAL REPORT ON THE MESQUITE GOLD MINE, CALIFORNIA, U.S.A.
P a g e | 1‐10
27/04/2020
1.12 Mine Plan
The Mesquite Mine is an operating open pit mine with ore processed by heap leaching using a CIC circuit to recover gold. Current mine production is a nominal 178,000 tons per day of total material, including a nominal 50,000 to 68,000 tons per day of ore that is hauled to the leach pad. Total mine production is capped at 65 million tons per year based on a restriction of the air quality permit. For 2019, a total of 256,200 contained ounces were mined and stacked on the heap leach pad and 125,736 ounces of gold were produced.
Highwall slope angle criteria vary by area and pit. In general, the steepest walls are on the south side of the property and the shallowest in the northeast. In general, the inter‐ramp angles vary from 29 to 42 degrees depending on pit area and wall orientation
The final pit designs are based on pit shells using the Lerch‐Grossman algorithm in Mine Plan software. Pits were generated using a revenue factor of 1.0 or gold price of $1,350/oz. These pit shells were used as the basis for the final phase designs in each pit area. The pit optimization utilized metallurgical recoveries of 75% for oxide ores and 35% for non‐oxide ores.
The detailed pit phase designs at Mesquite Mine are based on the pit optimization shells generated with the current resource model.
Three pit areas are considered in the reserves statement: Brownie (1‐phase), Vista East (2‐phases), Vista West (1‐phase) plus two areas in the Big Chief waste dump. Each pit has been designed to accommodate mining by the existing mining fleet. Mining occurs on 30 ft. lifts with catch benches spaced every 60 ft. vertically. The haul roads are 100 ft. in width with a road grade of 10%.
Mining cut‐offs for the mine plan are 0.004 oz/t for oxide and oxide‐transition and 0.009 oz/t for non‐oxide transition and non‐oxide material.
The mine schedule delivers 31.1 million tons of proven and probable ore grading 0.019 oz/t to the heap leach pad over a current design life of 2.5 years. The ore tonnage is made up of 0.25 million tons of proven reserves and 30.8 million tons of probable reserves.
The waste tonnage totals 120.9 million tons to be placed in various waste rock facilities or backfill in the existing pit workings. The overall strip ratio is 3.89:1.
The mine schedule utilizes the pit and phase designs to send a peak of 12.9 million tons of ore to the pad in 2020 then lesser amounts in the following years.
The mine equipment fleet is comprised of two Terex RH340 hydraulic shovels (44 yd3) which are the primary loading units. These are supported by two Cat 994H front end loaders (26 yd3) and a backup LeTourneau L1350 (28 yd3) front end loader. The haul truck fleet is comprised of sixteen Terex MT3700 (205 ton) and six Caterpillar 789D (200 ton) trucks. The mining fleet has additional support equipment in the form of track and rubber‐tired dozers, and graders. The mine operates on a work schedule of two 12‐hour shifts per day, seven days per week.

MESQUITE GOLD MINE, CALIFORNIA, U.S.A. TECHNICAL REPORT ON THE MESQUITE GOLD MINE, CALIFORNIA, U.S.A.
P a g e | 1‐11
27/04/2020
Drilling is performed with a fleet of rotary down‐the‐hole hammer drills (8¾ inch diameter) on a nominal 26 x 26 ft. pattern or a 28 x 28 ft. pattern. Blasting is controlled to minimize back break. The overall powder factor is 0.26 to 0.32 lb/ton. Holes are drilled to a 30 ft. bench height with 3 ft. of sub‐drilling for a total depth of 33 ft.
The MineSight generated pits showed the Rainbow pit area could potentially be included in the future once appropriate approvals are obtained to continue mining, and the highway is relocated. Currently that material remains in the resource category and has not been considered for reserves. This represents a future opportunity.
1.13 Processing
The Mesquite Mine processing facilities were originally designed to process 8,800 gpm of pregnant gold solution producing up to 140,000 oz of gold annually from a combination of 98 million tons of oxide ore grading 0.016 oz/t and 30 million tons of non‐oxide ore. Owing to the decreasing head grades as the mine developed, ore stacking, and solution processing rates have increased to maintain the nominal 140,000 ounce per annum production rate. Nominal solution flows to and from the heap are c. 13,400 gpm of barren solution to the heap and c. 12,000 of pregnant solution to the ADR circuit. The difference between the two flows accounts for fresh ore wetting and evaporation.
The processing facilities include the following operations:
heap leaching
carbon adsorption using Carbon‐in‐Column (CIC) processing
desorption and gold recovery
reagents and utilities
water services
During early operations, the ore was crushed to a nominal 2‐inch passing size. However, since the operation was re‐started in 2007, only Run‐of‐Mine (ROM) ore has been stacked and leached. ROM ore, with lime added for pH control, is trucked to the heap leach pad. The ore is stacked to a height of 20 ft. The ultimate pad height has been increased from 200 to 300 ft.
The Mesquite Mine became re‐certified in accordance with the International Cyanide Management Code in May 2018.
1.14 Markets
The average New York spot gold price for 2019 was $1,393 per troy ounce. The New York price as of December 31, 2019, was $1,519 per troy ounce. The three‐year, five‐year, and ten‐year rolling average prices through the end of December 2019 are $1,306, $1,265, and $1,314 per troy ounce, respectively. This Technical Report uses $1,350 per troy ounce for the economic analysis.

MESQUITE GOLD MINE, CALIFORNIA, U.S.A. TECHNICAL REPORT ON THE MESQUITE GOLD MINE, CALIFORNIA, U.S.A.
P a g e | 1‐12
27/04/2020
Dore is shipped from site to major precious metal refineries. WMMI has entered into a refining agreement with Asahi Refining. The terms and conditions are consistent with standard industry practices. Refining charges include treatment and transportation.
1.15 Capital and Operating Costs
Capital costs for the Mesquite Mine are minimal expenditures required to maintain operations in order to meet current reserves production. Capital costs are forecast to be $23.72 million over the remaining 2.5‐year mine life.
The total operating cost for the Mesquite Mine is $14.95 per ton processed including costs to complete the residual leaching. Operating costs are broken into three primary areas: mining, processing, and G&A.
The mining cost estimate is based on the reserves pit design and takes into consideration haulage distances, depth of mining, height of leach pad, and expected consumable and maintenance costs. Mine operating costs are based on the 2019 Operating Budget and Forecast and are forecast to be $1.79/ ton moved for the life of mine.
The process operating cost also is based on the forecast with adjustments made for consumables, primarily cyanide, lime, power, and other reagents. This cost is estimated to be $5.50 /ton ore processed.
G&A operating costs are based on historic operating costs with a forecast for increased labour, benefits, etc. These costs include the site overhead, but not the corporate overhead. The forecast is $1.67 /ton ore processed.
Refining costs are $1.30 per ounce of gold.
1.16 Financial Analysis
NI 43‐101 regulations exempt producing issuers from the requirement to disclose Economic Analysis on properties currently in production, unless the technical report prepared by the issuer includes a material expansion of current production. Equinox is a producing issuer, the Mesquite mine is currently in production, and a material expansion is not included in the current Mesquite LOM plan. AGP has performed an economic analysis using the Mineral Reserves and Life‐of‐Mine Plan presented in this report, and confirms the outcome is a positive cash flow that supports the statement of Mineral Reserves.
1.17 Conclusions
The Mineral Resources and Mineral Reserves have been successfully updated for the property. AGP believes that there are no issues with respect to the technical information that would materially impact on mineral resource and mineral reserve estimates, that the resource and reserve estimates have been properly prepared using acceptable methods, and that they may be

MESQUITE GOLD MINE, CALIFORNIA, U.S.A. TECHNICAL REPORT ON THE MESQUITE GOLD MINE, CALIFORNIA, U.S.A.
P a g e | 1‐13
27/04/2020
relied upon for project economic analysis. The project shows robust economics and the initial capital payback has already occurred.
The Mesquite Mine has combined oxide, oxide‐transition, non‐oxide transition and non‐oxide type material in Measured plus Indicated mineral resources, exclusive of mineral reserves, estimated to be 31.9 M tons at an average grade of 0.014 oz/t gold, for a total of 0.4 M ounces of contained gold, plus an additional 52.6 M tons of mineral resources in the Inferred category at an average grade of 0.010 oz/t gold, containing 510 koz of contained gold.
The eastern extent of the mineral resource, referred to as the Rainbow Area, encroaches on an existing public roadway and the extraction of the full resource in this area would require moving the existing roadway. Full access to the resource in this area could be achieved in the future.
It is AGP’s opinion the metallurgical recoveries used in this Technical Report are to a level sufficient to support Mineral Reserves declaration.
Further optimization of the mine plan is underway to investigate opportunities to bring ounces forward in the schedule and reduce mine operating costs.
Exploration potential exists for expanding the mine life in the Rainbow pit area and re‐examination of the past waste dumps. This work is ongoing.
1.18 Recommendations
The Qualified Person recommendations include the following work in each of the respective areas:
Geotechnical:
complete the detailed geotechnical work proposed by the consultant for the Brownie pit area; this includes the geotechnical drilling in the north end of the pit
continue monitoring of current slopes of the pit and waste dumps as mining progresses and adjusting per any updated geotechnical criteria.
Laboratory:
improve on the current analytical method’s sensitivity and method detection limits by implementation of ICP‐AES
complete an analytical method detection limit study to determine actual capability of the laboratory.
Metallurgy:
column test work improvements such as:
o examine different ore types o test various lift heights to maximize recovery o investigate the application rate to determine if it requires change

MESQUITE GOLD MINE, CALIFORNIA, U.S.A. TECHNICAL REPORT ON THE MESQUITE GOLD MINE, CALIFORNIA, U.S.A.
P a g e | 1‐14
27/04/2020
develop a geometallurgical model to assist in recovery estimations and production forecasting
examine relationship for lime dosage requirements and rock types
drill and sample “spent” heaps.
Heap Leaching:
develop long term stacking plan
examine placement height versus recovery
develop solution management plan:
o optimize application rates o optimize overall flow to the heap o increase heap leach area under leach o minimize cyanide consumption
continue study work on non‐oxide material to accurately assess its impact to future mining and gold production.
Mineral Resource:
improve classification within the Brownie Pit area by means of:
o small infill drill hole program to improve the drill hole spacing on the eastern margins of the area
o better definition of the location of the Brownie fault down to relevant depths o re‐evaluation of domaining and classification based on new interpretations o drilling aimed at extending the zone especially towards the north and south
further develop the new oxide categorization by:
o incorporation of ratios of cyanide soluble gold grades versus fire assay (total) gold grade, as well as sulphur data to compare against the observed data
o testing to confirm and better define the recoveries currently assigned to these categories
continue to investigate means of improving ore/waste selection during mining
continue with detailed mapping to better understand the structural controls on the distribution of mineralization .
Mine Planning and Mineral Reserves:
continued examination of mine sequence to bring ounces forward in the mine plan
start the examination of including Rainbow pit into the current mine plan:
o work with Environmental Department on drilling permit o assist Environmental Department on relocation of highway to make Rainbow pit
available for mine planning
examine the impact of drilling underway in old waste dumps:

MESQUITE GOLD MINE, CALIFORNIA, U.S.A. TECHNICAL REPORT ON THE MESQUITE GOLD MINE, CALIFORNIA, U.S.A.
P a g e | 1‐15
27/04/2020
o as the information from the Waste Dump Drilling program becomes available, prepare various mine plan scenarios that incorporate that material to determine potential increases in the mine overall economics
o examine and determine what portion of the mine dump material may be brought into reserves.

MESQUITE GOLD MINE, CALIFORNIA, U.S.A. TECHNICAL REPORT ON THE MESQUITE GOLD MINE, CALIFORNIA, U.S.A.
P a g e | 2‐1
27/04/2020
2 INTRODUCTION
Equinox retained independent consultants to prepare a Technical Report (the Report) on the Mesquite Mine near Brawley, Imperial County, California, U.S.A.
The preparation of the Report is led by AGP but includes contributions by Woods, LGGC, SIM, BDRC, and Robison.
This Report was prepared in compliance with National Instrument 43–101, Standards of Disclosure for Mineral Projects (NI 43–101) and documents the results of the estimation of mineral resources and mineral reserves on the Mesquite Mine property.
Unless specified, all measurements in this Report use the Imperial system. The Report currency is expressed in US dollars.
2.1 Qualified Persons
The Qualified Persons (QPs), as defined in NI 43–101, responsible for the preparation of the Report include:
Bruce Davis, FAusIMM, Geostatistician (BDRC)
Nathan Robison, PE, Principal Engineer (Robison)
Ali Shahkar, P.Eng., Principal Consultant (LGGC)
Robert Sim, P.Geo., Principal Geologist (SIM)
Jeff Woods, Principal Consulting Metallurgist, SME, MMSA (Woods)
Gordon Zurowski, P.Eng., Principal Mine Engineer (AGP)
2.2 Site Visits and Scope of Personal Inspection
AGP, LGGC, SIM, BDRC, Woods, and Robison QPs have conducted site visits to the Mesquite Mine as shown in Table 2‐1.

MESQUITE GOLD MINE, CALIFORNIA, U.S.A. TECHNICAL REPORT ON THE MESQUITE GOLD MINE, CALIFORNIA, U.S.A.
P a g e | 2‐2
27/04/2020
Table 2‐1: Dates of Site Visits and Areas of Responsibility
QP Name Site Visit Dates Area of Responsibility
Bruce Davis Nov. 13, 2018 Sections 4, 5, 6, 7, 8, 9, 10, 11 and 12, and those portions of the Summary, Interpretations and Conclusions, and Recommendations that pertain to those sections
Nathan Robison Numerous times with most recent April 6‐8, 2019
Sections 20 and those portions of the Summary, Interpretations and Conclusions, and Recommendations that pertain to that section
Ali Shahkar July 17‐18, 2018 Sections 14.1, 14.3, 14.4, 14.5 and those portions of the Summary, , Interpretations and Conclusions and Recommendations that pertain to that section
Robert Sim April 8 ‐9, 2015 Sections 14.2 and those portions of the Summary, , Interpretations and Conclusions and Recommendations that pertain to that section
Jeff Woods Numerous times with most recent March 17, 2020
Sections 13 and 17 and those portions of the Summary, Interpretations and Conclusions and Recommendations that pertain to those sections
Gordon Zurowski Numerous times with most recent Oct 29 – Nov 2, 2018
Sections 2, 3, 15, 16, 18, 19, 21, 22, 23, 24, 25 and those portions of the Summary, and Recommendations that pertain to those sections.
2.3 Effective Dates
The reserve and resource calculations are based on the surveyed month end pit surface dated 31 December 2019.
The effective dates of the resource and reserves are as follows:
Resource – December 31, 2019
Reserve – December 31, 2019
There were no material changes to the scientific and technical information between the effective date and the signature date of the Report other than ongoing grade control sampling and production reporting as expected of an operating mine. Therefore, the effective date of the Report is considered to be December 31, 2019.
2.4 Information Sources and References
AGP, LGGC, SIM, BDRC, Woods, and Robison have sourced information from reports and other reference documents as cited in the text and summarized in Section 27 of this Report. Technical data for preparation of the mineral resource and reserve estimation, was provided by Equinox.

MESQUITE GOLD MINE, CALIFORNIA, U.S.A. TECHNICAL REPORT ON THE MESQUITE GOLD MINE, CALIFORNIA, U.S.A.
P a g e | 2‐3
27/04/2020
2.5 Previous Technical Reports
This is the second technical report on the Mesquite Mine to be filed for Equinox. Previous technical reports for the Mesquite Mine include:
AGP, 2019: Equinox Technical Report on the Mesquite Gold Mine, Imperial County, California, USA, by G. Zurowski, B. Davis, N. Robison, R. Sim, and J. Woods, prepared for Equinox Corp., March 18, 2019.
RPA, 2014: Technical Report on the Mesquite Mine, Brawley, California, USA, by R.J. Lambert, W.W. Valliant, and K. Altman, prepared for New Gold Inc., February 28, 2014.
Scott Wilson RPA, 2010: Technical Report on the Mesquite Mine, Brawley, California, USA, by R.J. Lambert, W.W. Valliant, and H. Krutzelmann, prepared for New Gold Inc., February 26, 2010.

MESQUITE GOLD MINE, CALIFORNIA, U.S.A. TECHNICAL REPORT ON THE MESQUITE GOLD MINE, CALIFORNIA, U.S.A.
P a g e | 3‐1
27/04/2020
3 RELIANCE ON OTHER EXPERTS
This report has been prepared by AGP, LGGC, SGI and Robison Engineering Company (Robinson) for Equinox. The information, conclusions, opinions, and estimates contained herein are based on:
information available at the time of preparation of this report
assumptions, conditions, and qualifications as set forth in this report
data, reports, and other information supplied by Equinox and other third‐party sources
Ownership information was provided by Equinox on February 7, 2020. This has been relied upon by the QPs who have not researched property title or mineral rights for the Project and express no opinion as to the ownership status of the property.
Equinox provided guidance on applicable taxes, royalties, and other government levies or interests, applicable to revenue or income from the Project.
Except for the purposes legislated under provincial securities laws, any use of this report by any third party is at that party’s sole risk.

MESQUITE GOLD MINE, CALIFORNIA, U.S.A. TECHNICAL REPORT ON THE MESQUITE GOLD MINE, CALIFORNIA, U.S.A.
P a g e | 4‐1
27/04/2020
4 PROPERTY DESCRIPTION AND LOCATION
4.1 Location
The Mesquite Mine is located at latitude 33° 03’ North and longitude 114° 59’ West in Imperial County, Southern California. The property is approximately 24 miles north of the border with Mexico and 16 miles west of the border with the State of Arizona. The site is bordered to the north by the Chocolate Mountains Aerial Gunnery Range (CMAGR) and to the east and south by California State Highway 78, which is used to access the site. The Mesquite Mine is operated by Equinox’s wholly owned subsidiary, Western Mesquite Mines, Inc. (WMMI). A location map for the Project is presented in Figure 4‐1 below.
The project survey control is based on a local coordinate system. Robison Engineering developed a custom geodetic translation to define this grid, and the Mesquite Mine survey department maintains an accurate map of survey control tied to global Universal Transverse Mercator (UTM), public (California State Plane Zone 6) and the local mine grid coordinate systems.
Figure 4‐1: Location Map

MESQUITE GOLD MINE, CALIFORNIA, U.S.A. TECHNICAL REPORT ON THE MESQUITE GOLD MINE, CALIFORNIA, U.S.A.
P a g e | 4‐2
27/04/2020
4.2 Land Tenure
4.2.1 Mineral Rights
The mineral rights at the Mesquite Mine consist of 265 unpatented and 53 patented mining lode claims, 97 unpatented and 122 patented mill site claims, 658 acres of California State leased land, and a lease of a portion of the 4,275 acres of adjacent private land owned by the Los Angeles County Sanitation District (LACSD).
All the aforementioned properties are controlled by WMMI and are collectively identified as the Mesquite Plan of Operations Area as shown in Figure 4‐2 below.
The claims located on federally owned lands are administered by the Bureau of Land Management (BLM) and a detailed claim map is provided as Figure 4‐3.
Patented mining lode claims and patented mill site claims on U.S. Federal Land represent a secure title to the land. Unpatented mining and mill site claims do not have a termination date as long as annual assessment work is maintained and the land is held for mining purposes. The Federal fee land is leased by WMMI and can also be maintained indefinitely as long as the annual maintenance fees are paid.

MESQUITE GOLD MINE, CALIFORNIA, U.S.A. TECHNICAL REPORT ON THE MESQUITE GOLD MINE, CALIFORNIA, U.S.A.
P a g e | 4‐3
27/04/2020
Figure 4‐2: Plan of Operations

MESQUITE GOLD MINE, CALIFORNIA, U.S.A. TECHNICAL REPORT ON THE MESQUITE GOLD MINE, CALIFORNIA, U.S.A.
P a g e | 4‐4
27/04/2020
Figure 4‐3: Claim Map

MESQUITE GOLD MINE, CALIFORNIA, U.S.A. TECHNICAL REPORT ON THE MESQUITE GOLD MINE, CALIFORNIA, U.S.A.
P a g e | 4‐5
27/04/2020
4.3 Agreements and Encumbrances
In October 2018 Equinox acquired the Mesquite Mine from New Gold, Inc. (New Gold) through a Share Purchase Agreement. Under this agreement, Equinox acquired the Mesquite Mine by purchasing of all of the shares of New Gold Mesquite, Inc. (since renamed to Mesquite Gold Mine, Inc. (MGM)). WMMI, which directly owns the mine and its properties, is a wholly owned subsidiary of MGM, and thus became a wholly owned subsidiary of Equinox.
The mine properties consist of fee lands, leased lands, and mining claims. All of the properties have certain restrictions in common which are:
the applicable land use restrictions of the California Desert Conservation Areas
any multiple use rights of third parties as provided for in the applicable federal laws and regulations
reservations to the United States for right of way for ditches or canals constructed by the Federal Government
Some of the unpatented claims may have small areas that encroach on the Chocolate Mountain Aerial Gunnery Range (CMAGR). Any portion of the claims located inside the gunnery range are invalid but do not affect operations or any known potential mining areas.
4.4 Surface Rights
4.4.1 Mesquite Owned Property
The surface ownership of patented mining claims, which are identified as Imperial County Assessor’s parcels, have all the general rights of surface ownership as fee land. The patented mining claims are shown on Figure 4‐3. WMMI also own patented claims and mill site claims south of the mine property for water supply wells.
4.4.2 State of California Property
WMMI has surface operation rights within the leased parcel identified under the Section 4.2.1 ‐ Mineral Rights above.
4.4.3 Unpatented Mining Claims/Public Lands
The lode claims and mill site claims maintained by WMMI provide the general right for surface management and operations, subject to environmental permitting and other compliance activities unique to public lands. However, under California’s Environmental Quality Act (CEQA) authority, which generally mirrors the National Environmental Policy Act (NEPA) requirements the BLM is tasked to administer, there is little practical difference in operations and reclamation requirements regardless of whether the land is public or private.

MESQUITE GOLD MINE, CALIFORNIA, U.S.A. TECHNICAL REPORT ON THE MESQUITE GOLD MINE, CALIFORNIA, U.S.A.
P a g e | 4‐6
27/04/2020
4.4.4 Los Angeles County Sanitation District (LACSD) Landfill
In 1993, a Mineral Lease and Landfill Agreement was signed between Hanson Resource Company (HNRC) and Hospah Coal Company (Hospah), a subsidiary of Newmont, in conjunction with Santa Fe Pacific Minerals Corporation (SFPMC). LACSD is now the successor to HNRC, and WMMI assumed the rights and obligations of Hospah, SFPMC, and Newmont when the Mesquite Mine operation was acquired by Western Goldfields Inc. (WGI) on November 9, 2003.
LACSD is constructing a landfill facility adjacent to, and overlying portions of, the existing Mesquite Mine operations property. The landfill project will be located on private land owned by LACSD, as shown in Figure 4‐3 above. The landfill is expected to have an operational life of 100 years with a receiving capacity of 20,000 tons of landfill material per day. As part of the landfill project, LACSD has constructed a rail spur, from the main rail line at Brawley to the site, for delivery of containerized waste from the LACSD facilities in the Los Angeles area.
Under the agreement, WMMI has retained the right to explore, mine, extract, process, market, and sell ore, and otherwise conduct mining and processing activities, anywhere within the Mesquite Mine property for an initial period through 2024 with automatic extensions until 2078. LACSD has the right to utilize portions of the overburden stockpiles and spent ore from the leach pads for use as daily cover for the landfill, as well as for construction materials for general purposes as well as liner design. This overburden and spent ore material will be jointly used by both LACSD and WMMI, but WMMI will have priority.
WMMI remains responsible for the reclamation and environmental obligations for materials mined and processed from previous or future mining activities according to the existing permit requirements. If LACSD requires additional treatment, relocation, or additional processing of stockpiled or rinsed heap materials, the Landfill Lease Agreement stipulates that WMMI will be compensated for any additional costs incurred.
The 1993 Agreement provides for joint use of assets associated with the Mesquite Mine property for the mutual benefit of both parties. Water is delivered to the property by WMMI from a well field located southeast of the mine. The water wells and associated pipeline will be operated and maintained by WMMI and water will be provided to LACSD with the costs shared based on proportional usage. Other infrastructure items, such as access roads, power lines, and communications systems, will be treated on an individual basis. LACSD has realigned the access road for the landfill project. Power lines and communication systems have been chosen to operate as independent systems with all costs being the responsibility of the individual parties.
4.5 Royalties
Most of the mineral reserves planned for future mining at Mesquite Mine will be subject to a 0.5% to 2% production royalty due Franco‐Nevada Corporation and a 2% production royalty due Glamis Associates depending on the claim group. Claims jointly owned by Franco‐Nevada Corp. and Glamis Associates will pay a 1% royalty to Franco‐Nevada Corp. and a 2% royalty to Glamis

MESQUITE GOLD MINE, CALIFORNIA, U.S.A. TECHNICAL REPORT ON THE MESQUITE GOLD MINE, CALIFORNIA, U.S.A.
P a g e | 4‐7
27/04/2020
Associates. The average royalty per year is 2.6 % to the combination of Franco‐Nevada Corp. and Glamis Associates.
WMMI also pays a 6% to 9% net smelter royalty (depending on the relevant gold price) to the California State Lands Commission (CSLC) on production from certain California state leased lands under a Mineral Extraction Lease between WMMI and the CSLC. The royalty percentages are calculated as follows:
below $1,300 per troy ounce of gold, the royalty is 6%
from $1,300 to $1,800 per troy ounce of gold, the royalty is 7%
from $1,800 to $3,600 per troy ounce of gold, the royalty is 8%
above $3,600 per troy ounce of gold, the royalty increases to a maximum of 9%
AGP is not aware of any environmental liabilities on the property. Equinox has all required permits to conduct the proposed work on the property. AGP is not aware of any other significant factors and risks that may affect access, title, or the right or ability to operate on the property.

MESQUITE GOLD MINE, CALIFORNIA, U.S.A. TECHNICAL REPORT ON THE MESQUITE GOLD MINE, CALIFORNIA, U.S.A.
P a g e | 5‐1
27/04/2020
5 ACCESSIBILITY, CLIMATE, LOCAL RESOURCES, INFRASTRUCTURE, AND PHYSIOGRAPHY
5.1 Accessibility
The Mesquite Mine is located approximately 35 miles to the east of the town of Brawley, California and about 52 miles northwest of the city of Yuma, Arizona. Access to the property is from California State Highway 78 and then north along a paved private road into the Mesquite Mine site. Figure 4‐1 shows the general location.
5.2 Climate
The climate for Mesquite Mine is arid, with elevated temperatures in the summer generally in the 100° ‐ 110°F range, and winter highs generally in the 70° ‐ 80°F range. Winter temperatures are rarely below 32°F. Based on data collected at the Yuma weather station, the average annual temperature is 73°F. The lowest minimum average temperature is 42°F occurring in January. Precipitation can occur throughout the year but is most common during the late summer months (August and September) or during the winter months (January through March). Precipitation at the property totals less than three inches per year. Commonly, most of the year’s precipitation occurs in one or two short duration storm events. Annual evaporation, as measured at the Yuma weather station, is 97.7 inches.
The combination of low precipitation and high evaporation results in a situation where surface run‐off from the area is uncommon. Washes in the area are dry and will channel run‐off only during severe storm events. On average this may occur once per year, although it is common to have one‐ or two‐year periods with no surface flows at all. When surface flows do occur, washes will typically flow for periods of less than one hour.
5.3 Physiography
The Mesquite Mine is located a few miles to the southwest of the Chocolate Mountains and the CMAGR, at an elevation of between 600 ‐ 1,000 ft. above sea level. The property is on an alluvial fan that slopes gently from the northeast to the southwest. The vegetation consists of sparse desert vegetation with creosote bush, brittle brush, barrel cactus, and cholla cactus present.
5.4 Local Resources
Accommodations, supplies, and labour are available in either Brawley, California with a population of 25,000 (2010 census), or Yuma, Arizona with a population of 93,000 (2010 census). Consequently, mining suppliers and contractors are locally available.

MESQUITE GOLD MINE, CALIFORNIA, U.S.A. TECHNICAL REPORT ON THE MESQUITE GOLD MINE, CALIFORNIA, U.S.A.
P a g e | 5‐2
27/04/2020
5.5 Infrastructure
5.5.1 Electrical Power
Electricity for the mine is provided through a 92‐kV power line. Power is supplied to the site by Imperial Irrigation District Power Company. Power is stepped down from 92 kV to 13.2 kV on‐site. All power distribution from this point onwards is distributed on equipment and infrastructure owned by WMMI.
5.5.2 Water
Water for the project is supplied from the existing Vista well field located approximately two miles south of California State Highway 78. The two current active wells are deemed capable of supplying the water requirements for both WMMI and the LACSD operations. A new 18‐inch diameter line is in place; and the two existing pumping systems are capable of supplying approximately 2,000 gpm of fresh water to the operation. The mine will require about 1,000 gpm, and the landfill will require a maximum of 700 gpm when operating at full capacity.
5.5.3 Heap Leach Pad
Leach pad capacity as of December 31, 2019 is 30.7 million tons. That will complete Leach Pad 7 (designed by Tetra Tech) and Leach Pad 6 to the full 300 ft. height. To place the reserve leach tonnage on the pad, an additional 2.4 million tons of capacity is required. Mesquite Mine is currently engaged in the permitting process to expand leach pad capacity and do not feel this will be unduly withheld.

MESQUITE GOLD MINE, CALIFORNIA, U.S.A. TECHNICAL REPORT ON THE MESQUITE GOLD MINE, CALIFORNIA, U.S.A.
P a g e | 6‐1
27/04/2020
6 HISTORY
The description of the history of the project is summarized from the Micon (2006) report.
The first gold production at the Mesquite Mine project dates to the late 1800s and early 1900s when placer gold was recovered on a small scale. After World War II, small‐scale subsistence mining continued. At times, hundreds of people worked the mines or prospected in the area.
Gold was first discovered at Mesquite Mine by track crews building the Southern Pacific railroad around 1876. The first strike and claims in the area were staked at this time by Felisaro Parro. During the 1920s and 1930s, small‐scale subsistence placer mining was conducted in the district by jobless men searching for gold in the Chocolate Mountains and surrounding foothills. Larger placer and lode mining were reported in the area from 1937 through to the mid‐1970s.
In 1957, prospectors Richard and Ann Singer, staked 27 claims in the area, and began a dry washing campaign lasting until the late 1980s. Attempts at lode mining on the Mesquite Mine property were initiated during the 1950s and continued through the late 1970s, with no significant production recorded. The largest shaft was the Big Chief, sunk by Charlie Wade and K.W. Kelly, to a depth of 150 feet.
Exploration during the 1970s included work by Placer‐Amax, Conoco, Glamis Gold Corporation (Glamis Gold), Newmont, and Gold Fields. Exploration sampling, trenching, and drilling identified a number of gold bearing zones. The results and details concerning the pre‐Gold Fields exploration are not available for inclusion in this report.
Gold Fields Mining Corporation (Gold Fields) became interested in the property in 1980 and spent the next two years exploring and acquiring a land position. Once a land position had been acquired, Gold Fields started an exploratory drill program and in late 1982 announced it had identified a bulk mineable gold deposit. Gold Fields initiated a thorough exploration program that included surface sampling and geophysics. In September 1981, Gold Fields drilled twelve rotary drill holes, ten of which encountered significant mineralization within 200 ft. of the surface. In 1982, Gold Fields drilled the Big Chief deposit on a 141 ft. fence line, with holes spaced 141 ft. apart along the fence line.
This campaign employed 5‐1/4‐inch Reverse Circulation (RC) holes above the water table (approximately 200 ft.) and 3‐1/16‐inch core holes below the water table. By September 1982, 350 exploration holes had been drilled. By September 1983, a total of 868 holes were completed totalling 284,439 ft. of drilling. Approximately 1/3 of the holes in the present database were completed by mid‐year 1988 (3,200 holes and 1.3 million ft.). Gold Fields, Santa Fe, and Newmont continued to drill on the Mesquite Mine property by mostly RC drilling as they mined the deposits although Gold Fields completed most of the drilling on the property. By 1993, Gold Fields had completed over 5,000 holes, totalling 2.4 million ft.
In late 1982, sinking of a decline began with the objective of improving the confidence in the drill results of the Big Chief deposit. A total of 2,390 ft. of underground decline development (586

MESQUITE GOLD MINE, CALIFORNIA, U.S.A. TECHNICAL REPORT ON THE MESQUITE GOLD MINE, CALIFORNIA, U.S.A.
P a g e | 6‐2
27/04/2020
rounds) near the centre of the deposit was completed in 1983 (Bechtel, 1984). The decline was driven to provide material for pilot heap leach tests and to allow detailed geologic mapping and bulk sampling of the deposit. Each round from the decline was bulk sampled and a comparison with drill sampling was noted by Bechtel (1984). A total of 50 model blocks were estimated from the decline data and compared to the same blocks estimated from drill holes drilled along the path of the decline on 20 ft. intervals. The average grade of the two estimates compared closely, although the grade estimates of individual blocks did not correlate well.
Gold Fields, Santa Fe, and Newmont continued to drill and develop the Big Chief, Vista, Cherokee, Rainbow, Lena, and Gold Bug deposits on the property. The initial grid at Big Chief was reduced to 70 ft. with infill drilling along the 141 ft. space fence lines. The Vista deposit was initially drilled on 140 ft. sections, with drill holes spaced 70 ft. apart on the sections. The other deposits were drilled initially on 200 ‐ 400 ft. grids, with infill drilling generally completed on 100 ft. spacing.
Gold Fields began commercial gold production in the Big Chief pit at Mesquite Mine in March 1986 as a heap leach gold operation. In 1993, Santa Fe Pacific Gold Corporation (Santa Fe) acquired the Chimney Creek Mine in Nevada and the Mesquite Mine in California from Gold Fields. In May 1997, Santa Fe was acquired by Newmont Mining Corporation (Newmont). Newmont mined the deposit through May 2001, when there was a slope failure in the Big Chief pit and the existing reserves at a $300/oz gold price were deemed to be uneconomic. Gold recovery from the Mesquite Mine heap continued through to 2007. A total of 154 million tons of material grading 0.026 oz/t Au had been placed on the leach pads when mining operations stopped in 2001. Approximately 3.05 million oz of gold were recovered between 1985 and 2007 with a calculated average gold recovery of 76.5% prior to the restart of operations in late 2007. Table 6‐1 shows a summary of the historical mine production.
WGI acquired the Mesquite Mine from Newmont in November 2003. WGI completed a feasibility study in 2006 (Micon, 2006), and restarted operations in late 2007. In May 2006, WGI reported 201.9 million tons grading 0.018 oz/t Au containing 3.56 million ounces gold of Measured and Indicated mineral resources and 12.4 million tons grading 0.019 oz/t Au of Inferred mineral resources. Proven and Probable mineral reserves were estimated at 130.9 million tons grading 0.018 oz/t Au. The foregoing mineral reserves and mineral resources were considered compliant with CIM definitions however, they are historical in nature, a qualified person has not done sufficient work to classify the historical estimate as current mineral resources and mineral reserves and the issuer is not treating these historical estimates as current mineral resources or mineral reserves.
Commercial production was achieved in January 2008. In June 2009, following a business combination with WGI, New Gold became the operator. Newmont’s 2% net smelter royalty on the project was transferred to Franco‐Nevada Corporation in 2007.
Since 2007, an additional 1,499,000 ounces have been produced, bringing the total production to 4.5 million ounces since 1985. Table 6‐2 shows a summary of the mine production from 2007 to 2018.

MESQUITE GOLD MINE, CALIFORNIA, U.S.A. TECHNICAL REPORT ON THE MESQUITE GOLD MINE, CALIFORNIA, U.S.A.
P a g e | 6‐3
27/04/2020
Table 6‐1: Historic Production
Year Ore Au Au Au Annual Au Cum. Au
Placed Grade Placed Produced Recovery Recovery (tons) (oz/t) (oz) (oz) (%) (%)
1985 329,800 0.0549 18,110 0 0 0
1986 3,019,700 0.0624 188,410 152,810 81.1 74
1987 3,908,200 0.0519 202,700 179,660 88.6 81.2
1988 4,881,900 0.0455 222,070 173,170 78 80.1
1989 7,670,300 0.0321 246,220 199,690 81.1 80.4
1990 8,230,800 0.0359 295,430 202,260 68.5 77.4
1991 7,924,100 0.0304 240,880 201,730 83.7 78.5
1992 9,079,900 0.0294 266,830 207,890 77.9 78.4
1993 9,749,900 0.0297 289,260 205,910 71.2 77.3
1994 10,770,280 0.0301 324,250 209,570 64.6 75.5
1995 13,766,790 0.0223 306,480 193,360 63.1 74.1
1996 15,527,630 0.0229 356,240 186,800 52.4 71.5
1997 16,463,000 0.0165 271,530 227,940 83.9 72.5
1998 11,536,700 0.016 185,080 154,080 83.3 73.1
1999 14,087,100 0.0166 234,040 164,570 70.3 72.9
2000 12,840,900 0.0162 208,090 120,920 58.1 72.1
2001 4,225,500 0.0309 130,620 92,630 70.9 72.1
2002 57,100 73.5
2003 48,796 74.7
2004 29,001 75.5
2005 21,776 76
2006 14,001 76.4
2007 7,392 76.5
Total/Avg 154,012,500 0.0259 3,986,240 3,051,056 76.5

MESQUITE GOLD MINE, CALIFORNIA, U.S.A. TECHNICAL REPORT ON THE MESQUITE GOLD MINE, CALIFORNIA, U.S.A.
P a g e | 6‐4
27/04/2020
Table 6‐2: Production 2007‐2019 Equinox– Mesquite Mine, U.S.A.
Year Ore Placed
(tons) Au Grade (oz/t)
Au Placed (oz)
Au Produced
(oz)
Annual Au Recovery
(%)
Cumulative Au
Recovery (%)
2007 978,886 0.0198 19,345 3,777 19.5% 19.5%
2008 9,023,477 0.0224 202,147 111,034 54.9% 51.8%
2009 14,422,500 0.0150 216,012 150,002 69.4% 60.5%
2010 12,485,147 0.0181 225,882 169,023 74.8% 65.4%
2011 12,933,811 0.0166 214,321 158,004 73.7% 67.4%
2012 15,988,000 0.0136 216,790 142,008 65.5% 67.0%
2013 15,760,000 0.0109 171,900 107,016 62.3% 66.4%
2014 14,936,000 0.0117 174,810 106,669 61.0% 65.7%
2015 22,032,000 0.0100 221,040 134,868 61.0% 65.1%
2016 20,911,000 0.0110 229,250 111,123 48.5% 63.1%
2017 22,959,000 0.0094 216,510 168,890 78.0% 64.6%
2018 24,640,700 0.0093 229,770 140,136 61.0% 64.3%
2019 27,800,000 0.0093 257,480 125,736 48.8% 62.7%
Total/Avg 214,870,521 0.0121 2,595,257 1,628,286 62.7%
MESQUITE GOLD MINE, CALIFORNIA, U.S.A. TECHNICAL REPORT ON THE MESQUITE GOLD MINE, CALIFORNIA, U.S.A.
P a g e | 7‐1
27/04/2020
7 GEOLOGICAL SETTING AND MINERALIZATION
7.1 Regional Geology
The description of the regional geology was taken from a paper written by Newmont Mesquite Mine personnel (Smith et al., 1999).
The Mesquite Mine district lies on the southwest flank of the Chocolate Mountains, in amphibolite grade metamorphic rocks of the upper plate of the Vincent‐Chocolate Mountain Thrust. These upper plate rocks represent a fragment of Precambrian and Mesozoic continental crust that has an extremely complex history. During the Precambrian period, a gneissic complex was formed, followed by several episodes of plutonic intrusion into the gneisses. Granitic rocks were again intruded during the early Triassic and late Jurassic – early Cretaceous periods. The upper plate rocks were also subjected to several phases of amphibolite facies regional metamorphism, ranging from Precambrian to Mesozoic. Figure 7‐1 illustrates the relationship between the Mesquite Mine deposit and the major faulting in the area. The map also includes the locations of some other prospects/deposits that seem to be associated with the same regional faulting.
Lithologies exposed in the southern Chocolate Mountains include Proterozoic granitic and metamorphic rocks, Mesozoic metamorphic and plutonic units, early to mid‐Tertiary volcanic and plutonic rocks, and Tertiary to recent sedimentary units as shown in Figure 7‐1 (Manske, 1991). The Proterozoic is represented by the Chuckwalla Complex, while the Mesozoic terrain is a structurally complicated package of gneisses, schist, phyllite, and plutons (Manske, 1991). Mesozoic rock units include the Orocopia Schist, and Jurassic Winterhaven formation, which are overlain by Tertiary Quechan Volcanic rocks and Quaternary alluvial deposits. A stratigraphic section of the Mesquite Mine area is shown in Figure 7‐2.
The Chuckwalla Complex, locally referred to as the Mesquite Gneiss package, consists of amphibolite to greenschist grade gneisses and schists and plutonic rocks (Manske, 1991). These upper plates Proterozoic to Mesozoic metamorphic rocks are intruded by a series of Mesozoic quartz diorite to peraluminous granite plutons (Haxel and Dillon, 1978). U/Pb isotope dating of these intrusives indicate Cretaceous ages (80 Ma to 105 Ma) (Manske, 1991).
The Chuckwalla Complex was thrust over the Orocopia Schist along the Vincent‐Chocolate Mountain Thrust (80 Ma to 74 Ma). The Orocopia is a medium to coarse‐grained albite‐epidote‐amphibolite grade schist, which is exposed along the core of the Chocolate Mountains (Manske, 1991). The protolith of this formation was a middle Jurassic graphitic greywacke. This unit does not outcrop in the Mesquite Mine, but it presumably underlies the district as the regional basement (Haxel and Dillon, 1978).
The Chuckwalla and Orocopia sequence have been offset by the high‐angle, normal Singer Fault (8 Ma to 10 Ma). This N60o‐70oW (75o‐85o NE dipping) fault places the younger Winterhaven Formation in contact with the older, higher metamorphic grade Chuckwalla and Orocopia. The Winterhaven Formation comprises phyllites, quartzites, conglomerates, and metavolcanics, and

MESQUITE GOLD MINE, CALIFORNIA, U.S.A. TECHNICAL REPORT ON THE MESQUITE GOLD MINE, CALIFORNIA, U.S.A.
P a g e | 7‐2
27/04/2020
appears to represent Jurassic volcanic and sedimentary protoliths, metamorphosed at a lower greenschist grade (Manske, 1991).
The metamorphic and plutonic terrains were uplifted and eroded during the early Tertiary. Oligocene calc‐alkaline magmatism, consisting of andesite and rhyodacite flows (32 Ma) and ignimbrites and tuffs (26 Ma) covered the eroded surface as part of the Quechan Volcanics. The Mt. Barrow quartz monzonite sequence was then intruded (Crowe, 1978, Manske, 1991). These dates are coincident with gold mineralization events, dated at approximately 26 Ma to 38 Ma. Following emplacement of the Mt. Barrow stock, the district was subjected to Tertiary extension. This tectonism generated large‐scale northwest‐trending faults, and reactivated some Mesozoic thrusts (Haxel and Grubensky, 1984). Near the end of Tertiary extension, the area was regionally deformed resulting in fold axes trending west‐northwest. The Chocolate Mountains form the axis of a west‐northwest trending antiform within the regional fold set, with Mesquite Mine lying on a z‐fold along the southwest limb (Manske, 1991).
Erosion of these folded terrains produced poorly sorted conglomerates, fanglomerates, sands, and silts. These Miocene deposits provide a mantle (10 to 500 ft thick) over most of the Mesquite Mine district (Manske, 1991). A late Miocene basalt flow and recent alluvial gravel deposits cap these units. The right‐lateral strike slip motions on the San Andreas system (8 to 10 Ma) have transected all of the above noted lithologies, with the exception of recent gravel deposits. A local splay of this system, the Singer Fault, is located between the Chocolate Mountains and the Mesquite Mine.

MESQUITE GOLD MINE, CALIFORNIA, U.S.A. TECHNICAL REPORT ON THE MESQUITE GOLD MINE, CALIFORNIA, U.S.A.
P a g e | 7‐3
27/04/2020
Figure 7‐1: Regional Geology Map

MESQUITE GOLD MINE, CALIFORNIA, U.S.A. TECHNICAL REPORT ON THE MESQUITE GOLD MINE, CALIFORNIA, U.S.A.
P a g e | 7‐4
27/04/2020
Figure 7‐2: Stratigraphic Section

MESQUITE GOLD MINE, CALIFORNIA, U.S.A. TECHNICAL REPORT ON THE MESQUITE GOLD MINE, CALIFORNIA, U.S.A.
P a g e | 7‐5
27/04/2020
7.2 Property Geology
The description of property geology is taken for the most part from a report by Della Libera et al. (2011).
The Mesquite Mine comprises two sub‐parallel, Oligocene‐age mineralized zones: Big Chief – Vista (Big Chief, Cholla, and Lena, Rubble Ridge, Panhandle, and Vista), and Rainbow (Cherokee, Rainbow, and East Rainbow). Gold mineralization is hosted in Mesozoic gneisses that are intruded by biotite/muscovite rich granites. The district is covered by a thin veneer (0 to 300 ft) of Tertiary and Quaternary sediments, shed from the south slope of the Chocolate Mountains. Gold mineralization is bound by post‐mineral faulting related to the Neogene San Andreas fault system.
7.3 Stratigraphy
The stratigraphic succession at Mesquite Mine should be subdivided in three Gneiss Units, which form a geologic continuum grading from a felsic upper unit represented as Biotite Gneiss (BG) to a mafic lower unit represented as Mafic Gneiss (MG). A compositionally intermediate unit defined as Jurassic Hornblende Biotite Gneiss (HBG) is a transitional unit located between the upper felsic and lower mafic schist.
Miocene and Pliocene sandstone, conglomerate, siltstone, and sparse basalt interbeds unconformably overlie the mineralized gneissic rock.
7.4 Structure
Oligocene northwest‐striking dextral strike‐slip faults and north‐striking extensional faults are the dominant control of gold mineralization at Mesquite Mine. The fault sets mutually cut each other and thus, likely formed contemporaneously. Post‐mineral deformation reactivated the northwest‐ and north‐striking fault systems and developed a northeast‐striking left‐lateral oblique slip fault set, which cuts and offsets the earlier north‐ and northwest‐striking fault sets and disrupts the gold‐bearing ore bodies.
7.5 Alteration
The alteration observed in pit exposures and drill core is largely confined to narrow fracture selvages as sericite and/or chlorite, quartz ± adularia veins and breccias, and ankerite‐dolomite veins and breccias. The alteration intensity is directly related to hydro‐fracture density and is better developed in the BG than the HBG or the MG.
Figure 7‐3 and Figure 7‐4 illustrate the property and local area geology of the Mesquite Mine, respectively.

MESQUITE GOLD MINE, CALIFORNIA, U.S.A. TECHNICAL REPORT ON THE MESQUITE GOLD MINE, CALIFORNIA, U.S.A.
P a g e | 7‐6
27/04/2020
Figure 7‐3: Property Geology

MESQUITE GOLD MINE, CALIFORNIA, U.S.A. TECHNICAL REPORT ON THE MESQUITE GOLD MINE, CALIFORNIA, U.S.A.
P a g e | 7‐7
27/04/2020
Figure 7‐4: Typical Cross Section

MESQUITE GOLD MINE, CALIFORNIA, U.S.A. TECHNICAL REPORT ON THE MESQUITE GOLD MINE, CALIFORNIA, U.S.A.
P a g e | 7‐8
27/04/2020
7.6 Mineralization
Della Libera et al. (2011) reports the mineralization and alteration distribution is directly related to host rheology and is characterized by veins and breccias. The principal types of mineralization defined at Mesquite Mine are as follows:
early epidote ‐ quartz veinlets overprinted by chlorite veinlets
two‐stage siliceous matrix breccia (SMBX) developed along faults planes with quartz‐adularia matrix ± pyrite
quartz ± adularia ± pyrite ± electrum veinlets with sericite halos
ankerite ± dolomite ± pyrite veinlets
bleached zones on fault planes with green sericite ± pyrite
A more extensive description of the mineralogy is given in a document written by Newmont personnel describing the Mesquite Mine operation (Smith et al., 1999) and reported in the Technical Report prepared by Independent Mining Consultants, Inc. (IMC) entitled “Mesquite Gold Project Imperial County, California, USA, Technical Report”, dated May 26, 2006.
Gold occurs at Mesquite Mine as both submicron disseminated and coarse gold. All documented gold occurrences are native gold, and classification has been based on silver content and grain size. A silver‐free native gold is the most common type in the oxidized zone. A second type of gold is the silver‐bearing (5% to 20%) coarse (10 µ to 600 µ) gold. Its average size is 30 µm to 50 µm and it is typically found in the unoxidized zone, and only occasionally in the oxidized zone. Visible gold has been identified throughout Mesquite Mine. Small flakes, less than 50 µm, of free “flour” gold have been found within the oxidized gouge and clay fault zones. The flour gold is thought to be a result of remobilization during oxidation and is supergene in nature.
Coarse‐grained hypogene gold has also been noted with more frequency and larger size in the unoxidized portion of the deposits. Recent test work on non‐oxidized ore indicates 65% to 78% of the gold is liberated free milling gold, 13% is associated with refractory sulphide minerals, and the remainder is associated with iron oxides and carbonates.

MESQUITE GOLD MINE, CALIFORNIA, U.S.A. TECHNICAL REPORT ON THE MESQUITE GOLD MINE, CALIFORNIA, U.S.A.
P a g e | 8‐1
27/04/2020
8 DEPOSIT TYPES
The following description of the deposit types was summarized from the technical report prepared by IMC entitled “Mesquite Gold Project Imperial County, California, USA, Technical Report”, dated May 26, 2006.
The gold mineralization at Mesquite Mine was deposited in an epithermal setting, within 500 ‐ 1,000 ft of the surface. The majority of the economically attractive mineralization is found in the biotite gneiss and hornblende‐biotite gneiss, while the mafic gneiss and intrusive rocks are generally less mineralized. Gold mineralization is found both disseminated and vein hosted within these units. The majority of the veining is controlled by faults and fault junctions, which have moderate to steep dips.
The gold mineralization dominantly occurs in two types:
pods of mineralization limited in lateral and vertical extent at fault intersections
trends of mineralization along faults

MESQUITE GOLD MINE, CALIFORNIA, U.S.A. TECHNICAL REPORT ON THE MESQUITE GOLD MINE, CALIFORNIA, U.S.A.
P a g e | 9‐1
27/04/2020
9 EXPLORATION
The main approach, used by previous operators, for exploration of the Mesquite Mine deposit and surrounding area, is to test for the presence of gold mineralization using exploration drilling as described in Section 10.
Equinox intends to continue testing for extensions of the existing resource where there is evidence the deposit remains “open” to expansion. The proposed exploration drilling to test for expansions of the deposit is included in Section 24 and Section 26.
Equinox geologists feel the distribution of gold mineralization in the Mesquite Mine deposit is controlled, to some degree, by structural features. As a result, the company will undertake a mapping campaign, including the generation of a detailed structural model, which will further support future exploration activities.
In the fall of 2018, Equinox began testing some of the historical waste dumps on the Mesquite Mine property as a source for potential leach material. The material in these dumps was mined as waste that was below cut‐off grade at a time of lower gold prices and the material now may provide a resource that can be considered economic to leach. This initial testing involved drilling a series of holes using a blast‐hole drill rig. Although this is not considered optimal equipment for collecting representative samples from broken rock piles, and drilling was limited to a depth of 30 ft., the initial results were encouraging. Some examples of sample grades collected during this test program are listed in Table 9‐1 below.
In 2019, Equinox drilled 142 RC holes in the Brownie and VE2 deposits. The total footage drilled amounted to 66,085 ft. These holes increased the confidence in the resource estimates in these deposit areas. Equinox also drilled a total of 831 RC holes for a total of 126,345 ft. in waste dumps and abandoned leach pads. Results from these holes added to the estimates of Indicated and Inferred resources (see Section 14) of non in‐situ material.

MESQUITE GOLD MINE, CALIFORNIA, U.S.A. TECHNICAL REPORT ON THE MESQUITE GOLD MINE, CALIFORNIA, U.S.A.
P a g e | 9‐2
27/04/2020
Table 9‐1: Examples of Initial Samples Collected from Waste Dumps in 2018
Pit/Dump Area Bench AuFA (oz/t) AuCN (oz/t)
NW Brownie 820 0.0246 0.0113
NW Brownie 820 0.0075 0.0055
NW Brownie 820 0.0088 0.0088
NW Brownie 820 0.0128 0.0146
NW Brownie 880 0.0121 0.0124
NW Brownie 880 0.0058 0.0051
NW Brownie 880 0.0058 0.0047
NW Brownie 880 0.0120 0.0095
VW2 230 Dump 820 0.0095 0.0088
VW2 230 Dump 820 0.0133 0.0062
VW2 230 Dump 820 0.0594 0.0215
VW2 230 Dump 820 0.0106 0.0077
VW2 250 Dump 940 0.0055 0.0051
VW2 250 Dump 940 0.0137 0.0113
VW2 250 Dump 940 0.0154 0.0124
VW2 250 Dump 940 0.0121 0.0051
NOTE:
samples collected using blasthole drill over approximately 30‐foot intervals
AuFA = gold grade by fire assay method
AuCN = gold grade by cyanide soluble method

MESQUITE GOLD MINE, CALIFORNIA, U.S.A. TECHNICAL REPORT ON THE MESQUITE GOLD MINE, CALIFORNIA, U.S.A.
P a g e | 10‐1
27/04/2020
10 DRILLING
Drilling on the Project has totalled approximately 3.3 million ft. in 9,728 holes of which WMMI drilled approximately 514,955 ft. in 1,700 holes. Of the total holes drilled to date, 118 holes in the database were exploratory in nature, and tested for satellite deposits.
The holes were mostly drilled vertically. In general, the disseminated mineralization is flat‐lying or with a moderate 16° southwest dip and therefore the vertical drilling provides an appropriate measure of the true mineralization thickness.
10.1 Drilling by Previous Operators
The pre‐WMMI drilling comprises 2.7 million ft. of drilling in 6,221 drill holes, most of which are Reverse Circulation (RC) holes. A total of 103 holes in the database were diamond drill holes. During the early development of the property, 128 of the RC drill holes were deepened by diamond drilling below the water table. A total of 13 PQ core holes drilled for metallurgical testing, were not found in the current drill hole database. Most of the drill holes were vertical holes and have not been downhole surveyed.
The drill hole locations are illustrated in Figure 10‐1.

MESQUITE GOLD MINE, CALIFORNIA, U.S.A. TECHNICAL REPORT ON THE MESQUITE GOLD MINE, CALIFORNIA, U.S.A.
P a g e | 10‐2
27/04/2020
Figure 10‐1: Drill Hole Location Plan

MESQUITE GOLD MINE, CALIFORNIA, U.S.A. TECHNICAL REPORT ON THE MESQUITE GOLD MINE, CALIFORNIA, U.S.A.
P a g e | 10‐3
27/04/2020
10.2 Reverse Circulation Drilling and Logging by Gold Fields
Gold Fields completed most of the RC drilling on the property; more than 5,000 holes for 2.4 million feet. The methods used by Santa Fe and Newmont have not been documented but are assumed to be standard RC drilling practices.
The initial sampling by Gold Fields on the RC drilling was completed using two field samplers to collect and quarter each 2.5 ft. drill interval from a Jones riffle splitter beneath the drill cyclone. Approximately 85% of the samples were dry. Wet sampling was completed by a rotary wet sampler located beneath the drill cyclone and during wet sampling, flocculent was added to aid the settling of fines.
Portions of sample material collected from bags collected for each 2.5 ft. interval were poured into sieves and washed. The washed samples were then placed into trays to half fill the cells in the trays. The sample chips in the trays were then logged by a company geologist. No sample trays are available because the trays were discarded before WGI acquired the property.
10.3 Core Drilling and Logging by Gold Fields
Core drilling was generally completed using HQ core, which was transported to Yuma, Arizona, where it was cleaned and photographed. The core was logged, marked, and rock quality designation (RQD) measurements were taken from each five‐foot interval. Core recovery information is not available in the database. The core from the various drill campaigns were discarded before WGI acquired the property.
10.4 Twin Hole Comparison by Gold Fields
Gold Fields drilled two pairs of twin RC holes ‐ diamond drill holes during the preproduction exploration. They concluded the assays showed the same overall distribution of gold grades although with high local variation. The correlation coefficient for the paired composites is 55%; the mean value of the core composites (20 ft.) was 0.028 oz/t Au; and the mean of the RC composites (also 20 ft.) was 0.027 oz/t Au. The coefficient of variation was 1.3 for the core composites and 0.9 for the RC composites (Bechtel, 1984).
Mine Development Associates (MDA) found and reported in its December 2004 Technical Report, that a number of the vertical diamond drill holes had been drilled within 25 ft. of vertical RC drill holes. MDA compared 32 core holes with nearby RC drill holes representing approximately 10,000 ft. of compared data. This comparison showed significant differences between some of the holes (Table 10‐1), indicating the RC assays tend to return higher assays than comparable core assays.
In its 2006 technical report, IMC concluded although it was possible there was a bias in the RC samples, resource modelling methods employed at the property, particularly capping of high‐grade assays to get models to conform to production results, must have compensated for this bias. This is supported by the performance of the resource models to the actual mined tonnage.

MESQUITE GOLD MINE, CALIFORNIA, U.S.A. TECHNICAL REPORT ON THE MESQUITE GOLD MINE, CALIFORNIA, U.S.A.
P a g e | 10‐4
27/04/2020
Table 10‐1: Twin Hole Comparison
Core Holes RC Hole Interval Footage Core RC
Hole # East North Hole # East North From (ft)
To (ft)
(oz/t Au) (oz/t Au)
LDH‐01 12948 9925 MR‐1995 12943 9914 275 540 265 0.029 0.032
LDH‐02 12804 10065 MR‐0809 12791 10062 135 500 365 0.015 0.020
LDH‐03 12752 10020 MR‐1824 12742 10012 205 460 255 0.019 0.019
LDH‐04 12687 9970 MR‐1830 12694 9961 165 440 275 0.014 0.021
LDH‐05 12889 9964 MR‐0811 12877 9963 250 520 270 0.017 0.036
LDH‐08 12044 10582 MR‐1700 12049 10586 75 380 305 0.014 0.018
LDH‐09 12188 10616 MR‐0780 12198 10621 75 420 345 0.013 0.059
LDH‐10 12200 10507 SM‐0484 12193 10503 135 380 245 0.018 0.015
LDH‐11 12895 10069 MR‐0678 12883 10063 135 540 405 0.014 0.050
LDH‐12 12375 10283 MR‐0671 12389 10294 105 360 255 0.012 0.021
LDH‐13 12563 10140 MR‐0178 12581 10152 225 360 135 0.034 0.049
LDH‐14 11664 10574 MR‐1731 11659 10576 100 330 230 0.024 0.024
LDH‐15 11513 10529 MR‐0798 11508 10523 115 480 365 0.023 0.025
LDH‐18 12325 10442 MR‐1717 12342 10457 55 400 345 0.013 0.012
LDH‐20 11648 10578 MR‐1731 11659 10576 100 420 320 0.030 0.028
LDH‐21 11232 10963 SM‐1488 11243 10963 260 500 240 0.011 0.158
VDH‐01 17173 6997 MR‐0479 17181 7004 0 200 200 0.035 0.012
VDH‐02 17039 7039 MR‐1219 17052 7029 0 400 400 0.012 0.020
VDH‐04 17362 7149 MR‐1388 17351 7158 65 300 235 0.032 0.028
VDH‐05 17442 7056 MR‐1230 17450 7037 160 360 200 0.040 0.063
VDH‐07 17257 7234 MR‐1220 17277 7248 0 300 300 0.016 0.012
VDH‐09 17071 7271 MR‐1367 17059 7259 0 360 360 0.024 0.014
VDH‐10 17191 7170 MR‐2982 17198 7165 0 470 470 0.015 0.030
VDH‐11 18033 7051 MR‐1339 18044 7052 85 500 415 0.024 0.033
VDH‐12 16307 7105 MR‐0969 16302 7106 15 300 285 0.006 0.046
VDH‐13 16743 7137 MR‐1216 16757 7152 15 500 485 0.011 0.016
VDH‐14 18012 7196 MR‐0089 18005 7184 45 380 335 0.025 0.024
VDH‐16 16391 7180 MR‐0349 16399 7200 20 300 280 0.033 0.014
VDH‐17 18140 6949 MR‐1253 18144 6963 120 555 435 0.038 0.104
VDH‐18 18177 6997 MR‐0613 18187 7000 100 550 450 0.148 0.039
VDH‐19 18135 7134 MR‐1310 18137 7151 95 360 265 0.019 0.026
VDH‐21 17176 6994 MR‐0479 17181 7004 0 260 260 0.011 0.011
Totals 9,995 0.026 0.033
MESQUITE GOLD MINE, CALIFORNIA, U.S.A. TECHNICAL REPORT ON THE MESQUITE GOLD MINE, CALIFORNIA, U.S.A.
P a g e | 10‐5
27/04/2020
The following description of the sample method and approach was summarized from the Technical Report prepared by IMC entitled “Mesquite Gold Project Imperial County, California, USA, Technical Report”, dated May 26, 2006.
10.5 Reverse Circulation Sampling by Gold Fields
Gold Fields initial sampling on the RC drilling was completed using two field samplers to collect and quarter each 2.5 ft. drill interval from a Jones riffle splitter located beneath the drill cyclone. The succeeding 2.5 ft. interval split was combined to produce a quarter split of the five‐foot interval. This sample generally weighed 25 to 30 lbs. This sample was placed in bags and trucked to Yuma, Arizona to the Gold Fields in‐house sample preparation facility. The samples were dried in Yuma prior to processing.
Details of Santa Fe and Newmont sampling methods have not been documented.
10.6 Diamond Drill Core Sampling by Gold Fields
The whole core was transported to Gold Fields in‐house sample preparation facility in Yuma, Arizona. The whole core was reduced with the primary size reduction done with a jaw crusher followed by secondary crushing with a roll’s crusher. After crushing, the sample preparation was similar to the RC drilling sample preparation methodology.
10.7 Blasthole Drilling
In addition to the RC and core drilling data, over 650,000 blasthole samples were taken during mine operations from 1985 to 2001. Blastholes were drilled on 19 to 24 ft. spacing on each bench to define the ore and waste boundaries while mining. The blasthole samples were collected by the blasthole driller using a through‐the‐deck “rocket” sampler and assayed at the mine laboratory using methylisobutylketone (MIBK) gold dissolution and atomic absorption assaying.
The assay information for most of this blasthole sample data is available in a database. Historically, the blasthole database has been used to reconcile the various resource models developed for the property. This means on a continuous basis, a key step in the development of resource models was the comparison of how the modelling techniques performed compared to the historic blasthole data. IMC also used this data for their reconciliation study. That analysis provided guidance that was used by Lions Gate Geological Consulting (LGGC) in their preparation of the 2019 resource estimate.
10.8 Comments Regarding Sampling Method and Approach by Gold Fields
The sampling methods and approaches used for the sampling of the Mesquite Mine deposit are consistent with the deposit and mineralization type. Although the data is historic in nature, the descriptions provided indicate the sampling was done correctly. IMC (2006) reported they were

MESQUITE GOLD MINE, CALIFORNIA, U.S.A. TECHNICAL REPORT ON THE MESQUITE GOLD MINE, CALIFORNIA, U.S.A.
P a g e | 10‐6
27/04/2020
not aware of any deficiencies in sampling methods or sample recovery that would impact on the reliability of the results.
In AGP’s opinion, the sampling method and approach are appropriate for mineral resource estimation. Although the data is historic and details of the Santa Fe and Newmont sampling methods have not been documented, the mineral resource estimates versus actual production reconciliation has been reasonable and therefore minimizes these potential issues.
10.9 Drilling by WMMI
WMMI drilled 1,700 holes for a total of 514,955 ft. Diamond drilling accounted for 35,404 ft. in 36 holes.
10.10 Reverse Circulation Sampling by WMMI
Drilling is always done wet. Samples are taken every five feet. The samples weight ranges from 5 to 50 lbs., however, sampling plates in the cyclone are modified as needed to produce a typical sample weight of 30 to 40 lb.
The sample splitter on the drill rig is washed out at least every drill rod (i.e.: every 10 or 20 ft. depending on the type of drill). A five gallon bucket with a “rice” bag collects the sample under the cyclone discharge chute. Flocculent is sometimes used to help settle out the fines.
Duplicate samples are taken on a random basis at the rate of one per 140 ft. of drilling, at approximately a 30:1 ratio (i.e.: five to six duplicates are taken for an 800 ft. hole).
Sample bags and tags are pre‐numbered in the office by the WMMI drilling crew and stacked on the ground in order of drill hole. Samples typically sit for at least five days in the field to dry before being collected by the WMMI drilling crew and prepared for shipping to an off‐site laboratory for assays.
10.11 Diamond Drill Logging and Sampling by WMMI
Drill core was transported daily in sealed cardboard core boxes from the drill site to the core logging facility on site. The front of each core box was marked with consecutive box numbers, drill hole number, and drilled interval at the rig, and a wood block was inserted for each run drilled.
At the core logging facility, the project geologists marked intervals to be sampled and logged the core before each box was photographed and then split. The core recovery and rock quality data were collected between driller’s block intervals and core recovery was also recorded for each sample interval. The core was continuously sampled at five foot intervals. The core was logged noting lithology, alteration, mineralization, and structures. Core descriptions and geotechnical measurements were entered directly onto a laptop using Core View digital logging software.
Sampling was completed using a core saw for all competent rock intervals and using a core splitter for friable material such as fault gouge. For each sample interval, one‐half split of the core was

MESQUITE GOLD MINE, CALIFORNIA, U.S.A. TECHNICAL REPORT ON THE MESQUITE GOLD MINE, CALIFORNIA, U.S.A.
P a g e | 10‐7
27/04/2020
placed in consecutively numbered plastic bags with correspondingly numbered sample tickets. The other half was placed back into the original core box and a corresponding numbered ticket was stapled inside the box for each interval sampled. The boxes of split core were placed in secured storage inside the core storage facility.

MESQUITE GOLD MINE, CALIFORNIA, U.S.A. TECHNICAL REPORT ON THE MESQUITE GOLD MINE, CALIFORNIA, U.S.A.
P a g e | 11‐1
27/04/2020
11 SAMPLE PREPARATION, ANALYSES, AND SECURITY
11.1 Pre‐WMMI
The following description of the sample preparation methods, analysis, and security was summarized from the technical report prepared by IMC entitled “Mesquite Gold Project Imperial County, California, USA, Technical Report”, dated May 26, 2006.
11.1.1 Sample Security
The samples were collected, split, and placed in sealed bags at the drill site and transported to the Mesquite Mine exploration sample preparation facilities located in Yuma, Arizona, by company employees. The sample pulps were prepared in Yuma and shipped to assay laboratories. Most of the samples were shipped to Gold Fields assay laboratory facilities in Lakewood, Colorado. Although the procedure used by Santa Fe or Newmont has not been formally documented, the only probable change to sampling protocol would be that the Yuma office was closed during this time resulting in sample preparation work being done at the mine site.
11.1.2 Drill Sample Preparation and Analysis
RC drill samples, core samples, and bulk samples (from the decline), were treated at the Gold Fields sample preparation facility in Yuma, Arizona. The previously prepared 40 lb bulk sample and the drill samples were crushed to minus 10 mesh and then split in a Jones splitter to approximately one pound. This sample was pulverized to minus 150 mesh and split into four pulps. One of these pulps was fire‐assayed at Gold Fields laboratory in Lakewood, Colorado. Check assays were run on 20% of the samples by submitting a second pulp to either Skyline Laboratory or Barringer Laboratory. The check assays made on the duplicate pulps were noted to agree with the original assay with no bias and 95% correlation coefficient. It is unknown if the aforementioned laboratories were certified.
During sample preparation, periodic checks were made for coarse gold by running the reject material through a Denver gold saver and carrying out both visual and quantitative assessments of the results (Bechtel, 1984).
Due to the historic nature of the Mesquite Mine assay data, the certification applicable to the Barringer and Skyline laboratories during the course of their work is not known. Both were commercial laboratories that were heavily relied on by the mining industry during that time. It is also reported that a significant number of the assays were done by the Gold Fields facility in Lakewood, Colorado. Note that much of the Gold Fields laboratory analyses would have been in the areas of Big Chief which have been mostly mined out and would not be a major factor for future production.

MESQUITE GOLD MINE, CALIFORNIA, U.S.A. TECHNICAL REPORT ON THE MESQUITE GOLD MINE, CALIFORNIA, U.S.A.
P a g e | 11‐2
27/04/2020
11.1.3 Quality Assurance/Quality Control, Check Samples, and Check Assays
According to Bechtel (1984), Gold Fields prepared all drill samples (both core and RC) and the bulk samples from the decline at its sample preparation laboratory in Yuma, Arizona. After the samples were fire assayed at the Gold Fields laboratory in Lakewood, Colorado, check assays were done on approximately 20% of the samples. A second duplicated pulp was assayed by either Barringer Laboratory or Skyline Laboratory.
Gold Fields comparison of 1,383 check assays, with the corresponding original assays, shows a good correlation of the two sets of data. The means were within approximately 5% and the correlation coefficient was 95%.
The Quality Assurance/Quality Control (QA/QC) procedures by Santa Fe or Newmont have not been formally documented, but QA/QC, check samples, and check assays were done as evidenced by information in the hard copy files existing for each individual hole. In addition, a program of soluble cyanide assaying was performed along with the fire assaying.
Figure 11‐1 illustrates the sample preparation and assay procedure. In AGP’s opinion, the sample preparation, security, and analytical procedures were adequate for Mineral Resource estimation.

MESQUITE GOLD MINE, CALIFORNIA, U.S.A. TECHNICAL REPORT ON THE MESQUITE GOLD MINE, CALIFORNIA, U.S.A.
P a g e | 11‐3
27/04/2020
Figure 11‐1: Assay Lab Sample Preparation and Assaying Procedure

MESQUITE GOLD MINE, CALIFORNIA, U.S.A. TECHNICAL REPORT ON THE MESQUITE GOLD MINE, CALIFORNIA, U.S.A.
P a g e | 11‐4
27/04/2020
11.2 WMMI
11.2.1 Sample Security
Drill core and RC samples were palletized with a security tag and transported by truck from the Mesquite Mine to the American Assay Labs (AAL) facility in Sparks, Nevada. The shipments were done using a transport service company recommended by AAL and scheduled at least once per week.
11.2.2 Sample Preparation and Analysis
At AAL in Sparks, all samples were inventoried and entered into an electronic tracking system prior to sample preparation. All samples were prepared as shown on the flow chart in Figure 11‐2.
All samples were analyzed for gold using a 50 g fire assay with an atomic absorption (AA) finish (AUFA50‐AAS/ICP) and cyanide soluble gold assay (AUCNSO). A one‐kilogram pulp was returned from each sample and stored in the core storage facility at the Mesquite Mine site. Assay results were transmitted electronically to New Gold, Inc. VP Exploration, and the Mesquite Mine Sulfide Project Manager. Hard copy certificates were mailed to the Mesquite Mine office in California.

MESQUITE GOLD MINE, CALIFORNIA, U.S.A. TECHNICAL REPORT ON THE MESQUITE GOLD MINE, CALIFORNIA, U.S.A.
P a g e | 11‐5
27/04/2020
Figure 11‐2: Sample Preparation Flow Chart

MESQUITE GOLD MINE, CALIFORNIA, U.S.A. TECHNICAL REPORT ON THE MESQUITE GOLD MINE, CALIFORNIA, U.S.A.
P a g e | 11‐6
27/04/2020
11.2.3 Quality Assurance/Quality Control
The QA/QC program comprised submission of Certified Reference Material (CRM), blanks, and duplicate samples into the sample stream. The project geologist and database manager reviewed the results. QA/QC assays that fell outside the acceptable limits required a re‐assay of ten samples before and after the non‐compliant sample.
11.2.4 Certified Reference Material
During the 2010‐2011 drilling program and the first half of the 2013 drill program WMMI submitted 610 CRMs at the rate of approximately one in ten samples. The CRMs were supplied by Geostats Pty Ltd, New Zealand and represent the expected range of values at the mine. The specifications of the CRMs are summarized in Table 11‐1.
Table 11‐1: Certified Reference Material
Supplier Standard Samples Expected Grade Standard Deviation Reference No. Returned (g/t Au) (g/t Au)
Geostats Pty Ltd G300‐8 105 1.07 0.06
G312‐7 54 0.22 0.01
G901‐7 144 1.52 0.06
G901‐9 60 0.69 0.04
G907‐2 91 0.89 0.06
G909‐7 156 0.49 0.03
The conventional approach to setting reference standard acceptance limits is to use the expected assay ±2 standard deviations. Only 3% of the assays would be expected to fall outside the limits and values would be expected to be randomly distributed about the standard’s expected value. Five CRMs, less than 1% of the 610 submitted were outside the limits. The results for G312‐7 were on average 7% below the expected value, however, in absolute terms it was only 0.01 g/t Au.
Drill programs in 2015 and 2016 followed the same protocols as used in previous drill campaigns. Forty‐two (42) CRMs, 2% of the 1,953 submitted, were outside limits. All failures were addressed by remedial assaying. There were no quality issues regarding the standard reference materials from the 2015 and 2016 drilling that would preclude their use in resource estimation.
In AGP’s opinion, the results support the integrity of the database used for mineral resource estimation. The control charts for results of the six CRMs are illustrated in Figure 11‐3.

MESQUITE GOLD MINE, CALIFORNIA, U.S.A. TECHNICAL REPORT ON THE MESQUITE GOLD MINE, CALIFORNIA, U.S.A.
P a g e | 11‐7
27/04/2020
Figure 11‐3: Control Charts – Certified Reference Material
0.2
0.4
0.6
0.8
1
1.2
1.410427
11249
11596
11680
11775
11919
12042
12145
12271
12419
12522
12669
557519
557869
557952
558010
558061
558153
558491
558959
559377
559658
560017
560103
560564
560963
561131
561264
561461
561858
562176
562288
562548
562987
563178
Grade (g/t Au)
Sample Number
G300‐8
Expected ‐2SD +2SD Actual
0.19
0.20
0.21
0.22
0.23
0.24
0.25
198720
198862
199036
199167
199276
199370
199548
199709
199802
199957
200119
200742
200951
1270347
1270538
1270955
1271138
1271418
1271561
1271701
1271847
1271987
1272078
1272399
1272650
1272873
1273100
Grade (g/t Au)
Sample Number
G312‐7
Actual Expected ‐2SD +2SD

MESQUITE GOLD MINE, CALIFORNIA, U.S.A. TECHNICAL REPORT ON THE MESQUITE GOLD MINE, CALIFORNIA, U.S.A.
P a g e | 11‐8
27/04/2020
1.00
1.101.20
1.301.401.50
1.601.70
1.80
10019
10271
11228
11409
11898
12187
12503
12731
199630
200097
200905
557730
558353
558938
559275
561038
561442
562118
562569
562793
563102
563300
563396
1270265
1270811
1271662
1272277
1272575
1273025
Grade (g/t Au)
Sample Number
G901‐7
Actual Expected ‐2SD +2SD
0.55
0.60
0.65
0.70
0.75
0.80
10053
10294
10417
10610
10772
11001
11053
11148
11490
11554
558853
559503
559540
559581
559626
559683
559831
559978
560073
560222
560405
560514
560635
560874
561528
561565
561673
561916
561974
590711
Grade (g/t Au)
Sample Number
G901‐9
Actual Expected ‐2SD +2SD

MESQUITE GOLD MINE, CALIFORNIA, U.S.A. TECHNICAL REPORT ON THE MESQUITE GOLD MINE, CALIFORNIA, U.S.A.
P a g e | 11‐9
27/04/2020
11.2.5 Blank Samples
WMMI inserted 482 blank samples into the sample stream to check for contamination, drift, tampering or sample mix‐ups. Blank samples comprised waste from a barren rhyolite outcrop on the Mesquite Mine site as well as samples used by the on‐site laboratory.
0.70
0.75
0.80
0.85
0.90
0.95
1.00
1.05
10073
10361
10828
198901
199255
199648
199875
200058
201064
559508
559587
559938
560243
560599
560754
560893
561639
562010
562408
590782
590915
1270579
1270790
1270934
1271237
1271540
1271723
1271969
1272255
1272791
1272985
Grade (g/t Au)
Sample Number
G907‐2
Actual Expected ‐2SD +2SD
0.150.200.250.300.350.400.450.500.550.60
10470
10672
10870
11072
11430
11877
12689
199015
199216
199487
200079
201018
557676
557843
559871
560369
560919
561238
561404
561815
562036
562447
562668
562857
563019
1270224
1271030
1271457
1271865
1272237
1272629
1273079
Grade (g/t Au)
Sample Number
G909‐7
Actual Expected ‐2SD +2SD

MESQUITE GOLD MINE, CALIFORNIA, U.S.A. TECHNICAL REPORT ON THE MESQUITE GOLD MINE, CALIFORNIA, U.S.A.
P a g e | 11‐10
27/04/2020
WMMI inserted 1,200 blank samples in the 2015/2016 drill program sample stream. Blank samples comprised silica sand pulps from commercial suppliers as well as samples used by the on‐site laboratory.
In AGP’s opinion, the blank samples should have a maximum acceptance level of 0.01 g/t Au. The results demonstrate that:
97.9% of the control blanks returned values within the maximum acceptance level
1.2% of the control blanks returned values between 3 and 4 times the detection level
0.9% of the control blanks returned values greater than 4 times the detection limit
In AGP’s opinion, the results indicate minimal evidence of potential contamination, drift, tampering or sample mix‐ups.
11.2.6 Field Duplicates
WMMI submitted 298 split core duplicates and 376 split rotary sample duplicates during the 2010‐2011 and 2013 drilling programs. Duplicate samples are used to monitor data variability as a function of sample homogeneity. Figure 11‐4 and Figure 11‐5 illustrate the results of the field duplicate sample program. In AGP’s opinion the results of the field duplicates support the use of the database for Mineral Resource estimation.
Figure 11‐4: Field Duplicates ‐ Split Core
R² = 0.9466
0.00
0.50
1.00
1.50
2.00
2.50
3.00
3.50
4.00
4.50
0.00 0.50 1.00 1.50 2.00 2.50 3.00 3.50 4.00 4.50
Duplicate (g/t Au)
Original (g/t Au)
Field Duplicates ‐ Split Core
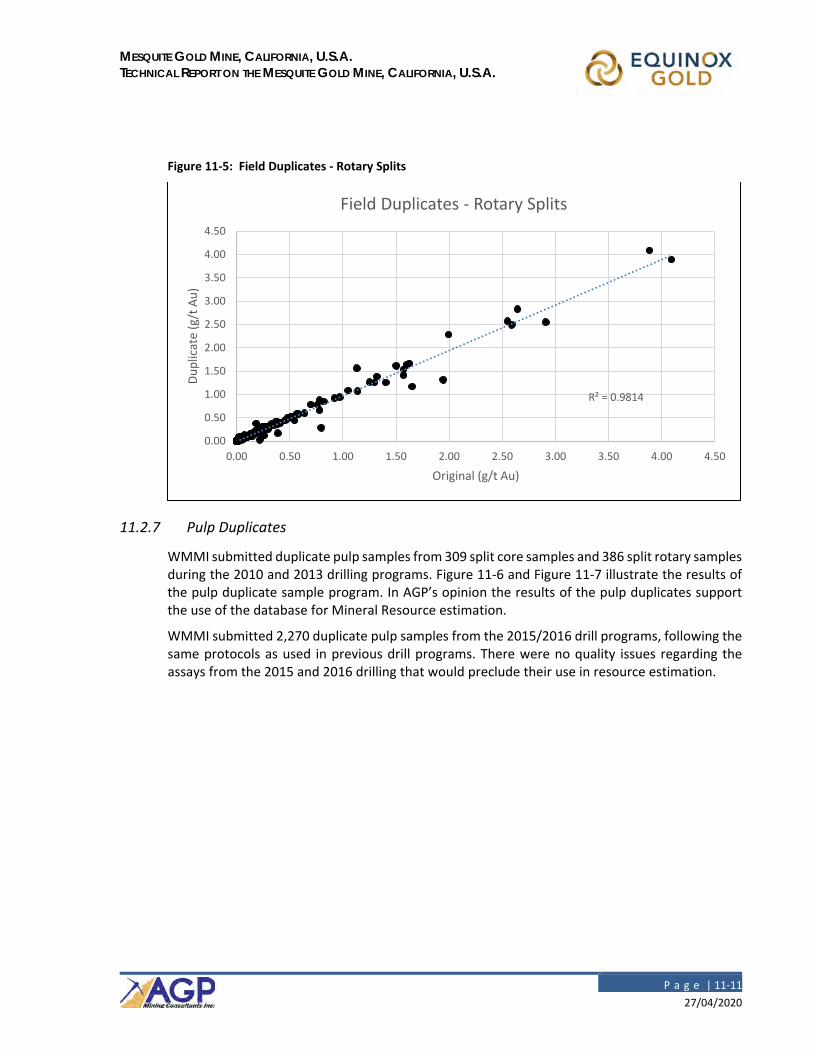
MESQUITE GOLD MINE, CALIFORNIA, U.S.A. TECHNICAL REPORT ON THE MESQUITE GOLD MINE, CALIFORNIA, U.S.A.
P a g e | 11‐11
27/04/2020
Figure 11‐5: Field Duplicates ‐ Rotary Splits
11.2.7 Pulp Duplicates
WMMI submitted duplicate pulp samples from 309 split core samples and 386 split rotary samples during the 2010 and 2013 drilling programs. Figure 11‐6 and Figure 11‐7 illustrate the results of the pulp duplicate sample program. In AGP’s opinion the results of the pulp duplicates support the use of the database for Mineral Resource estimation.
WMMI submitted 2,270 duplicate pulp samples from the 2015/2016 drill programs, following the same protocols as used in previous drill programs. There were no quality issues regarding the assays from the 2015 and 2016 drilling that would preclude their use in resource estimation.
R² = 0.9814
0.00
0.50
1.00
1.50
2.00
2.50
3.00
3.50
4.00
4.50
0.00 0.50 1.00 1.50 2.00 2.50 3.00 3.50 4.00 4.50
Duplicate (g/t Au)
Original (g/t Au)
Field Duplicates ‐ Rotary Splits

MESQUITE GOLD MINE, CALIFORNIA, U.S.A. TECHNICAL REPORT ON THE MESQUITE GOLD MINE, CALIFORNIA, U.S.A.
P a g e | 11‐12
27/04/2020
Figure 11‐6: Pulp Duplicates – Split Core
Figure 11‐7: Pulp Duplicates – Rotary Splits
R² = 0.95
0.00
0.50
1.00
1.50
2.00
2.50
3.00
3.50
4.00
4.50
0.00 0.50 1.00 1.50 2.00 2.50 3.00 3.50
Duplicate (g/t Au)
Original (g/t Au)
Pulp Duplicates ‐ Split Core
R² = 0.993
0.00
0.50
1.00
1.50
2.00
2.50
3.00
3.50
4.00
4.50
5.00
0.00 0.50 1.00 1.50 2.00 2.50 3.00 3.50 4.00 4.50 5.00
Duplicate (g/t Au)
Original (g/t Au)
Pulp Duplicates ‐ Rotary Splits

MESQUITE GOLD MINE, CALIFORNIA, U.S.A. TECHNICAL REPORT ON THE MESQUITE GOLD MINE, CALIFORNIA, U.S.A.
P a g e | 11‐13
27/04/2020
11.2.8 Results from 2019 Drilling
Four different standards distributed by Rock Labs were used during the drill program in the Brownie area. Blank material is validated blank limestone from Sloan Quarry outside of Las Vegas. A total of 151 standards and 176 blanks samples were inserted into the sample stream accounting for 10.5% of all samples. The total number of “failures” for the control samples was 1: a single standard failure and no blank failures.
Control samples for the dump drilling program consisted of 1,015 standards and 1,411 blanks. The total number of “failures” for the control samples was nine: six standard failures and two blank failures.
The remedial assay protocol for any standard failure is to re‐analyze the five preceding and five succeeding samples around the standard failure. The remedial protocol for any blank failure is to rerun the ten samples preceding the blank. Remedial procedures identified no significant deviations from original assay results. Assays from the 2019 drill samples were validated by the QC sample results.
11.3 Conclusions
Sample preparation, analysis, and security is of sufficient quality that the sample results can be used for mineral resource estimation.

MESQUITE GOLD MINE, CALIFORNIA, U.S.A. TECHNICAL REPORT ON THE MESQUITE GOLD MINE, CALIFORNIA, U.S.A.
P a g e | 12‐1
27/04/2020
12 DATA VERIFICATION
The following description of the data verification was summarized from the Technical Report prepared by IMC entitled “Mesquite Gold Project Imperial County, California, USA, Technical Report”, dated May 26, 2006.
12.1 Bulk Samples by Gold Fields
In 1982 and 1983, a decline and crosscuts were developed in the Big Chief deposit to provide material for a pilot heap leach and to obtain geologic information in the deposit. A total of 2,390 ft. of underground development was completed. Each blast round of approximately 40 tons was split into two portions, one for metallurgical testing and the other for assaying. A total of 58 rounds were bulk sampled. Table 12‐1 shows a comparison of model blocks estimated from the decline samples with the same model blocks estimated using only the drill data. It can be seen the means of the two data sets compare very well at 0.052 oz/t and 0.051 oz/t, respectively. The low correlation coefficient, however, indicates on a round‐by‐round basis there was considerable variability between the bulk and drill sample results. The results of the study demonstrate a mineral resource estimate should be reliable on a global basis, but less so on a smaller scale.
12.2 Other Early Gold Fields Data Checks
Bechtel (1984) reported that Gold Fields compared the results of RC and core drilling and concluded there was no bias in either type of drilling. During the initial reserve estimation, Gold Fields also made a comparison of block estimates based on drill holes with block estimates based on four or more bulk samples within each block. The mean grades of 50 blocks were within 2%. In addition, Gold Fields made a comparison of the grade estimates for 1,122 blocks based on 141 ft. spaced drilling with grade estimates of the same blocks based on drill spacing averaging less than 100 ft. The difference in the means of the block estimates was less than 1%, although individual blocks did not compare well (Bechtel, 1984). The results are summarized in Table 12‐1.
Table 12‐1: Comparison of Block Estimates from Decline vs. Drill Holes
Item Drill Decline
Mean – oz/t Au 0.052 0.051
Minimum Grade – oz/t Au 0.010 0.010
Maximum Grade – oz/t Au 0.099 0.175
Standard Deviation 0.018 0.034
Number of Blocks 50 50
Correlation Coefficient 12.70% 12.70%

MESQUITE GOLD MINE, CALIFORNIA, U.S.A. TECHNICAL REPORT ON THE MESQUITE GOLD MINE, CALIFORNIA, U.S.A.
P a g e | 12‐2
27/04/2020
12.3 IMC Data Comparison and Comments
IMC (2006) did a comparison of the drilling data with the blasthole data by pairing drill hole composites with the closest blasthole within 10 ft. The summary statistics compared well, indicating good agreement between these two key data sets.
IMC (2006) believed the sampling database at Mesquite Mine was adequate to develop the resource model, mineral resource estimate, and ultimately the mineral reserve estimate to the level of accuracy required for the feasibility study.
The analysis by MDA presented in Section 11 indicates the possibility that the RC data are slightly high biased compared to core. IMC proposed that, if this was true, it had been accounted for in the resource modelling, mostly due to, in the opinion of IMC, fairly aggressive grade capping. The comparison of blasthole data to RC data does not show this bias.
12.4 Checks
Original assay results from the individual drill programs are located in the hard copy files containing drill hole logs and assay sheets. In 2014, RPA compared the assays from the original assay certificates with the entries in two diamond drill logs and found no errors.
12.5 Comparisons to Production Records
Over an operating life of more than thirty years, the Mesquite Mine has produced gold approaching a total nearing 5 million ounces. During that time, the amount of geology, drilling, sampling, and assay information has continued to expand allowing mineral resource estimates to be compared against production records and be reconciled. Production is the ultimate verification for the validity of the data used for mineral resource estimation and reserve definition.
12.6 Conclusion
The QPs consider that the available data are adequate to use as the basis for mineral resource estimation and mineral reserve definition.

MESQUITE GOLD MINE, CALIFORNIA, U.S.A. TECHNICAL REPORT ON THE MESQUITE GOLD MINE, CALIFORNIA, U.S.A.
P a g e | 13‐1
27/04/2020
13 MINERAL PROCESSING AND METALLURGICAL TESTING
13.1 Metallurgical Testing
13.1.1 Historical Testing
Previous operators of the Mesquite Mine have completed several metallurgical test work programs focused on heap leaching. These programs have been completed both on‐site and also by industry recognized commercial laboratories. The results of this work have been reported extensively in other technical reports (IMC, MDA, RPA) and for the sake of brevity will not be addressed in this technical report.
13.1.2 Recent Column Testing: Site Run Column Tests‐ Heap Leach Feed
As part of the heap leach control and operating philosophy at the Mesquite Mine, column tests are conducted on material corresponding to different production periods. Recently these tests have been based on mined ore blocks. These column tests were conducted on composites of the heap leach feed and run on an as‐received basis with no size reduction or additional lime added.
These testing programs include at a minimum the following:
Direct Head Analyses, including:
o Column Test Fire Assay Head Assays o Column Test Cyanide Soluble Head Assays o Column Test Feed Sieve Analysis with Assays o Column Test Fire Assay Tail Assays o Column Test Cyanide Soluble Tail Assays o Column Test Tailing Sieve Analysis with Assays
The following figures illustrate the distributions of the pertinent heap leach feed column test KPI’s available at the time of writing. The dark shaded block sections correspond to column tests having gold recoveries lower than 65% based on the calculated head grades.
The heap leach column tests include gold head assay, calculated gold head grade, and gold recovery distributions with pertinent statistics are presented in the following figures. All assays are in troy ounces per short ton (oz/t) unless stated otherwise. Figure 13‐1 represents the direct head gold fire assays for the column tests. Figure 13‐2 shows the column test calculated gold head grades based on the individual column test mass balances or Gold Extracted + Gold in Residue. Figure 13‐3 is the gold recovery based on the calculated head grades for the column test data.
The mean and median fire assay gold head grades are 0.0095 oz/t and 0.0091 respectively as shown in Figure 13‐1. The fire assay head grades ranged between 0.0029 oz/t and 0.0353 oz/t with an upper quartile (75%) of 0.0113 oz/t. Low metallurgical performance column tests (dark zones) appear to be randomly distributed throughout the population. The 0.0353 oz/t assay is

MESQUITE GOLD MINE, CALIFORNIA, U.S.A. TECHNICAL REPORT ON THE MESQUITE GOLD MINE, CALIFORNIA, U.S.A.
P a g e | 13‐2
27/04/2020
considered an outlier but has not been culled from the data set which influences the statistics to the high side.
Figure 13‐1: Column Test Fire Assay Head Grade Distribution
Figure 13‐2: Column Test Calculated Head Grades – (Extracted + Tail Sieve Assay)

MESQUITE GOLD MINE, CALIFORNIA, U.S.A. TECHNICAL REPORT ON THE MESQUITE GOLD MINE, CALIFORNIA, U.S.A.
P a g e | 13‐3
27/04/2020
Heap leach feed calculated gold head grade distribution and statistics are given in Figure 13‐2. The mean and median calculated Au head grades were 0.0112 oz/t and 0.0111 oz/t, respectively. Interestingly, these are “measurably” higher than the direct head assays of the same population and call for a closer examination. The calculated head grades ranged between 0.0042 oz/t and 0.0261 oz/t with an upper quartile of 0.0132 oz/t.
Column test gold recoveries based on the calculated head grades are presented in Figure 13‐3. As previously noted, column tests with Au recovery below 65 percent are identified as highlighted zones in the bar chart distributions. Mean gold recoveries for the heap leach feed column tests was 68.1% gold with a median gold recovery of 71.1%. The gold recovery ranged between 40.2% and 96.6%, with an upper quartile of 79.7%. It should be noted that poor metallurgical response observed in the low recovery column tests appear to be a function of short leach cycles, i.e. 40 to 50 days and/or issues with leach solution chemistry, primarily pH.
Figure 13‐3: Column Test Calculated Au Recovery Based on Calculated Head Grades
13.2 Production Data 2007 to 2019
The relevant production data to be considered is from July 2007, when the mine reopened, to year‐end 2019. During this period approximately 215 million tons of ore containing 2,595,257 oz of gold have been placed on the heap leach pads with an average grade of 0.0121 oz/t Au. By December 2019, a total of 1,626,567 oz of gold had been produced, having an overall cumulative gold recovery of 62.7%. A summary is provided in Table 13‐1 following. Annual apparent recoveries (annual ounce recovered / annual ounces stacked), for the period 2007 through 2019 are shown in Figure 13‐4. The apparent recovery required roughly five years to reach steady state at approximately 61% recovery. This is a function of the initial lag phase in leaching fresh ore in
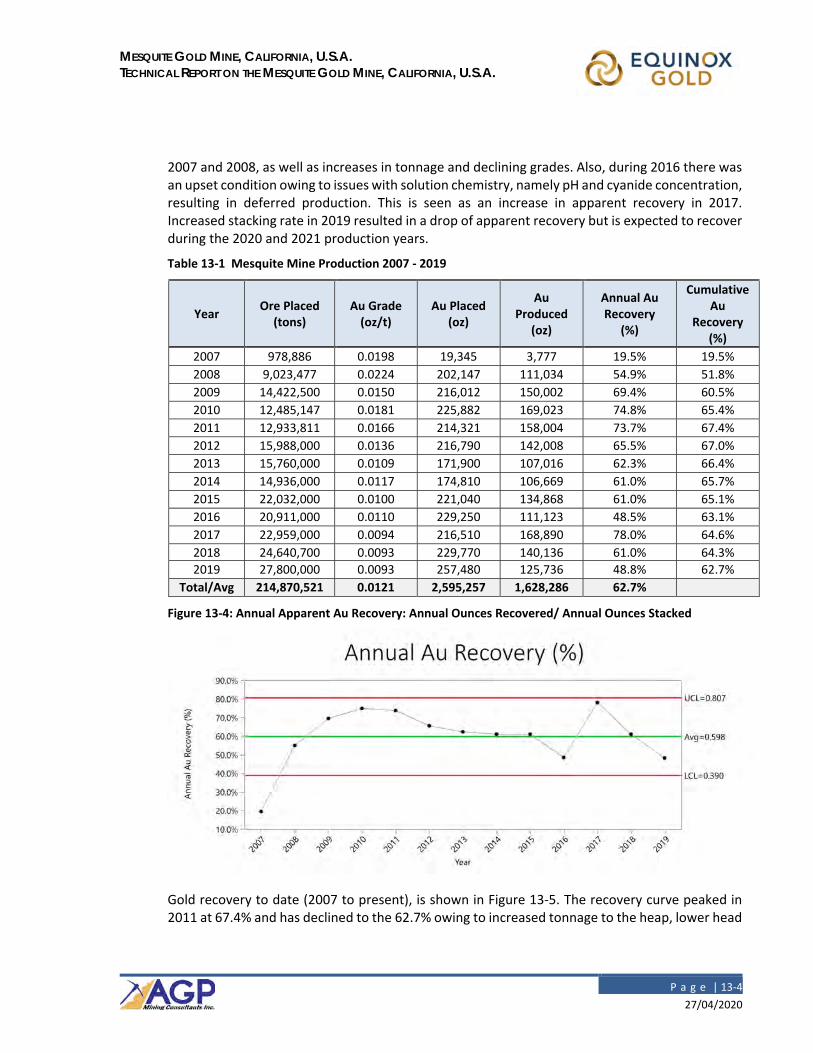
MESQUITE GOLD MINE, CALIFORNIA, U.S.A. TECHNICAL REPORT ON THE MESQUITE GOLD MINE, CALIFORNIA, U.S.A.
P a g e | 13‐4
27/04/2020
2007 and 2008, as well as increases in tonnage and declining grades. Also, during 2016 there was an upset condition owing to issues with solution chemistry, namely pH and cyanide concentration, resulting in deferred production. This is seen as an increase in apparent recovery in 2017. Increased stacking rate in 2019 resulted in a drop of apparent recovery but is expected to recover during the 2020 and 2021 production years.
Table 13‐1 Mesquite Mine Production 2007 ‐ 2019
Year Ore Placed
(tons) Au Grade (oz/t)
Au Placed (oz)
Au Produced
(oz)
Annual Au Recovery
(%)
Cumulative Au
Recovery (%)
2007 978,886 0.0198 19,345 3,777 19.5% 19.5%
2008 9,023,477 0.0224 202,147 111,034 54.9% 51.8%
2009 14,422,500 0.0150 216,012 150,002 69.4% 60.5%
2010 12,485,147 0.0181 225,882 169,023 74.8% 65.4%
2011 12,933,811 0.0166 214,321 158,004 73.7% 67.4%
2012 15,988,000 0.0136 216,790 142,008 65.5% 67.0%
2013 15,760,000 0.0109 171,900 107,016 62.3% 66.4%
2014 14,936,000 0.0117 174,810 106,669 61.0% 65.7%
2015 22,032,000 0.0100 221,040 134,868 61.0% 65.1%
2016 20,911,000 0.0110 229,250 111,123 48.5% 63.1%
2017 22,959,000 0.0094 216,510 168,890 78.0% 64.6%
2018 24,640,700 0.0093 229,770 140,136 61.0% 64.3%
2019 27,800,000 0.0093 257,480 125,736 48.8% 62.7%
Total/Avg 214,870,521 0.0121 2,595,257 1,628,286 62.7%
Figure 13‐4: Annual Apparent Au Recovery: Annual Ounces Recovered/ Annual Ounces Stacked
Gold recovery to date (2007 to present), is shown in Figure 13‐5. The recovery curve peaked in 2011 at 67.4% and has declined to the 62.7% owing to increased tonnage to the heap, lower head

MESQUITE GOLD MINE, CALIFORNIA, U.S.A. TECHNICAL REPORT ON THE MESQUITE GOLD MINE, CALIFORNIA, U.S.A.
P a g e | 13‐5
27/04/2020
grades, and higher mass fraction of the non‐ox material being placed on the heap. It is expected that the recovery will improve during the 2020 and 2021 production years due to improved heap leach solution chemistry and solution management practices. It is also reasonable to expect that the previously reported gold recovery projections of 75% for oxide and 35% for non‐ox, are correct.
Figure 13‐5: Restart to Date Cumulative Au Recovery
The WMMI Monthly Operations Report for December 2019 provided the actual and budgeted production data for the year. A summary of this data is provided in Table 13‐2.
Table 13‐2: Mesquite Mine 2019 Year End Data
Actual Budget Difference
Tons (‘000 t) 27,800 22,210 25.2%
Grade (oz/t) 0.0047 0.0068 ‐17.7%
Contained Oz 257,480 283,610 ‐9.2%
Produced Oz 124,017 152,521 ‐18.7%
Recovery 62.9% 69.6% ‐10.4%
13.3 Recommendations
The following recommendations are provided for metallurgical and testwork:
continue metallurgical testing of the heap leach feed
develop a metallurgical testing program to optimize leaching parameters for the non‐ox material
MESQUITE GOLD MINE, CALIFORNIA, U.S.A. TECHNICAL REPORT ON THE MESQUITE GOLD MINE, CALIFORNIA, U.S.A.
P a g e | 13‐6
27/04/2020
o review of historical test work data indicates higher recoveries are possible if the leach solution chemistry is properly controlled
develop a proper solution management plan to maximize solution utilization on the heap while minimizing cyanide consumption
optimize leach pad lift stacking height
improve analytical methods for low gold ore types.

MESQUITE GOLD MINE, CALIFORNIA, U.S.A. TECHNICAL REPORT ON THE MESQUITE GOLD MINE, CALIFORNIA, U.S.A.
P a g e | 14‐1
27/04/2020
14 MINERAL RESOURCE ESTIMATES
The mineral resource section is broken into two components for the Report:
1. In‐situ Resources
2. Dump Resources
In‐situ resources comprise material to be mined for a first time. The dump resources are material that was mined in the past and considered waste due to the gold price at that time. With the increase in the gold price in today’s environment, portions of the waste dump may have resources that can be defined.
14.1 In‐situ Resource Estimate
14.1.1 Introduction
This Report describes the approach used to develop the mineral resource estimate update for the Mesquite Mine gold deposit located in southeastern California, USA. The resource estimate presented in this Report is based on a database provided by Equinox on January 13, 2020, which included the results of the drilling campaigns and re‐logging and geological interpretations carried out by Equinox in 2019. Mineral resources presented in this Report are based on the resource‐limiting, minimum (or mined‐out) surface and topographic surface as of December 31, 2019.
This mineral resource estimate was prepared by Ali Shahkar P.Eng. of Lions Gate Geological Consulting Inc. (LGGC) and Bruce Davis, FAusIMM, BDRC. Ali Shahkar is an independent QP within the requirements of NI 43‐101 for the purpose of the mineral resource estimations contained in this report and is the QP responsible for the in‐situ portion of the estimations. The mineral resource has been estimated in conformity with generally accepted CIM Estimation of Mineral Resources and Mineral Reserves Best Practice Guidelines (November 2003) and is reported in accordance with the Canadian Securities Administrators’ (CSA) National Instrument 43‐101 (NI 43‐101). Mineral resources are not mineral reserves, and they do not have demonstrated economic viability. There is no certainty that all or any part of the mineral resource will be converted into a mineral reserve upon application of economic factors.
Estimations are made from 3D block models based on geostatistical applications using commercial mine planning software (Geovia®). The project limits are based on imperial units using a nominal block size of 50 x 50 x 30 ft. (LxWxH). The majority of drilling prior to 2010 was conducted using vertical holes. Since 2010, drill holes have been inclined in reaction to what is interpreted to be subvertical, gold‐bearing structures. Drill holes are generally drilled at 75‐ft. intervals on cross sections spaced at 150‐ft. intervals. However, not all holes are long enough to provide the same data density at depths of the remaining resources below past production pits. The aim of the 2019 drilling campaign was to infill areas within the current mine plan where increased data density was needed.

MESQUITE GOLD MINE, CALIFORNIA, U.S.A. TECHNICAL REPORT ON THE MESQUITE GOLD MINE, CALIFORNIA, U.S.A.
P a g e | 14‐2
27/04/2020
The resource estimate was generated using drill hole sample assay results and the interpretation of a geologic model that relates to the spatial distribution of gold in the deposit. Interpolation characteristics were defined based on the geology, drill hole spacing, and geostatistical analysis of the data. The database also contains limited sample results for cyanide soluble gold, but there is insufficient data present to support model estimations of this type. The resources were classified according to their proximity to gold sample data locations and were reported, as required by NI 43‐101, according to the CIM Definition Standards for Mineral Resources and Mineral Reserves (May 2014).
14.1.2 Available Data
On January 13, 2020, Equinox provided the drill hole database containing collar locations, down‐hole surveys, assay results, and logged geologic information. This data was formatted and loaded into Geovia®.
There is a total of 7,326 drill holes in the database (with a total cumulative length of 3,176,490 ft) of which 142 holes were drilled in 2019 in the remaining reserve areas of Brownie and Vista East. The sampling results and geologic information from the holes located in the vicinity of the Mesquite Mine deposit, have been used to generate the resource model. Figure 14‐1 is a plan showing the distribution of drilling at Mesquite Mine with the 2019 drill holes shown in red.
Figure 14‐1: Drill Hole Plan – 2019 Drilling in Red
To generate the updated resource estimates LGGC used the same database as used for the previous resource estimates (as described in previous Technical Reports), plus the new drill holes from the 2019 infill drilling campaign by Equinox. Of the 142 new drill holes (66,085 ft), 52 are in the Brownie Area and 90 in the Vista East Area. These were designed to increase the data density at the more sparsely drilled Brownie Area and to better delineate the Vista East mineralization at
MESQUITE GOLD MINE, CALIFORNIA, U.S.A. TECHNICAL REPORT ON THE MESQUITE GOLD MINE, CALIFORNIA, U.S.A.
P a g e | 14‐3
27/04/2020
depths below the current pit. Holes are both inclined and vertical based on the infill target locations and drilling access logistics. Nearly all of the drill holes used for the estimate are RC and are sampled at 5 ft. intervals.
The estimation was carried out using assay data in imperial units of ounces per short ton (oz/t) and all gold grade data in parts per million (ppm) have been converted to imperial units using the following formula:
Au oz/t = Au ppm / 34.286
The geologic information is derived from observations made during logging and includes lithology type and oxide domain designations. The pre‐2019 data has been adjusted by the re‐logging campaign carried out by Equinox. The overall lithologies remain close to the previous versions. The oxide domains are now categorized into four types oxide (OXD), oxide‐transition (OXD‐TR), non‐oxide (NOX) and non‐oxide‐transition (NOX‐TR).
There was no recovery data provided with the sample database.
14.1.3 Geologic Model, Domains, and Coding
In January of 2020, Equinox provided a series of wireframe domains representing the geologic interpretations of the various lithologic units and oxide domains. These incorporated the results of re‐logging, mapping and interpretation work carried out by Equinox. Earlier iterations of this modeling work had been reviewed by LGGC and formed the basis of two interim resource estimations leading to the current version that is based on data available at the end of 2019. Figure 14‐2 shows the main lithological units (excluding the overlying Tertiary units).
The three main lithologies that host the mineralization at Mesquite are the upper unit of Biotite Gneiss (BG), middle unit of Hornblende Biotite Gneiss (HBG) and lower unit of Mafic Gneiss (MG). It is thought that a downward decrease in mineralization reflects decreasing brittle rheology of the rocks due to increasing mafic mineral percentage.
Two major normal faults that have been identified in the deposit offset lithologies in the geologic model, dividing the model into three blocks (Figure 14‐7). These two faults appear to offset gold mineralization and are used as hard boundaries in resource estimations going forward. Further faulting is recognized but not well enough understood for inclusion in modeling or resource estimations at this time.

MESQUITE GOLD MINE, CALIFORNIA, U.S.A. TECHNICAL REPORT ON THE MESQUITE GOLD MINE, CALIFORNIA, U.S.A.
P a g e | 14‐4
27/04/2020
Figure 14‐2: Planview Showing Main Lithology Units (excluding Tertiary cover)
Wireframes representing the new four category logging scheme, that was developed in 2019 for the oxidation logging, were provided. These domains do not have implications on the interpolation of the gold grades but are ultimately used to assign recovery assumptions and affect the reporting cut‐off grade of the material. Figure 14‐3 shows an example of the newly interpreted oxide domains in a vertical section through Brownie Area.
Figure 14‐3: Vertical Section (Looking East) Showing the Oxidation Category Wireframes

MESQUITE GOLD MINE, CALIFORNIA, U.S.A. TECHNICAL REPORT ON THE MESQUITE GOLD MINE, CALIFORNIA, U.S.A.
P a g e | 14‐5
27/04/2020
14.1.4 Compositing
Compositing the drill hole samples helps standardize the database for further statistical evaluation. This step eliminates any effect that inconsistent sample lengths might have on the data.
To retain the original characteristics of the underlying data, a composite length was selected that reflects the average original sample length. The generation of longer composites can result in some degree of smoothing which could mask certain features of the data. Almost 99% of the samples in the database are exactly 5 ft. long, and as a result, a standard 5 ft. composite sample length was generated for grade estimations in the block model.
Drill hole composites are length‐weighted and were generated down‐the‐hole; this means composites begin at the top of each hole and are generated at 5‐ft intervals down the length of the hole.
Using the wireframe domains, sample intervals were assigned the various domain codes on a majority basis.
14.1.5 Exploratory Data Analysis
Exploratory data analysis (EDA) involves statistically summarizing the database to quantify the characteristics of the data. The main purpose of EDA is to determine if there is any evidence of spatial distinctions in grade; if this occurs, a separation and isolation of domains during interpolation may be necessary. An unwanted mixing of data is prevented by applying separate domains during interpolation: the result is a grade model that better reflects the unique properties of the deposit. However, applying domain boundaries in areas where the data is not statistically unique may impose a bias in the distribution of grades in the model.
A domain boundary, which segregates the data during interpolation, is typically applied if the average grade in one domain is significantly different from that of another domain. A boundary may also be applied when there is evidence that a notable change in the grade distribution exists across the contact.
14.1.6 Basic Statistics by Domain
The basic statistics for the distribution of gold were generated by lithology type, structural block, oxide domain, and in relation to the water table. The results are presented in a boxplot.
The distribution of gold by lithology is shown in Figure 14‐4. The three main gneiss units that host mineralization show a gradual decrease in gold grades with depth, going from the upper BG to HBG and ultimately MG.

MESQUITE GOLD MINE, CALIFORNIA, U.S.A. TECHNICAL REPORT ON THE MESQUITE GOLD MINE, CALIFORNIA, U.S.A.
P a g e | 14‐6
27/04/2020
Figure 14‐4: Boxplots for Gold (ppm) by Lithology
14.1.7 Contact Profiles
Contact profiles evaluate the nature of grade trends between two domains: they graphically display the average grades at increasing distances from the contact boundary. Contact profiles that show a marked difference in grade across a domain boundary indicate the two datasets should be isolated during interpolation. Conversely, if a more gradual change in grade occurs across a contact, the introduction of a hard boundary (e.g., segregation during interpolation) may result in a much different trend in the grade model; in this case, the change in grade between domains in the model is often more abrupt than the trends seen in the raw data. Finally, a flat contact profile indicates no grade changes across the boundary; in this case, hard or soft domain boundaries will produce similar results in the model.
Contact profiles were generated to further evaluate the change in gold grade observed in the boxplot analyses across the three main lithologies. The contact plot between BG and HBG shows a gradual decrease in grades across the contact into HBG (Figure 14‐5). Figure 14‐6 shows a sharper drop in grades going from HBG into MG.

MESQUITE GOLD MINE, CALIFORNIA, U.S.A. TECHNICAL REPORT ON THE MESQUITE GOLD MINE, CALIFORNIA, U.S.A.
P a g e | 14‐7
27/04/2020
Figure 14‐5: Contact Plot Between BG and HBG
Figure 14‐6: Contact Plot Between MG and HBG

MESQUITE GOLD MINE, CALIFORNIA, U.S.A. TECHNICAL REPORT ON THE MESQUITE GOLD MINE, CALIFORNIA, U.S.A.
P a g e | 14‐8
27/04/2020
14.1.8 Conclusions and Modeling Implications
The EDA results indicate there is a difference in the distribution of gold between the three main host lithologies at Mesquite Mine. This difference is transitional in nature and correlates with depth. This is consistent with the geological concepts and observations that gold mineralization is stronger and more pervasive in the upper portions of the deposit within the more favourable BG unit and more discretely distributed at depth within the MG unit. Given that most of the remaining resources (except for Brownie) fall within the lower portions of the deposit, this transitional change needs to be addressed in modeling efforts.
The lithology units alone do not provide adequate domains for grade interpolation which is controlled by structures within them. Nearly all the drilling at Mesquite has been RC and therefore there is no detailed structural model that could serve for domaining purposes.
Given this, the approach of generating grade shells for use as domains was taken. These domains are used to control the estimated gold grades during interpolation by separating areas likely to have a different mineralization tenor. The methodology used in deriving the grade‐shells is detailed in the next section of this report.
The two main normal faults discussed earlier act as hard boundaries dividing the overall model into three blocks. Figure 14‐7 shows the resulting grade shells and their codes divided into the three main structural blocks.
Figure 14‐7: Grade Shells Divided Into Three Structural Blocks

MESQUITE GOLD MINE, CALIFORNIA, U.S.A. TECHNICAL REPORT ON THE MESQUITE GOLD MINE, CALIFORNIA, U.S.A.
P a g e | 14‐9
27/04/2020
14.1.9 Grade Shells
Two grade shells generated by Equinox using Leapfrog® software were provided for resource estimation, a low‐grade shell (0.1 ppm Au) and a high‐grade shell (0.5 ppm Au). Grade shells are based on 30 ft downhole composites of gold fire assay data. Composites were chosen to help smooth the shells and reduce isolated volumes that would not be useful in resource estimation. The shells are calculated with a spherical decay function with ranges of 6000 ft for the low‐grade shell and 4000 ft for the high‐grade shell.
Shells are heavily influenced by interpreted trends in the gold assay data. These trends are modeled by two‐dimensional surfaces interpreted visually in Leapfrog® and guided by the geologic concepts presented earlier. These surfaces were used as inputs for a Leapfrog® Structural Trend which was then applied as spatially dependent anisotropy to the orientation of the grade shells.
The grade shells also honor interpreted mineralization favourability within the host gneisses—decreasing with depth from the brittle BG on top, through the less brittle HBG in the middle, down to the poorly fractured MG basement. Probability boundaries are set at 40% of the spherical weighted distance to waste intervals in the BG, 60% in the HBG, and 80% in the MG. Though the grade shells within each lithology were calculated separately, interpolations included data from adjoining lithologies to honor lithology as a soft boundary.
Finally, grade shells were generated individually for each fault block, with spatial filters preventing assays from adjoining fault blocks from influencing the interpolation. This honors these faults as hard boundaries to mineralization. Figure 14‐8 shows an isometric view of the grade shells with their corresponding Domain Codes.
Figure 14‐8: Plan View Showing Extent of Area Domains
MESQUITE GOLD MINE, CALIFORNIA, U.S.A. TECHNICAL REPORT ON THE MESQUITE GOLD MINE, CALIFORNIA, U.S.A.
P a g e | 14‐10
27/04/2020
The grade shells were also visually inspected to ensure that they encapsulate the intended areas of higher and lower gold mineralization, especially within the main two areas of BRO and VE2. Generally, LGGC does not recommend the use of higher‐grade shells (such as the 0.5 ppm utilized here) and prefers geologically controlled domaining. In this case it was it was found that the 0.5 ppm grade shell performed reasonably in outlining areas of continuity of higher gold grades, as it was heavily influenced by the available lithologic and structural information. This provides a different result than relying on a solely probabilistic grade domain which tends to not preform well in areas of lower and non‐uniform data density. Given that the bulk of the remaining resources fall within the lower portions of the deposit, with poorer data density and tighter controls on mineralization, this approach has had a significant impact in the defined resources remaining at the bottom of the mined‐out pits as compared to the previous models.
The grades shells were treated as hard boundaries during the interpolation of gold grades.
14.1.10 Bulk Density Data
There was no individual bulk density data present in the sample database. The following tonnage factors were taken from the 2010 RPA Inc. technical report: 13.58 ft3/ton for hard rock and 15.94 ft3/ton for all Tertiary rocks and colluvium. These are equivalent to bulk density values of 2.36 /m3 and 2.01 t/m3, respectively.
14.1.11 Evaluation of Outlier Grades
In previous resource models at Mesquite Mine, the estimate includes all parts of the deposit prior to mining. By doing this, reconciliation evaluations can be performed on portions of the model that have already been extracted and the results can then be used to guide and improve the development of the estimates of the remaining resources. However, since the majority of the higher‐grade resources have already been extracted, outlier restrictions using the whole (pre‐mining) database have essentially no impact on the remaining (generally lower‐grade) parts of the deposit and can actually result in an over‐estimation of the grade for the remaining resource. As a response, the data selected for potential outlier controls are restricted to within 100 feet above the December 31, 2019 minimum (or mined‐out) surface.
Histograms and probability plots were reviewed for the presence of potentially anomalous high‐grade gold samples. The physical locations of potential outlier values were evaluated, and it was decided these would be controlled during model estimation using a combination of traditional top‐cutting and outlier limitations. An outlier limitation restricts the distance of influence of samples above a defined threshold during grade interpolations. During block grade interpolations, any samples above the defined threshold limit would be restricted to a maximum influence distance of 50 ft. along the two major axis of the search ellipse and 30 ft. along the minor axis. The top‐cut (TC) and restricted outlier (RO) threshold limits for gold are listed in Table 14‐1.

MESQUITE GOLD MINE, CALIFORNIA, U.S.A. TECHNICAL REPORT ON THE MESQUITE GOLD MINE, CALIFORNIA, U.S.A.
P a g e | 14‐11
27/04/2020
Table 14‐1: Top‐Cut and Restricted Outlier Threshold Limits By Domain
Domain TC (oz/t) No. Composites No. Cut RO (oz/t)
1100 0.1 8,171 2 0.05
1500 0.2 2,259 14 0.1
2100 0.3 90,010 81 0.15
2500 0.35 21,900 186 0.2
3100 0.2 11,348 8 0.15
3500 1 7,192 32 0.5
The combination of TC and RO controls resulted in a metal reduction of 6% at BRO and 15% at VE2. These areas are the two main contributors to the remaining reserves at Mesquite. The higher metal removal at VE2 is due to the higher coefficient of variance in this area. The amount of contained gold lost due to these measures is considered appropriate for this deposit at this stage of exploitation. Table 14‐2 shows the summary of statistics for the composites and the mean and coefficient of variance after the application of TC, by grade shell domains.
Table 14‐2: Summary Gold Grade (oz/t) Statistics By Domain
Uncapped 5ft Composites Capped
Domain No.
Comps Mean STDV CV Min Q25 Q50 Q75 Max Mean CV
1100 8172 0.007 0.000 1.145 0.000 0.002 0.005 0.009 0.232 0.007 1.073
1500 2260 0.026 0.001 1.290 0.000 0.009 0.018 0.032 0.651 0.026 1.077
2100 90011 0.010 0.002 4.149 0.000 0.002 0.005 0.011 7.500 0.010 1.840
2500 21901 0.040 0.023 3.777 0.000 0.010 0.020 0.041 15.300 0.036 1.379
3100 11349 0.009 0.001 3.325 0.000 0.002 0.005 0.010 2.041 0.009 1.462
3500 7190 0.052 0.086 5.675 0.000 0.008 0.020 0.044 16.726 0.044 2.140
14.1.12 Variography
The degree of spatial variability in a mineral deposit depends on both the distance and direction between points of comparison. Typically, the variability between samples increases as the distance between those samples increases. If the degree of variability is related to the direction of comparison, then the deposit is said to exhibit anisotropic tendencies which can be summarized with the search ellipse. The semi‐variogram is a common function used to measure the spatial variability within a deposit.
The components of the variogram include the nugget, the sill, and the range. Often samples compared over very short distances, even samples compared from the same location, show some degree of variability. As a result, the curve of the variogram often begins at some point on the y‐axis above the origin: this point is called the nugget. The nugget is a measure of not only the natural variability of the data over very short distances, but also a measure of the variability which can be introduced due to errors during sample collection, preparation, and the assay process.

MESQUITE GOLD MINE, CALIFORNIA, U.S.A. TECHNICAL REPORT ON THE MESQUITE GOLD MINE, CALIFORNIA, U.S.A.
P a g e | 14‐12
27/04/2020
The amount of variability between samples typically increases as the distance between the samples increases. Eventually, the degree of variability between samples reaches a constant, maximum value; this is called the sill, and the distance between samples at which this occurs is called the range.
The spatial evaluation of the data in this report was conducted using a correlogram rather than the traditional variogram. The correlogram is normalized to the variance of the data and is less sensitive to outlier values, generally giving better results.
Variograms were generated using the commercial software package SAGE 2001© (Isaacks & Co.). Multidirectional variograms were generated for all available composited gold samples located within the grade shells in each structural block. The results are summarized in Table 14‐3.
Table 14‐3: Correlogram Parameters for Gold
Domain Nugget Sill 1 Sill 2
1st Structure 2nd Structure
Range (ft) Azimuth Dip
Range (ft) Azimuth Dip
1100 0.566 0.398 0.036 19 301 69 2,953 318 59
Spherical
52 34 2 965 351 ‐26
110 125 21 182 74 14
1500 0.678 0.116 0.206 15 50 89 318 69 ‐11
Spherical
147 12 ‐1 26 148 48
851 102 ‐1 108 348 40
2100 0.600 0.381 0.019 12 321 42 268 315 77
Spherical
37 14 ‐34 236 29 ‐4
21 81 30 143 118 12
2500 0.750 0.190 0.060 20 57 66 81 210 65
Spherical
110 331 ‐1 780 330 13
11 61 ‐23 345 65 21
3100 0.600 0.370 0.030 20 187 53 491 112 52
Spherical
14 90 5 868 310 37
53 176 ‐37 71 34 ‐9
3500 0.450 0.512 0.038 4 76 23 190 309 89
Spherical
45 358 ‐26 427 26 0
22 130 ‐54 47 116 1
14.1.13 Model Setup and Limits
A block model was initialized in Geovia® and the dimensions are defined in Table 14‐4. It should be noted that the block model dimensions have been extended to the South and West from the previous versions in order to accommodate combining of the in‐situ and waste dump block models. The selection of a nominal block size measuring 50 x 50 x 30 ft. (LxWxH) is considered appropriate with respect to the current drill hole spacing and the selective mining unit (SMU) of the operation.

MESQUITE GOLD MINE, CALIFORNIA, U.S.A. TECHNICAL REPORT ON THE MESQUITE GOLD MINE, CALIFORNIA, U.S.A.
P a g e | 14‐13
27/04/2020
Table 14‐4: Block Model Limits
Direction Minimum Maximum Block Size (ft) Number of Blocks
East 4000 25000 50 420
North ‐800 15500 50 326
Elevation ‐290 1000 30 43 Note: Model is not rotated.
Blocks in the model were coded on a majority basis with the grade shell and oxidation domains. During this stage, blocks along a domain boundary are coded if more than 50% of the block occurs within the boundaries of that domain.
14.1.14 Interpolation Parameters
The block model gold grades are estimated using Ordinary Kriging (OK). The results of the OK estimation are compared with the Hermitian Polynomial Change of Support method, also referred to as the Discrete Gaussian Correction. This method is described in greater detail in Section 14.1.17 (Model Checks for Change of Support). Gold grades are also estimated using Nearest Neighbour (NN) and Inverse Distance‐weighted to the power of two (ID2) methods (both capped and uncapped) for comparison purposes.
The Mesquite Mine OK model is generated with a relatively small number of samples to match the change of support, or Hermitian Correction (Herco) grade distribution. This approach reduces the amount of smoothing or averaging in the model and, while there may be some uncertainty on a localized scale, this approach produces a reliable estimate of the recoverable grades and tonnages for the overall deposit.
All grade estimates use length‐weighted composite drill hole sample data. Hard boundaries are applied to the grade shell domains during the interpolation of gold grades. The interpolation parameters are summarized by domain in Table 14‐5.
Table 14‐5: Interpolation Parameters
Domain Search Ellipse Rotation (RHR) Search Ellipse Range (ft) Number of Composites
Z Y Z X Y Z Min/Block Max/Block Max/Hole
1100 140 ‐15 0 400 600 100 10 30 6
1500 140 ‐15 0 400 600 100 10 30 6
2100 100 ‐15 0 400 600 100 10 30 6
2500 100 ‐15 0 400 600 100 10 30 6
3100 120 ‐10 0 500 300 80 10 30 6
3500 120 ‐10 0 500 300 80 10 30 6 Notes: All rotations are Right Hand Rule (RHR) convention
14.1.15 Validation
The results of the modeling process are validated using several methods. These methods included a thorough, visual inspection of the model grades in relation to the underlying drill hole sample

MESQUITE GOLD MINE, CALIFORNIA, U.S.A. TECHNICAL REPORT ON THE MESQUITE GOLD MINE, CALIFORNIA, U.S.A.
P a g e | 14‐14
27/04/2020
grades, comparisons with the change of support model, comparisons with other estimation methods, and grade distribution comparisons using swath plots.
14.1.16 Visual Inspection
A detailed visual inspection of the block model was conducted in both the section and plan to ensure the desired results following interpolation. This inspection confirmed blocks within the respective domains and below the topographic surface were properly coded. To ensure there is proper representation in the model, the inspection also included a comparison of the distribution of block gold grades relative to the drill hole samples.
14.1.17 Model Checks for Change of Support
The relative degree of smoothing in the block model estimates is evaluated using the Discrete Gaussian Correction; it is also referred to as the Hermitian Polynomial Change of Support method (Journel and Huijbregts, Mining Geostatistics, 1978). With this method, the distribution of the hypothetical block grades can be directly compared to the estimated OK model through the use of pseudo‐grade/tonnage curves. Adjustments are made to the block model interpolation parameters until an acceptable match is made with the Herco (HERmitian Correction) distribution. In general, the estimated model should be slightly higher in tonnage and slightly lower in grade when compared to the Herco distribution at the projected cut‐off grade. These differences account for selectivity and other potential ore‐handling issues which commonly occur during mining.
The Herco distribution is derived from the de‐clustered composite grades which are adjusted to account for the change in support, moving from smaller drill hole composite samples to the larger blocks in the model. The transformation results in a less‐skewed distribution but with the same mean as the original de‐clustered samples.
Pseudo grade/tonnage plots generated for models in each of the two areas of remaining reserves (Brownie and VE2 pits) are shown in Figure 14‐9. Models in both areas show reasonable correlation between the Herco results and the OK models at the cut‐off grades of interest for the Project.

MESQUITE GOLD MINE, CALIFORNIA, U.S.A. TECHNICAL REPORT ON THE MESQUITE GOLD MINE, CALIFORNIA, U.S.A.
P a g e | 14‐15
27/04/2020
Figure 14‐9: Change of Support Curves
14.1.18 Comparison of Interpolation Methods
For comparison purposes, additional models have been generated using both the inverse distance‐weighted to the power of two (ID2) and nearest neighbour (NN) interpolation methods. The results of these models are compared to the OK models at a series of cut‐off grades using grade/tonnage plots generated for BRO (Figure 14‐10) and VE2 (Figure 14‐11) pit areas. The comparisons are limited to the Measured and Indicated material remaining as of December 31, 2019.
In both areas, the OK and ID models compare well with the NN ones and show degrees of smoothing that are consistent with the continuity exhibited in the correlograms.

MESQUITE GOLD MINE, CALIFORNIA, U.S.A. TECHNICAL REPORT ON THE MESQUITE GOLD MINE, CALIFORNIA, U.S.A.
P a g e | 14‐16
27/04/2020
Figure 14‐10: Grade‐Tonnage Comparison of OK, ID, and NN Models At Brownie
Figure 14‐11: Grade‐Tonnage Comparison of OK, ID, and NN Models At Vista East 2

MESQUITE GOLD MINE, CALIFORNIA, U.S.A. TECHNICAL REPORT ON THE MESQUITE GOLD MINE, CALIFORNIA, U.S.A.
P a g e | 14‐17
27/04/2020
14.1.19 Swath Plots (Drift Analysis)
A swath plot is a graphical display of the grade distribution derived from a series of bands, or swaths, generated in several directions throughout the deposit. Using the swath plot, grade variations from the OK (and ID2) model are compared to the distribution derived from the de‐clustered NN grade model.
On a local scale, the NN model does not provide reliable estimations of grade, but on a much larger scale, it represents an unbiased estimate of the grade distribution based on the underlying data. Therefore, if the OK model is unbiased, the grade trends may show local fluctuations on a swath plot, but the overall trend should be similar to the NN distribution of grade.
Swath plots have been generated in three orthogonal directions for gold distributions in each of the two areas of remaining reserves. Figure 14‐12 and Figure 14‐13 show examples of swath plots (by eastings and northings) for the BRO and VE2 pit areas respectively. There is good correspondence between the OK models and the NN. The degree of smoothing in the OK model is evident in the peaks and valleys shown in the swath plots.

MESQUITE GOLD MINE, CALIFORNIA, U.S.A. TECHNICAL REPORT ON THE MESQUITE GOLD MINE, CALIFORNIA, U.S.A.
P a g e | 14‐18
27/04/2020
Figure 14‐12: Swath Plots Comparing OK, ID2, and NN Models at BRO

MESQUITE GOLD MINE, CALIFORNIA, U.S.A. TECHNICAL REPORT ON THE MESQUITE GOLD MINE, CALIFORNIA, U.S.A.
P a g e | 14‐19
27/04/2020
Figure 14‐13: Swath Plots Comparing OK, ID2, and NN Models at VE2

MESQUITE GOLD MINE, CALIFORNIA, U.S.A. TECHNICAL REPORT ON THE MESQUITE GOLD MINE, CALIFORNIA, U.S.A.
P a g e | 14‐20
27/04/2020
14.1.20 Resource Classification
The mineral resources at the Mesquite Mine deposit have been classified in accordance with the CIM Definition Standards for Mineral Resources and Mineral Reserves (May 2014). The classification criteria are based on the distance‐to‐sample data and are based on the relative degree of confidence in the block grade estimate. These parameters are, in part, based on the years of production history at this operation. Statistical information is gained through inspection of histograms and gold variogram results. Indicator variograms, produced from 30‐ft. sample composites and defined at a threshold of 0.0035 oz/t Au (equal to the cut‐off grade for oxide and transition material), provide information regarding the ranges of continuous zones of potentially economic mineralization.
Resource categories are defined as follows:
Measured Mineral Resources:
Blocks in the model that have gold grades estimated from two or more drill holes within an average distance of 50 ft. and exhibiting a high degree of consistency. This is equivalent to drilling on a 75 x 75 ft. pattern.
Indicated Mineral Resources:
Blocks in the model that have gold grades estimated from two or more drill holes within an average distance of 140 ft. and exhibiting a relatively high degree of consistency and continuity in the nature of the mineralization. This is equivalent to drilling on a 200 x 200 ft. pattern.
Inferred Mineral Resources:
Blocks in the model that have gold grades estimated from two or more drill holes within an average distance of 350 ft.
14.1.21 In‐situ Mineral Resources
The estimated in‐situ mineral resources have been generated for year‐end 2019 and represent the material located between the surveyed topographic surface as of December 31, 2019, excluding any surface stockpiles and the ultimate resource limiting pit shell generated in March of 2020. The resource limiting ultimate pit shell is derived using an assumed gold price of $1,500 per ounce, 2020 budget operating costs and metallurgical recoveries of 75% for OXD/OXD‐TR and 35% for NOX‐NOX‐TR material. The mineral resources contained within the resource limiting ultimate pit shell exhibit reasonable prospects for eventual economic extraction as required under NI 43‐101.
The in‐situ mineral resources, inclusive of mineral reserves, are listed in Table 14‐6 with metric conversions provided in Table 14‐7. Resources have been segregated based on oxide type. The base case cut‐off grade for OXD/OXD‐TR material is 0.0025 oz/t Au and 0.0053 oz/t Au for NOX/NOX‐TR material. Note: the cut‐off grades were 0.0039 oz/t Au for oxide and 0.0084 oz/t Au for transition and sulphide resources based on the previous oxide categories.
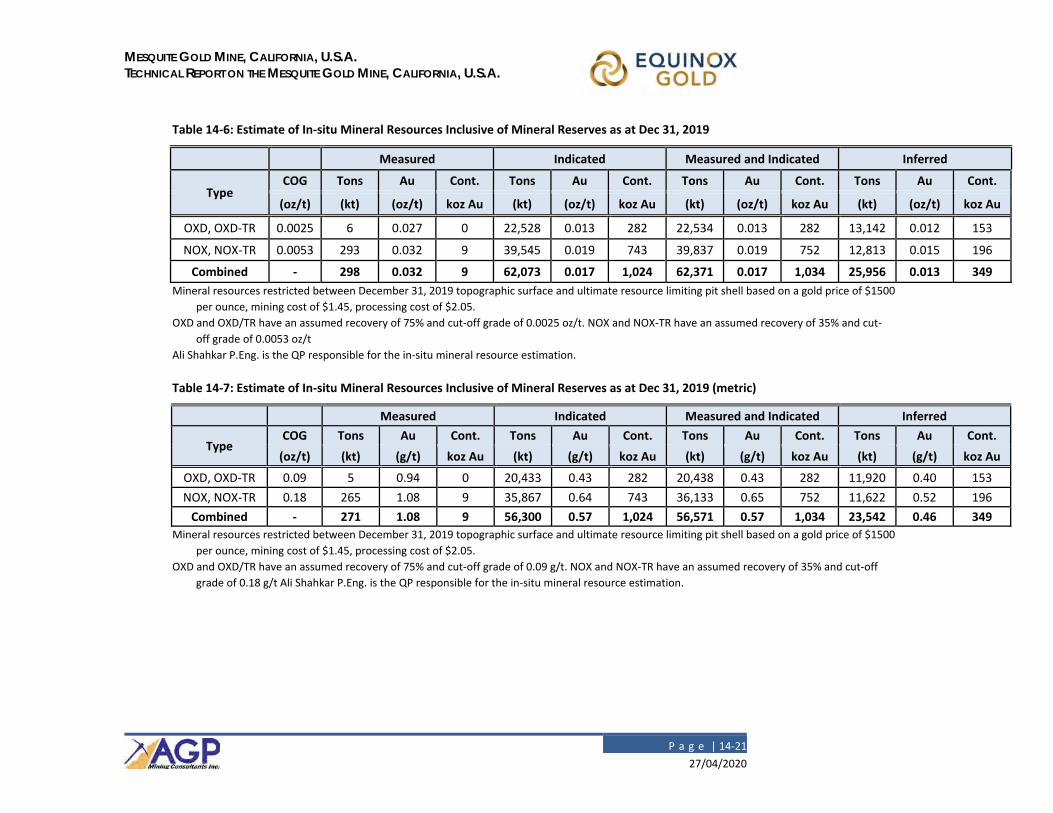
MESQUITE GOLD MINE, CALIFORNIA, U.S.A. TECHNICAL REPORT ON THE MESQUITE GOLD MINE, CALIFORNIA, U.S.A.
P a g e | 14‐21
27/04/2020
Table 14‐6: Estimate of In‐situ Mineral Resources Inclusive of Mineral Reserves as at Dec 31, 2019
Measured Indicated Measured and Indicated Inferred
Type COG Tons Au Cont. Tons Au Cont. Tons Au Cont. Tons Au Cont.
(oz/t) (kt) (oz/t) koz Au (kt) (oz/t) koz Au (kt) (oz/t) koz Au (kt) (oz/t) koz Au
OXD, OXD‐TR 0.0025 6 0.027 0 22,528 0.013 282 22,534 0.013 282 13,142 0.012 153
NOX, NOX‐TR 0.0053 293 0.032 9 39,545 0.019 743 39,837 0.019 752 12,813 0.015 196
Combined ‐ 298 0.032 9 62,073 0.017 1,024 62,371 0.017 1,034 25,956 0.013 349
Mineral resources restricted between December 31, 2019 topographic surface and ultimate resource limiting pit shell based on a gold price of $1500
per ounce, mining cost of $1.45, processing cost of $2.05.
OXD and OXD/TR have an assumed recovery of 75% and cut‐off grade of 0.0025 oz/t. NOX and NOX‐TR have an assumed recovery of 35% and cut‐
off grade of 0.0053 oz/t
Ali Shahkar P.Eng. is the QP responsible for the in‐situ mineral resource estimation.
Table 14‐7: Estimate of In‐situ Mineral Resources Inclusive of Mineral Reserves as at Dec 31, 2019 (metric)
Measured Indicated Measured and Indicated Inferred
Type COG Tons Au Cont. Tons Au Cont. Tons Au Cont. Tons Au Cont.
(oz/t) (kt) (g/t) koz Au (kt) (g/t) koz Au (kt) (g/t) koz Au (kt) (g/t) koz Au
OXD, OXD‐TR 0.09 5 0.94 0 20,433 0.43 282 20,438 0.43 282 11,920 0.40 153
NOX, NOX‐TR 0.18 265 1.08 9 35,867 0.64 743 36,133 0.65 752 11,622 0.52 196
Combined ‐ 271 1.08 9 56,300 0.57 1,024 56,571 0.57 1,034 23,542 0.46 349
Mineral resources restricted between December 31, 2019 topographic surface and ultimate resource limiting pit shell based on a gold price of $1500
per ounce, mining cost of $1.45, processing cost of $2.05.
OXD and OXD/TR have an assumed recovery of 75% and cut‐off grade of 0.09 g/t. NOX and NOX‐TR have an assumed recovery of 35% and cut‐off
grade of 0.18 g/t Ali Shahkar P.Eng. is the QP responsible for the in‐situ mineral resource estimation.

MESQUITE GOLD MINE, CALIFORNIA, U.S.A. TECHNICAL REPORT ON THE MESQUITE GOLD MINE, CALIFORNIA, U.S.A.
P a g e | 14‐22
27/04/2020
There are no known factors related to mining, metallurgical, infrastructure, environmental, permitting, legal, title, taxation, socio‐economic, marketing, or political issues which could materially affect the mineral resource. The eastern extent of the mineral resource, referred to as the Rainbow area, encroaches on an existing public roadway and full extraction of the full resource in the area would require moving the existing road. There are no known reasons that full access to the resource in this area could not be achieved in the future. It is considered reasonable to expect that a majority of resources in the Inferred category could be upgraded to Indicated or Measured resources with further exploration.
To provide information regarding the sensitivity of this resource estimation to cut‐off grade, the mineral inventory contained within the deposit is shown at a series of gold cut‐off thresholds in
Table 14‐8.
Table 14‐8: Sensitivity of In‐situ Mineral Resources Inclusive of Mineral Reserves as at December 31, 2019
Measured and Indicated Inferred
Oxide Cut‐off Grade Tons Au Cont. Tons Au Cont.
(oz/t Au) (M) (oz/t) koz Au (M) (oz/t) koz Au
OXD, OXD‐TR
0.002 22.5 0.013 282 13.1 0.012 153
0.0025 22.5 0.013 282 13.1 0.012 153
0.003 22.5 0.013 282 13.1 0.012 153
0.0035 22.3 0.013 281 13.1 0.012 153
0.004 22.0 0.013 280 13.0 0.012 152
0.0045 21.4 0.013 278 12.8 0.012 151
0.005 20.5 0.013 273 12.5 0.012 150
0.006 17.6 0.015 257 11.4 0.013 144
0.007 14.7 0.016 238 9.9 0.014 134
NOX, NOX‐TR
0.004 41.4 0.018 759 12.9 0.015 196
0.005 40.3 0.019 754 12.8 0.015 196
0.0053 39.8 0.019 752 12.8 0.015 196
0.006 38.5 0.019 744 12.7 0.015 196
0.0065 37.6 0.020 738 12.7 0.015 195
0.007 36.6 0.020 732 12.5 0.016 194
0.0075 35.3 0.020 723 12.3 0.016 193
0.008 34.1 0.021 713 12.1 0.016 191
0.0085 32.7 0.021 701 11.7 0.016 188
0.009 31.0 0.022 687 11.1 0.016 183
0.0095 29.0 0.023 668 10.4 0.017 176
Note: Mineral resources inclusive of mineral reserves.

MESQUITE GOLD MINE, CALIFORNIA, U.S.A. TECHNICAL REPORT ON THE MESQUITE GOLD MINE, CALIFORNIA, U.S.A.
P a g e | 14‐23
27/04/2020
Base case cut‐off grade for OXD and OXD‐TR is 0.0025 oz/t Au and 0.0053 oz/t Au for NOX and NOX‐TR.
Mineral resources, exclusive of mineral reserves, are generated by removing the various reserve pushbacks designed from the ultimate resource pit shell and calculating the remaining resources above the cut‐off limits. Mineral resources, exclusive of mineral reserves, are listed in Table 14‐9 with metric conversions provided in Table 14‐10.

MESQUITE GOLD MINE, CALIFORNIA, U.S.A. TECHNICAL REPORT ON THE MESQUITE GOLD MINE, CALIFORNIA, U.S.A.
P a g e | 14‐24
27/04/2020
Table 14‐9: Estimate of In‐situ Mineral Resources Exclusive of Mineral Reserves as at Dec 31, 2019
Measured Indicated Measured and Indicated Inferred
Type COG Tons Au Cont. Tons Au Cont. Tons Au Cont. Tons Au Cont.
(oz/t) (kt) (oz/t) koz Au (kt) (oz/t) koz Au (kt) (oz/t) koz Au (kt) (oz/t) koz Au
OXD, OXD‐TR 0.0025 ‐ ‐ ‐ 9,373 0.012 110 9,373 0.012 110 11,855 0.012 139
NOX, NOX‐TR 0.0053 22 0.021 0 16,702 0.017 291 16,724 0.017 292 11,571 0.015 176
Combined ‐ 22 0.021 0 26,074 0.015 401 26,096 0.015 402 23,426 0.013 315 Mineral resources restricted between December 31, 2019 topographic surface and ultimate resource limiting pit shell based on a gold price of $1500
per ounce, mining cost of $1.45, processing cost of $2.05.
OXD and OXD/TR have an assumed recovery of 75% and cut‐off grade of 0.0025 oz/t. NOX and NOX‐TR have an assumed recovery of 35% and cut‐
off grade of 0.0053 oz/t. Ali Shahkar P.Eng. is the QP responsible for the in‐situ mineral resource estimation.
Table 14‐10: Estimate of In‐situ Mineral Resources Exclusive of Mineral Reserves as at Dec 31, 2019 (metric)
Measured Indicated Measured and Indicated Inferred
Type COG Tonnes Au Cont. Tonnes Au Cont. Tonnes Au Cont. Tonnes Au Cont.
(g/t) (kt) (g/t) Koz Au (kt) (g/t) Koz Au (kt) (g/t) Koz Au (kt) (g/t) Koz Au
OXD, OXD‐TR 0.09 ‐ ‐ ‐ 8,501 0.40 110 8,501 0.40 110 10,753 0.40 139
NOX, NOX‐TR 0.18 20 0.73 0 15,148 0.60 291 15,168 0.60 292 10,495 0.52 176
Combined ‐ 20 0.73 0 23,649 0.53 401 23,669 0.53 402 21,247 0.46 315 Mineral resources restricted between December 31, 2019 topographic surface and ultimate resource limiting pit shell based on a gold price of $1500
per ounce, mining cost of $1.45, processing cost of $2.05.
OXD and OXD/TR have an assumed recovery of 75% and cut‐off grade of 0.09 g/t. NOX and NOX‐TR have an assumed recovery of 35% and cut‐off
grade of 0.18 g/t. Ali Shahkar P.Eng. is the QP responsible for the in‐situ mineral resource estimation.

MESQUITE GOLD MINE, CALIFORNIA, U.S.A. TECHNICAL REPORT ON THE MESQUITE GOLD MINE, CALIFORNIA, U.S.A.
P a g e | 14‐25
27/04/2020
14.2 Mineral Resource Estimate of Waste Dumps
14.2.1 Introduction
This section of the report describes the approach used to estimate gold resources in several of the waste dump areas at the Mesquite mine. Although these are referred to as “waste” dumps, much of the material located in these dumps is mineralized to some extent. What may have been considered waste during previous mining operations under lower gold prices is now considered amenable to heap leach extraction in today’s gold price environment. The six waste dump areas that contain mineral resources described in this report are referred to as Brownie, Big Chief, LP4, OM250, Vista and VE2‐S.
14.2.2 Sample Data
In the spring of 2019, Equinox initiated a reverse circulation (RC) drilling program to test the gold grades in eight waste dump areas located on the Mesquite property.
The first phase of this drilling was completed in July 2019 with a total of 835 holes and a cumulative total of 128,730 ft of drilling. Individual holes averaged 154 ft long and ranged from a minimum of 40 ft long to a maximum of 650 ft. This RC drilling program was conducted by a drilling contractor, and all drilled intervals were sampled and analyzed at an independent laboratory (American Assay Laboratories located in Reno, Nevada). All holes in the program are vertically oriented and are generally spaced on a nominal 100‐ft grid pattern. In some isolated locations, drill holes are spaced on a 200‐ft (or more) grid pattern. Samples were collected on 5‐ft intervals and analyzed for total gold content using a fire assaying method. Every fourth sample (20‐ft intervals) was also analyzed for cyanide soluble gold and sulphur percentages.
The distribution of holes from the initial phase of waste dump drilling is shown in Figure 14‐14. Although drilling occurred in eight locations, only six waste dump areas have sufficient drilling to support estimates of mineral resources. These are identified by the coloured areas in Figure 14‐14.
In the fall of 2019, Equinox continued with a second phase of RC drilling on the Big Chief waste dump area with an additional 251 vertical holes spaced at 50 ft and 100 ft intervals. For this phase, the drilling was conducted by mine personnel using a rig purchased by the operation. Unfortunately, the sampling process was different in this second program, and samples were not collected and analyzed in the same consistent manner as was done in phase one. Of the 32,525 ft of drilling completed during the second phase, 73% of the drilled intervals were sampled and analyzed at the mine lab using a hot cyanide technique, and only 44% of this drilling was analyzed with the fire assay method for total gold content.
The hot cyanide method provides only generalized results with very poor precision and accuracy that cannot be relied on to support the estimation of gold resources in the waste dumps. The spatial distribution of available fire assay data (for total gold content) from the second phase of drilling is considered too variable and inconsistent to be used for mineral resource estimation purposes. Therefore, the results from the second phase of waste dump drilling has been excluded from use in the estimation of mineral resources in the waste dumps.

MESQUITE GOLD MINE, CALIFORNIA, U.S.A. TECHNICAL REPORT ON THE MESQUITE GOLD MINE, CALIFORNIA, U.S.A.
P a g e | 14‐26
27/04/2020
Equinox provided a series of 3D domains that represent the volumes of the waste dumps located above the original topographic surface. In 2019, Equinox began removing mineralized material from several of the waste dumps. These dumps have been clipped to the year‐end topographic surface so that dump volumes are reported as of December 31, 2019.
Figure 14‐14: Plan View Showing Drill Holes in Waste Dump Areas
14.2.3 Approach to Developing the Waste Dump Resource Block Model
The original 5‐ft sample length was retained as composites for estimation into model blocks measuring 50 x 50 x 30 ft (l x w x h). The proportion of model blocks located inside the 3D waste dump domains are coded in each model block. Estimates for total gold are made in model blocks using ordinary kriging (OK). The search range is more extensive laterally (X and Y directions) and is limited in the vertical direction; this approach mimics the stacking of the waste dumps in lifts where the mixing of material is minimal in the vertical dimension. For comparison purposes, additional estimates for total gold content were also generated using the inverse distance weighted (IDW) and nearest neighbour (NN) interpolation methods.
The effects of potentially anomalous high‐grade gold samples are controlled using a combination of top‐cutting and outlier limitation; this restricts the distance of influence of samples above a

MESQUITE GOLD MINE, CALIFORNIA, U.S.A. TECHNICAL REPORT ON THE MESQUITE GOLD MINE, CALIFORNIA, U.S.A.
P a g e | 14‐27
27/04/2020
defined grade threshold. These measures have resulted in a 7% reduction in contained gold in the waste dump block model.
The estimates for total gold in the block model was validated using a combination of visual and statistical methods to ensure it is an appropriate representation of the underlying sample data.
In addition to the estimation of total gold in the block model, ratio estimates were also calculated for cyanide soluble gold to total gold content by fire assaying (AuCN:AuFA). This provides an indication of the leaching characteristics of the rock in the waste dumps. The ratio of AuCN to AuFA is calculated in drill hole samples, and these ratios are estimated in model blocks using OK. This ratio model was also validated using a combination of visual and statistical methods.
Blocks in the model are included in the Inferred category when they are within a maximum distance of 200 ft from a drill hole. Areas delineated by drilling on a regular 100‐ft pattern are included in the Indicated category. It should be noted that the approach used to evaluate the mineral resource potential for these waste dump areas does not assume much selectivity at a cut‐off grade. Instead, large volumes of material are assumed to be transported from the waste dumps to the leach pads. Using this approach, we can assume material to be in the two mineral resource categories described here.
14.2.4 Estimate of Waste Dump Mineral Resources
A tonnage factor of 17.64 cubic feet per ton, provided by the mine personnel, was used to calculate mineral resource tons from the model. The estimate of mineral resources inclusive of mineral reserves in the waste dumps is shown at various cut‐off thresholds for comparison purposes in Table 14‐11. The base case cut‐off grade of 0.004 oz/t gold, used during mining of waste dump material, is highlighted in the table. Also, the projected AuCN to AuFA ratios are included to provide some information with respect to leach recoveries.
The estimate of mineral resources inclusive of mineral reserves in the individual waste dump areas is shown in Table 14‐12 (for Indicated category) and Table 14‐13 (for Inferred category) at a series of total gold cut‐off grades for comparison purposes. The base case cut‐off grade of 0.004 oz/t gold is highlighted in each of the mineral resource tables.
The extent of the mineral resources at a 0.004 oz/t Au cut‐off grade is shown in The base case cut‐off grade of waste dump mineral resources is 0.004 oz/t gold. The leach recovery of waste dump mineral resources is assumed to be 75%. Robert Sim, P.Geo. is responsible for the estimates of waste dump mineral resources.
Figure 14‐15.

MESQUITE GOLD MINE, CALIFORNIA, U.S.A. TECHNICAL REPORT ON THE MESQUITE GOLD MINE, CALIFORNIA, U.S.A.
P a g e | 14‐28
27/04/2020
Table 14‐11: Estimate of Waste Dump Mineral Resources Inclusive of Mineral Reserves
Cut‐off Indicated Inferred
AuFA (oz/t)
Tons AuFA Cont. Ratio Tons AuFA Cont. Ratio
(kt) (oz/t) Au AuCN/AuFA (kt) (oz/t) Au AuCN/AuFA (koz) (koz)
0.002 28,547 0.0044 126 0.83 70,825 0.0042 297 0.83
0.003 19,101 0.0056 107 0.78 44,351 0.0054 239 0.78
0.004 Base Case
13,080 0.0068 89 0.73 29,134 0.0067 195 0.72
0.005 9,498 0.0078 74 0.69 20,483 0.0079 162 0.67
0.006 6,707 0.009 60 0.65 14,794 0.009 133 0.64
0.007 4,641 0.0103 48 0.62 11,117 0.0099 110 0.61
0.008 3,406 0.0115 39 0.59 8,196 0.011 90 0.59
0.009 2,443 0.0129 32 0.58 5,888 0.0122 72 0.58
0.01 1,876 0.0141 26 0.57 4,377 0.0133 58 0.57 The base case cut‐off grade of waste dump mineral resources is 0.004 oz/t gold. The leach recovery of waste dump
mineral resources is assumed to be 75%. Robert Sim, P.Geo. is responsible for the estimates of waste dump
mineral resources.

MESQUITE GOLD MINE, CALIFORNIA, U.S.A. TECHNICAL REPORT ON THE MESQUITE GOLD MINE, CALIFORNIA, U.S.A.
P a g e | 14‐29
27/04/2020
Figure 14‐15: Plan View Showing the Distribution of Waste Dump Mineral Resources Inclusive of Mineral Reserves by Class

MESQUITE GOLD MINE, CALIFORNIA, U.S.A. TECHNICAL REPORT ON THE MESQUITE GOLD MINE, CALIFORNIA, U.S.A.
P a g e | 14‐30
27/04/2020
Table 14‐12: Estimate of Indicated Mineral Resources Inclusive of Mineral Reserves by Waste Dump Area
Cut‐off Tons AuFA Cont.Au Ratio Tons AuFA Cont.Au Ratio Tons AuFA Cont.Au Ratio
AuFA (oz/t)
(kt) (oz/t) (koz) AuCN/AuFA (kt) (oz/t) (koz) AuCN/AuFA (kt) (oz/t) (koz) AuCN/AuFA
Waste Dump Area1 Big Chief Waste Dump Area2 Brownie Waste Dump Area3 LP4
0.002 18,846 0.0037 70 0.88 110 0.0048 0.5 0.95 3,916 0.0089 35 0.51
0.003 10,962 0.0048 53 0.86 35 0.0108 0.4 0.96 3,912 0.0089 35 0.51
0.004 Base Case
6,673 0.0060 40 0.83 15 0.0210 0.3 0.95 3,861 0.0090 35 0.51
0.005 4,424 0.0071 31 0.82 14 0.0223 0.3 0.95 3,742 0.0091 34 0.51
0.006 2,641 0.0084 22 0.79 14 0.0223 0.3 0.95 3,346 0.0096 32 0.51
0.007 1,572 0.0101 16 0.77 10 0.0295 0.3 0.91 2,690 0.0105 28 0.51
0.008 1,039 0.0117 12 0.74 7 0.0379 0.3 0.91 2,153 0.0114 25 0.50
0.009 768 0.0130 10 0.71 7 0.0381 0.3 0.91 1,532 0.0128 20 0.49
0.010 600 0.0141 8 0.70 4 0.0565 0.2 0.89 1,162 0.0140 16 0.49
Waste Dump Area4 OM250 Waste Dump Area5 VE2‐S Waste Dump Area6 Vista
0.002 2,490 0.0034 8.0 0.87 2,651 0.0037 10 0.86 534 0.0058 3 0.64
0.003 1,746 0.0040 7.0 0.87 1,950 0.0043 8 0.84 496 0.0061 3 0.63
0.004 Base Case
929 0.0048 4.0 0.86 1,249 0.0051 6 0.83 354 0.0073 3 0.62
0.005 399 0.0059 2.0 0.86 672 0.006 4 0.82 248 0.0088 2 0.61
0.006 185 0.0070 1.0 0.87 329 0.007 2 0.83 192 0.0098 2 0.61
0.007 70 0.0086 0.6 0.90 171 0.008 1 0.82 129 0.0117 2 0.59
0.008 48 0.0093 0.4 0.90 82 0.009 1 0.81 77 0.0149 1 0.57
0.009 34 0.0098 0.3 0.90 34 0.0105 0.4 0.77 68 0.0158 1 0.55
0.010 25 0.0101 0.3 0.91 20 0.0116 0.2 0.73 64 0.0162 1 0.54
The base case cut‐off grade of waste dump mineral resources is 0.004 oz/t gold. The leach recovery of waste dump mineral resources is assumed to
be 75%. Robert Sim, P.Geo. is responsible for the estimates of waste dump mineral resources.

MESQUITE GOLD MINE, CALIFORNIA, U.S.A. TECHNICAL REPORT ON THE MESQUITE GOLD MINE, CALIFORNIA, U.S.A.
P a g e | 14‐31
27/04/2020
Table 14‐13: Estimate of Inferred Mineral Resources Inclusive of Mineral Reserves by Waste Dump Area
Cut‐off Tons AuFA Cont.Au Ratio Tons AuFA Cont.Au Ratio Tons AuFA Cont.Au Ratio
AuFA (oz/t) (kt) (oz/t) (koz) AuCN/AuFA (kt) (oz/t) (koz) AuCN/AuFA (kt) (oz/t) (koz) AuCN/AuFA
Waste Dump Area1 Big Chief Waste Dump Area2 Brownie Waste Dump Area3 LP4
0.002 29,403 0.0037 109 0.87 8,773 0.0030 26 0.94 9,006 0.0088 79 0.53
0.003 17,358 0.0049 85 0.85 3,470 0.0046 16 0.92 8,994 0.0088 79 0.53
0.004 Base Case
11,055 0.0059 65 0.82 1,509 0.0067 10 0.92 8,921 0.0088 79 0.53
0.005 7,254 0.0069 50 0.80 829 0.0088 7 0.91 8,733 0.0089 78 0.53
0.006 4,363 0.0082 36 0.78 549 0.0108 6 0.90 8,017 0.0093 75 0.53
0.007 2,731 0.0095 26 0.75 420 0.0123 5 0.89 6,802 0.0099 67 0.53
0.008 1,798 0.0108 19 0.72 319 0.0139 4 0.88 5,285 0.0107 57 0.52
0.009 1,331 0.0118 16 0.69 216 0.0168 4 0.88 3,786 0.0118 45 0.51
0.010 1,037 0.0126 13 0.67 157 0.0197 3 0.87 2,745 0.0128 35 0.51
Waste Dump Area4 OM250 Waste Dump Area5 VE2‐S Waste Dump Area6 Vista
0.002 10,315 0.0027 28 0.90 9,000 0.0031 28 0.88 4,328 0.0058 25 0.65
0.003 5,111 0.0033 17 0.88 5,378 0.0038 20 0.85 4,041 0.0061 25 0.65
0.004 Base Case
1,365 0.0043 6 0.88 2,818 0.0045 13 0.83 3,466 0.0066 23 0.65
0.005 230 0.0058 1 0.87 947 0.0055 5 0.83 2,490 0.0076 19 0.65
0.006 70 0.0076 1 0.89 259 0.0068 2 0.82 1,536 0.0092 14 0.64
0.007 31 0.0096 0.3 0.87 105 0.0079 1 0.80 1,030 0.0108 11 0.63
0.008 27 0.0100 0.3 0.86 38 0.0095 0.4 0.80 730 0.0124 9 0.61
0.009 23 0.0104 0.2 0.86 23 0.0105 0.2 0.76 510 0.0143 7 0.60
0.010 18 0.0107 0.2 0.87 16 0.0111 0.2 0.73 403 0.0157 6 0.58
The base case cut‐off grade of waste dump mineral resources is 0.004 oz/t gold. The leach recovery of waste dump mineral resources is
assumed to be 75%. Robert Sim, P.Geo. is responsible for the estimates of waste dump mineral resources.

MESQUITE GOLD MINE, CALIFORNIA, U.S.A. TECHNICAL REPORT ON THE MESQUITE GOLD MINE, CALIFORNIA, U.S.A.
P a g e | 14‐32
27/04/2020
Table 14‐14 lists mineral resources exclusive of mineral reserves.
Table 14‐14: Estimate of Waste Dump Mineral Resources Exclusive of Mineral Reserves
Cut‐off AuFA
Indicated Inferred
(oz/t) Tons AuFA Cont. Ratio Tons AuFA Cont. Ratio (kt) (oz/t) Au AuCN/AuFA (kt) (oz/t) Au AuCN/AuFA (koz) (koz)
0.002 20,617 0.0032 66 0.88 70,825 0.0042 297 0.83
0.003 11,485 0.0041 47 0.85 44,351 0.0054 239 0.78
0.004 Base Case
5,794 0.0052 30 0.83 29,134 0.0067 195 0.72
0.005 2,868 0.0064 18 0.79 20,483 0.0079 162 0.67
0.006 1,451 0.0077 11 0.74 14,794 0.0090 133 0.64
0.007 791 0.0092 7 0.71 11,117 0.0099 110 0.61
0.008 432 0.0110 5 0.67 8,196 0.0110 90 0.59
0.009 259 0.0129 3 0.64 5,888 0.0122 72 0.58
0.010 187 0.0144 3 0.63 4,377 0.0133 58 0.57 The base case cut‐off grade of waste dump mineral resources is 0.004 oz/t gold. The leach recovery of waste dump
mineral resources is assumed to be 75%. Robert Sim, P.Geo. is responsible for the estimates of waste dump
mineral resources.
14.2.5 Conclusions and Comments on Waste Dump Mineral Resources
The waste dump areas that have been tested to date by RC drilling outline an Indicated mineral resource inclusive of mineral reserves of 13M tons at a grade of 0.007 oz/t total gold containing 89 thousand ounces of gold plus an Inferred mineral resource of 29M tons at a grade of 0.007 oz/t total gold containing 195 thousand ounces of gold.
The estimate of AuCN to AuFA ratios generally range from 0.60 to 0.85 for mineral resources at a 0.004 oz/t Au cut‐off grade. This may be an indication of the projected leach recoveries for this material. It is assumed that all dump material is considered to be “oxidized” material that is amenable to cyanide leaching. The AuCN to AuFA ratio estimates tend to support this assumption.
The projected cut‐off grade of these mineral resources is 0.004 oz/t Au. The mineral resource becomes “patchy” at higher cut‐off grades. At higher cut‐off thresholds, most of the waste dumps at VE2‐S, OM250, Brownie and parts of Big Chief do not appear to be economically viable.
Mineral resources are classified relative to the distance from drilling. Not all areas of the waste dumps could be accessed for drilling (primarily the slopes could not be drilled for safety reasons). It is likely that additional mineral resources exist in these undrilled areas. Currently, mineral resources in the Inferred category extend for a distance of 200 ft from current drilling.
The drill hole spacing of the waste dumps is not designed for small‐ to medium‐scale selectivity during mining. Some areas, such as the central part of the Big Chief waste dump, have higher grade material that is overlain by 100 to 120 ft of essentially barren waste. These areas have been

MESQUITE GOLD MINE, CALIFORNIA, U.S.A. TECHNICAL REPORT ON THE MESQUITE GOLD MINE, CALIFORNIA, U.S.A.
P a g e | 14‐33
27/04/2020
evaluated by mine engineering personnel, and they feel it is viable to remove the barren material in order to extract the underlying mineralized resources. Therefore, we feel that the mineral resources presented here exhibit reasonable prospects for eventual economic extraction.
In 2019, portions of the Big Chief waste dump were further evaluated with a second phase of drilling. Less than one half of the drilled intervals were sampled and analyzed for total gold content. Although the results of the second phase of drilling are similar to proximal holes from the first phase of drilling, the spatial distribution of sample data from phase two is patchy and irregular in many of these areas and, as a result, is considered insufficient to support a mineral resource estimation in the waste dumps. Therefore, the results of this second phase of drilling have not been included.
14.3 In‐situ and Waste Dump Mineral Resources
Mineral Resources at Mesquite are comprised of in‐situ resources (as in previous years) and the newly added waste dump resources.
The in‐situ estimated mineral resources have been generated for year‐end 2019 and represent the material located between the surveyed topographic surface as of December 31, 2019, excluding any surface stockpiles and the ultimate resource limiting pit shell generated in March of 2020. The resource limiting ultimate pit shell is derived using an assumed gold price of $1,500 per ounce, 2019 budget operating costs and metallurgical recoveries of 75% for OXD/OXD‐TR and 35% for NOX‐NOX‐TR material.
Waste dump resources are reported at a cut‐off grade of 0.004 oz/t gold, which is currently used for mining of waste dump material. The mineral resources contained within the resource limiting ultimate pit shell exhibit reasonable prospects for eventual economic extraction as required under NI 43‐101.
The mineral resources, inclusive of mineral reserves, are listed in Table 14‐15 with metric conversions are provided in Table 14‐16. Resources have been segregated based on oxide type. The base case cut‐off grade for OXD/OXD‐TR material is 0.0025 oz/t Au, 0.0053 oz/t Au for NOX/NOX‐TR material and 0.004 oz/t Au for the Waste Dump material. Note that the previous cut‐off grades were 0.0039 oz/t Au for oxide and 0.0084 oz/t Au for transition and sulphide resources based on the previous oxide categories.

MESQUITE GOLD MINE, CALIFORNIA, U.S.A. TECHNICAL REPORT ON THE MESQUITE GOLD MINE, CALIFORNIA, U.S.A.
P a g e | 14‐34
27/04/2020
Table 14‐15: Estimate of Mineral Resources Inclusive of Mineral Reserves as at Dec 31, 2019
Measured Indicated Measured and Indicated Inferred
Type COG Tons Au Cont. Tons Au Cont. Tons Au Cont. Tons Au Cont.
(oz/t) (kt) (oz/t) koz Au (kt) (oz/t) koz Au (kt) (oz/t) koz Au (kt) (oz/t) koz Au
OXD, OXD‐TR 0.0025 6 0.027 0 22,528 0.013 282 22,534 0.013 282 13,142 0.012 153
NOX, NOX‐TR 0.0053 293 0.032 9 39,545 0.019 743 39,837 0.019 752 12,813 0.015 196
Waste Dump 0.004 ‐ ‐ ‐ 13,080 0.007 89 13,080 0.007 89 29,134 0.007 195
Combined ‐ 298 0.032 9 75,153 0.015 1,113 75,451 0.015 1,123 55,090 0.010 544
Mineral resources restricted between December 31, 2019 topographic surface and ultimate resource limiting pit shell based on a gold price of $1500
per ounce, mining cost of $1.45, processing cost of $2.05.
OXD and OXD/TR have an assumed recovery of 75% and cut‐off grade of 0.0025 oz/t. NOX and NOX‐TR have an assumed recovery of 35% and cut‐
off grade of 0.0053 oz/t.
Waste Dump material have an assumed recovery of 75% and cut‐off grade of 0.004 oz/t.
Ali Shahkar P.Eng. is the QP responsible for the in‐situ mineral resource estimation
Robert Sim, P.Geo. is the QP responsible for the waste dump mineral resource estimation.
Table 14‐16: Estimate of Mineral Resources Inclusive of Mineral Reserves as at Dec 31, 2019 (metric)
Measured Indicated Measured and Indicated Inferred
Type COG Tonnes Au Cont. Tonnes Au Cont. Tonnes Au Cont. Tonnes Au Cont.
(g/t) (kt) (g/t) koz Au (kt) (g/t) koz Au (kt) (g/t) koz Au (kt) (g/t) koz Au
OXD, OXD‐TR 0.09 5 0.94 0 20,433 0.43 282 20,438 0.43 282 11,920 0.40 153
NOX, NOX‐TR 0.18 265 1.08 9 35,867 0.64 743 36,133 0.65 752 11,622 0.52 196
Waste Dump 0.14 ‐ ‐ ‐ 11,864 0.23 89 11,864 0.23 89 26,425 0.23 195
Combined ‐ 271 1.08 9 68,164 0.51 1,113 68,434 0.51 1,123 49,966 0.34 544
Mineral resources restricted between December 31, 2019 topographic surface and ultimate resource limiting pit shell based on a gold price of $1500
per ounce, mining cost of $1.45, processing cost of $2.05.
OXD and OXD/TR have an assumed recovery of 75% and cut‐off grade of 0.09 g/t. NOX and NOX‐TR have an assumed recovery of 35% and cut‐off
grade of 0.18 g/t.
Waste Dump material have an assumed recovery of 75% and cut‐off grade of 0.14 g/t.
Ali Shahkar P.Eng. is the QP responsible for the in‐situ mineral resource estimation.
Robert Sim, P.Geo. is the QP responsible for the waste dump mineral resource estimation.
MESQUITE GOLD MINE, CALIFORNIA, U.S.A. TECHNICAL REPORT ON THE MESQUITE GOLD MINE, CALIFORNIA, U.S.A.
P a g e | 14‐35
27/04/2020
There are no known factors related to mining, metallurgical, infrastructure, environmental, permitting, legal, title, taxation, socio‐economic, marketing, or political issues which could materially affect either the in situ or waste dump mineral resource. The eastern extent of the mineral resource, referred to as the Rainbow area, encroaches on an existing public roadway and full extraction of the full resource in the area would require moving the existing road. There are no known reasons that full access to the resource in this area could not be achieved in the future. It is reasonable to expect that a majority of resources in the Inferred category could be upgraded to Indicated or Measured resources with further exploration.
Mineral resources, exclusive of mineral reserves, are generated by removing the various reserve pushbacks designed from the ultimate resource pit shell and calculating the remaining resources above the cut‐off limits. Mineral resources, exclusive of mineral reserves, are listed in Table 14‐17 with metric conversions provided in Table 14‐18.

MESQUITE GOLD MINE, CALIFORNIA, U.S.A. TECHNICAL REPORT ON THE MESQUITE GOLD MINE, CALIFORNIA, U.S.A.
P a g e | 14‐36
27/04/2020
Table 14‐17 : Estimate of Mineral Resources Exclusive of Mineral Reserves as at Dec 31, 2019
Measured Indicated Measured and Indicated Inferred
Type COG Tons Au Cont. Tons Au Cont. Tons Au Cont. Tons Au Cont.
(oz/t) (kt) (oz/t) koz Au (kt) (oz/t) koz Au (kt) (oz/t) koz Au (kt) (oz/t) koz Au
OXD, OXD‐TR 0.0025 ‐ ‐ ‐ 9,373 0.012 110 9,373 0.012 110 11,855 0.012 139
NOX, NOX‐TR 0.0053 22 0.021 0 16,702 0.017 291 16,724 0.017 292 11,571 0.015 176
Waste Dump 0.004 ‐ ‐ ‐ 5,794 0.005 30 5,794 0.005 30 29,134 0.007 195
Combined ‐ 22 0.021 0 31,868 0.014 432 31,890 0.014 432 52,560 0.010 510
Mineral resources restricted between December 31, 2019 topographic surface and ultimate resource limiting pit shell based on a gold price of $1500
per ounce, mining cost of $1.45, processing cost of $2.05.
OXD and OXD/TR have an assumed recovery of 75% and cut‐off grade of 0.0025 oz/t. NOX and NOX‐TR have an assumed recovery of 35% and cut‐
off grade of 0.0053 oz/t.
Waste Dump material have an assumed recovery of 75% and cut‐off grade of 0.004 oz/t.
Ali Shahkar P.Eng. is the QP responsible for the in‐situ mineral resource estimation.
Robert Sim, P.Geo. is the QP responsible for the waste dump mineral resource estimation.
Table 14‐18: Estimate of Mineral Resources Exclusive of Mineral Reserves as at Dec 31, 2019 (metric)
Measured Indicated Measured and Indicated Inferred
Type COG Tonnes Au Cont. Tonnes Au Cont. Tonnes Au Cont. Tonnes Au Cont.
(oz/t) (kt) (g/t) koz Au (kt) (g/t) koz Au (kt) (g/t) koz Au (kt) (g/t) koz Au
OXD, OXD‐TR 0.09 ‐ ‐ ‐ 8,501 0.40 110 8,501 0.40 110 10,753 0.40 139
NOX, NOX‐TR 0.18 20 0.73 0 15,148 0.60 291 15,168 0.60 292 10,495 0.52 176
Waste Dump 0.14 ‐ ‐ ‐ 5,255 0.18 30 5,255 0.18 30 26,425 0.23 195
Combined ‐ 20 0.73 0 28,904 0.46 432 28,924 0.46 432 47,672 0.33 510
Mineral resources restricted between December 31, 2019 topographic surface and ultimate resource limiting pit shell based on a gold price of $1500
per ounce, mining cost of $1.45, processing cost of $2.05.
OXD and OXD/TR have an assumed recovery of 75% and cut‐off grade of 0.09 g/t. NOX and NOX‐TR have an assumed recovery of 35% and cut‐off
grade of 0.18 g/t.
Waste Dump material have an assumed recovery of 75% and cut‐off grade of 0.14 g/t.
Ali Shahkar P.Eng. is the QP responsible for the in‐situ mineral resource estimation.
Robert Sim, P.Geo. is the QP responsible for the waste dump mineral resource estimation.

MESQUITE GOLD MINE, CALIFORNIA, U.S.A. TECHNICAL REPORT ON THE MESQUITE GOLD MINE, CALIFORNIA, U.S.A.
P a g e | 14‐37
27/04/2020
14.4 Comparison with Previous Resource Estimates
The previous resource estimate, presented as of December 31, 2018 (AGP, March 18, 2019: Equinox Technical Report on the Mesquite Gold Mine, by G. Zurowski, B. Davis, N. Robinson, R. Sim, and J. Woods), is compared to the current (December 31, 2019) estimate in Table 14‐19 with metric conversions shown in Table 14‐20.
Table 14‐19: Comparison of Resources Inclusive of Reserves Dec. 31, 2019 vs. Dec. 31, 2018
December 31, 2019 December 31, 2018
Type Tons Au Cont.
Type Tons Au Cont.
(M) (oz/t) koz Au (M) (oz/t) koz Au
Measured
OXD/OXD‐TR Oxide 4.8 0.011 51
NOX/NOX‐TR 0.3 0.032 9 Sx/Tr 2.5 0.018 45
WASTE DUMP
Combined 0.3 0.032 9 7.4 0.013 96
Indicated
OXD/OXD‐TR 22.5 0.013 282 Oxide 93.9 0.011 1,051
NOX/NOX‐TR 39.5 0.019 743 Sx/Tr 104.2 0.017 1,782
WASTE DUMP 13.1 0.007 89
Combined 75.2 0.015 1,113 198.1 0.014 2,833
Measured and Indicated
OXD/OXD‐TR 22.5 0.013 282 Oxide 98.7 0.011 1,106
NOX/NOX‐TR 39.8 0.019 752 Sx/Tr 106.8 0.017 1,825
WASTE DUMP 13.1 0.007 89
Combined 75.5 0.015 1,123 205.5 0.014 2,930
Inferred
OXD/OXD‐TR 13.1 0.012 153 Oxide 10.6 0.009 92
NOX/NOX‐TR 12.8 0.015 196 Sx/Tr 7.5 0.014 104
WASTE DUMP 29.1 0.007 195
Combined 55.1 0.010 544 18.1 0.011 196
Notes: Mineral resources inclusive of mineral reserves
Dec 31, 2018: Cut‐off grade for Oxide is 0.0039 oz/t Au and 0.0084 oz/t Au for Transition and Sulphide
Dec 31, 2019: Cut‐off grade for OXD/OXD‐TR is 0.0025 oz/t Au, NOX/NOX‐TR is 0.0053 oz/t Au and Waste Dump
material is 0.004 oz/t Au

MESQUITE GOLD MINE, CALIFORNIA, U.S.A. TECHNICAL REPORT ON THE MESQUITE GOLD MINE, CALIFORNIA, U.S.A.
P a g e | 14‐38
27/04/2020
Table 14‐20: Comparison of Resources Inclusive of Reserves Dec. 31, 2019 vs. Dec. 31, 2018 (metric)
December 31, 2019 December 31, 2018
Type Tonnes Au Cont.
Type Tonnes Au Cont.
(M) (g/t) koz Au (M) (g/t) koz Au
Measured
OXD/OXD‐TR Oxide 4.4 0.36 51
NOX/NOX‐TR 0.3 1.08 9 Sx/Tr 2.3 0.61 45
WASTE DUMP
Combined 0.3 1.08 9 6.7 0.45 96
Indicated
OXD/OXD‐TR 20.4 0.43 282 Oxide 85.2 0.38 1,051
NOX/NOX‐TR 35.9 0.64 743 Sx/Tr 94.6 0.59 1,782
WASTE DUMP 11.9 0.23 89
Combined 68.2 0.51 1,113 179.7 0.49 2,833
Measured and Indicated
OXD/OXD‐TR 20.4 0.43 282 Oxide 89.5 0.38 1,106
NOX/NOX‐TR 36.1 0.65 752 Sx/Tr 96.8 0.59 1,825
WASTE DUMP 11.9 0.23 89
Combined 68.4 0.51 1,123 186.4 0.49 2,930
Inferred
OXD/OXD‐TR 11.9 0.40 153 Oxide 9.6 0.30 92
NOX/NOX‐TR 11.6 0.52 196 Sx/Tr 6.8 0.48 104
WASTE DUMP 26.4 0.23 195
Combined 50.0 0.34 544 16.4 0.37 196
Notes: Mineral resources inclusive of mineral reserves
Dec 31, 2018: Cut‐off grade for Oxide is 0.134 g/t Au and 0.288 g/t for Transition and Sulphide
Dec 31, 2019: Cut‐off grade for OXD/OXD‐TR is 0.09 g/t Au, NOX/NOX‐TR is 0.18 g/t Au and Waste Dump material is
0.14 g/t Au

MESQUITE GOLD MINE, CALIFORNIA, U.S.A. TECHNICAL REPORT ON THE MESQUITE GOLD MINE, CALIFORNIA, U.S.A.
P a g e | 14‐39
27/04/2020
The 2018 resource estimate was depleted by mining by 12 Mtons (or 173 koz) during 2019. Production was mainly in the VW2, VW3 and VE2 areas and did not reconcile well with the grades estimated in the block model. This led to an evaluation of the resource estimation methodology and parameters especially with respect to the lower portions of the deposit which exhibit tighter controls on the gold mineralization. Overall, Table 14‐19 shows a reduction of 62% in the contained gold within the Measured and Indicated categories and an Increase of 187% in the Inferred category. The changes in the resources can be attributed to the following factors:
Changes in the geologic model, domaining, interpolation parameters, which had great implications in the remaining resources. With the exception the of Brownie area, the remaining resources are located below past production pits and within the lower portions of the deposit where gold mineralization is more tightly controlled by the structures. These changes affected both the grade distribution and classification.
Classification of the resources was adjusted to acknowledge the continuity of gold mineralization specific to the remaining resources. This resulted in ~20 Mt (~290 koz contained Au) to be downgraded from Measured and Indicated categories to Inferred. Approximately 118 Mt (~ 170 koz of contained Au) of previously classified material were dropped from grade interpolation and classification due to the remodelling of the grade zones.
Changes in the oxide characterization categories, which directly affects the gold recoveries assumptions and reporting cut‐off grades. Roughly 13 Mt (~130 koz of contained Au) were previously considered within the Oxide horizon but fall into the NOX‐TR category and are being reported at a higher cut‐off grade. This would also have impacted the resource limiting pit, within which the mineral resources are reported.
Inclusion of the Waste Dump resources. These are the result of the drilling campaign aimed at identifying areas of historical waste material which would make cut‐off grades at current conditions.
Changes in gold price, operating costs and technical parameters are listed below:
2019 2018
Gold Price: $1500/oz $1400/oz Op cost: Mining $1.45/t $1.45/t Process $2.05/t $1.81/t G&A $0.70/t $0.75/t Recovery: 75%OXD/TR 75%Ox
35% NOX/TR 35% Tr, Sul Royalty: 1.9% 1.9% Cut‐off grade: 0.0025 oz/t OXD/TR 0.0039 oz/t Ox,
0.0053 oz/t NOX/TR 0.0084 oz/t Tr,Sul
The comparison of the mineral resources exclusive of the reserves are shown in Table 14‐1 (metric conversion shown in Table 1‐2).

MESQUITE GOLD MINE, CALIFORNIA, U.S.A. TECHNICAL REPORT ON THE MESQUITE GOLD MINE, CALIFORNIA, U.S.A.
P a g e | 14‐40
27/04/2020
Table 14‐1: Comparison of Resources Exclusive of Reserves Dec. 31, 2019 vs. Dec. 31, 2018
December 31, 2019 December 31, 2018
Type Tons Au Cont.
Type Tons Au Cont.
(M) (oz/t) koz Au (M) (oz/t) koz Au
Measured
OXD/OXD‐TR Oxide 4.3 0.010 45
NOX/NOX‐TR Sx/Tr 1.6 0.017 27
WASTE DUMP
Combined 6 0.012 72
Indicated
OXD/OXD‐TR 9.4 0.012 110 Oxide 61.9 0.011 656
NOX/NOX‐TR 16.7 0.017 291 Sx/Tr 73.1 0.016 1,169
WASTE DUMP 5.8 0.005 30
Combined 31.9 0.014 432 135.1 0.014 1,825
Measured and Indicated
OXD/OXD‐TR 9.4 0.012 110 Oxide 66.2 0.011 702
NOX/NOX‐TR 16.7 0.017 292 Sx/Tr 74.8 0.016 1,196
WASTE DUMP 5.8 0.005 30
Combined 31.9 0.014 432 141.1 0.013 1,898
Inferred
OXD/OXD‐TR 11.9 0.012 139 Oxide 9.1 0.009 80
NOX/NOX‐TR 11.6 0.015 176 Sx/Tr 7.5 0.014 104
WASTE DUMP 29.1 0.007 195
Combined 52.6 0.010 510 16.6 0.011 184
Notes: Mineral resources exclusive of mineral reserves
Dec 31, 2018: Cut‐off grade for Oxide is 0.0039 oz/t Au and 0.0084 oz/t Au for Transition and Sulphide
Dec 31, 2019: Cut‐off grade for OXD/OXD‐TR is 0.0025 oz/t Au, NOX/NOX‐TR is 0.0053 oz/t Au and Waste Dump
material is 0.004 oz/t Au

MESQUITE GOLD MINE, CALIFORNIA, U.S.A. TECHNICAL REPORT ON THE MESQUITE GOLD MINE, CALIFORNIA, U.S.A.
P a g e | 14‐41
27/04/2020
Table 1‐2: Comparison of Resources Exclusive of Reserves Dec. 31, 2019 vs. Dec. 31, 2018 (metric)
December 31, 2019 December 31, 2018
Type Tonnes Au Cont.
Type Tonnes Au Cont.
(M) (g/t) koz Au (M) (g/t) koz Au
Measured
OXD/OXD‐TR Oxide 4.4 0.36 45
NOX/NOX‐TR Sx/Tr 2.3 0.61 27
WASTE DUMP
Combined 6.7 0.45 72
Indicated
OXD/OXD‐TR 8.5 0.40 110 Oxide 85.2 0.38 656
NOX/NOX‐TR 15.1 0.60 291 Sx/Tr 94.6 0.59 1,169
WASTE DUMP 5.3 0.18 30
Combined 28.9 0.46 432 179.7 0.49 1,825
Measured and Indicated
OXD/OXD‐TR 8.5 0.40 110 Oxide 89.5 0.38 702
NOX/NOX‐TR 15.2 0.60 292 Sx/Tr 96.8 0.59 1,196
WASTE DUMP 5.3 0.18 30
Combined 28.9 0.46 432 186.4 0.49 1,898
Inferred
OXD/OXD‐TR 10.8 0.40 139 Oxide 9.6 0.30 80
NOX/NOX‐TR 10.5 0.52 176 Sx/Tr 6.8 0.48 104
WASTE DUMP 26.4 0.23 195
Combined 47.7 0.33 510 16.4 0.37 184
Notes: Mineral resources exclusive of mineral reserves
Dec 31, 2018: Cut‐off grade for Oxide is 0.134 g/t Au and 0.288 g/t for Transition and Sulphide
Dec 31, 2019: Cut‐off grade for OXD/OXD‐TR is 0.09 g/t Au, NOX/NOX‐TR is 0.18 g/t Au and Waste Dump material is
0.14 g/t Au
14.5 Recommendations
The following recommendations are provided for mineral resource estimation:
In‐situ Resources
The Brownie Pit area was significantly impacted in terms of reserves by the changes in the resource model. These were caused by loss of material due to re‐interpretation of the Tertiary unit and re‐classification of material into the Inferred category from Indicated. The overall metal content in the area remains close to the previous model (‐6%). Majority of the Inferred material would likely convert to Indicated though drilling and re‐evaluation

MESQUITE GOLD MINE, CALIFORNIA, U.S.A. TECHNICAL REPORT ON THE MESQUITE GOLD MINE, CALIFORNIA, U.S.A.
P a g e | 14‐42
27/04/2020
of the newly interpreted fault and grade shells. To achieve this, the following is recommended:
o small infill drill program to improve the drill spacing on the eastern margins of the area
o better definition of the location of the Brownie fault down to relevant depths o re‐evaluation of the uses of hard boundaries in domaining and re‐evaluation of
the classification based on new interpretations o drilling to try to extend the zone especially towards the north and south. There
are also a few intersections of grade to the west that warrant further investigation, though their depth with respect to potentially economic pits should be considered
This is the first resource estimate to rely on the newly developed oxide characterization categories and approach. This variable has a significant and direct impact on the assumed recoveries and therefore cut‐off grades. It is strongly recommended that:
o Equinox continues to further develop this categorization through the use of the observed data as well as AuFA to AuCN ratios and sulphur data from the new drilling (and historical holes where available)
o carry out testing to confirm and better define the recoveries currently assigned to these categories
Waste Dump Resources
When drilling waste dumps, use fire assays for all samples for total gold content. In addition to this, analyse every fourth sample for cyanide soluble gold content.
RC drill holes in waste dump areas should be spaced on a nominal 100ft spaced pattern

MESQUITE GOLD MINE, CALIFORNIA, U.S.A. TECHNICAL REPORT ON THE MESQUITE GOLD MINE, CALIFORNIA, U.S.A.
P a g e | 15‐1
27/04/2020
15 MINERAL RESERVE ESTIMATES
15.1 Summary
The reserves for the Mesquite Mine are based on the conversion of the Measured and Indicated resources within the current Technical Report mine plan. Measured resources are converted to Proven Reserves and Indicated resources are converted directly to Probable Reserves. The total reserves for the Mesquite Mine are shown in imperial units in Table 15‐1.
The imperial unit statement of reserves are the reserves of record but for ease of use by various parties, the reserves have also been stated in metric units in Table 15‐2. Some variation may exist due to rounding.

MESQUITE GOLD MINE, CALIFORNIA, U.S.A. TECHNICAL REPORT ON THE MESQUITE GOLD MINE, CALIFORNIA, U.S.A.
P a g e | 15‐2
27/04/2020
Table 15‐1: Proven and Probable Reserves (Imperial Units)
Proven Probable Total
Ore Type Tons (kt) Grade (oz/t)
Gold (koz)
Tons (kt) Grade (oz/t)
Gold (koz)
Tons (kt) Grade (oz/t)
Gold (koz)
Oxide 5 0.0275 ‐ 15,166 0.0122 185 15,171 0.0122 185
Transition 44 0.0276 1 2,507 0.0236 59 2,551 0.0237 60
Non‐Oxide 201 0.0370 8 13,168 0.0251 331 13,369 0.0253 339
Total 250 0.0352 9 30,841 0.0186 575 31,091 0.0188 584
Note: This mineral reserve estimate is as of Dec 31, 2019 and is based on the mineral resource estimate dated Dec 31, 2019 for Mesquite Mine by LGGC. The mineral
reserve calculation was completed under the supervision of Gordon Zurowski, P.Eng. of AGP., who is a Qualified Person as defined under NI 43‐101. Mineral
reserves are stated within the final design pit based on a $1,350/oz gold price. The cut‐off grade varied by material type from 0.004 oz/t for oxide and oxide‐
transition and 0.009 oz/t for non‐oxide materials. The mining cost averaged $1.45/t mined, processing costs are $2.05/t ore and G&A was $0.70/t ore placed. The
ore recoveries were 75% for oxide, and 35% for non‐oxide material.
Table 15‐2: Proven and Probable Reserves (Metric Units)
Proven Probable
Total
Ore Type Tonnes (kt)
Grade (g/t)
Gold (koz)
Tonnes (kt)
Grade (g/t)
Gold (koz)
Tonnes (kt)
Grade (g/t)
Gold (koz)
Oxide 5 0.94 ‐ 13,755 0.42 185 13,760 0.37 185
Transition 40 0.95 1 2,274 0.81 59 2,314 0.81 60
Non‐Oxide 183 1.27 8 11,943 0.86 331 12,126 0.87 339
Total 228 1.21 9 27,972 0.64 575 28,200 0.62 584

MESQUITE GOLD MINE, CALIFORNIA, U.S.A. TECHNICAL REPORT ON THE MESQUITE GOLD MINE, CALIFORNIA, U.S.A.
P a g e | 15‐3
27/04/2020
The QP has not identified any known legal, political, environmental, or other risks that would materially affect the potential development of the Mineral Reserves.
15.2 Mining Method and Mining Costs
The Mesquite Mine is an open pit operation using conventional mining equipment. No underground mining is considered for exploitation of the deposits.
All work is based on current mine operating plans generated by Mesquite Mine personnel and verified by AGP except for the Brownie pit which was designed by AGP.
Costs are based on actual operating costs and proposed budgets for the remaining mine life.
The current resource model dated December 31, 2019 is used for all mine design work. Only Measured and Indicated resources were used in the determination of reserves for Mesquite Mine.
The Rainbow area of the Mesquite Mine property was not considered in the statement of reserves.
15.2.1 Geotechnical Considerations
Highwall slope angle criteria vary by area and pit. In general, the steepest walls are on the south side of the property and the shallowest in the northeast. Numerous pit slope stability analyses have been conducted over the various years of mine operation and continue in new areas yet to be opened (Brownie). This includes work from Call & Nicholas (1986), Shepard Miller (1999), C.O. Brawner (1999, 2000), Agra Earth & Environmental (2000), Engineering Analytics (2008, 2009), BGC Engineering Inc. (2013) and Nicklaus Engineering Inc. (2013). The latest work is ongoing with BGC Engineering Inc. on various pit areas.
In general, the inter ramp angles vary from 29 – 42 degrees depending on pit area and wall orientation. This is due to foliation that is parallel to the walls in certain zones.
The tertiary conglomerate gravel (TCG) slopes are also based on thickness of the unit. For thicknesses of less than 60 feet, the inter‐ramp angle for short term slopes can be 34 degrees but flattens to 29 degrees for thicknesses greater than 160 feet.
The various criteria have been loaded into the geologic model for use by the mine staff by lithological unit. This is used for the pit optimization as well as pit design work.
15.2.2 Economic Pit Shell Development
The final pit designs are based on pit shells using Whittle software and verified with the Lerch‐Grossman algorithm in MineSight. The parameters for the pit shells are shown in Table 15‐3.
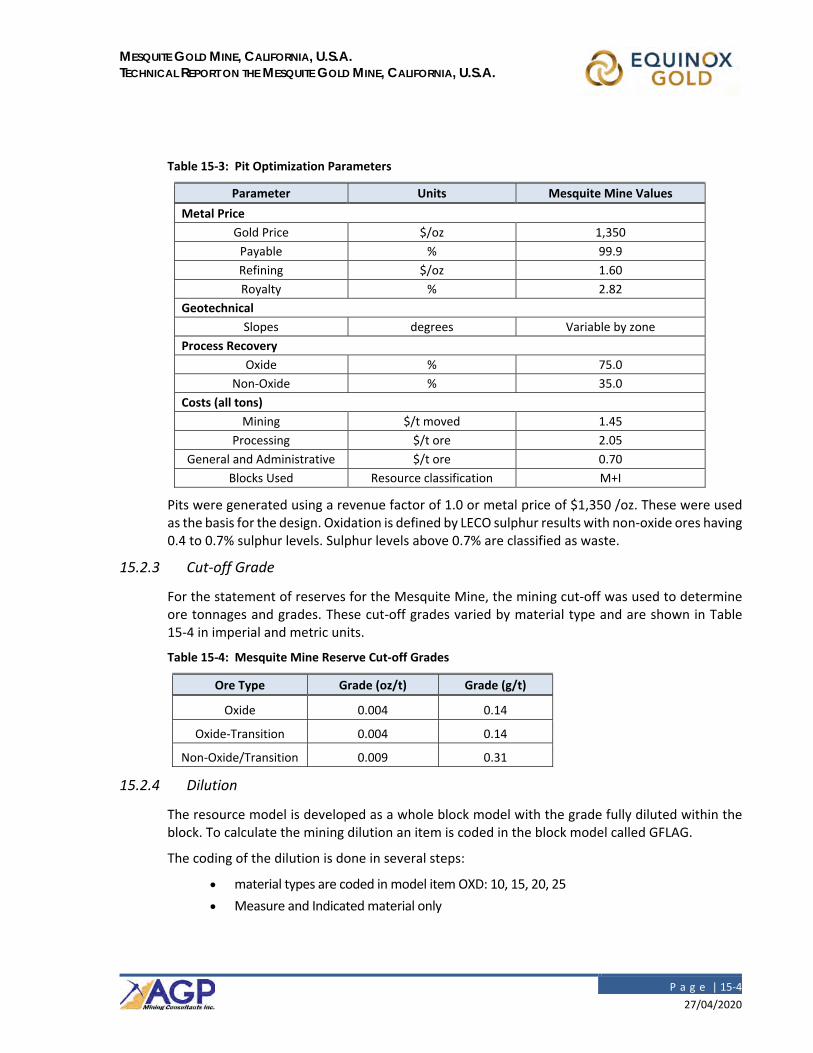
MESQUITE GOLD MINE, CALIFORNIA, U.S.A. TECHNICAL REPORT ON THE MESQUITE GOLD MINE, CALIFORNIA, U.S.A.
P a g e | 15‐4
27/04/2020
Table 15‐3: Pit Optimization Parameters
Parameter Units Mesquite Mine Values
Metal Price
Gold Price $/oz 1,350
Payable % 99.9
Refining $/oz 1.60
Royalty % 2.82
Geotechnical
Slopes degrees Variable by zone
Process Recovery
Oxide % 75.0
Non‐Oxide % 35.0
Costs (all tons)
Mining $/t moved 1.45
Processing $/t ore 2.05
General and Administrative $/t ore 0.70
Blocks Used Resource classification M+I
Pits were generated using a revenue factor of 1.0 or metal price of $1,350 /oz. These were used as the basis for the design. Oxidation is defined by LECO sulphur results with non‐oxide ores having 0.4 to 0.7% sulphur levels. Sulphur levels above 0.7% are classified as waste.
15.2.3 Cut‐off Grade
For the statement of reserves for the Mesquite Mine, the mining cut‐off was used to determine ore tonnages and grades. These cut‐off grades varied by material type and are shown in Table 15‐4 in imperial and metric units.
Table 15‐4: Mesquite Mine Reserve Cut‐off Grades
Ore Type Grade (oz/t) Grade (g/t)
Oxide 0.004 0.14
Oxide‐Transition 0.004 0.14
Non‐Oxide/Transition 0.009 0.31
15.2.4 Dilution
The resource model is developed as a whole block model with the grade fully diluted within the block. To calculate the mining dilution an item is coded in the block model called GFLAG.
The coding of the dilution is done in several steps:
material types are coded in model item OXD: 10, 15, 20, 25
Measure and Indicated material only

MESQUITE GOLD MINE, CALIFORNIA, U.S.A. TECHNICAL REPORT ON THE MESQUITE GOLD MINE, CALIFORNIA, U.S.A.
P a g e | 15‐5
27/04/2020
code all Oxide (10) or Oxide‐Transition (15) blocks equal to, or greater than, 0.004 oz/t as: Ore =1
code all Non‐Oxide (20) and Non‐Oxide Transition (25) blocks equal to, or great than, 0.009 oz/t as: Ore = 2
any material with item Ore = 1 or 2 is ore
This process will have situations where ore blocks are “orphaned” or isolated from the main ore zone, or conversely there will be waste bocks within the main ore zone that would be difficult to separate.
An additional procedure is then run to determine if the waste blocks have 3 or more ore blocks (ORE =1 or 2) surrounding it. If that is the case, the waste block is then coded as ore or GFLAG = 100 at its grade.
Isolated ore blocks (ORE =1 or 2) are queried to determine if they have 3 or more waste blocks surrounding it. If that is the case, the block is then coded to be waste or GFLAG = 0.
Tonnages within the mine schedule use the GFLAG to determine ore from waste.
This process resulted in reduced ore tonnage and contained ounces. The ore tons dropped by 6.9% and the contained ounces dropped by 4.5% indicating a significant number of isolated ore blocks had been eliminated in the dilution calculation.
15.2.5 Pit Design
The detailed pit phase designs at Mesquite Mine are based on the pit optimization shells generated with the current resource model.
Four pit and waste dump areas are considered in the reserves statement:
1. Brownie – one phase
2. Vista East – two phases
3. Vista West – one phase
4. Big Chief Waste dump – two parts
Each pit phase has been designed to accommodate the existing mining fleet. Mining occurs on 30‐foot lifts with catch benches spaced every 60 ft. vertically. The haul roads are 100 ft. in width with a road grade of 10%.
The mine schedule delivers 31.1 million tons of ore grading 0.019 oz/t to the heap leach pad over a current design life of 2.5 years. Waste tonnage totals 120.9 million tons to be placed in various waste rock facilities or backfill in the existing pit workings. The overall strip ratio is 3.89:1.
Mine production is limited to 65 million tons per year under the current mining permit.
15.2.6 Mine Reserves Statement
The reserves for the Mesquite Mine are based on the conversion of the Measured and Indicated resources within the current technical report mine plan. Measured resources are converted to

MESQUITE GOLD MINE, CALIFORNIA, U.S.A. TECHNICAL REPORT ON THE MESQUITE GOLD MINE, CALIFORNIA, U.S.A.
P a g e | 15‐6
27/04/2020
Proven Reserves and Indicated resources are converted directly to Probable Reserves. These were prepared under the supervision of Gordon Zurowski, P.Eng. of AGP, a QP as defined under NI 43‐101, working with the Mesquite Mine Chief Mine Engineer, Julio Gamez.
Cut‐offs for the reserves were based on cut‐offs of 0.004 oz/t for oxide and oxide‐transition material and 0.009 oz/t for non‐oxide material.
This estimate is as of December 31, 2019. The total reserves for the Mesquite Mine are shown in imperial units in Table 15‐5 and Table 15‐6.
Table 15‐5: Proven and Probable Reserves – Summary for Mesquite Mine
Proven Probable Total
Ore Type Tons (kt)
Grade (oz/t)
Gold (koz)
Tons (kt)
Grade (oz/t)
Gold (koz)
Tons (kt)
Grade (oz/t)
Gold (koz)
Oxide 5 0.0275 ‐ 15,166 0.0122 185 15,171 0.0122 185
Transition 44 0.0276 1 2,507 0.0236 59 2,551 0.0237 60
Non‐Oxide 201 0.0370 8 13,168 0.0251 331 13,369 0.0253 339
Total 250 0.0352 9 30,841 0.0186 575 31,091 0.0188 584
Note: This mineral reserve estimate is as of Dec 31, 2019 and is based on the mineral resource estimate dated Dec 31,
2019 for Mesquite Mine by LGGC. The mineral reserve calculation was completed under the supervision of
Gordon Zurowski, P.Eng. of AGP., who is a Qualified Person as defined under NI 43‐101. Mineral reserves are
stated within the final design pit based on a $1,350/oz gold price. The cut‐off grade varied by material type from
0.004 oz/t for oxide and oxide‐transition and 0.009 oz/t for non‐oxide materials. The mining cost averaged
$1.45/t mined, processing costs are $2.05/t ore and G&A was $0.70/t ore placed. The ore recoveries were 75%
for oxide, and 35% for non‐oxide material.

MESQUITE GOLD MINE, CALIFORNIA, U.S.A. TECHNICAL REPORT ON THE MESQUITE GOLD MINE, CALIFORNIA, U.S.A.
P a g e | 15‐7
27/04/2020
Table 15‐6: Proven and Probable Reserves – by Pit and Waste Dump Area
Proven Probable Total
Ore Type Tons (kt)
Grade (oz/t)
Gold (koz)
Tons (kt)
Grade (oz/t)
Gold (koz)
Tons (kt)
Grade (oz/t)
Gold (koz)
Brownie
Oxide ‐ ‐ ‐ 10,282 0.0139 143 10,282 0.0139 143
Transition ‐ ‐ ‐ 215 0.0165 4 215 0.0165 4
Non‐Oxide ‐ ‐ ‐ ‐ ‐ , ‐ ‐ ‐
Total ‐ ‐ ‐ 10,497 0.0139 147 10,497 0.0139 147
Vista East
Oxide 5 0.0275 ‐ 1,082 0.0127 14 1,087 0.0128 14
Transition 44 0.0276 1 2,035 0.0257 52 2,079 0.0257 53
Non‐Oxide 201 0.0370 8 13,110 0.0252 330 13,311 0.0254 338
Total 250 0.0352 9 16,227 0.0244 396 16,477 0.0246 405
Vista West
Oxide ‐ ‐ ‐ 623 0.0102 6 623 0.0102 6
Transition ‐ ‐ ‐ 257 0.0130 3 257 0.0130 3
Non‐Oxide ‐ ‐ ‐ 58 0.0109 1 58 0.0109 1
Total ‐ ‐ ‐ 938 0.0110 10 938 0.0110 10
Big Chief Dump
Oxide ‐ ‐ ‐ 3,179 0.0070 22 3,179 0.0070 22
Transition ‐ ‐ ‐ ‐ ‐ ‐ ‐ ‐ ‐
Non‐Oxide ‐ ‐ ‐ ‐ ‐ ‐ ‐ ‐ ‐
Total ‐ ‐ ‐ 3,179 0.0070 22 3,179 0.0070 22
TOTALS
Oxide 5 0.0275 ‐ 15,166 0.0122 185 15,171 0.0122 185
Transition 44 0.0276 1 2,507 0.0236 59 2,551 0.0237 60
Non‐Oxide 201 0.0370 8 13,168 0.0251 331 13,369 0.0253 339
Total 250 0.0352 9 30,841 0.0186 575 31,091 0.0188 584

MESQUITE GOLD MINE, CALIFORNIA, U.S.A. TECHNICAL REPORT ON THE MESQUITE GOLD MINE, CALIFORNIA, U.S.A.
P a g e | 16‐1
27/04/2020
16 MINING METHODS
16.1 Introduction
The Mesquite Mine is an operating open pit mine with ore processing by heap leaching using a CIC circuit to recover gold. Current mine production is a nominal 178,000 tons per day of total material, including a nominal 50,000 to 68,000 tons per day of ore that is hauled to the leach pad. Total mine production is capped at 65 million tons per year based on the air quality permit. For 2019, gold production was 125,700 ounces.
16.2 Geologic Model
The resource model used for the development of the long‐range plan and the mine reserves was developed by Lions Gate Geological Consulting (LGGC) in Gemcom software. The model has been described in Section 14 of this report. The model was imported into Mine Plan mining software for use by the mining team. The Mine Plan model names are MES10.dat and ME15.dat.
The resource estimate is based on the database from December 2019. The model is in Imperial units with detail in Table 16‐1.
Table 16‐1: Geological Model Details
Framework Description Model Value
X origin (ft) 4,000
Y origin (ft) ‐800
Z origin (ft)(min) ‐290
Number of blocks in X direction 420
Number of blocks in Y direction 326
Number of blocks in Z direction 43
X block size (ft) 50
Y block size (ft) 50
Z block size (ft) 30
The block model contains information on rock type, density, classification, weathering, and gold grade. The resource model is a whole block model and assumed to be fully diluted.
Only Measured and Indicated resources were used for the update of the reserves at Mesquite Mine. All Inferred resources were considered to be waste.
Current resources for Mesquite Mine, with an effective date of December 31, 2019 are shown in Table 16‐2 below.

MESQUITE GOLD MINE, CALIFORNIA, U.S.A. TECHNICAL REPORT ON THE MESQUITE GOLD MINE, CALIFORNIA, U.S.A.
P a g e | 16‐2
27/04/2020
Table 16‐2: Mesquite Mine Resources(inclusive of reserves) – December 31, 2019
Resources as of December 31,2019
Ore Type Ton (Mt) Gold Grade
(oz/t) Contained Gold
(koz)
Measured
Oxide, Oxide Transition 0.0 0.027 0
Non‐Oxide, Non‐ Oxide Transition 0.3 0.032 9
Waste Dump (Oxide) 0.0 0.000 0
Total 0.3 0.032 9
Indicated
Oxide, Oxide Transition 22.5 0.013 282
Non‐Oxide, Non‐ Oxide Transition 39.5 0.019 743
Waste Dump (Oxide) 13.1 0.007 89
Total 75.2 0.015 1,113
Measured + Indicated
Oxide, Oxide Transition 22.5 0.013 282
Non‐Oxide, Non‐ Oxide Transition 39.8 0.019 752
Waste Dump (Oxide) 13.1 0.007 89
Total 75.5 0.015 1,123
Inferred
Oxide, Oxide Transition 13.1 0.012 153
Non‐Oxide, Non‐ Oxide Transition 12.8 0.015 196
Waste Dump (Oxide) 29.1 0.007 195
Total 55.1 0.010 544
Notes: Mineral resources inclusive of mineral reserves.
Cut‐off grade for Oxide, Oxide‐Transition is 0.0025 oz/t Au and 0.0053 oz/t Au and for Non‐Oxide Transition and Non‐
Oxide. Waste dump material has a cut‐off grade of 0.004 oz/t Au.
16.3 Geotechnical Information
Highwall slope angle criteria vary by area and pit. In general, the steepest walls are on the south side of the property and the shallowest in the northeast. Numerous pit slope stability analyses have been conducted over the various years of mine operation and continue in new areas yet to be opened (Brownie). This includes work from Call & Nicholas (1986), Shepard Miller (1999), C.O. Brawner (1999, 2000), Agra Earth & Environmental (2000), Engineering Analytics (2008, 2009), BGC Engineering Inc. (2013), and Nicklaus Engineering Inc. (2013). The latest work is ongoing with BGC Engineering Inc. on various pit areas.
In general, the inter ramp angles vary from 29 to 42 degrees depending on pit area and wall orientation. This is due to foliation present parallel to the walls in certain zones.

MESQUITE GOLD MINE, CALIFORNIA, U.S.A. TECHNICAL REPORT ON THE MESQUITE GOLD MINE, CALIFORNIA, U.S.A.
P a g e | 16‐3
27/04/2020
The tertiary conglomerate gravel (TCG) slopes are also based on thickness of the unit. For thicknesses of less than 60 ft. the inter ramp angle for short term slopes can be 34 degrees but flattens to 29 degrees for thicknesses greater than 160 ft.
The geotechnical consultants have provided detailed information for each pit area. These criteria are based on operating experience at Mesquite Mine and ongoing observations. An example of the information provided to site personnel is shown in Table 16‐3.

MESQUITE GOLD MINE, CALIFORNIA, U.S.A. TECHNICAL REPORT ON THE MESQUITE GOLD MINE, CALIFORNIA, U.S.A.
P a g e | 16‐4
27/04/2020
Table 16‐3: VW2 Slope Criteria

MESQUITE GOLD MINE, CALIFORNIA, U.S.A. TECHNICAL REPORT ON THE MESQUITE GOLD MINE, CALIFORNIA, U.S.A.
P a g e | 16‐5
27/04/2020
The various criteria have been loaded into the geologic model for use by the mine staff by lithological unit. This is used for the pit optimization as well as pit design work.
16.4 Economic Pit Shell Development
The final pit designs are based on pit shells using Whittle and verified with the Lerch‐Grossman procedure in MineSight. The parameters for the pit shells are shown in Table 16‐4.
Table 16‐4: Pit Optimization Parameters
Parameter Units Mesquite Mine Values
Metal Price
Gold Price $/oz 1,350
Payable % 99.9
Refining $/oz 1.60
Royalty % 2.82
Geotechnical
Slopes degrees Variable by zone
Process Recovery
Oxide % 75.0
Oxide‐transition % 75.0
Non‐Oxide % 35.0
Costs (all tons)
Mining $/t moved 1.45
Processing $/t ore 2.05
General and Administrative $/t ore 0.70
Blocks Used Resource classification M+I
Pits were generated using a revenue factor of 1.0 or metal price of $1,350 /oz. These were used as the basis for the final phase designs in each pit area.
The pit optimization utilized metallurgical recoveries of 75% for oxide ores and 35% for non‐oxide ores. Oxidation is defined by LECO sulphur results with non‐oxide ores having 0.4 to 0.7% sulphur. Sulphur levels above 0.7% are classified as waste.
The generated pits showed the Rainbow pit area could be included in the future once appropriate approvals were obtained to continue mining, and the highway was relocated. Currently that material remains in the resource category and has not been considered for reserves. This represents a future opportunity.

MESQUITE GOLD MINE, CALIFORNIA, U.S.A. TECHNICAL REPORT ON THE MESQUITE GOLD MINE, CALIFORNIA, U.S.A.
P a g e | 16‐6
27/04/2020
16.5 Dilution Calculation
The resource model is developed as a whole block model with the grade fully diluted within the block. To calculate the mining dilution an item is coded in the block model called GFLAG.
The coding of the dilution is done in several steps:
material types are coded in model item OXD: 10, 15, 20, 25
Measure and Indicated material only
code all Oxide (10) or Oxide‐Transition (15) blocks equal to, or greater than, 0.004 oz/t as: ORE =1
code all Non‐Oxide (20) and Non‐Oxide Transition (25) blocks equal to, or great than, 0.009 oz/t as: Ore = 2
any material with item ORE = 1 or 2 is ore
This process will have situations where ore blocks are “orphaned” or isolated from the main ore zone, or conversely there will be waste bocks within the main ore zone that would be difficult to separate.
An additional procedure is then run to determine if the waste blocks have 3 or more ore blocks (ORE =1 or 2) surrounding it. If that is the case, the waste block is then coded as ore or GFLAG = 100 at its grade.
Isolated ore blocks (ORE =1 or 2) are queried to determine if they have 3 or more waste blocks surrounding it. If that is the case, the block is then coded to be waste or GFLAG = 0.
Tonnages within the mine schedule use the GFLAG to determine ore from waste.
This process resulted in reduced ore tonnage and contained ounces. The ore tons dropped by 6.9% and the contained ounces dropped by 4.5% indicating a significant number of isolated ore blocks had been eliminated in the dilution calculation.
16.6 Pit Design
The detailed pit phase designs at Mesquite Mine are based on the pit optimization shells generated with the current resource model.
Four pit and waste dump areas are considered in the reserves statement:
1. Brownie – one phase
2. Vista East‐ two phases
3. Vista West – one phase
4. Big Chief Waste dump – two parts
Each pit phase has been designed to accommodate the existing mining fleet. Mining occurs on 30 ft. lifts with catch benches spaced every 60 ft. vertically. The haul roads are 100 ft. in width with a road grade of 10%. The final design phase tons and grades are shown in Table 16‐5.

MESQUITE GOLD MINE, CALIFORNIA, U.S.A. TECHNICAL REPORT ON THE MESQUITE GOLD MINE, CALIFORNIA, U.S.A.
P a g e | 16‐7
27/04/2020
Table 16‐5: Final Design – Phase Tons and Grade
Pit Ore (MT) Gold Grade (oz/t) Waste (MT) Total (tons) Strip Ratio
Brownie – Ph1 10.5 0.014 64.9 75.4 6.18
Vista East – Ph1 8.7 0.028 10.4 19.1 1.20
Vista East – Ph2 7.8 0.021 34.6 42.4 4.42
Vista West – Ph2 0.9 0.011 6.3 7.2 6.72
Big Chief Dumps 3.2 0.007 4.7 7.9 1.48
Total 31.1 0.019 120.9 152.0 3.89
Ore tonnages are based on the cut‐offs shown in Table 16‐6 below.
Table 16‐6: Mesquite Mine Reserve Cut‐off Grades
Ore Type Grade (oz/t)
Oxide 0.004
Oxide‐Transition 0.004
Non‐Oxide 0.009
The pit areas and phases have been indicated in Figure 16‐1. The ultimate pit area at the end of the mine life is shown in Figure 16‐2.

MESQUITE GOLD MINE, CALIFORNIA, U.S.A. TECHNICAL REPORT ON THE MESQUITE GOLD MINE, CALIFORNIA, U.S.A.
P a g e | 16‐8
27/04/2020
Figure 16‐1: Mesquite Mine Pit Areas

MESQUITE GOLD MINE, CALIFORNIA, U.S.A. TECHNICAL REPORT ON THE MESQUITE GOLD MINE, CALIFORNIA, U.S.A.
P a g e | 16‐9
27/04/2020
Figure 16‐2: Ultimate Pit Configuration

MESQUITE GOLD MINE, CALIFORNIA, U.S.A. TECHNICAL REPORT ON THE MESQUITE GOLD MINE, CALIFORNIA, U.S.A.
P a g e | 16‐10
27/04/2020
Waste backfill occurs in the pit area between Brownie and Vista West – Phase 2. Additional pit backfill is located in Vista West – Phase 3 once that phase is complete in early 2020.
16.7 Mine Schedule
The mine schedule is based on 2019 reserves. It delivers 31.1 million tons of proven and probable ore grading 0.019 oz/t to the heap leach pad over a current design life of 2.5 years. The ore tonnage is made up of 0.25 million tons of proven reserves, 30.8 million tons of probable reserves.
Waste tonnage totals 120.9 million tons to be placed in various waste rock facilities or backfill in the existing pit workings. The overall strip ratio is 3.89:1.
The mine schedule utilizes the pit and phase designs to send a peak of 12.9 million tons of ore to the pad in 2020 then lesser amounts in the following years. Total mine production is limited to 65 million tons per year of total material moved under the current mining permit.
Haulage profiles were determined for each bench from each phase to the leach pad or waste dump location per year. This is used to schedule the mine equipment and ensure no shortfall in equipment is present. The mine equipment is sufficient to meet the production schedule.
The mine equipment fleet is comprised of two Terex RH340 hydraulic shovels (44 yd3) which are the primary loading units. These are supported by two Cat 994H front end loaders (26 yd3) and a backup LeTourneau L1350 (28 yd3) front end loader. The haul truck fleet is comprised of sixteen Terex MT3700 (205 ton) and six Caterpillar 789D (200 ton) trucks. The mining fleet has additional support equipment in the form of track and rubber‐tired dozers, and graders. The mine operates on a work schedule of two 12‐hour shifts per day, seven days per week.
Drilling is performed with a fleet of rotary down‐the‐hole hammer drills (8¾ inch diameter) on a nominal 26 x 26 ft. pattern or a 28 x 28 ft. pattern. Blasting is controlled to minimize back break. The overall powder factor is 0.26 to 0.32 lb/ton. Holes are drilled to a 30 ft. bench height with 3 ft. of sub‐drilling for a total depth of 33 ft.
Mining in 2020 will occur in Vista West Phase 2, Vista East Phase 1, Brownie and Big Chief waste dumps. The Vista West pit will be completed in 2020. Mining in Brownie is a pre‐stripping operation. Vista East Phase 1 will also be completed in 2020.
Both Brownie and Vista East Phase 2 will be mined together in 2021 and 2022. Brownie finishes in the first quarter of 2022 and Vista East Phase 2 in the second quarter of 2022.
Vista East Phase 2 will be completed in April 2022 and represents, to completion, the current reserve pit designs.
Production figures from 2007 to 2022 are shown in Table 16‐7. This consists of past production and the current mine plan for 2020 to 2022.

MESQUITE GOLD MINE, CALIFORNIA, U.S.A. TECHNICAL REPORT ON THE MESQUITE GOLD MINE, CALIFORNIA, U.S.A.
P a g e | 16‐11
27/04/2020
Table 16‐7: Mine Production 2007 – 2022 (Actual and Mine Plan(Highlighted))
Year Ore (MT) Gold Grade
(oz/t) Waste (MT) Total (tons) Strip Ratio
2007 1.0 0.020 18.9 19.9 19.34
2008 8.9 0.022 45.6 54.6 5.10
2009 14.0 0.015 45.0 59.0 3.22
2010 12.5 0.018 39.7 52.2 3.18
2011 12.9 0.017 37.7 50.7 2.92
2012 15.9 0.014 34.4 50.3 2.15
2013 15.8 0.011 37.5 53.2 2.38
2014 14.9 0.012 40.9 55.8 2.74
2015 22.0 0.010 42.8 64.8 1.94
2016 20.9 0.011 43.9 64.8 2.10
2017 22.9 0.009 41.9 64.9 1.83
2018 24.6 0.009 40.2 64.9 1.63
2019 27.8 0.009 36.3 64.1 1.31
Subtotal 2007 ‐ 2019 214.1 0.012 504.8 719.2 2.36
2020 12.9 0.021 50.8 63.7 3.95
2021 9.4 0.014 55.7 65.0 5.95
2022 8.9 0.020 14.4 23.3 1.63
Subtotal 2020 ‐ 2022 31.1 0.019 120.9 152.0 3.89
Total 2007 ‐ 2022 245.2 0.013 625.7 871.2 2.55
16.8 Mine Plan Sequence
End of year positions for the pits are shown in Figure 16‐3 to Figure 16‐5.

MESQUITE GOLD MINE, CALIFORNIA, U.S.A. TECHNICAL REPORT ON THE MESQUITE GOLD MINE, CALIFORNIA, U.S.A.
P a g e | 16‐12
27/04/2020
Figure 16‐3: End of 2020

MESQUITE GOLD MINE, CALIFORNIA, U.S.A. TECHNICAL REPORT ON THE MESQUITE GOLD MINE, CALIFORNIA, U.S.A.
P a g e | 16‐13
27/04/2020
Figure 16‐4: End of 2021

MESQUITE GOLD MINE, CALIFORNIA, U.S.A. TECHNICAL REPORT ON THE MESQUITE GOLD MINE, CALIFORNIA, U.S.A.
P a g e | 16‐14
27/04/2020
Figure 16‐5: End of 2022 (ultimate limits)

MESQUITE GOLD MINE, CALIFORNIA, U.S.A. TECHNICAL REPORT ON THE MESQUITE GOLD MINE, CALIFORNIA, U.S.A.
P a g e | 17‐1
27/04/2020
17 RECOVERY METHODS
17.1 Process Plant
17.1.1 Summary
The Mesquite Mine processing facilities were originally designed to process 8,800 gpm of pregnant gold solution producing up to 140,000 oz of gold annually from a combination of 98 million tons of oxide ore grading 0.016 oz/t and 30 million tons of non‐oxide ore. Owing to the decreasing head grades as the mine developed, ore stacking, and solution processing rates have increased to maintain the nominal 140,000 ounce per annum production rate. Nominal solution flows to and from the heap are c. 13,400 gpm of barren solution to the heap and c. 12,000 of pregnant solution to the ADR circuit. The difference between the two flows accounts for fresh ore wetting and evaporation.
The processing facilities include the following operations:
heap leaching
carbon adsorption using carbon‐in‐column (CIC) processing
desorption and gold recovery
reagents and utilities
water services
During early operations, the ore was crushed to a nominal 2‐inch passing size. However, since the operation was re‐started in 2007, only Run‐of‐Mine (ROM) ore has been stacked and leached. ROM ore, with lime added for pH control, is trucked to the heap leach pad. The ore is stacked to a height of 20 ft. The ultimate pad height has been increased from 200 to 300 ft.
Dilute sodium cyanide solution is pumped from the barren solution tank and distributed to the surface of the leach pad using drip emitters. The solution then percolates through the pad extracting the gold. The gold bearing pregnant solution reports to the pregnant solution sump located at the carbon‐in‐columns (CIC) adsorption plant.
From the pregnant solution sump, the gold bearing solution is pumped to the adsorption plant, also known as the CIC plant. This plant is currently comprised of three CIC trains operating in parallel. These consist of: Train A: one train of six 6‐ton CIC, Train B: one train of three 3‐ton CIC in columns and, Train C: one train of two 3‐ton CIC where the gold is recovered from the solution by adsorption onto activated carbon. Solution flows by gravity from the first column to the last column. Barren solution discharges from the final columns of each CIC train on to a carbon safety screen and reports to the barren solution tank. The barren solution is adjusted in the barren solution tank where liquid sodium cyanide, fresh water, calcium hydroxide slurry (liquid caustic in an emergency), and antiscalant are added as required. The adjusted barren solution is recycled to the leach pad for additional leaching of the ore. The Heap Leaching and Adsorption flowsheet is shown in Figure 17‐1.

MESQUITE GOLD MINE, CALIFORNIA, U.S.A. TECHNICAL REPORT ON THE MESQUITE GOLD MINE, CALIFORNIA, U.S.A.
P a g e | 17‐2
27/04/2020
Figure 17‐1: Heap Leach Carbon Circuit Process Flowsheet
When the carbon in the first column is loaded sufficiently with gold, the activated carbon is advanced counter current to the solution flow in the CIC circuit. Loaded carbon from the first column of the CIC circuit is transported to the desorption circuit located at the original gold plant via trailer (Figure 17‐2).

MESQUITE GOLD MINE, CALIFORNIA, U.S.A. TECHNICAL REPORT ON THE MESQUITE GOLD MINE, CALIFORNIA, U.S.A.
P a g e | 17‐3
27/04/2020
Figure 17‐2: Adsorption Plant Process Flowsheet
At the gold plant, the carbon is washed with a dilute hydrochloric acid solution for removal of inorganic contaminants. After the acid wash stage, the carbon is stripped of precious metals using a traditional pressure Anglo American Research Lab (AARL) process. Pregnant strip solution is processed using electrowinning cells to recover gold, becoming barren strip solution. Resultant barren strip solution is recycled back to the carbon strip vessel for re‐use in the stripping process. The electrowinning sludge recovered from the electrowinning circuit is dried and then mixed with flux and smelted in an induction furnace to produce doré bars and slag. The slag is reprocessed in future smelts to remove any residual precious metal values. The doré bars are cleaned, weighed, and readied for shipment. After stripping, the carbon is thermally regenerated in a carbon reactivation kiln which also removes any organic contaminants. Following stripping and regeneration, the carbon is loaded onto a trailer and returned to the CIC columns for re‐use.
Calcium hydroxide slurry, caustic soda (50%), briquetted sodium cyanide, antiscalant, hydrochloric acid, and lime are received in bulk quantities and stored as required. Appropriate storage and containment facilities are provided for all of the reagents and all acids are stored separately from all cyanide mixing and distribution areas.
The Mesquite Mine became re‐certified in accordance with the International Cyanide Management Code in May 2018.

MESQUITE GOLD MINE, CALIFORNIA, U.S.A. TECHNICAL REPORT ON THE MESQUITE GOLD MINE, CALIFORNIA, U.S.A.
P a g e | 17‐4
27/04/2020
The processing circuits are designed to contain the water associated with normal precipitation events. The storm water ponds are designed to contain the excess water from an extreme event, such as a 24‐hour or, 100‐year storm event.
17.2 Water Services
From the water wells, fresh water is pumped to the raw water tank or the barren solution tank at the CICs. The wells produce 3,000 gpm of fresh water which is sufficient to meet the needs of the operation. From the raw water tank, it can be distributed to the potable, treated, site utility and process water systems. Process water will be used for dust suppression, as wash water for the carbon screens, and as acid wash solution.

MESQUITE GOLD MINE, CALIFORNIA, U.S.A. TECHNICAL REPORT ON THE MESQUITE GOLD MINE, CALIFORNIA, U.S.A.
P a g e | 18‐1
27/04/2020
18 PROJECT INFRASTRUCTURE
18.1 Electrical Power
Electricity for the mine is provided through a 92‐kV power line. Power is supplied to the site by Imperial Irrigation District Power Company. Power is stepped down from 92 kV to 13.2 kV on‐site. All power distribution from this point onwards is distributed on equipment and infrastructure owned by WMMI.
18.2 Water
Water for the project is supplied from the existing Vista well field located approximately two miles south of California State Highway 78. The two current active wells are deemed capable of supplying the water requirements for both WMMI and the LACSD. With the new 18‐inch diameter line in place, the two existing pumping systems are capable of supplying approximately 3,000 gpm of fresh water to the operation which is sufficient to supply the mine and the landfill.
18.3 Heap Leach Pad
Leach pad capacity at the end of December 31, 2019 is 30.7 million tons. That will complete Leach Pad 7 (designed by Tetra Tech) and also Leach Pad 6 to the full 300 ft. height. To place the reserve leach tonnage on the pad, an additional 2.4 million tons of capacity is required. Mesquite Mine is currently engaged in the permitting process to expand leach pad capacity and do not feel this will be unduly withheld.
18.4 Site Layout
The general mine site layout is shown in Figure 18‐1.

MESQUITE GOLD MINE, CALIFORNIA, U.S.A. TECHNICAL REPORT ON THE MESQUITE GOLD MINE, CALIFORNIA, U.S.A.
P a g e | 18‐2
27/04/2020
Figure 18‐1: Overall Site Layout – December 31, 2019

MESQUITE GOLD MINE, CALIFORNIA, U.S.A. TECHNICAL REPORT ON THE MESQUITE GOLD MINE, CALIFORNIA, U.S.A.
P a g e | 19‐1
27/04/2020
19 MARKET STUDIES AND CONTRACTS
19.1 Markets
The gold markets are mature global markets with reputable smelters and refiners located throughout the world.
Gold is a principal metal traded at spot prices for immediate delivery. The market for gold trading typically spans 24 hours a day within multiple locations around the world (such as New York, London, Zurich, Sydney, Tokyo, Hong Kong, and Dubai). Daily prices are quoted on the New York spot market and can be found on www.kitco.com.
19.2 Gold Price
The average New York spot gold price for 2019 was $1,393 per troy ounce. The New York price as of December 31, 2019, was $1,519 per troy ounce. The three‐year, five‐year, and ten‐year rolling average prices through the end of December 2019 are $1,306, $1,265, and $1,314 per troy ounce, respectively. This Technical Report uses $1,350 per troy ounce for the economic analysis.
19.3 Contracts
Dore is shipped from site to major refineries. WMMI has entered into a refining agreement with a reputable refiner. The terms and conditions are consistent with standard industry practices. Refining charges include treatment and transportation.

MESQUITE GOLD MINE, CALIFORNIA, U.S.A. TECHNICAL REPORT ON THE MESQUITE GOLD MINE, CALIFORNIA, U.S.A.
P a g e | 20‐1
27/04/2020
20 ENVIRONMENTAL STUDIES, PERMITTING, AND SOCIAL OR COMMUNITY
IMPACT
20.1 Environmental Issues
The Mesquite Mine was thoroughly evaluated under NEPA and CEQA in the 2002 Mesquite Expansion EIR/EIS, and subsequently in the 2016 Addendum to that EIR/EIS prepared for the Consolidated Reclamation Plan (see discussion under Project Permitting in Section 20.2 below).
A number of historical and ongoing environmental studies also exist, related to environmental impact ranging from air quality compliance to protection of the desert tortoise found in the area. The Mesquite Mine Environmental Department administers these permits and retains professional services from time to time to assure compliance with existing permits, and to encourage sustainable “mining for closure” practices to reduce liability and practice good land stewardship.
There are no known environmental issues that could materially impact the ability of WMMI to extract the mineral resources or mineral reserves.
20.2 Project Permitting
The Mesquite Mine received regulatory approval to resume mining operations on July 2, 2007, after the issuance of the Air Quality permit from the Imperial County Air Pollution Control District. WMMI is in compliance with all permits.
The Mesquite Mine is a mature mine from an environmental, permitting, and social perspective. Open pit mining and heap leach operations at the site date back to the 1980s. Throughout the Mesquite Mine ownership history (Gold Fields, Santa Fe Gold, Newmont, New Gold, and Equinox) the mine has had a successful environmental track record and operating history. The environmental staff are “seasoned” and bring operating and compliance success(es) from previous operations and employment. During the course of interviews with staff, no major violations with operating permits were reported and relationship(s) with nearby communities and agencies were relayed as amicable with no adversarial relationships or issues apparent.
The closure and reclamation plan for the Mesquite Mine has been developed by WMMI with the assistance of independent consultants with the specific objective of leaving the land in a useful, safe, and stable post‐mining configuration, capable of supporting native plant life, providing wildlife habitat, maintaining watershed functions, and supporting limited livestock grazing. Portions of the mine will be utilized by the Los Angeles County Sanitation District as a long‐term landfill, and the mine’s planned development is integrated with this long‐term use.
Equinox and its predecessors have developed plans and obtained federal, state, and local approvals for heap leach pads, waste disposal, site monitoring, and water management; both during operations and post mine closure. The mine currently operates under the “Consolidated
MESQUITE GOLD MINE, CALIFORNIA, U.S.A. TECHNICAL REPORT ON THE MESQUITE GOLD MINE, CALIFORNIA, U.S.A.
P a g e | 20‐2
27/04/2020
Reclamation Plan (CRP)” which was approved in December 2016 and formally combined three separate Mine Identification Numbers under which the mine had previously operated. The CRP also included mining the Brownie Pit and updated a number of reclamation methods and requirements to modern standards of mine closure, reclamation, stabilization, and revegetation.
In addition, the mine is International Cyanide Code “Certified” through the development and implementation of a Cyanide Management Plan (and training). The Cyanide Code is a voluntary program designed to assist the global gold mining industry and the producers and transporters of cyanide used in gold mining in improving cyanide management practices, and to publicly demonstrate their compliance with the Cyanide Code through an independent and transparent process. The Cyanide Code is intended to reduce the potential exposure of workers and communities to harmful concentrations of cyanide‚ to limit releases of cyanide to the environment‚ and to enhance response actions in the event of an exposure or release. The most recent Cyanide Code Certification was performed in 2018 with plans to update certification in 2020.
Equinox has obtained permits and authorizations from federal, state, and local agencies to operate current facilities and activities. Table 20‐1 provides a current list of the permits and plans being, or having been, operated under. Equinox and WWMI are in compliance with issued permits. Minor violations within the past year were limited to sampling and reporting timing errors due to misinterpretation of Air Quality permit conditions for the carbon‐in‐column plant, and these errors were corrected, restoring compliance.
No permitting efforts are currently underway, and the mine operates under its established permits and rights.
20.3 Social and Community Requirements
Equinox reports excellent working relationships with regulatory agencies and the public.
20.4 Mine Closure Requirements and Reclamation Costs
Reclamation plans have been developed by Equinox and approved by the applicable regulatory agencies. In general, these plans call for the heap rinsing, removal of structures, grading of surfaces to stabilize slopes and achieve a more natural appearance, creation of stormwater management features application of growth medium, and revegetation. The intent is to provide for a beneficial post mining land use.
Equinox has retained Robison Engineering Company, Inc (Robison) to calculate the internal and bond level reclamation cost estimates for the Mesquite Mine. The current estimate for reclamation of all currently developed and foreseeable mining activities, is $21,421,292 as reported in the Asset Retirement Obligation (ARO) financial accounting. This amount is amortized and adjusted for inflation in Section 22 of this report as an Operating Expense.

MESQUITE GOLD MINE, CALIFORNIA, U.S.A. TECHNICAL REPORT ON THE MESQUITE GOLD MINE, CALIFORNIA, U.S.A.
P a g e | 20‐3
27/04/2020
At the same time, Equinox currently maintains seven separate bonds totaling $26,319,287 which guarantee that proposed and approved reclamation activities will be performed. These were updated in September 2019:
Regional Water Board Closure Bond (Bond # 800026546) = $550,000
Lease Compliance Bond (Bond # 800026547) = $50,000
Big Chief Tension Crack Bond on State Lands (Bond #800026545) = $61,783
REC‐1 CRP Reclamation (Bond #800026543) = $7,174,357
REC‐2 CRP Reclamation (Bond #BDTO‐300022‐018) = $7,174,357
CLO‐1 CRP BLM/RWQCB Closure (Bond #800013555) = $5,654,395
CLO‐2 CRP BLM/RWQCB Closure (Bond #BDTO‐300023‐018) = $5,654,395
The bond amounts exceed the ARO reclamation cost due to several factors, generally related to the assumption for bonding purposes, of public administration of the reclamation activities which add to the physical and contract costs of reclamation and closure. These numbers are developed by a third party and represent estimated costs for an independent party to perform reclamation and closure activities.
Waste disposal requirements are limited to off‐site recycling and landfill disposal of demolition debris, including that from buildings, pipelines, and other mine fixtures. There are no tailings at this run‐of‐mine heap leach operation.
Monitoring during operations consists of a variety of permit‐required regular inspections of hundreds of discreet data points throughout the operations area, for water, air, and other environmental quality factors, in addition to physical inspection for wildlife and plant health, and invasive species abatement. Formal professional surveys are also routinely performed, particularly for the protection of the Desert Tortoise, an endangered species occurring in the area; protection of to the Tortoise is primarily achieved through exclusion (engineered fencing).
Post‐closure monitoring will consist of continued compliance with the operating permits as long as they remain active. Additional monitoring to document erosional stability, public safety, and ultimately, revegetation are added requirements following the active mining and reclamation periods, in accordance with operating permits.
Water management consist of compliance with the Colorado River Regional Water Quality Board Order, which regulates all waste, storm, and freshwater resources, both contained (e.g. heaps and pits) and regional (e.g. stormwater run‐on and run‐off). Documentation of containment and stormwater quality are part of routine monitoring requirements.

MESQUITE GOLD MINE, CALIFORNIA, U.S.A. TECHNICAL REPORT ON THE MESQUITE GOLD MINE, CALIFORNIA, U.S.A.
P a g e | 20‐4
27/04/2020
Table 20‐1: Environmental Permits Matrix
PERMIT (Name) AGENCY (Authority) PERMIT # DATE EXPIRATION COMMENT
BLM Record of Decision
Plan of Operations varies 30‐Jan‐85 n/a Mesquite Project
Record of Decision Bureau of Land Management CAMC‐109887/121229 04‐Nov‐87 n/a Approval of VCR Project
Plan of Operations ‐ Consolidated
varies Final Oct‐95 n/a Consolidated Plan of Operations, includes all maps, located on Env. Bookshelf
Plan of Operations ‐ Expansion
varies 23‐Nov‐98 n/a Mesquite Expansion Project
Record of Decision Bureau of Land Management 98121054 16‐Jul‐02 n/a Approval of Mesquite Expansion‐ Reduced Footprint Alternative
Conditional Use Permit
Conditional Use Permit
Imperial County Planning and Building Development Services
09‐0020 08‐Jan‐18 8‐Jan‐34 Covers Reclamation and Contingency Plans. Replaced and superseded 09‐0020 (A&B)
Air Quality Permit
Air Quality Permit Receipt
Imperial County Air Pollution Control District
All AQ Permits Below
01‐Jan‐2020 31‐Dec‐2020 Air Pollution Control District Permits invoiced and paid annually
Air Quality Permit Imperial County Air Pollution Control District
1920C‐5 04‐Oct‐2016 annual renewal fee 31‐Dec
Permit to Operate ‐ Primary permit support sources, area sources, and mobile off‐road
Air Quality Permit Imperial County Air Pollution Control District
4005A‐6 16‐Mar‐18 annual renewal fee 31‐Dec
Gold Plant sources (Mercury)

MESQUITE GOLD MINE, CALIFORNIA, U.S.A. TECHNICAL REPORT ON THE MESQUITE GOLD MINE, CALIFORNIA, U.S.A.
P a g e | 20‐5
27/04/2020
PERMIT (Name) AGENCY (Authority) PERMIT # DATE EXPIRATION COMMENT
Air Quality Permit Imperial County Air Pollution
Control District 4006A‐2 17‐Jul‐2019
annual renewal fee 31‐Dec
Permit to Operate – portable engines (gasoline and diesel) all less than 50 hp and greater than 50 hp
Air Quality Permit Imperial County Air Pollution Control District & US EPA
V‐4005 10‐May‐17 10‐May‐22 Federal regulated mercury emission units
Reclamation Plans
Consolidated Reclamation Plan (CRP)
California Office of Mine Reclamation
15‐001 24‐May‐18
Previously approved Reclamation Plans (original Mesquite Mine and VCR Expansion are superseded by Rec Plan No. 15‐0001)
Bio ‐ Wildlife Permits
Streambed Alteration Permit (1603)
5‐373‐96 19‐Dec‐96
Allows alteration to unnamed drainages for diversion channel. Mitigate impacts with installation of wildlife drinker.
Streambed Alteration Permit (1601)
California Department of Fish and Game (CDFG)
6‐097‐00 18‐Feb‐03 year 2020
Allows alteration to unnamed drainages for site construction. Originally expired 12‐Jul‐05, Notification Package 30‐Sept‐2010 Approves project until 2020 without agreement (per CDFG letter 20‐May‐11)
Incidental Take Permit (2081)
California Department of Fish and Game
2081‐2003‐011‐06 12‐Aug‐03 30‐Dec‐20 Covers threatened desert tortoise. Includes Mitigation, Monitoring & Reporting Plan
Streambed Alteration (1601) Notification
Notification 1600‐2010‐0134‐R6
30‐Sep‐10 year 2020 Notification Package & Attachments (CD)

MESQUITE GOLD MINE, CALIFORNIA, U.S.A. TECHNICAL REPORT ON THE MESQUITE GOLD MINE, CALIFORNIA, U.S.A.
P a g e | 20‐6
27/04/2020
PERMIT (Name) AGENCY (Authority) PERMIT # DATE EXPIRATION COMMENT
Streambed Alteration Permit (1601) CDFG Letter
CDFG Letter Notification 1600‐2010‐0134‐R6
25‐May‐11 n/a Letter authorizes completion of project as originally proposed
ROWs and Encroachments
ROW IID Distribution Line
Bureau of Land Management CA‐17187 25‐May‐85
Imperial Irrigation District (IID) ROW for: Electric Distribution Line, substations, and access road to provide electric to project.
ROW Utility Corridor CA‐19129 12‐Sep‐86
Annual Rental amount $5,485.60 1/1/YY‐12/31/YY Utility Corridor consisting of water pipeline, overhead transmission line, access road and water wells.
ROW Amendment‐ Waterline
CA‐19129 25‐Jun‐07 Amendment Approved replacement of Vista Well Waterline.
Water Permits
NPDES General Permit California Regional Water Quality
Control Board NPDES
NO.CAS00001 01‐Jul‐2015 30‐Jul‐2020 For stormwater management
Public (Domestic) Water System Permit
Imperial County Public Health Department
PT0005483 01‐Jan‐10 Annual Renewal
Fee
Non‐Transient, Non‐Community Water System Facility ID#0003157 System ID#1300643
Waste Discharge Permit ‐ Monitoring and Reporting Program
California Regional Water Quality Control Board
R7‐2014‐0032 09‐May‐2014 General Permit, Monitoring and Reporting Program (revision 1) for cyanide management
Waste Discharge Permit‐ letter
95‐016 WDID 7A132140003
27‐Dec‐07 & 30‐May‐08
n/a Letters approve leach pad 5&6 expansion

MESQUITE GOLD MINE, CALIFORNIA, U.S.A. TECHNICAL REPORT ON THE MESQUITE GOLD MINE, CALIFORNIA, U.S.A.
P a g e | 20‐7
27/04/2020
PERMIT (Name) AGENCY (Authority) PERMIT # DATE EXPIRATION COMMENT
Waste Discharge Permit
California Regional Water Quality Control Board
93‐043 WDID 7A132222001
17‐Nov‐93 For waste management facility (inert waste onsite landfill)
Other Operational Permits
User of High Explosives
Bureau of Alcohol, Tobacco and Firearms
9‐CA‐025‐3J‐01263 22‐Aug‐07
IC Business License IC Tax Collector 000567 29‐Dec‐10 Annual Renewal
Hazardous Waste Generator
California Department of Toxic Substances Control
EPA ID# CAD109163071
01‐Jan‐11 31‐Dec‐11 (CUPA) Unified Program Certificate
LACSD Lease Agreement
Los Angeles County Sanitation District
25‐Jun‐93 n/a
Other Operational Permits
Heliport California Department of
Transportation Imp‐3(H) 08‐Feb‐95 n/a
MSHA Legal ID # Mine Safety Health Administration Mine ID # 04‐04614 27‐Sep‐10 n/a Update if there is a change of safety department authority or ownership
Radio Station Authorization
Federal Communications Commission
Varies varies varies Various expiration dates: 2013, 2014, 2017 & 2019
Septic Permit 6212 Imperial County Public Health
Department Varies Permit #6212, (3373, 3374, 3323,
3743 old shop areas)
State Lease for Mineral Extraction
California State Lands Commission PRC 8039.2 01‐Oct‐12 30‐Sep‐22
Royalties and annual rental. Lease was renewed and amended 8/14/12. Lease period and royalty scale were amended.
Biological Opinion
Biological Opinion US Fish & Wildlife Service 1‐6‐92‐F‐28 01‐Jun‐92 Initial consultation

MESQUITE GOLD MINE, CALIFORNIA, U.S.A. TECHNICAL REPORT ON THE MESQUITE GOLD MINE, CALIFORNIA, U.S.A.
P a g e | 20‐8
27/04/2020
PERMIT (Name) AGENCY (Authority) PERMIT # DATE EXPIRATION COMMENT
Biological Opinion (Amendment)
US Fish & Wildlife Service 1‐6‐92‐F‐22R4 27‐Oct‐2017 Revised the incidental takes
Biological Opinion US Fish & Wildlife Service 1‐6‐92‐F‐39 07‐Jul‐98 Mine Exploratory Drilling Project (PCN‐98‐20004‐TCD)
NEPA / CEQA Documentation
Mesquite Mine Expansion Draft EIS/EIR
Imperial County Planning and Building
DRAFT EIR/EIS 08‐Aug‐00 n/a Appendix 2 ‐ includes baseline vegetation data
Final Mesquite Expansion EIR‐EIS
Imperial County Planning and Building
Final EIR/EIS Final July‐02 n/a Includes Response to comments
Various Plans / Regulations / Ordinances
California Cyanide Management Plan
Bureau of Land Management n/a 14‐May‐92 n/a
Mitigation Monitoring and Enforcement Reporting Plan
varies Final EIR/EIS x‐Feb‐02 n/a From Mesquite Mine Expansion Final EIR/EIS
Imperial County SMARA Ordinance
Imperial County Planning and Building
n/a 2008 n/a Imperial County, Title9 Division 20: Surface Mining & Reclamation

MESQUITE GOLD MINE, CALIFORNIA, U.S.A. TECHNICAL REPORT ON THE MESQUITE GOLD MINE, CALIFORNIA, U.S.A.
P a g e | 21‐1
27/04/2020
21 CAPITAL AND OPERATING COSTS
21.1 Capital Cost Estimates
21.1.1 Sustaining Capital
Capital costs for the Mesquite Mine in order to meet current reserves production are minimal expenditures to maintain operations. Capital costs totaling $23.72 million over the remaining mine life are forecast.
21.1.2 Capital Cost Summary
The capital costs forecast for the Mesquite Mine to the end of the mine life are shown in Table 21‐1.
Table 21‐1: LOM Capital Costs
Units Life of Mine 2020 2021 2022
Hardware/Software $ ‘000s 349 174 175 ‐
Process Equipment $ ’000s 7,500 7,500 ‐ ‐
Mineral Exploration $ ’000s
8,071 8,071
Leach Pad Expansion $ ’000s
5,500 5,500
Light Vehicles $ ’000s 300 150 150 ‐
Air Quality Offsets $ ’000s 2,000 ‐ 2,000 ‐
Total $ ’000s 23,720 21,395 2,325 ‐
21.2 Operating Cost Estimates
The total operating cost for the Mesquite Mine is $14.95 per ton processed until the end of the residual leaching, which is expected to run out to 2025, while the mining is complete in 2022. Operating costs are broken into three primary areas: mining, processing, and G&A.
21.2.1 Mine Operating Costs
The mining cost estimate is based on the reserves pit design and takes into consideration haulage distances, depth of mining, height of leach pad, and expected consumable and maintenance costs. Mine operating costs are based on the 2020 Operating Budget and Forecast. Previous mine costs and the LOM forecast costs are shown in Table 21‐2 as the cost per ton of material moved.

MESQUITE GOLD MINE, CALIFORNIA, U.S.A. TECHNICAL REPORT ON THE MESQUITE GOLD MINE, CALIFORNIA, U.S.A.
P a g e | 21‐2
27/04/2020
Table 21‐2: Mine Operating Costs ‐ $/ton moved
Area Units Actual 2017
Actual 2018
Actual 2019
LOM 2020 ‐ 2022
Mining $/t moved 1.30 1.31 1.47 1.79
21.2.2 Process Operating Costs
The process operating costs reflect the historical operating costs with adjustments made for consumables (primarily cyanide, lime, and other reagents and power). This cost is expressed as cost per ton ore processed and is shown in Table 21‐3.
Table 21‐3: Process Operating Costs ‐ $/t ore processed
Area Units Actual 2017
Actual 2018
Actual 2019
LOM 2020 ‐ 2022
Processing $/t ore 1.42 1.70 1.78 5.50
21.2.3 General and Administrative Operating Costs
G&A operating costs are based on historic operating costs with a forecast for increased labour, benefits, etc. These costs include the site overhead, but not the corporate overhead. The G&A costs are expressed as costs per ton of ore processed and are shown in Table 21‐4
Table 21‐4: G&A Costs ‐ $/t ore processed
Area Units Actual 2017
Actual 2018
Actual 2019
LOM 2020 ‐ 2022
G & A $/t ore 0.53 0.62 0.56 1.67
21.2.4 Refining Costs
Contracts are in place for refining with charges of a nominal $1.80 per ounce of gold.

MESQUITE GOLD MINE, CALIFORNIA, U.S.A. TECHNICAL REPORT ON THE MESQUITE GOLD MINE, CALIFORNIA, U.S.A.
P a g e | 22‐1
27/04/2020
22 ECONOMIC ANALYSIS
NI 43‐101 regulations exempt producing issuers from the requirement to disclose Economic Analysis on properties currently in production, unless the technical report prepared by the issuer includes a material expansion of current production. Equinox is a producing issuer, the Mesquite mine is currently in production, and a material expansion is not included in the current Mesquite LOM plan. AGP has performed an economic analysis using the Mineral Reserves and Life‐of‐Mine Plan presented in this report, and confirms the outcome is a positive cash flow that supports the statement of Mineral Reserves.

MESQUITE GOLD MINE, CALIFORNIA, U.S.A. TECHNICAL REPORT ON THE MESQUITE GOLD MINE, CALIFORNIA, U.S.A.
P a g e | 23‐1
27/04/2020
23 ADJACENT PROPERTIES
Several properties have been mined within a mineralized belt running between the Chocolate Mountains to the north and the southern slopes of the Cargo Muchacho Mountains to the south. The belt extends from the Mesquite Mine to approximately 20 miles to the southeast. Properties that have been mined include the Picacho Mine and the American Girl Mine. The Imperial Project is located approximately 10 miles to the southeast of the Mesquite Mine.
On a larger scale, the mineralized belt is thought to continue south into Northern Mexico. Fresnillo operates the La Herradura Mine located 250 miles southeast of Mesquite in Northern Mexico.
Information regarding mineralization at adjacent properties is not necessarily indicative of mineralization at the Mesquite Mine.
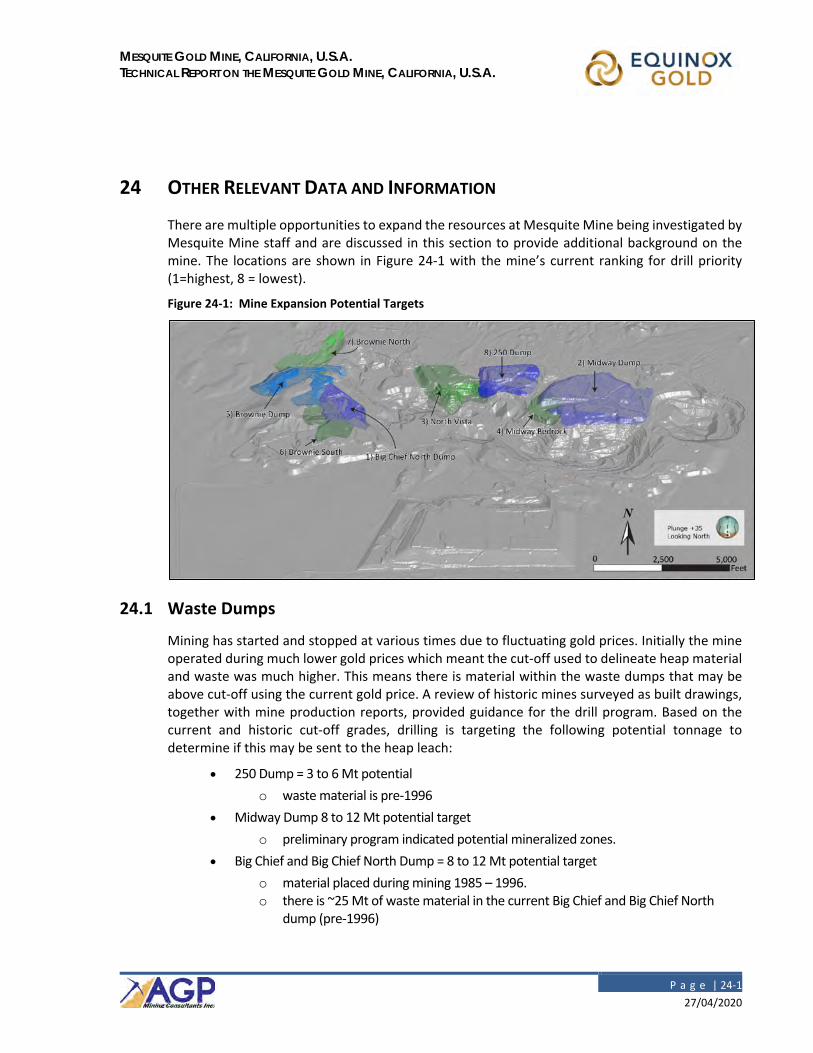
MESQUITE GOLD MINE, CALIFORNIA, U.S.A. TECHNICAL REPORT ON THE MESQUITE GOLD MINE, CALIFORNIA, U.S.A.
P a g e | 24‐1
27/04/2020
24 OTHER RELEVANT DATA AND INFORMATION
There are multiple opportunities to expand the resources at Mesquite Mine being investigated by Mesquite Mine staff and are discussed in this section to provide additional background on the mine. The locations are shown in Figure 24‐1 with the mine’s current ranking for drill priority (1=highest, 8 = lowest).
Figure 24‐1: Mine Expansion Potential Targets
24.1 Waste Dumps
Mining has started and stopped at various times due to fluctuating gold prices. Initially the mine operated during much lower gold prices which meant the cut‐off used to delineate heap material and waste was much higher. This means there is material within the waste dumps that may be above cut‐off using the current gold price. A review of historic mines surveyed as built drawings, together with mine production reports, provided guidance for the drill program. Based on the current and historic cut‐off grades, drilling is targeting the following potential tonnage to determine if this may be sent to the heap leach:
250 Dump = 3 to 6 Mt potential
o waste material is pre‐1996
Midway Dump 8 to 12 Mt potential target
o preliminary program indicated potential mineralized zones.
Big Chief and Big Chief North Dump = 8 to 12 Mt potential target
o material placed during mining 1985 – 1996. o there is ~25 Mt of waste material in the current Big Chief and Big Chief North
dump (pre‐1996)

MESQUITE GOLD MINE, CALIFORNIA, U.S.A. TECHNICAL REPORT ON THE MESQUITE GOLD MINE, CALIFORNIA, U.S.A.
P a g e | 24‐2
27/04/2020
o the entire Big Chief North Dump has 10 Mt of exposed area to explore
Brownie Dump = 1 to 2 Mt potential target
o a total of 18 Mt of waste material was placed in pre‐1996 mining
These locations are shown in Figure 24‐1.
24.2 Rainbow Pit
The Rainbow pit area was previously mined until a geotechnical instability near Highway 78 forced mining to stop and requiring construction of a buttress below the wall adjacent to the highway. The reserves do not include any material from Rainbow pit, but the resources do contain this material.
There is a total of 22.6 million tons of potential heap material grading 0.015 oz/t are within the resource constraining pit shell for a contained total of 328,000 ounces, and 52.1 million tons of waste for an overall strip ratio of 2.3:1. This is constrained by a resource pit shell, and not a final design, but shows the potential within the Rainbow pit for advancing proper designs and permitting to commence mining in this area once again. The highway will need to be realigned to accommodate the pit development. This opportunity requires further assessment.
24.3 Reworking of Leach Pads
Two of the older leach pads were considered for re‐processing. Mineralized material on the old Vista leach pad, and a portion of mineralized material identified on Leach Pad 4 has been restacked.
Removal and placement on the current, or on a new leach facility, will allow remaining contained gold identified in Leach Pad 4 to be stacked for additional recovery efforts.
24.4 Leach Pad Expansion
With the potential for additional material to be leached, Mesquite Mine personnel have started the process of obtaining permits to expand leach pad capacity. This is currently envisaged to be located overtop of existing Leach Pad 4. Design of this facility is to be undertaken in conjunction with the permit change request.

MESQUITE GOLD MINE, CALIFORNIA, U.S.A. TECHNICAL REPORT ON THE MESQUITE GOLD MINE, CALIFORNIA, U.S.A.
P a g e | 25‐1
27/04/2020
25 INTERPRETATION AND CONCLUSIONS
Based on evaluation of the data available from the Mesquite Mine operation, the authors of this technical report have drawn the following conclusions:
As of the effective date of this Technical Report (December 31, 2019), Equinox holds a 100% interest in WMMI.
The Mesquite Mine deposit forms relatively continuous zones of disseminated gold mineralization associated with a sequence of favorable structural zones.
The Mesquite Mine has combined oxide, oxide‐transition, non‐oxide transition and non‐oxide type material in Measured plus Indicated mineral resources, exclusive of mineral reserves, estimated to be 31.9 M tons at an average grade of 0.014 oz/t gold, for a total of 0.4 M ounces of contained gold, plus an additional 52.6 M tons of mineral resources in the Inferred category at an average grade of 0.010 oz/t gold, containing 510 koz of contained gold. See Table 14‐7 for the separate disclosure of Measured and Indicated mineral resources.
There are no known factors related to metallurgical, environmental, permitting, legal, title, taxation, socio‐economic, marketing, or political issues which could materially affect the mineral resource or mineral reserve estimates.
The eastern extent of the mineral resource, referred to as the Rainbow Area, encroaches on an existing public roadway and the extraction of the full resource in this area would require moving the existing roadway. There are no known reasons that full access to the resource in this area could be achieved in the future.
It is the QP’s opinion the metallurgical recoveries used in this Technical Report are to a level sufficient to support Mineral Reserves declaration.
The existing and planned infrastructure, availability of staff, existing power, water and any planned modifications or the requirements to establish such, are understood by Mesquite Mines. Expansion of the heap leach facilities is one example of work to expand capacity currently underway.
Estimations of mineral reserves for the Project conform to industry best practices and meet the requirements of CIM (2014). Reviews of the environmental, permitting, legal, title, taxation, socio‐economic, marketing, and political factors, and constraints for the operation support the declaration of Mineral Reserves using the set of assumptions outlined.
The Mesquite Mine has Proven and Probable mineral reserves estimated to be 31.1 M tons grading 0.0188 oz/t totaling 584 koz of contained gold.
The mine plans are appropriate for the style of mineralization.
Geotechnical concerns affecting wall slopes are well understood and that knowledge is being expanded with additional study/drilling planned in the coming years.

MESQUITE GOLD MINE, CALIFORNIA, U.S.A. TECHNICAL REPORT ON THE MESQUITE GOLD MINE, CALIFORNIA, U.S.A.
P a g e | 25‐2
27/04/2020
Further optimization of the mine plan is underway to investigate opportunities to bring ounces forward in the schedule and reduce mine operating costs.
Exploration potential exists for expanding the mine life in the Rainbow pit area and re‐examination of the past waste dumps. This work is ongoing.
The economic analysis is positive under the set of assumptions used.

MESQUITE GOLD MINE, CALIFORNIA, U.S.A. TECHNICAL REPORT ON THE MESQUITE GOLD MINE, CALIFORNIA, U.S.A.
P a g e | 26‐1
27/04/2020
26 RECOMMENDATIONS
26.1 Geotechnical
The following is recommended for geotechnical consideration at the Mesquite Mine:
complete the detailed geotechnical work proposed by the consultant for the Brownie pit area; this includes the geotechnical drilling in the north end of the pit
continue monitoring of current slopes of the pit and waste dumps as mining progresses and adjusting per any updated geotechnical criteria
26.2 Process and Metallurgy
The following items are recommended for the processing and metallurgical areas of the Mesquite Mine.
26.2.1 Laboratory
The following items should be examined in more detail:
improve on the current analytical method’s sensitivity and method detection limits by implementation of ICP‐AES
complete an analytical method detection limit study to determine actual capability of the laboratory
26.2.2 Metallurgy
The metallurgical recommendations are:
column test work improvements such as:
o examine different ore type o test various lift heights to maximize recovery o investigate the application rate to determine if appropriate or requires changing
develop a Geomet model to assist in recovery estimations and production forecasting
examine relationship for lime dosage requirements and rock types
drill and sample “spent” heaps
26.2.3 Heap Leaching
develop long term stacking plan
examine placement height versus recovery
develop solution management plan
o optimize application rates o optimize overall flow to the heap

MESQUITE GOLD MINE, CALIFORNIA, U.S.A. TECHNICAL REPORT ON THE MESQUITE GOLD MINE, CALIFORNIA, U.S.A.
P a g e | 26‐2
27/04/2020
o increase heap leach area under leach o minimize cyanide consumption
continue study work on non‐oxide material to accurately assess its impact to future mining and gold production
26.3 Mineral Resources
The following recommendations are made from a Mineral Resource perspective:
improve classification within the Brownie Pit area by means of:
o small infill drill program to improve the drill spacing on the eastern margins of the area
o better definition of the location of the brownie fault down to relevant depths o re‐evaluation of domaining and classification based on new interpretations o drilling aimed at extending the zone especially towards the north and south
further develop the new oxide categorization by:
o incorporation of ratios of cyanide soluble gold grades verses fire assay (total) gold grade, as well as sulphur data to compare against the observed data
o testing to confirm and better define the recoveries currently assigned to these categories
continue to investigate means of improving ore/waste selection during mining
continue with detailed mapping to better understand the structural controls on the distribution of mineralization
when drilling waste dumps, use fire assay to analyse all samples for total gold content. In addition to this, analyse every fourth sample for cyanide soluble gold content. RC drill holes in waste dump areas should be spaced on a nominal 100ft spaced pattern
26.4 Mine Planning
The following actions are recommended from a mine planning and reserves perspective:
continued examination of mine sequence to bring ounces forward in the mine plan.
examine including Rainbow pit into the current mine plan:
o work with environmental department on drilling permit o assist environmental department on relocation of highway to make Rainbow pit
available for mine planning
examine the impact of drilling underway in old waste dumps:
o as the information from the waste dump drilling program becomes available, prepare various mine plan scenarios that incorporate that material to determine potential increases in the mine overall economics
o examine and determine what portion of the mine dump material may be brought into reserves

MESQUITE GOLD MINE, CALIFORNIA, U.S.A. TECHNICAL REPORT ON THE MESQUITE GOLD MINE, CALIFORNIA, U.S.A.
P a g e | 27‐1
27/04/2020
27 REFERENCES
Bechtel Civil and Minerals, 1984: Mesquite Project Feasibility Study, prepared for Gold Fields
Operating Co.
BGC Engineering Inc., 2013(a): Annual Geotechnical Review, prepared for New Gold Inc.,
September 18, 2013.
BGC Engineering, Inc., 2013(b): Rainbow Pit – East Wall Stability and Impact on Highway 78,
prepared for New Gold Inc., September 20, 2013.
Crowe, B. M., 1978, Cenozoic Volcanic Geology and Probable Age of Inception of Basin‐Range
Faulting in the Southeasternmost Chocolate Mountains, California, Geologic Society of
America Bulletin, vol. 89, p,251‐264.
Della Libera, M., et al., 2011: Mesquite Sulfide Project, 2010 Annual Report, February 28, 2011.
Engineering Analytics, Inc., 2009: Stope Stability Analyses of the East Rainbow Pit Expansion,
March 2009.
Haxel, G.B., and Dillon, J.T., 1978: The Pelona‐Orocopia Schist and the Vincent‐Chocolate
Mountain Thrust System, Southern California, in D.G. Howell and K.A. MacDougall,
Mesozoic Paleogeography of the Western United States, SEPM Pacific Coast
Paleogeography Symposium 2, pp. 453‐469.
Haxel, G. B. and Grubensky, M. J., 1984, Tectonic Significance of Localization of Middle Tertiary
Detachments Faults Along Mesozoic and Early Tertiary Thrust Faults, Southern Arizona
Region, Geologic Society of America Abstracts with Programs, Vol. 16, No. 6, p. 533.
Independent Mining Consultants Inc., 2009: Mineral Resources and Mineral Reserves
Verification, Letter Report, March 30, 2009.
Independent Mining Consultants Inc., 2006: Mesquite Gold Project Imperial County, California,
USA, Technical Report, May 26, 2006.
Longton, C.M., 2011: Internal memo regarding interpretation of lithology in Mesquite Mine,
May 11, 2011.
Longton, C.M., 2011: Internal memo regarding “Mesquite Geology” , February 4, 2011.
Mine Development Associates, 2004: Technical Report on the Mesquite Mine Project, Imperial
County, California, USA, December 22, 2004.
Manske, S.L., 1991: Epithermal Gold Mineralization in Gneissic Rocks of the Mesquite District,
Imperial County, California, Ph.D. Dissertation at Stanford University.

MESQUITE GOLD MINE, CALIFORNIA, U.S.A. TECHNICAL REPORT ON THE MESQUITE GOLD MINE, CALIFORNIA, U.S.A.
P a g e | 27‐2
27/04/2020
Micon International Limited, 2006: Technical Report on the Mesquite Mine Expansion,
Feasibility Study, Imperial County, California, by R.M. Gowans and M.G. Hester, prepared
for Western Goldfields, Inc., August 6, 2006.
Nicklaus Engineering Inc., 2013: Geotechnical Design Report State Highway 78 Repair at
Mesquite Mine, prepared for New Gold Inc., July 26, 2013.
RPA, 2014: Technical Report on the Mesquite Mine, Brawley, California, USA, by R.J. Lambert,
W.W. Valliant and K. Altman, prepared for New Gold Inc., February 28, 2014.
Scott Wilson RPA, 2010: Technical Report on the Mesquite Mine, Brawley, California, USA, by
R.J. Lambert, W.W. Valliant and H. Krutzelmann, prepared for New Gold Inc., February 26,
2010.
Smith et al., 1999: Regional Geology, Internal Report to Newmont Mining Corporation.

MESQUITE GOLD MINE, CALIFORNIA, U.S.A. TECHNICAL REPORT ON THE MESQUITE GOLD MINE, CALIFORNIA, U.S.A.
P a g e | 28‐1
27/04/2020
28 CERTIFICATE OF AUTHORS
28.1 Bruce M. Davis, FAusIMM
I, Bruce M. Davis, FAusIMM am employed as a Geostatistician with BD Resource Consulting, Inc (BDRC) located at 4253 Cheyenne Drive, Larkspur, Colorado, USA. This certificate accompanies the technical report titled Technical Report on the Mesquite Gold Mine, California, U.S.A. (the “Technical Report”) prepared for Equinox Gold Corp. (“Equinox”) dated April 27, 2020 with an effective date of December 31, 2019. I hereby certify the following:
I am a fellow in good standing of the Australasian Institute of Mining and Metallurgy, membership #211185.
I graduated from the University of Wyoming in 1978 with a Doctor of Philosophy degree.
I have practiced my profession continuously for forty years since graduation.
I have been directly involved in mineral resource and reserve estimations and feasibility studies on numerous underground and open pit base metal and gold deposits in Canada, the United States, Central and South America, Europe, Asia, Africa, and Australia. As a result of my experience and qualifications, I am a Qualified Person as defined in NI 43–101.
I visited the Mesquite Mine on November 13, 2018.
I am responsible for Sections 4 to 12 and those portions of the Summary, Interpretations and Conclusions, and Recommendations that pertain to those sections of the Technical Report.
I am independent of Equinox as described by Section 1.5 of the instrument.
I have previous involvement with the property starting in 1991. My previous involvement includes resource estimation for the previous operator, New Gold, from 2013 to 2018.
I have read NI 43–101 and the Technical Report sections for which I am responsible have been prepared in compliance with that Instrument.
As of the effective date of the Technical Report, to the best of my knowledge, information, and belief, the sections of the Technical Report that I am responsible for, contain all scientific and technical information that is required to be disclosed to make those sections of the technical report not misleading.
Signed and dated in Colorado, USA on April 27, 2020.
“signed & sealed”
Bruce M. Davis, FAusIMM

MESQUITE GOLD MINE, CALIFORNIA, U.S.A. TECHNICAL REPORT ON THE MESQUITE GOLD MINE, CALIFORNIA, U.S.A.
P a g e | 28‐2
27/04/2020
28.2 Robert Sim, P.Geo.
This certificate accompanies the technical report titled Technical Report on the Mesquite Gold Mine, California, U.S.A. (the “Technical Report”) prepared for Equinox Gold Corp. (“Equinox”) dated April 27, 2020 with an effective date of December 31, 2019. I, Robert Sim, P.Geo. hereby certify the following:
I am an independent consultant of SIM Geological Inc. (SGI) and have an address at 508–1950 Robson Street, Vancouver, British Columbia, Canada V6G 1E8.
I graduated from Lakehead University with an Honours Bachelor of Science (Geology) in 1984.
I am a member, in good standing, of Engineers and Geoscientists British Columbia, License Number 24076.
I have practiced my profession continuously for 35 years and have been involved in mineral exploration, mine site geology and operations, mineral resource and reserve estimations and feasibility studies on numerous underground and open pit base metal and gold deposits in Canada, the United States, Central and South America, Europe, Asia, Africa and Australia.
I have read the definition of “qualified person” set out in National Instrument 43‐101 Standards of Disclosure for Mineral Projects (“NI 43‐101”) and certify that by reason of my education, affiliation with a professional association (as defined in NI 43‐101) and past relevant work experience, I fulfill the requirements to be a “qualified person” for the purposes of NI 43‐101.
I am responsible for the preparation of Section 14.2 of the Technical Report
I visited the Mesquite Mine site from April 8 to 9, 2015.
I am independent of Equinox applying all of the tests in Section 1.5 of NI 43‐101.
I have had prior involvement with the property that is the subject of the Technical Report. I have been responsible for the generation of mineral resource estimates for the Mesquite Mine in a previous technical report with effective date of December 31, 2018, as well as on behalf of the previous owner of the property, New Gold Inc., from 2013 to 2018.
I have read NI 43‐101 and confirm the Technical Report has been prepared in compliance with that instrument and form.
As of the effective date of the Technical Report, to the best of my knowledge, information and belief, the Sections of the Technical Report for which I am responsible contain all scientific and technical information that is required to be disclosed to make the Technical Report not misleading.
Signed and dated at Vancouver, BC, Canada on April 27, 2020.
“signed & sealed” ____________________________________ Robert Sim, P.Geo.

MESQUITE GOLD MINE, CALIFORNIA, U.S.A. TECHNICAL REPORT ON THE MESQUITE GOLD MINE, CALIFORNIA, U.S.A.
P a g e | 28‐3
27/04/2020
28.3 Gordon Zurowski, P.Eng.
I, Gordon Zurowski, P.Eng. am employed as a Principal Mine Engineer with AGP Mining Consultants Inc. (AGP) located at #246‐132K Commerce Park Drive, Barrie ON Canada. This certificate accompanies the technical report titled Technical Report on the Mesquite Gold Mine, California, U.S.A. (the “Technical Report”) prepared for Equinox Gold Corp. (“Equinox”) dated April 27, 2020 with an effective date of December 31, 2019 and I hereby certify the following:
I am a member in good standing with the Professional Engineers of Ontario (PEO) in Canada, membership #100077750.
I graduated from the University of Saskatchewan with a B.Sc. Geological Engineering, 1989.
I have practiced my profession continuously for thirty years since graduation.
I have been directly involved in mineral resource and reserve estimations and feasibility studies for over 25 years in Canada, the United States, Central and South America, Europe, Asia, Africa, and Australia. As a result of my experience and qualifications, I am a Qualified Person as defined in NI 43–101.
I visited the Mesquite Mine on October 29 to November 2, 2018.
I am responsible for Sections 2, 3, 15, 16, 18, 19, 21, 22, 23, 24, and those portions of the Summary, Interpretations and Conclusions and Recommendations that pertain to those sections.
I am independent of Equinox as described by Section 1.5 of the instrument.
I was previously involved with the Mesquite Mine project in the statement of reserves in 2019.
I have read NI 43–101 and the Technical Report sections for which I am responsible have been prepared in compliance with that Instrument.
As of the effective date of the Technical Report, to the best of my knowledge, information, and belief, the sections of the Technical Report that I am responsible for, contain all scientific and technical information that is required to be disclosed to make those sections of the technical report not misleading.
Signed and dated at Stouffville ON, on April 27, 2020.
“signed & sealed”
Gordon Zurowski, P.Eng.

MESQUITE GOLD MINE, CALIFORNIA, U.S.A. TECHNICAL REPORT ON THE MESQUITE GOLD MINE, CALIFORNIA, U.S.A.
P a g e | 28‐4
27/04/2020
28.4 Jefferey L. Woods, SME MMAS
I, Jeffrey L. Woods SME MMAS, am employed as a Principle Consulting Metallurgist with Woods Process Services LLC located at 3191 Quitman St., Denver CO 90212. This certificate accompanies the technical report titled Technical Report on the Mesquite Gold Mine, California, U.S.A. (the “Technical Report”) prepared for Equinox Gold Corp. (“Equinox”) dated April 27, 2020 with an effective date of December 31, 2019 and I hereby certify the following:
I am a member in good standing of Society for Mining, Metallurgy and Exploration, membership #4018591.
I graduated from the Mackay School of Mines, University of Nevada, Reno, Nevada, U.S.A., in 1988 with a B.S. in Metallurgical Engineering.
I have practiced my profession continuously for 32 years since graduation.
I have been directly involved in international mine operations, technical services, project development and consulting for various commodities, metals, deposits, and processes. As a result of my experience and qualifications, I am a Qualified Person as defined in NI 43–101.
I last visited the Mesquite Mine on February 17, 2020.
I am responsible for Sections 13 and 17 and those portions of the Summary, Interpretations and Conclusions and Recommendations that pertain to those sections.
I am independent of Equinox as described by Section 1.5 of the instrument.
I have had previous involvement with the Mesquite Mine for Western Goldfields in 2002 as a consultant.
I have read NI 43–101 and the Technical Report sections for which I am responsible have been prepared in compliance with that Instrument.
As of the effective date of the Technical Report, to the best of my knowledge, information, and belief, the sections of the Technical Report that I am responsible for, contain all scientific and technical information that is required to be disclosed to make those sections of the technical report not misleading.
Signed and dated in Colorado, USA this April 27, 2020.
“signed & sealed”
Jeffery L. Woods, SME MMAS

MESQUITE GOLD MINE, CALIFORNIA, U.S.A. TECHNICAL REPORT ON THE MESQUITE GOLD MINE, CALIFORNIA, U.S.A.
P a g e | 28‐5
27/04/2020
28.5 Ali Shahkar, P. Eng.
I, Ali Shahkar, P.Eng., am employed as a Principal Consultant with Lions Gate Geological Consulting Inc. located at 7629 Sechelt Inlet Road, Sechelt, British Columbia, Canada V0N 3A4. This certificate accompanies the technical report titled Technical Report on the Mesquite Gold Mine, California, U.S.A. (the “Technical Report”) prepared for Equinox Gold Corp. (“Equinox”) dated April 27, 2020 with an effective date of December 31, 2019 and I hereby certify the following:
I am a member in good standing of Engineers and Geoscientists British Columbia, license #28980. I graduated from University of British Columbia with a Bachelor of Applied Science degree in geological engineering in 1995.
I have practiced my profession continuously since 1995. I have 25 years of experience as a geologist in mineral exploration and mining, with the last 17 years specifically in resource estimation. My work experience has been focussed on exploration and modelling of precious and base metal deposits both in Canada and internationally. As a result of my experience and qualifications, I am a Qualified Person as defined in NI 43–101.
I visited the Mesquite Mine site from July 17th to 18th of 2018.
I am responsible for sections 14.1, 14.3, 14.4 and 14.5 of the technical report.
I am independent of Equinox as described by Section 1.5 of the instrument.
I was involved with the Mesquite Mine property first in 2018 during a due diligence study on the mineral resources and again since February 2019 in generating the mineral resource estimates.
I have read NI 43–101 and the sections of the Technical Report for which I am responsible have been prepared in compliance with that Instrument.
As of the effective date of the Technical Report, to the best of my knowledge, information, and belief, the sections of the Technical Report that I am responsible for, contain all scientific and technical information that is required to be disclosed to make those sections of the Technical Report not misleading.
Dated: April 27, 2020
“Signed and sealed”
Ali Shahkar, P.Eng.

MESQUITE GOLD MINE, CALIFORNIA, U.S.A. TECHNICAL REPORT ON THE MESQUITE GOLD MINE, CALIFORNIA, U.S.A.
P a g e | 28.6
27/04/2020
28.6 Nathan Earl Robison, PE
I, Nathan Earl Robison, PE am employed as a Principal Engineer with Robison Engineering Company, Inc located at 846 Victorian Avenue, Suite 20, Sparks, NV 89511, US. This certificate accompanies the technical report titled Technical Report on the Mesquite Gold Mine, California, U.S.A. (the “Technical Report”) prepared for Equinox Gold Corp. dated April 27, 2020 with an effective date of December 31, 2019 and I hereby certify the following:
I am a member in good standing of the California Board for Professional Engineers and Land Surveyors, Membership #C 64888.
I graduated from the University of Nevada, Reno in 1999.
I have practiced my profession continuously for 19 years since graduation.
I have been directly involved in mine reclamation planning, permitting, mapping, and management of both unpatented and fee simple mineral rights. As a result of my experience and qualifications, I am a Qualified Person as defined in NI 43–101.
I visited the Mesquite Mine on approximately 50 occasions to date, most recently from April 6‐8, 2019.
I am responsible for Section 20 and portions of the Summary, Interpretations and Conclusions, and Recommendations that pertain to that section.
I am independent of Western Mesquite Mines, Inc. as described by Section 1.5 of the instrument.
I have been involved with all environmental, permitting, mapping and mine planning aspects of the Mesquite Mine since reopening in 2007.
I have read NI 43–101 and the Technical Report sections for which I am responsible have been prepared in compliance with that Instrument.
As of the effective date of the Technical Report, to the best of my knowledge, information, and belief, the sections of the Technical Report that I am responsible for, contain all scientific and technical information that is required to be disclosed to make those sections of the technical report not misleading.
Signed and dated in Nevada, USA on April 27, 2020.
“signed and sealed”
Nathan Earl Robison, PE