technical report series on the study (boreas) … (npp) is determined as the difference between gpp...
TRANSCRIPT
NASA/TMm2000-209891, Vol. 54
Technical Report Series on theBoreal Ecosystem-Atmosphere Study (BOREAS)
Forrest G. Hall and Jaime Nickeson, Editors
Volume 54
BOREAS RSS-8 BIOME-BGC Model
Simulations at Tower Flux Sites in 1994
John Kimball
University of Montana, Missoula, Montana
National Aeronautics and
Space Administration
Goddard Space Flight Center
Greenbelt, Maryland 20771
August 2000
https://ntrs.nasa.gov/search.jsp?R=20010022093 2018-07-16T10:22:25+00:00Z

The NASA STI Program Office ... in Profile
Since its founding, NASA has been dedicated to
the advancement of aeronautics and spacescience. The NASA Scientific and Technical
Information (STI) Program Office plays a key
part in helping NASA maintain this importantrole.
The NASA STI Program Office is operated by
Langley Research Center, the lead center forNASA's scientific and technical information. The
NASA STI Program Office provides access to
the NASA STI Database, the largest collection of
aeronautical and space science STI in the world.
The Program Office is also NASA's institutional
mechanism for disseminating the results of its
research and development activities. These
results are published by NASA in the NASA STI
Report Series, which includes the following
report types:
• TECHNICAL PUBLICATION. Reports of
completed research or a major significant
phase of research that present the results of
NASA programs and include extensive data or
theoretical analysis. Includes compilations of
significant scientific and technical data and
information deemed to be of continuing
reference value. NASA's counterpart of
peer-reviewed formal professional papers but
has less stringent limitations on manuscript
length and extent of graphic presentations.
• TECHNICAL MEMORANDUM. Scientific
and technical findings that are preliminary or
of specialized interest, e.g., quick release
reports, working papers, and bibliographiesthat contain minimal annotation. Does not
contain extensive analysis.
• CONTRACTOR REPORT. Scientific and
technical findings by NASA-sponsored
contractors and grantees.
CONFERENCE PUBLICATION. Collected
papers from scientific and technical
conferences, symposia, seminars, or other
meetings sponsored or cosponsored by NASA.
SPECIAL PUBLICATION. Scientific, techni-cal, or historical information from NASA
programs, projects, and mission, often con-
cerned with subjects having substantial publicinterest.
TECHNICAL TRANSLATION.
English-language translations of foreign scien-
tific and technical material pertinent to NASA'smission.
Specialized services that complement the STI
Program Office's diverse offerings include creat-
ing custom thesauri, building customized data-
bases, organizing and publishing research results...
even providing videos.
For more information about the NASA STI Pro-
grain Office, see the following:
Access the NASA STI Program Home Page at
http://www, sti.nasa.gov/STI-homepage.html
E-mail your question via the Internet to
help@ sti.nasa.gov
Fax your question to the NASA Access Help
Desk at (301) 621-0134
• Telephone the NASA Access Help Desk at
(301) 621-0390
Write to:
NASA Access Help Desk
NASA Center for AeroSpace Information7121 Standard Drive
Hanover, MD 21076-1320

NASA/TMm2000-209891, Vol. 54
Technical Report Series on theBoreal Ecosystem-Atmosphere Study (BOREAS)
Forrest G. Hall and Jaime Nickeson, Editors
Volume 54
BOREAS RSS-8 BIOME-BGC Model
Simulations at Tower Flux Sites in 1994
John Kimball
University of Montana, Missoula, Montana
National Aeronautics and
Space Administration
Goddard Space Flight Center
Greenbelt, Maryland 20771
August 2000

NASA Center for AeroSpace Information7121 Standard Drive
Hanover, MD 21076-1320Price Code: A17
Available from:
National Technical Information Service
5285 Port Royal RoadSpringfield, VA 22161
Price Code: A10

BOREAS RSS-8 BIOME-BGC Model Simulations at Tower Flux Sites in1994
John S. Kimball
Summary
BIOME-BGC is a general ecosystem process model designed to simulate biogeochemical andhydrologic processes across multiple scales (Running and Hunt, 1993). In this investigation,BIOME-BGC was used to estimate daily water and carbon budgets for the BOREAS tower flux sitesfor 1994. Carbon variables estimated by the model include gross primary production (i.e., netphotosynthesis), maintenance and heterotrophic respiration, net primary production, and net ecosystemcarbon exchange. Hydrologic variables estimated by the model include snowcover, evaporation,transpiration, evapotranspiration, soil moisture, and outflow. The information provided by theinvestigation includes input initialization and model output files for various sites in tabular ASCIIformat.
Table of Contents
1) Model Overview
2) Investigator(s)3) Model Theory4) Equipment5) Data Acquisition Methods6) Observations
7) Data Description8) Data Organization9) Data Manipulations10) Errors11) Notes
12) Application of the Model13) Future Modifications and Plans14) Software15) Data Access
16) Output Products and Availability17) References
18) Glossary of Terms19) List of Acronyms20) Document Information
1. Model Overview
1.1 Model IdentificationBOREAS RSS-08 BIOME-BGC Model Simulations at Tower Flux Sites in 1994
1.2 Model Introduction
BIOME-BGC simulates biogeochemical and hydrologic processes across multiple biomes based onthe logic that differences in process rates between biomes are primarily a function of climate andgeneral life-form characteristics. The carbon balance portion of BIOME-BGC utilizes dailymeteorological data in conjunction with general stand and soil information to predict netphotosynthesis, growth, maintenance, and heterotrophic respiration at a daily time-step. BIOME-BGCis general in the sense that the surface is represented by singular, homogeneous canopy and soil layers.
Page 1
Detaileddescriptionsof BIOME-BGClogicaregivenby RunningandCoughlan(1988)andRunningandHunt (1993).A descriptionof thecomponentsof themodelrelatingto thepredictionof hydrologicandcarbonbalancecharacteristicswithin differentborealforeststandsis givenby Kimball etal.(1997a,b).A summaryof theimportantcomponentsof BIOME-BGCrelatingto thepredictionof dailycarbonallocationandexchangeisgivenbelow.
1.3 Objective/PurposeIn this investigation,BIOME-BGCwasusedto estimatedailyandannualhydrologicandcarbon
budgetsfor differentborealforeststandsassociatedwith theBORealEcosystem-AtmosphereStudy(BOREAS)towerflux sites,andnetcarbonflux estimateswerecomparedwith resultsderivedfromtowerflux andbiomassmeasurementdata.Theseresultswereusedto assesstheimportantclimateandstandcharacteristicsthatcontrolstandhydrologiccharacteristics,estimatedproductivityrespiration,andsurface-atmospherecarbonexchange.
Theseresultsconstitutethe initial effortin 1996to simulatehydrologicandcarbonexchangeprocessesfor differentborealforeststands.Theresultsareexpectedto changeasthemodelsarefurthermodifiedanddevelopedto reflectinsightgainedfrom newresearchregardingborealforestprocesses.Theseresultsareintendedto provideaframeworkfor evaluatingthesensitivityof theborealforestregionalcarbonbalanceto globalwarming.
1.4 Summary of Parameters and Variables
Model daily Greenwich Mean Time (GMT) input requirements:• Maximum and minimum daily air temperature (°C)• precipitation (cm)• total daily solar radiation (kJ)• daylength (s)
There is also a site initialization file that describes stand morphology and soil characteristics.Parameters included in this file are discussed in Section 1.5. Site initialization files that were used to
generate model results for the sites in this investigation are provided.
Model daily (GMT) carbon outputs:Net photosynthesis gross primary production (GPP); maintenance (Rm), growth (Rg),
heterotrophic (Rh), and total respiration (Rtot); net ecosystem carbon exchange (NEE). Rm representsthe daily sum of estimated Rm rates from coarse and fine root, sapwood, and foliar carbon pools.Foliar respiration is computed as the sum of estimated day and night foliar respiration rates. GPP iscomputed as the difference between gross photosynthesis and day leaf respiration. Net primaryproduction (NPP) is determined as the difference between GPP and Rm. Rg was estimated as 32% ofthe daily difference between GPP and Rm. Rh is estimated as a proportion of prescribed soil and littercarbon pools; estimated soil water potential and soil temperature conditions regulate this proportion.Rtot is estimated as the sum of Rm, Rg, and Rh. NEE is estimated as the difference between GPP andRtot.
Model daily (GMT) hydrologic outputs:Evaporation, transpiration, evapotranspiration, soil moisture, snow water equivalent.
1.5 Discussion
BIOME-BGC simulates biogeochemical and hydrologic processes across multiple biomes based onthe logic that differences in process rates between biomes are primarily a function of climate andgeneral life-form characteristics. The carbon balance portion of BIOME-BGC utilizes dailymeteorological data in conjunction with general stand and soil information to predict netphotosynthesis, growth, maintenance and heterotrophic respiration at a daily time-step. BIOME-BGCis general in the sense that the surface is represented by singular, homogeneous canopy and soil layers.Detailed descriptions of BIOME-BGC logic are given by Running and Coughlan (1988) and Running
Page 2

andHunt (1993).Kimball et al. (1997a,b)givesadescriptionof thecomponentsof themodelrelatingto thepredictionof hydrologicandcarboncharacteristicswithin differentborealforeststands.Asummaryof theimportantcomponentsof BIOME-BGCrelatingto thepredictionof dailycarbonallocationandexchangeisgivenin Section3.
1.6 Related ModelsTheseresultsrepresentsite-specificmodelrunsusingBIOME-BGC.BIOME-BGCwill alsobe
usedwithin thecontextof aRegionalHydro-EcologicalSimulationSystem(RHESSys)to generatelandscape-levelestimatesof 1994dailyhydrologicandcarbonfluxeswithin theBOREAS1000-kinx1000-kinstudyregion.A detaileddescriptionof theRHESSysmodelisgivenby Bandetal. (1991,1993).
2. Investigator(s)
2.1 Investigator(s) Name and TitleSteven W. Running and John S. Kimball (TE-21 and RSS-8)NTSG School of ForestryUniversity of MontanaMissoula, MT 59812
2.2 Title of InvestigationBIOME-BGC simulations of stand hydrology, productivity, surface-atmosphere carbon and water
exchange at selected BOREAS tower flux sites for 1994
2.3 Contact Information
Contact 1"John S. Kimball
NTSG School of ForestryUniversity of MontanaMissoula, MT 59812(406) 243-5616(406) 243-4510 (fax)email: [email protected]
Contact 2"Jaime Nickeson
NASA/GSFCCode 923
Bldg. 22, Rm. C89Greenbelt, MD 20071(301) 286-3373(301) 286-0239 (fax)Jaime.Nickeson@ gsfc.nasa.gov
3. Model Theory
The sole input to the carbon budget in BIOME-BGC is the photosynthetic fixation of CO2 by the
vegetation canopy. All outputs are in the form of respired CO2, coming either from plant tissues
because of growth or maintenance respiration, or from the litter and soil carbon pools as the result ofheterotrophic respiration.
Page 3
GPPrepresentsthesystem'stotalgainof carbonby netphotosynthesisandis definedasthedailysumof grossphotosynthesisanddaily foliar respiration.Thecurrentrepresentationof photosynthesisdifferssignificantlyfrom previouslypublisheddescriptionsof theBGCfamily of models(RunningandHunt, 1993;HuntandRunning,1992;RunningandCoughlan,1988).TheoriginalFOREST-BGCrepresentationof photosynthesisreliesprimarily ontheparameterizationof amesophyllconductanceto CO2,estimatingtherateof fixation asadiffusionprocess,drivenby aprescribedinternalCO2concentration.FOREST-BGCalsodoesnot implementanexplicittreatmentofthephotosyntheticbiochemicalpathways.Theoriginalversionof BIOME-BGCpresentsamoredetailedrepresentationof photosynthesis,relyingonexplicitmodelsof photosyntheticbiochemistry(Leuning,1990;Farquharet al., 1980).TheoriginalBIOME-BGCalsoincludesaniterativecalculationof intracellularCO2 concentration (Ci), as well as an explicit calculation of the CO2
compensation point. The current implementation of photosynthetic biochemistry is closely related tothe original BIOME-BGC logic in that it is based on the Farquhar biochemical model, but the resultingset of equations is somewhat different because of differences in the logical constraints applied: aquadratic system of equations is solved by eliminating Ci, instead of by specifying a value as an initialcondition. Other differences include a more detailed dependence of the kinetic parameters ontemperature (Woodrow and Berry, 1988) and a simplifying assumption that empirically relates themaximum rate of electron transport to the maximum carboxylation velocity (Wullschleger, 1993).
Photosynthesis is regulated by the canopy conductance to CO2 (gc), leaf maintenance respiration,
and daily meteorological conditions, including air pressure, air temperature, and photosyntheticallyactive photon flux density (PPFD). The maximum canopy conductance to CO2 (gc max) defines the
upper boundary of the photosynthetic rate and is determined by leaf area index (LAI) and prescribedleaf-scale boundary layer, cuticular, and maximum stomatal conductances; gc is reduced when airtemperature, vapor pressure deficit (VPD), PPFD, or soil water potential deviate from prescribedoptimal conditions (Leuning, 1990; Running and Coughlan, 1988; Jarvis and Morison, 1981).BIOME-BGC represents the canopy as a "big leaf" in that all units of leaf area in the canopy arerepresented using a single, canopy-averaged conductance. This assumption is generally not valid atsubdaily (e.g., hourly) time-steps because the reduction of irradiance at lower vertical layers of thecanopy reduces conductances at the bottom of the canopy. The big leaf assumption is strengthened,however, by the integrative effects of a daily time-step and by the implicit assumption that theallocation of leaf nitrogen between light harvesting and carbon fixing enzymes over depth in thecanopy varies in response to the canopy light environment, allowing an optimized use of interceptedradiation (Evans, 1989).
Total respiration from the system (Rtot) is estimated on a daily basis as the sum of the maintenance(Rm), heterotrophic (Rh) and growth (Rg) respiration components. Rm represents the total loss ofcarbon due to day and night leaf respiration (Rdl + Rnl), sapwood (Rsw), coarse root (Rcr) and fineroot (Rfr) respiration. Respiration is estimated as a daily proportion of carbon in living tissue that isreleased as the result of cellular metabolic processes, excluding any growth processes. Rm iscalculated from mean daily air temperatures and prescribed leaf, root, and sapwood carbon pools usingan exponentially increasing function of respiration with temperature following Amthor (1986). Themagnitude of the respiration response to temperature is governed by a prescribed rate defined at areference temperature (i.e. 15°C) and a proportional change in rate for a 10°C change in temperature(Q10). In all cases except leaf maintenance respiration, the daily average temperature is used, and asingle value is calculated for the mass lost to maintenance respiration for the day. In the case of leaves,however, Rdl and Rnl rates are calculated from estimated day and night air temperatures, respectively,because Rdl is required to determine GPP. Daily growth respiration was not determined explicitly bythe model in this investigation; instead, Rg was computed as a proportion (32%) of the daily differencebetween GPP and Rm (Penning de Vries et al., 1974).
The heterotrophic respiration term in BIOME-BGC represents the system's loss of carbon causedby soil microbial respiration. Daily Rh is estimated as a proportion of prescribed soil and litter carbonpools. The proportion of litter carbon being respired on a daily basis is regulated by soil water potentialand soil temperature conditions following Orchard and Cook (1983), Andren and Paustian (1987), andRunning and Coughlan (1988). The proportion of soil carbon respired on a daily basis was estimatedas 1% of the proportion of litter carbon respired based on data for boreal coniferous and deciduous
Page 4

stands(FoxandVanCleve, 1983;ColeandRapp,1981).NPPrepresentsthenetaccumulationof carbonby thestandandis determinedasthedifference
betweenGPPandthesumof RmandRg.NEErepresentsthenetaccumulationor lossof carbonbytheentiresoil-standsystemandisdeterminedasthedifferencebetweenGPPandRtot.Positivefluxesin this investigationdenoteanetuptakeof carbonby thesystemwhilenegativefluxesdenoteanetloss.Standardsfor denotingpositiveandnegativefluxesgenerallyvarybetweendifferentdisciplines,however,andnetcarbonuptakeis oftendenotedasanegativeflux in theliterature.
BIOME-BGCusesdailymaximumandminimumair temperatures,humidity,incidentsolarradiation,andprecipitationto determinedailycarbonandwaterfluxes.Averagedaily incidentshortwaveradiation(Qi) wassimulatedusingMT-CLIM logic describedbyRunninget al. (1987).Averagedailynetsolarradiation(Qn)wasestimatedusingaprescribed,constantalbedoforvegetation.QnwasattenuatedthroughthevegetationcanopyusingBeer'sformulationandaprescribedextinctioncoefficientmodulatedbyLAI to derivetheamountof solarradiationtransmittedthroughthecanopy(Qt).Theamountof solarradiationabsorbedby thecanopy(Qa)wasestimatedasthedifferencebetweenQi andQt.PPFDwasestimatedbasedontheassumptionthatphotosyntheticallyactiveradiationrepresentsapproximately50%of Qa(RunningandCoughlan,1988).
Meandailyair temperature(Ta)wasestimatedastheaverageof themeasureddailymaximumandminimumair temperatures.Minimumdailyair temperaturewasassumedequalto themeandailydewpointandwasusedto estimatethemeandailyVPD.Daily soiltemperaturesata30-cmsoildepth(Tsoil) wereestimatedusingan11-dayrunningaverageof Ta (Zhengetal., 1993).Soil waterpotential(PSI)wasestimatedfrom soilwatercontent,soildepth,andtextureinformationfollowingCosbyet al. (1984).Ta,VPD, PPFD,andPSIwereusedto estimategcandGPPfollowing JarvisandMorison(1981)andFarquharandvonCaemmerer(1982),respectively.TaandTsoilwereusedtoestimateRm,whileTsoil andPSIwereusedto estimateRh (RunningandCoughlan,1988).
4. Equipment
BIOME-BGC is written in C with no specific hardware requirements.
5. Data Acquisition Methods
The model requires a daily meteorological data file. This file consists of six columns that are spacedelimited with each row of the file representing a specific day of the year. Column 1 represents the dayof year (Julian day format, 1-365), column 2 represents precipitation (cm), column 3 representsmaximum 24-hr daily air temperature (°C), column 4 represents minimum 24 hr daily air temperature(°C), column 5 represents total daily solar radiation (direct+diffuse, kJ), and column 6 represents thedaylength (s). A second file is also required that defines site initialization parameters such as soil, litter,leaf and sapwood carbon pools, and soil type and condition. A detailed discussion of the developmentof the tower site initialization parameter files is presented below.
BIOME-BGC requires general information about stand morphology and soil characteristics inorder to simulate the water and carbon balance at a site. Information required by the model to defineinitial hydrologic characteristics of the study sites is given by Kimball et al. (1997a,b). A list of criticalparameters used to define soil and stand carbon characteristics at the eight study sites can be foundthere in Table 1. These parameters were held constant throughout the model runs. Soil parameterswere derived from measurements collected at the sites during 1994 by Cuenca et al. (1997) and valuesreported in the literature for representative soil types (Hillel, 1980). The soil depth was set at 0.5 mand assumed homogeneous in regard to soil mineralized carbon, structure, and soil moisturecharacteristics. Mean daily stand solar albedos for snow-free conditions were estimated from siteobservations (Sellers et al., 1995).
Estimates of average annual LAI were derived from effective LAI measurements conducted over
Page 5

approximatelythreeperiodsduringthe1994growingseasonateachstudysiteby Chen(1996).EffectiveLAI wasmeasuredusingaLI-CORLAI-2000plantcanopyanalyzerandadjustedfor foliageclumping.Specificleafarea(SLA)andleafnitrogenlevelsweredeterminedfrom pluckedneedleandleafmeasurementsatthespruce,jack pine,andaspensitesby Margolisetal. (1996unpublisheddata).Theamountsof leafnitrogenin ribulosebisphosphatecarboxylase-oxygenase(RuBisCO)wereestimatedfrom theliteraturefor representativecovertypes(FieldandMooney,1986).Leaf carbonwasderivedfrom LAI andSLA information.Sapwoodcarbonwasestimatedfrom sapwoodbiomassmeasurementscollectedby Goweret al. (1996unpublisheddata)at theblackspruce,aspenandjackpinesitesandestimatesof therelativeproportionsof sapwoodlive cells(WaringandSchlesinger,1985).Coarserootcarbonwasestimatedto beapproximately25%of sapwoodcarbon(e.g.,Grieretal., 1981;Grier andLogan,1977).
Theamountof carbonattributedto fine rootbiomassishighlyvariabledependingonspeciestype,standage,andnutrientavailability.Processesgoverningthepartitioningof carbonbetweenroot andfoliar biomassaregenerallypoorlyunderstoodandnotwell quantifiedin theliterature.Observationshaveshown,however,thatfine rootbiomassis generallygreaterthanfoliar biomassin nutrient-limitedsystems,whichoftenoccurin borealandcold temperateforestsandmayrepresentanadaptationtomaximizenutrientuptake(Nadelhofferetal., 1985;KeyesandGrier, 1981;Tetrealtet al., 1978).Soilcarbonattributedto fine rootswasestimatedfrom 1.5SouthernStudyAreaOld Aspen(SSA-OA)to3.5SSA-OldJackPine(OJP)timestheestimatedleaf carbonbasedonobservationsfrom borealandcold temperateconiferousanddeciduousstandsonnutrient-poorsites(Goweret al., 1992;ComeauandKimmins, 1989;Nadelhofferetal.; 1985;LinderandAxelson,1982;PeralaandAlban, 1982;KeyesandGrier, 1981).Soil litter andmineralizedorganiccarbonpoolswithin theprescribed0.5-msoildepthswereestimatedfrom soil layerdepth,bulk densityandpercentorganiccarbonmeasurementsconductedateachof thestudysitesby Andersonetal. (1995unpublisheddata).
Leaf,stem,coarse,andfine rootmaintenancerespirationcoefficientswereestimatedfrommeasuredratesfor coniferousanddeciduouscovertypes(Sprugelet al., 1995).All otherecophysiologicalparameterswereobtainedfrom theliteraturefor generalcovertypes(e.g.,Sprugeletal., 1995;Nobel, 1991;Waring andSchlesinger,1985).
6.1 Data NotesNone.
6.2 Field NotesNone.
6. Observations
7. Data Description
7.1 Spatial Characteristics
7.1.1 Spatial Coverage
These results constitute point simulations of the BOREAS NSA-Old Black Spruce (NOBS) andYoung Jack Pine (NYJP) and SSA-Old Aspen (SOA), Old Black Spruce (SOBS) and Old Jack Pine(SOJP) tower flux sites.
7.1.2 Spatial Coverage Map
Not applicable.
7.1.3 Spatial ResolutionTower site.
Page 6

7.1.4 Projection
Not applicable.
7.1.5 Grid Description
Not applicable.
7.2 Temporal Characteristics
7.2.1 Temporal Coverage
BIOME-BGC was run over a 2-year period at each study site. The model was initialized using1989 AMS mesonet station meteorological data from the Thompson airport (55.8 ° N, 97.9 ° W) forstudy sites in the Northern Study Area (NSA), and from Prince Albert airport (53.2 ° N, 105.7 ° W) andWaskesiu Lake (53.9 ° N, 106.1 ° W) for study sites in the SSA (Shewchuk, 1997). All analyses ofmodel results were done for the second year using the 1994 meteorological data base described inSection 7.3.
7.2.2 Temporal Coverage Map
Not applicable.
7.2.3 Temporal Resolution
Daily.
7.3 Data Characteristics
BIOME-BGC requires two input files (daily meteorological data and initialization data) to generatetwo output files of daily estimates of site hydrologic and carbon balance characteristics. Theinitialization file provides site-specific information about stand morphology, soil type, and soilcondition. The meteorological data file and output files are described further in subsequent sections.
Organized by site, the names of the initialization, meteorology, and output files provided are:
NSA-OBS-FLXTR.IN INI
NSA-OBS-FLXTR.IN MET
NSA-OBS-FLXTR.OUT CARB
NSA-OBS-FLXTR.OUT HYD
NSA-YJP-FLXTR.IN INI
NSA-YJP-FLXTR.IN MET
NSA-YJP-FLXTR.OUT CARB
NSA-YJP-FLXTR.OUT HYD
SSA-9OA-FLXTR.IN INI
SSA-9OA-FLXTR.IN MET
SSA-9OA-FLXTR.OUT CARB
SSA-9OA-FLXTR.OUT HYD
SSA-OBS-FLXTR.IN INI
SSA-OBS-FLXTR.IN MET
SSA-OBS-FLXTR.OUT CARB
SSA-OBS-FLXTR.OUT HYD
SSA-OJP-FLXTR.IN INI
SSA-OJP-FLXTR.IN MET
SSA-OJP-FLXTR.OUT CARB
SSA-OJP-FLXTR.OUT HYD
Page 7

Air temperature,solarradiation,andprecipitationweremeasuredat approximate15-minuteintervalsateachof thestudysitesduring1994.ThesedatawereobtainedfromBOREASprincipalinvestigatorsateachstudysiteandtheSaskatchewanResearchCouncil'smesonetdatabase(BOREASScienceTeam1995).The1994meteorologicalrecordsfor eachstudysitewereincompletebecauseof periodsofinstrumentmalfunction,calibration,andmeasurementinactivity.Continuousmeteorologicalrecordsfor 1994wereobtainedfor eachstudysiteby temporallyinterpolatingmissingdataor substitutingdatafrom adjacentsites.Daily maximumandminimumair temperatures,precipitation,andsolarradiationwerethenderivedfrom thecontinuousdatarecordsfor eachsiteandusedto generatemodelresults.
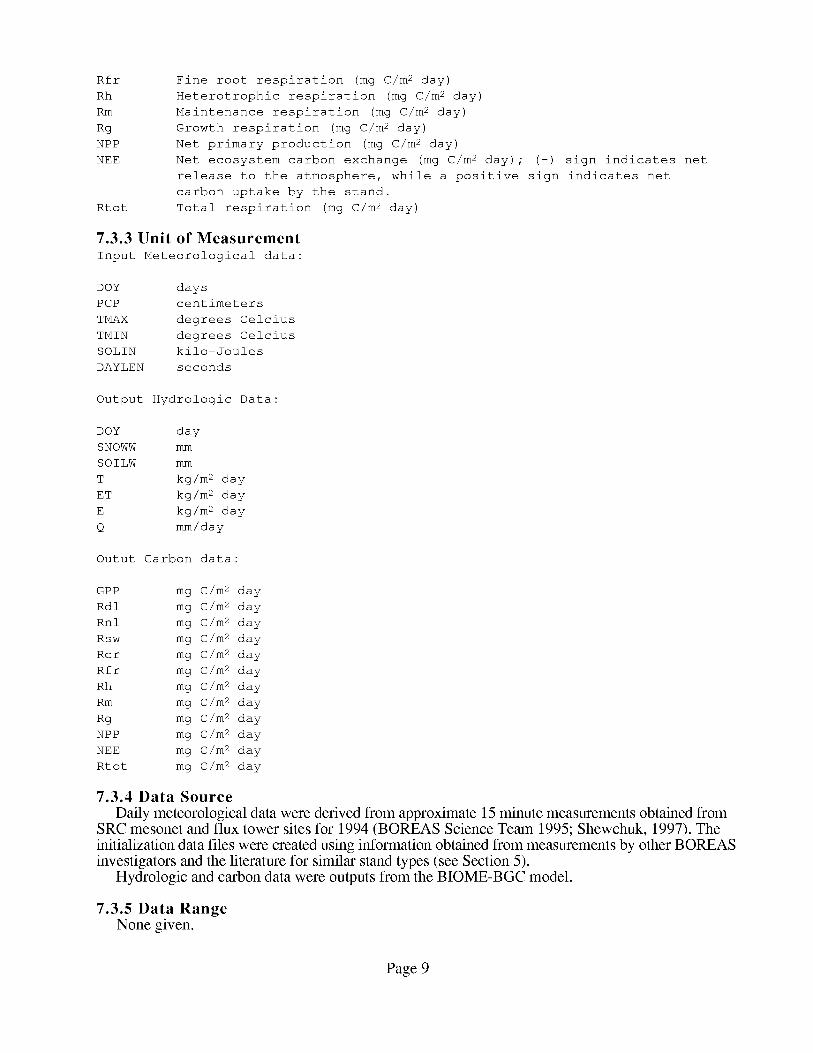
7.3.1 Parameter/Variables
Input Meteorological data:
DOY PCP TMAX TMIN SOLIN DAYLEN
Output Hydrologic Data:
DOY SNOWW SOILW T ET E Q
Output Carbon data:
DOY GPP Rdl Rnl Rsw Rcr
**NOTE: NEE denoted with a
from the stand to the atmosphere, while
net carbon uptake by the stand.
7.3.2 Variable Description/Definition
Input Meteorological data:
Rfr Rh Rm Rg NPP NEE Rtot
(-) sign indicates net carbon release
a positive sign indicates
DOY Day of year (1-365)
PCP daily precipitation (cm)
TMAX maximum 24-hour air temperature
TMIN minimum 24-hour air temperature
SOLIN total daily solar radiation (kJ)
DAYLEN daylength (s)
Output Hydrologic Data:
(°C)
(°C)
DOY julian day
SNOWW Snow water equivalent of the snowcover (mm)
SOILW Water held in the soil layer (mm)
T Transpiration from the canopy (kg/m 2 day)
ET Evapotranspiration (kg/m 2 day)
E Evaporation from the canopy and surface (kg/m 2 day)
Q outflow (ram/day)
Output Carbon data:
production (mg C/m 2 day)
DOY
GPP
Rdl
Rnl
Rsw
Rcr
Julian day
Net daily photosynthesis or gross primary
Daytime leaf respiration (mg C/m 2 day)
Night leaf respiration (mg C/m 2 day)
Sapwood respiration (mg C/m 2 day)
Coarse root respiration (mg C/m 2 day)
Page 8
Rfr
Rh
Rm
Rg
NPP
NEE
Rtot
Fine root respiration (mg C/m 2 day)
Heterotrophic respiration (mg C/m 2 day)
Maintenance respiration (mg C/m 2 day)
Growth respiration (mg C/m 2 day)
Net primary production (mg C/m 2 day)
Net ecosystem carbon exchange (mg C/m 2 day); (-) sign indicates net
release to the atmosphere, while a positive sign indicates net
carbon uptake by the stand.
Total respiration (mg C/m 2 day)
7.3.3 Unit of Measurement
Input Meteorological data:
DOY days
PCP centimeters
TMAX degrees Celcius
TMIN degrees Celcius
SOLIN kilo-Joules
DAYLEN seconds
Output Hydrologic Data:
DOY day
SNOWW mm
SOILW mm
T kg/m 2 day
ET kg/m 2 day
E kg/m 2 day
Q mm/day
Outut Carbon data:
GPP mg C/m 2 day
Rdl mg C/m 2 day
Rnl mg C/m 2 day
Rsw mg C/m 2 day
Rcr mg C/m 2 day
Rfr mg C/m 2 day
Rh mg C/m 2 day
Rm mg C/m 2 day
Rg mg C/m 2 day
NPP mg C/m 2 day
NEE mg C/m 2 day
Rtot mg C/m 2 day
7.3.4 Data Source
Daily meteorological data were derived from approximate 15 minute measurements obtained fromSRC mesonet and flux tower sites for 1994 (BOREAS Science Team 1995; Shewchuk, 1997). The
initialization data files were created using information obtained from measurements by other BOREASinvestigators and the literature for similar stand types (see Section 5).
Hydrologic and carbon data were outputs from the BIOME-BGC model.
7.3.5 Data Range
None given.
Page 9
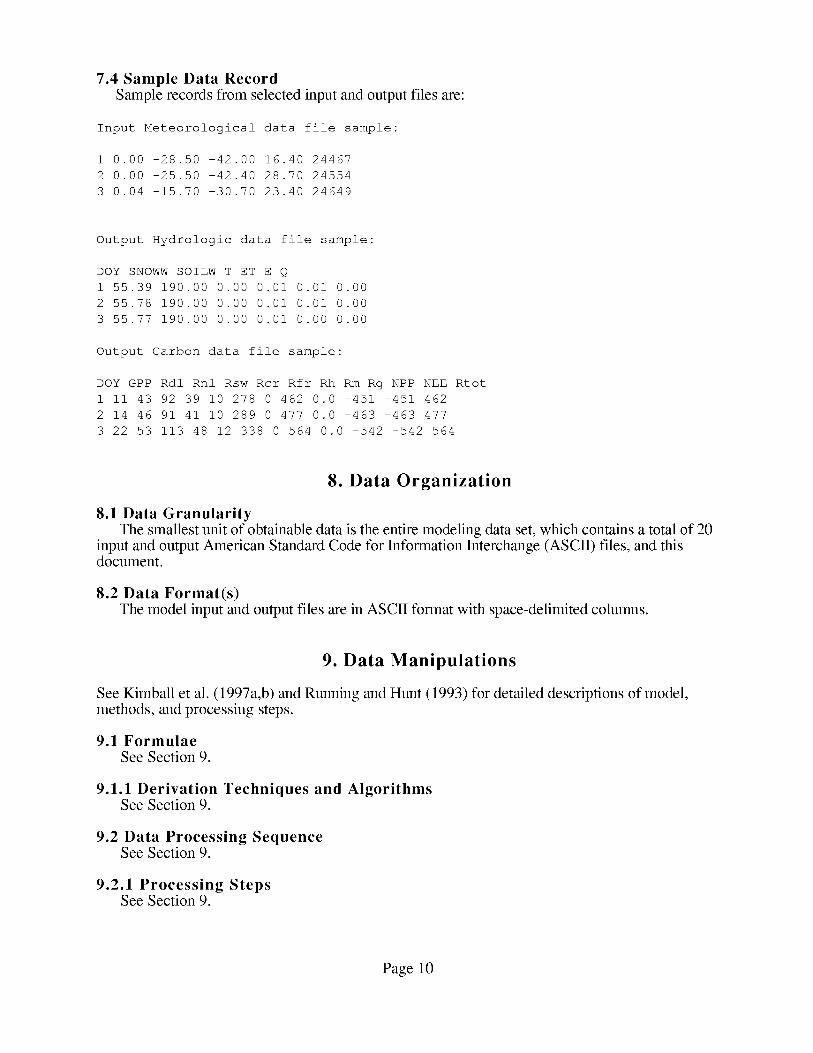
7.4 Sample Data Record
Sample records from selected input and output files are:
Input Meteorological data file sample:
i 0.00 -28.50 -42.00 16.40 24467
2 0.00 -25.50 -42.40 28.70 24554
3 0.04 -15.70 -30.70 23.40 24649
Output Hydrologic data file sample:
DOY SNOWW SOILW T ET E Q
1 55.39 190.00 0.00 0.01 0.01 0.00
2 55.78 190.00 0.00 0.01 0.01 0.00
3 55.77 190.00 0.00 0.01 0.00 0.00
Output Carbon data file sample:
DOY GPP Rdl Rnl Rsw Rcr Rfr Rh Rm Rg NPP NEE Rtot
1 ii 43 92 39 i0 278 0 462 0.0 -451 -451 462
2 14 46 91 41 i0 289 0 477 0.0 -463 -463 477
3 22 53 113 48 12 338 0 564 0.0 -542 -542 564
8. Data Organization
8.1 Data GranularityThe smallest unit of obtainable data is the entire modeling data set, which contains a total of 20
input and output American Standard Code for Information Interchange (ASCII) files, and thisdocument.
8.2 Data Format(s)The model input and output files are in ASCII format with space-delimited columns.
9. Data Manipulations
See Kimball et al. (1997a,b) and Running and Hunt (1993) for detailed descriptions of model,methods, and processing steps.
9.1 FormulaeSee Section 9.
9.1.1 Derivation Techniques and AlgorithmsSee Section 9.
9.2 Data Processing SequenceSee Section 9.
9.2.1 Proeessing StepsSee Section 9.
Page 10

9.2.2 Processing ChangesSee Section 9.
9.3 CalculationsSee Section 9.
9.3.1 Special Corrections/Adjustments
Not applicable.
9.3.2 Calculated VariablesSee Sections 7.3.1 and 7.3.272.
9.4 Graphs and Plots
Not applicable.
10. Errors
10.1 Sources of Error
BIOME-BGC is a process-level model designed to be general enough to apply at regional to globalscales. The model uses several simplifying assumptions regarding stand and meteorological conditionsin order to facilitate application at regional scales. A fundamental model assumption for thisinvestigation was that stand physiological conditions such as age, stand structure, LAI, and carbonstorages were spatially and temporally uniform on an annual basis. Soil conditions such as depth,density, and moisture content were also assumed spatially uniform with no lateral or subsurfacedrainage. Stand conditions at the study sites were both spatially and temporally diverse and werecomposed of different age types, biomass densities, and species compositions (Sellers et al., 1995).Some sites also had significant vegetation understories that were not explicitly modeled in thisinvestigation. Evidence suggests that these vegetation types contributed significantly to the dailycarbon budget (e.g., Black et al., 1996). Further discussion of potential error sources for thisinvestigation is given by Kimball et al. (1997a,b).
10.2 Quality AssessmentSee Section 10.1.
10.2.1 Model Validation by SourceModel results were compared with daily carbon and water fluxes derived from site tower flux
measurements for 1994. Model estimates of annual NPP were also compared with NPP estimatesderived from site biomass measurements and allometric equations for 1994 (Gower et al., unpublisheddata). Model estimates of SNOWW and SOILW were compared with measured data for 1994(Shewchuck, 1997). Detailed discussions of these comparisons are given by Kimball et al. (1997a,b).
10.2.2 Confidence Level/Accuracy JudgmentCurrently, there is not enough information regarding measurement error associated with model
inputs or model sensitivity to these inputs to establish documented confidence levels in model results.This problem is currently being addressed using sensitivity analyses with multiple-year data and spatialaggregations of remote sensing inputs for the BOREAS region. This work is being funded under adifferent, but related, project with the jet propulsion Laboratory (JPL). Also see Section 10.2.1.
10.2.3 Measurement Error for ParametersSee Section 10.2.2.
10.2.4 Additional Quality AssessmentsSee Sections 10.1 and 10.2.1.
Page 11

10.2.5 Data Verification by Data Center
BOREAS Information System (BORIS) staff have looked at the input and output files andreviewed the model documentation.
11.
11.1 Limitations of the ModelSee Sections 10.1 and 10.2.1.
11.2 Known Problems with the ModelSee Sections 10.1 and 10.2.1.
11.3 Usage GuidanceNone.
11.4 Other Relevant InformationNone.
Notes
12. Application of the Model
These results constitute the initial effort in 1996 to simulate hydrologic and carbon exchange processesfor different boreal forest stands. These results are expected to change as the models are furthermodified and developed to reflect insight gained from new research regarding boreal forest processes.These results are intended for comparison with other models.
13. Future Modifications and Plans
This model will be used in the context of RHESSys to generate landscape-level estimates of daily andannual water and carbon exchange processes over the 1,000-kin x 1,000-kin BOREAS grid at a 1-kinspatial resolution.
Carbon allocation, growth respiration, and nitrogen cycle routines will be activated (see Runningand Hunt, 1993), and model runs will be conducted over longer time periods (50 to several hundredyears) to investigate the effects of interannual climate variations on site to regional water and carbonbudgets.
A sensitivity analysis with multiple-year data and spatial aggregations of remote sensing inputs forthe BOREAS region is currently underway. This work is being funded under a different, but related,project with JPL.
14. Software
14.1 Software Description
BIOME-BGC was written in C on a UNIX platform.
14.2 Software Access
To request a copy of the model, please send email to one of the individuals from the University ofMontana listed in Section 2.3.
14.3 Software/Platform LimitationsNone known.
Page 12

15. Data Access
The RSS-08 BIOME-BGC model files are available from the Earth Observing System Data andInformation System (EOSDIS) Oak Ridge National Laboratory (ORNL) Distributed Active ArchiveCenter (DAAC).
15.1 Contact Information
For BOREAS data and documentation please contact:
ORNL DAAC User Services
Oak Ridge National LaboratoryP.O. Box 2008 MS-6407
Oak Ridge, TN 37831-6407Phone: (423) 241-3952Fax: (423) 574-4665E-mail: [email protected] or [email protected]
15.2 Data Center Identification
Earth Observing System Data and Information System (EOSDIS) Oak Ridge National Laboratory(ORNL) Distributed Active Archive Center (DAAC) for Biogeochemical Dynamicshttp://www-eosdis.ornl.gov/.
15.3 Procedures for Obtaining DataUsers may obtain data directly through the ORNL DAAC online search and order system
[http://www-eosdis.ornl.gov/] and the anonymous FTP site [ftp://www-eosdis.ornl.gov/data/] or bycontacting User Services by electronic mail, telephone, fax, letter, or personal visit using the contactinformation in Section 15.1.
15.4 Data Center Status/Plans
The ORNL DAAC is the primary source for BOREAS field measurement, image, GIS, andhardcopy data products. The BOREAS CD-ROM and data referenced or listed in inventories on theCD-ROM are available from the ORNL DAAC.
16. Output Products and Availability
16.1 Tape ProductsNone.
16.2 Film ProductsNone.
16.3 Other Products
Model results are stored as ASCII files and are available either online or by contacting BORIS staffdirectly. See Section 15.1.
Page 13
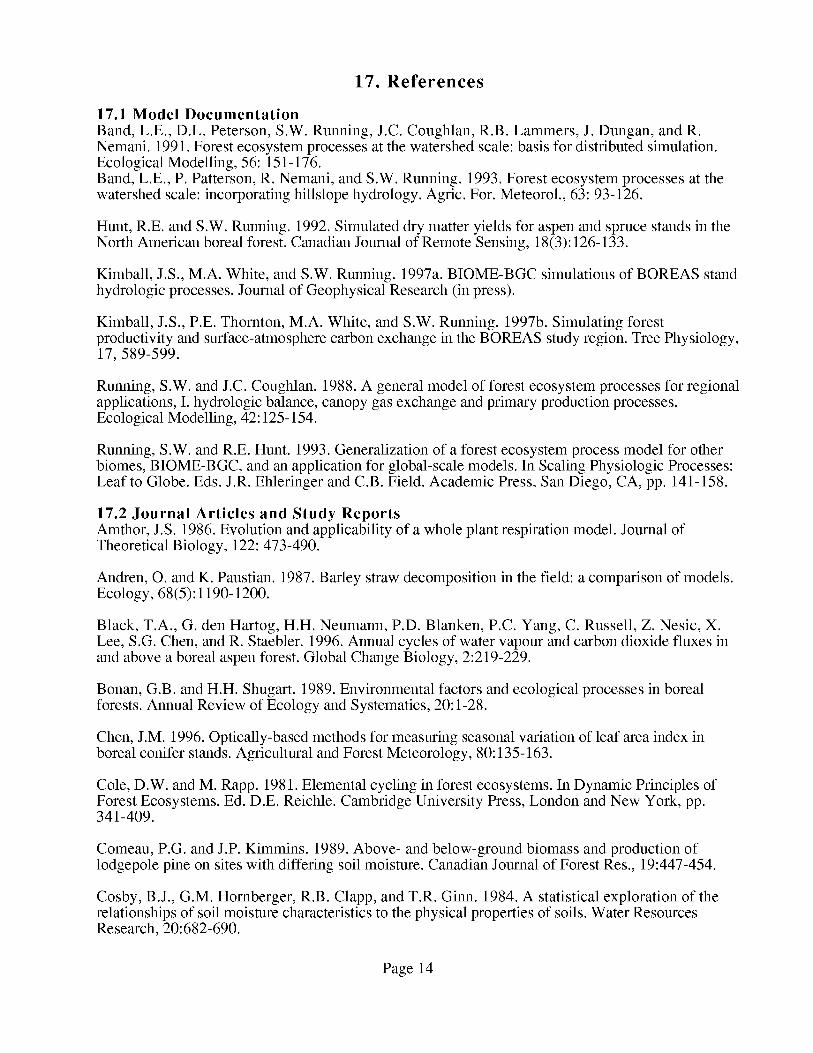
17. References
17.1 Model Documentation
Band, L.E., D.L. Peterson, S.W. Running, J.C. Coughlan, R.B. Lammers, J. Dungan, and R.Nemani. 1991. Forest ecosystem processes at the watershed scale: basis for distributed simulation.Ecological Modelling, 56:151-176.Band, L.E., P. Patterson, R. Nemani, and S.W. Running. 1993. Forest ecosystem processes at thewatershed scale: incorporating hillslope hydrology. Agric. For. Meteorol., 63: 93-126.
Hunt, R.E. and S.W. Running. 1992. Simulated dry matter yields for aspen and spruce stands in theNorth American boreal forest. Canadian Journal of Remote Sensing, 18(3): 126-133.
Kimball, J.S., M.A. White, and S.W. Running. 1997a. BIOME-BGC simulations of BOREAS standhydrologic processes. Journal of Geophysical Research (in press).
Kimball, J.S., P.E. Thornton, M.A. White, and S.W. Running. 1997b. Simulating forestproductivity and surface-atmosphere carbon exchange in the BOREAS study region. Tree Physiology,17, 589-599.
Running, S.W. and J.C. Coughlan. 1988. A general model of forest ecosystem processes for regionalapplications, I. hydrologic balance, canopy gas exchange and primary production processes.Ecological Modelling, 42:125-154.
Running, S.W. and R.E. Hunt. 1993. Generalization of a forest ecosystem process model for otherbiomes, BIOME-BGC, and an application for global-scale models. In Scaling Physiologic Processes:Leaf to Globe. Eds. J.R. Ehleringer and C.B. Field. Academic Press, San Diego, CA, pp. 141-158.
17.2 Journal Articles and Study ReportsAmthor, J.S. 1986. Evolution and applicability of a whole plant respiration model. Journal ofTheoretical Biology, 122: 473-490.
Andren, O. and K. Paustian. 1987. Barley straw decomposition in the field: a comparison of models.Ecology, 68(5): 1190-1200.
Black, T.A., G. den Hartog, H.H. Neumann, P.D. Blanken, P.C. Yang, C. Russell, Z. Nesic, X.Lee, S.G. Chen, and R. Staebler. 1996. Annual cycles of water vapour and carbon dioxide fluxes inand above a boreal aspen forest. Global Change Biology, 2:219-229.
Bonan, G.B. and H.H. Shugart. 1989. Environmental factors and ecological processes in borealforests. Annual Review of Ecology and Systematics, 20:1-28.
Chen, J.M. 1996. Optically-based methods for measuring seasonal variation of leaf area index inboreal conifer stands. Agricultural and Forest Meteorology, 80:135-163.
Cole, D.W. and M. Rapp. 1981. Elemental cycling in forest ecosystems. In Dynamic Principles ofForest Ecosystems. Ed. D.E. Reichle. Cambridge University Press, London and New York, pp.341-409.
Comeau, P.G. and J.P. Kimmins. 1989. Above- and below-ground biomass and production oflodgepole pine on sites with differing soil moisture. Canadian Journal of Forest Res., 19:447-454.
Cosby, B.J., G.M. Hornberger, R.B. Clapp, and T.R. Ginn. 1984. A statistical exploration of therelationships of soil moisture characteristics to the physical properties of soils. Water ResourcesResearch, 20:682-690.
Page 14

Edwards,N.T., H.H. Shugart,S.B.McLaughlin, W.F. Harris, andD.E. Reichle.1981.Carbonmetabolismin terrestrialecosystems.In InterBiol.ProgrammeNo. 23,"DynamicPropertiesof ForestEcosystems."Ed. D.E.Reichle.CambridgeUniversityPress,LondonandNewYork, pp499-536.
Evans,J.R.1989.Photosynthesisandnitrogenrelationshipsin leavesof C3plants.Oecologia,78:9-19.
Farquhar,G.D. 1989.Modelsof integratedphotosynthesisof cellsandleaves.Phil. Trans.Roy.Soc.Lond., 323B:357-367.
Farquhar,G.D. andS.vonCaemmerer.1982.Modellingof photosyntheticresponseto environmentalconditions.In Encyclopediaof PlantPhysiology,New Series,Vol. 12B,"PhysiologicalPlantEcologyII." Eds.O.L. Lange,P.S.Nobel,C.B. Osmond,andH. Ziegler. SpringerVerlag, Berlin,Germany,pp. 549-587.
Farquhar,G.D.,S.von Caemmerer,andJ.A.Berry. 1980.A biochemicalmodelof photosyntheticCO2assimilationin leavesof C3species.Planta,149:78-90.
Field,C. andH.A. Mooney.1986.Thephotosynthesis-nitrogenrelationshipin wild plants.In On theEconomyof PlantForm andFunction.Ed. T.J.Givnish.CambridgeUniversityPress,Cambridge,pp. 25-55.
Fox, J.F.andK. VanCleve.1983.Relationshipsbetweencellulosedecomposition,Jenny'sk,forest-floornitrogen,andsoiltemperaturein Alaskantaigaforests.CanadianJournalof ForestResearch,13:789-794.
Gates,D.M. 1993.Plant-AtmosphereRelationships.ChapmanandHall, NewYork, 92p.
Gower,S.T.,K.A. Vogt, andC.C.Grier. 1992.Carbondynamicsof RockyMountainDouglas-fir:Influenceof waterandnutrientavailability.EcologicalMonographs,62:43-65.
Grier, C.C.andR.S.Logan.1981.Old-growthpseudotsugamenziesiicommunitiesof awesternOregonwatershed:biomassdistributionandproductionbudgets.EcologicalMonographs,47:373-400.
Grier, C.C.,K.A. Vogt, M.R. Keyes,andR.L. Edmonds.1981.Biomassdistribution andabove-andbelow-groundproductionin youngandmatureAbiesamabiliszoneecosystemsof theWashingtonCascades.CanadianJournalof ForestResearch,11:155-157.
Hillel, D. 1980.Fundamentalsof Soil Physics.AcademicPress,NewYork, 413p.
Jarvis,P.G.andJ.I.L. Morison. 1981.Stomatalcontrol of transpirationandphotosynthesis.InStomatalPhysiology.Eds.P.G.JarvisandT.A. Mansfield.CambridgeUniversityPress,Cambridge,pp. 247-279.
Keyes,M.R. andC.C.Grier. 1981.Above-andbelow-groundnetproductionin 40-year-oldDouglas-firstandsonhigh andlow productivity sites.CanadianJournalof ForestRes.,11:599-605.
Kinerson,R.S.,C.W.Ralston,andC.G.Wells. 1977.Carboncycling in a loblolly pineplantation.Oecologia,29:1-10.
Leuning,R. 1990.Modelingstomatalbehaviorandphotosynthesisof EucalyptusGrandis.AustralianJournalof PlantPhysiology,17:159-175.
Page15
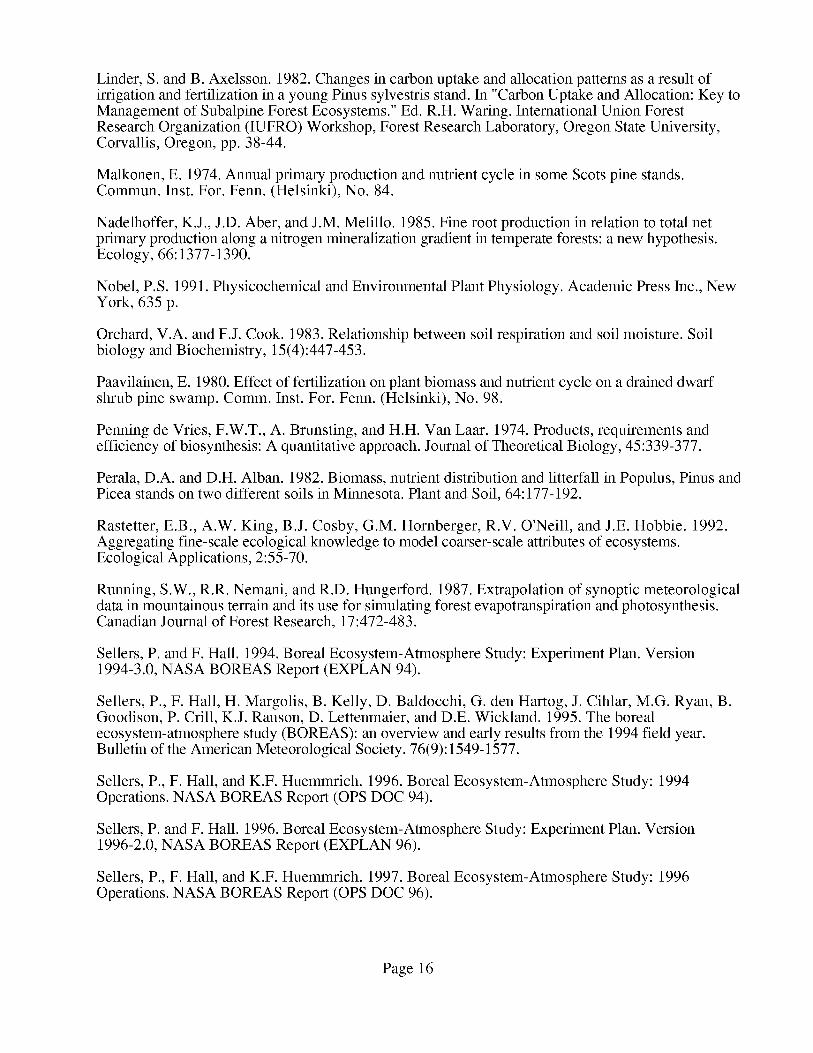
Linder,S.andB.Axelsson.1982.Changesin carbonuptakeandallocationpatternsasaresultofirrigationandfertilizationin ayoungPinussylvestrisstand.In "CarbonUptakeandAllocation:KeytoManagementof SubalpineForestEcosystems."Ed.R.H. Waring.InternationalUnionForestResearchOrganization(IUFRO)Workshop,ForestResearchLaboratory,OregonStateUniversity,Corvallis,Oregon,pp. 38-44.
Malkonen,E. 1974.Annualprimaryproductionandnutrientcyclein some Scots pine stands.Commun. Inst. For. Fenn. (Helsinki), No. 84.
Nadelhoffer, K.J., J.D. Aber, and J.M. Melillo. 1985. Fine root production in relation to total netprimary production along a nitrogen mineralization gradient in temperate forests: a new hypothesis.Ecology, 66:1377-1390.
Nobel, P.S. 1991. Physicochemical and Environmental Plant Physiology. Academic Press Inc., NewYork, 635 p.
Orchard, V.A. and F.J. Cook. 1983. Relationship between soil respiration and soil moisture. Soilbiology and Biochemistry, 15(4):447-453.
Paavilainen, E. 1980. Effect of fertilization on plant biomass and nutrient cycle on a drained dwarfshrub pine swamp. Comm. Inst. For. Fenn. (Helsinki), No. 98.
Penning de Vries, F.W.T., A. Brunsting, and H.H. Van Laar. 1974. Products, requirements andefficiency of biosynthesis: A quantitative approach. Journal of Theoretical Biology, 45:339-377.
Perala, D.A. and D.H. Alban. 1982. Biomass, nutrient distribution and litterfall in Populus, Pinus andPicea stands on two different soils in Minnesota. Plant and Soil, 64:177-192.
Rastetter, E.B., A.W. King, B.J. Cosby, G.M. Hornberger, R.V. O'Neill, and J.E. Hobbie. 1992.Aggregating fine-scale ecological knowledge to model coarser-scale attributes of ecosystems.Ecological Applications, 2:55-70.
Running, S.W., R.R. Nemani, and R.D. Hungerford. 1987. Extrapolation of synoptic meteorologicaldata in mountainous terrain and its use for simulating forest evapotranspiration and photosynthesis.Canadian Journal of Forest Research, 17:472-483.
Sellers, P. and F. Hall. 1994. Boreal Ecosystem-Atmosphere Study: Experiment Plan. Version1994-3.0, NASA BOREAS Report (EXPLAN 94).
Sellers, P., F. Hall, H. Margolis, B. Kelly, D. Baldocchi, G. den Hartog, J. Cihlar, M.G. Ryan, B.Goodison, P. Crill, K.J. Ranson, D. Lettenmaier, and D.E. Wickland. 1995. The boreal
ecosystem-atmosphere study (BOREAS): an overview and early results from the 1994 field year.Bulletin of the American Meteorological Society. 76(9): 1549-1577.
Sellers, P., F. Hall, and K.F. Huemmrich. 1996. Boreal Ecosystem-Atmosphere Study: 1994Operations. NASA BOREAS Report (OPS DOC 94).
Sellers, P. and F. Hall. 1996. Boreal Ecosystem-Atmosphere Study: Experiment Plan. Version1996-2.0, NASA BOREAS Report (EXPLAN 96).
Sellers, P., F. Hall, and K.F. Huemmrich. 1997. Boreal Ecosystem-Atmosphere Study: 1996Operations. NASA BOREAS Report (OPS DOC 96).
Page 16
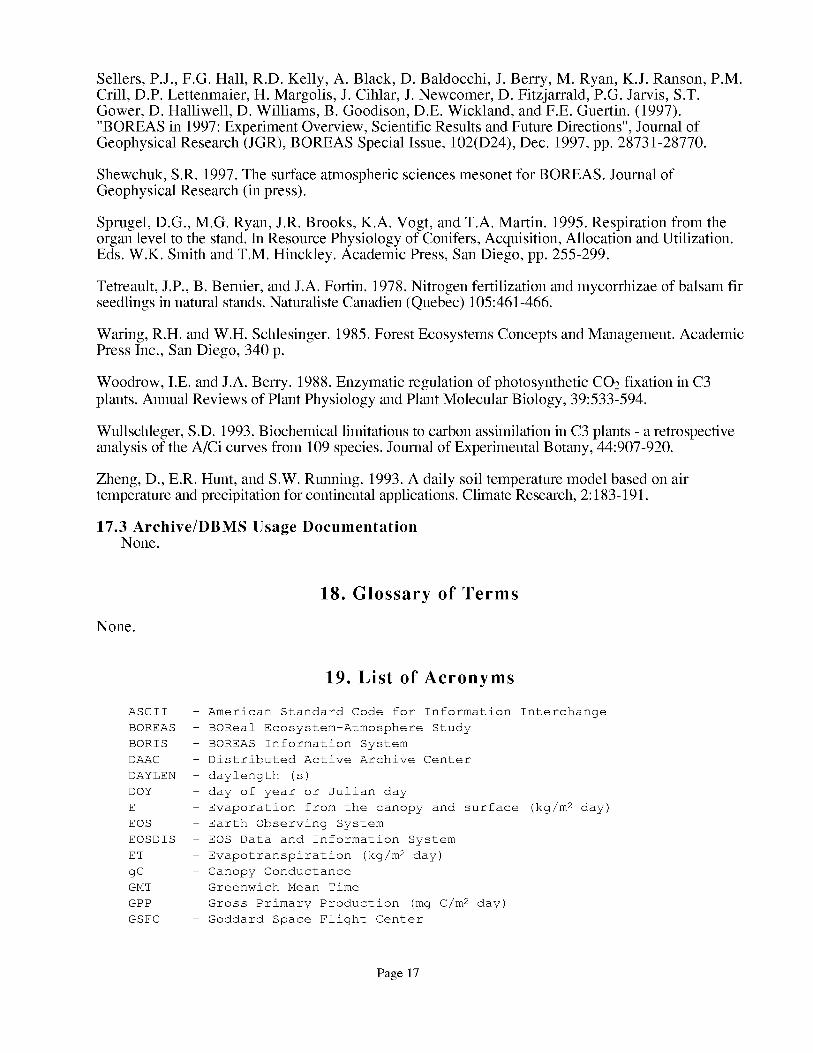
Sellers,P.J.,F.G.Hall, R.D. Kelly, A. Black, D. Baldocchi,J. Berry, M. Ryan,K.J. Ranson,P.M.Crill, D.P.Lettenmaier,H. Margolis,J.Cihlar, J.Newcomer,D. Fitzjarrald,P.G.Jarvis,S.T.Gower,D. Halliwell, D. Williams, B. Goodison,D.E.Wickland, andF.E. Guertin.(1997)."BOREASin 1997:ExperimentOverview,ScientificResultsandFutureDirections",JournalofGeophysicalResearch(JGR),BOREASSpecialIssue,102(D24),Dec. 1997,pp.28731-28770.
Shewchuk,S.R.1997.Thesurfaceatmosphericsciencesmesonetfor BOREAS.JournalofGeophysicalResearch(inpress).
Sprugel,D.G.,M.G. Ryan,J.R.Brooks,K.A. Vogt, andT.A. Martin. 1995.Respirationfrom theorganlevel to thestand.In ResourcePhysiologyof Conifers,Acquisition,AllocationandUtilization.Eds.W.K. SmithandT.M. Hinckley. AcademicPress,SanDiego,pp. 255-299.
Tetreault,J.P.,B. Bernier,andJ.A. Fortin. 1978.Nitrogenfertilization andmycorrhizaeof balsamfirseedlingsin naturalstands.NaturalisteCanadien(Quebec)105:461-466.
Waring,R.H. andW.H. Schlesinger.1985.ForestEcosystemsConceptsandManagement.AcademicPressInc., SanDiego,340p.
Woodrow,I.E. andJ.A.Berry. 1988.Enzymaticregulationof photosyntheticCO2 fixation in C3
plants. Annual Reviews of Plant Physiology and Plant Molecular Biology, 39:533-594.
Wullschleger, S.D. 1993. Biochemical limitations to carbon assimilation in C3 plants - a retrospectiveanalysis of the A/Ci curves from 109 species. Journal of Experimental Botany, 44:907-920.
Zheng, D., E.R. Hunt, and S.W. Running. 1993. A daily soil temperature model based on airtemperature and precipitation for continental applications. Climate Research, 2:183-191.
17.3 Archive/DBMS Usage DocumentationNone.
None.
18. Glossary of Terms
ASCII
BOREAS
BORIS
DAAC
DAYLEN
DOY
E
EOS
EOSDIS
ET
gC
GMT
GPP
GSFC
19. List of Acronyms
- American Standard Code for Information
- BOReal Ecosystem-Atmosphere Study
- BOREAS Information System
- Distributed Active Archive Center
- daylength (s)
- day of year or Julian day
- Evaporation from the canopy and
- Earth Observing System
- EOS Data and Information System
- Evapotranspiration (kg/m 2 day)
- Canopy Conductance
- Greenwich Mean Time
- Gross Primary Production (mg C/m 2 day)
- Goddard Space Flight Center
Interchange
surface (kg/m 2 day)
Page 17

JPL
LAI
NASA
NEE
NPP
NSA
OA
OBS
OJP
ORNL
PANP
PCP
PPFD
PSI
Q
Rcr
Rdl
Rfr
Rg
Rh
- Jet Propulsion Laboratory
- Leaf Area Index (m2/m 2)
- National Aeronautics and Space Administration
- Net Ecosystem Carbon Exchange (mg C/m 2 day)
- Net Primary Production (mg C/m 2 day)
- Northern Study Area
- Old Aspen
- Old Black Spruce
- Old Jack Spruce
- Oak Ridge National Laboratory
- Prince Albert National Park
- Daily Precipitation (cm)
- Photosynthetically Active Photon Flux Density
- Soil Water Potential
- Outflow (mm/day)
- Coarse root respiration rate (mg C/m 2 day)
- Daytime leaf respiration rate (mg C/m 2 day)
- Fine root respiration rate (mg C/m 2 day)
- Growth respiration (mg C/m 2 day)
- Heterotrophic respiration (mg C/m 2 day)
RHESSYS - Regional Hydro-EcologicalSimulation System
Rm - Maintenance respiration (mg C/m 2 day)
Rnl - Nighttime leaf respiration rate (mg C/m 2 day)
RSS - Remote Sensing Science
Rsw - Sapwood respiration rate (mg C/m 2 day)
Rtot - Total respiration (mg C/m 2 day)
RuBisCO - Ribulose Bisphosphate Carboxylase-Oxygenase
SLA
SOILW
SOLIN
SNOWW
SSA
T
TE
TMAX
TMIN
URL
YJP
- Specific leaf area (m2/kg C)
- Water held in the Soil Layer (ram)
- Total Daily Solar Radiation (kJ)
- Snow Water Equivilent of the Snowcover (mm)
- Southern Study Area
- Transpiration from the canopy (kg/m 2 day)
- Terrestrial Ecology
- maximum 24-hour air temperature (°C)
- minimum 24-hour air temperature (°C)
- Uniform Resource Locator
- Young Jack Pine
20. Document Information
20.1 Document Revision Date
Written: 19-Sep- 1996Last Updated: 06-Oct- 1998
20.2 Document Review Date(s)BORIS Review: 16-Sep-1997Science Review: 01-Nov- 1997
20.3 Document ID
Page 18

20.4 CitationWhenusingBIOME-BGC,pleaseincludethefollowing acknowledgmentaswell ascitationsof
relevantpapersin Section17.1:
If usingdatafromtheBOREASCD-ROM series,alsoreferencethedataas:Running,S.W,J.S.Kimball, "BIOME-BGC ModelSimulationsat TowerFlux Sites."In
CollectedDataof TheBorealEcosystem-AtmosphereStudy.Eds.J.Newcomer,D. Landis,S.Conrad,S.Curd,K. Huemmrich,D. Knapp,A. Morrell, J.Nickeson,A. Papagno,D. Rinker,R.Strub,T. Twine,F. Hall, andP. Sellers.CD-ROM. NASA, 2000.
Also,cite theBOREASCD-ROMsetas:Newcomer,J.,D. Landis,S.Conrad,S.Curd,K. Huemmrich,D. Knapp,A. Morrell, J.
Nickeson,A. Papagno,D. Rinker,R. Strub,T. Twine,F. Hall, andP.Sellers,eds.CollectedDataofTheBorealEcosystem-AtmosphereStudy.NASA. CD-ROM.NASA, 2000.
20.5 Document Curator
20.6 Document URL
Page 19

REPORT DOCUMENTATION PAGE FormApprovedOMB No. 0704-0188
Public reporting burden for this collection of informationis estimated to average 1 hour per response, including the time for reviewing instructions, searching existing data sources,gathering and maintaining the data needed, and completing and reviewing the collection of information. Send comments regarding this burden estimate or any other aspect of thiscollection of information, including suggestions for reducing this burden, to Washington Headquarters Services, Directorate for Information Operations and Reports, 1215 JeffersonDavis Highway, Suite 1204, Arlington, VA 22202-4302, and to the Office of Management and Budget, Paperwork Reduction Project (0704-0188), Washington, DC 20503.
1. AGENCY USE ONLY (Leave blank) 2. REPORT DATE 3. REPORT TYPE AND DATES COVERED
August 2000 Technical Memorandum4. TITLE AND SUBTITLE
Technical Report Series on the Boreal Ecosystem-Atmosphere Study (BOREAS)
BOREAS RSS-8 BIOME-BGC Model Simulations at Tower Flux Sites in 1994
6. AUTHOR(S)
John Kimball
Forrest G. Hall and Jaime Nickeson, Editors
7. PERFORMING ORGANIZATION NAME(S) AND ADDRESS (ES)
Goddard Space Flight Center
Greenbelt, Maryland 20771
9. SPONSORING / MONITORING AGENCY NAME(S) AND ADDRESS (ES)
National Aeronautics and Space Administration
Washington, DC 20546-0001
5. FUNDING NUMBERS
923
RTOP: 923-462-33-01
8. PEFORMING ORGANIZATIONREPORT NUMBER
2000-03136-0
10. SPONSORING / MONITORING
AGENCY REPORT NUMBER
TM--2000-209891
Vol. 54
11. SUPPLEMENTARY NOTES
J. Kimball: University of Montana; J. Nickeson: Raytheon ITSS
12a. DISTRIBUTION / AVAILABILITY STATEMENT
Unclassifie_Unlimited
Subject Category: 43
Report available from the NASA Center for AeroSpace Information,
7121 Standard Drive, Hanover, MD 21076-1320. (301) 621-0390.
12b. DISTRIBUTION CODE
13. ABSTRACT (Maximum 200 words)
BIOME-BGC is a general ecosystem process model designed to simulate biogeochemical and hydro-
logic processes across multiple scales (Running and Hunt, 1993). In this investigation, BIOME-BGC
was used to estimate daily water and carbon budgets for the BOREAS tower flux sites for 1994.
Carbon variables estimated by the model include gross primary production (i.e., net photosynthesis),
maintenance and heterotrophic respiration, net primary production, and net ecosystem carbon ex-
change. Hydrologic variables estimated by the model include snowcover, evaporation, transpiration,
evapotranspiration, soil moisture, and outflow. The information provided by the investigation includes
input initialization and model output files for various sites in tabular ASCII format.
14. SUBJECT TERMS
BOREAS, remote sensing science, BIOME-BGC.
17. SECURITY CLASSIFICATIONOF REPORT
Unclassified
NSN 7540-01-280-5500
18. SECURITY CLASSIFICATIONOF THIS PAGE
Unclassified
19. SECURITY CLASSIFICATIONOF ABSTRACT
Unclassified
15. NUMBER OF PAGES
19
16. PRICE CODE
20. LIMITATION OF ABSTRACT
UL
Standard Form 298 (Rev. 2-89)Prescribed by ANSI Std. Z39.18298-102
