technical report - solaris resources
TRANSCRIPT

AMC Mining Consultants (Canada) Ltd. BC0767129
200 Granville Street, Suite 202
Vancouver BC V6C 1S4
Canada
T +1 604 669 0044
W amcconsultants.com
Unearth a smarter way
Technical Report La Verde Copper Project
Equinox Gold Corp. and Solaris Copper Inc.
Michoacán State, Mexico
In accordance with the requirements of National Instrument 43-101 “Standards of Disclosure for
Mineral Projects” of the Canadian Securities Administrators
Qualified Persons: P. Stephenson, P.Geo., BSc (Hons) MCIM, FAIG, FAusIMM (CP) A. Riles, BSc (Hons) Grad Dipl Business Management, M. Econ Geol, MAIG (QP) M. Molavi, P.Eng., M.Eng., B.Eng. M. O’Brien, MSc, P.Geo. P. Lebleu, P.Eng., M.Eng.
AMC Project 718017 Effective date 20 June 2018

La Verde Copper Project
Equinox Gold Corp. and Solaris Copper Inc. 718017
amcconsultants.com ii
1 Summary
1.1 Introduction, location, and ownership
This Technical Report on the La Verde Copper Property (the Property) located in Michoacan, Mexico,
includes the current La Verde Project (the Project) and the immediate surrounding land. It has been
prepared by AMC Mining Consultants (Canada) Ltd. (AMC) of Vancouver, Canada, on behalf of
Equinox Gold Corp. (“Equinox”) and its newly incorporated wholly-owned subsidiary Solaris Copper
Inc. (“Solaris”), both of Vancouver, Canada. Equinox also holds all of the shares of Lowell Copper
Holdings Inc. (“Lowell Copper”), of Vancouver Canada This report is an amended version of the
14 October 2014 Technical Report which in turn was an updated version of the report issued
effective 30 September 2012 and titled “La Verde Copper Project Michoacan state, Mexico Technical
Report” prepared by AMC for Catalyst Copper, and with filing date 3 December 2012. None of the
changes made in this amended report materially affect AMC’s opinions or conclusions only the
recommendations. The principal amendments have been made in the interest of transparency to
show a change in ownership and reduction in claim size. These amendments are reflected in Sections
2, 4, and 26 of the report. Other amendments are minor wording changes for clarification. This
report has been prepared in accordance with the requirements of National Instrument 43-101
(NI 43-101), “Standards of Disclosure for Mineral Projects”, of the Canadian Securities
Administrators (CSA) for lodgement on CSA’s “System for Electronic Document Analysis and
Retrieval” (SEDAR).
The La Verde property is located in west central Mexico, approximately 320 kilometres (km) west
of Mexico City and hosts porphyry copper style mineralization. The La Verde project consists of one
concession totalling approximately 2,500 hectares (6,425 acres) (reduced during February 2016
from 7,904 hectares (19,530 acres)). Within the concession, mineralization is hosted within a
mid-tertiary granodiorite / quartz monzonite intrusive complex roughly 5.5 kilometres long and
1 kilometre wide; which is up to 750 metres (m) above mean sea level (msl), known as the Sierra
del Marqués intrusive complex. Historical exploration work included geological, geochemical and
geophysical surveys as well as over 100,000 m of drilling.
Catalyst Copper Corp. (“Catalyst”) holds a 60% interest in the La Verde copper project located in
Michoacán State in west-central Mexico (“La Verde”) through its wholly-owned Mexican subsidiary
Minera Hill 29, S.A de C.V (“Minera”). Minera beneficially owns 60% of the common shares of Minera
Torre de Oro, S.A.P.I de C.V. (“MTO”), a Mexican corporation and the holder of the property. The
remaining 40% of the common shares of MTO are held by a wholly-owned subsidiary of Teck
Resources Limited (“TRL”). Catalyst previously was a publicly traded company with its shares listed
on the TSX Venture exchange but on 26 May 2016 Catalyst completed an arrangement with
NewCastle Gold Ltd. (“NewCastle”) and became a wholly owned subsidiary of NewCastle. On
22 December 2017 Equinox Gold Corp. (“Equinox”), formerly Trek Mining Corp., completed an
arrangement under which NewCastle became a wholly owned subsidiary of Equinox. This resulted
in Equinox, a company listed on the TSX Venture Exchange, indirectly holding 100% of the issued
and outstanding common shares of Catalyst and its interest in La Verde.
Each of Equinox, Solaris and Lowell Copper is a company existing under the British Columbia
Business Corporations Act. Each of Solaris and Lowell Copper is a wholly owned subsidiary of
Equinox. On 20 June 2018 Equinox announced that its board of directors had approved a plan of
arrangement (“Arrangement”) under which Equinox intends to transfer its shares of Catalyst to
Lowell Copper and then Solaris will acquire all of the shares of Lowell Copper as well as the interest
in the La Verde Project. Shareholders of Equinox will receive common shares in Solaris in proportion
to their shareholdings in Equinox. Completion of the Arrangement is subject to certain conditions
including receipt of all necessary securityholder, court, and regulatory approvals

La Verde Copper Project
Equinox Gold Corp. and Solaris Copper Inc. 718017
amcconsultants.com iii
The preliminary economic assessment is preliminary in nature. It includes Inferred Mineral
Resources that are considered too speculative geologically to have the economic considerations
applied to them that would enable them to be categorized as Mineral Reserves. There is no certainty
that the preliminary economic assessment will be realized.
1.2 Geology and mineralization
Most of the Project area is underlain by the northwestern margin of the mid-tertiary Huacana
granodiorite / quartz monzonite batholith. This same batholith is host to the San Isidro and
Inguaran copper breccia pipes located roughly 20 km and 50 km, respectively, to the southeast of
La Verde.
The intrusive complex at La Verde is dominated by quartz-diorite and forms an east- west trending
arcuate range roughly 5.5 km long, 1 km wide, and up to 290 m above the surrounding blanket of
Quaternary sediments. The range is known as the Sierra del Marqués and is divided into the Cerro
La Laguna (West Hill) and Cerro Mina La Verde (East Hill) by a topographic low known as La Puerta
located roughly in the centre of the arc.
The East Hill contains four main copper mineralized zones. Three of these zones (#1, #3, and #4)
are hosted within altered and brecciated quartz-diorite in close proximity to dykes and stocks of
quartz-feldspar porphyry, while the fourth zone (#2) is hosted largely within unbrecciated quartz-
feldspar porphyry. All four mineralized zones form a roughly circular pattern on the western half of
the East Hill, in a plan view. Alteration tends to be fairly tightly restricted to zones of brecciation,
except in the case of large-scale calcium-sodium metasomatism within quartz-diorite adjacent to
quartz-feldspar porphyry.
The West Hill is characterized by approximately east-west trending bands of phyllic / propylitic
alteration with associated pyrite-chalcopyrite ± arsenopyrite- pyrrhotite veining at the contact
between quartz-diorite porphyry and quartz-diorite. The lateral extent of these mineralized
east-west striking veins forms a north-northeast south-southwest trending roughly elliptical shaped
deposit, in a plan view. The western half of the West Hill consists of “red diorite” stained red by
inclusions of hematite. A major north-northwest trending magnetic lineament occupies this region
of the West Hill and may reflect a structural break separating red diorite to the west from
quartz-diorite to the east. Apart from a few small vein showings, no significant copper-
mineralization has been intersected to date within the red diorite.
1.3 Exploration
The Project has been explored since 1906. Most of the drilling has been focused on the West Hill
and East Hill deposits. Minera Hill 29 S.A. de C.V. (MinHill) conducted an induced polarization (IP)
survey and completed drilling on 20 drillholes in 2010. In 2011 an additional 24 drillholes were
completed, while the latest 2012 campaign added 12 new holes. Combined with the prior exploration
work, the database contains 641 drillholes totalling 114,824 m.
1.4 Mineral Resources
Table 1.1 summarizes the La Verde Mineral Resources as of 19 September 2012 at cut-off grades
of 0.10%, 0.20%, and 0.30% Cu. Mineral Resources are reported at a cut-off grade of 0.2% Cu.
The Qualified Person responsible for the Mineral Resource estimate is Mr Michael O’Brien, M.Sc., Pr.
Sci.Nat., FGSSA, FAusIMM, FSAIMM, P. Geo. Of Ausenco.

La Verde Copper Project
Equinox Gold Corp. and Solaris Copper Inc. 718017
amcconsultants.com iv
Table 1.1 Mineral Resource statement
Resource class Cut-off (Cu%) Zone Tonnes (000s) Cu (%) Ag (g/t) Au (g/t) As (%)
Measured
0.1
East Hill 57,963 0.37 2.75 0.05 0.02
West Hill 20,995 0.37 1.95 0.01 0.05
Total 78,958 0.37 2.54 0.04 0.03
0.2
East Hill 41,262 0.46 3.30 0.06 0.02
West Hill 16,265 0.43 2.03 0.01 0.05
Total 57,527 0.45 2.94 0.05 0.03
0.3
East Hill 29,896 0.54 3.68 0.07 0.03
West Hill 11,194 0.52 2.15 0.01 0.06
Total 41,090 0.53 3.26 0.05 0.03
Indicated
0.1
East Hill 322,936 0.26 2.32 0.05 0.02
West Hill 262,669 0.33 1.39 <0.01 0.04
Total 585,605 0.30 1.91 0.03 0.03
0.2
East Hill 163,604 0.39 3.31 0.06 0.04
West Hill 186,838 0.41 1.47 0.01 0.03
Total 350,442 0.40 2.33 0.03 0.04
0.3
East Hill 98,784 0.49 4.04 0.07 0.05
West Hill 126,505 0.49 1.55 <0.01 0.03
Total 225,289 0.49 2.65 0.04 0.04
Measured + Indicated, 0.1% Cu 664,563 0.30 1.98 0.03 0.03
Measured + Indicated, 0.2% Cu 407,969 0.41 2.42 0.03 0.04
Measured + Indicated, 0.3% Cu 266,379 0.50 2.74 0.04 0.04
Inferred
0.1
East Hill 434,614 0.20 1.51 0.03 0.02
West Hill 330,426 0.29 1.17 <0.01 0.03
Total 765,040 0.24 1.36 0.02 0.02
0.2
East Hill 140,566 0.35 2.79 0.05 0.04
West Hill 197,272 0.38 1.33 <0.01 0.02
Total 337,838 0.37 1.94 0.02 0.03
0.3
East Hill 61,761 0.49 4.20 0.07 0.07
West Hill 126,222 0.46 1.45 <0.01 0.02
Total 187,983 0.47 2.36 0.03 0.04
Notes: CIM Definition standards (2010) were used for reporting the Mineral Resources Mineral Resource are reported at a cut-off grade of 0.2% Cu Drilling results up to 19 September 2012. Mineral Resources that are not Mineral Reserves do not have demonstrated economic viability. The numbers may not compute exactly due to rounding.
1.5 Mining
The La Verde project lends itself to a conventional truck and shovel open pit mining method as the
mineralized rock outcrops at surface at both the East Hill and West Hill. A full time mine and mill
operation is proposed for La Verde. The conceptual mining schedule calls for ex-pit mining rates of
181 Ktonne/day during Year 1, 264 Ktonne/day from Year 2 to 4, and an average of 296 Ktonne/day
from Year 5 to 18.

La Verde Copper Project
Equinox Gold Corp. and Solaris Copper Inc. 718017
amcconsultants.com v
For this size of mining operation and the selectivity required in this type of deposit, large size mining
equipment is proposed. Both productivities and costs have been estimated on the following
operational scheme:
• Drilling and Blasting on 15 m benches.
• Primary loading with rope and hydraulic shovels.
• Use of 225 tonnes haul trucks.
Use of electric equipment (primary drills and rope shovels) were considered for the costing.
Net smelter return (NSR) calculations were undertaken on all mining blocks by taking into
consideration metal prices for copper, silver and gold, smelter costs, transport costs and refining
costs as well as arsenic-related penalties. The NSR values were used in the life of mine schedule to
optimize the value of the project. The conceptual life of mine plan presented in this report is based
on optimizing the overall value for the Project by using a variable NSR cut-off grade by period and
selectively stockpiling lower grade material after meeting processing plant requirements of 30 Mtpa.
Stockpiled lower grade material is reclaimed at the most opportune time throughout the mine life
to complement mill feed sourced directly from the open pits. Stockpiled materials are fully reclaimed
by the end of the mine life.
The milling life is proposed to span 19 years at a target plant throughput rate of 30 Mtpa with a
total of 588 Mt of mineralized rock, comprised of 397 Mt Measured and Indicated Mineral Resources
and 191 Mt Inferred Mineral Resources delivered to the plant. Life-of-mine (LOM) copper
concentrate production is estimated to be around 7.17 million tonnes averaging 26.7 % Cu. Mining
schedule is presented on a yearly basis in Table 1.2.

La Verde Copper Project
Equinox Gold Corp. and Solaris Copper Inc. 718017
amcconsultants.com vi
Table 1.2 Conceptual life of mine schedule
Year Y-1 Y1 Y2 Y3 Y4 Y5 Y6 Y7 Y8 Y9 Y10 Y11 Y12 Y13 Y14 Y15 Y16 Y17 Y18 Y19 Y20 LOM
Ex-Pit tonnes
Measured + Indicated, Mt 16.2 39.8 49.5 50.7 35.7 26.5 27.5 19.4 19.2 16.8 15.7 15.2 11.9 2.7 5.4 8.2 10.6 12.6 13.0 397
Inferred, Mt 0.3 1.5 3.2 4.3 8.6 7.8 8.2 10.5 11 13.1 8.4 15.0 6.1 8.3 17.9 15.7 16.6 17.4 17.0 191
Waste, Mt 48.5 53.7 42.3 40.1 50.7 85.7 84.3 90.1 89.8 90.0 95.9 84.8 97.0 103.9 91.7 91.1 52.8 50.0 8.1 1,350
Ex-Pit strip
By year na 3.0 2.2 2.2 2.4 4.1 3.0 3.0 3.0 3.0 4.0 2.8 5.4 9.4 3.9 3.8 1.9 1.7 0.3
Cumulative na 5.7 3.7 3.2 3.0 3.2 3.2 3.1 3.1 3.1 3.2 3.2 3.3 3.5 3.5 3.5 3.4 3.3 3.1 3.1
Note: The conceptual mining schedule is provided in accordance with the requirements of 22 (b) of Form 43-101F1. It does not represent an estimate of Mineral Reserves.

La Verde Copper Project
Equinox Gold Corp. and Solaris Copper Inc. 718017
amcconsultants.com vii
1.6 Processing and engineering
The major component of potentially economic material derives from the copper content of the
sulphides with a minor component from the East Hill oxides. West Hill oxide material is essentially
waste due to the copper being in chlorite and showing very low recoveries.
Although high priority work is required in the next phase of study on investigations into
geo-metallurgical variability, AMC is satisfied that, based on the initial metallurgical testwork,
90% copper recovery to a 26 – 27% Cu concentrate is achievable on the sulphide material with
a conventional crushing, grinding (SAG-Ball mill- pebble Crusher (SABC)) flotation circuit. The
mineralized material is moderately hard but with good liberation characteristics at a primary
grind size of approximately 200 µm.
The circuit would be configured in two trains of crushing, grinding and rougher flotation with a
common regrind and three stage cleaning circuit. A tailings thickener has been included in the
flowsheet, mainly to maximize tailings storage efficiencies and also to minimize water
consumption.
The main risk to marketability of concentrate is its projected arsenic content, especially in East
Hill sulphides where the arsenic is present as the copper-arsenic sulphosalt, tennantite. Although
various alternative downstream concentrate treatment options to remove arsenic were
considered, the focus of the PEA has been on proven roaster technology to treat the La Verde
concentrates and recover arsenic into a stable and environmentally inert compound.
Services such as power and supply roads essential to the La Verde project are in close proximity
to the site. Two main highways are located to the east and the west of the property. The railway
proposed to be used for concentrate shipment to the port of Lazaro Cardenas is sited a few
kilometres north of the processing plant.
Although water is abundant in the region, including an irrigation canal that transects the
property, significant community and government consultation will be required in the next project
phase to determine the actual availability of water for the proposed project. During the next
phase of this project, capacities, availability, and permission to use these services should be
investigated further.
The tailings management facility (TMF) storage area required for this Project is significant, with
an estimated capacity of 367 million cubic meters. Several natural valleys located within 5 to 12
km of the Project have been identified as suitable, from an engineering perspective, for tailings
storage for the first half of the mine life. Additional storage can be found further north-west or
west of the Property. Alternative mining scenarios should be evaluated to mine the two open
pits sequentially, thereby presenting an opportunity for backfilling the first pit with tailings or
waste material. The land required for the proposed TMF locations is not currently owned by
Lowell Copper and remains a project risk.
1.7 Capital and operating cost – project metrics
Life of mine mining costs have been estimated to average US$1.66/t of material moved.
Processing costs have been estimated at US$5.84/t milled. Roasting costs have been estimated
at US$30/t of concentrate treated.

La Verde Copper Project
Equinox Gold Corp. and Solaris Copper Inc. 718017
amcconsultants.com viii
Yearly revenue has been estimated applying assumed international metal prices, as follows:
• Copper: US$2.7/lb (US$5,950/tonne)
• Gold: US$1,200/troy ounce (US$38.58/g)
• Silver: US$25/troy ounce (US$0.80/g)
These prices have been applied evenly throughout the mine life. First revenue is obtained in year
Y1.
Current metal prices vary from those used with gold and copper prices being higher, and the
price of silver is lower. The relative economic contribution from the different metals are: 92%
for copper, 5% for silver and 3% for gold. The impact of using current prices (US$3.00 for
copper, US$1250 for gold, and US$17.50 for silver) would enhance the project.
Since the intent of this report was to show the change in ownership and reduction in lease area,
the economics were not deemed to be significant to the issuer.
Pre-production capital has been estimated as US$1,160M, to be spent in three years from Year
(-3) to Year (-1).
Based on these estimates and parameters the La Verde pre-tax Net Present Value (NPV) is
estimated at US$617M using a discount rate of 8%, before depreciation and taxes. The post-tax
NPV is estimated at US$300M using a discount rate of 8%.
Table 1.3 Key project metrics
Item Assumption and metrics
Conceptual Mill feed 397 Million tonnes of Indicated and Measured material at 0.38% Cu, 0.04 g/t Au and 2.46 g/t Ag and 191 Million tonnes of Inferred material at 0.33% Cu, 0.03 g/t Au and 1.94 g/t Ag
Mining rate 105 Mtpa (avg. LOM) (mineralized material + waste)
Total material moved 2,054 Mt
Mining method Rope shovels and haul trucks
Ownership Owner operated
Mining life 19 years
Processing life 20 years
Processing method Crush, grind, flotation, concentrate roasting
Processing rate 30 Mtpa
Concentrate produced (LOM) 7.17 Million tonnes at 26.7% Cu
Processing recoveries Cu, 90% - Au, 77.6% - Ag, 79%
Pre-Production Capital US$1,160M
Indicative NPV at 8% (pre-tax) US$617M
Indicative NPV at 8% (post-tax) US$300M
The preliminary economic assessment is preliminary in nature. It includes Inferred Mineral
Resources that are considered too speculative geologically to have the economic considerations
applied to them that would enable them to be categorized as Mineral Reserves. There is no
certainty that the preliminary economic assessment will be realized.
The conceptual mill feed figures shown in Table 1.2 and Table 1.3 do not represent an estimate
of Mineral Reserves.

La Verde Copper Project
Equinox Gold Corp. and Solaris Copper Inc. 718017
amcconsultants.com ix
Mineral Resources that are not Mineral Reserves do not have demonstrated economic viability.
1.8 Conclusions and recommendations
The present study indicates that La Verde is a potentially attractive mining opportunity. The key
financial indicators, based on reasonable future copper prices and capital and operational cost
estimates, justify advancing the Project to a Pre-Feasibility study stage.
There are key areas of risk or uncertainty that need to be addressed in moving the Project
forward:
• Additional drilling is required to, (a) upgrade the substantial component of Inferred
Resources to Indicated or Measured Resources, (b) provide samples for metallurgical
testwork, and c) provide additional geologic and alteration information.
• Management of high arsenic grades and arsenic by-products, both from an economic and
an environmental point of view.
• Availability of reliable and convenient power and water sources.
• Identification of TMF locations for the substantial projected LOM shortfall in tailings dam
capacity.
• Acquisition of the land required for TMF locations.
• Social license. The initiation of systematic social and environmental assessment of the
water access, infrastructure, and tailings disposal assumptions contained in the study is
required. Continued development of good relationships with the local stakeholders,
particularly with the nearby communities.
AMC makes the following recommendations:
1 Advance the Project to a Pre-Feasibility level.
2 Initiate formal discussions with the relevant Mexican government agencies to investigate
the feasibility of the proposed TMF solution outlined in this study.
3 In the next study phase, evaluate alternative options to TMF construction including dry
stacking. The cost of this trade-off study is included in the Pre-Feasibility study cost.
4 Initiate formal discussions with the relevant Mexican government agencies to investigate
a reliable power supply for the power consumption levels outlined in this study.
5 Strengthen Company involvement with local communities and initiate conversation with
the relevant stakeholders regarding the extension and considerations of the project.
Particularly relevant is the community engagement with respect to the project’s water and
land uses.
6 Initiate environmental and social baseline studies. On the environmental side, include the
potential for contamination by arsenic from waste dumps and stockpiles from the earliest
evaluation stages. See Table 26.1 for cost estimate.
7 In the next mine planning exercise, investigate options to deplete West Hill pit earlier to
provide an opportunity for backfilling the pit with tailings or waste material. The cost of
this trade-off study is included in the Pre-Feasibility study cost.
8 Use modern open pit mine planning software to investigate a more optimum way of
defining pushbacks based on value and arsenic content. The cost of this trade-off study is
included in the Pre-Feasibility study cost.
9 With respect to pit wall planning:
⎯ Undertake a geotechnical drilling program using orientated, NQ3 or HQ3 diamond
drill core.

La Verde Copper Project
Equinox Gold Corp. and Solaris Copper Inc. 718017
amcconsultants.com x
⎯ Develop a geotechnical and structural model at pit scale to help with the modelling
of the pit wall stability.
⎯ Conduct a hydrogeological study to assess the presence, nature, and depth of the
water table, and how this may be affected by mining.
⎯ Undertake an assessment of the rock mass strength and carry out a slope stability
analysis at bench, inter-ramp and overall scale to assess the slope parameters for
each pit.
10 Initiate a program investigating the geo-metallurgical variability across the deposits to
develop a geo-metallurgical map and appropriate geo-metallurgical domains. See Table
26.1 for cost estimate.
11 Investigate options to improve precious metals recovery, especially gold in West Hill
sulphides. See Table 26.1 for cost estimate.
12 Undertake a trade-off study on the use of high pressure grinding rolls (HPGR). See Table
26.1 for cost estimate.
13 Carry out concentrate roaster testwork and associated preliminary design studies. See
Table 26.1.
Table 1.4 Estimated cost of recommendations
Activity Cost estimate (US$M)
Pre-Feasibility study 1.5
Additional drilling to upgrade Resources + first Geomechanic studies 2.9
Environmental and social baseline studies 1.1
Geo-metallurgical investigations 0.8
HPGR Testing 0.1
Concentrate Roasting testwork 0.2

La Verde Copper Project
Equinox Gold Corp. and Solaris Copper Inc. 718017
amcconsultants.com xi
Contents
1 Summary .............................................................................................................. ii 1.1 Introduction, location, and ownership ................................................................ ii 1.2 Geology and mineralization ............................................................................. iii 1.3 Exploration ................................................................................................... iii 1.4 Mineral Resources .......................................................................................... iii 1.5 Mining .......................................................................................................... iv 1.6 Processing and engineering ............................................................................ vii 1.7 Capital and operating cost – project metrics ..................................................... vii 1.8 Conclusions and recommendations ................................................................... ix
2 Introduction ......................................................................................................... 19 2.1 General and terms of reference ...................................................................... 19 2.2 The Issuer ................................................................................................... 19 2.3 Report authors ............................................................................................. 19 2.4 Units of measure, currency, and acronyms ....................................................... 21
3 Reliance on other experts ...................................................................................... 23
4 Property description and location ............................................................................ 24 4.1 Location ...................................................................................................... 24 4.2 Concessions ................................................................................................. 24
5 Accessibility, climate, local resources, infrastructure, and physiography ...................... 28 5.1 Accessibility ................................................................................................. 28 5.2 Climate ....................................................................................................... 28 5.3 Local resources ............................................................................................ 28 5.4 Infrastructure ............................................................................................... 29 5.5 Physiography ............................................................................................... 30
6 History ................................................................................................................ 32 6.1 Regional mining history ................................................................................. 32 6.2 La Verde mining history ................................................................................. 32 6.3 La Verde exploration history ........................................................................... 33
6.3.1 Lytton / HBM&S program ............................................................... 34 6.3.2 Noranda program .......................................................................... 35 6.3.3 Aur program ................................................................................. 36 6.3.4 MTO program ............................................................................... 37
7 Geological setting and mineralization ...................................................................... 39 7.1 Regional geology .......................................................................................... 39 7.2 Local geology ............................................................................................... 39 7.3 Property geology .......................................................................................... 40
7.3.1 Summary ..................................................................................... 40 7.3.2 Quartz-diorite group ...................................................................... 42 7.3.3 Feldspar +/- quartz porphyritic felsic intrusive group ......................... 43 7.3.4 Breccia ........................................................................................ 43
7.4 Structure ..................................................................................................... 43 7.5 Alteration .................................................................................................... 43 7.6 Mineralization ............................................................................................... 44
7.6.1 West Hill ...................................................................................... 44 7.6.2 East Hill ....................................................................................... 45
7.6.2.1 #1 Zone (Breccia) ............................................................. 45 7.6.2.2 #2 Zone .......................................................................... 45 7.6.2.3 #3 Zone .......................................................................... 46

La Verde Copper Project
Equinox Gold Corp. and Solaris Copper Inc. 718017
amcconsultants.com xii
7.6.2.4 #4 Zone .......................................................................... 47 7.6.3 Las Minitas ................................................................................... 47
8 Deposit types ....................................................................................................... 49
9 Exploration .......................................................................................................... 51 9.1 2010 exploration .......................................................................................... 51 9.2 2012 exploration .......................................................................................... 51
10 Drilling ................................................................................................................ 54 10.1 2010 and 2011 drilling .................................................................................. 54
10.1.1 2010 drill program ........................................................................ 54 10.1.2 2011 drill program ........................................................................ 54
10.2 2012 drilling ................................................................................................. 54 10.3 Verification drillholes ..................................................................................... 59 10.4 Drillhole survey ............................................................................................ 61 10.5 Mineral sample length versus true thickness .................................................... 61
11 Sample preparation, analyses, and security ............................................................. 62 11.1 Sample preparation....................................................................................... 62
11.1.1 Sampling of previously drilled core .................................................. 62 11.2 Core storage facility ...................................................................................... 62 11.3 Sample analysis ........................................................................................... 62 11.4 Review of Quality Assurance / Quality Control .................................................. 63
11.4.1 Standards .................................................................................... 63 11.4.2 Blanks ......................................................................................... 67 11.4.3 Duplicates .................................................................................... 68 11.4.4 Second laboratory ......................................................................... 70
11.5 Discussion ................................................................................................... 70
12 Data verification ................................................................................................... 71 12.1 Drillhole Collar .............................................................................................. 71 12.2 Logging ....................................................................................................... 72 12.3 Data verification ........................................................................................... 72 12.4 Check assays ............................................................................................... 73 12.5 Discussion ................................................................................................... 73
13 Mineral processing and metallurgical testing ............................................................ 74 13.1 Introduction ................................................................................................. 74 13.2 Metallurgical samples .................................................................................... 74 13.3 Metallurgical testwork ................................................................................... 75
13.3.1 KM2900 – August-November 2011 .................................................. 75 13.3.1.1 Chemical and mineralogical characteristics ........................ 75 13.3.1.2 Comminution tests ......................................................... 77 13.3.1.3 Flotation tests................................................................ 77
13.3.2 KM3306 – April 2012 ..................................................................... 80 13.3.2.1 Chemical and mineralogical characteristics ........................ 80 13.3.2.2 Concentrate generation .................................................. 80
13.4 Metallurgical grade-recovery predictions .......................................................... 81 13.5 Concentrate quality ....................................................................................... 82
14 Mineral Resource estimates .................................................................................... 84 14.1 Drillhole database ......................................................................................... 84 14.2 Project parameters ....................................................................................... 84 14.3 Geological model .......................................................................................... 84
14.3.1 Contact plots ................................................................................ 87 14.3.1.1 East Hill ........................................................................ 87
La Verde Copper Project
Equinox Gold Corp. and Solaris Copper Inc. 718017
amcconsultants.com xiii
14.3.1.2 West Hill ....................................................................... 89 14.4 Assay statistics ............................................................................................. 90 14.5 Compositing ................................................................................................. 91 14.6 Capping ....................................................................................................... 92 14.7 Specific Gravity ............................................................................................ 93 14.8 Spatial analysis ............................................................................................ 94 14.9 Grade interpolation ....................................................................................... 94 14.10 Block model validation ................................................................................. 99
14.10.1 Visual checks ................................................................................ 99 14.10.2 Global comparison ........................................................................ 99 14.10.3 Adequacy of resource estimation methods ....................................... 99
14.11 Mineral Resource classification and resource statement ................................... 99 14.11.1 Resource classification ................................................................... 99 14.11.2 Mineral Resource statement ......................................................... 100
14.12 Previous Mineral Resource estimate ............................................................ 101
15 Mineral Reserve estimates ................................................................................... 103
16 Mining methods .................................................................................................. 104 16.1 Resource model for mining – mining block model ............................................ 104
16.1.1 Processing eligibility and NSR calculations ...................................... 105 16.2 Strategic mine planning ............................................................................... 107
16.2.1 Selection of the size of the operation ............................................. 107 16.2.2 Inclusion of a roasting stage ......................................................... 107
16.3 Ultimate pit selection .................................................................................. 111 16.4 Ultimate pit sensitivity analysis..................................................................... 118 16.5 Geotechnical data – rock mass classification .................................................. 118
16.5.1 Data .......................................................................................... 118 16.5.2 Rock Quality Designation (RQD) .................................................... 119 16.5.3 Assumed design parameters ......................................................... 121
16.6 Layout of other mining facilities around the pits .............................................. 121 16.7 Conceptual mining schedule ......................................................................... 123 16.8 Mine equipment and personnel ..................................................................... 128
17 Recovery methods .............................................................................................. 131 17.1 Key metallurgical parameters ....................................................................... 131 17.2 Flowsheet .................................................................................................. 132 17.3 Equipment sizing and description .................................................................. 135 17.4 Conceptual production schedule .................................................................... 136 17.5 Process inputs ............................................................................................ 136
18 Project infrastructure .......................................................................................... 138 18.1 Tailings disposal ......................................................................................... 138
18.1.1 Design basis and operating criteria ................................................ 141 18.1.2 Tailings management facility embankments ................................... 141 18.1.3 Mill tailings transport and deposition system .................................. 142 18.1.4 Reclaim water system .................................................................. 142
18.2 Waste rock storage (reactive and non-reactive) .............................................. 142 18.3 Mill feed stockpiles ...................................................................................... 142 18.4 Irrigation channel ....................................................................................... 142 18.5 Access roads .............................................................................................. 142 18.6 Rail access ................................................................................................. 143 18.7 Water supply .............................................................................................. 144 18.8 Power ........................................................................................................ 145 18.9 Other infrastructure .................................................................................... 146

La Verde Copper Project
Equinox Gold Corp. and Solaris Copper Inc. 718017
amcconsultants.com xiv
18.9.1 Equipment lay down area ............................................................. 147 18.9.2 Loading and unloading facilities .................................................... 147 18.9.3 Water treatment plant ................................................................. 147 18.9.4 Communications ......................................................................... 147 18.9.5 Port facilities .............................................................................. 147 18.9.6 Camp and housing ...................................................................... 147 18.9.7 Administration offices training room .............................................. 148 18.9.8 Maintenance workshops and warehouse building ............................. 148 18.9.9 Mine dry (change rooms) ............................................................. 148 18.9.10 Laboratories ............................................................................... 148 18.9.11 Security and guardhouse ............................................................. 148 18.9.12 Medical / ambulance / first aid / mine rescue facilities ..................... 148 18.9.13 Truck shop ................................................................................. 148 18.9.14 Explosives magazine ................................................................... 148 18.9.15 Fuel storage and distribution systems ............................................ 149
19 Market studies and contracts................................................................................ 150 19.1 Concentrate marketing ................................................................................ 150
20 Environmental studies, permitting and social or community impact ........................... 151 20.1 Environmental and communities’ considerations included in this study .............. 151
20.1.1 The mine pits ............................................................................. 151 20.1.2 Waste dumps and stockpiles......................................................... 151 20.1.3 Tailings management facilities ...................................................... 151
21 Capital and operating costs .................................................................................. 152 21.1 Mining capital and operating costs ................................................................ 152
21.1.1 Operating costs .......................................................................... 152 21.1.2 Capital cost ................................................................................ 152
21.2 Milling capital and operating costs ................................................................. 153 21.3 Infrastructure capital ................................................................................... 155 21.4 General and Administrative (G&A) costs ........................................................ 155
22 Economic analysis ............................................................................................... 156 22.1 Revenue estimation .................................................................................... 156 22.2 Initial capital cost ....................................................................................... 158 22.3 Cash flow and financial indicators ................................................................. 158 22.4 Cash flow sensitivity.................................................................................... 160
23 Adjacent properties ............................................................................................. 162
24 Other relevant data and information ..................................................................... 163
25 Interpretation and conclusions ............................................................................. 164
26 Recommendations .............................................................................................. 165
27 References ......................................................................................................... 167
28 Certificates ........................................................................................................ 168
Tables
Table 1.1 Mineral Resource statement ........................................................................ iv
Table 1.2 Conceptual life of mine schedule .................................................................. vi
Table 1.3 Key project metrics .................................................................................. viii
Table 1.4 Estimated cost of recommendations ............................................................. x

La Verde Copper Project
Equinox Gold Corp. and Solaris Copper Inc. 718017
amcconsultants.com xv
Table 2.1 Persons who prepared or contributed to this Technical Report ........................ 20
Table 2.2 Units, terms, and abbreviations .................................................................. 22
Table 4.1 La Verde concessions ................................................................................ 24
Table 4.2 Cima agreement ....................................................................................... 26
Table 6.1 Summary of exploration activity ................................................................. 34
Table 6.2 Lytton / HBM&S exploration program .......................................................... 35
Table 6.3 Noranda exploration program ..................................................................... 35
Table 6.4 Aur exploration program ............................................................................ 36
Table 6.5 MTO exploration program (Years 2007 – 2009) ............................................ 37
Table 10.1 2012 drilling – summary of significant results ............................................... 56
Table 10.2 Twinned drillholes ..................................................................................... 60
Table 11.1 Summary of Standard Reference Material results .......................................... 63
Table 12.1 Field check – collar survey ......................................................................... 71
Table 13.1 1976 Hazen metallurgical study results........................................................ 74
Table 13.2 Chemical analysis of composites ................................................................. 76
Table 13.3 Copper deportment ................................................................................... 76
Table 13.4 Comminution results ................................................................................. 77
Table 13.5 Rougher flotation results – copper recovery vs mass pull wt% ........................ 78
Table 13.6 Locked cycle test results – sulphides ........................................................... 79
Table 13.7 Locked cycle test results – oxides ............................................................... 80
Table 13.8 KM 3306 chemical analysis of composites .................................................... 80
Table 13.9 Locked cycle test results – sulphides ........................................................... 81
Table 13.10 Metallurgical recovery and concentrate grade parameters .............................. 82
Table 13.11 Copper concentrates analysis ..................................................................... 82
Table 14.1 La Verde block model limits........................................................................ 84
Table 14.2 Geological domains ................................................................................... 85
Table 14.3 La Verde Assay descriptive statistics for copper, all drillholes and rock types .... 90
Table 14.4 La Verde 3 m composite descriptive statistics for copper, all drillholes and rock
types....................................................................................................... 91
Table 14.5 La Verde 3 m composite descriptive statistics for copper by geology domain .... 92
Table 14.6 Summary of La Verde SG values by rock type .............................................. 94
Table 14.7 East Hill variogram model parameters ......................................................... 94
Table 14.8 West Hill variogram model parameters ........................................................ 94
Table 14.9 Search ellipses ......................................................................................... 95
Table 14.10 Global Comparison, 0.1% Copper Cut-off ..................................................... 99
Table 14.11 Composite versus block model statistics for all blocks .................................... 99
Table 14.12 Mineral Resource statement, La Verde Project ............................................ 101
Table 14.13 Comparison with previous Mineral Resource estimate .................................. 102
Table 16.1 Rock types in the mining block model ........................................................ 104
Table 16.2 NSR calculation parameters and assumptions ............................................. 106
Table 16.3 Normalized project value results based on varying COG scenarios ................. 111
Table 16.4 Cut-off grade scenarios tested .................................................................. 111
Table 16.5 Pit optimization input .............................................................................. 112

La Verde Copper Project
Equinox Gold Corp. and Solaris Copper Inc. 718017
amcconsultants.com xvi
Table 16.6 Features of the selected ultimate pit ......................................................... 113
Table 16.7 Ultimate pit sensitivity to selected operational parameters ........................... 118
Table 16.8 Drillhole core photos used to review catalyst logging of RQD values .............. 119
Table 16.9 RQD values and descriptions (Deere, 1964) ............................................... 119
Table 16.10 Conceptual mining schedule ..................................................................... 126
Table 16.11 Conceptual mill feed schedule .................................................................. 127
Table 16.12 Mining equipment ................................................................................... 128
Table 16.13 Mine mobile equipment. Active units per year and acquisition schedule ......... 129
Table 16.14 Number of employees and labour expenses ................................................ 130
Table 17.1 Metallurgical recovery and concentrate grade parameters ............................ 131
Table 17.2 Overall design criteria ............................................................................ 132
Table 17.3 Conceptual mill concentrates and recoveries .............................................. 136
Table 18.1 La Verde PEA estimate road costs ............................................................. 143
Table 18.2 La Verde PEA estimate electrical cost ........................................................ 146
Table 18.3 La Verde PEA estimate for other infrastructure costs ................................... 147
Table 21.1 Indicative mining total and unit costs ........................................................ 152
Table 21.2 Mine mobile equipment capital per year ..................................................... 153
Table 21.3 Processing capital cost estimate (US$M) .................................................... 154
Table 21.4 Processing operating cost estimate (US$) .................................................. 154
Table 21.5 Processing manning costs (US$) ............................................................... 155
Table 21.6 Infrastructure capital costs ...................................................................... 155
Table 22.1 Gross and net revenue estimation ............................................................. 157
Table 22.2 La Verde Project conceptual cash flow ....................................................... 159
Table 22.3 Pre-tax cash flow sensitivity ..................................................................... 160
Table 22.4 Pre-tax cash flow sensitivity to copper price ............................................... 161
Table 26.1 Estimated cost of recommendations .......................................................... 166
Figures
Figure 4.1 La Verde regional location map ................................................................... 24
Figure 4.2 La Verde claims map ................................................................................. 25
Figure 5.1 Lowell Copper core storage and sampling facility .......................................... 29
Figure 5.2 Irrigation Canal at El Marqués River Gorge ................................................... 30
Figure 6.1 La Verde historical mining .......................................................................... 33
Figure 6.2 Noranda IP results .................................................................................... 36
Figure 7.1 Regional geology ...................................................................................... 39
Figure 7.2 Local geology map .................................................................................... 41
Figure 7.3 Geology of the La Verde intrusive complex ................................................... 42
Figure 8.1 Idealized porphyry copper model for La Verde .............................................. 49
Figure 8.2 Idealized porphyry copper model for East Hill ............................................... 50
Figure 9.1 IP survey – anomalies shown in red ............................................................ 51
Figure 9.2 2012 IP survey relative to previous surveys ................................................. 52
Figure 9.3 2012 IP survey anomalous IP responses ...................................................... 53
Figure 10.1 La Verde drillhole collar map ...................................................................... 55

La Verde Copper Project
Equinox Gold Corp. and Solaris Copper Inc. 718017
amcconsultants.com xvii
Figure 10.2 QQ plot, twin hole assays .......................................................................... 61
Figure 11.1 SRM CDN-CM-5 copper assay results ........................................................... 64
Figure 11.2 SRM CDN-CM-6 copper assay results ........................................................... 65
Figure 11.3 SRM CDN-CM-8 copper assay results ........................................................... 66
Figure 11.4 SRM CDN-CM-12 copper assay results ......................................................... 67
Figure 11.5 Blank sample copper assay results .............................................................. 68
Figure 11.6 Coarse reject duplicate relative difference plot.............................................. 69
Figure 11.7 Coarse reject duplicate QQ plot .................................................................. 70
Figure 12.1 Collar marker, LV12-045 ............................................................................ 72
Figure 13.1 Sulphide Cu rougher performance vs grind size ............................................ 78
Figure 14.1 West Hill geology domains ......................................................................... 86
Figure 14.2 East Hill geology domains .......................................................................... 86
Figure 14.3 West and East Hill geology domains ............................................................ 87
Figure 14.4 Contact plot for geology wireframes Zone 1 and Zone 7 ................................ 88
Figure 14.5 Contact plot for geology wireframes Zone 1 and Zone 3 ................................ 88
Figure 14.6 Contact plot for geology wireframes Zone 2 and Zone 7 ................................ 89
Figure 14.7 Contact plot for geology wireframes Zone 5 and Zone 8 ................................ 90
Figure 14.8 Histogram of copper assays, all drillhole and rock types................................. 91
Figure 14.9 Boxplot of 3 m composite by geology domain showing copper grade ............... 92
Figure 14.10 Specific gravity determinations ................................................................... 93
Figure 14.11 Copper OK block model, East-West Section at 2113000 North (looking North) .. 96
Figure 14.12 Copper OK block model, North-South Section at 810850 East (looking West) ... 97
Figure 14.13 Copper OK block model, planview 480 m elevation (looking down) ................. 98
Figure 16.1 Rock types in a typical section through West and East Hill, looking North ....... 105
Figure 16.2 Undiscounted pit value and mill feed yield versus pit size – roast / no-roast options
............................................................................................................ 108
Figure 16.3 Non-roasting NSR values and optimal pit – typical West-East section, through the
West and East hills (looking North) ........................................................... 109
Figure 16.4 Roasting NSR values and optimal pit – typical West East section through the West
and East hills (looking North) ................................................................... 110
Figure 16.5 Undiscounted and discounted pit value curves ............................................ 112
Figure 16.6 Selected ultimate pit and NSR values – typical section through West and East Hill,
looking North ......................................................................................... 113
Figure 16.7 Selected ultimate pit and NSR values – plan view at elevation 390 ................ 114
Figure 16.8 Selected ultimate pit and NSR values – typical section through West Hill, looking
East ...................................................................................................... 115
Figure 16.9 Selected ultimate pit and NSR values - typical section through East Hill, looking
East ...................................................................................................... 116
Figure 16.10 Selected ultimate pit and Mineral Resources (NSR greater than US$6/t) – Isometric
view looking North .................................................................................. 117
Figure 16.11 Mineral Resources with NSR values above US$6/t not mined by the ultimate
pit – Isometric view looking North ............................................................. 117
Figure 16.12 RQD values by geotechnical domain – logged from drillholes located in the
proposed West Hill pit ............................................................................. 120

La Verde Copper Project
Equinox Gold Corp. and Solaris Copper Inc. 718017
amcconsultants.com xviii
Figure 16.13 RQD values by geotechnical domain; logged from drillholes located in proposed
East pit .................................................................................................. 121
Figure 16.14 General layout including mill site, stockpiles and waste dumps – plan view .... 123
Figure 16.15 Mining schedule, end of Year 1 (end of pre-stripping) .................................. 124
Figure 16.16 Mining schedule, end of Year 5 ................................................................. 124
Figure 16.17 Mining schedule, end of Year 10 ............................................................... 125
Figure 16.18 Mining schedule, end of pit life ................................................................. 125
Figure 17.1 Process flowsheet ................................................................................... 133
Figure 17.2 Partial roasting flowsheet ......................................................................... 134
Figure 18.1 Proposed TMF and mine site ..................................................................... 138
Figure 18.2 TMF dam system and capacities ................................................................ 139
Figure 18.3 Other potential TMF sites near the mine site .............................................. 140
Figure 18.4 Property connectivity to nearby locations ................................................... 143
Figure 18.5 Active rail transport close to Core Shack .................................................... 144
Figure 18.6 Irrigation channel close to the proposed mill site ........................................ 145
Figure 18.7 Two high tension powerlines. La Verde hills in the background ..................... 146
Distribution list
1 e-copy to Equinox Gold Corp. 1 e-copy to Solaris Copper Inc. 1 e-copy to AMC’s Vancouver office

La Verde Copper Project
Equinox Gold Corp. and Solaris Copper Inc. 718017
amcconsultants.com 19
2 Introduction
2.1 General and terms of reference
This Technical Report on the La Verde Copper Property (the Property) located in Michoacan, Mexico,
includes the current La Verde Project (the Project) and the immediate surrounding land. It has been
prepared by AMC Mining Consultants (Canada) Ltd. (AMC) of Vancouver, Canada, on behalf of
Equinox Gold Corp. (“Equinox”) and its newly incorporated wholly-owned subsidiary Solaris Copper
Inc. (“Solaris”), both of Vancouver, Canada. Equinox also holds all of the shares of Lowell Copper
Holdings Inc. (“Lowell Copper”), of Vancouver Canada.
This report is an amended version of the 14 October 2014 Technical Report which in turn was an
updated version of the report issued effective 30 September 2012 and titled “La Verde Copper
Project Michoacán state, Mexico Technical Report” prepared by AMC for Catalyst Copper, and with
filing date 3 December 2012. None of the changes made in this amended report materially affect
AMC’s opinions or conclusions only the recommendations. The principal amendments have been
made in the interest of transparency to show a change in ownership and reduction in claim size.
These amendments are reflected in Section 2, 4, and 26 of the report. Other amendments are minor
wording changes for clarification. This report has been prepared in accordance with the
requirements of National Instrument 43-101 (NI 43-101), “Standards of Disclosure for Mineral
Projects”, of the Canadian Securities Administrators (CSA) for lodgement on CSA’s “System for
Electronic Document Analysis and Retrieval” (SEDAR).
2.2 The Issuer
Each of Equinox, Solaris and Lowell Copper is a company existing under the British Columbia
Business Corporations Act. Each of Solaris and Lowell Copper is a wholly owned subsidiary of
Equinox. On 20 June 2018 Equinox announced that its board of directors had approved a plan of
arrangement (“Arrangement”) under which Equinox intends to transfer its shares of Catalyst to
Lowell Copper and then Solaris will acquire all of the shares of Lowell Copper as well as the interest
in the La Verde Project. Shareholders of Equinox will receive common shares in Solaris in proportion
to their shareholdings in Equinox. Completion of the Arrangement is subject to certain conditions
including receipt of all necessary securityholder, court and regulatory approvals.
2.3 Report authors
A listing of the authors of this Report, together with the sections for which they are responsible, is
given in Table 2.1.

La Verde Copper Project
Equinox Gold Corp. and Solaris Copper Inc. 718017
amcconsultants.com 20
Table 2.1 Persons who prepared or contributed to this Technical Report
Qualified Persons responsible for the preparation of this Technical Report
Qualified Person
Position Employer Independent
of Lowell Copper
Date of last site
visit
Professional designation
Sections of Report
Mr P R Stephenson
Associate Principal Geologist
AMC Mining Consultants (Canada) Ltd.
Yes No visit
P.Geo., BSc (Hons), MCIM, FAIG, FAusIMM (CP)
1-5 and 23-26
Mr A Riles Principal Metallurgical Consultant
Riles Integrated Resource Management Ltd
Yes 11-12 April
2012
BSc (Hons) Grad Dipl Business Management, M. Econ Geol MAIG (QP)
13, 17, and 19. Part 18-21 and contributed to 25 and 26
Mr Mo Molavi
Director, Principal Mining Engineer, Manager of Mining Services
AMC Mining Consultants (Canada) Ltd.
Yes No visit P.Eng., M.Eng., B.Eng.
15, 16 and 18. Part 1, 2, 5, and 22
Mr Philippe Lebleu
Principal Mining Engineer
AMC Mining Consultants (Canada) Ltd.
Yes 10 April 2018
P.Eng., M.Eng. Part 26
Mr Michael F. O’Brien
Technical Director – Geology and Mineral Resources, Mining & Asset Performance Consulting
Ausenco Canada Inc
Yes No visit
M.Sc., Pr. Sci.Nat., FGSSA, FAusIMM, FSAIMM, P. Geo.
6-12 and 14
Other Experts who assisted the Qualified Persons
Expert Position Employer Independent
of Lowell Copper
Visited site
Professional designation
Sections of Report
Mr Braulio* Lanas
Senior Mining Consultant
AMC Mining Consultants (Canada) Ltd.
Yes 11-12 April
2012
16, 21 and 22; overall compilation of report
Mr James Stoddart
Principal Mining Consultant
AMC Mining Consultants (Canada) Ltd.
Yes No visit Peer Review of 16, 21, and 22
Ms Adrienne Ross
Principal Geologist AMC Mining Consultants (Canada) Ltd.
Yes No visit Ph.D., P.Geo. General assistance
Ms Margaret Harder*
Geologist Tetra Tech WEI Inc.
Yes 21 August
2012 M.Sc, P.Geo.
6 to 12 and 14
*Ms Harder is no longer employed with Tetra Tech WEI Inc. *Mr Lanas is no longer employed with AMC Mining Consultants (Canada) Ltd.
Personal inspections by QPs and others of the Property took place as follows:
• The Tetra Tech site visit was conducted by Margaret Harder on 21 August 2012.
• The AMC site visit was conducted by QP Alan Riles and Senior Mining Consultant Braulio Lanas,
from 11 – 12 April 2012. During the visit, the core shack and core storage facility, the Project
site and surroundings, and the Project office in Uruapan were visited. The visit covered
relevant geo-metallurgy aspects, including inspections of core boxes at the core shed, and
surrounding potential locations for relevant infrastructure components such as tailings disposal

La Verde Copper Project
Equinox Gold Corp. and Solaris Copper Inc. 718017
amcconsultants.com 21
facilities, concentrator and powerlines. The visit also included discussions with Catalyst staff
regarding drill core care, sampling and assaying procedures.
• The second AMC site visit was conducted by Philippe Lebleu on 10 April 2018. Philippe was
accompanied by representatives from Equinox and Lowell Copper. During this visit, the core
shack and core storage facility, the Project site and surroundings, and the Project office in
Uruapan were visited. The visit covered relevant geo-metallurgy aspects, including inspections
of core boxes at the core shed, and surrounding potential locations for relevant infrastructure
components such as tailings disposal facilities, concentrator and powerlines.
This report is effective 20 June 2018.
2.4 Units of measure, currency, and acronyms
Throughout this report, measurements are in metric units and currency in US dollars unless
otherwise stated. Tables 2.2 show key terms, acronyms, units and other abbreviations used.

La Verde Copper Project
Equinox Gold Corp. and Solaris Copper Inc. 718017
amcconsultants.com 22
Table 2.2 Units, terms, and abbreviations
Unit Abbreviation Term Abbreviation
Percent % Above mean sea level AMSL
Per pound (avdp) /lb Bond work index BWI
Per ounce (avdp) /oz Cyanide CN
Per kilowatt hour /kW.hr Diameter dia
Per cubic metre /m3 Earnings before interest, tax, depreciation, and amortization
EBITDA
Metre(s) m Engineering, procurement, and contract management
EPCM
Per tonne kilometre /t.km General and administration G&A
One millionth of a meter µm Hydraulic Radius HR
Square meters m2 Internal rate of return IRR
Cubic meters m3 Modified Stability Number N’
Cubic meters per hour m3/hr Preliminary Economic Assessment PEA
Millimetres mm Pre-feasibility study PFS
Million ounces (avdp) Moz Net present value NPV
dry metric tonnes dmt Acidity or basicity pH
Megapascals MPa Pyrite Py
Megatonnes Mt Rock Mass Rating RMR
Megatonnes per annum Mtpa Rock quality designation RQD
Grams/t g/t Rock work index RWI
Grams/t of gold g/t Au Semi-autogenous grinding SAG
Megawatts MW Tailings management facility TMF
Per annum p.a Universal Transverse Mercator UTM
Per tonne /t Fire Assay FA
Kilogram(s) kg Atomic Absorption AA
Kilograms per cubic metre kg/m3 Atomic Absorption Spectrometry AAS
Kilometre(s) km Gold Au
Square kilometres km2 Inductively-Coupled Plasma ICP
Cubic kilometres per annum km3/a Tonne(s) t
Kilopascal kpa Tonnes per hour tph
Kilotonne per annum kt/a Volt(s) V
Kilowatt kW Weight for weight w/w
Kilowatt-hours kWh Wet metric tonnes wmt
Litre l Tonnes per cubic metre t/m3
Pound (avdp) lb Tonnes per day tpd
ID inversed distance OK ordinary kriging
IDW inversed distance weighted
SG specific gravity
NN nearest neighbour SRM Standard Reference Material
Kilopascal kpa Tonnes per hour tph
Kilotonne per annum kt/a Volt(s) V
Kilowatt kW Weight for weight w/w

La Verde Copper Project
Equinox Gold Corp. and Solaris Copper Inc. 718017
amcconsultants.com 23
3 Reliance on other experts
The Qualified Persons have relied, in respect of legal aspects, upon the work of the Expert listed
below. To the extent permitted under NI 43-101, the Qualified Persons disclaim responsibility for
the relevant section of the Technical Report.
The following disclosure is made in respect of this Expert:
• Sections 2.1 and 2.2 of this report describe certain legal entities, corporate relationships, and
the proposed arrangement between Equinox and Solaris. The authors have relied solely on
Equinox Gold Corp.’s General Counsel, Susan Toews, for the information in Sections 2.1 and
2.2 regarding legal entities, corporate relationships, and the proposed arrangement.
Report, opinion, or statement relied upon:
• Tenure issues and lease reduction and legal aspects of the transaction between Catalyst
Copper and Equinox Gold Corp. and Solaris Copper Inc.
Extent of reliance:
• Full reliance following a review by the Qualified Person(s).
Portion of Technical Report to which disclaimer applies:
• Sections 2 and 4.

La Verde Copper Project
Equinox Gold Corp. and Solaris Copper Inc. 718017
amcconsultants.com 24
4 Property description and location
4.1 Location
The Property is located in the state of Michoacán, approximately 320 km west of Mexico City. The
known copper deposits on the Property area lie 8 km northeast of the town of Nueva Italia de Ruiz
(population ~50,000) and 8 km southwest of the town of Lombardia (population ~25,000). Uruapan
(population ~316,000) is the largest city near the Property and is 60 km to the north.
The centre of the Property is 19°05’14”N latitude and 102°00’41”W longitude, equivalent to
coordinates 814302 mE and 2113035 mN in Universal Transverse Mercator (UTM), Zone 13Q.
Figure 4.1 La Verde regional location map
Source: Catalyst Copper.
4.2 Concessions
The Property consists of one concession as outlined in Table 4.1 and illustrated in Figure 4.2.
Table 4.1 La Verde concessions
Claim Title No. Area (ha)
Unificacion Santa Maria 224965 2,547.4237

La Verde Copper Project
Equinox Gold Corp. and Solaris Copper Inc. 718017
amcconsultants.com 25
Figure 4.2 La Verde claims map
Source: Equinox Gold Corp.

La Verde Copper Project
Equinox Gold Corp. and Solaris Copper Inc. 718017
amcconsultants.com 26
All of the original claims which constitute the Unificacion Santa Maria were acquired by
Mr Jorge Ordoñez, the principal owner of Minera Cima S.A. de C.V. (Cima), in a Mexican claim
lottery. In February 2005, the original seven claims were unified and deemed the Unificacion Santa
Maria claim. Unification of contiguous claims allowed for distribution of exploration expenditures
throughout the land position.
Minera Aur Mexico S.A. de C.V. (Aur) executed a purchase agreement with Cima to acquire a 100%
interest in the original seven mining claims upon completion of the payments listed in Table 4.2.
Table 4.2 Cima agreement
Anniversary Date Payment ($)
0 On-signing 50,000
1 5 November 2005 100,000
2 5 November 2006 150,000
3 5 November 2007 250,000
4 5 November 2008 250,000
5 5 November 2009 6,000,000
Total 6,800,000
In addition, Cima retained a 0.50% net smelter royalty (NSR). In May 2005, the Capire protection
claim was located around the core of La Verde claims and became part of the Cima agreement. Teck
Resources Limited (Teck) acquired all of the outstanding common shares of Aur’s parent company
in September 2007. Aur changed its name to Minera Torre de Oro, S.A. de C.V. (MTO), and has
completed all option payments and now owns a 100% interest in the Property, subject only to the
underlying NSR royalty.
According to Mexican mining law, claims are located by establishing a concrete claim monument
(Punto de Partida), which is positioned within the Property or less than 3 km from any of the
boundaries, if it is outside. A registered surveyor must survey the Punto de Partida and link it to the
national survey network. The surveyor files a report with the Mexican mining agency. The report
includes the location of the Punto de Partida and the development of the perimeter of the claim.
AMC has been advised by Catalyst Copper that this was the procedure used to locate the Property
boundaries.
Svit Gold Corp. (Svit) initiated talks with MTO in 2009 to acquire the Property. A Property of Merit
report was prepared by Micon International Limited (Micon), dated 19 January 2010 as a
requirement for Svit to re-list on the TSXV. Svit changed its name to Catalyst Copper Corp. at the
time of re-listing. The option agreement between MTO and Minera Hill 29 S.A. de C.V (MinHill),
Catalyst’s Mexican subsidiary is as follows:
• Catalyst must incorporate MinHill, a wholly owned subsidiary of Catalyst, under Mexican law
(completed).
• MTO and MinHill will incorporate a separate joint venture company “Holdco” under Mexican
law (completed).
• Within ten days of signing, MinHill will advance US$6,000,000 to MTO. MinHill will also fund
US$10,000,000 in expenditures (work commitments) before 31 December 2012. This will earn
MinHill its initial 60% interest in the Property through Holdco (S-1 Option) (completed).
• The work commitment includes a minimum of 200 km of IP survey, a minimum of 30,000 m
of drilling and a NI 43-101 compliant mineral resource estimate of the Property (nearing
completion).
• MinHill is responsible for entering into access agreements with the local ejidos (completed).

La Verde Copper Project
Equinox Gold Corp. and Solaris Copper Inc. 718017
amcconsultants.com 27
Upon earning a 60% interest in the Project, Catalyst is required to deliver MTO “Notice”; that
includes a statement in reasonable detail evidencing its expenditures on the Project (including
required work commitments) and a technical report on the results obtained from such expenditures.
The date of delivery of such Notice is referred to herein as the “Catalyst Earn-In Date”.
MTO may elect, at any time up to 60 days after the Catalyst Earn-In Date, to:
1 Invoke its option (the “T-1Option”) to earn back a 20% interest in the Project, to hold a 60%
interest.
2 Form a joint venture, whereupon the interests would be Catalyst 60%, MTO 40%.
If MTO elects to exercise the T-1 Option, it is required to incur and sole fund aggregate additional
expenditures of twice the expenditures incurred by Catalyst to a maximum of $20M, within three
years of such election (MTO has the right to fund any shortfall in funding by paying such shortfall
in cash to Catalyst). If MTO fails either to complete such expenditures or pay the shortfall in cash,
then the interests in the Project would be Catalyst 60%, MTO 40%.
If MTO elects (or is deemed to have elected) not to invoke the T-1 Option, Catalyst has the right,
for a period of 60 days to purchase MTO’s remaining 40% interest by paying MTO $20M.
The option agreement warrants that the concessions and other rights are in good standing and that
MTO has paid the semi-annual taxes and completed all annual work commitments under Mexican
law. It also warrants that the concessions are free and clear of all liens, charges and encumbrances
arising from operations on or related to the Property.
AMC is not aware of any environmental or social issues that may affect access, title, or the right or
ability to perform work on the property. All exploration activities conducted on the property have
been in compliance with relevant environmental permitting requirements. To AMC’s knowledge,
MinHill has obtained the appropriate permits covering surface rights.
Regarding the mineral claims standing, AMC has been shown the updated payments done by MinHill
to MTO for the concept of updating the “Unificación Santa María” mine claims. This has been deemed
by AMC as sufficient proof of the Catalyst’s rights on the La Verde property.

La Verde Copper Project
Equinox Gold Corp. and Solaris Copper Inc. 718017
amcconsultants.com 28
5 Accessibility, climate, local resources, infrastructure, and physiography
5.1 Accessibility
Two paved highways provide access to the Property including the new Morelia – Lazaro Cárdenas
highway (toll road) and the original Lombardia-Nueva Italia highway (Mexico Highway 37) (Figure
4.1). Within the Property there are a series of all-weather dirt roads and old drill roads.
The closest international airport is at Morelia (2010 population 730,000). The General Francisco J.
Mujica International Airport is approximately 170 km to the northeast of the Property via the new
Morelia-Lazaro Cárdenas Autopista. A second international airport (Ixtapa Zihuatanejo International
Airport) is located approximately 200 km south of the Property. Uruapan is served by the Uruapan
International Airport.
5.2 Climate
The climate in the Project area is classified as semi-dry temperate with rain in the summer, an
average annual temperature of 27.3°C, and a mean temperature of 25.3°C in the coldest month of
the year. Average annual rainfall is 707.5 mm with the bulk of the rainfall occurring in June, July,
August, and September (588 mm). Exploration and mining can be carried out all year long.
5.3 Local resources
There are several villages within the concession boundary (see Figure 4.1). The two closest villages
are El Huaco, immediately south-west of the known deposits, and La Laguna, immediately to the
north-west. Both villages have a couple of hundred residents. These villages could provide some of
the workforce for the Project but could not provide the necessary equipment.
The larger town of Nueva Italia de Ruiz (2010 population 32,467) is immediately southwest of the
concession boundary. The Aur / MTO core and rejects that were stored in a warehouse in La Laguna
have been transported to a much larger warehouse facility 4 km north of Nueva Italia de Ruiz. The
front of the warehouse opens onto the main Lombardia-Nueva Italia de Ruiz highway, while the
main railway to the coast is adjacent to the rear of the warehouse (Figure 5.1).

La Verde Copper Project
Equinox Gold Corp. and Solaris Copper Inc. 718017
amcconsultants.com 29
Figure 5.1 Lowell Copper core storage and sampling facility
Source: Catalyst Copper.
Lombardia (population ~25,000) is immediately north of the Property boundary. Most of the
labourers and equipment required for the Project could be sourced from either of these larger towns.
Uruapan (2010 population 315,379) is approximately 60 km north of Nueva Italia de Ruiz.
More specialized equipment and skilled labourers may be sourced from Uruapan, Morelia (population
~608,000) and Lazaro Cardenas (population ~75,000). Difficult items may have to be sourced from
Mexico City or Guadalajara. It should not be necessary to source many items from outside Mexico.
Drill (core and reverse circulation (RC)) equipment and personnel can be sourced from other regions
within Mexico.
The known copper deposits are on the common land owned by the El Huaco Ejido (communal land
cooperative). Early on, Aur had difficulty in negotiating access rights with the El Huaco Ejido. MTO
when operator, improved community relations between itself and the ejido through assistance with
several projects for the cooperative as well as hiring some of its members during the exploration
seasons. A four-year access agreement was successfully negotiated that allowed MinHill access to
El Huaco common ground for exploration purposes. This access agreement has now expired and
would have to be re-established.
5.4 Infrastructure
There is a high-volume irrigation canal transecting the concession which is used by the local mango
and cucumber farmers. The canal empties into a steep canyon (El Marqués River gorge) near

La Verde Copper Project
Equinox Gold Corp. and Solaris Copper Inc. 718017
amcconsultants.com 30
El Huaco. To date, the availability and access to water for the exploration programs has been
favourably negotiated with local communities.
The road system in this part of Mexico is excellent. The rail link to the deep-sea port of Lazaro
Cardenas is in excellent condition. A siding already exists at the new core storage warehouse facility
north of Nueva Italia de Ruiz which could be used to handle bulk imports and copper concentrates.
There are several high-tension electrical lines (66 kVA) within 5 km of the Project. Telephone / cell
coverage in the area is excellent.
5.5 Physiography
The topography of the area is dominated by a ridge of prominent hills surrounded by low relief farm
land and occasional deeply incised canyon drainages. The main area of interest is characterized by
a series of hills approximately 5.5 km long (east-west) by 1 km wide (north-south) referred to as
the Sierra del Marqués. The maximum elevation on the Property is approximately 750 masl and
occurs on Cerro Mina La Verde (East Hill). The valley floor is at approximately 425 masl to the south
of Sierra del Marqués and 500 masl to the north.
Vegetation in the district is classified as Selva Baja Caducifolia and most hills are covered with
secondary vegetation consisting of small trees, bushes and vines. Large trees include tamarindo,
pinzon and cuatro hojas, however much of the primary vegetation has been stripped and secondary
vegetation dominates the non-irrigated land.
Irrigation of the valley floor has generated a strong agricultural industry. The main crops in this
area include mango, rice, cucumber, tomato, corn, lime and grapefruit. Agricultural fields are active
year-round with some areas generating up to four harvests per year.
Figure 5.2 Irrigation Canal at El Marqués River Gorge
Source: Catalyst Copper.

La Verde Copper Project
Equinox Gold Corp. and Solaris Copper Inc. 718017
amcconsultants.com 31
The US Geological Survey has recorded three earthquakes in proximity to Property. On
29 October 1990 there was a 5.1 magnitude earthquake at 98.6 km depth 16.5 km to the southeast
of the Property. On 3 July 1973 there was a 5.6 magnitude earthquake at 125 km depth 22 km to
the east of the Property. Then on 28 May 1985 there was a 5.2 magnitude earthquake at 105 km
depth 27.6 km to the southeast of the Property.

La Verde Copper Project
Equinox Gold Corp. and Solaris Copper Inc. 718017
amcconsultants.com 32
6 History
This section has been extracted and adapted from the Tetra Tech September 2012 Report.
6.1 Regional mining history
The Property is part of the Michoacán Copper Belt. This metallogenic area has been explored and
mined on a small scale since the early 1900s, focussing on high-grade showings. Since the early
1960s, the world mining industry has focused on large tonnage, low-grade porphyry copper
exploration and mining. This new direction has brought significant activity to this area.
Copper-bearing breccia pipes in the Huacana pluton, including La Verde, San Isidro and Inguaran,
underwent extensive exploration by mining companies and by various academic organizations
including the US Geological Survey and the Servicio Geologico Mexicano.
The largest copper mine in the region is located approximately 50 km east-southeast of La Verde
at the Inguaran mine. American Smelting and Refining Company (ASARCO) (now Grupo Mexico or
GMEXICO) mined several breccia bodies at Inguaran from 1971 to 1982 and extracted some
7,000,000 t of ore grading 1.2% Cu (Osoria et al. 1991).
Copper mining in other parts of the region has been restricted to small operations centred on high-
grade structures in andesites to the south of La Verde and in the Huacana pluton. Mining operations
such as Las Mexicanas produced small amounts of ore which were treated at a small mill in Oropeda.
A small underground mine and mill was developed at Brazil (also known as Calzontzin) where limited
tonnage was mined from a copper-rich narrow structure (~2 m wide) in the Huacana pluton.
6.2 La Verde mining history
Small scale copper mining began at Cerro Mina La Verde (East Hill) in 1906 and continued
intermittently until the early 1960s. Approximately 45,000 t of ore was mined from high-grade
sections using underground mining methods. Mined ore was hand-sorted, and material grading
greater than 10% Cu was shipped to local smelters (Coochey and Eckman 1978). Evidence of
previous mining is scattered throughout the Property, including underground workings (as shown
in Figure 6.1) and large open stopes on the south slope of East Hill, as well as open cuts and smaller
stopes on Cerro La Laguna (West Hill). The stopes on the West Hill continue to a depth of
approximately 35 m but have a short, generally less than 25 m, strike-length.

La Verde Copper Project
Equinox Gold Corp. and Solaris Copper Inc. 718017
amcconsultants.com 33
Figure 6.1 La Verde historical mining
Source: Catalyst Copper.
6.3 La Verde exploration history
The Property was virtually unexplored by modern methods until Consejo de Recursos No Renovables
(CRNR) conducted rock chip sampling, geophysics and diamond drilling in the late 1950s. Since this
initial phase of exploration, three major exploration efforts have been completed on the Property.
A summary of exploration activity at the Property is presented in Table 6.1.

La Verde Copper Project
Equinox Gold Corp. and Solaris Copper Inc. 718017
amcconsultants.com 34
Table 6.1 Summary of exploration activity
Year Activity
1906 Onset of mining high-grade copper zones.
1957
Mine operated and owned by Sr. Jose Maria Flores Barron.
CRNR completed mapping, geophysics (ground MAG) and underground sampling of stopes and adits, 370 samples taken with average grade of 1.4% Cu.
1958 CRNR completed 11 diamond drillholes on the southern flank of the East Hill, totalling 741 m of BQ core.
1967 to 1972
Lytton enters into agreement with Flores Barron and completes a comprehensive program of geological mapping, soil geochemistry, IP geophysics and approximately 50,201 m of diamond drilling and 12,584 m of percussion drilling. First feasibility study completed.
1974 Hudson Bay Mining and Smelting (HBM&S) acquires control of Lytton.
An additional 6,659 m of diamond drilling is completed, as well as a second feasibility study.
1976 D. Coochey completes resources estimate of West Hill.
1984 D. Coochey completes updated estimate of West Hill resource.
1995 to 1996
Mexican government mining agency, El Fideicomiso de Fomento Minero (FIFOMI) promotes the Property.
Noranda completes due diligence including underground mapping and sampling, IP geophysics and 300 m of RC drilling in the plains to the south of the Sierra del Marqués.
2003 Claims enter lottery and are acquired by Cima.
2004 to 2005 Aur enters into an option to purchase agreement with Cima.
Aur completed an airborne magnetometer, electromagnetic and radiometric survey in January 2005.
Late 2005 Aur acquires old data including the complete 1972, 1974 feasibility reports, archived drill logs, surface geologic maps and various other data from HBM&S data warehouse in Flin Flon, Manitoba.
2005 to 2007
Aur completed 24 diamond core drillholes for a total of 9,600 m and stores core in La Laguna warehouse.
Aur completed a series of short lined IP surveys over the Property in 2005. The resulting cut lines are still extremely visible from surface and satellite.
Aur had progressively poorer community relations with the El Huaco Ejido until the company was barred from the Property.
2007 to 2009
Teck acquires all of the outstanding common shares of Aur’s parent company in September 2007 and MTO completes four diamond core drillholes totaling 1,562 m in 2008.
The core is also stored in the La Laguna warehouse. Community relations with the El Huaco Ejido have improved.
2009 to 2012 MinHill options the Property from MTO and completes additional diamond drilling and geophysical surveys (see details in Sections 9 and 10).
6.3.1 Lytton / HBM&S program
Lytton completed an extensive exploration program at La Verde from 1967 to 1972 including
geological mapping and sampling, soil geochemistry, IP geophysics, underground development and
sampling, bulk sampling, and drilling. This work resulted in the delineation of a large mineralized
vein complex, known as the West Hill Zone, and four distinct mineralized breccia zones within the
East Hill area. Exploration activity is summarized in Table 6.2.

La Verde Copper Project
Equinox Gold Corp. and Solaris Copper Inc. 718017
amcconsultants.com 35
Table 6.2 Lytton / HBM&S exploration program
Company Year Activity Description
Lytton
1966 - 1967 IP Survey 47.5 km
1966 - 1967 Soil Geochemistry -
- Drilling – core 50,201 m
1967 - 1972 Surface 152 holes, V-1 to V-142
1969 - 1972 Underground 97 holes, UV-1 to UV-90
- Drilling – percussion 12,584 m
1967 - 1972 Surface 198 holes, S-1 to S-213, and R-2 to R-24
1969 - 1972 Underground 91 holes, US-1 to US-204
1970 IP Survey 179.5 km
1968 - 1971 Underground Development
2.2 m wide crosscuts and drifts totalling 3,386 m
1971 Bulk Sampling 245 m of crosscut sampling
1967 - 1972 Geologic Mapping 1:4000 scale map of the Sierra del Marqués
1968 - 1971 Underground Mapping 1:200 scale adit map
HBM&S 1974 - 1976 Drilling – core 6,659 m
- Surface 27 holes, V-143 to V-169
All IP surveys done for Lytton were undertaken by Seigel Asociados. Numerous anomalies were
identified on both West and East Hill that correspond well to the known mineralized zones. Lytton
and HBM&S used much of this IP data to target additional drillholes. Detailed descriptions of
individual anomalies and methods used are located in Seigel 1970.
Extensive drilling was completed on the Project, mostly by Lytton (62,785 m) and later by HBM&S
(6,659 m). A database for these drillholes includes short form logs that record rock types and
assays. Generally, both the East and West Hills were drilled along 50 m sections and at 50 m
intervals.
6.3.2 Noranda program
In early 1995 Noranda Mining and Exploration Inc. (Noranda) completed a significant amount of
field work on the Property which is summarized in Table 6.3.
Table 6.3 Noranda exploration program
Year Activity Description
1995
Geological mapping
– Underground
– Surface - regional
East Hill and selective West Hill adits
1995
Sampling
– Underground
– Silt - regional IP survey
East Hill and selective West Hill adits 27 km
The underground work by Noranda corroborated the mineralization in drillholes and Noranda
concluded that the historical grades could be considered valid, with the exception of gold which it
believed was lower than that reported in the 1972 feasibility study. The most significant finding of
the Noranda program, however, was the identification of a 1 by 2 km IP anomaly at 100 m depth
known as “La Verde Sur”, located roughly 1 km south of the East Hill in an area of alluvial cover as
illustrated in Figure 6.2.

La Verde Copper Project
Equinox Gold Corp. and Solaris Copper Inc. 718017
amcconsultants.com 36
Figure 6.2 Noranda IP results
Source: Catalyst Copper.
6.3.3 Aur program
Aur conducted an aggressive exploration program that is summarized in Table 6.4.
Table 6.4 Aur exploration program
Year Activity Description
2004 to 2006
Line cutting
Geophysical surveys
– Airborne
– Ground
Soil Geochemistry
Geological mapping
– Surface – regional
Drilling - core
– Surface
65 km, N-S lines 100 to 200 m apart
593 line km – mag, electromagnetic (EM) and radiometric IP (60 km) and magnetometer
487 samples
1:20,000
24 holes, 9,600 m, confirmation drilling and IP anomaly testing
The airborne, helicopter-based geophysics was completed by McPhar Geosurveys of Canada in
January 2005. Zang Geophysical Consultants interpreted the results in April 2005. The airborne
magnetics identified the eastern two-thirds of the La Verde intrusive as a large prominent magnetic
low especially around the known mineralized zones. Red diorite in the western half of West Hill is
thought to result in the magnetic high in this part of the intrusive. The magnetic low anomaly
continues to the northwest of La Verde but shifts westerly at the edge of the East Hill known
mineralized zones and continues under the alluvium in the La Laguna area. The electromagnetic
(EM) survey identified several resistivity anomalies that correlate to mineralized zones. The

La Verde Copper Project
Equinox Gold Corp. and Solaris Copper Inc. 718017
amcconsultants.com 37
radiometric survey outlines the location of exposed Huacana batholith, including the La Verde
intrusive complex.
The soil geochemical surveys focused on the western end of the Sierra del Marqués and Las Minitas.
The most significant copper soil anomaly was in the Las Minitas prospect area.
Ground geophysics was run over the cut lines and undertaken by Quantec Geophysics in
February / March 2005. IP spacing was 100 m over the East and West Hill deposits and 50 m on
the perimeter of the deposits and Las Minitas prospect. The results outlined a large chargeability
anomaly at a depth of 200 m below the surface of Sierra del Marqués. Several anomalies within the
area have not been drill tested. The ground magnetometer survey showed good correlation to the
airborne magnetometer results.
Geological reconnaissance mapping was completed to understand the property-scale geology, and
to investigate mineral occurrences as well as airborne geophysical anomalies outside of Sierra del
Marqués. Much of the Property has yet to be mapped as the program was cut short due to the onset
of the rainy season; however, a 1: 20,000 scale preliminary geological map was developed.
A total of 9,600 m of surface diamond drilling (7,085 m NQ size, 2,515 m HQ size) in 24 drillholes
was completed on the Property by Aur between November 2004 and August 2005. Seventeen of
the holes confirmed each of the mineralized zones in both West (two holes) and East Hill (15 holes).
Aur’s sample intervals within drill core were primarily selected based on the degree of visible copper
mineralization within a given zone (i.e. zones of high grade material were separated out from zones
of lower grade material). When present, major lithological breaks were used to begin / end an
individual sample interval.
While blanket sampling was not applied in the Aur drill program at La Verde, barren intersections
up to 20 m in width within otherwise mineralized zones were generally included in sampling for
continuity purposes. Overall approximately 64% of all core drilled at La Verde was sampled for
assaying.
6.3.4 MTO program
Teck acquired all outstanding common shares of Aur’s parent company in September 2007. The
following work was completed by MTO (Table 6.5).
Table 6.5 MTO exploration program (Years 2007 – 2009)
Activity Description
Geological Geophysical
Drilling – core
– Surface
Reinterpretation of older data
Reinterpretation of older data
Four holes, 1,562 m, perimeter holes
From 2008 to 2009 MTO completed a re-evaluation of the historical geology and drill database. A
new deposit model was developed by MTO geologists (Chamberlain, 2009). Through this work,
modifications to logging and mapping and recommendations for future exploration were put forth.
Historical geophysical data was re-interpreted by MTO geophysics personnel (V. Sterritt 2008 and
B. Lum 2009). Conclusions and recommendations from this work were as follows:
• Using the airborne data, several regional structures (i.e. faults and contacts) and large zones
of potential porphyry-style alteration were inferred.

La Verde Copper Project
Equinox Gold Corp. and Solaris Copper Inc. 718017
amcconsultants.com 38
• There is a decent correlation between structures identified from the aeromagnetic data and
the regional geology and there is potential for developing a map of the bedrock geology under
alluvium using the magnetics.
• The mineralized zones occur in a strong magnetic low, which corresponds well with the
mineralized lithologies.
• The magnetic low is much larger than the exposed Sierra del Marqués, indicating that there
is potential for mineralization under cover to the north and south of the known deposits.
• The IP / resistivity data indicates potential for untested sulphide mineralization between East
and West Hill, south of East and West Hill beyond the depth of investigation of the survey and
drilling and to the northwest beyond the survey extents.
Four diamond drillholes totalling 1,562 m were completed on the Property. The four holes explored
IP anomalies outside of the Sierra del Marqués ridge as MTO was still in the process of negotiating
an access agreement with the El Huaco Ejido. Anomalous intersections were cut in one of these
holes. This data, coupled with the geophysical data, indicate that there may be more mineralization
at La Verde than has been identified at the East and West Hill deposits.
MTO geologists used the same sample methodology as Aur. Sample intervals were generally 1.5 m.
Blanks were obtained from the same cinder cone quarry near Nueva Italia as used by Aur.

La Verde Copper Project
Equinox Gold Corp. and Solaris Copper Inc. 718017
amcconsultants.com 39
7 Geological setting and mineralization
This section has been extracted and adapted from the Tetra Tech September 2012 Report.
7.1 Regional geology
The Property is situated along the southern margin of the Mexican Neovolcanic Axis and within the
Sierra Madre del Sur (Figure 7.1). Most of the Project area is underlain by the north-western margin
of the mid-Tertiary Huacana granodiorite / quartz monzonite batholith. This same batholith is host
to the San Isidro and Inguaran copper breccia pipes located roughly 20 km and 50 km, respectively,
to the southeast of La Verde (Figure 7.1).
Figure 7.1 Regional geology
Source: Catalyst Copper.
7.2 Local geology
The surficial geology in this region is characterized by a blanket of Quaternary sediments dominated
by thick sequences of bedded conglomerate, lesser sandstone, mudstone and recent volcanic rocks
(Coochey and Eckman 1978). The La Verde intrusive complex represents a window of exposed
intrusive basement and forms an east-west trending arcuate range.
Early Tertiary supracrustal basement rocks are present in the El Marqués River gorge south of the
Property where interlayered porphyritic andesite and lesser basalt flows are exposed beneath
Quaternary andesite flows.

La Verde Copper Project
Equinox Gold Corp. and Solaris Copper Inc. 718017
amcconsultants.com 40
7.3 Property geology
7.3.1 Summary
The intrusive complex at La Verde is dominated by quartz-diorite, which is exposed along an east-
west-trending arcuate mountain range roughly 5.5 km long, 1 km wide and up to 290 m above the
surrounding blanket of Quaternary sediments (Figure 7.2 and Figure 7.3). The range is known as
the Sierra del Marqués and is divided into the Cerro La Laguna (West Hill) and Cerro Mina La Verde
(East Hill) by a topographic low known as La Puerta located roughly in the centre of the arc.
The East Hill contains four main copper mineralized zones. Three of these zones (#1, #3, and #4)
are hosted within altered and brecciated quartz-diorite in close proximity to dykes and stocks of
quartz-feldspar porphyry, while the fourth zone (#2) is hosted largely within unbrecciated quartz-
feldspar porphyry. All four mineralized zones form a roughly circular pattern on the western half of
the East Hill, in a plan view. Brecciation mechanisms on the East Hill vary from mechanical milling
to hydrothermal cracking. Alteration tends to be fairly tightly restricted to zones of brecciation,
except in the case of large-scale calcium-sodium metasomatism within quartz-diorite adjacent to
quartz-feldspar porphyry. Potassic feldspar alteration was noted in drillholes located on the north
side of the East Hill.
The West Hill is characterized by approximately east-west trending bands of phyllic / propylitic
alteration with associated pyrite-chalcopyrite ±arsenopyrite pyrrhotite veining at the contact
between quartz-diorite porphyry and equigranular quartz-diorite. The lateral extent of these
mineralized east-west striking veins forms a north-northeast south-southwest trending roughly
elliptical shaped mineralized body, in a plan view. The western half of the West Hill consists of
equigranular “red diorite” stained red by inclusions of hematite. A major north-northwest-trending
magnetic lineament occupies this region of the West Hill and may reflect a structural break
separating red diorite to the west from quartz-diorite to the east. Apart from a few small vein
showings, no significant copper mineralization has been intersected to date within the red diorite.

La Verde Copper Project
Equinox Gold Corp. and Solaris Copper Inc. 718017
amcconsultants.com 41
Figure 7.2 Local geology map
Source: Catalyst Copper.
The Las Minitas prospect (south-east from La Verde in Figure 7.3) is located roughly 2 km east-
southeast of the East Hill. It consists of a narrow, east-west-trending zone of propylitic / silica
alteration with associated weak chalcopyrite-pyrite mineralization.
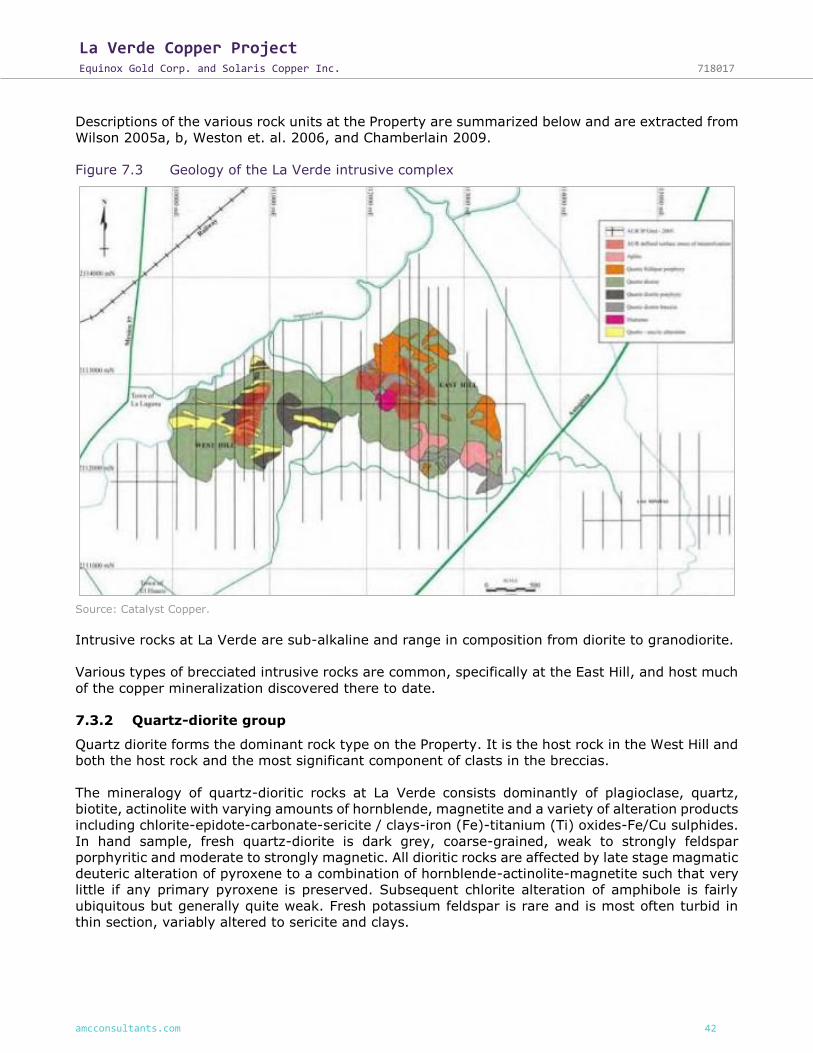
La Verde Copper Project
Equinox Gold Corp. and Solaris Copper Inc. 718017
amcconsultants.com 42
Descriptions of the various rock units at the Property are summarized below and are extracted from
Wilson 2005a, b, Weston et. al. 2006, and Chamberlain 2009.
Figure 7.3 Geology of the La Verde intrusive complex
Source: Catalyst Copper.
Intrusive rocks at La Verde are sub-alkaline and range in composition from diorite to granodiorite.
Various types of brecciated intrusive rocks are common, specifically at the East Hill, and host much
of the copper mineralization discovered there to date.
7.3.2 Quartz-diorite group
Quartz diorite forms the dominant rock type on the Property. It is the host rock in the West Hill and
both the host rock and the most significant component of clasts in the breccias.
The mineralogy of quartz-dioritic rocks at La Verde consists dominantly of plagioclase, quartz,
biotite, actinolite with varying amounts of hornblende, magnetite and a variety of alteration products
including chlorite-epidote-carbonate-sericite / clays-iron (Fe)-titanium (Ti) oxides-Fe/Cu sulphides.
In hand sample, fresh quartz-diorite is dark grey, coarse-grained, weak to strongly feldspar
porphyritic and moderate to strongly magnetic. All dioritic rocks are affected by late stage magmatic
deuteric alteration of pyroxene to a combination of hornblende-actinolite-magnetite such that very
little if any primary pyroxene is preserved. Subsequent chlorite alteration of amphibole is fairly
ubiquitous but generally quite weak. Fresh potassium feldspar is rare and is most often turbid in
thin section, variably altered to sericite and clays.

La Verde Copper Project
Equinox Gold Corp. and Solaris Copper Inc. 718017
amcconsultants.com 43
7.3.3 Feldspar +/- quartz porphyritic felsic intrusive group
Felsic intrusive rocks have been restricted to the East Hill. Based on available core and limited
outcrops there are at least four main types of felsic intrusive rocks present as breccia clasts or as
lithological units:
• Feldspar-biotite porphyry.
• Hornblende-quartz-feldspar porphyry.
• Hornblende-feldspar-quartz-eye porphyry.
• Fine to medium-grained aplite.
Hornblende-quartz-feldspar porphyry is the most abundant type of felsic intrusion on East Hill.
Detailed mapping would be required to substantiate this idea, as feldspar-biotite porphyry and
hornblende-quartz-feldspar porphyry have historically been mapped as a single unit.
7.3.4 Breccia
Brecciated quartz-diorite, feldspar±quartz porphyritic felsic intrusions host the bulk of copper
mineralization. The breccias show a wide range of characteristics, commonly complicated by
secondary alteration and mineralization. There are three types of breccia that have been recognized
at La Verde. These three types have been subdivided according to cement versus matrix fill,
lithofacies and components (Chamberlain 2009).
Two hydrothermal events have been recognized. The initial stage is associated with the copper
mineralizing event. The secondary stage crosscuts the lithology. A possible third event involves
tourmaline ±hematite cemented quartz and sericite altered diorite clast breccias.
7.4 Structure
No significant faults have been identified in drilling or in outcrops although there are numerous
minor structures / faults trending east-west, northeast-southwest and southeast-northwest. Several
regional structures (faults and / or contacts) have been identified by airborne magnetic and
electromagnetic geophysics as well as ground magnetometer and IP surveys run over the Property.
The interpreted aeromagnetic geophysical survey data indicates that there could be a left-handed
slip fault (or fold) separating the East Hill from the West Hill, striking at approximately 045° azimuth.
Very limited drilling in the projected fault area has not identified this structure.
No folding has been recognized in the drilling or in outcrops.
7.5 Alteration
In the West Hill area vein-controlled phyllic and propylitic alteration is oriented east-northeast within
the quartz-gabbro porphyry stock, east-southeast within surrounding quartzdiorite, and east-west
common to both. Historical mapping indicates linear east trending zones of quartz-sericite alteration
that can be traced for up to 900 m on surface.
Alteration on East Hill is limited to mineralized zones and associated breccias although there are a
few broad zones of calcium-sodium metasomatism found on the East Hill. Potassic alteration was
observed in drill cores on the north side of the East Hill deposits. Outside of these zones, little to no
pervasive wall-rock alteration is present.
La Verde Copper Project
Equinox Gold Corp. and Solaris Copper Inc. 718017
amcconsultants.com 44
7.6 Mineralization
Mineralization discovered to date at La Verde occurs predominantly within five main zones, four of
which are situated within the East Hill area. Detailed descriptions of all five zones are contained in
the Weston and MacLean 2006 report but are summarized in the following sections.
7.6.1 West Hill
The West Hill deposit has a north-northeast-trending elliptical outline, approximately 300 to 500 m
wide by 800 m in length. Mineralization on the West Hill deposit occurs in veins within
phyllic-propylitic alteration envelopes and the mineralization outcrops in a number of locations,
commonly marked by the appearance of limonite-malachite stained waste piles and / or sparse
vegetation “kill” zones.
The West Hill consists of steeply-dipping to vertical bands of epidote-sericite-quartz-calcite-altered
quartzdiorite and quartz-gabbro porphyry containing veinlets, veins, and disseminations of
pyrite-chalcopyrite ±pyrrhotite-arsenopyrite.
Phyllic-propylitic alteration veins strike east-northeast within the quartz-gabbro porphyry stock,
east-southeast within surrounding quartz-diorite, and east-west common to both. Historical
mapping indicates linear east-trending zones of quartz sericite alteration that can be traced for up
to 900 m on surface.
In drill core, mineralized veins vary from a few centimetres to several metres in width. Zones of
mineralization often consist of groups or swarms of mineralized veins with increased alteration
intensity correlating with increased vein density.
A low vein density usually corresponds with weakly mineralized zones, with sulphides generally
restricted to veins. Wall-rock alteration occurs as discrete envelopes around the veins. Surrounding
host rocks are generally unaltered.
Where there is high vein density, alteration in vein selvages coalesces and sulphides commonly
occur as disseminations in the vein selvages. The altered and / or mineralized host rock is
characteristically lighter in colour, non-magnetic and visually distinct from unaltered
quartz-diorite / quartz-gabbro host rock.
Localized high grade mineralization has been observed in drill core. As an example, drillhole
C11-04-02 intersected massive chalcopyrite veins of greater than 2 m core-width. The
non-true-width sample assayed 13.88% Cu over 3.99 m. Underground mapping indicates that these
wider zones of high grade mineralization pinch and swell over the width of the drift and plunge
either steeply east or steeply west.
It is difficult to correlate the mineralized structures, due to the variability of copper grades and
widths between drillholes. As a result, previous resource estimates have used phyllic-propylitic
alteration zones as a guide for connecting the mineralized intervals. These have demonstrated the
vertical continuity of the alteration system. Indeed, past and present drilling has intersected zones
of alteration / mineralization to a depth of 0 masl or 600 m below the top of West Hill.
Aur tried to model the West Hill vein structures by vertical and horizontal sections spaced 50 m
apart using various grade and waste parameters in an attempt to identify the orientation of broad
corridors of lower grade mineralization, and the orientation of narrow higher grade vein structures.
Unfortunately, due to the complexity of the mineralizing system, a representative geological solid
model which confidently reflected the size and shape of the West Hill Zone has not yet been

La Verde Copper Project
Equinox Gold Corp. and Solaris Copper Inc. 718017
amcconsultants.com 45
successfully produced. From this data, there appears to be a northeast-southwest trend to the
mineralization.
7.6.2 East Hill
7.6.2.1 #1 Zone (Breccia)
The #1 Zone is exposed at surface between sections 812300 to 812600 mE as a roughly east-
trending series of malachite-stained quartz-diorite breccia outcrops. Weathering and copper-oxide
mineralization is generally restricted to within 20 m of surface.
Mineralization occurs principally as disseminations and blebs of bornite-chalcopyrite± arsenopyrite-
molybdenite throughout the matrix and within fragments of brecciated quartz-diorite. Some
mineralization also occurs as planar fracture veinlets and joint coatings within large quartz-diorite
blocks and unbrecciated quartz-diorite wall-rock. The breccias are generally weakly to moderately
altered to an assemblage of chlorite-sericite-calcite±quartz. Zones of patchy pink alteration have
been interpreted to be potassically altered (potassium feldspar-chloritesericite±quartz-epidote-
calcite) fragments and are almost always associated with higher grade bornite±molybdenite-
arsenopyrite mineralization within the #1 Zone.
The #1 Zone forms a well-defined, fairly consistently mineralized body at a cut-off grade of
0.3% Cu. It has rough dimensions of 150 to 220 m wide, 100 to 150 m deep and 200 m long. The
western boundary of the zone is quite sharp as it passes into sporadically mineralized breccia. The
zone thins into two separate mineralized bodies to the east in section 812450 mE, before it
apparently pinches out in section 812500 m E. This area is poorly delineated, but the IP chargeability
inversion data indicates that there is potential for undiscovered mineralization at depth or along
strike.
The lower contact of the #1 Zone dips gently to the north between 20° to 30° and roughly parallels
the breccia / quartz-diorite footwall contact but extends into unbrecciated footwall up to 90 m in
section 812350 mE. Mineralization within the footwall differs in that it occurs principally as veinlets
and disseminations associated with a mix of alteration assemblages including quartz-potassium
feldspar-sericite-chlorite. Previous work suggests this footwall style mineralization may represent
part of a feeder system to the overlying mineralized breccias.
7.6.2.2 #2 Zone
Copper mineralization within the #2 Zone generally does not begin until 50 to 150 m below surface.
However, the western extension between lines 812300 mE to 812350 mE comes within 5 to 10 m
of surface and is clearly visible as a chargeability inversion anomaly. The upper 100 to 200 m of
this zone is hosted within a rootless, unbrecciated, quartz-feldspar porphyry which shows little
alteration outside of the mineralized veinlets. Below the porphyry, mineralization continues down
into quartz-diorite and quartz-diorite breccia.
Within quartz-feldspar porphyry, the mineralization is characterized by 1 to 2 mm wide sub-vertical
sheeted veins of chalcopyrite-bornite±molybdenite-arsenopyrite within discrete alteration
envelopes of quartz-chlorite-sericite. The veins are generally sub-parallel but conjugate sets have
been observed. Mineralization can also occur as finely disseminated chalcopyrite-bornite associated
with sericite-chlorite altered amphibole crystals within quartz-feldspar porphyry. At depth, the host
rock changes to quartz-diorite and quartz-diorite breccia with local zones of mixed breccia
containing quartz-feldspar porphyry fragments intermingled with quartz-diorite breccia. The
mineralization style largely remains as fracture veinlets and fine disseminations, often associated
with sericite-chlorite-quartz± potassium feldspar-calcite alteration envelopes. However, with depth
a strong and pervasive calcium-sodium-silicon (Ca-Na-Si) metasomatism pervades both quartz
diorite and quartz diorite breccia often masking igneous textures. This widespread alteration type

La Verde Copper Project
Equinox Gold Corp. and Solaris Copper Inc. 718017
amcconsultants.com 46
may indicate the presence of a large felsic intrusion at depth as there appears to be a close spatial
relationship at surface between calcium-sodium ±silicon metasomatism and quartz-feldspar
porphyry.
The #2 Zone trends east-southeast and at a cut-off grade of 0.3% Cu forms a well-defined,
consistently mineralized, vertically dipping tabular body between 50 to 150 m wide, up to 250 to
300 m in strike length, and with a dip extent of 350 m that is open at depth. The bottom of the
mineralizing system has yet to be defined for most of its strike length and there is potential to add
significant tonnage to this zone at depth.
Previous work indicates a lateral zonation in sulphide mineralogy as the zone tends to be
chalcopyrite dominant in the south and bornite dominant in the north. As well, in sections with deep
drillhole penetration the grade appears to decrease gradually with depth.
The western boundary of the #2 Zone is poorly defined and currently extends into the wide and
deeply mineralized area of the #4 Zone. Mineralization within this region contains some
characteristics of the #2 Zone, with fracture veins of bornite±chalcopyrite within quartz-feldspar
porphyry recorded in previous drill logs as far west as section 812250 mE.
To the east, the down dip extent of the #2 Zone appears to merge with the #1 Zone as the
mineralization shifts from #1-style blebs to #2-style sub-parallel fracture veins in a continuously
mineralized section intersected in hole C11-05-06. This area is also characterized by a lateral
displacement of the #2 Zone to the south before it gradually pinches to less than 20 m width at its
eastern boundary. The cause of this south, right-lateral shift is unclear as the majority of late faults
in the East Hill have been previously mapped as trending northeast, east and southeast, and there
does not appear to be a southerly shift in the outline of the #1 Zone in this area.
7.6.2.3 #3 Zone
The #3 Zone is intermittently exposed on surface for roughly 400 m between sections 812325 to
812725 mE as a southeast trending zone of malachite-stained breccias of quartz-feldspar porphyry
in the northwest and quartz-diorite breccia extending from the centre to the southeast. Mixed
breccias of quartz-feldspar porphyry and quartz-diorite occur within the contact areas between the
two main rock types. Weathering and copper oxide mineralization is generally restricted to within
20 m of surface except in zones of faulting where surface waters have percolated to greater depths.
Mineralization within the #3 Zone occurs as blebs, disseminations and veins of chalcopyrite-bornite
within sericite / kaolinite-chlorite-quartz±calcite-potassium feldspar altered framework supported
breccias of quartz-feldspar porphyry, quartz-diorite and mixed varieties of the two. Quartz-feldspar
porphyry breccias tend to be more tightly packed with less rotational movement than brecciated
quartz-diorite, and in several cases brecciated dykes of quartz-feldspar porphyry are observable in
drillcore.
At a cut-off grade of 0.3% Cu, the #3 Zone forms a fairly continuously mineralized southeast-
trending elongate corridor that extends for roughly 500 m. In cross section, however, this corridor
consists of one to three mineralized sections which merge and bifurcate along strike. In the
northwest the zone consists of two mineralized panels dipping to the northeast at 50 to 60° with
long axis 120 to 170 m and width 30 to 80 m. At roughly 812550 mE these two panels merge to
form a single intermittently mineralized body roughly 150 m wide and 100 to 220 m long. By
812650 mE, the zone splits again to form two mineralized zones, one of which exhibits a strong
vertical aspect.

La Verde Copper Project
Equinox Gold Corp. and Solaris Copper Inc. 718017
amcconsultants.com 47
7.6.2.4 #4 Zone
Copper mineralization within the #4 Zone does not outcrop and generally does not begin until 100
to 300 m below surface. Historical mapping indicates that it is manifested at surface as a 60 to 90 m
wide northwest trending band of weakly to non-mineralized green sericitized crackle breccia
between sections 811925 to 812250 m E. Near its eastern boundary in section 812225 mE, the #4
Zone approaches within 20 to 30 m of surface where it appears to merge with the #2 Zone.
Historically the #4 Zone was the last to be discovered at La Verde. Due to economic restrictions
inherent with the depth of mineralization, its dimensions were never properly delineated, and as
such there is good potential to add significant tonnage to this zone in the future.
Mineralization within the zone is characterized by blebby to disseminated chalcopyrite-
pyrite±bornite-arsenopyrite occurring principally within the matrix to a hydrothermal “crackle”
breccia cemented by a combination of quartz-calcite-tourmaline-chlorite gangue. Brecciated host
rocks are dominantly quartz-diorite, but several intervals of brecciated quartz-feldspar porphyry
indicate the area was intruded by several felsic dykes prior to, and possibly coincidental with
brecciation. Indeed, a large feldspar±quartz porphyritic stock occurs immediately north of the #4
Zone, and a mineralized feldspar-quartz-biotite bearing granodiorite has been intersected at depth
in drilling to the north in hole C11-05-15.
An early episode of silicification associated with the #4 Zone is evident as numerous cross-cutting
quartz veinlets at surface, and coarse, drusy quartz±tourmaline veins up to 4 m in core-width
observed at depth. Subsequent brecciation of the host rock ensued, as evidenced by the presence
of quartz-diorite fragments with quartz veinlets near surface, and brecciated quartz±tourmaline
vein fragments at depth. Pervasive wall-rock alteration followed (with zoned breccia fragments
containing light grey sericite / kaolinite-calcite altered cores and dark green chlorite-tourmaline
altered margins) along with cementation of the breccia matrix by a combination of quartz-calcite-
tourmaline-chlorite-chalcopyrite.
At a cut-off grade of 0.3% Cu (which includes 9 m internal waste), the zone is a large, roughly east-
west, irregularly shaped body with strike length up to 300 m, width varying from 100 to 350 m,
and an open down-dip extent up to 400 m. The western boundary of the zone is quite sharp,
terminating abruptly in section 811936 mE. To the east the zone pinches from 200 m width in
section 812085 mE to less than 100 m width in section 812130 mE before it appears to merge with
the #2 Zone. A large chargeability inversion anomaly to the south suggests sulphide mineralization
may continue for several hundred metres beyond the presently assumed southern limit of
mineralization. The northern boundary appears to dip steeply to the north between 55 to 75° until
section 812225 mE where it dips vertically, similar to the #2 Zone. The upper surface of the #4
Zone is highly irregular in form and may in fact be sub-horizontal with sub-vertical mineralized
shoots emanating upward from the main mineralized zone.
7.6.3 Las Minitas
The Las Minitas prospect occurs 2 km east-southeast of the East Hill, just east of the town of Las
Minitas. The prospect is characterized by an area, roughly 100 by 50 m, of exposed malachite chips
and a few shallow historical trenches. Recent geophysical and geochemical surveys revealed an
east-west trending IP inversion anomaly with coincident copper-in-soil anomaly over a strike length
of roughly 700 m. Subsequent drilling intersected significant copper mineralization in only one of
five holes drilled to test the area.
Hole C11-05-20 confirmed the existence of shallow copper mineralization of limited width and strike
extent immediately east of the historical showing. Mineralization here occurs as a 15 m wide discrete
band of chalcopyrite-pyrite disseminations and veins within pervasively quartz-chlorite-epidote

La Verde Copper Project
Equinox Gold Corp. and Solaris Copper Inc. 718017
amcconsultants.com 48
altered massive medium-grain quartz-monzodiorite. The mineralized band is interpreted from
geophysics to dip moderately (~45°) to the south and was not intersected in any other holes located
200 m, 400 m, and 640 m to the east.

La Verde Copper Project
Equinox Gold Corp. and Solaris Copper Inc. 718017
amcconsultants.com 49
8 Deposit types
This section has been extracted and adapted from the Tetra Tech September 2012 Report.
The La Verde deposit represents the upper portions of a copper porphyry deposit.
Several models have been developed for the La Verde deposit. One of these is illustrated in Figure
8.1, put forth by Weston and MacLean (2006). The figure illustrates the relationship between
intrusive breccias (East Hill) and buried porphyry (West Hill) copper systems at depth.
Examples of similar mineralized intrusive breccias are the Willa breccia pipe in south-eastern BC
(Wong and Spence, 1995), the mineralized breccia pipes of Copper Basin, Arizona (Johnston and
Lowell, 1961), and numerous copper bearing tourmaline breccia pipes in Chile as described by
Sillitoe and Sawkins (1971).
Figure 8.1 Idealized porphyry copper model for La Verde
Source: Weston and MacLean (2006).
The existence of a separate intrusion of quartz-gabbro porphyry is debatable, as past geologists
and recent observations suggest that porphyritic quartz-gabbro may simply be a contiguous phase
of the quartz-diorite intrusion forming the West Hill.
An alternative model for the East Hill deposit has been developed by Chamberlain (2009) and is
illustrated in Figure 8.2.

La Verde Copper Project
Equinox Gold Corp. and Solaris Copper Inc. 718017
amcconsultants.com 50
Figure 8.2 Idealized porphyry copper model for East Hill
Source: Chamberlain (2009).
This model includes the initial diorite intrusion which is overprinted by a series of pulsed breccia
facies with and without copper mineralization. A series of carbonate copper sulphide-sheeted veins
cross cut the lithology followed by small-scale bornite±chalcopyrite veinlets that cross cut the
porphyry and diorite. This is followed by chlorite veins and pervasive chlorite alteration which occurs
and replaces mafic mineral phases. The final recognized event is the emplacement of a hydrothermal
breccia with calcite-quartz-tourmaline-chalcopyrite cement.

La Verde Copper Project
Equinox Gold Corp. and Solaris Copper Inc. 718017
amcconsultants.com 51
9 Exploration
This section has been extracted from the Tetra Tech September 2012 Report.
9.1 2010 exploration
Based on the “Property of Merit” report (Makepeace, 2010) recommendations, MHill carried out an
exploration program in 2010. A 150-line km pole-dipole IP program was completed in October 2010
(Lajoie 2010) and was conducted by Pacific Geophysical Ltd (Pacific Geophysical) of Vancouver, BC.
The geophysical survey covered the East and West Hill as well as to the northern portion of the
Huacana Batholith area to the south end of the concessions. A standard pole dipole array with
a=100 m and the majority of the separation was n =1 to 12 which improved depth detection and
target delineation capability.
The results indicated that the southern portion of the concession hosted several IP anomalies that
can be attributed to hematite in quartz monzonite (Figure 9.1). The hematite mineralization appears
to be highly chargeable at times which can create shallow IP anomalies. Several drill target areas
were discovered from the survey including Huaco, Huaco South, Tziritzicuaro North. A review of the
previous data confirmed that the strongest chargeabilities in the vicinity of West Hill mineralization
were toward the north. This suggests that the area between West Hill deposit and the main irrigation
canal has mineral potential.
Figure 9.1 IP survey – anomalies shown in red
Source: Catalyst Copper.
9.2 2012 exploration
In 2012, a 59 line-km pole-dipole IP survey was completed in the Las Minitas area, southeast of
East Hill. The 2012 survey was also conducted by Pacific Geophysical. The survey was conducted
on a UTM grid with 200 m line spacing. Figure 9.2 shows the location of the 2012 lines relative to
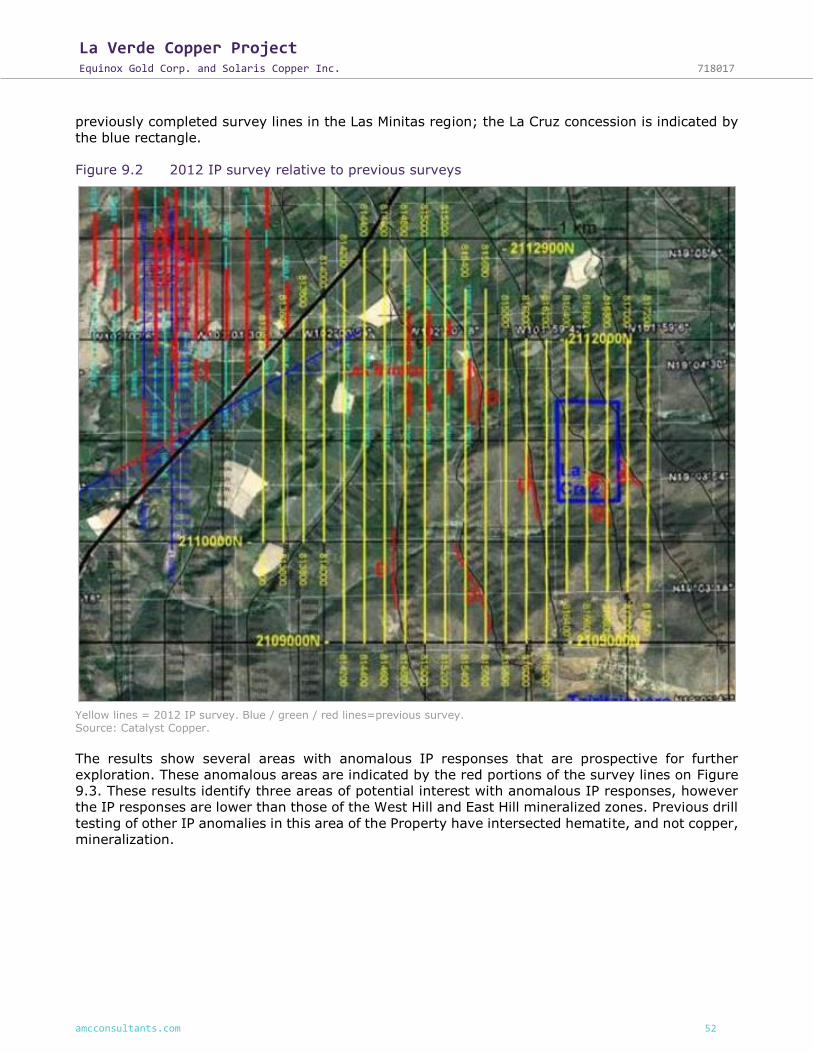
La Verde Copper Project
Equinox Gold Corp. and Solaris Copper Inc. 718017
amcconsultants.com 52
previously completed survey lines in the Las Minitas region; the La Cruz concession is indicated by
the blue rectangle.
Figure 9.2 2012 IP survey relative to previous surveys
Yellow lines = 2012 IP survey. Blue / green / red lines=previous survey. Source: Catalyst Copper.
The results show several areas with anomalous IP responses that are prospective for further
exploration. These anomalous areas are indicated by the red portions of the survey lines on Figure
9.3. These results identify three areas of potential interest with anomalous IP responses, however
the IP responses are lower than those of the West Hill and East Hill mineralized zones. Previous drill
testing of other IP anomalies in this area of the Property have intersected hematite, and not copper,
mineralization.

La Verde Copper Project
Equinox Gold Corp. and Solaris Copper Inc. 718017
amcconsultants.com 53
Figure 9.3 2012 IP survey anomalous IP responses
Red lines = anomalous IP chargeability responses. Source: Catalyst Copper.
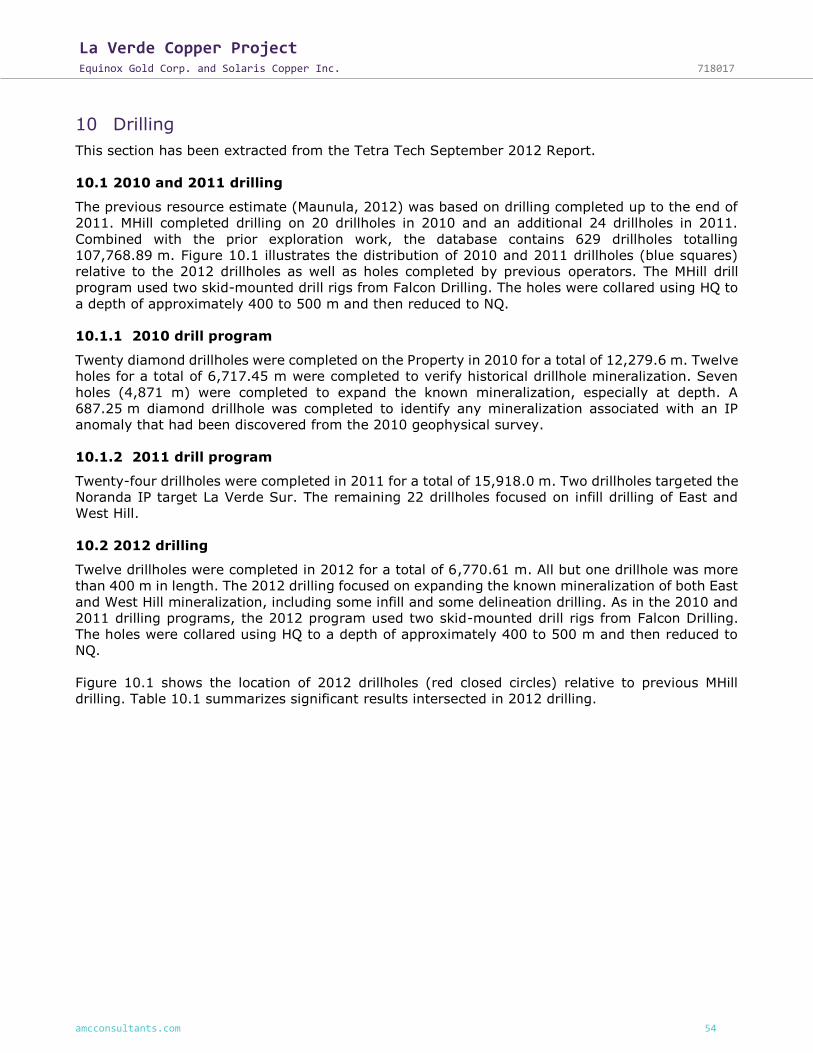
La Verde Copper Project
Equinox Gold Corp. and Solaris Copper Inc. 718017
amcconsultants.com 54
10 Drilling
This section has been extracted from the Tetra Tech September 2012 Report.
10.1 2010 and 2011 drilling
The previous resource estimate (Maunula, 2012) was based on drilling completed up to the end of
2011. MHill completed drilling on 20 drillholes in 2010 and an additional 24 drillholes in 2011.
Combined with the prior exploration work, the database contains 629 drillholes totalling
107,768.89 m. Figure 10.1 illustrates the distribution of 2010 and 2011 drillholes (blue squares)
relative to the 2012 drillholes as well as holes completed by previous operators. The MHill drill
program used two skid-mounted drill rigs from Falcon Drilling. The holes were collared using HQ to
a depth of approximately 400 to 500 m and then reduced to NQ.
10.1.1 2010 drill program
Twenty diamond drillholes were completed on the Property in 2010 for a total of 12,279.6 m. Twelve
holes for a total of 6,717.45 m were completed to verify historical drillhole mineralization. Seven
holes (4,871 m) were completed to expand the known mineralization, especially at depth. A
687.25 m diamond drillhole was completed to identify any mineralization associated with an IP
anomaly that had been discovered from the 2010 geophysical survey.
10.1.2 2011 drill program
Twenty-four drillholes were completed in 2011 for a total of 15,918.0 m. Two drillholes targeted the
Noranda IP target La Verde Sur. The remaining 22 drillholes focused on infill drilling of East and
West Hill.
10.2 2012 drilling
Twelve drillholes were completed in 2012 for a total of 6,770.61 m. All but one drillhole was more
than 400 m in length. The 2012 drilling focused on expanding the known mineralization of both East
and West Hill mineralization, including some infill and some delineation drilling. As in the 2010 and
2011 drilling programs, the 2012 program used two skid-mounted drill rigs from Falcon Drilling.
The holes were collared using HQ to a depth of approximately 400 to 500 m and then reduced to
NQ.
Figure 10.1 shows the location of 2012 drillholes (red closed circles) relative to previous MHill
drilling. Table 10.1 summarizes significant results intersected in 2012 drilling.
La Verde Copper Project
Equinox Gold Corp. and Solaris Copper Inc. 718017
amcconsultants.com 55
Figure 10.1 La Verde drillhole collar map
Note: Grid display easting (E) and northing (N) values (units in metres). Source: Catalyst Copper.

La Verde Copper Project
Equinox Gold Corp. and Solaris Copper Inc. 718017
amcconsultants.com 56
Table 10.1 2012 drilling – summary of significant results
Hill Drillhole From (m) To (m) Length (m) Cu (%) Au (g/t) Ag (g/t) Mo (%)
East LV12-037 118.70 125.00 6.30 0.423 0.160 1 0.001
129.00 135.00 6.00 0.119 0.042 1 0.001
140.00 148.00 8.00 0.250 0.196 2 0.001
221.80 229.50 7.70 0.116 0.043 1 0.009
261.50 265.50 4.00 0.102 0.006 1 0.006
277.30 280.90 3.60 0.145 0.078 1 0.011
315.40 319.75 4.35 0.116 0.007 1 0.001
329.20 332.45 3.25 0.123 0.033 1 0.001
East LV12-038 35.80 39.80 4.00 0.266 0.015 1 0.001
112.00 114.85 2.85 0.118 0.007 2 0.001
216.80 224.80 8.00 0.105 0.004 1 0.001
230.80 234.80 4.00 0.105 0.014 1 0.001
248.50 265.70 17.20 0.108 0.003 1 0.001
271.00 276.50 5.50 0.154 0.011 1 0.001
276.50 303.70 27.20 0.576 0.275 1 0.001
303.70 324.25 20.55 0.121 0.041 1 0.001
333.15 336.65 3.50 0.599 0.127 11 0.001
336.65 367.20 30.55 0.132 0.036 1 0.001
370.40 380.10 9.70 0.159 0.063 1 0.001
381.70 384.70 3.00 0.230 0.031 1 0.001
392.70 396.70 4.00 0.117 0.032 1 0.001
396.70 461.25 64.55 0.371 0.121 4 0.004
464.60 468.60 4.00 0.102 0.026 1 0.002
483.25 498.10 14.85 0.096 0.042 1 0.001
498.10 675.30 177.20 0.536 0.041 5 0.006
675.30 682.80 7.50 0.179 0.002 2 0.002
East LV12-039 89.05 92.20 3.15 0.184 0.038 2 0.001
236.80 250.80 14.00 0.349 0.028 2 0.001
332.00 346.00 14.00 0.234 0.008 3 0.001
354.00 358.15 4.15 0.249 0.023 4 0.001
360.30 368.00 7.70 0.106 0.023 2 0.001
376.00 603.05 226.95 0.673 0.076 6 0.003
617.00 621.00 4.00 0.131 0.008 2 0.004
627.00 631.00 4.00 0.435 0.005 5 0.014
646.00 651.50 5.50 0.221 0.004 2 0.012
661.60 673.35 11.75 0.932 0.009 6 0.009
West LV12-040 59.00 69.25 10.25 0.121 0.002 1 0.001
69.25 74.90 5.65 1.659 0.009 4 0.001
143.00 147.00 4.00 0.265 0.001 1 0.001
161.70 165.10 3.40 0.120 0.001 1 0.001
181.90 216.00 34.10 0.855 0.003 2 0.001
226.00 229.60 3.60 0.100 0.001 1 0.001

La Verde Copper Project
Equinox Gold Corp. and Solaris Copper Inc. 718017
amcconsultants.com 57
Hill Drillhole From (m) To (m) Length (m) Cu (%) Au (g/t) Ag (g/t) Mo (%)
231.20 236.70 5.50 0.828 0.001 3 0.001
236.70 244.70 8.00 0.109 0.003 1 0.001
256.60 259.30 2.70 0.282 0.002 2 0.001
288.30 291.70 3.40 0.259 0.002 1 0.001
320.20 323.10 2.90 0.250 0.001 1 0.001
327.30 331.50 4.20 0.222 0.003 1 0.001
364.60 372.35 7.75 1.477 0.006 2 0.001
383.05 387.35 4.30 0.263 0.002 1 0.001
West LV12-041 69.00 76.45 7.45 0.423 0.011 3 0.007
93.00 106.00 13.00 0.601 0.011 2 0.003
185.00 193.00 8.00 1.324 0.005 7 0.002
223.50 227.30 3.80 0.581 0.005 4 0.001
249.55 259.00 9.45 0.269 0.005 1 0.003
284.50 311.40 26.90 0.286 0.012 1 0.002
337.30 408.00 70.70 0.857 0.003 3 0.001
419.00 438.00 19.00 1.946 0.003 5 0.001
461.60 477.50 15.90 0.614 0.003 2 0.001
487.00 496.00 9.00 1.898 0.180 5 0.001
533.60 539.00 5.40 0.641 0.001 2 0.001
549.00 553.70 4.70 0.608 0.001 1 0.001
581.20 585.00 3.80 1.397 0.003 3 0.001
594.25 597.20 2.95 0.612 0.001 1 0.001
605.20 640.10 34.90 0.603 0.002 1 0.001
East LV12-042 47.30 50.70 3.40 0.266 0.019 1 0.001
100.75 243.00 142.25 0.287 0.007 3 0.001
289.60 293.70 4.10 0.229 0.008 2 0.001
325.60 330.70 5.10 0.239 0.001 1 0.001
359.15 557.95 198.80 0.375 0.078 5 0.004
West LV12-043 30.80 34.15 3.35 0.237 0.004 2 0.001
115.60 119.80 4.20 1.008 0.046 5 0.001
176.00 203.00 27.00 0.687 0.006 2 0.001
211.20 221.30 10.10 0.689 0.036 2 0.001
283.50 287.50 4.00 0.238 0.005 1 0.009
311.20 316.25 5.05 0.295 0.017 1 0.002
336.50 345.80 9.30 0.682 0.021 3 0.005
East LV12-044 197.10 201.15 4.05 0.237 0.018 2 0.002
238.00 246.00 8.00 0.295 0.016 5 0.001
278.55 283.30 4.75 0.245 0.022 4 0.003
303.50 307.50 4.00 0.231 0.021 3 0.001
366.20 369.65 3.45 0.390 0.050 3 0.001
400.50 406.50 6.00 0.200 0.140 2 0.002
432.85 436.70 3.85 0.213 0.113 2 0.002
483.00 487.00 4.00 0.563 0.095 5 0.005

La Verde Copper Project
Equinox Gold Corp. and Solaris Copper Inc. 718017
amcconsultants.com 58
Hill Drillhole From (m) To (m) Length (m) Cu (%) Au (g/t) Ag (g/t) Mo (%)
506.40 510.40 4.00 0.647 0.504 7 0.003
533.70 575.35 41.65 0.555 0.014 5 0.003
657.00 746.50 89.50 0.526 0.014 7 0.007
West LV12-045 115.00 118.50 3.50 0.250 0.002 2 0.003
133.15 150.90 17.75 1.246 0.019 5 0.003
233.00 255.90 22.90 0.972 0.015 4 0.001
295.60 299.00 3.40 0.269 0.002 2 0.001
326.70 352.70 26.00 1.683 0.007 4 0.001
381.00 395.25 14.25 2.038 0.010 6 0.001
403.15 410.50 7.35 0.389 0.003 2 0.001
East LV12-046 187.80 227.10 39.30 0.227 0.038 2 0.001
256.30 259.55 3.25 0.223 0.041 3 0.001
267.50 274.90 7.40 0.217 0.062 2 0.001
279.60 283.60 4.00 0.291 0.045 4 0.001
314.50 319.70 5.20 0.206 0.055 3 0.003
414.00 418.00 4.00 0.299 0.003 8 0.001
445.40 452.50 7.10 0.238 0.092 3 0.002
466.30 472.00 5.70 0.380 0.094 4 0.002
493.00 528.95 35.95 0.587 0.114 6 0.002
562.35 611.40 49.05 1.188 0.039 10 0.003
623.85 630.10 6.25 0.276 0.005 3 0.012
635.00 641.00 6.00 0.214 0.046 3 0.010
West LV12-047 81.70 86.30 4.60 0.294 0.003 2 0.001
114.60 123.35 8.75 0.263 0.004 2 0.001
132.80 140.85 8.05 0.874 0.009 4 0.001
185.70 188.70 3.00 0.461 0.003 3 0.001
196.30 205.30 9.00 0.627 0.042 4 0.004
209.30 213.30 4.00 0.251 0.005 2 0.001
259.00 263.00 4.00 0.229 0.002 2 0.001
298.00 330.70 32.70 0.387 0.003 2 0.001
378.00 381.95 3.95 1.639 0.014 5 0.001
413.45 422.75 9.30 0.668 0.018 2 0.001
433.40 437.60 4.20 0.220 0.002 2 0.001
452.00 458.85 6.85 0.405 0.002 2 0.001
478.30 480.25 1.95 0.353 0.003 2 0.001
493.60 584.90 91.30 0.530 0.003 2 0.001
West LV12-048 92.00 94.80 2.80 0.345 0.002 2 0.001
98.60 102.55 3.95 0.818 0.002 2 0.001
115.00 124.25 9.25 0.882 0.002 2 0.002
146.40 153.85 7.45 0.225 0.002 2 0.001
179.35 188.70 9.35 0.469 0.004 2 0.001
208.50 216.00 7.50 0.264 0.002 2 0.001
222.00 226.00 4.00 0.645 0.004 2 0.001

La Verde Copper Project
Equinox Gold Corp. and Solaris Copper Inc. 718017
amcconsultants.com 59
Hill Drillhole From (m) To (m) Length (m) Cu (%) Au (g/t) Ag (g/t) Mo (%)
244.00 252.00 8.00 0.634 0.005 2 0.001
261.60 269.25 7.65 1.010 0.006 2 0.001
279.00 283.00 4.00 0.202 0.002 2 0.001
298.50 308.60 10.10 2.020 0.003 3 0.002
320.20 324.20 4.00 0.296 0.002 2 0.001
352.20 356.20 4.00 0.267 0.007 2 0.001
373.20 377.10 3.90 2.148 0.007 4 0.001
382.40 385.75 3.35 0.380 0.004 2 0.001
411.80 428.05 16.25 0.474 0.002 2 0.001
456.95 465.35 8.40 0.299 0.002 2 0.001
10.3 Verification drillholes
The verification, or twinned, drillholes (T suffix in Table 10.2) were drilled as close as possible to
the historical holes, based on the known coordinates of those holes. In some cases, the exact collar
location of the historical drillhole could not be determined. Half of the historical holes had no
down-the-hole surveys so their path was assumed to be linear while the verification holes were all
surveyed at regular intervals throughout the holes. The verification holes were drilled deeper than
the historical holes because mineralization continued at depth. Deeper mineralized intervals were
intersected in the majority of the verification holes.
Table 10.2 compares the weighted average of the initial continuous mineralized intervals within
each of the historical holes as compared to the verification holes. This analysis illustrates that
although the continuous interval is large, the majority of the verification holes compare favourably
with the historical data. There are a few holes that do not compare well but are still anomalous.
These differences could be explained by:
• The historical and verification holes may be further apart from one another, possibly due to
survey accuracy of the collar location of the historical hole with respect to the verification hole
collar.
• The historical holes that have no down-hole surveys could have deviated independently to the
verification holes creating an increasing distance between the holes as the hole depths
increased.
• Small-scale variations or high-grade veinlets may have been intersected in one hole and not
the other due to the nature of the geological formations (e.g. breccias) being intersected.

La Verde Copper Project
Equinox Gold Corp. and Solaris Copper Inc. 718017
amcconsultants.com 60
Table 10.2 Twinned drillholes
Holes From (m) To (m) Interval (m) Grade (Cu %)
V-126 228.05 360.25 132.20 0.48
V-126T 227.53 360.85 133.32 0.48
V-12 96.80 240.70 143.90 1.06
V-12T 96.00 240.00 144.00 0.68
V-13 27.80 276.50 248.70 0.26
V-13T 28.71 276.70 247.99 0.20
V-14 16.30 167.00 150.70 0.38
V-14T 16.10 165.40 149.30 0.36
V-15 13.40 281.20 267.80 0.54
V-15T 13.00 282.00 269.00 0.45
V-17 80.80 351.00 270.20 0.26
V-17T 79.50 352.00 272.50 0.44
V-19 37.00 261.25 224.25 0.50
V-19T 37.50 260.86 223.36 0.34
V-21 20.15 310.50 290.35 0.28
V-21T 20.20 311.00 290.80 0.26
V-38 70.35 243.90 173.55 0.35
V-38T 70.10 243.00 172.90 0.18
V-47 108.30 390.15 281.85 0.36
V-47T 108.60 391.00 282.40 0.37
V-75 74.70 473.00 398.30 0.35
V-75T 74.50 473.00 398.50 0.28
V-76 0.00 90.85 90.85 1.00
V-76T 0.00 91.00 91.00 0.36
The quantile-quantile (QQ) plot is illustrated in Figure 10.2 and demonstrates that the twin hole
assays were generally lower in grade but match reasonably well up to 0.5% copper. High-grade
chalcopyrite veinlets results in a greater assay difference at higher grades, which is to be expected
given the nature of high grade mineralization.
Tetra Tech feels that the historical holes can be used as part of the drill database.

La Verde Copper Project
Equinox Gold Corp. and Solaris Copper Inc. 718017
amcconsultants.com 61
Figure 10.2 QQ plot, twin hole assays
Source: Tetra Tech.
10.4 Drillhole survey
The Catalyst diamond drillhole collars were initially surveyed with a Garmin GPS 60CSx which has
an accuracy of ±3 m. All 2010 and 2011 drillholes were later resurveyed by an external surveyor.
A rented FlexIT Smart Tool Survey System (No. 54611) was used for all down-the-hole surveys.
Prior to the Maunula (2012) resource estimate, all drillhole collars were translated to WGS84 datum
to conform with the new topography survey by Aero Geometrics Ltd.
10.5 Mineral sample length versus true thickness
The relationship between sample length and true thickness cannot always be established for
porphyry style mineralization. At the Property, there is disseminated and stockwork mineralization.
Both the East and West Hill mineralized zones are irregular, coupled with multiple phases of
intrusion. This makes it difficult to know the orientation and dimensions of mineralization relative
to an individual drillhole. Therefore, although mineralized intervals may be selected on the basis of
grade, the true thickness of the mineralized zone is not readily apparent.
However, the West Hill mineralized vein structures typically are oriented with an east-west strike
(090° azimuth) and steeply dip to the south. Therefore, in this area the drillholes have a bearing of
000° azimuth, which is approximately perpendicular to the strike of the veins. The holes are inclined
and depending on the dip inclination of the individual holes, the true thickness would be
approximately 60 to 90% of the drill core intervals.

La Verde Copper Project
Equinox Gold Corp. and Solaris Copper Inc. 718017
amcconsultants.com 62
11 Sample preparation, analyses, and security
The following Sections 11.1 through 11.5 are a summarized version of the sample preparation
methodology used for the La Verde Mineral Resource and Mineral Reserve. The summary is derived
from the Tetra Tech September 2012 Report to which the reader is referred for further details.
11.1 Sample preparation
For each drillhole, one geologist was assigned responsibility for all aspects of the core sampling
method.
Core boxes were transported twice daily from the drill station to the core facility. Rock quality
designation (RQD) and geology were logged on paper. Sample intervals were marked on the core
box and sample tags were also stapled to it. A digital photo was taken of each core box prior to
cutting.
Core was cut in half with a diamond core saw. Sample intervals were generally 2 m in length. The
samples were placed in heavy mil plastic bags with a sample tag inside the bag and the sample
number written on the outside. Samples were then placed in nylon sacks. Sample numbers were
written on each sack. A lab sample sheet documents each sack and each sample within the sack.
Quality assurance / quality control samples (QA / QC) were inserted into the sequence of sample
numbers for each hole. A standard was inserted every 20 samples and a blank was inserted every
30 samples. Duplicate samples, in the form of a quarter of the remaining core interval, were inserted
every 40 samples.
Geological logs, photos and samples sheets were input into a laptop on a daily basis. This data was
backed up onto a second computer and an external drive each day.
11.1.1 Sampling of previously drilled core
In 2010 and 2011, MHill sampled core from drillholes completed by Aur in 2005 to 2007. Aur
sampled only 64% of the core, leaving many gaps including apparently barren intervals within
mineralized areas. MHill sampled these gaps to provide continuous sampling in mineralized areas.
A total of 524 samples were collected from 14 Aur drillholes. Sample preparation, storage, analysis,
and QA / QC for these samples is the same as for other samples collected by MHill, described
elsewhere in this section.
11.2 Core storage facility
MinHill established a new secure core storage facility at a large warehouse in Estación Nueva Italia
which is approximately 4 km north of Nueva Italia de Ruiz along Mexico Highway 37. The warehouse
backs onto a siding which is part of the main line railway to the ocean port facilities at Lazaro
Cardenas.
The facility has ample room for core logging, core sawing / sampling and core / reject / pulp storage.
All Aur and MTO core, rejects and pulps have been moved from the original warehouse at La Laguna
to this new facility.
11.3 Sample analysis
Samples were taken to Acme Analytical Laboratories Mexico S.A. de C.V., Guadalajara Mexico, for
sample preparation. An employee from Acme signed for the samples and drove them to their
laboratory. Each sample was pulverized and sieved generating a pulp and rejects. The sample was

La Verde Copper Project
Equinox Gold Corp. and Solaris Copper Inc. 718017
amcconsultants.com 63
crushed to 80% passing 10 mesh, split 500 g and pulverized to 85% passing 200 mesh (R200-500).
The rejects were returned to MHill in Estación Nueva Itália, by Acme drivers.
The pulps were sent by air express cargo to Acme Analytical Laboratories in Vancouver, BC, Canada
for analysis. The analysis was initially a 36 element inductively coupled plasma (ICP) analysis (Acme
Group 1D). A 0.5 g sample split is leached in hot (95°C) aqua regia with the resulting aliquot being
analysed by an inductively coupled plasma emission spectrometry (ICP-ES). This initial analysis was
almost immediately changed to achieve optimum precision especially in copper (Acme Group 7AR).
The aqua regia aliquot is analyzed by ICP-ES emission spectrometry giving “%” concentrations for
base and precious metals. If the concentration of copper or molybdenum were over 10,000 ppm
(1%) then the sample had an atomic absorption spectroscopy (AAS) finish (Acme Group 8AR). If
the concentration of gold was above 0.5 g/t, that sample was fire assayed (Acme Group G01).
The results of the analysis were digitally sent to MHill and followed up by hardcopy assay certificates.
Acme Analytical Laboratories Ltd. (AcmeLabs) is an independent, internationally recognized,
ISO 9001:2008 certified facility (Quality Management System Certificate FM 63007). They are
working toward ISO / IES 17025:2005 (General Requirements for the Competence of Testing and
Calibration Laboratories) certification.
Catalyst has also sent a random series of 100 pulps to ALS Minerals’ laboratory in North Vancouver,
BC, Canada as a check on AcmeLab’s performance. ALS Minerals is also an ISO 9001:2008 certified
facility and operates in compliance with ISO / IES 17025.
11.4 Review of Quality Assurance / Quality Control
MHill used a series of standard reference materials (SRMs), blank reference materials (Blanks) and
duplicates as part of their QA / QC program.
11.4.1 Standards
Four SRMs from CDN Resource Laboratories Ltd. (CDN Resource) in Langley, BC, Canada were used
during the exploration program: CDN-CM-5, CDN-CM-6, CDNCM- 8, and CDN-CM-12.
The SRMs analysed by ACME report close to the recommended values.
Table 11.1 is a summary of the text from the Tetra Tech September 2012 Report. The table lists
the number of SRMs analysed by ACME, the results of those assays, the number of times an insertion
error occurred and the number of times the standard was outside acceptable limits.
Table 11.1 Summary of Standard Reference Material results
SRM No. of SRM analysed
Average Cu (%)
Two standard deviations
Insertion errors*
Fails
ACME CDN-CM5 180 0.316 0.026 9 2
Expected n/a 0.319 0.020 n/a n/a
ACME CDN-CM6 338 0.737 0.042 9 2
Expected n/a 0.737 0.039 n/a n/a
ACME CDN-CM8 196 0.367 0.012 3 0
Expected n/a 0.364 0.024 n/a n/a
ACME CDN-CM12 16 0.914 0.024 0 1
Expected n/a 0.917 0.044 n/a n/a
*An insertion error is where the SRM was identified as the wrong standard. Insertion errors are not considered fails.

La Verde Copper Project
Equinox Gold Corp. and Solaris Copper Inc. 718017
amcconsultants.com 64
In addition, for CDN-CM-5, ten samples had insufficient material for gold analysis. For CDN-CM-6,
twelve samples had insufficient material for gold analysis and one sample had insufficient material
for copper analysis. For CDN-CM-8, fifteen samples had insufficient material for gold analysis and
two samples for copper.
The following charts, Figure 11.1 to Figure 11.4, illustrate the standard assay results for standards
CDN-CM-5, CDN-CM-6, CDN-CM-8, and CDN-CM-12.
Figure 11.1 SRM CDN-CM-5 copper assay results
Source: Catalyst Copper.

La Verde Copper Project
Equinox Gold Corp. and Solaris Copper Inc. 718017
amcconsultants.com 65
Figure 11.2 SRM CDN-CM-6 copper assay results
Source: Catalyst Copper.

La Verde Copper Project
Equinox Gold Corp. and Solaris Copper Inc. 718017
amcconsultants.com 66
Figure 11.3 SRM CDN-CM-8 copper assay results
Source: Catalyst Copper.

La Verde Copper Project
Equinox Gold Corp. and Solaris Copper Inc. 718017
amcconsultants.com 67
Figure 11.4 SRM CDN-CM-12 copper assay results
Source: Catalyst Copper.
11.4.2 Blanks
There were 498 blanks inserted in the program. The blanks were material from a local gravel pit
(volcanic cinder cone). The copper assays from the blank samples were quoted in parts per million
rather than copper percent, due to the very low concentration of copper in the blanks. Ten
independent samples averaging 3.1 kg were sent to AcmeLabs for analysis. The average of these
samples was 28.9 ppm copper ± 2.2 ppm copper. Figure 11.5 illustrates the blank sample assay
results.
There are many sample results that plot above the second standard deviation level. This can partially
be attributed to the lower detection limit (1 ppm copper) of the equipment used and possibly the
potential inhomogeneity of the blank material. Although the copper levels in the blank material are
extremely low, Micon (Makepeace, 2011) had recommended that a standard blank sample be used
in further drilling programs as part of the QA / QC process. This was not implemented by MHill in
the 2011 drill program. Using three times the “accepted average”, there were 15 blank samples
that failed. One may be an insertion error, as it appears to be an SRM sample for CM-6.

La Verde Copper Project
Equinox Gold Corp. and Solaris Copper Inc. 718017
amcconsultants.com 68
Figure 11.5 Blank sample copper assay results
Source: Catalyst Copper.
11.4.3 Duplicates
There were 382 duplicate samples analysed during the program. The duplicates report 70% within
20% relative difference, the target is generally set for 90%. These results somewhat reflect the
influence of the high-grade copper veinlets within the core.
The QQ plot in Figure 11.7 shows that there is no bias present in the samples. Generally, the
distribution tracks closely to the X=Y line up to 3% copper. Above the 3% copper point, the duplicate
assay is higher than the original assay.
Figure 11.6 illustrates the comparison between the two assay results.
The duplicates report 70% within 20% relative difference, the target is generally set for 90%. These
results somewhat reflect the influence of the high-grade copper veinlets within the core.
The QQ plot in Figure 11.7 shows that there is no bias present in the samples. Generally, the
distribution tracks closely to the X=Y line up to 3% copper. Above the 3% copper point, the duplicate
assay is higher than the original assay.

La Verde Copper Project
Equinox Gold Corp. and Solaris Copper Inc. 718017
amcconsultants.com 69
Figure 11.6 Coarse reject duplicate relative difference plot
Source: Tetra Tech.

La Verde Copper Project
Equinox Gold Corp. and Solaris Copper Inc. 718017
amcconsultants.com 70
Figure 11.7 Coarse reject duplicate QQ plot
Source: Tetra Tech.
11.4.4 Second laboratory
The 100 samples that were re-assayed at ALS Minerals have been compared to the AcmeLabs
analysis. Based on this small number of samples, the AcmeLabs analysis reports 0.004% copper
below the ALS Minerals analysis with a standard deviation of 0.035% copper. An analysis of the
QA / QC standards, used in the MHill drill program, was also compared. The results showed similar
variations to the 100 samples. This nominal difference between laboratories is considered
acceptable.
11.5 Discussion
Tetra Tech believes that the QA / QC program that was initiated by MHill during the 2010 drilling
program and continued through the 2011 and 2012 programs follows industry accepted guidelines
and the results confirm the validity of the assays obtained from that program.
Tetra Tech recommends timely monitoring of QA / QC samples through control charts to further
improve the QA / QC program.

La Verde Copper Project
Equinox Gold Corp. and Solaris Copper Inc. 718017
amcconsultants.com 71
12 Data verification
Sections 12.2 and 12.4 are a summarized version of the logging and check assay methodology. The
summary is derived from the Tetra Tech September 2012 Report of Tetra Tech to which the reader
is referred for further details. The remaining sections are an extraction from Tetra Tech September
2012 Report.
The Tetra Tech site visit was conducted by Margaret Harder, P.Geo., 21 on August 2012. During the
site visit to the Property, the core shack and core storage facility, which are located at the Project
office 8 km northeast of the town of Nueva Italia de Ruiz, were visited. The Project office in Uruapan
was also visited following the Project site visit.
Tetra Tech conducted verification of two drillholes LV12-039 and LV12-045 which is 16% of the
12 drillholes completed in 2012. Tetra Tech found that MHill followed industry accepted guidelines
for drillhole data management.
12.1 Drillhole Collar
Two collars were checked in the field during the site visit. Table 12.1 compares the collar locations.
Tetra Tech used a Garmin Oregon 550 for the field readings. The accuracy for this global positioning
system (GPS) instrument is less than 10 m. The collar coordinates were generally confirmed within
that level of accuracy, although the easting reading for LV11-039 was slightly outside of the error
limit. The elevations for both holes were also slightly outside these error limits, although elevations
values are often somewhat less accurate than easting and northing readings.
Table 12.1 Field check – collar survey
Drillhole Coordinate MHill Tetra Tech
LV11-039
Easting 812,100 812,088
Northing 2,112,690 2,112,691
Elevation 483 495
LV11-045
Easting 810,935 810,937
Northing 2,113,295 2,113,297
Elevation 523.5 534
Figure 12.1 illustrates the method employed By MHill to mark the collars in the field.

La Verde Copper Project
Equinox Gold Corp. and Solaris Copper Inc. 718017
amcconsultants.com 72
Figure 12.1 Collar marker, LV12-045
Source: Tetra Tech.
12.2 Logging
The core boxes of the two drillholes were laid out in MHill’s warehouse. Core box labelling and
footage markers and assay tags were reviewed. No errors were noted.
The logged lithology was compared with the database record to confirm data entry along with
consistency and accuracy in logging. The contacts were found, in some cases, to be transitional so
the position of the contact was subject to interpretation. As the grade is transitional across most
contacts, subjectivity about the contact location will not impact the grade estimation.
Core logging by MHill geologists appears to have been completed to industry standards. Although
there is some inconsistency in identification of alteration types, this is not unusual in porphyry
deposits as the nature of alteration is typically gradational and distinctions between different
alteration styles can be subtle.
12.3 Data verification
The original assay certificates were compared with the database records to confirm data loading. A
total of 679 assay records for drillholes LV12-039 and LV12-045 were verified out of a total of
3,938 records, or 17% of all assays collected in 2012. No errors were found.

La Verde Copper Project
Equinox Gold Corp. and Solaris Copper Inc. 718017
amcconsultants.com 73
12.4 Check assays
Tetra Tech collected four pulp samples from drillholes LV11-039 and LV11-045. Tetra Tech
maintained custody of the samples from the Project site until shipped to the check laboratory, ALS
Minerals in North Vancouver, BC.
The check assay results compared reasonably well with the original assays. The four Tetra Tech
check assays returned results somewhat lower than those of MHill; however, given the small number
of samples collected this is not considered statistically meaningful. The Tetra Tech check samples
confirmed anomalous grade results within the expected grade range for the rock types and areas
sampled.
12.5 Discussion
Tetra Tech believes that the dataset is sufficiently robust to support resource estimation.

La Verde Copper Project
Equinox Gold Corp. and Solaris Copper Inc. 718017
amcconsultants.com 74
13 Mineral processing and metallurgical testing
13.1 Introduction
The word “ore” is used in this section in a generic sense and does not imply that Mineral Reserves
have been estimated.
Historical testwork programs and their results have already been reported in the Tetra Tech
September 2012 Report. They are summarized below.
The 1972 metallurgical studies by Lytton (raw data lost) showed 55% recovery from oxides, >90%
recovery from sulphides, both to superior grade (>35% Cu) concentrates, especially early in the
mine life. Additional work in 1976 by Hazen focused on grind size and reagent optimization and also
attempted to address the issues around arsenic levels in the concentrates. The results as of 1976
are shown in Table 13.1.
Table 13.1 1976 Hazen metallurgical study results
Mineralization type Feed Cu % Recovery % Cu Conc grade Cu %
Mixed ox / sulphide 0.76 54.8 37.4
East Hill zones 1, 3 0.7 93.7 36.6
East Hill zones 2 0.68 90.9 26.6
West Hill 0.68 91.9 25.5
Stockpile 0.27 87.6 27.6
Average 0.65 90.5 32.1
The average expectation was of >90% copper recovery to a copper concentrate of 32% Cu, with
the higher grades coming from the mixed oxide-sulphide material and from the secondary sulphides
in East Hill Zones 1 and 3.
The most recent metallurgical testwork was initiated by Catalyst as part of this current PEA. A
preliminary phase was carried out at G&T Metallurgical Services Ltd (G&T) in Kamloops in late 2011.
The key objectives were to prepare four global composites based on oxide and sulphide material for
each of West Hill and East Hill and, on these, carry out a standard set of comminution tests followed
by flotation tests to maximize copper recoveries into high grade copper concentrates. In addition,
a detailed assessment of concentrate quality was carried out.
Subsequently, and pursuant to the high levels of arsenic found to report to the flotation concentrates
in 2011, a further round of testwork was conducted in April 2012 to confirm previous results and
generate larger amounts of rougher and final concentrates for testing at other laboratories of
downstream treatment options.
These two programs (named KM2900 and KM3306, respectively) are reported separately in Section
13.3.
13.2 Metallurgical samples
The metallurgical samples were taken from a selection of holes from West Hill and East Hill whose
collars covered the grid areas 2112300-2113200 N by 810700-811100 E and 212800-2113300 N
by 812200-812500 E, respectively.
AMC considers that the samples provide adequate spatial representation but at a lower density in
West Hill.

La Verde Copper Project
Equinox Gold Corp. and Solaris Copper Inc. 718017
amcconsultants.com 75
For each of West Hill and East Hill, the samples were composited by oxide or sulphide characteristics,
thus providing four composites. The West Hill oxide composite covered depths to 40 m and the
sulphide 50 – 140 m, although heavily weighted to deeper intersections. The East Hill oxide
composite covered depths to 30 m and the sulphide 30 – 130 m, more evenly spread.
AMC considers that, to date, the oxide-sulphide transition zone in West Hill has been inadequately
represented and this may constitute a geometallurgical risk. AMC understands that this will be
addressed in the next phase of study with acid soluble copper assays being included in the in-fill
drilling assays.
AMC also considers that inadequate account has been taken of the alteration chemistry although
this is to a certain extent a function of the incorporation of historical drilling data where core logs
were not as comprehensive as the more recent drilling. As is discussed in Section 13.3, the
mineralogical characteristics of the two oxide samples are very different, with East Hill oxide
exhibiting a “classic” supergene” weathering profile, whereas West Hill oxide appears to be a result
of a different (hypogene?) mechanism.
The East Hill sulphide composite does not take account of the zoning described in Section 7.6.2, as
indeed had been done by Hazen; therefore, AMC believes that the composite selection does not
address any potential mineralogical and resulting geometallurgical differences arising from the
alteration geochemistry.
AMC’s experience on the smaller porphyritic systems and associated vein-fracture hosted deposits
in Mexico (as opposed to the giant Chilean porphyries where sheer scale imposes some
homogeneity) is that there is often significant geometallurgical variability, especially associated with
alteration geochemistry.
In summary, AMC believes that the metallurgical samples are spatially representative but that there
should have been more consideration of the alteration geochemistry and resulting geometallurgical
implications. Although the samples are adequate for this preliminary assessment, AMC considers it
essential that high priority be given early in subsequent studies to investigations of the
geometallurgical variability. AMC understands that this is well understood by Lowell Copper and that
the in-fill drilling program of the next phase of study will include variability testing to address some
of these issues around alteration geochemistry.
13.3 Metallurgical testwork
13.3.1 KM2900 – August-November 2011
13.3.1.1 Chemical and mineralogical characteristics
89 individual intersections of half drill core were received, coarse-crushed, and 200 g assayed for
Cu, CuOX and CuCN. The last two represent acid soluble oxide copper and cyanide-soluble secondary
copper, respectively.
For both East and West Hill material, high levels of oxide copper were most evident at depths
shallower than 30 m. Below that, oxide copper levels were generally around 5% of the total copper,
except for occasional higher values (10 – 20%) in East Hill at around 80 m depth.
Cyanide soluble copper levels showed that a general rising trend with depth to levels containing >
50% of total copper in East Hill and in West Hill were generally much lower (10%) apart from slightly
elevated (20%) levels at around 20 m depth.
The composites were WH-1 and WH-2, being oxide and sulphide material respectively from West
Hill and EH-3 and EH-4, being similarly oxide and sulphide material from East Hill.

La Verde Copper Project
Equinox Gold Corp. and Solaris Copper Inc. 718017
amcconsultants.com 76
The chemical content of the four composites is shown in Table 13.2.
Table 13.2 Chemical analysis of composites
Composite Cu % CU
(ox) %
Cu (CN)
%
Mo %
Mo (ox) %
Fe % S % Ag g/t
Au g/t As % Co g/t
C %
WH-1 0.36 0.17 0.03 0.004 0.004 6.35 0.06 1 <0.01 0.058 25 0.02
WH-2 0.63 0.01 0.01 0.003 0.002 4.65 1.57 2 0.04 0.17 188 0.55
EH-3 0.45 0.33 0.05 0.021 0.021 3.43 0.07 1 0.13 0.009 19 0.39
EH-4 0.72 0.03 0.34 0.002 0.001 2.47 0.58 6.5 0.09 0.058 100 0.66
AMC notes that both oxide composites confirmed the high levels of acid soluble copper expected
from the individual intersections. This is generally difficult to recover via flotation.
The East Hill sulphide material had just under half the copper in cyanide soluble form suggesting
the presence of secondary copper minerals such as chalcocite and covellite. These secondary copper
sulphides, although often slower floating than chalcopyrite, should result in higher grade copper
concentrates, as indicated by the earlier work at Hazen.
Molybdenum was predominantly in the oxide form and, therefore, not expected to be readily
recoverable by flotation
The copper deportment of the four composites in mineralogical terms is summarized in Table 13.3.
Table 13.3 Copper deportment
Composite % of copper occurring in copper-bearing minerals
Cp Bn Ch/Cv Mal Chrys in Feox in Chlor in Mnox Tenn
WH-1 3.5 0.3 2.5 4.4 21.4 66.2 1.7
WH-2 93.5 2.5 3.1 1.0
EH-3 4.6 1.6 4.2 51.0 6.1 8.4 24.2
EH-4 44.1 32.5 20.4 3.0
From Table 13.3, it is evident that the two oxide samples WH-1 and EH-3 are very different, as
mentioned in Section 13.2.
While the East Hill oxide material has the acid soluble copper content largely as malachite (difficult
to float but possible with sulphidation by sodium hydrosulphide NaHS), the non-sulphide copper in
West Hill is predominantly contained in chlorite and in iron and manganese oxides. Flotation
recovery of these constituents would be expected to be close to zero and, in any case, even if
recoverable to some extent, would result in concentrates of too low a grade to be sold. This West
Hill oxide is, effectively, waste.
AMC believes that whereas the East Hill weathering profile is a typical supergene phenomenon with
typical malachite, the weathering mechanism at West Hill appears to be different with much higher
proportions of copper-bearing chlorite, possibly related to the alteration geochemistry and hypogene
effects.
Gangue mineralogy was also reported in the G&T report and shows the predominantly quartz-
feldspar mineralogy of East Hill as opposed to the quartz-epidote veining of the West Hill. West Hill
generally shows more mineralogical evidence of the propylitic / phyllic alteration.
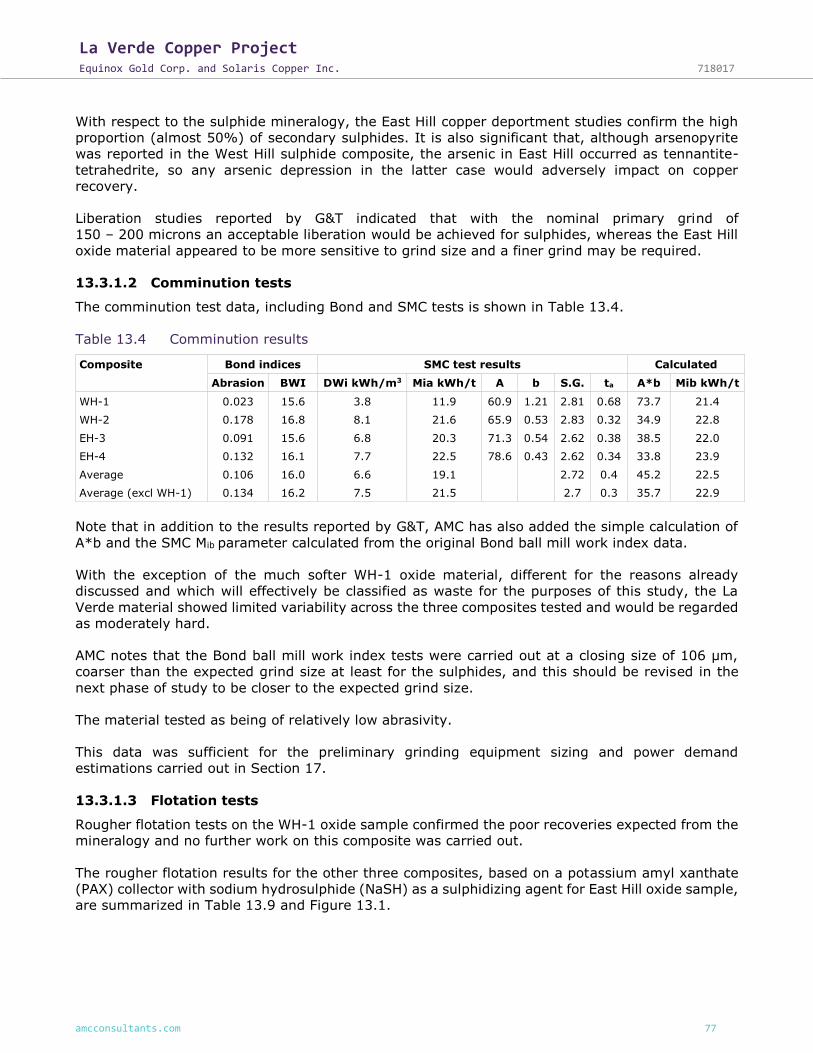
La Verde Copper Project
Equinox Gold Corp. and Solaris Copper Inc. 718017
amcconsultants.com 77
With respect to the sulphide mineralogy, the East Hill copper deportment studies confirm the high
proportion (almost 50%) of secondary sulphides. It is also significant that, although arsenopyrite
was reported in the West Hill sulphide composite, the arsenic in East Hill occurred as tennantite-
tetrahedrite, so any arsenic depression in the latter case would adversely impact on copper
recovery.
Liberation studies reported by G&T indicated that with the nominal primary grind of
150 – 200 microns an acceptable liberation would be achieved for sulphides, whereas the East Hill
oxide material appeared to be more sensitive to grind size and a finer grind may be required.
13.3.1.2 Comminution tests
The comminution test data, including Bond and SMC tests is shown in Table 13.4.
Table 13.4 Comminution results
Composite Bond indices SMC test results Calculated
Abrasion BWI DWi kWh/m3 Mia kWh/t A b S.G. ta A*b Mib kWh/t
WH-1 0.023 15.6 3.8 11.9 60.9 1.21 2.81 0.68 73.7 21.4
WH-2 0.178 16.8 8.1 21.6 65.9 0.53 2.83 0.32 34.9 22.8
EH-3 0.091 15.6 6.8 20.3 71.3 0.54 2.62 0.38 38.5 22.0
EH-4 0.132 16.1 7.7 22.5 78.6 0.43 2.62 0.34 33.8 23.9
Average 0.106 16.0 6.6 19.1
2.72 0.4 45.2 22.5
Average (excl WH-1) 0.134 16.2 7.5 21.5 2.7 0.3 35.7 22.9
Note that in addition to the results reported by G&T, AMC has also added the simple calculation of
A*b and the SMC Mib parameter calculated from the original Bond ball mill work index data.
With the exception of the much softer WH-1 oxide material, different for the reasons already
discussed and which will effectively be classified as waste for the purposes of this study, the La
Verde material showed limited variability across the three composites tested and would be regarded
as moderately hard.
AMC notes that the Bond ball mill work index tests were carried out at a closing size of 106 µm,
coarser than the expected grind size at least for the sulphides, and this should be revised in the
next phase of study to be closer to the expected grind size.
The material tested as being of relatively low abrasivity.
This data was sufficient for the preliminary grinding equipment sizing and power demand
estimations carried out in Section 17.
13.3.1.3 Flotation tests
Rougher flotation tests on the WH-1 oxide sample confirmed the poor recoveries expected from the
mineralogy and no further work on this composite was carried out.
The rougher flotation results for the other three composites, based on a potassium amyl xanthate
(PAX) collector with sodium hydrosulphide (NaSH) as a sulphidizing agent for East Hill oxide sample,
are summarized in Table 13.9 and Figure 13.1.

La Verde Copper Project
Equinox Gold Corp. and Solaris Copper Inc. 718017
amcconsultants.com 78
Table 13.5 Rougher flotation results – copper recovery vs mass pull wt%
wt% Cu rec % wt% Cu rec % wt% Cu rec %
Grind size 147 (WH) 217 (WH) 305 (WH)
WH-2 5.1 94.9 4.7 93.6 4.4 91.6
6.0 96.2 5.9 95.8 5.7 94.4
7.0 96.9 6.9 96.7 7.1 95.6
Grind size 145 (EH) 223 EH) 300 (EH)
EH-4 4.5 95.3 4.1 94.8 4.2 92.7
5.5 96.4 4.8 95.9 5.3 94.5
7.1 97.3 5.5 96.6 6.4 95.6
Two things are evident from Figure 13.1:
1 West Hill and East Hill sit on two slightly different grade recovery curves, with East Hill being
slightly superior perhaps due to the secondary copper sulphides enhancing concentrate
grades.
2 For both East and West, the 145 – 147 µm and 217 – 223 µm curves are very similar but the
300 – 305 µm curves are inferior. So, although the G&T report states that a primary grind of
300 µm would be adequate, AMC considers that a slightly finer grind, say 220 µm, would
provide an extra two points recovery. At this stage AMC would recommend this finer grind
subject to more a detailed trade-off and optimization study to balance additional recovery
against additional grinding costs at the next phase of study.
Molybdenum recovery attempts were unsuccessful, due to it being in the oxide form.
Figure 13.1 Sulphide Cu rougher performance vs grind size
Source: AMC

La Verde Copper Project
Equinox Gold Corp. and Solaris Copper Inc. 718017
amcconsultants.com 79
In the cleaner tests, EH-3 oxide sample appeared insensitive to cleaner / regrind conditions and
overall recoveries (batch basis) of 40% to a concentrate assaying at least 30% Cu appeared
achievable.
In the case of the sulphide composites, West Hill appeared to benefit from floating at a higher
ph (9.5) in terms of improving concentrate grade with no impact on recovery, whereas with East
Hill a higher pH did improve concentrate grade but at the expense of copper recovery.
Regrinding improved concentrate grade for both West and East and for East appeared to be the key
to realizing the concentrate grade of the secondary copper sulphides.
The other key result from the cleaner work was that arsenic will be an issue with concentrate quality.
Although some success was achieved with rejecting arsenopyrite from the West Hill sulphides,
especially with elevated pH (11) where less than 10% arsenic recovery was achieved whilst still
maintaining copper recoveries in the 80 – 90% range.
However, with East Hill the arsenic being as tennantite-tetrahedrite meant that similar
differentiation was not possible.
Flotation kinetics was not specifically addressed but typical flotation times were 6–10 minutes for
roughers and up to five minutes for cleaners. The higher end of the range of times was used in the
design criteria presented in Section 17.
The above discussions have all been related to batch tests, essential for establishing, and then
optimizing flotation conditions. However, definitive results for plant recovery predictions can best
be derived from locked cycle tests in which intermediate streams are recycled, and these results
are tabulated in Table 13.6 and Table 13.7.
Table 13.6 Locked cycle test results – sulphides
Product
Assay Distribution %
wt% Cu % S % As % Ag g/t Au g/t Cu S As Ag Au
WH-2
Feed 100 0.62 1.6 0.17 3 0.02 100 100 100 100 100
Rghr Conc 7.6 7.75 16.7 1.49 27 0.21 94.2 79.3 66.8 68.7 62.8
Final Conc 2.2 26 38.1 0.94 81 0.12 91.8 52.4 12.2 60.5 10.6
Clnr 1 tail 5.4 0.28 7.96 1.71 4 0.24 2.5 26.8 54.6 8.2 52.2
Rghr Tail 92.4 0.04 0.36 0.06 1 0.01 5.8 20.7 33.2 31.3 37.2
EH-4
Feed 100 0.74 0.59 0.05 8 0.06 100 100 100 100 100
Rghr Conc 5.8 12.1 8.6 0.68 116 0.84 93.8 83.9 74.2 87.6 83.7
Final Conc 2.5 27.4 19.3 1.50 260 1.87 92.2 81.6 70.9 85.5 80.9
Clnr 1 tail 3.3 0.36 0.42 0.05 5 0.05 1.6 2.3 3.4 2.1 2.8
Rghr Tail 94.2 0.05 0.1 0.01 1 0.01 6.2 16.1 25.8 12.4 16.3
Note that for these sulphide locked cycle tests, a primary grind of 300 µm was employed, coarser
than ideal in AMC’s opinion, and for WH-2 there were three stages of cleaning at pH 9.5. For EH-4
there were also three stages of cleaning, but at natural pH and with no regrind. AMC believes that
the higher grade potential of the secondary copper sulphides was not realized under these conditions
and there remains upside in the concentrate copper grade.

La Verde Copper Project
Equinox Gold Corp. and Solaris Copper Inc. 718017
amcconsultants.com 80
As expected from the cleaner tests, arsenic levels in final concentrate are high. In East Hill, despite
the lower feed As%, unacceptably high (>1% As) from a concentrate marketing perspective, due
to the co-recovery of tennanite an copper arsenic sulphosalt.
The very low levels of gold recovery to final concentrate for WH-2, despite reasonable recovery to
rougher concentrate, appear anomalous, but AMC has referred back to the original results and can
find no obvious error. This should be investigated further.
Table 13.7 Locked cycle test results – oxides
Product
Assay Distribution %
wt% Cu % S % As % Ag g/t Au g/t Cu S As Ag Au
EH-3
Feed 100 0.47 0.08 0.02 2 0.06 100 100 100 100 100
Rghr Conc 1.9 14.2 1.59 0.23 63 3.43 57.6 39 19.1 58.6 101.4
Final Conc 0.8 28.8 3.07 0.42 124 5.91 51.5 33.2 14.9 51.3 77
Rghr Tail 99.2 0.23 0.05 0.02 1 0.02 48.5 66.8 85.1 48.7 23
For the oxide locked cycle test a finer primary grind of 138 µm was employed and a negative
electrochemical potential (relative to Ag / AgCl-Pt electrode) was maintained using NaHS to promote
the flotation of malachite and azurite. The recovery relative to the batch tests was significantly
increased due to the recycling of first cleaner tail. Only one stage of cleaning was necessary.
13.3.2 KM3306 – April 2012
13.3.2.1 Chemical and mineralogical characteristics
This second phase was conducted principally to generate additional concentrates for downstream
treatment option studies, targeted at reducing arsenic levels in the concentrates. Material remaining
from the KM 2900 initial phase was used and additional composites were prepared from similar
intersections.
Table 13.8 shows the chemical analysis of the new composites (WH-5 and EH-6), both sulphides,
compared to the equivalent composites from KM 2900. The general match is good except that
arsenic levels are about half the earlier values. Mineral deportment was also similar, although again
there were some differences with respect to arsenic with arsenopyrite dominant and both new
composites and less tennantite-tetrahedrite in EH-6 than in EH-4. EH-6, however, also contained
cobaltite which is assumed will float similarly to the copper arsenic sulphosalts.
Liberation characteristics were reported as being similar.
Table 13.8 KM 3306 chemical analysis of composites
Composite Cu % CU (ox) % Cu (CN) % Fe % S % As % C %
KM2900 WH-2 0.63 0.009 0.01 4.65 1.57 0.17 0.55
KM3306 WH-5 0.68 0.007 0.013 5.21 1.79 0.078 0.38
KM2900 EH-4 0.72 0.029 0.34 2.47 0.58 0.058 0.66
KM3306 EH-6 0.77 0.03 0.37 2.36 0.49 0.029 0.6
13.3.2.2 Concentrate generation
Following rougher tests at a primary grind of around 300 µm which produced similar results as
previously although with slightly lower recovery, probably due to the coarser grind, locked cycle
tests were again carried out.

La Verde Copper Project
Equinox Gold Corp. and Solaris Copper Inc. 718017
amcconsultants.com 81
Table 13.9 shows the results of these locked cycle tests.
WH-2 concentrate grade was significantly lower, thought to be due to reagent overdosing, but
recovery was lower too. Interestingly the concentrate grade for EH-6 was significantly higher despite
neither regrinding nor a higher pH being employed.
Arsenic levels were still in excess of 1% in final concentrate despite the lower head grade and
arsenic recovery was significantly higher for WH-5, presumably related to the reagent overdosing
already referred to.
Table 13.9 Locked cycle test results – sulphides
Product
Assay Distribution %
wt% Cu % Fe % S % As % Cu Fe S As
WH-5
Feed 100 0.66 4.92 1.68 0.08 100 100 100 100
Rghr Conc 9.4 6.2 15.7 12.8 0.50 87.6 30 71.5 62.3
Final Conc 3.0 19.0 33.4 37.9 1.15 86.8 20.5 68.1 41.9
Clnr 1 tail 6.0 0.08 7.3 0.9 0.28 0.7 8.9 3.2 20.1
Rghr Tail 90.6 0.09 3.8 0.53 0.03 12.4 70 28.5 37.7
EH-6
Feed 100 0.69 2.49 0.51 0.03 100 100 100 100
Rghr Conc 7.0 9.0 7.0 6.2 0.30 91.4 19.8 84.5 77.5
Final Conc 1.8 34.4 16.7 23.3 1.16 88.3 11.9 81.1 71.3
Clnr 1 tail 3.6 0.39 3.61 0.31 0.04 2.0 5.2 2.2 4.4
Rghr Tail 93 0.06 2.15 0.09 0.01 8.6 80.2 15.5 22.5
13.4 Metallurgical grade-recovery predictions
Based predominantly on the KM2900 testwork, Table 13.10 summarizes the grade-recovery
predictions on which the pit optimization and flowsheet development are based.
AMC notes the following with respect to the figures highlighted in red:
• Gold recovery in West Hill sulphides at 10% appears anomalously low, as mentioned
previously, and merits further investigation.
• Arsenic recovery in West Hill sulphides has been predicted at 20%, higher than the 12%
reported in the testwork, and conservatively reflecting the possibility of a much higher figure
(42%) as found in the KM3306 work.
• In the absence of data, arsenic recovery for East Hill oxides is assumed to be the same as
for the sulphides, but the proportion of oxides is low, so this is hardly material.
• East Hill sulphides concentrate grade is reported as 27.5% per KM2900, although the
KM3306 work indicates that higher grades can be achieved. However, KM3306 Cu recovery
was lower so this potential for a higher grade, although quite likely based on the mineralogy,
is not certain and should be subject to confirmation in the next phase of study.

La Verde Copper Project
Equinox Gold Corp. and Solaris Copper Inc. 718017
amcconsultants.com 82
Table 13.10 Metallurgical recovery and concentrate grade parameters
Metallurgical parameters
Cu Au Ag As
Recovery Conc. grade
W Su E Su E ox W Su E Su E ox W Su E Su E ox W Su E Su E ox
90% 90% 50% 10% 80% 75% 60% 85% 50% 20% 70% 70%
26% 27.5% 29%
13.5 Concentrate quality
The testwork has shown that the La Verde sulphide mineralization, which constitutes the major part
of the deposit, is metallurgically amenable to a conventional flowsheet utilizing a relatively coarse
grind and a straightforward flotation circuit.
However, the presence of arsenic (and antimony) as deleterious elements does present an adverse
impact on the economic extraction of the mineral. Table 13.11 lists the important elemental analyses
for the three composites of economic value.
Table 13.11 Copper concentrates analysis
Element Symbol Units WH-2 EH-4 EH-3
Aluminium Al % 0.24 2.59 2.35
Antimony Sb % 0.01 0.56 0.05
Arsenic As % 0.94 1.5 0.16
Bismuth Bi g/t <20 62 <20
Cadmium Cd g/t 44 20 2
Calcium Ca % 0.21 1.37 1.15
Carbon C % 0.05 0.31 2.62
Cobalt Co g/t 1162 994 188
Copper Cu % 26 27.4 28.8
Fluorine F g/t 31 133 163
Gold Au g/t 0.12 1.87 5.88
Iron Fe % 32 14.5 10.6
Lead Pb % 0.04 0.02 0.04
Magnesium Mg % 0.054 0.29 0.5
Manganese Mn % 0.005 0.039 0.15
Mercury Hg g/t <1 1 <1
Molybdenum Mo % 0.017 0.029 0.42
Nickel Ni g/t 246 92 160
Palladium Pd g/t 0.015 0.005 0.008
Phosphorus P g/t 19 234 656
Platinum Pt g/t <0.001 <0.001 0.22
Selenium Se g/t 47 38 19
Silicon Si % 0.45 8.03 7.53
Sulphur S % 38.1 19.3 3.07
Silver Ag g/t 76 258 124
Zinc Zn % 0.54 0.11 0.03
Copper concentrates are regarded as “clean” with arsenic levels less than 0.1% As. Penalties
generally commence at 0.3% As and arsenic levels greater than 1% As pose significant marketing

La Verde Copper Project
Equinox Gold Corp. and Solaris Copper Inc. 718017
amcconsultants.com 83
issues, especially as China, an important destination for copper concentrates in the global market,
imposes a 0.5% As limit on imported material. This is discussed further in Section 19.
Preliminary results have been received from the hydrometallurgical and roasting testwork carried
out on the concentrates generated in the KM 3306 program of April 2012. AMC has summarized the
key outcomes:
• Galvanox™ leach technology did not appear suitable. This process relies on the
chalcopyrite-pyrite galvanic couple to dissolve chalcopyrite under atmospheric leach
conditions, but the La Verde concentrates are low in pyrite; therefore, a pyrite addition was
required. Even with that, 80% extraction was the maximum achieved and extractions > 90%
were only possible with the addition of petroleum coke. AMC considers that the core feature
of the galvanic couple that makes this process attractive is not applicable to La Verde and
therefore does not believe this process merits further testwork.
• Teck’s CESL process was also tested. This process consists of pressure oxidation and an
“enhanced atmospheric leach” stage in the presence of chloride ions, followed by pressure
cyanidation for precious metals recovery. Testwork objectives were achieved, namely:
⎯ >97. 5% copper extraction.
⎯ >85% gold and silver extraction.
⎯ Arsenic was precipitated and As in solution was < 20 ppm.
However, AMC notes the following:
• The process is relatively complex and chloride solutions will incur materials of construction
issues.
• Despite several years of operation of the CESL demonstration plant, no commercial scale plant
is in operation.
Nevertheless, AMC believes that the excellent results achieved with respect to metal extractions
and arsenic precipitation merit further investigations:
• Partial roasting for As and Sb removal was tested at Outotec’s laboratory in Sweden. Outotec
concluded that both the East Hill and West Hill concentrates were suitable for fluidized bed
roasting with calcine arsenic levels expected to be <0.3% As, and possibly as low as
0.1 – 0.2% As in full scale operation. However, the East Hill material contained coarse lime or
dolomite which formed calcium arsenates and limited arsenic removal to 0.35% As in calcine.
The coarseness of these carbonates indicated possible contamination and Outotec
recommended that further investigations be carried out to verify if they were intrinsic to the
concentrates or indeed extraneous contamination.
• AMC believes that these results indicate that roasting can achieve saleable concentrates for
La Verde, notwithstanding the carbonate issue. Also, in view of the well-established
commercialization of roasting and current advanced investigations into roasting at other
operations, including Aranzazu in Mexico and Codelco’s Mina Ministro Hales operation in Chile,
AMC believes that roasting is the most viable concentrate treatment option for consideration
in this PEA.

La Verde Copper Project
Equinox Gold Corp. and Solaris Copper Inc. 718017
amcconsultants.com 84
14 Mineral Resource estimates
Sections 14.1 to 14.6 and 14.10 have been extracted from the Tetra Tech September 2012 Report.
Sections 14.7, 14.11, and 14.12 have been modified slightly from the Tetra Tech September 2012
Report.
Tetra Tech completed the Mineral Resource estimation using MineSight™ MS3D v.7.0-6 software.
The Tetra Tech team comprises Margaret Harder, M.Sc., P.Geo., who completed the Resource
estimate and Michael O’Brien, M.Sc., Pr.Sci.Nat., FGSSA, FAusIMM, FSAIMM, who reviewed the
Resource estimate. The effective date of this Resource estimate is 19 September 2012.
14.1 Drillhole database
The drillhole sample database was compiled by MHill and reviewed by Tetra Tech, as described in
Section 12.0. Based on this review, Tetra Tech determined that the database is acceptable for use
in Resource estimation.
The database contains collar locations, drillhole orientations with downhole deviation surveys, assay
intervals with results, and intervals with geology and alteration logging data.
The Resource database contained information from 641 complete drillholes totalling 114,823.93 m
of drilling. The average drillhole length is 179.12 m and the maximum length is 924.05 m. A total
of 49,597 copper assays averaging 0.33% copper were contained in the assay table and
34,993 copper composites (3 m in length) averaging 0.28% copper in the composite table.
14.2 Project parameters
The deposit was modelled for copper, gold, silver, molybdenum, and arsenic content. The block
model was developed based on the selected block size for a parallel preliminary economic
assessment for an open pit operation, using a block size 20 m wide by 20 m long and a bench height
of 15 m. The block model origin, in UTM coordinates, was 809,000 m east, 2,110,000 m north and
-250 m elevation. The block model limits are tabulated in Table 14.1.
Table 14.1 La Verde block model limits
Minimum Maximum Size (m) Number
809,000 814,000 20 250
2,110,000 2,114,000 20 200
-250 800 15 70
14.3 Geological model
Three-dimensional geology solids were initially developed by MHill on north-south sections at 50 m
spacing for the quartz-feldspar porphyry, quartz diorite, breccia, and overburden lithologies. These
solids were used by Tetra Tech as a guide for further geological modelling using Leapfrog v.2.5.1.13
software. Eight geology domains were created, as well as an overburden surface which modelled
the overburden depths as logged in drillholes (where overburden was absent, the overburden
surface was merged with topography).
The modelling in Leapfrog was conducted by selecting the lithology of drillhole composites using a
window filter of 3 m and with a minimum percentage of 50% for any lithology type to be
incorporated into the wireframe mesh. The wireframe meshes were constructed using a 30 m
triangulation resolution and an off-surface point clipping of 100 m. Contact points identified from
drillhole logs were honoured in the boundary meshes. The lithology meshes, overburden, and
topography were assigned unique codes which were used to code both the block model and the

La Verde Copper Project
Equinox Gold Corp. and Solaris Copper Inc. 718017
amcconsultants.com 85
drillhole composites. During interpolation, the software would select data based on matching block
and composite lithology codes. Tetra Tech regards these parameters as appropriate for geological
modelling of a porphyry-type deposit.
Similar modelling of alteration domains was conducted, also using Leapfrog software. The alteration
wireframes did show reasonable correlation with mineralization in some areas; however, the
identification of alteration types was too inconsistent to apply for modelling on a deposit-wide scale.
As such, the alteration wireframes could not be used for selection of data during resource
estimation.
The geological domains and their associated block model codes are listed in Table 14.2.
Table 14.2 Geological domains
Code Description
1 East Hill Breccias
2 East Hill Quartz Diorite Porphyry
3 East Hill Quartz-Feldspar Porphyry
4 West Hill Breccias
5 West Hill Quartz Diorite Porphyry
6 West Hill Quartz-Feldspar Porphyry
7 East Hill Quartz Diorite
8 West Hill Quartz Diorite
Figure 14.1 and Figure 14.2 show geology wireframes for breccias (red), quartz diorite porphyry
(blue), and quartz-feldspar porphyry (pink) for the West and East Hill, respectively. In both the
West and East Hill zones, these rock types are surrounded by the quartz diorite wireframe for that
zone, which is not shown in Figure 14.1 or Figure 14.2 for illustration purposes. Figure 14.3 shows
the domain models for all rock types for both the West and East Hills, with the respective quartz
diorite wireframes transparent to show the other enclosed rock types.

La Verde Copper Project
Equinox Gold Corp. and Solaris Copper Inc. 718017
amcconsultants.com 86
Figure 14.1 West Hill geology domains
Note: View looking west-northwest. Grid displays northing and elevation values (units in metres). Red=Breccia, Blue=Quartz Diorite Porphyry and Pink = Quartz-Feldspar Porphyry. Source: Tetra Tech.
Figure 14.2 East Hill geology domains
Note: View looking northeast. Grid displays northing and elevation values (units in metres). Red= Breccia, Blue=Quartz Diorite Porphyry and Pink = Quartz-Feldspar Porphyry. Source: Tetra Tech.

La Verde Copper Project
Equinox Gold Corp. and Solaris Copper Inc. 718017
amcconsultants.com 87
Figure 14.3 West and East Hill geology domains
Note: View looking north. Total extent is approximately 870 m in elevation, 2,700 m in width. Red= Breccia, Blue=Quartz Diorite Porphyry and Pink = Quartz-Feldspar Porphyry, Dark beige (left side of image) = West Hill Quartz Diorite, Light beige (Right side of image) = East Hill Quartz Diorite. Source: Tetra Tech.
14.3.1 Contact plots
The validity of the geology domain wireframes was evaluated using contact plots, plotting the copper
grade in a set distance on either side of the contact of interest.
14.3.1.1 East Hill
Contact plots for the East Hill geology solids are shown in Figure 14.4 to Figure 14.6. These plots
highlight that much of the mineralization in the East Hill is hosted by breccias, with a gradual
increase in the grade of adjacent quartz diorite towards the brecciated zones (Figure 14.4). The
grade is fairly flat across the contact between quartz diorite and quartz diorite porphyry and the
grade is lower in the porphyry adjacent to both the breccia zone and the quartz diorite (Figure 14.5
and Figure 14.6). The quartz diorite porphyry rock type is a minor host of mineralization on the East
Hill and, therefore, is not shown in contact plots.

La Verde Copper Project
Equinox Gold Corp. and Solaris Copper Inc. 718017
amcconsultants.com 88
Figure 14.4 Contact plot for geology wireframes Zone 1 and Zone 7
Zone1 = East Hill Breccias, Zone 7 = East Hill Quartz Diorite. Source: Tetra Tech.
Figure 14.5 Contact plot for geology wireframes Zone 1 and Zone 3
Zone1 = East Hill Breccias, Zone 3 = East Hill Quartz-Feldspar Porphyry. Source: Tetra Tech.

La Verde Copper Project
Equinox Gold Corp. and Solaris Copper Inc. 718017
amcconsultants.com 89
Figure 14.6 Contact plot for geology wireframes Zone 2 and Zone 7
Zone 2 = East Hill Quartz-Diorite Porphyry, Zone 7 = East Hill Quartz Diorite. Source: Tetra Tech.
14.3.1.2 West Hill
Mineralization in the West Hill does not appear to have a strong preference for either of the dominant
West Hill rock types of quartz diorite and quartz diorite porphyry. Overall the contact plot shows a
fairly flat copper profile across the contact, with a slight decrease in grade in the quartz diorite
porphyry with increasing distance away from the quartz diorite (Figure 14.7). Unlike the East Hill,
breccia and quartz-feldspar porphyry rock types are volumetrically minor in the West Hill and
therefore contact plots for these wireframes are not shown.

La Verde Copper Project
Equinox Gold Corp. and Solaris Copper Inc. 718017
amcconsultants.com 90
Figure 14.7 Contact plot for geology wireframes Zone 5 and Zone 8
Zone 5 = West Hill Quartz Diorite Porphyry, Zone 8 = West Hill Quartz Diorite. Source: Tetra Tech.
14.4 Assay statistics
The assay data was evaluated based on the geological domains (as defined in Table 14.3) using
standard descriptive statistics and graphical techniques including boxplots, scatterplots, and
histograms. Table 14.3 summarizes the descriptive statistics for all copper assays in the database
used for resource estimation. Figure 14.8 shows a histogram of copper assay data for all drillholes,
and across all rock types. The histogram shows strong positive skewness, typical of this type of
deposit.
Table 14.3 La Verde Assay descriptive statistics for copper, all drillholes and rock types
Statistic Raw assay samples
Number of samples 49,597
Minimum (Cu%) 0.0
Maximum (Cu%) 33.19
Mean (Cu%) 0.328
Median (Cu%) 0.104
Standard deviation 0.902
Sample variance 0.813
Coefficient of variance 2.753
Kurtosis 306.799
Skewness 13.806
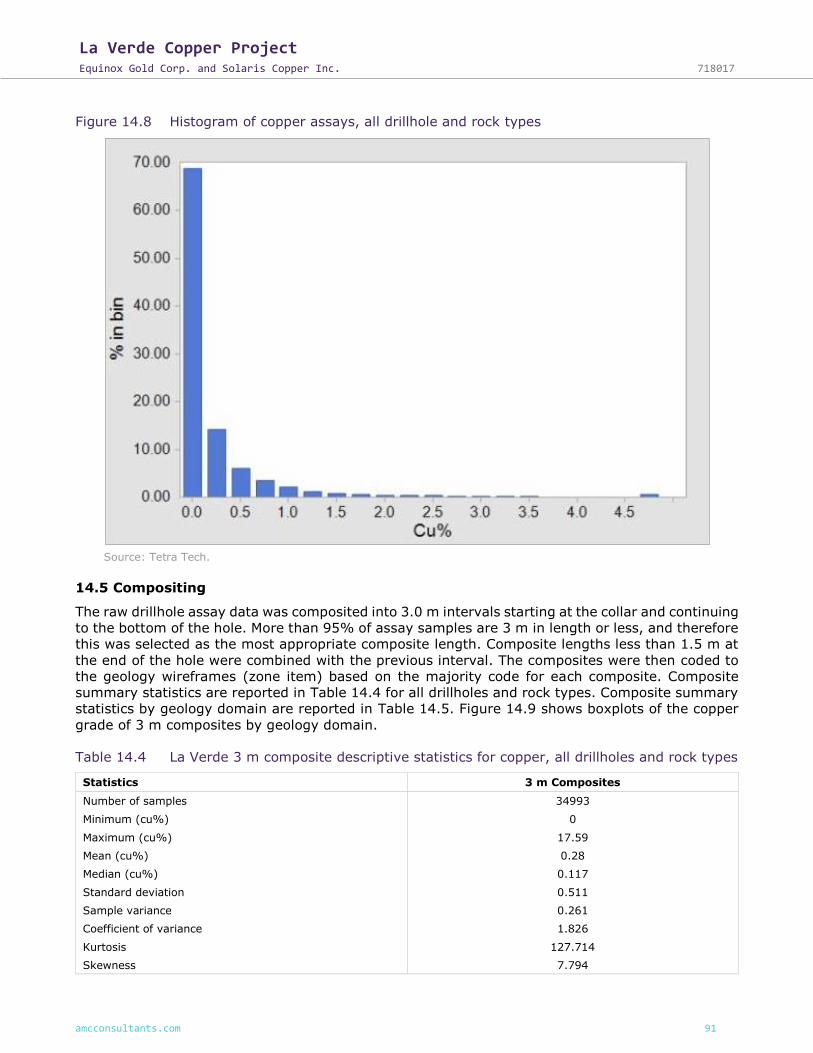
La Verde Copper Project
Equinox Gold Corp. and Solaris Copper Inc. 718017
amcconsultants.com 91
Figure 14.8 Histogram of copper assays, all drillhole and rock types
Source: Tetra Tech.
14.5 Compositing
The raw drillhole assay data was composited into 3.0 m intervals starting at the collar and continuing
to the bottom of the hole. More than 95% of assay samples are 3 m in length or less, and therefore
this was selected as the most appropriate composite length. Composite lengths less than 1.5 m at
the end of the hole were combined with the previous interval. The composites were then coded to
the geology wireframes (zone item) based on the majority code for each composite. Composite
summary statistics are reported in Table 14.4 for all drillholes and rock types. Composite summary
statistics by geology domain are reported in Table 14.5. Figure 14.9 shows boxplots of the copper
grade of 3 m composites by geology domain.
Table 14.4 La Verde 3 m composite descriptive statistics for copper, all drillholes and rock types
Statistics 3 m Composites
Number of samples 34993
Minimum (cu%) 0
Maximum (cu%) 17.59
Mean (cu%) 0.28
Median (cu%) 0.117
Standard deviation 0.511
Sample variance 0.261
Coefficient of variance 1.826
Kurtosis 127.714
Skewness 7.794

La Verde Copper Project
Equinox Gold Corp. and Solaris Copper Inc. 718017
amcconsultants.com 92
Table 14.5 La Verde 3 m composite descriptive statistics for copper by geology domain
Statistic EH
Breccia
EH Quartz Diorite
Porphyry
EH Quartz- Feldspar Porphyry
WH Breccia
WH Quartz Diorite
Porphyry
WH Quartz- Feldspar Porphyry
EH Quartz Diorite
WH Quartz-
Dior
Zone 1 2 3 4 5 6 7 8
Number of samples 10,343 436 2462 85 6,605 158 6,791 5,594
Minimum (Cu%) 0 0 0 0 0 0 0 0
Maximum (Cu%) 9.87 1.63 5.43 1.29 17.59 6.27 8.51 9.38
Mean (Cu%) 0.356 0.104 0.244 0.169 0.332 0.472 0.177 0.28
Median (Cu%) 0.215 0.056 0.104 0.061 0.099 0.23 0.078 0.09
Standard deviation 0.474 0.161 0.365 0.254 0.719 0.694 0.354 0.548
Sample variance 0.225 0.026 0.133 0.065 0.516 0.482 0.125 0.3
Coefficient of variation
1.334 1.55 1.499 1.502 2.163 1.471 2 1.956
Kurtosis 67.392 36.025 25.032 6.177 126.192 30.338 107.244 51.974
Skewness 5.768 5.087 3.671 2.438 8.452 4.48 7.941 5.647
Note: EH=East Hill, WH=West Hill.
Figure 14.9 Boxplot of 3 m composite by geology domain showing copper grade
Note: See Table 14.3 for zones. Source: Tetra Tech.
14.6 Capping
Tetra Tech applied the same capping criteria for the current Resource estimate that was used for
the Maunula (2012) estimate. Tetra Tech considers the capping strategy applied by Maunula (2012)
to be reasonable for porphyry-style deposits and retained the same strategy for consistency.

La Verde Copper Project
Equinox Gold Corp. and Solaris Copper Inc. 718017
amcconsultants.com 93
No cap was applied to copper values. Gold was capped at 3 g/t and silver was capped at 100 g/t.
These caps affected ten gold values and six silver values, in both cases much less than 1% of the
total number of gold or silver assays.
14.7 Specific Gravity
MHill determined specific gravity (SG) through immersion of drill core in water methodology. A total
of 4,921 determinations were completed in 2011. Figure 14.10 is a histogram showing the
distribution of measurements for SG.
The value of 2.7 g/cm3 was selected for the Maunula (2012) La Verde model and this value is also
used for the current Resource estimate. Tetra Tech recommends further analysis by rock types and
mineralization styles to confirm whether one global value for the entire deposit is appropriate. Table
14.6 summarizes the existing SG data by main rock types, highlighting that 2.7 g/cm3 is an
appropriate global estimate, however more detailed SG data by rock type should be used for future
estimates.
As the rocks are competent intrusive rocks, permeability and porosity are not considered material.
Tetra Tech considers the SG to be representative of the bulk density.
Figure 14.10 Specific gravity determinations
Note: g/cc= g/cm3
Source: Tetra Tech.

La Verde Copper Project
Equinox Gold Corp. and Solaris Copper Inc. 718017
amcconsultants.com 94
Table 14.6 Summary of La Verde SG values by rock type
Rock type SG (g/cm3)
Quartz feldspar Porphyry 2.67
Quartz diorite porphyry 2.79
Quartz diorite 2.75
Breccias 2.69
Veins 3.4
Faults 3.63
Overburden 3.96
Note: EH=East Hill, WH=West Hill.
14.8 Spatial analysis
The spatial continuity of mineralization in a particular deposit is commonly assessed using
variography. The variography of composited assay values for the deposit were assessed using
MineSight™ MSDA v.2.80-02 software. Both downhole and directional variograms were initially
constructed with 3 m lags, matching the composite lengths. Additional variograms were also
constructed at several multiples of 3 m, up to 30 m, to test the parameters identified using the
short range lags. Experimental variograms were constructed at 45° directional increments and 45°
vertical increments, for a total of 10 variograms. The MineSight™ MSDA software then applied a
best-fit algorithm for these 10 variograms producing the variogram model, which was exported from
the MineSight™ MSDA software and imported into the MineSight™ MS3D software for interpolation.
Variography was conducted separately for the East and West Hills, with the exception of arsenic, as
the style of mineralization and dominant host rocks are different for each part of the deposit.
Variography was also conducted separately for copper, gold, silver, and arsenic in order to best
reflect the spatial distribution of these main metals of interest. The model variogram parameters
for these metals are summarized in Table 14.7 for the East Hill and Table 14.8 for the West Hill.
Table 14.7 East Hill variogram model parameters
Metal Nugget Total Sill Range X Range Y Range Z Rotation X Rotation Y Rotation Z
Cu 0.3421 1.4769 29.9 23.7 79.4 5.4 16.5 -2.1
Au 0.4756 1.2742 85.6 78.9 125.5 20 1.8 -5.2
Ag 0.469 1.3057 102 81 211.5 30.3 18.9 -2.5
As 0.7741 1.3407 91.6 271.5 271.5 280.7 -0.4 31.5
Table 14.8 West Hill variogram model parameters
Metal Nugget Total Sill Range X Range Y Range Z Rotation 1 Rotation 2 Rotation 3
Cu 0.5406 1.0858 151.5 18.3 10.2 90.4 -6.3 68.8
Au 0.4777 0.8584 113.3 122.5 0.3 70.9 42 18.5
Ag 0.7148 1.2838 33.9 38.4 211.5 29 6 -3.8
As 0.7741 1.3407 91.6 271.5 271.5 280.7 -0.4 31.5
14.9 Grade interpolation
The East and West Hills were interpolated separately as each hill had different variogram models.
Modelling consisted of grade interpolation by ordinary kriging (OK). An additional interpolation using
inversed distance weighting (IDW) was also completed for validation purposes. The grade
interpolation used search ellipses as defined in Table 14.9. These parameters were based on the
geological interpretation and variogram analysis for each hill and for each metal. The search ellipses
were chosen based on the ranges indicated by the variogram models, such that the ellipses were

La Verde Copper Project
Equinox Gold Corp. and Solaris Copper Inc. 718017
amcconsultants.com 95
larger in all dimensions than the variogram model. In many cases, no rotation of the search ellipse
was considered necessary.
Table 14.9 Search ellipses
Deposit area Metal Search distance MS3D rotation
X Y Z Rotation 1 Rotation 2 Rotation 3
East Hill
Cu 125 125 125 0 0 0
Au 150 150 180 0 0 0
Ag 150 150 250 30.3 18.9 -2.5
As 275 275 275 0 0 0
West Hill
Cu 125 125 160 0 0 0
Au 175 180 100 70.3 42 18.5
Ag 100 100 250 29 6 -3.8
As 275 275 275 0 0 0
Figure 14.11 to Figure 14.13 shows the block model OK copper grade in a typical east-west section
(Figure 14.11), north-south section (Figure 14.12), and plan view (Figure 14.13). Figure 14.12 also
shows drillhole traces within the volume clipping of that section; the drillhole display shows 15 m
composites for illustration purposes. As most drilling was completed with roughly north or south
azimuths, they do not display well within the volume clipping of east-west or plan view sections and
therefore are not shown on Figure 14.11 or Figure 14.13.

La Verde Copper Project
Equinox Gold Corp. and Solaris Copper Inc. 718017
amcconsultants.com 96
Figure 14.11 Copper OK block model, East-West Section at 2113000 North (looking North)
Note: Geology domain colours as described in Section 14.3. Easting and elevation in metres. Only blocks classified as Inferred-Indicated-Measured are shown. Source: AMC.

La Verde Copper Project
Equinox Gold Corp. and Solaris Copper Inc. 718017
amcconsultants.com 97
Figure 14.12 Copper OK block model, North-South Section at 810850 East (looking West)
Note: Geology domain colours as described in Section 14.3. Northing and elevation in metres. Only blocks classified as Inferred-Indicated-Measured are shown. Drillhole traces show 15 m composites. Source: AMC

La Verde Copper Project
Equinox Gold Corp. and Solaris Copper Inc. 718017
amcconsultants.com 98
Figure 14.13 Copper OK block model, planview 480 m elevation (looking down)
Note: Geology domain colours as described in Section 14.3. Easting and northing in metres. Only blocks classified as Inferred-Indicated-Measured are shown.
Source: AMC

La Verde Copper Project
Equinox Gold Corp. and Solaris Copper Inc. 718017
amcconsultants.com 99
14.10 Block model validation
Tetra Tech distinguishes between verification from validation as follows:
• Verification is a manual (e.g. visual inspection) or quasi-manual (e.g. spreadsheet) check of
the actual procedure used.
• Validation is a test for reasonableness using a parallel procedure, which may be either manual
or (but is usually) a computer-based procedure.
14.10.1 Visual checks
Interpolated block grades, Resource classification, geological interpretation outlines and drillhole
composite intersections were verified on screen for plan and section. Based on visual inspection by
Tetra Tech, the block model grades appeared to honour the data well (for example Figure 14.11).
The estimated grades exhibit a satisfactory consistency with the drillhole composites.
14.10.2 Global comparison
Tetra Tech verified the block model estimates for global bias by comparing the average copper
grades from the model (OK) using IDW estimates. The results (Table 14.10) show that the IDW
results compare well with the OK results. A higher degree of smoothing is evident in the IDW model.
Table 14.10 Global Comparison, 0.1% Copper Cut-off
Block selection CUKR (%) CUID (%)
Inferred + Measured + Indicated 0.268 0.241
Measured + Indicated 0.303 0.280
Note: CUKR = OK results; CUID = IDW results.
Histogram and boxplots were created of the block model data and reviewed with respect to the
corresponding composite plots. No apparent bias was noted. Table 14.11 summarizes the global
statistics of composites versus blocks.
Table 14.11 Composite versus block model statistics for all blocks
Source Cu% (Mean) Standard deviation Coefficient of variation
Drillhole composites 0.280 0.511 1.83
Block Model 0.168 0.170 1.011
14.10.3 Adequacy of resource estimation methods
The deposit has been estimated using modern block modelling techniques in industry-standard
software. This included proper geologic input, appropriate block model cell sizes, review of grade
capping, assay compositing and reasonable interpolation parameters. The results have been verified
by peer review, by visual review, and by statistical comparisons between the estimated block grades
and the composites used to assign them. The OK has also been validated with an alternative
estimation method, IDW. No biases have been identified in the model.
14.11 Mineral Resource classification and resource statement
14.11.1 Resource classification
The Mineral Resources are classified under the categories of Measured, Indicated and Inferred
Mineral Resources, in accordance with CIM Definition Standards. The classification reflects
confidence of grade continuity as a function of: QA / QC procedures, quality of assay and density

La Verde Copper Project
Equinox Gold Corp. and Solaris Copper Inc. 718017
amcconsultants.com 100
data, and sample spacing relative to geological and geostatistical observations regarding continuity
of mineralization.
Tetra Tech is not aware of any environmental, permitting, legal, title, taxation, socioeconomic,
marketing or other relevant issues that may affect the estimate of Mineral Resources at this time.
The volume of material removed by historical mining is insignificant compared with the total volume
of mineralized material, and therefore this material was not subtracted from the tonnages below.
The Resource model blocks were classified into Measured, Indicated and Inferred Resource
categories based on the level of confidence in the grade estimate for each block. The classification
was based on a combination of kriging variance and distance from the nearest composite. The
classification boundaries used in the Maunula (2012) estimate (nearest composite less than 15 m
for Measured, less than 50 m for Indicated, less 160 m for Inferred) were used as a basis to evaluate
the kriging variance around these distances in both the East and West Hills. The kriging variance
was then used to generate meshes containing blocks of similar estimation confidence, using kriging
variance as an inverse proxy measure of confidence. Kriging variance increases with increasing
distance from the data used for the kriging estimation, at a rate dependent on the variography for
the variable. It is, therefore, a useful measure of uncertainty (or inverse measure of confidence) in
the estimation process. The meshes of these kriging confidence solids were constructed using a
100 m triangulation resolution. The Resource classification then assigned a confidence level to
blocks within each of the Measured, Indicated, and Inferred kriging variance solids.
Tetra Tech regards this process as appropriate to guide the definition of boundaries between the
Mineral Resource categories in this deposit.
14.11.2 Mineral Resource statement
The Mineral Resource, as of 19 September 2012 comprises Measured, Indicated and Inferred
Resources. The classified Mineral Resources are shown in Table 14.12. At a base-case cut-off grade
of 0.2% copper, the total Measured Resource is 57,527,000 t at 0.45% copper, the Indicated
Resource is 350,442,000 t at 0.40% copper, and the Measured + Indicated Resource is
407,969,000 t at 0.41% copper. The total Inferred Resource at a 0.2% copper cut-off is
337,838,000 t at 0.37% copper.

La Verde Copper Project
Equinox Gold Corp. and Solaris Copper Inc. 718017
amcconsultants.com 101
Table 14.12 Mineral Resource statement, La Verde Project
Resource class Cut-off (Cu%) Zone Tonnes (000s) Cu (%) Ag (g/t) Au (g/t) As (%)
Measured
0.1
East Hill 57,963 0.37 2.75 0.05 0.02
West Hill 20,995 0.37 1.95 0.01 0.05
Total 78,958 0.37 2.54 0.04 0.03
0.2
East Hill 41,262 0.46 3.30 0.06 0.02
West Hill 16,265 0.43 2.03 0.01 0.05
Total 57,527 0.45 2.94 0.05 0.03
0.3
East Hill 29,896 0.54 3.68 0.07 0.03
West Hill 11,194 0.52 2.15 0.01 0.06
Total 41,090 0.53 3.26 0.05 0.03
Indicated
0.1
East Hill 322,936 0.26 2.32 0.05 0.02
West Hill 262,669 0.33 1.39 <0.01 0.04
Total 585,605 0.30 1.91 0.03 0.03
0.2
East Hill 163,604 0.39 3.31 0.06 0.04
West Hill 186,838 0.41 1.47 0.01 0.03
Total 350,442 0.40 2.33 0.03 0.04
0.3
East Hill 98,784 0.49 4.04 0.07 0.05
West Hill 126,505 0.49 1.55 <0.01 0.03
Total 225,289 0.49 2.65 0.04 0.04
Measured + Indicated, 0.1% Cu 664,563 0.30 1.98 0.03 0.03
Measured + Indicated, 0.2% Cu 407,969 0.41 2.42 0.03 0.04
Measured + Indicated, 0.3% Cu 266,379 0.50 2.74 0.04 0.04
Inferred
0.1
East Hill 434,614 0.20 1.51 0.03 0.02
West Hill 330,426 0.29 1.17 <0.01 0.03
Total 765,040 0.24 1.36 0.02 0.02
0.2
East Hill 140,566 0.35 2.79 0.05 0.04
West Hill 197,272 0.38 1.33 <0.01 0.02
Total 337,838 0.37 1.94 0.02 0.03
0.3
East Hill 61,761 0.49 4.20 0.07 0.07
West Hill 126,222 0.46 1.45 <0.01 0.02
Total 187,983 0.47 2.36 0.03 0.04
Notes: CIM Definition standards (2010) were used for reporting the Mineral Resources Mineral Resource are reported at a cut-off grade of 0.2% Cu Drilling results up to 19 September 2012. Mineral Resources that are not Mineral Reserves do not have demonstrated economic viability. The numbers may not compute exactly due to rounding.
This Resource estimate is not constrained by a pit shell. The cut-off grade of 0.2% copper is based
on experience for similar open pit projects and a mining conceptual study which used a metal price
of $2.50/lb and copper metal recovery of 92% (Maunula, 2012).
14.12 Previous Mineral Resource estimate
Prior to the Tetra Tech September 2012 Report, a NI 43-101 compliant Resource was reported by
T. Maunula of Tetra Tech in January 2012. Table 14.13 summarizes the differences between the
January 2012 Resource Report and the September 2012 Resource Estimate.

La Verde Copper Project
Equinox Gold Corp. and Solaris Copper Inc. 718017
amcconsultants.com 102
The difference between the January 2012 estimate and the current estimates is in part due to
additional drilling completed in 2012. The 12 drillholes completed in 2012 targeted areas of the
deposit for both delineation of additional mineralization and infill drilling in select areas to allow for
upgrading of the Mineral Resource classification. As a result, the Resource tonnage is larger in the
current Resource estimate and includes a 15% increase in the Indicated + Measured categories and
an 85% increase in the Inferred category. As expected, the grades remain similar between the two
models, and, therefore, the percent difference in metal content is similar to the percent difference
in tonnage.
The increase in the Inferred category is also due to a change in the parameters used for
classification. Classification was based on a combination of the distance from the nearest composite
and kriging variance. It was also guided by the most recent 3D geology model that was not available
when the January 2012 Resource Report was written.
Table 14.13 Comparison with previous Mineral Resource estimate
Description Tetra Tech January 2012 Current estimate Difference in
tonnes (%) Difference in metal (%) Tonnes (000s) Cu (%) Tonnes (000s) Cu (%)
Measured 29,342 0.50 57,527 0.45 96 76
Indicated 324,735 0.40 350,442 0.40 8 8
Measured + Indicated 354,077 0.41 407,969 0.41 15 15
Inferred 181,739 0.40 337,838 0.37 86 72

La Verde Copper Project
Equinox Gold Corp. and Solaris Copper Inc. 718017
amcconsultants.com 103
15 Mineral Reserve estimates
Under NI 43-101 guidelines, due to the Preliminary Economic Assessment level of the present study,
no mineral reserves are reported.

La Verde Copper Project
Equinox Gold Corp. and Solaris Copper Inc. 718017
amcconsultants.com 104
16 Mining methods
The La Verde East Hill and West Hill mineralized regions are located close to surface and are suitable
for open pit mining. The local topography is suitable to accommodate large quantities of waste
generated during the mining operation, as well as interim stockpiles. The climate is favourable to
open pit mining and no significant surface water bodies are impacted by the mining activity.
The proposed open pit mines the upper portion of the two main mineralized regions, while leaving
some deeper Resource un-mined that may be suitable for underground mining.
16.1 Resource model for mining – mining block model
A Resource block model was supplied by Tetra Tech. The Resource model was used to produce a
mining model by applying modifying factors that account for practicalities of mining; the latter model
was subsequently used in the mining, metallurgical and economic analysis.
The significant modifications made to the model are listed below:
• Rock type grouping – As indicated in Section 14, all grade interpolations were allocated to
eight lithology classes. In the mining block model, zones were grouped into larger categories
of the West or East Hill.
• New Oxide Zone created – In the Resource model the whole mineralization is classified as
sulphide. However, oxidation is evident in the upper sections of some drillholes, as well as in
the field. As copper recoveries by flotation are often lower in oxide mineralization than in
sulphide mineralization, it was agreed with Catalyst that a simplistic 20 m thick oxide blanket
would be added to the model to represent the oxidization layer. The original in-situ grade
estimates were retained within the approximate oxide blanket.
• Resource classification – Mineralized material was classified in the Resource model as
Measured, Indicated, Inferred and Not-Classified. As this is a PEA, all classified mineralization
has been included in the analysis. The unclassified category was treated as waste.
• Grades: Kriged estimates for copper (CUKR), gold (AUKR), silver (AGKR), and arsenic (ASKR)
were used in the mining analysis. In agreement with Catalyst, molybdenum grades were
deemed too low to consider this metal as a recoverable product. Hence, while molybdenum is
included in the Resource statement, it was excluded of any further analysis.
Table 16.1 maps the categories used in the Resource model to those of the mining model.
Table 16.1 Rock types in the mining block model
Resource Model Zone and Category Mining model rock types
Zone Classification Sulphides Oxides
1 – East Hill Breccia Measured +
Indicated +
Inferred
ESU EOX 2 – East Hill Quartz Diorite Porphyry
3 – East Hill Quartz Feldspar Porphyry
7 – East Hill Quartz Diorite
4 – West Hill Breccia Measured +
Indicated +
Inferred
WSU WOX 5 – West Hill Quartz Diorite Porphyry
6 – West Hill Quartz Feldspar Porphyry
8 – West Hill Quartz Diorite
All Zones Not Classified Added to background waste
Figure 16.1 shows the rock types in the mining block model and their spatial distribution.

La Verde Copper Project
Equinox Gold Corp. and Solaris Copper Inc. 718017
amcconsultants.com 105
Figure 16.1 Rock types in a typical section through West and East Hill, looking North
Source: AMC
16.1.1 Processing eligibility and NSR calculations
As described in Sections 13.4 and 13.5, metallurgical tests conducted to date suggest that arsenic
in the La Verde final concentrates can reach levels that, if not reduced before selling, would incur
severe smelter penalties, and even potentially render the concentrates unmarketable. Penalties
ultimately increase the concentrate selling cost and reach levels that reduce the concentrate value
to zero.
Alternatively, high-arsenic concentrate could potentially be treated on site by using a roasting
process to remove a significant proportion of the contained arsenic before releasing the final product
to copper smelters. In this case, the value of the concentrate is reduced by the operating costs of
the arsenic reduction stages, but conversely would not be as impacted by penalties.
In order to properly reflect the economic impact of the arsenic values reporting to the final
concentrates, an NSR equivalent grade was calculated for all mineralized material blocks. This
equivalent grade was used in the Lerchs-Grossman analysis to identify the ultimate pit to use for
mine scheduling. In all cases the NSR value was estimated to the concentrate filtering stage (i.e.
mill product). Table 16.2 summarizes the parameters used in the NSR calculations. The source for
these parameters can be found in Sections 17 and 19. Note that for smelter charges and refining
charges, two set of parameters, denoted by ‘(I)’ and ‘(II)’, are provided. These were used to
calculate alternative NSR values depending on the concentrate’s market destination, referred to as
“clean” or “dirty” concentrates.

La Verde Copper Project
Equinox Gold Corp. and Solaris Copper Inc. 718017
amcconsultants.com 106
Table 16.2 NSR calculation parameters and assumptions
Parameter Description Value Comment
Primary Recovery Method
Single concentrate flotation
Metals Adding Value Cu, Ag, Au Au, Ag paid as by-products. Arsenic penalties at smelter and refinery
Mill Recoveries
Cu
Sulphides East Hill : 90%
West Hill : 90%
See Table 17.1
Oxides East Hill: 50%
West Hill: 0%
Au
Sulphides East Hill: 80%
West Hill: 0%
Oxides East Hill: 75%
West Hill: 0%
Ag
Sulphides East Hill: 85%
West Hill: 60%
Oxides East Hill: 50%
West Hill: 50%
As
Sulphides East Hill: 70%
West Hill: 20%
Oxides East Hill: 70%
West Hill: 20%
Concentrate Cu grade
Sulphides East Hill: 27.5%
West Hill: 26%
Oxides East Hill: 29%
West Hill: 0%
Cost of Roasting On site US$30/tonne Per tonne of concentrate
Cost of Transport to Smelter
US$70/tonne Per tonne of concentrate
% Payable
Cu 96.5%
Au 95% Minimum payable content of 1 g per concentrate tonne
Ag 90% Minimum payable content of 30 g per concentrate tonne
Smelter Charges (I)
(when sold in restricted market as “dirty” concentrates)
As < 0.5% US$108/dry tonne
0.5% < As < 1.0% US$128/dry tonne
As > 1.0% US$190/dry tonne Plus an additional 5 US$/ dry tonne per each 0.01% above 1%
Refining Charges (I)
(when sold in restricted market as “dirty” concentrates)
As < 0.5% US$0.1075/Cu lb
0.5% < As < 1.0% US$0.1275/Cu lb
As > 1.0% US$0.19/Cu lb
Smelter Charges (II)
(when sold in regular market as “clean” concentrate)
As < 0.2% US$70/dry tonne
0.2% < As < 1.0% US$70/dry tonne Plus an additional 3 US$/ dry tonne per each 0.1% above 0.2%
Refining Charges (II)
(when sold in regular market as “clean” concentrate)
As < 0.2% US$0.07/Cu lb
0.2% < As < 1.0% US$0.07/Cu lb
Metal prices
Cu US$2.7/lb
Au US$1,200/tOz
Ag US$25/tOz

La Verde Copper Project
Equinox Gold Corp. and Solaris Copper Inc. 718017
amcconsultants.com 107
16.2 Strategic mine planning
Since this is the first economic analysis of the La Verde deposit, some economic and technical
strategic decisions had to be made. These included: processing and mining production rate, cut-off
grade strategy, options for arsenic reduction, and concentrate marketing. The assumptions made
in this PEA are not final and even though specific values have been used, significant further analysis
is required to advance the project to pre-feasibility level.
16.2.1 Selection of the size of the operation
Prior to the present study, preliminary pit optimization runs showed potential mill feed tonnages in
the 350 Mt – 550 Mt range. Benchmarking conducted against similar-size porphyry deposits led
Catalyst to consider a range of milling capacity between 40 ktpd and 90 ktpd.
As part of the present study, a high-level analysis was undertaken to estimate mill throughput
capacity to maximize project value. The NPV was calculated as the difference between the
discounted operating surplus associated with a given mining schedule, and a corresponding estimate
of initial capital expenditure. The Lerchs-Grossman (LG) algorithm was used to test plant
throughputs between 22 Mtpa (60.3 ktpd) and 55 Mtpa (151 ktpd) and derive corresponding mining
production capacity and associated capital costs.
This high-level analysis showed a relatively stable maximum value around a processing capacity of
30 Mtpa; this throughput was selected for this PEA.
AMC emphasizes the utmost importance of undertaking this type of strategic analysis prior to the
development of any mining project. Should the La Verde project be advanced to pre-feasibility, a
detailed study to estimate the optimal balance between mining rate, processing rate and cut-off
grade should be performed.
16.2.2 Inclusion of a roasting stage
Metallurgical testing conducted to date suggests that arsenic levels can reach levels that adversely
impact on the economic value of the project due to additional costs for roasting, smelting and
refining the concentrate. The magnitude of the additional costs incurred is dependent on which of
the two following processing path is selected:
• Non-roasting option: in this case the selling cost will be higher due to the high smelter
penalties imposed by the very restricted number of smelters which can accept high arsenic or
“dirty” concentrate. Ultimately, the increase in the selling cost can outweigh the value of the
copper in the concentrate.
• Roasting option: in this instance a “clean” concentrate is produced for sale to the regular
smelter market. This option requires onsite partial roasting to reduce the arsenic levels to
acceptable levels, manageable by regular smelters. With this option, the value of the project
is reduced by the capital and operating cost of the roasting stage.
Both options were analysed for La Verde. For each case, an NSR was calculated, taking into account
their respective costs. Figure 16.2 shows the total operating surplus and the total mill feed tonnage
for a range of optimal pit sizes, plotted against tonnage of total rock on the X-axis. The non-roasting
option curve lies beneath the roasting option curve along the whole range of pit sizes. This indicates
that, for the same set of parameters, the non-roasting option always yields lower value pits. For
the non-roasting option, the maximum undiscounted pit value is US$2,789M at a pit size of around
1,700 Mt containing around 560 Mt of mill feed. For the roasting option, the maximum undiscounted
pit value is US$3,587M at a pit size of around 2,200 Mt containing around 750 Mt of mill feed. The
same behaviour and relative position of the two options is obtained when discounted pit values are
used.

La Verde Copper Project
Equinox Gold Corp. and Solaris Copper Inc. 718017
amcconsultants.com 108
Figure 16.2 Undiscounted pit value and mill feed yield versus pit size – roast / no-roast options
Source: AMC
The preceding results support adopting the roasting option as the base case for the current PEA.
Figure 16.3 and Figure 16.4 illustrate the change in pit limit between the roasting and non-roasting
options.
3,587
2,789
0
200
400
600
800
1000
1200
1400
1600
1800
0
500
1000
1500
2000
2500
3000
3500
4000
0 500 1000 1500 2000 2500 3000 3500
Ore
To
nn
age
, M
t
Pit
Val
ue
, M
US$
Total Rock (Pit Size), Mt
pit value UNDISC - ALL ROASTED
pit value UNDISC - NO ROAST
ore tonnes - NO ROAST
ore tonnes - ALL ROASTED

La Verde Copper Project
Equinox Gold Corp. and Solaris Copper Inc. 718017
amcconsultants.com 109
Figure 16.3 Non-roasting NSR values and optimal pit – typical West-East section, through the
West and East hills (looking North)
Source: AMC
Figure 16.3 illustrates a typical cross section showing block NSR values for the non-roasting option.
The thick red lines depict the maximum undiscounted value shell, also represented by the highest
value on the green curve in Figure 16.2.

La Verde Copper Project
Equinox Gold Corp. and Solaris Copper Inc. 718017
amcconsultants.com 110
Figure 16.4 Roasting NSR values and optimal pit – typical West East section through the West
and East hills (looking North)
Source: AMC
Figure 16.4 shows a typical cross section showing block NSR values for the roasting option. The
thick yellow lines depict the maximum undiscounted cashflow pit for the same set of parameters
used for the no-roast option. While the West Hill pit remains the same, the East Hill pit grows
significantly downwards and westwards due to the gain in value in the corresponding regions of the
deposit.
These results identified the roasting option as preferable from a value perspective.
The potential to add value to the project by deferring construction of the roaster (and postponing
capital expenditure), and by using an elevated cut-off grade (COG) in the first years of mine life
was tested by way of a high-level strategic analysis.
Each scenario was produced by assuming that a roasting facility would only come into production
after a specific amount of years.
In addition, an elevated COG was applied each year and for each scenario, as summarized in Table
16.4.

La Verde Copper Project
Equinox Gold Corp. and Solaris Copper Inc. 718017
amcconsultants.com 111
Table 16.3 Normalized project value results based on varying COG scenarios
Roaster start time COG base case COG Scenario 1 COG Scenario 2 COG Scenario 3 COG Scenario 4
At Startup 100% 106% 111% 106% 95%
After 3 yrs -- 101% 110% 109% --
After 5 yrs -- 99% 110% 99% --
After 6 yrs -- -- 101% -- --
Note: The notation “--“ indicates that a schedule was not produced.
Table 16.4 Cut-off grade scenarios tested
COG series - NSR, US$/t
Y1 Y2 Y3 Y4 Y5 Y6 Y7 Y8 Y9 Y10 Y11 Y12 Y13 Y14
COG Base case 6 … > Flat marginal COG
COG Scenario 1 12 12 10 10 8 8 6 … >
COG Scenario 2 14 14 12 12 10 10 8 8 6 … >
COG Scenario 3 16 16 14 14 12 12 10 10 8 8 6 … >
COG Scenario 4 18 18 16 16 14 14 12 12 10 10 8 8 6 … >
The results of this high-level analysis are presented in Table 16.3. The results have been normalized
and compared by using the COG Base Case scenario and roasting from start-up as reference point.
The highest value, 111%, is obtained by the combination of roasting from start of processing
operations and following the Scenario 2 COG policy, thus applying an elevated cut-off grade over
the first nine years of mining.
This combination of options was selected as a robust course of action at PEA level; a more detailed
analysis of the mining rate, treatment rate and COG policy should be performed as part of a
pre-feasibility study.
16.3 Ultimate pit selection
The parameters used in the pit optimization are presented in Table 16.5.
The Whittle Four-X package’s Lerchs-Grossman and Milawa production scheduling algorithms were
used for pit optimization and strategic scheduling. The ultimate pit shell was selected by following
the steps listed below:
• The NSR value corresponding to the roasting option was populated into the mining model and
used for the pit optimization.
• The ultimate pit was selected by considering the highest discounted operating surplus obtained
from feasible mining and milling high-level schedules. The schedules were based on the
Scenario 2 COG outlined in the preceding section.
The selected ultimate pit corresponds to the Revenue Factor of 90% (RF=0.9). Figure 16.5 shows
the position of the selected ultimate pit on the discounted value curve.

La Verde Copper Project
Equinox Gold Corp. and Solaris Copper Inc. 718017
amcconsultants.com 112
Figure 16.5 Undiscounted and discounted pit value curves
Source: AMC
Table 16.5 Pit optimization input
Parameter Value Comment
Block size 20 m x 20 m x 15 m No re-blocking used
Overall slope angle 39 degrees Limited geotechnical data was available. The overall slope angle used is based on experience in similar rock types and the expected total wall height.
Unit cost of mining US$1.70 per tonne mined
Benchmark data based on a mining rate of 200 ktpd to 300 ktpd
Unit cost of processing
US$6.00 per Mill Feed tonne
Refer to Section 17
Unit G&A costs US$0.35 per Mill Feed tonne
US$10 – 11M per year was estimated for the expected operation size.
Eligible rock types for processing
Four rock types as described in Table 16.1. These include Measured, Indicated and Inferred Resources
Metal prices
Included in the NSR calculation (see Table 16.2) Processing recoveries
Selling prices
Mine dilution factor 1 Given the nature of the porphyry mineralization and model block size, it is appropriate, at this level of study, to assume 0% dilution and mining loss. Mine recovery factor 1
The selected ultimate pit shell features are summarized in Table 16.6.

La Verde Copper Project
Equinox Gold Corp. and Solaris Copper Inc. 718017
amcconsultants.com 113
Table 16.6 Features of the selected ultimate pit
Item Value Units
Measured + Indicated 397 million tonnes
Inferred 191 million tonnes
Waste 1,350 million tonnes
Total Mill Feed 588 million tonnes
Overall strip ratio 2.3 ratio
Mill Feed mean grades
NSR 17.3 US$/tonne
Copper 0.37 %
Gold 0.03 g/tonne
Silver 2.3 g/tonne
Arsenic 0.033 %
Lowest bench toe elevation -55 m
Figure 16.5 through Figure 16.9 illustrate the ultimate pit selected and its relationship to the Mineral
Resources. In some figures the ultimate pit trace has been highlighted to improve visualization.
Figure 16.6 Selected ultimate pit and NSR values – typical section through West and East Hill,
looking North
Source: AMC

La Verde Copper Project
Equinox Gold Corp. and Solaris Copper Inc. 718017
amcconsultants.com 114
Figure 16.7 Selected ultimate pit and NSR values – plan view at elevation 390
Source: AMC

La Verde Copper Project
Equinox Gold Corp. and Solaris Copper Inc. 718017
amcconsultants.com 115
Figure 16.8 Selected ultimate pit and NSR values – typical section through West Hill, looking East
Source: AMC

La Verde Copper Project
Equinox Gold Corp. and Solaris Copper Inc. 718017
amcconsultants.com 116
Figure 16.9 Selected ultimate pit and NSR values - typical section through East Hill, looking East
Source: AMC
Figure 16.10 and Figure 16.11 show the selected ultimate pit and its relationship to the fraction of
the Mineral Resources with NSR greater than US$6/t, represented by the red solids. Figure 16.11
shows the fraction of Mineral Resources not included in the ultimate pit.

La Verde Copper Project
Equinox Gold Corp. and Solaris Copper Inc. 718017
amcconsultants.com 117
Figure 16.10 Selected ultimate pit and Mineral Resources (NSR greater than US$6/t) – Isometric
view looking North
Source: AMC
Figure 16.11 Mineral Resources with NSR values above US$6/t not mined by the ultimate
pit – Isometric view looking North
Source: AMC

La Verde Copper Project
Equinox Gold Corp. and Solaris Copper Inc. 718017
amcconsultants.com 118
16.4 Ultimate pit sensitivity analysis
Table 16.7 presents the results of the sensitivity analysis conducted on the ultimate pit shell.
Table 16.7 Ultimate pit sensitivity to selected operational parameters
Variation in unit mining cost. base case value: US$1.7/tonne
US$1.9/tonne (+12%) US$2.1/tonne (+24%)
Feature Base case value Variation, % Variation, %
Measured+Indicated, Mtonne 397
12% 50% Inferred, Mtonne 191
Waste, Mtonne 1,350
Total to Processing, Mill Capacity (LOM), Mtonne
588 20% 41%
Mean NSR Grade, US$/tonne 17.3 0% 5%
Mean Copper Grade, % 0.37 0% 5%
Variation in Overall Slope Angle. Base Case value: 39 degrees
37 degrees (- 2 flatter) 42 degrees (+3 steeper)
Feature Base Case Value (a) Variation, % Variation, %
Measured+Indicated, Mtonne 397
5% 3% Inferred 191
Waste, Mtonne 1,350
Total to Processing, Mill Capacity (LOM), Mtonne
588 4% 1%
Mean NSR Grade, US$/tonne 17.3 2% 2%
Mean Copper Grade, % 0.37 3% 3%
16.5 Geotechnical data – rock mass classification
16.5.1 Data
The rock mass characteristics at La Verde have been assessed using the limited data provided to
AMC, which includes:
• Resource borehole collar locations and downhole survey.
• Local topography.
• Drillhole logging data (RQD data only).
The geotechnical database used in this study is comprised of 51 diamond drillholes. All drillholes
were logged by Catalyst personnel. The database was reviewed using core photographs from four
drillholes outlined in Table 16.8.
It should be noted that AMC did not have an opportunity to review the drill core on site from a
geotechnical point of view.
Based on the limited information available, logging of geotechnical parameters (i.e. RQD) appears
to be logged to industry standard.

La Verde Copper Project
Equinox Gold Corp. and Solaris Copper Inc. 718017
amcconsultants.com 119
Table 16.8 Drillhole core photos used to review catalyst logging of RQD values
Bore hole ID Easting (mE) Northing (mN) Elevation (mRL) Depth length (m)
LV12-041 810800.0 2113210.0 565.0 641.9
LV12-042 812204.0 2112788.0 534.0 565.1
LV12-043 811000.0 2113195.0 540.0 389.0
LV12-044 811852.0 2112925.0 450.0 682.3
16.5.2 Rock Quality Designation (RQD)
RQD is a fundamental input into several rock mass characterization schemes, and is generally
regarded as a reliable, and basic indicator of ground conditions. However, it should be noted that
RQD is not substitute for a more representative rock mass classification scheme such as RMR1989
(Bieniawski, 1989) or NGI Q (Barton et. al., 1974).
The RQD is calculated as the ratio of the sum of the lengths of all core sticks greater than 10 cm in
length, to the total length of the drill core run, expressed as a percentage. Values and descriptions
of RQD are presented in Table 16.6.
Table 16.9 RQD values and descriptions (Deere, 1964)
Rock Quality Designation (Description) RQD Value (%)
Very Poor 0 to 25
Poor 25 to 50
Fair 50 to 75
Good 75 to 90
Excellent 90 to 100
A preliminary review of geotechnical logging suggests that the uppermost section of the drillholes
typically display low RQD recorded values (after Deere, 1964). This zone is thought to be associated
with a depth of weathering, which is estimated to be around 25 m.
Figure 16.12 indicates that the weathered zone in the West Hill deposit (WWP Domain) is
characterized by RQD values of 0 to 10%, while the unweathered rock (UWP Domain) below features
values of 70% to 90%.
It can be seen from Figure 16.13 that the weathered zone in the East Hill deposit (WEP Domain)
typically features RQD values of 0 to 10% and 60 to 70%. The unweathered drill core (UEP Domain)
is characterized by RQD values of 70 to 90%.

La Verde Copper Project
Equinox Gold Corp. and Solaris Copper Inc. 718017
amcconsultants.com 120
Figure 16.12 RQD values by geotechnical domain – logged from drillholes located in the proposed
West Hill pit
Source: AMC

La Verde Copper Project
Equinox Gold Corp. and Solaris Copper Inc. 718017
amcconsultants.com 121
Figure 16.13 RQD values by geotechnical domain; logged from drillholes located in proposed East
pit
Source: AMC
16.5.3 Assumed design parameters
An Overall Slope Angle (OSA) of 39° has been assumed for this study, which is reasonable for a
PEA level of analysis.
Geotechnical information that is typically required to undertake reliable slope stability analysis
includes, but is not limited to:
• Lithology types and locations.
• Estimated intact rock strengths.
• The orientation and condition of geological structures (such as joints, shears, and deposit-
scale faults).
• Rock property data derived from laboratory testing.
• Hydrological information (such as location and extent of ground water, along with the
associated pore water pressures).
None of the information outlined above has been supplied to AMC for this study.
While RQD values have been provided, it should be noted that this form of assessment does not
take into consideration the effects of hydrological conditions, nor deposit-scale geological structures,
which may adversely affect slope stability. Furthermore, the RQD estimates are sourced from
drillholes that are positioned within the deposit, and not from locations where pit walls are likely to
be located.
16.6 Layout of other mining facilities around the pits
As shown in Table 16.4, 1,350 million tonnes of waste are extracted from the pits. Additionally, the
extraction schedule calls for the stockpiling of up to 110 million tonnes of material.

La Verde Copper Project
Equinox Gold Corp. and Solaris Copper Inc. 718017
amcconsultants.com 122
Currently, Lowell Copper does not own the surface land required to hold the pit and the surrounding
mining facilities outlined in this section. Notwithstanding, under the assumption that any land
required for surface dumps and storage can be acquired, sufficient space for the scheduled dumps
and stockpiles is available in the immediate surroundings of the pit.
The location of the mill is proposed to be on the north side of the open pits; most of the areas
surrounding the pits would be used for surface dumps and stockpiles. The basic criteria for selecting
the dumps location is as follows:
• Minimize haulage: dump as close as possible to the pit rims and at elevations as low as
possible.
• Offset from communities: a minimum 500 m offset between surrounding communities
perimeters and the closest dump / stockpile toe has been used. Viability of this offset has not
been explored with the local communities.
• Offset from pit: toes of waste dumps and stockpiles no closer than 200 m from the pit rims to
allow for potential pit expansion.
• All waste dumps and stockpiles were designed at an average slope angle of 28 degrees. This
angle includes a 37 degree angle of repose and allowance for haul roads (not shown at this
stage).
The resulting layout is shown in Figure 16.14. The stockpiles would be fully reclaimed by the end of
the mine life.

La Verde Copper Project
Equinox Gold Corp. and Solaris Copper Inc. 718017
amcconsultants.com 123
Figure 16.14 General layout including mill site, stockpiles and waste dumps – plan view
Source: AMC
16.7 Conceptual mining schedule
The open pits were scheduled using the Milawa algorithm which is part of the Whittle Four-X
package. Highlights of the selected mining schedule are:
• The selected schedule calls for 21 years of mining activity; in Year -1, 65 million tonnes are
pre-stripped, open pit mining occurs between Year 1 and Year 19, and stockpile reclaiming in
Years 20 and 21.
• Metal prices and mill recoveries are the same as those used for NSR calculation and pit
optimization.
Figure 16.15 to Figure 16.17 show some selected end of period face progression to illustrate the
mining development. The legend is based on NSR values, the warmer colours corresponding to the
higher NSR values. Pre-stripping operations commence in Year -1 and milling in Year 1.
West Hill Pit
Long term stockpiles
Plant
Waste Dumps
Reduced lease boundary
East Hill Pit

La Verde Copper Project
Equinox Gold Corp. and Solaris Copper Inc. 718017
amcconsultants.com 124
Figure 16.15 Mining schedule, end of Year 1 (end of pre-stripping)
Source: AMC
Figure 16.16 Mining schedule, end of Year 5
Source: AMC

La Verde Copper Project
Equinox Gold Corp. and Solaris Copper Inc. 718017
amcconsultants.com 125
Figure 16.17 Mining schedule, end of Year 10
Source: AMC
Figure 16.18 Mining schedule, end of pit life
Source: AMC
The detail of the conceptual schedule is presented in Table 16.7. Note that, on a period by period
basis, only a portion of the mined mineralized material goes directly to the mill; the lower grade
material is stockpiled for treatment at the end of mine life. This strategy is adopted to feed higher
grades in early years to increase the project’s NPV. The yearly conceptual mill feed is provided in
Table 16.8.

La Verde Copper Project
Equinox Gold Corp. and Solaris Copper Inc. 718017
amcconsultants.com 126
Table 16.10 Conceptual mining schedule
Y(-1) Y 1 Y 2 Y 3 Y 4 Y 5 Y 6 Y 7 Y 8 Y 9 Y 10 Y 11 Y 12 Y 13 Y 14 Y 15 Y 16 Y 17 Y 18 Y 19 Y 20 LOM
Tonnage (Mt) - 12.4 10.4 3.1 5.6 1.1 3.8 1.5 2.5 1.4 2.5 1.6 0.5 0.2 0.0 0.1 0.7 0.0 0.2 - -
CU (%) - 0.55 0.60 0.64 0.45 0.55 0.41 0.39 0.42 0.35 0.44 0.43 0.43 0.21 0.48 0.28 0.48 0.33 0.28 - -
AU (gpt) - 0.07 0.05 0.01 0.02 0.02 0.04 0.06 0.03 0.05 0.12 0.10 0.13 0.24 0.27 0.19 0.18 0.13 0.08 - -
AG (gpt) - 4.2 4.1 2.7 2.4 2.6 2.0 4.3 2.8 2.6 3.2 2.4 3.9 2.8 4.0 2.3 5.4 2.7 2.7 - -
Tonnage (Mt) 3.7 5.4 5.0 1.4 2.3 0.4 0.7 - - - - - - - - - - - - - -
CU (%) 0.41 0.19 0.19 0.21 0.19 0.16 0.15 - - - - - - - - - - - - - -
AU (gpt) 0.06 0.03 0.02 0.01 0.01 0.04 0.04 - - - - - - - - - - - - - -
AG (gpt) 3.3 1.7 1.9 1.7 1.6 1.2 1.1 - - - - - - - - - - - - - -
Tonnage (Mt) 3.7 17.8 15.4 4.5 7.9 1.5 4.5 1.5 2.5 1.4 2.5 1.6 0.5 0.2 0.0 0.1 0.7 0.0 0.2 - -
CU (%) 0.41 0.44 0.47 0.50 0.38 0.45 0.37 0.39 0.42 0.35 0.44 0.43 0.43 0.21 0.48 0.28 0.48 0.33 0.28 - -
AU (gpt) 0.06 0.06 0.04 0.01 0.02 0.02 0.04 0.06 0.03 0.05 0.12 0.10 0.13 0.24 0.27 0.19 0.18 0.13 0.08 - -
AG (gpt) 3.3 3.4 3.4 2.4 2.2 2.2 1.8 4.3 2.8 2.6 3.2 2.4 3.9 2.8 4.0 2.3 5.4 2.7 2.7 - -
Tonnage (Mt) - 10.8 18.1 25.7 19.0 18.4 19.3 17.8 16.7 15.4 13.2 13.6 11.4 2.5 5.4 8.1 9.9 12.5 12.8 - -
CU (%) - 0.47 0.51 0.55 0.52 0.50 0.32 0.46 0.42 0.44 0.40 0.35 0.32 0.17 0.20 0.27 0.36 0.34 0.36 - -
AU (gpt) - 0.06 0.03 0.02 0.01 0.01 0.04 0.08 0.02 0.03 0.04 0.03 0.03 0.04 0.04 0.04 0.05 0.03 0.04 - -
AG (gpt) - 3.3 3.1 2.4 2.3 2.0 2.5 4.9 2.0 2.1 2.2 2.0 1.6 1.2 1.7 2.0 2.6 1.9 2.3 - -
Tonnage (Mt) 12.4 11.3 16.0 20.5 8.8 6.7 3.7 - - - - - - - - - - - - - -
CU (%) 0.39 0.19 0.20 0.19 0.18 0.17 0.16 - - - - - - - - - - - - - -
AU (gpt) 0.12 0.03 0.01 0.02 0.01 0.04 0.03 - - - - - - - - - - - - - -
AG (gpt) 4.1 2.1 1.5 1.5 1.6 1.3 1.5 - - - - - - - - - - - - - -
Tonnage (Mt) 12.4 22.1 34.1 46.1 27.8 25.1 23.0 17.8 16.7 15.4 13.2 13.6 11.4 2.5 5.4 8.1 9.9 12.5 12.8 - -
CU (%) 0.39 0.33 0.36 0.39 0.41 0.42 0.30 0.46 0.42 0.44 0.40 0.35 0.32 0.17 0.20 0.27 0.36 0.34 0.36 - -
AU (gpt) 0.12 0.05 0.02 0.02 0.01 0.02 0.04 0.08 0.02 0.03 0.04 0.03 0.03 0.04 0.04 0.04 0.05 0.03 0.04 - -
AG (gpt) 4.1 2.7 2.4 2.0 2.1 1.8 2.3 4.9 2.0 2.1 2.2 2.0 1.6 1.2 1.7 2.0 2.6 1.9 2.3 - -
Tonnage (Mt) 16.2 39.8 49.5 50.7 35.7 26.5 27.5 19.4 19.2 16.8 15.7 15.2 11.9 2.7 5.4 8.2 10.6 12.6 13.0 - - 397
CU (%) 0.39 0.38 0.39 0.40 0.40 0.42 0.31 0.45 0.42 0.44 0.40 0.36 0.32 0.17 0.20 0.27 0.37 0.34 0.36 - -
AU (gpt) 0.11 0.05 0.03 0.02 0.01 0.02 0.04 0.08 0.02 0.03 0.05 0.04 0.03 0.06 0.04 0.04 0.06 0.03 0.04 - -
AG (gpt) 3.9 3.0 2.7 2.1 2.1 1.8 2.2 4.8 2.1 2.2 2.4 2.1 1.7 1.3 1.8 2.0 2.7 1.9 2.3 - -
Tonnage (Mt) - 0.6 1.5 1.2 3.1 3.8 6.9 10.5 10.7 13.1 8.4 14.8 6.1 8.3 17.9 15.7 16.6 17.4 17.0 - -
CU (%) - 0.44 0.45 0.54 0.52 0.43 0.32 0.39 0.37 0.42 0.40 0.34 0.31 0.19 0.23 0.27 0.33 0.35 0.45 - -
AU (gpt) - 0.04 0.02 0.03 0.01 0.01 0.04 0.05 0.01 0.02 0.03 0.02 0.02 0.02 0.03 0.02 0.04 0.04 0.02 - -
AG (gpt) - 0.7 1.6 2.4 2.0 1.8 2.4 3.0 1.9 2.0 1.9 1.8 1.5 1.0 1.5 1.7 2.2 2.2 2.6 - -
Tonnage (Mt) 0.3 0.8 1.7 3.0 5.6 3.9 1.3 - 0.4 - - 0.3 - - - - - - - - -
CU (%) 0.12 0.20 0.20 0.18 0.17 0.16 0.16 - 0.24 - - 0.28 - - - - - - - - -
AU (gpt) 0.09 0.03 0.01 0.03 0.01 0.04 0.03 - 0.05 - - 0.00 - - - - - - - - -
AG (gpt) 2.9 0.8 1.5 1.5 1.4 1.3 1.4 - 0.9 - - 0.1 - - - - - - - - -
Tonnage (Mt) 0.3 1.5 3.2 4.3 8.6 7.8 8.2 10.5 11.0 13.1 8.4 15.0 6.1 8.3 17.9 15.7 16.6 17.4 17.0 - - 191
CU (%) 0.12 0.31 0.32 0.28 0.30 0.29 0.30 0.39 0.37 0.42 0.40 0.34 0.31 0.19 0.23 0.27 0.33 0.35 0.45 - -
AU (gpt) 0.09 0.03 0.02 0.03 0.01 0.03 0.03 0.05 0.02 0.02 0.03 0.02 0.02 0.02 0.03 0.02 0.04 0.04 0.02 - -
AG (gpt) 2.9 0.8 1.6 1.8 1.6 1.5 2.3 3.0 1.9 2.0 1.9 1.8 1.5 1.0 1.5 1.7 2.2 2.2 2.6 - -
Waste, Mt 48.5 53.7 42.3 40.1 50.7 85.7 84.3 90.1 89.8 90.0 95.9 84.8 97.0 103.9 91.7 91.1 52.8 50.0 8.1 1,350
YEAR
Measured
Indicated
to Mill
to Stockpiles
to Mill
to Stockpiles
Total (Measured and Indicated)
Total (Inferred)
Total Waste
Total (Measured)
Total (Indicated)
Inferred
to Stockpiles
to Mill

La Verde Copper Project
Equinox Gold Corp. and Solaris Copper Inc. 718017
amcconsultants.com 127
Table 16.11 Conceptual mill feed schedule
Note: The mill feed schedule is provided in accordance with the requirements of 22 (b) of Form 43-101F1. It does not represent an estimate of Mineral Reserves.
YEAR Y(-1) Y 1 Y 2 Y 3 Y 4 Y 5 Y 6 Y 7 Y 8 Y 9 Y 10 Y 11 Y 12 Y 13 Y 14 Y 15 Y 16 Y 17 Y 18 Y 19 Y 20
Tonnage (Mt) - 14.0 10.4 3.1 6.0 2.1 3.8 1.5 2.5 1.4 3.4 1.6 2.4 3.2 1.1 1.1 1.2 0.04 0.2 4.7 2.8
CU (%) - 0.55 0.60 0.64 0.46 0.38 0.41 0.39 0.42 0.35 0.37 0.43 0.24 0.20 0.21 0.21 0.35 0.33 0.28 0.19 0.17
AU (gpt) - 0.07 0.05 0.01 0.03 0.03 0.04 0.06 0.03 0.05 0.10 0.10 0.04 0.03 0.02 0.03 0.13 0.13 0.08 0.01 0.03
AG (gpt) - 4.2 4.1 2.7 2.6 2.7 2.0 4.3 2.8 2.6 3.0 2.4 2.3 1.7 1.7 1.7 3.8 2.7 2.7 1.6 1.4
Tonnage (Mt) - 15.1 18.1 25.7 20.6 23.0 19.3 17.8 16.7 15.4 17.3 13.6 19.9 15.5 10.1 12.3 12.1 12.5 12.8 20.3 12.0
CU (%) - 0.51 0.51 0.55 0.52 0.44 0.32 0.46 0.42 0.44 0.35 0.35 0.27 0.19 0.20 0.25 0.33 0.34 0.36 0.19 0.17
AU (gpt) - 0.10 0.03 0.02 0.02 0.02 0.04 0.08 0.02 0.03 0.04 0.03 0.03 0.02 0.03 0.03 0.05 0.03 0.04 0.01 0.04
AG (gpt) - 4.0 3.1 2.4 2.5 2.1 2.5 4.9 2.0 2.1 2.3 2.0 1.7 1.6 1.7 1.9 2.4 1.9 2.3 1.6 1.4
Tonnage (Mt) - 0.8 1.5 1.2 3.3 4.8 6.9 10.5 10.7 13.1 9.3 14.8 8.0 11.3 19.0 16.7 17.1 17.4 17.0 4.7 2.8
CU (%) - 0.42 0.45 0.54 0.52 0.38 0.32 0.39 0.37 0.42 0.38 0.34 0.28 0.18 0.23 0.27 0.32 0.35 0.45 0.17 0.15
AU (gpt) - 0.06 0.02 0.03 0.02 0.02 0.04 0.05 0.01 0.02 0.03 0.02 0.02 0.02 0.03 0.02 0.04 0.04 0.02 0.01 0.03
AG (gpt) - 1.2 1.6 2.4 2.1 1.9 2.4 3.0 1.9 2.0 1.9 1.8 1.5 1.1 1.5 1.7 2.2 2.2 2.6 1.2 1.1
Measured to Mill from stockpile
and production
Indicated to Mill from stockpile
and production
Inferred to Mill from stockpile
and production

La Verde Copper Project
Equinox Gold Corp. and Solaris Copper Inc. 718017
amcconsultants.com 128
16.8 Mine equipment and personnel
A full time mine and mill operation is proposed for La Verde, i.e. a continuous operation of 360 days
per year and 24 hours per day. It is not anticipated that any other delays will reduce the annual
operating time.
The selected schedule calls for ex-pit mining rates of 181 Ktonne/day in Year 1, 264 Ktonne/day
from Year 2 to 4, and an average of 296 Ktonne/day from Year 5 to 18.
For this size of mining operation and the selectivity required in this type of deposit, large size mining
equipment is proposed. Both productivities and costs have been estimated based on the following
operational parameters:
• Drilling and Blasting on 15 m benches.
• Primary loading with rope and hydraulic shovels.
• Use of 225 tonnes haul trucks.
• Use of electric equipment (primary drills and rope shovels).
The proposed mining equipment is described in Table 16.12.
Table 16.12 Mining equipment
Unit operation Equipment Normal use Key indicators
Drilling Electric rotary drills. 90 klb pulldown class
Vertical drilling.
10 5/8” – 12 ¼” hole diam. range
29 drilled meters per hour (LOM avg)
Blasting Owner operated Avg. Yield, 2500 tonne per hole for all material
LOM powder factor, 0.28 kg/t
Loading
Four shovels in the 37 - 42 cu. meter bucket range.
Two electric rope shovels. Two hydraulic (diesel).
Two front end loaders
LOM average, 75 ktonne per day per unit
5500 tph avg. loading capacity
Haulage 225-tonne-class payload trucks Haulage 830 tph avg LOM productivity
Support Equipment
Conventional equipment: water trucks, wheel dozers, bulldozers and motor graders
Ancillary work 84,000 operating hours per year (LOM avg)
The number of equipment units required per year and the purchasing schedule (new and
replacement units) are provided in Table 16.13.

La Verde Copper Project
Equinox Gold Corp. and Solaris Copper Inc. 718017
amcconsultants.com 129
Table 16.13 Mine mobile equipment. Active units per year and acquisition schedule
Mine Operations and Maintenance Mobile Equipment - UNITS in USE
Unit Y(-3) Y(-2) Y(-1) Y1 Y2 Y3 Y4 Y5 Y6 Y7 Y8 Y9 Y10 Y11 Y12 Y13 Y14 Y15 Y16 Y17 Y18 Y19 Y20
Primary Drill u 3 5 5 5 5 6 6 7 7 7 7 7 7 6 6 6 5 5 3 3 0
Secondary Drill u 1 1 1 1 1 1 1 1 1 1 1 1 1 1 1 1 1 1 1 0 0
Explosive Factory Truck u 2 4 4 4 4 4 4 4 4 4 4 4 4 4 4 4 4 3 3 0 0
Rope Shovel u 1 1 1 1 2 2 2 2 2 2 2 2 2 2 2 1 1 1 1 0
Hydraulic Shovel u 2 2 2 2 2 2 2 2 2 2 2 2 2 2 2 2 2 2 1 1 1
Front-End Loader u 1 1 1 1 1 2 2 2 2 2 2 2 2 2 2 2 1 1 1 1 1
Haultruck u 9 11 11 11 11 15 15 16 18 18 22 22 24 24 24 24 24 24 15 5 3
Wheel Dozer u 3 5 5 5 5 5 5 5 5 5 5 5 5 5 5 5 4 4 3 2 2
Bulldozer u 3 5 5 5 5 5 5 5 5 5 5 5 5 5 5 5 4 4 4 2 2
Water Truck u 2 4 4 4 4 4 4 4 4 4 4 4 4 4 4 4 3 2 2 2 2
Grader u 2 2 2 2 2 2 2 2 2 2 2 2 2 2 2 2 2 2 2 2 2
Cable Handler u 1 2 2 2 2 3 3 3 3 3 3 3 3 3 3 3 2 2 2 1 1
Crane u 2 2 2 2 2 2 2 2 2 2 2 2 2 2 2 2 2 2 2 2 3
Tool Truck (Maintenance) u 8 8 8 8 8 8 8 8 8 8 8 8 8 8 8 8 8 8 8 8 9
Aquisition Schedule - Includes additions and replacements - NUMBER of UNITS
Unit Y(-3) Y(-2) Y(-1) Y1 Y2 Y3 Y4 Y5 Y6 Y7 Y8 Y9 Y10 Y11 Y12 Y13 Y14 Y15 Y16 Y17 Y18 Y19 Y20
Primary Drill u 2 1 2 1 1 2
Secondary Drill u 1 1 1
Explosive Factory Truck u 2 2 2 2 2 2
Rope Shovel u 1 1
Hydraulicl Shovel u 1 1 1
Front-End Loader u 1 1 1
Haultruck u 4 5 2 4 1 2 4 9 4 4
Wheel Dozer u 2 2 1 2 2 1
Bulldozer u 2 2 1 2 2 1
Water Truck u 1 1 2 2 2 2 2
Grader u 1 1 1 1
Cable Handler u 1 1 1 1 1
Crane u 1 1 1 1
Tool Truck (Maintenance) u 4 4 7 7

La Verde Copper Project
Equinox Gold Corp. and Solaris Copper Inc. 718017
amcconsultants.com 130
Mine personnel include staff and shift workers from Mine Operations, Mine Maintenance, Mine
Engineering and Production Geology. For shift work, four crews have been assumed to provide
continuous coverage with the first crew working on day shift, the second crew working on night
shift, and crews three and four off schedule.
Personnel are predominantly composed of Mexican nationals; expatriates have been allocated to
some key positions only. A summary of mine personnel number and average employee costs is
provided in Table 16.14.
Table 16.14 Number of employees and labour expenses
Count Yearly avg per employee costs ‘000 US$
Expatriates 3 300
Professionals & Supervisors 89 78
Tradesmen 35 25
Shift workers 377 16
Total 504 na

La Verde Copper Project
Equinox Gold Corp. and Solaris Copper Inc. 718017
amcconsultants.com 131
17 Recovery methods
17.1 Key metallurgical parameters
The key metallurgical parameters from Section 13 are shown again in Table 17.1 for ease of
reference.
These have been used in conjunction with the mine schedule to develop the production schedule
shown in Table 17.3 and to input into the key throughput parameters for equipment sizing.
Table 17.1 Metallurgical recovery and concentrate grade parameters
Metallurgical parameters
Cu Au Ag As
W Su E Su E ox W Su E Su E ox W Su E Su E ox W Su E Su E ox
Recovery 90% 90% 50% 10% 80% 75% 60% 85% 50% 20% 70% 70%
Conc. grade 26% 27.5% 29%
Summary design criteria are shown in Table 17.2.
These are based on some generic industry standards, e.g. for availabilities, the key testwork
outcomes described in Section 13, and some factors based on AMC’s experience of similar projects.
As mentioned in Section 13, note that flotation kinetics were not specifically reported in the
metallurgical testwork studies, but the residence time assumptions cited in the Table 17.2 are in
accord with the range recorded in the raw test data and, in AMC’s opinion, in line with expected
conditions for such a copper flotation circuit.
These parameters were used along with the recoveries and others from Table 17.1 to develop a
high-level mass balance. They also provided inputs for the power and water consumption
calculations presented in Section 17.5.

La Verde Copper Project
Equinox Gold Corp. and Solaris Copper Inc. 718017
amcconsultants.com 132
Table 17.2 Overall design criteria
Parameter Value
General:
Operating days p.a. 360
Availabilities:
crusher 70%
grinding / flotation 95%
Grinding:
Abrasion Index 0.134
SAG parameters:
A*b (JK) 35.7
Mia (SMC) 21.5
Feed size F80 mm 125
Product Size P80 µ 1000
Ball mill parameters:
BWI 16.2
Mib (SMC) 22.9
Feed size F80 µ 1000.0
Product Size P80 µ 220.0
Regrind parameters:
Feed size F80 µ 100.0
Product Size P80 µ 40.0
Flotation:
% solids:
roughers 33
cleaners 15
residence times (lab) mins
roughers 10
cleaners 5
scale up factor 3 x
Tailings Thickener:
% solids in underflow 60
17.2 Flowsheet
The proposed flowsheet is shown in schematic form in Figure 17.1. It is a conventional copper
concentrator flowsheet comprising crushing, grinding (SAG, Ball mill pebble crusher – SABC), and
flotation with concentrate regrind and three stages of cleaning. There will be two trains of grinding
and two rougher flotation banks followed by a common regrind and cleaner circuit.

La Verde Copper Project
Equinox Gold Corp. and Solaris Copper Inc. 718017
amcconsultants.com 133
Figure 17.1 Process flowsheet
Source: AMC
For reasons of promoting maximum settled density in the tailings storage facility, which maximizes
the storage efficiency in the face of significant challenges in identifying suitable sites and adequate
storage volume, a tailings thickener has been included in the flowsheet. This will also minimize net
water usage by reducing evaporation losses and the amount of water lock-up in the tailings solids.
In addition, following the concentrate treatment testwork reported in Section 13, partial roasting of
the concentrates for arsenic removal has been included in the flowsheet. Its general principles are
described below.
Partial roasting in fluidized bed roaster is well-established technology. The roasting principle in
general prepares concentrates for subsequent pyrometallurgical or hydrometallurgical operations
by decreasing sulphur levels, removing arsenic and antimony or rendering the concentrate
leachable. Partial roasting in particular is accomplished by controlling the access of the air to the
concentrate; a predetermined amount of sulphur is removed and only part of the iron sulphide is
oxidized although most of the volatile elements such as arsenic and antimony are removed, leaving
the copper sulphide otherwise relatively unchanged. There are operating examples in China,
Philippines and Europe and an advanced project underway with one of the major South American
copper producers.
“Fixing” the arsenic as a stable waste product is also a vital part of the process and this will be
achieved at La Verde by wet scrubbing of the roaster exhaust gases to capture the arsenic (as water
soluble arsenic trioxide) and the oxidized particulate (mainly iron oxide). The iron oxide will dissolve

La Verde Copper Project
Equinox Gold Corp. and Solaris Copper Inc. 718017
amcconsultants.com 134
in the acid scrub liquor to provide the necessary iron (minimum 4:1 Fe:As stoichiometric ratio),
along with limestone to neutralize the liquor and air oxidation, to stabilize the arsenic as hydrated
ferric arsenate (FeAsO4.2H2O; artificial scorodite). This is environmentally stable over a much wider
range of pH and oxidation potential than a calcium arsenate produced by simple neutralization with
lime. Modern flue gas treatment technology will also capture SO2 and meet any environmental
concerns regarding roasters that may have applied in the past.
The suggested partial roasting flowsheet for La Verde is shown in Figure 17.2. Typically, a partial
roaster would utilize the installation shown in the dashed-line box in order to produce arsenic
trioxide for storage. However, the electrostatic precipitator and baghouse are both capital intensive
and high maintenance unit operations and for La Verde iron stabilization of arsenic as described
above is the preferred option and the red box would be replaced by the alternative wet scrubbing
flowsheet shown.
For the purposes of this PEA, it is assumed that on-site disposal of the stable ferric arsenate is viable
although sensitivity to a potential off-site registered land-fill disposal scenario has been considered,
based on another project in Mexico known to AMC where such a scenario has been costed.
Figure 17.2 Partial roasting flowsheet
Source: AMC

La Verde Copper Project
Equinox Gold Corp. and Solaris Copper Inc. 718017
amcconsultants.com 135
17.3 Equipment sizing and description
Equipment sizing has been carried out from a combination of first principles calculations for critical
equipment such as grinding mills and flotation cells that are mineralization-specific, and benchmark
comparables for other, less critical more generic equipment. Details by section are provided below.
Crushing equipment is based on the AMC database for similar size base metal projects. Two gyratory
crushers of 60” x 89” are proposed.
Grinding is based on the SMC testwork results tabulated in Section 13 and the SMC methodology
for determining mill power requirements. A 20% allowance has been added for losses and design
margin.
From this AMC has determined that two 22 MW SAG mills (12.2 m x 6.7 m with wraparound gearless
motors) and two 15 MW ball mills are required. A single regrind mill of 2.15 MW capacity is also
indicated.
The ball mills are in closed circuit with cyclones.
Flotation circuit design and sizing is based on the maximum annual feed grade in the production
schedule (Table 17.3) of 0.59% Cu, and with a 20% margin for grade fluctuations (relevant to
cleaner circuit). Residence time assumptions have been shown in Table 17.2 and a minimum of five
cells per bank has been observed to minimize short-circuiting.
300 m3 cells have been selected for rougher-scavenger flotation (two trains of 10 cells) and 40 m3
cells for cleaning (9, 7, 5 cells for first, second, third, cleaners respectively). Note that an
opportunity exists to improve capital and power efficiency by selecting the 500 m3 cells, which have
recently been released by one of the equipment manufacturers.
No thickening or filtration testwork has been performed at this stage (typically done by vendors)
and AMC has not attempted any sizing of concentrating dewatering equipment. However, the regrind
size would indicate that a pressure filter would be required for concentrate filtration and for the
purposes of the capital cost estimate presented in chapter 21, AMC has relied on benchmark
comparables from a similar size project.
Tailings pumping is a significant item, particularly if suitable tailings storage facilities are only
available at a considerable distance. High-level pump calculations were carried out on a thickened
tails product and it was determined that a power load of approximately 7 MW would be required to
pump just over 3500 tph a distance of up to 10 km, assuming minimal elevation change to any of
a potential range of sites in the flat non-farmed land to the north-west of the project. Several
parallel pumping stations and lines (probably four) would be required.
For the purposes of this PEA the roaster was sized at 400,000 tpa concentrate feed. This was based
on two criteria, referring to the mill feed production schedule shown in Table 17.3:
• Being able to treat 80% of the average 500,000 tpa concentrate for first five years at 0.61%
As average arsenic content, with the balance being for direct sales at approximately 0.5% As.
• Not being over-sized for the balance of the mine life where all concentrates need to be roasted
(average 1.4% As) and tonnage only rarely exceeds 400,000 tpa by a significant amount.
Clearly this is an item for further optimization at the next stage of study when more detailed
production schedules are available, based on the additional geometallurgical variability information
that will be generated from the testwork already recommended.

La Verde Copper Project
Equinox Gold Corp. and Solaris Copper Inc. 718017
amcconsultants.com 136
17.4 Conceptual production schedule
The conceptual mill feed schedule is presented in Table 17.3. The conceptual mine schedule
described in Section 16 was derived not only with an elevated cut-off grade strategy to maximize
early cash flow and project NPV but also with the arsenic recovery data, smelter penalties (these
are especially penurious above 1% As in the concentrate) and the cost of roasting built into the NSR
values in the block model.
The recoveries and grades for the main mineralization types were applied to the mine schedule by
individual mineralization type and the schedule represents the blended feed.
The pit optimization exercise was a good example of how combining the usual grade parameters
with downstream metallurgical parameters facilitated selective mining of lower arsenic content
material to meet desired concentrate specifications.
Table 17.3 Conceptual mill concentrates and recoveries
17.5 Process inputs
The key process inputs for a large low grade project of this nature are power and water.
Power demand was estimated from first principle calculations for grinding and flotation and using
vendor data for flotation cells. Grinding and flotation typically account for over 60% of the total
power usage in a concentrator. Power requirements for ancillary equipment and services were
estimated by a factoring approach. Because the tailings pumping power would be a function of the
tailings storage facility location, this component was separately calculated as described earlier so it
could be varied if necessary.
Concentrate
Period Produced Cu Au Ag As Cu Au Ag As
000 Tonnes % g/t g/t g/t % g/t g/t g/t
1 480 27.5 4.20 194 0.70 83.6% 78.6% 77.2% 55.4%
2 540 26.8 1.41 151 0.78 90.0% 74.0% 80.0% 38.6%
3 573 26.4 0.64 92 0.56 89.8% 62.6% 72.0% 26.2%
4 516 26.4 0.89 101 0.47 89.4% 69.1% 70.9% 25.2%
5 429 26.3 0.94 98 0.53 87.8% 67.5% 66.0% 24.5%
6 329 27.4 2.90 184 1.29 90.0% 79.6% 84.1% 64.1%
7 428 27.1 3.77 240 3.40 90.0% 79.0% 82.5% 64.3%
8 408 26.3 0.82 101 0.69 89.8% 65.9% 67.4% 27.5%
9 440 26.4 1.26 104 0.80 90.0% 72.1% 72.9% 40.0%
10 360 26.7 2.83 143 1.03 89.0% 76.1% 76.5% 42.2%
11 355 26.6 1.97 122 0.96 89.9% 74.7% 74.0% 38.5%
12 269 26.8 2.33 144 1.40 88.7% 73.4% 75.4% 43.7%
13 189 26.8 2.89 164 1.32 89.0% 73.8% 74.6% 30.1%
14 220 26.7 2.69 160 1.08 90.0% 73.8% 74.0% 34.1%
15 261 26.6 2.07 153 1.33 89.9% 73.5% 74.7% 38.8%
16 330 26.8 3.42 167 1.78 89.5% 77.6% 78.4% 51.5%
17 350 26.6 2.26 136 1.75 90.0% 74.6% 76.0% 52.4%
18 419 26.6 1.49 133 1.21 90.0% 71.4% 76.2% 48.3%
19 187 26.3 0.87 161 1.37 89.9% 53.4% 65.8% 22.1%
20 89 27.6 5.41 211 0.98 83.7% 79.3% 81.4% 55.9%
Totals 7169 26.7 2.05 142 1.12 89.1% 74.6% 75.6% 41.6%
Concentrate Grades Recoveries

La Verde Copper Project
Equinox Gold Corp. and Solaris Copper Inc. 718017
amcconsultants.com 137
Total power demand amounted to 120 MW drawn, of which 7 MW was for tailings, assuming a
pumping distance of 10 km. This total demand translated to 33 kWh/t in unit power consumption
terms.
With a tailings thickener included in the flowsheet, it was assumed that recovery of water from the
thickened material in the tailings storage facility would be negligible and, therefore, assuming no
other significant losses, the net water consumption would equal the water contained in the thickener
underflow. This amounts to 0.65 m3/T of feed or 19.5 million m3 of water per annum.
Other significant process inputs are grinding steel and reagents / consumables. Grinding steel was
estimated from the abrasion index derived in the comminution testwork to be 1.2 kg/tonne of mill
feed. Overall flotation reagent consumption was estimated at 0.1 kg/tonne, typical of a simple
copper flotation circuit.
These power, steel and reagent unit consumption figures provided the basis for the operating costs
tabulated in Section 21.

La Verde Copper Project
Equinox Gold Corp. and Solaris Copper Inc. 718017
amcconsultants.com 138
18 Project infrastructure
18.1 Tailings disposal
As indicated in Table 17.3, 587.6 million tonnes will be processed through the mine life. Using an
estimate of 1.6 tonne / cubic meter for the settled density of tailings — and neglecting the mass
recovered as concentrate — there is a requirement of 367 million cubic meters for storage of all the
tailings for the LOM.
From a purely engineering and conceptual perspective a series of narrow valleys located around the
property have initially been considered for this disposal. For the purpose of advancing this study,
AMC and Lowell Copper have agreed that these narrow valleys can reasonably be considered as the
closest technically feasible and economically convenient location for the TMF. AMC and Lowell
Copper understand that a full process of consultation with local communities and authorities will be
required to assess all the TMF options outlined in the study. Additionally, AMC notes that Lowell
copper does not own the land required for this intended use.
Preliminary estimations indicate that a total storage capacity of 150 Mm3 is achievable with
construction of six dams.
Figure 18.1 shows one of the possible locations of the proposed six dams in relation to the mine
site.
Figure 18.1 Proposed TMF and mine site
Source: AMC
The capacities of these six dams are shown in Figure 18.2.

La Verde Copper Project
Equinox Gold Corp. and Solaris Copper Inc. 718017
amcconsultants.com 139
Figure 18.2 TMF dam system and capacities
Source: AMC
This storage capacity is not sufficient for the LOM. An additional 217 M m3 would be needed and
therefore other options have to be investigated. Currently the most obvious option is the extension
of valleys further to the north-west as shown in Figure 18.3.
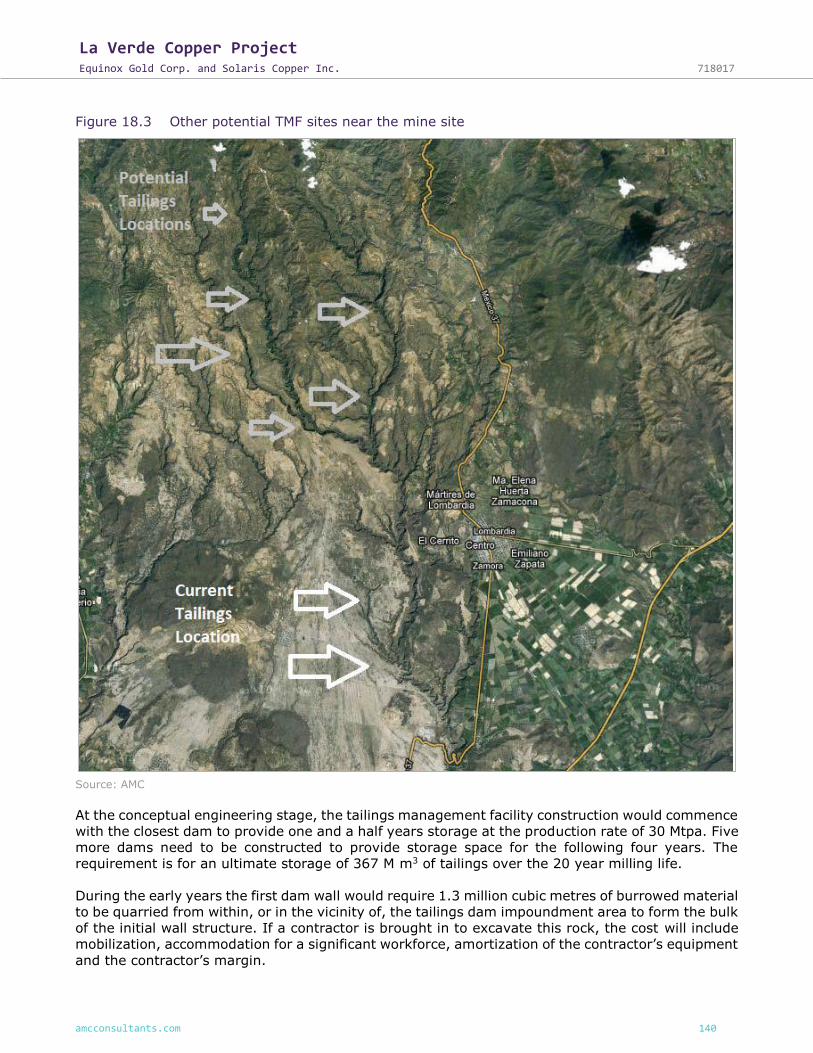
La Verde Copper Project
Equinox Gold Corp. and Solaris Copper Inc. 718017
amcconsultants.com 140
Figure 18.3 Other potential TMF sites near the mine site
Source: AMC
At the conceptual engineering stage, the tailings management facility construction would commence
with the closest dam to provide one and a half years storage at the production rate of 30 Mtpa. Five
more dams need to be constructed to provide storage space for the following four years. The
requirement is for an ultimate storage of 367 M m3 of tailings over the 20 year milling life.
During the early years the first dam wall would require 1.3 million cubic metres of burrowed material
to be quarried from within, or in the vicinity of, the tailings dam impoundment area to form the bulk
of the initial wall structure. If a contractor is brought in to excavate this rock, the cost will include
mobilization, accommodation for a significant workforce, amortization of the contractor’s equipment
and the contractor’s margin.

La Verde Copper Project
Equinox Gold Corp. and Solaris Copper Inc. 718017
amcconsultants.com 141
18.1.1 Design basis and operating criteria
The principal objective of the design and operation of the TMF is to ensure secure containment for
tailings solids and impounded process water. The TMF would serve as the primary water
management facility for the project, providing a buffering volume for the mill process water
demands, as well as collecting and storing the necessary quantities of precipitation and runoff.
The total tailings production is assumed to be about 82,200 t/d, or 100% of the milled mineralized
rock. Tailings from the mill would be discharged to the TMF as a slurry at an average unthickened
solids content of approximately 35% (by weight).
The initial six TMF dams are sized to store the estimated volume of tailings produced in the first
eight years of mill operation (240 million tonnes). There will be a need for one or several more
dams to store the estimated total of 367 Mm3 of tailings over the 20 year milling life.
The topography is not favourable to yield a relatively large storage volume as compared with the
quantity of material required for embankment construction. As a result, TMF capital costs can be
high. In the initial capital only the first six dams have been considered.
18.1.2 Tailings management facility embankments
The first TMF embankment would be raised in the NW of the site, more embankments would be
constructed upstream of the first with each embankment providing the required capacity for that
particular period until the next embankment is completed, while always maintaining minimum storm
water storage, wave run-up, and freeboard requirements. It is expected that the construction design
of the embankments would be reviewed annually and refined as required, to accommodate the
availability of construction materials and to incorporate experience gained with local conditions and
constraints.
Small temporary coffer dams would be constructed for each embankment upstream of the main
TMF embankment footprint. These dams would allow the TMF dam foundation area to be dewatered,
cleared, and stripped prior to preparation for construction of the embankment.
A network of 150 mm-diameter perforated high-density polyethylene (HDPE) interceptor pipes
placed in a dendritic or herringbone pattern would underlie each dam foundation. The drains would
be surrounded by appropriate filter and drainage materials. The individual interceptor drains would
connect to 300 mm diameter HDPE main collector pipes to transport seepage to recycle ponds
located at the topographic low points below each embankment. The underdrain network would be
expanded as the staged embankments are constructed. They would also provide foundation
dewatering during initial construction.
Each dam has a minimum horizontal width of 15 m to allow placement of burrow material by the
required fleet. Rock would be dumped, spread, and compacted to the specified density. All
embankments would have a minimum final crest width of 15 m to allow for vehicle access and
pipelines. The dams would be designed as water retaining structures to allow the supernatant pond
to submerge the tailings beaches to the extent possible. A central low-permeability core zone would
provide a positive hydraulic cut-off in the dam. Appropriate filter zones would be placed downstream
of the low-permeability core. It is envisaged that these would be constructed by a specialized
contractor using locally sourced borrow material. Ongoing construction of the dam shell zone would
make use of suitable low-sulphur, geochemically innocuous rock from the area. The shell zones
would need to be constructed prior to beginning work on the crest, core, and filter zones to allow
access for equipment. Geomechanical waste rock characterizations are needed to confirm that this
is technically and economically feasible.

La Verde Copper Project
Equinox Gold Corp. and Solaris Copper Inc. 718017
amcconsultants.com 142
18.1.3 Mill tailings transport and deposition system
The tailings transport system would be constructed in stages throughout the life of the project.
Tailings would initially be pumped from the mill directly to the main TMF embankment through a
560 mm-diameter rubber lined steel pipeline; a 560 mm-diameter HDPE pipeline would be used to
distribute tailings to off takes located along the embankment.
18.1.4 Reclaim water system
The reclaim water system would comprise both pumped and gravity flow components. Supernatant
reclaim water from the TMF would be pumped over the dam to a head tank directly above the mill
site at an elevation of roughly 700 m.
Reclaim pumps can be mounted on a floating barge in the TMF supernatant pond and would operate
on level control from the head tank.
18.2 Waste rock storage (reactive and non-reactive)
Conceptually, waste dumps would be located on the south and east side of the pits as shown on the
site plan, Figure 18.1.
A ditch and pumping system is required to collect and transport any run-off from the waste pile to
the water treatment plant or mill.
18.3 Mill feed stockpiles
Mill feed stockpiles are proposed to be on the north side of the pits as shown on the site plan, Figure
18.1 with the main stockpile area on the West side of the process plant.
18.4 Irrigation channel
An irrigation channel runs in a NE to SW direction by the proposed process plant site. It is
recommended that the course of this waterway would stay as is. Capital funds have instead been
allotted to channel the water in a culvert to allow for traffic movement over the channel. Lowell
copper envisages that any action concerning this channel is subject to engagement with the
communities and government.
18.5 Access roads
Two paved highways provide access to the Property including the new Morelia-Lazaro Cárdenas
Autopista (toll road) and the original Lombardia-Nueva Italia highway (Mexico Highway 37) (Figure
18.4). Within the Property there are a series of all-weather dirt roads and old drill roads.
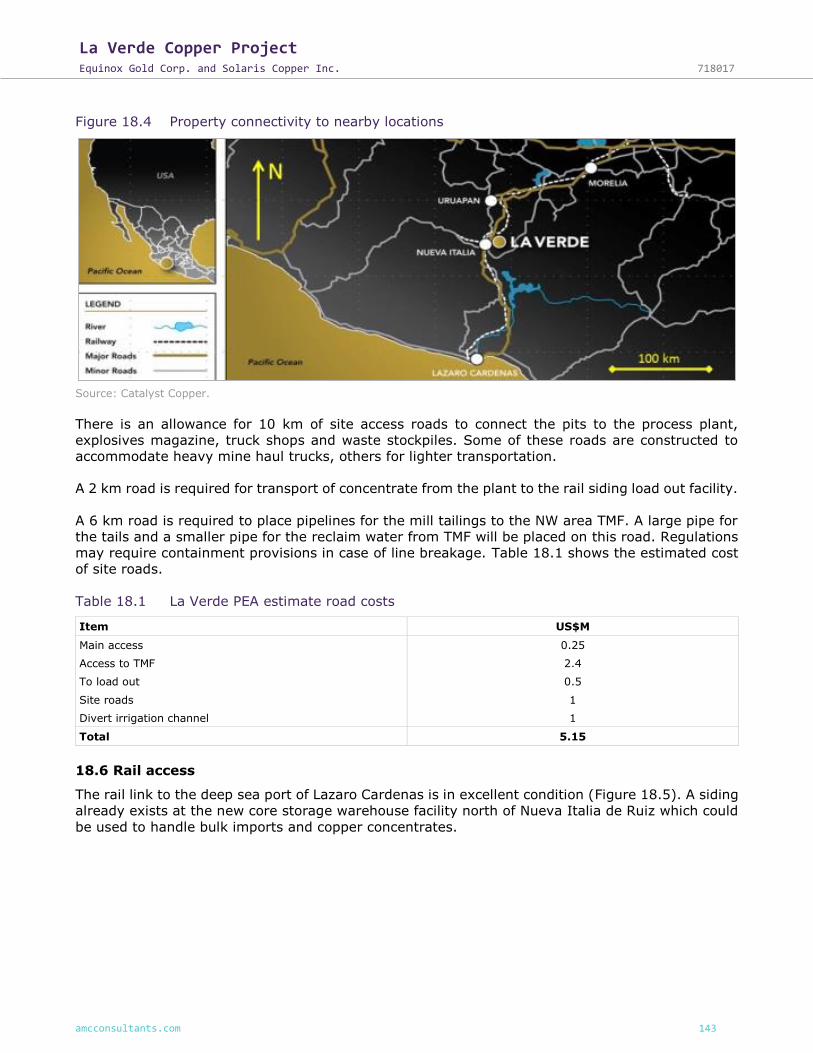
La Verde Copper Project
Equinox Gold Corp. and Solaris Copper Inc. 718017
amcconsultants.com 143
Figure 18.4 Property connectivity to nearby locations
Source: Catalyst Copper.
There is an allowance for 10 km of site access roads to connect the pits to the process plant,
explosives magazine, truck shops and waste stockpiles. Some of these roads are constructed to
accommodate heavy mine haul trucks, others for lighter transportation.
A 2 km road is required for transport of concentrate from the plant to the rail siding load out facility.
A 6 km road is required to place pipelines for the mill tailings to the NW area TMF. A large pipe for
the tails and a smaller pipe for the reclaim water from TMF will be placed on this road. Regulations
may require containment provisions in case of line breakage. Table 18.1 shows the estimated cost
of site roads.
Table 18.1 La Verde PEA estimate road costs
Item US$M
Main access 0.25
Access to TMF 2.4
To load out 0.5
Site roads 1
Divert irrigation channel 1
Total 5.15
18.6 Rail access
The rail link to the deep sea port of Lazaro Cardenas is in excellent condition (Figure 18.5). A siding
already exists at the new core storage warehouse facility north of Nueva Italia de Ruiz which could
be used to handle bulk imports and copper concentrates.
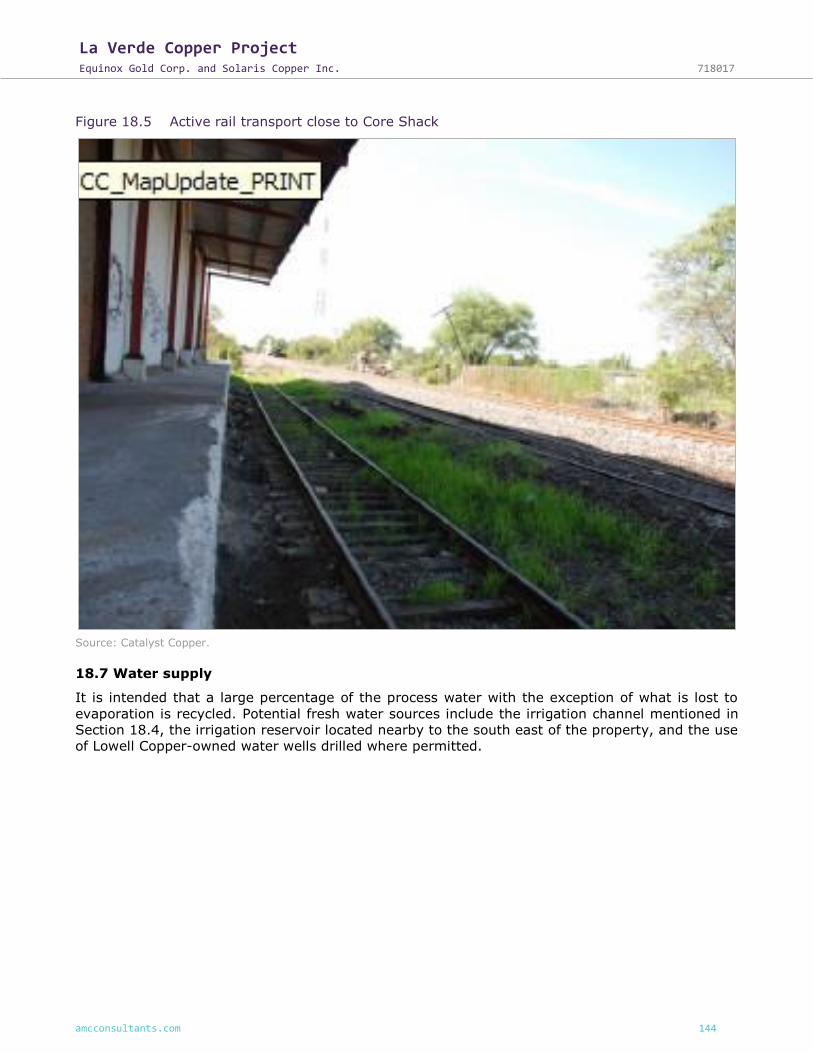
La Verde Copper Project
Equinox Gold Corp. and Solaris Copper Inc. 718017
amcconsultants.com 144
Figure 18.5 Active rail transport close to Core Shack
Source: Catalyst Copper.
18.7 Water supply
It is intended that a large percentage of the process water with the exception of what is lost to
evaporation is recycled. Potential fresh water sources include the irrigation channel mentioned in
Section 18.4, the irrigation reservoir located nearby to the south east of the property, and the use
of Lowell Copper-owned water wells drilled where permitted.

La Verde Copper Project
Equinox Gold Corp. and Solaris Copper Inc. 718017
amcconsultants.com 145
Figure 18.6 Irrigation channel close to the proposed mill site
Source: Catalyst Copper.
18.8 Power
The overall power demand for the operation has been estimated at 145 MW. The main user of power
is the process plant.
There are several high-tension electrical lines (66 kVA) within 5 km of the Project. The client
indicates that Mexican power authority CFE would have sufficient capacity for La Verde operations.
Figure 18.7 shows a typical high tension transmission line in the vicinity of the mine site.
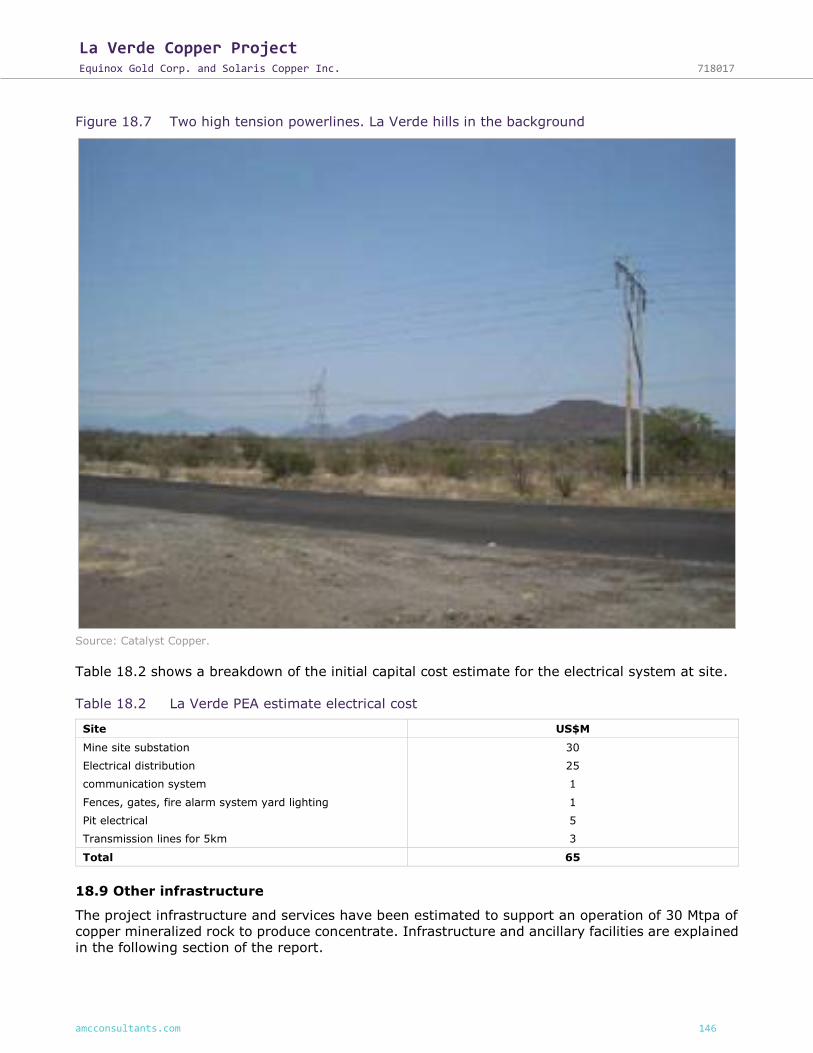
La Verde Copper Project
Equinox Gold Corp. and Solaris Copper Inc. 718017
amcconsultants.com 146
Figure 18.7 Two high tension powerlines. La Verde hills in the background
Source: Catalyst Copper.
Table 18.2 shows a breakdown of the initial capital cost estimate for the electrical system at site.
Table 18.2 La Verde PEA estimate electrical cost
Site US$M
Mine site substation 30
Electrical distribution 25
communication system 1
Fences, gates, fire alarm system yard lighting 1
Pit electrical 5
Transmission lines for 5km 3
Total 65
18.9 Other infrastructure
The project infrastructure and services have been estimated to support an operation of 30 Mtpa of
copper mineralized rock to produce concentrate. Infrastructure and ancillary facilities are explained
in the following section of the report.

La Verde Copper Project
Equinox Gold Corp. and Solaris Copper Inc. 718017
amcconsultants.com 147
Careful attention was given to the placement of the facilities in order to minimize the overall
footprint and required excavation. The layout as a whole takes advantage of the natural slope in
the area and availability of services.
Table 18.3 shows the estimated cost of other infrastructure.
Table 18.3 La Verde PEA estimate for other infrastructure costs
Item US$M
Concentrate rail load-out facility 6
Construction camp 10
Offices include lockers, first aid 2
Truck shop, tools and lube oil 7
Warehouse 1
Lab and equipment 1
Fuel storage 1
Explosives magazine 1
Site prep 25
Total 54
18.9.1 Equipment lay down area
No open area storage area has been specifically allocated; however, there is area within the plant
site that could be fenced off to provide extra storage for equipment and materials, if required.
18.9.2 Loading and unloading facilities
A truck load-out facility will be required at the process plant for loading of concentrate. It is
anticipated that the concentrate will be trucked to the railhead 1.5 km NW of the plant where a
siding is in existence. An unloading facility for trucks and load-out onto the rail cars will be required
at this site.
18.9.3 Water treatment plant
Reclaim water from the TMF and any water collected from the waste and mill feed stockpiles and
effluent from the offices, truck shop and warehouse will be treated prior to use in the plant or
discharge in the environment.
18.9.4 Communications
The site communications systems will be supplied as a design build package and the scope defined
in future project phases.
18.9.5 Port facilities
The port of Lazaro Cardenas is approximately 200 km south west of the mine site. This port has rail
unloading and ship loading facilities.
18.9.6 Camp and housing
A construction camp will be required during the early days of the project. Upon commissioning, it is
anticipated that the workforce will be living in the many communities that are in the vicinity of the
mine site.

La Verde Copper Project
Equinox Gold Corp. and Solaris Copper Inc. 718017
amcconsultants.com 148
There are provisions for a modularized structure construction camp in the capital estimate. At a
later stage this structure can be converted into either offices or a temporary or permanent
accommodation facility for the workforce. The construction camp is located at the plant site.
18.9.7 Administration offices training room
The administration building will be a modularized structure that will provide working space for
management, supervision, geology, engineering, and other operations support staff.
18.9.8 Maintenance workshops and warehouse building
A stick-built maintenance / warehouse facility will be provided to service the mobile equipment and
for storage of equipment spares. One repair bay will be provided for servicing light vehicles, which
will also be used for tune-ups. Small tools and equipment will be provided. A waste oil system,
exhaust system, lube-oil system, water system, small machine shop and equipment, and welding
bay will be included.
The maintenance area will be equipped with a crane. The warehouse area will be sized to
accommodate process materials and the maintenance shop supplies.
18.9.9 Mine dry (change rooms)
A separate mine dry facility, including lockers and shower facilities, will be provided. The mine dry
will be a modularized structure located at the plant site.
18.9.10 Laboratories
An assay laboratory will be located in a separate modular building as part of the mill building. The
laboratory will be a single-storey structure equipped to perform daily analyses of mine and process
samples.
18.9.11 Security and guardhouse
A security / gatehouse will be located on the site access road at the plant site. The access road at
Highway 37 will have a manual gate with signage indicating that they are now entering private
property.
18.9.12 Medical / ambulance / first aid / mine rescue facilities
Due to proximity of the mine site to several communities, it is envisaged that only basic medical
and first aid facilities would be required to stabilize any injuries for transport to local hospitals.
18.9.13 Truck shop
The truck shop building will be a pre-engineered building, with an overhead clearance of at least
10 m. The building will be designed to provide facilities for maintenance and repair, minor office
space, clean and dry areas, and general storage. It will be at the plant site near the mining haul
road. The truck shop will house two maintenance bays, one light vehicle repair bay, a welding and
machine shop, and an electrical and instrument shop. The truck wash and tire change building are
included within the truck shop. The building will contain a wash bay, maintenance bay, tool crib,
compressor room, hot water pressure system, tire change, and an oil separator. Waste oil will be
disposed of in the refuse incinerator with any remaining oil removed and discarded at an approved
facility.
18.9.14 Explosives magazine
The explosives magazine is located within the mine property, south west of the West Hill pit.

La Verde Copper Project
Equinox Gold Corp. and Solaris Copper Inc. 718017
amcconsultants.com 149
18.9.15 Fuel storage and distribution systems
An area has been designated near the truck shop for the storage and dispensing of fuel. The fuel
storage and dispensing facility will include a lined containment area so that spills are confined and
can readily be cleaned, and so that the need for extensive and costly remediation work can be
avoided during site closure.
Diesel fuel will be required for the non-electrical mobile mine equipment, some small trucks, and
surface vehicles. The pumping station allows for re-fuelling of both light vehicles and heavy-duty
mining equipment.

La Verde Copper Project
Equinox Gold Corp. and Solaris Copper Inc. 718017
amcconsultants.com 150
19 Market studies and contracts
19.1 Concentrate marketing
Although at this early stage in the project no smelter contracts have been put in place, the crucial
importance of the arsenic levels in concentrates has been well recognized, as has already been
discussed.
Globally there is a trend towards higher arsenic levels in copper concentrates, while on the other
hand smelting capacity for arsenic-bearing materials is decreasing. Hence there is once again a
strong interest in potential hydrometallurgical routes for treating high arsenic concentrates as well
as traditional roaster routes, albeit with attendant environmental issues.
Specialist in high arsenic concentrate smelters like Dundee Metal’s Tsumeb smelter in Namibia
specialize in concentrates with levels of 5% As, higher than La Verde’s under any circumstances
unless a differential float to produce a high arsenic concentrate was carried out. This route is not
considered any further at this stage, although it remains an option for further study.
In the “normal” copper concentrate market, “clean” concentrates are those with less than 0.1% As,
penalties typically commence at 0.3% As and “dirty” concentrates used to be considered as
containing greater than 1% As with 2% As as an absolute limit. However, the closure of several
smelters capable of treating such dirty concentrates has squeezed the market significantly and most
of these dirty concentrates are treated in only one country, China.
Although Chinese smelters treat domestic concentrates with 2 – 3% As, there is a limit imposed on
imported base metal concentrates of 0.5% As. Marketing concentrates through the large global
concentrate traders does offer some blending opportunities; however, 0.5% As is the new target
maximum, especially for a large volume producer like La Verde where the large volumes limit
blending options.
AMC has based its analysis of La Verde concentrate options on the following premises:
• Current benchmark smelter TC/RC terms for “clean” (<0.3% As) concentrates of 70/7 i.e.
$70/t for TC, 7c/lb Cu for RC.
• Normal As penalties applying ($3/t per 0.1% As > 0.3% As) up to 1% As.
• An additional $20/T TC applied for concentrates >0.5% As to allow for storage and blending
costs through a concentrate trade (based on a recent example in Mexico).
• Much increased TC’s for concentrates > 1% As (additional $100/t plus up to $5/t per 0.01%
As, also based on a recent example in Mexico), reflecting acute difficulties in securing sales.

La Verde Copper Project
Equinox Gold Corp. and Solaris Copper Inc. 718017
amcconsultants.com 151
20 Environmental studies, permitting and social or community impact
Due to the early stage of the La Verde copper project development Lowell Copper has not yet
implemented any formal environmental and community impact evaluation programs. Accordingly,
no specific report has been made available to AMC for review. Following are some AMC’s
environmental and communities-related considerations contained in this study.
20.1 Environmental and communities’ considerations included in this study
AMC envisages that the three most significant areas of environmental impact of this Project are:
the two pits, the waste dumps and mill feed stockpiles, and the tailings management facilities. This
study principally focuses on the technical and economic viability of the project, emphasizing the
engineering point of view. AMC and Lowell Copper understand that the actual viability of the
technical solutions proposed for the mine, the dumps and the TMF need to be assessed with the
communities and the corresponding permits and social licences are required. In the
Recommendations, AMC states the need for an early assessment of various specific environmental
/ social features of the Project should it be moved to more advanced stages.
20.1.1 The mine pits
By the natural location of the deposit, most of the land comprised within the pit rims corresponds
to wild vegetation areas, currently with no agricultural or pasture use. Also, preliminary observation
does not reveal the existence of any site regularly used by the communities inside the pit rims
perimeters.
20.1.2 Waste dumps and stockpiles
A surrounding belt of massive rock storage facilities is included in the study (see Figure 16.4). Most
of waste has been scheduled to be left on East and South dumps whereas two stockpiles are
developed on the North side on each flank of the concentrator site. Both stockpiles will grow during
the first half of the mine life to be completely reclaimed by the end of the mine life.
Both proposed waste dumps and stockpiles make extensive use of current agricultural land. This
aspect will need to be consulted with the involved communities.
An opportunity of reducing the footprint of waste dumps and stockpiles may be available as most
of the proposed designs have spare capacity on top. Further trade-off mining studies can examine
this option.
As shown is Sections 18 and 21, waste dumps remediation is considered in the present study.
20.1.3 Tailings management facilities
Among other options reviewed, the valleys to the NW of project have been suggested for tailings
disposal. Proximity to plant site is the main reason for this choice. One valley is dry during the non-
rainy season. Provisions for the east valley that may contain water most of the year is to allow the
water un-interrupted flow via culverts under the tailings.
Currently, it is observed that there is minimal vegetation or agricultural use around these valleys,
as such the impact of tailings disposal would be minimized. Notwithstanding, Lowell Copper is
committed to carry on appropriate environmental and community surveys before making any final
planning for tailings disposal.
At closure, there are provisions in the budget to rehabilitate these impoundments by covering them
with top soil from the vicinity.

La Verde Copper Project
Equinox Gold Corp. and Solaris Copper Inc. 718017
amcconsultants.com 152
21 Capital and operating costs
21.1 Mining capital and operating costs
21.1.1 Operating costs
An indicative operating cost model has been used to estimate total and unit mining cost for the La
Verde Project. Mining costs at La Verde are mostly driven by the haulage cost. During the first half
of the mine life haulage distances are shorter and, accordingly, haulage is comparatively cheaper.
From years 11 to 19 haulage cost markedly increases due to the deeper source of ex-pit rock. Table
21.1 provides indicative estimates of the unit mining cost per year.
Table 21.1 Indicative mining total and unit costs
21.1.2 Capital cost
Mine capital costs are mostly comprised of mobile equipment. Maintenance buildings and mine
electric grid are included under Infrastructure. Estimated total initial capital for the mine, including
mobile equipment and first fills, amounts to US$134.5M. Table 21.2 gives the amount of capital per
year, including the initial capital spent in years Y(-3) to Y(-1). This includes mine operation and
mobile equipment maintenance, major repairs for bigger mine equipment (shovels and drills), and
ancillary.
Y(-3) Y(-2) Y(-1) Y1 Y2 Y3 Y4 Y5 Y6 to Y10 Y11 to Y15 Y16 to Y20 LOM
unit
Ex-Pit Tons Mt 65.0 95.0 95.0 95.0 95.0 120.0 600.0 575.0 198.1 1938.1
From Stocks Tons Mt 0.0 6.2 0.0 0.0 2.4 6.6 5.9 43.9 50.7 115.8
Total Moved Tons Mt 65.0 101.2 95.0 95.0 97.4 126.6 605.9 618.9 248.8 2053.8
Drilling MUS$ 7.4 13.0 13.2 13.3 13.1 15.7 80.2 76.9 31.7 264.6
Blasting MUS$ 12.3 20.7 22.0 22.2 21.0 24.1 120.7 113.5 44.6 401.2
Loading MUS$ 15.9 22.4 21.7 21.9 21.6 30.0 146.8 148.4 79.9 508.6
Haulage MUS$ 14.5 20.9 20.6 20.0 24.0 40.9 264.5 765.6 417.3 1588.2
Support Equipment MUS$ 10.4 16.9 16.9 16.9 16.9 16.9 84.3 83.6 47.5 310.2
Mine Eng. & Geology MUS$ 3.5 3.5 3.5 3.5 3.7 3.7 18.4 18.4 18.1 76.5
Maintenance G&A + Shops MUS$ 8.2 8.2 8.2 8.2 8.2 8.2 40.8 40.8 33.0 163.4
Mine G&A MUS$ 4.7 4.7 4.7 4.7 4.7 4.7 23.4 23.3 19.8 94.6
Total MUS$ 76.8 110.2 110.8 110.7 113.1 144.1 779.1 1270.6 691.8 3407.2
Unit cost , US$ / moved tonne
Drilling US$/t 0.11 0.13 0.14 0.14 0.13 0.12 0.13 0.12 0.13 0.13
Blasting US$/t 0.19 0.20 0.23 0.23 0.22 0.19 0.20 0.18 0.18 0.20
Loading US$/t 0.24 0.22 0.23 0.23 0.22 0.24 0.24 0.24 0.32 0.25
Haulage US$/t 0.22 0.21 0.22 0.21 0.25 0.32 0.44 1.24 1.68 0.77
Support Equipment US$/t 0.16 0.17 0.18 0.18 0.17 0.13 0.14 0.14 0.19 0.15
Mine Eng. & Geology US$/t 0.05 0.04 0.04 0.04 0.04 0.03 0.03 0.03 0.07 0.04
Maintenance G&A + Shops US$/t 0.13 0.08 0.09 0.09 0.08 0.06 0.07 0.07 0.13 0.08
Mine G&A US$/t 0.07 0.05 0.05 0.05 0.05 0.04 0.04 0.04 0.08 0.05
Total US$/t 1.18 1.09 1.17 1.17 1.16 1.14 1.29 2.05 2.78 1.66
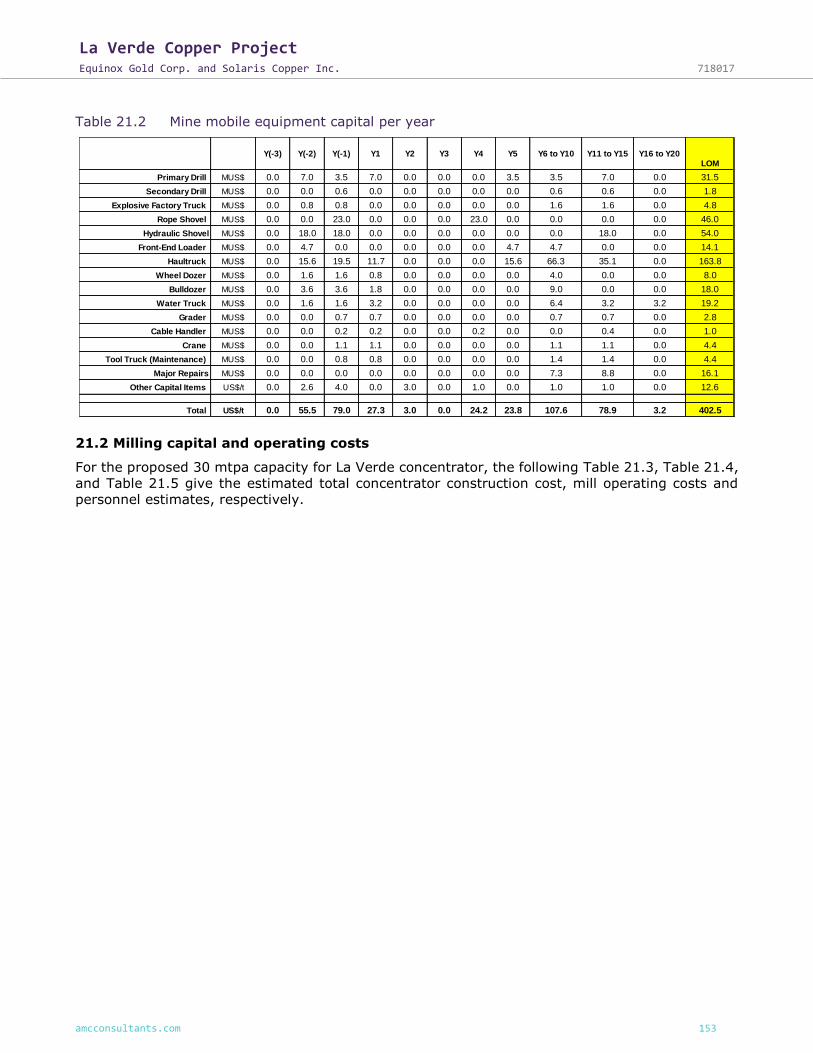
La Verde Copper Project
Equinox Gold Corp. and Solaris Copper Inc. 718017
amcconsultants.com 153
Table 21.2 Mine mobile equipment capital per year
21.2 Milling capital and operating costs
For the proposed 30 mtpa capacity for La Verde concentrator, the following Table 21.3, Table 21.4,
and Table 21.5 give the estimated total concentrator construction cost, mill operating costs and
personnel estimates, respectively.
Y(-3) Y(-2) Y(-1) Y1 Y2 Y3 Y4 Y5 Y6 to Y10 Y11 to Y15 Y16 to Y20LOM
Primary Drill MUS$ 0.0 7.0 3.5 7.0 0.0 0.0 0.0 3.5 3.5 7.0 0.0 31.5
Secondary Drill MUS$ 0.0 0.0 0.6 0.0 0.0 0.0 0.0 0.0 0.6 0.6 0.0 1.8
Explosive Factory Truck MUS$ 0.0 0.8 0.8 0.0 0.0 0.0 0.0 0.0 1.6 1.6 0.0 4.8
Rope Shovel MUS$ 0.0 0.0 23.0 0.0 0.0 0.0 23.0 0.0 0.0 0.0 0.0 46.0
Hydraulic Shovel MUS$ 0.0 18.0 18.0 0.0 0.0 0.0 0.0 0.0 0.0 18.0 0.0 54.0
Front-End Loader MUS$ 0.0 4.7 0.0 0.0 0.0 0.0 0.0 4.7 4.7 0.0 0.0 14.1
Haultruck MUS$ 0.0 15.6 19.5 11.7 0.0 0.0 0.0 15.6 66.3 35.1 0.0 163.8
Wheel Dozer MUS$ 0.0 1.6 1.6 0.8 0.0 0.0 0.0 0.0 4.0 0.0 0.0 8.0
Bulldozer MUS$ 0.0 3.6 3.6 1.8 0.0 0.0 0.0 0.0 9.0 0.0 0.0 18.0
Water Truck MUS$ 0.0 1.6 1.6 3.2 0.0 0.0 0.0 0.0 6.4 3.2 3.2 19.2
Grader MUS$ 0.0 0.0 0.7 0.7 0.0 0.0 0.0 0.0 0.7 0.7 0.0 2.8
Cable Handler MUS$ 0.0 0.0 0.2 0.2 0.0 0.0 0.2 0.0 0.0 0.4 0.0 1.0
Crane MUS$ 0.0 0.0 1.1 1.1 0.0 0.0 0.0 0.0 1.1 1.1 0.0 4.4
Tool Truck (Maintenance) MUS$ 0.0 0.0 0.8 0.8 0.0 0.0 0.0 0.0 1.4 1.4 0.0 4.4
Major Repairs MUS$ 0.0 0.0 0.0 0.0 0.0 0.0 0.0 0.0 7.3 8.8 0.0 16.1
Other Capital Items US$/t 0.0 2.6 4.0 0.0 3.0 0.0 1.0 0.0 1.0 1.0 0.0 12.6
Total US$/t 0.0 55.5 79.0 27.3 3.0 0.0 24.2 23.8 107.6 78.9 3.2 402.5
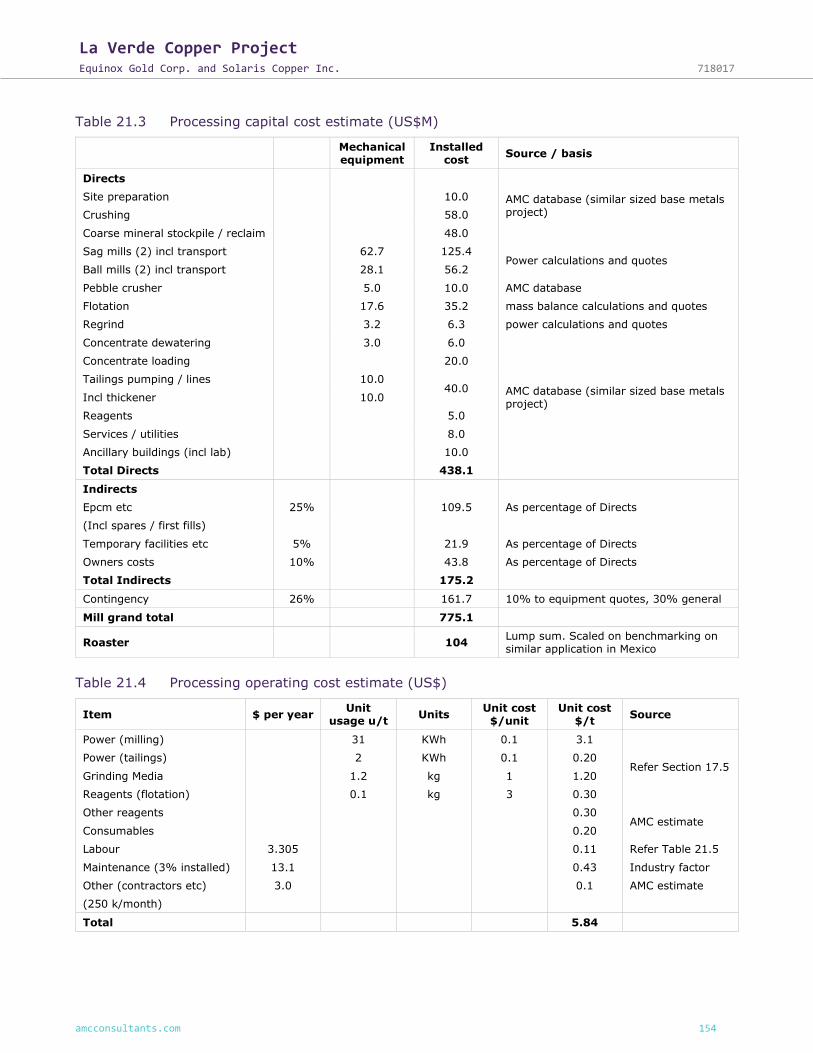
La Verde Copper Project
Equinox Gold Corp. and Solaris Copper Inc. 718017
amcconsultants.com 154
Table 21.3 Processing capital cost estimate (US$M)
Mechanical equipment
Installed cost
Source / basis
Directs
AMC database (similar sized base metals project)
Site preparation 10.0
Crushing 58.0
Coarse mineral stockpile / reclaim 48.0
Sag mills (2) incl transport 62.7 125.4 Power calculations and quotes
Ball mills (2) incl transport 28.1 56.2
Pebble crusher 5.0 10.0 AMC database
Flotation 17.6 35.2 mass balance calculations and quotes
Regrind 3.2 6.3 power calculations and quotes
Concentrate dewatering 3.0 6.0
AMC database (similar sized base metals project)
Concentrate loading 20.0
Tailings pumping / lines 10.0 40.0
Incl thickener 10.0
Reagents 5.0
Services / utilities 8.0
Ancillary buildings (incl lab) 10.0
Total Directs 438.1
Indirects
Epcm etc 25% 109.5 As percentage of Directs
(Incl spares / first fills)
Temporary facilities etc 5% 21.9 As percentage of Directs
Owners costs 10% 43.8 As percentage of Directs
Total Indirects 175.2
Contingency 26% 161.7 10% to equipment quotes, 30% general
Mill grand total 775.1
Roaster 104 Lump sum. Scaled on benchmarking on similar application in Mexico
Table 21.4 Processing operating cost estimate (US$)
Item $ per year Unit
usage u/t Units
Unit cost $/unit
Unit cost $/t
Source
Power (milling) 31 KWh 0.1 3.1
Refer Section 17.5 Power (tailings) 2 KWh 0.1 0.20
Grinding Media 1.2 kg 1 1.20
Reagents (flotation) 0.1 kg 3 0.30
Other reagents 0.30 AMC estimate
Consumables 0.20
Labour 3.305 0.11 Refer Table 21.5
Maintenance (3% installed) 13.1 0.43 Industry factor
Other (contractors etc) 3.0 0.1 AMC estimate
(250 k/month)
Total 5.84

La Verde Copper Project
Equinox Gold Corp. and Solaris Copper Inc. 718017
amcconsultants.com 155
Note that the power cost estimate of $0.1/kWh has been confirmed as a reasonable estimate for
Mexican grid power and reinforces the recommendation regarding a trade-off study for high
pressure grinding rolls as an alternative to SAG milling to reduce power consumption.
Table 21.5 Processing manning costs (US$)
Category Salary (all-incl) US$ Numbers Cost $ p.a.
Operators 15,000 55 825,000
Lab 20,000 12 240,000
Tradesmen 20,000 24 480,000
Supervision 60,000 9 540,000
Professionals:-
National 80,000 4 320,000
Ex-Pat 150,000 4 600,000
Management (ex-pat) 300,000 1 300,000
Total 109 3,305,000
As explained in Section 17.3, the roaster facility has been estimated to have a capacity to treat
400,000 tonnes per year. The estimated operation cost is US$30/tonne of concentrate fed. A
high-level estimate of the total capital cost is included in Table 21.3. AMC estimates that further
studies, including flotation management of the arsenic and options for mill feed scheduling, will
contribute to building a more robust estimate in terms of capacity and costs.
21.3 Infrastructure capital
The infrastructure capital includes roads, buildings, electric power and tailings management
facilities. Table 21.6 shows a summary of these estimated costs.
Table 21.6 Infrastructure capital costs
Item Cost, US$M
Buildings 17.5
Roads 11.0
Electrical 55.0
Site preparation 15.0
TMF 164.0
Closure 92.0
Total 356.0
21.4 General and Administrative (G&A) costs
G&A costs are estimated at US$10M based on staffing complement of 69 and including insurance,
permits, flights, and miscellaneous fees.

La Verde Copper Project
Equinox Gold Corp. and Solaris Copper Inc. 718017
amcconsultants.com 156
22 Economic analysis
The preliminary economic assessment is preliminary in nature. It includes Inferred Mineral
Resources that are considered too speculative geologically to have the economic considerations
applied to them that would enable them to be categorized as Mineral Reserves. There is no certainty
that the preliminary economic assessment will be realized.
Mineral Resources that are not Mineral Reserves do not have demonstrated economic viability.
22.1 Revenue estimation
The conceptual income generated by the La Verde Project comes from selling copper concentrate
to copper smelters around the world. The La Verde concentrates will additionally contain variable
amounts of gold and silver in high enough concentration to be payable by smelters.
Projected yearly metals production in concentrate from the La Verde mill can be obtained from Table
17.3. Yearly revenue has been calculated applying assumed metal prices, as follows:
• Copper: US$2.7/lb (US$5,950/tonne)
• Gold: US$1,200/troy ounce (US$38.58/g)
• Silver: US$25/troy ounce (US$0.80/g)
Current metal prices vary from those used with gold and copper prices being higher, and the price
of silver is lower. In respect to the precious metal prices, the gold price is slightly lower and silver
price is higher than may be used in similar projects at this time. The copper price currently used
would also be higher. The relative economic contribution from the different metals are: 92% for
copper, 5% for Silver and 3% for gold. The impact of using more current prices (US$3.00 for copper,
US$1250 for gold, and US$17.50 for silver) would enhances the project).
Since the intent of this report was to show the change in ownership and reduction in lease area, the
economics were not deemed to be significant to the issuer.
Smelting and refining charges, maximum payable metal percentages, freight charges and arsenic-
related penalties have been applied as described in Table 16.2. The resulting gross and net revenues
are given in Table 22.1. All figures are million US$.

La Verde Copper Project
Equinox Gold Corp. and Solaris Copper Inc. 718017
amcconsultants.com 157
Table 22.1 Gross and net revenue estimation
YEAR Y(-1) Y 1 Y 2 Y 3 Y 4 Y 5 Y 6 Y 7 Y 8 Y 9 Y 10 Y 11 Y 12 Y 13 Y 14 Y 15 Y 16 Y 17 Y 18 Y 19 Y 20 LOM
Final Product (dry), Mt 432.3 486.1 515.3 464.1 386.0 296.2 385.1 366.8 395.6 323.9 319.2 241.9 169.7 198.2 235.3 296.6 315.4 376.7 168.0 79.7 6,452
Freight, US$M 30.3 34.0 36.1 32.5 27.0 20.7 27.0 25.7 27.7 22.7 22.3 16.9 11.9 13.9 16.5 20.8 22.1 26.4 11.8 5.6 452
Roasting, US$M
TC, US$M 30.3 34.0 36.1 32.5 27.0 20.7 27.0 25.7 27.7 22.7 22.3 16.9 11.9 13.9 16.5 20.8 22.1 26.4 11.8 5.6 452
Refining, US$M 20.4 22.4 23.3 21.0 17.4 13.9 17.9 16.5 17.9 14.8 14.6 11.1 7.8 9.1 10.7 13.6 14.4 17.2 7.6 3.8 295
As Penalties, US$M 0.0 0.0 0.0 0.0 0.0 0.0 0.0 0.0 0.0 0.0 0.0 0.0 0.0 0.0 0.0 0.0 0.0 0.0 0.0 0.0 -
Total, US$M 80.9 90.4 95.5 86.0 71.4 55.4 71.8 67.9 73.3 60.2 59.2 45.0 31.6 36.8 43.7 55.2 58.6 69.9 31.1 14.9 1,199
GROSS REVENUE (BASED ON PAYABLE METALS)
YEAR Y(-1) Y 1 Y 2 Y 3 Y 4 Y 5 Y 6 Y 7 Y 8 Y 9 Y 10 Y 11 Y 12 Y 13 Y 14 Y 15 Y 16 Y 17 Y 18 Y 19 Y 20 LOM
Copper, US$M 757.8 832.4 868.6 782.7 647.4 518.5 666.6 615.0 667.1 552.4 541.7 413.9 290.5 337.2 399.7 507.6 536.0 639.9 282.1 140.4 10,998
Gold, US$M 59.2 8.5 0.0 0.0 0.0 24.1 45.8 0.0 4.4 25.3 13.3 13.8 13.7 14.3 10.8 30.8 17.0 8.0 0.0 15.1 304
Silver, US$M 63.4 52.5 28.5 29.4 23.5 40.9 72.3 23.4 26.1 32.6 26.3 24.7 20.4 23.0 25.8 36.4 30.0 34.7 19.6 12.9 646
Total, US$M 880.5 893.4 897.1 812.1 670.9 583.5 784.7 638.4 697.7 610.3 581.3 452.3 324.6 374.5 436.3 574.7 582.9 682.5 301.8 168.4 11,948
NET REVENUE (NSR), US$M 799.6 803.0 801.6 726.1 599.5 528.1 712.8 570.5 624.4 550.2 522.0 407.4 293.0 337.7 392.6 519.6 524.4 612.6 270.7 153.5 10,749

La Verde Copper Project
Equinox Gold Corp. and Solaris Copper Inc. 718017
amcconsultants.com 158
22.2 Initial capital cost
Initial capital cost has been estimated as US$1,160M, to be spent in three years from Year (-3) to
Year (-1). It can be broken down as follows:
• Mining equipment: US$134.5M.
• Mill and Roaster: US$879.1M.
⎯ US$775,1M in the mill buildings and equipment.
⎯ US$104.0M in the roasting facility.
• Infrastructure: US$126.5M in TMF, buildings, electrical, and other facilities.
Other preproduction capital expenditures are estimated as:
• US$76.8M in operating cost for mine pre-stripping.
• US$27.6M in mine sustaining capital (first 3 months of Year 1).
• US$47.4M in mill sustaining capital (first 3 months of Year 1).
22.3 Cash flow and financial indicators
The projected La Verde project cash flow combines operating and capital costs, as described in
Section 21 and Section 22.2; and revenues, given in Section 22.1. The projected pre-tax and after-
tax cash flows are shown in Table 22.2.
Taxation has been accounted for in a simplified manner in the PEA and is based on an indicative
28% corporate tax rate. Depreciation is computed on a straight-line basis assuming a weighted
average depreciation rate of 12%.
Table 22.2 includes Inferred Mineral Resources that are considered to be too speculative geologically
to have the economic considerations applied to them that would enable them to be categorized as
Mineral Reserves. There is no certainty that the preliminary economic assessment will be realized.

La Verde Copper Project
Equinox Gold Corp. and Solaris Copper Inc. 718017
amcconsultants.com 159
Table 22.2 La Verde Project conceptual cash flow
Years
Y(-3) Y-(-2) Y(-1) Y1 Y2 Y3 Y4 Y5 Y6 Y7 Y8 Y9 Y10 Y11 Y12 Y13 Y14 Y15 Y16 Y17 Y18 Y19 Y20 Y21 Totals
Ex-pit tonnage Mt
Unit cost - per ex-pit tonne US $/t 1.18 1.16 1.17 1.17 1.19 1.20 1.20 1.27 1.27 1.38 1.38 1.37 1.90 2.33 2.57 2.87 3.15 3.11 3.18 - - 1.76
Unit cost - per moved tonne US $/t 1.18 1.09 1.17 1.17 1.16 1.20 1.20 1.27 1.27 1.38 1.38 1.37 1.90 2.33 2.57 2.87 3.15 3.11 3.18 1.42 1.55 1.66
Total mining op. cost US$M 76.8 110.2 110.8 110.7 113.1 144.1 143.8 152.6 152.3 165.1 165.2 157.9 218.6 267.5 296.0 330.5 251.6 249.0 121.1 42.6 27.5 3,407
Mine Capital - initial US$M 55.5 79.0 134
Mine Capital - sustaining US$M 27.3 3.0 0.0 24.2 23.8 4.5 17.9 14.2 20.8 50.2 42.4 6.7 0.8 8.4 20.6 3.2 0.0 0.0 0.0 0.0 268
Mine capital - working US$M 27.6 -27.6 -
Total mine capital US$M 0.0 55.5 106.6 27.3 3.0 0.0 24.2 23.8 4.5 17.9 14.2 20.8 50.2 42.4 6.7 0.8 8.4 20.6 3.2 0.0 0.0 0.0 -27.6 403
Mill feed Mt
Unit milling cost US$M 5.84 5.84 5.84 5.84 5.84 5.84 5.84 5.84 5.84 5.84 5.84 5.84 5.84 5.84 5.84 5.84 5.84 5.84 5.84 5.84
Total milling cost US$M 0.0 0.0 0.0 175.3 175.1 175.1 175.0 174.8 175.0 174.6 174.2 175.1 175.3 175.0 176.8 175.0 176.1 175.8 177.0 175.2 175.2 173.5 102.4 3,432
Roaster fee Mt 400.0 400.0 400.0 400.0 400.0 329.1 400.0 400.0 400.0 359.9 354.6 268.8 188.6 220.2 261.4 329.6 350.4 418.6 186.7 88.5 6,557
Unit roasting cost US $/t 30.0 30.0 30.0 30.0 30.0 30.0 30.0 30.0 30.0 30.0 30.0 30.0 30.0 30.0 30.0 30.0 30.0 30.0 30.0 30.0
Total roasting op. cost US$M 0.0 0.0 0.0 12.0 12.0 12.0 12.0 12.0 9.9 12.0 12.0 12.0 10.8 10.6 8.1 5.7 6.6 7.8 9.9 10.5 12.6 5.6 2.7 197
Mill Capital - initial US$M 387.5 387.5 775
Roaster capital - initail US$M 104.0 104
Mill & roast - sustaining cap. US$M 7.0 7.0 7.0 7.9 7.9 7.9 8.8 8.8 8.8 8.8 8.8 8.8 8.8 8.8 8.8 8.8 8.8 8.8 8.8 8.8 168
Mill & roast - working cap. US$M 45.8 -45.8 -
Total mill & roast capital US$M 0.0 387.5 537.3 7.0 7.0 7.0 7.9 7.9 7.9 8.8 8.8 8.8 8.8 8.8 8.8 8.8 8.8 8.8 8.8 8.8 8.8 8.8 -37.0 0.0 1,047
Inrastructure capital - initial US$M 60.0 56.5 10.0 127
Infrastructure capital - sustaining US$M 0.0 4.5 8.0 5.3 10.0 0.0 0.0 13.1 2.5 5.5 17.0 0.0 17.0 0.0 19.0 7.0 8.0 17.0 3.1 0.0 137
Total infrastructure capital US$M 60.0 56.5 10.0 0.0 4.5 8.0 5.3 10.0 0.0 0.0 13.1 2.5 5.5 17.0 0.0 17.0 0.0 19.0 7.0 8.0 17.0 3.1 0.0 264
G & A costs US$M 10.0 10.0 10.0 10.0 10.0 10.0 10.0 10.0 10.0 10.0 10.0 10.0 10.0 10.0 10.0 10.0 10.0 10.0 10.0 10.0 7.0 4.9 212
Closure capital US$M 20.0 72.0 92
Other liabilities US$M 4.0 4.0 4.0 3.5 3.0 2.5 3.5 2.9 3.1 2.8 2.6 2.0 1.5 1.7 2.0 2.6 2.6 3.1 1.4 0.8 54
Total site cost 60.0 499.5 740.7 345.8 326.4 326.8 351.0 385.6 353.6 379.4 387.5 397.4 428.6 424.3 431.0 486.3 507.6 574.5 470.1 464.1 347.8 245.0 95.8 76.9 9,107
Gross revenue (on % payables) US$M 880.5 893.4 897.1 812.1 670.9 583.5 784.7 638.4 697.7 610.3 581.3 452.3 324.6 374.5 436.3 574.7 582.9 682.5 301.8 168.4 11,948
Selling cost US$M 83.5 94.5 100.7 89.5 72.3 55.4 72.7 68.1 74.5 60.2 59.2 45.0 31.6 36.8 43.7 55.2 58.6 69.9 31.1 14.9 1,217
Net revenue (NSR) US$M 797.0 798.9 796.4 722.6 598.6 528.1 712.0 570.3 623.2 550.1 522.1 407.3 293.0 337.7 392.6 519.5 524.3 612.6 270.7 153.5 10,731
Net Cash Flow before Tax Annual US$M -60.0 -499.5 -740.7 451.2 472.5 469.6 371.6 213.0 174.5 332.6 182.8 225.8 121.5 97.8 -23.7 -193.3 -169.9 -181.9 49.4 60.2 264.8 25.7 57.7 -76.9 1,624
Cumulative US$M -60.0 -559.5 -1300.2 -849.0 -376.5 93.1 464.7 677.7 852.2 1184.8 1367.6 1593.4 1714.9 1812.7 1789.0 1595.7 1425.8 1243.9 1293.3 1353.5 1618.3 1644.0 1701.7 1624.8
Income Taxes (28%) US$M 0.0 0.0 0.0 71.2 95.4 94.2 71.8 27.1 7.7 55.1 14.5 59.4 42.9 35.4 0.0 0.0 0.0 0.0 0.0 0.0 0.0 0.0 0.0 0.0 575
Net Cash Flow after Tax Annual US$M -60.0 -499.5 -740.7 380.0 377.1 375.4 299.8 185.9 166.8 277.5 168.3 166.4 78.6 62.4 -23.7 -193.3 -169.9 -181.9 49.4 60.2 264.8 25.7 57.7 -76.9 1,049
Cumulative US$M -60.0 -559.5 -1300.2 -920.2 -543.1 -167.8 132.0 317.9 484.7 762.2 930.4 1096.8 1175.5 1237.8 1214.1 1020.8 850.9 669.0 718.4 778.6 1043.4 1069.1 1126.8 1049.9
Mine
Mill & Roaster
NSR
Refer to Table 16.1 0 for Ex-Pit Tonnage
Refer to Table 16.11 for Mill feed Schedule
Infrasructure
G & A and others

La Verde Copper Project
Equinox Gold Corp. and Solaris Copper Inc. 718017
amcconsultants.com 160
Financial indicators derived from the estimated pre-tax and post-tax cash flow are as follows:
• NPV at the beginning of year Y(-3), as a function of the discount rate is as follows:
⎯ If discount rate is 0%, NPV is US$1,625M pre-tax, US$1,050M post-tax.
⎯ If discount rate is 5%, NPV is US$904M pre-tax, US$510M post-tax.
⎯ If discount rate is 8%, NPV is US$617M pre-tax, US$300M post-tax.
⎯ If discount rate is 10%, NPV is US$471M pre-tax, US$192M post-tax.
• Internal Rate of Return: 21.2% pre-tax and 13.5% post tax.
• Year for recovery of the Initial Capital: Year 4.
• Total undiscounted net cash flow: US$1,625M pre-tax, US$1,050M post-tax.
AMC notes that in spite of the positive economic KPIs the cash flow given in Table 22.2 exhibits a
series of negative years from Year 12 to Year 15. These negatives are mostly driven by lower copper
and silver grades and a strong increase in the unit mining cost which, in turn, is the result of a
corresponding increase in haulage cost in those years. Due to the PEA nature of the study,
insufficient iterations of the mining schedule were done in order to specifically smooth out the
haulage cost. This step should be included in any future mine schedule exercise. Nevertheless, once
smoothed, the location of these negative factors in the project time line is likely to continue to have
an adverse, but not severe, impact on the NPV, which could be offset by metals prices higher than
the ones assumed for the study.
22.4 Cash flow sensitivity
The pre-tax cash flow sensitivity has been tested by varying some relevant input parameters such
as copper head grades, copper recovery in the mill, and initial capital cost. Table 22.3 gives the
sensitivity response as percent variation of financial KPI’s.
Table 22.3 Pre-tax cash flow sensitivity
KPI ---> NPV (8%), US$M IRR, % Total Undisc. CF, US$M
Parameter varied
value % of base case value % of base case value % of base case
Base case 617 100% 21.2 100% 1,625 100%
Copper recovery
up to 94% 810 131% 24.0 113% 2,063 127%
down to 85% 406 66% 17.7 83% 1,135 70%
Copper head grade
10% higher 1,042 169% 27.1 128% 2,591 159%
10% lower 220 36% 14.1 67% 712 44%
Initial capital
10% higher 519 84% 18.4 87% 1,494 92%
10% lower 720 117% 24.4 115% 1,756 108%
Additionally, the cash flow sensitivity has been tested by varying the metals prices according to four
prices scenarios, namely:
• Scenario A: The Base Case (see section 22.1).
• Scenario B: Three year trailing averages for metal prices according to the US Securities and
Exchange Commission Guidelines in November 2012 were: copper, US$3.64/lb; gold,
US$1,455/oz; silver, US$28.06/oz.
• Scenario C: Copper, US$3.0/lb; gold, US$1,200/oz; silver, US$25/oz.
• Scenario D: Copper, US$2.4/lb; gold, US$1,200/oz; silver, US$25/oz.
Table 22.4 gives the sensitivity response as percent variation of financial KPI’s. Of particular note
is the project sensitivity to the copper price.

La Verde Copper Project
Equinox Gold Corp. and Solaris Copper Inc. 718017
amcconsultants.com 161
Table 22.4 Pre-tax cash flow sensitivity to copper price
KPI ---> NPV, US$M IRR, %
Price Scenario @ 0% discount rate @ 6% discount rate @ 8% discount rate
Scenario A 1,625 796 617 21.2
Scenario B 5,579 2,874 2,342 41.9
Scenario C 2,842 1,436 1,148 28.6
Scenario D 447 183 109 11.5
La Verde Copper Project
Equinox Gold Corp. and Solaris Copper Inc. 718017
amcconsultants.com 162
23 Adjacent properties
There are no adjacent properties to the Project that are considered relevant to this Technical Report.
La Verde Copper Project
Equinox Gold Corp. and Solaris Copper Inc. 718017
amcconsultants.com 163
24 Other relevant data and information
There is no additional information or explanation required to make the report understandable and
not misleading.

La Verde Copper Project
Equinox Gold Corp. and Solaris Copper Inc. 718017
amcconsultants.com 164
25 Interpretation and conclusions
The present study indicates that La Verde is an attractive mining opportunity. The key financial
indicators, based on reasonable future copper prices and capital and operating cost estimates,
justify advancing the Property to the next stage.
There are, however, key areas of risk or uncertainty that need to be addressed in moving the Project
forward:
• Additional drilling to improve the robustness of the geological model and upgrade the
substantial component of Inferred Resources to Indicated or Measured Resources.
• Management of high arsenic grades and arsenic by-products, both from an economic and an
environmental point of view.
• Availability of reliable and convenient power and water sources.
• Identification of TMF locations for the substantial projected LOM shortfall in tailings dam
capacity.
• Acquisition of the land required for TMF locations.
• Social license. The initiation of systematic social and environmental assessment of the water
access, infrastructure and tailings disposal assumptions contained in the study is required.
Continued development of good relationships with the local stakeholders, particularly with the
nearby communities is required.

La Verde Copper Project
Equinox Gold Corp. and Solaris Copper Inc. 718017
amcconsultants.com 165
26 Recommendations
1 Advance the Project to a Pre-Feasibility level.
2 Initiate formal discussions with the relevant Mexican government agencies to investigate the
feasibility of the proposed TMF solution outlined in this study.
3 In the next study phase, evaluate alternative options to TMF construction including dry
stacking. The cost of this trade-off study is included in the Pre-Feasibility study cost.
4 Initiate formal discussions with the relevant Mexican government agencies to investigate a
reliable power supply for the power consumption levels outlined in this study.
5 Strengthen Company involvement with local communities and initiate conversation with the
relevant stakeholders regarding the extension and considerations of the project. Particularly
relevant is the community engagement respect the project’s water and land uses.
6 Initiate environmental and social baseline studies. On the environmental side, include the
potential for contamination by arsenic from waste dumps and stockpiles from the earliest
evaluation stages. See Table 26.1 for cost estimate.
7 In the next mine planning exercise, investigate options to deplete West Hill pit earlier to
provide an opportunity for backfilling the pit with tailings or waste material. The cost of this
trade-off study is included in the Pre-Feasibility study cost.
8 In the next mine planning exercise, use modern open pit mine planning software to investigate
a more optimum way of defining pushbacks based on value and arsenic content. The cost of
this trade-off study is included in the Pre-Feasibility study cost.
9 Initiate a program investigating the geo-metallurgical variability across the deposits to develop
a geo-metallurgical map and appropriate geo-metallurgical domains. See Table 26.1 for cost
estimate.
10 Investigate options to improve precious metals recovery, especially gold in West Hill sulphides.
See Table 26.1 for cost estimate.
11 Undertake a trade-off study on the use of high pressure grinding rolls (HPGR). See Table 26.1
for cost estimate.
12 Carry out concentrate roaster testwork and associated preliminary design studies. See Table
26.1.
13 With respect to pit wall planning:
⎯ Undertake a geotechnical drilling program using orientated, NQ3 or HQ3 diamond drill
core.
⎯ Develop a geotechnical and structural model at pit scale to help with the modelling of
the pit wall stability.
⎯ Conduct a hydrogeological study to assess the presence, nature, and depth of the water
table, and how this may be affected by mining.
⎯ Undertake an assessment of the rock mass strength and carry out a slope stability
analysis at bench, inter-ramp and overall scale to assess the slope parameters for each
pit.

La Verde Copper Project
Equinox Gold Corp. and Solaris Copper Inc. 718017
amcconsultants.com 166
Table 26.1 Estimated cost of recommendations
Activity Cost estimate (US$M)
Pre-Feasibility study 1.5
Additional drilling to upgrade Resources + first Geomechanic studies 2.9
Environmental and social baseline studies 1.1
Geo-metallurgical investigations, including improving gold recovery 0.8
HPGR Testing 0.1
Concentrate Roasting testwork 0.2

La Verde Copper Project
Equinox Gold Corp. and Solaris Copper Inc. 718017
amcconsultants.com 167
27 References
Briskey, J.A. and Bellamy, J.R., 1976, Bethlehem Copper's Jersey, East Jersey, Huestis, and Iona
deposits in Porphyry deposits of the Canadian Cordillera. Edited by A. Sutherland Brown. Canadian
Institute of Mining and Metallurgy, Special Volume 15, pp. 105-119.
Chamberlain, C., 2009, Geological and Hydrothermal Characteristics of the La Verde Cu System,
Michoacán, Mexico, Implications for Exploration, Internal Company Report for Teck.
Coochey, D.V., and Eckman, P., 1978, Geology of the La Verde Copper Deposits.
Johnston W.P. and Lowell J.D. 1961 Geology and origin of mineralized breccia pipes in Copper Basin
Arizona Econ Geol. v 56 p 916-940
Lajoie, J. J., 2010, 2010 Reconnaissance IP Survey, La Verde Property, Michoacán, Mexico, Internal
Company Report for Catalyst Copper Corp., November.
Makepeace, D.K., 2010, Technical Report on the La Verde Property, Michoacán, Mexico, Property of
Merit. Internal Company Report for Catalyst Copper Corporation.
Maunula, T., 2012, Technical Report and Resource Estimate of the La Verde Copper Project, Mexico
prepared for Minera Hill 29 SA de CV by Tetra Tech Wardrop. January
Michoacán, Mexico; Arizona Geological Society Digest, Vol. 11, pp.129-137.
Sillitoe R.H. and Sawkins F.J. 1971, Geologic mineralogic and fluid inclusion studies relating to the
origin of copper bearing tourmaline breccia pipes Chile Econ Geology v 66 p. 1028-1041
Weston, R. and MacLean, P., 2006, La Verde Copper Project, Michoacán, Mexico, Summary of
Exploration, Internal Company Report for Aur Resources Inc., April.
Wilson, G.C., 2005a, Mineralogy and Nature of Drill-Core Samples from La Verde, Michoacán,
Mexico; Internal Petrographic Report for Aur Resources Inc.
Wilson, G.C., 2005b, Intrusive Rock from La Verde, Michoacán, Mexico; Internal Petrographic Report
for Aur Resources Inc.
Wong, R.H. and Spence, C.D., 1995, Copper-Gold Mineralization in the Willa Breccia Pipe,
Southeastern British Columbia; in Schroeter, T.G., editor, Porphyry Deposits of the Northwestern
Cordillera of North America, CIM Special Volume 46, pp. 401-409.
La Verde Copper Project
Equinox Gold Corp. and Solaris Copper Inc. 718017
amcconsultants.com 168
28 Certificates
P R Stephenson
1 I, Patrick R Stephenson, P.Geo., BSc (Hons), FAusIMM (CP), MAIG, MCIM, of Vancouver, British
Columbia, do hereby certify that I am an Associate Principal Geologist with AMC Mining
Consultants (Canada) Ltd., Suite 202 – 200 Granville Street, Vancouver, BC, V6C 1S4.
2 I graduated with a BSc (Hons) in Geology from Aberdeen University in Scotland in 1971.
3 I am a registered member in good standing of the Association of Professional Engineers and
Geoscientists of British Columbia.
4 I have worked as a Geologist and Manager for a total of 44 years since my graduation from
university and have relevant experience in geology, exploration and mineral resource
estimation for base and precious metal deposits and in public reporting of mineral assets.
5 I have read the definition of “Qualified Person” set out in National Instrument 43-101
(NI 43-101) and certify that by reason of my education, affiliation with a professional
association (as defined in NI 43-101) and past relevant work experience, I fulfill the
requirements to be a “Qualified Person” for the purposes of NI 43-101.
6 I am responsible for the preparation of Sections 1 to 5, and 23 to 26 of the “La Verde Copper
Project Michoacán State, Mexico, Technical Report for Catalyst Copper Corp”, dated effective
30 September 2012 (the “Technical Report) and amended for Equinox Gold Corp. and Solaris
Copper Inc. dated effective 20 June 2018.
7 I have not visited the Property.
8 I am independent of Minera Hill 29 SA de CV and Equinox Gold Corp. and Solaris Copper Inc.
as defined by Section 1.5 of the Instrument.
9 I have read NI 43-101 and Form 43-101F1, and the parts of the Technical Report for which I
am responsible have been prepared in compliance with that instrument and form.
10 As at the effective date of the Technical Report, to the best of my knowledge, information,
and belief, the parts of the Technical Report that I am responsible for contain all scientific and
technical information that is required to be disclosed to make the Technical Report not
misleading.
Dated 20 June 2018
Original signed and sealed by
Patrick R Stephenson, P.Geo.

La Verde Copper Project
Equinox Gold Corp. and Solaris Copper Inc. 718017
amcconsultants.com 169
A Riles
1 I, Alan Riles, MAIG, BMet (Hons), Grad Dipl Business Management, M. EconGeol do hereby
certify that I am Associate Principal Consultant Metallurgist with AMC Mining Consultants
(Canada) Ltd, Suite 202 – 200 Granville Street, Vancouver, British Columbia V6C 1S4, Canada.
2 I graduated with a Bachelor of Metallurgy (Hons Class 1) from Sheffield University, UK in 1974.
3 I am a registered member of the Australian Institute of Geoscientists.
4 I have practiced my profession continuously since 1974, with particular experience in study
management, and both operational and project experience in precious and base metal
deposits.
5 I have read the definition of “Qualified Person” set out in National Instrument 43-101
(NI 43-101) and certify that by reason of my education, affiliation with a professional
association (as defined in NI 43-101) and past relevant work experience, I fulfill the
requirements to be a “Qualified Person” for the purposes of NI 43-101.
6 I am responsible for the preparation of Sections 13, 17, and 19, parts of 18 to 21, and
contributed to Sections 25 and 26 of the “La Verde Copper Project Michoacán State, Mexico,
Technical Report for Catalyst Copper Corp”, dated effective 30 September 2012 (the “Technical
Report) and amended for Equinox Gold Corp. and Solaris Copper Inc. dated effective
20 June 2018.
7 I visited the Property from 11 – 12 April 2012.
8 I am independent of Minera Hill 29 SA de CV and Equinox Gold Corp. and Solaris Copper Inc.
as defined by Section 1.5 of the Instrument.
9 I have read NI 43-101 and Form 43-101F1, and the parts of the Technical Report for which I
am responsible have been prepared in compliance with that instrument and form.
10 As at the effective date of the Technical Report, to the best of my knowledge, information,
and belief, the parts of the Technical Report that I am responsible for contain all scientific and
technical information that is required to be disclosed to make the Technical Report not
misleading.
Dated 20 June 2018
Original signed and sealed by
Alan Riles, MAIG

La Verde Copper Project
Equinox Gold Corp. and Solaris Copper Inc. 718017
amcconsultants.com 170
M Molavi
1 I, Mo Molavi, P.Eng., M.Eng., B.Eng., do hereby certify that I am a Principal Mining Engineer
with AMC Mining Consultants (Canada) Limited, Suite 202 – 200 Granville Street, Vancouver,
BC, V6C 1S4.
2 I graduated with a B Eng in Mining Engineering from the Laurentian University in Sudbury
Ontario in 1979, and an M Eng in Mining Engineering specializing in Rock Mechanics and mining
methods from the McGill University of Montreal in 1987.
3 I am a registered member in good standing of the Association of Professional Engineers and
Geoscientists of Saskatchewan and Association of Professional Engineers and Geoscientists of
British Columbia. and a Member of the Canadian Institute of Mining, Metallurgy and Petroleum.
4 I have worked as a Mining Engineer for a total of 38 years since my graduation from university
and have relevant experience in project management, feasibility studies and technical report
preparations for mining projects.
5 I have read the definition of “Qualified Person” set out in National Instrument 43-101
(NI 43-101) and certify that by reason of my education, affiliation with a professional
association (as defined in NI 43-101) and past relevant work experience, I fulfill the
requirements to be a “Qualified Person” for the purposes of NI 43-101.
6 I am responsible for the preparation of Sections 15, 16 and 18, parts of 1, 2, 5, and 22 of the
“La Verde Copper Project Michoacán State, Mexico, Technical Report for Catalyst Copper
Corp”, dated effective 30 September 2012 (the “Technical Report) and amended for Equinox
Gold Corp. and Solaris Copper Inc. dated effective 20 June 2018.
7 I have not visited the Property.
8 I am independent of Minera Hill 29 SA de CV and Equinox Gold Corp. and Solaris Copper Inc.
as defined by Section 1.5 of the Instrument.
9 I have read NI 43-101 and Form 43-101F1, and the parts of the Technical Report for which I
am responsible have been prepared in compliance with that instrument and form.
10 As at the effective date of the Technical Report, to the best of my knowledge, information,
and belief, the parts of the Technical Report that I am responsible for contain all scientific and
technical information that is required to be disclosed to make the Technical Report not
misleading.
Dated 20 June 2018
Original signed and sealed by
Mo Molavi, P.Eng.

La Verde Copper Project
Equinox Gold Corp. and Solaris Copper Inc. 718017
amcconsultants.com 171
Michael O’Brien
855 Homer Street
Vancouver, BC
Canada V6B 2W2
1 I, Michael O’Brien, MSc, P.Geo., do hereby certify that I am a Technical Director of Geology
and Mineral Resources with Ausenco Engineering Canada, 855 Homer Street, Vancouver, BC,
Canada, V6B 2W2.
2 I graduated with a BSc(HONS) in Geology from the University of Kwazulu-Natal in 1978, and
an MSc in Geology from the University of the Witwatersrand in 2002.
3 I am a registered member of the Association of Professional Engineers and Geoscientists of
British Columbia (#41338).
4 I have practiced my profession in geology for a total of thirty-five years with experience in
exploration, advanced evaluation, operations, resource estimation, and technical report
writing
5 I have read the definition of “Qualified Person” set out in National Instrument 43-101
(NI 43-101) and certify that by reason of my education, affiliation with a professional
association (as defined in NI 43-101) and past relevant work experience, I fulfill the
requirements to be a “Qualified Person” for the purposes of NI 43-101.
6 I am responsible for the preparation of Sections 6 to 12 and 14 of the “La Verde Copper Project
Michoacán State, Mexico, Technical Report for Catalyst Copper Corp”, dated effective 30
September 2012 (the “Technical Report) and amended for Equinox Gold Corp. and Solaris
Copper Inc. dated effective 20 June 2018.
7 I have not visited the Property.
8 I am independent of Minera Hill 29 SA de CV as defined by Section 1.5 of the Instrument. I
have no prior involvement with the Property that is the subject of the Technical Report.
9 I have read NI 43-101 and Form 43-101F1, and the parts of the Technical Report for which I
am responsible have been prepared in compliance with that instrument and form.
10 As at the effective date of the Technical Report, to the best of my knowledge, information,
and belief, the parts of the Technical Report that I am responsible for, contain all scientific
and technical information that is required to be disclosed to make the Technical Report not
misleading.
Dated 20 June 2018
Original signed and sealed by
Michael O’Brien, MSc, P.Geo.

La Verde Copper Project
Equinox Gold Corp. and Solaris Copper Inc. 718017
amcconsultants.com 172
P Lebleu
I, Philippe Lebleu, P.Eng., M.Eng., of Vancouver, British Columbia, do hereby certify that:
1 I am currently employed as a Principal Mining Engineer with AMC Mining Consultants (Canada)
Ltd. with an office located at Suite 202 – 200 Granville Street, Vancouver, BC, V6C 1S4.
2 I am a registered member in good standing with Engineers and Geoscientists British Columbia
(registration #41544), and a member of the Australian Institute of Mining and Metallurgy.
3 I graduated from The Royal School of Mines, Imperial College in London, England with a
Masters of Mining Engineering with Rock Mechanics in 1999. I have extensive operational
experience in iron ore, copper and aggregates in Canada, Australia and Malaysia, with mines
moving up to 90 Mtpa. My consulting experience spans various commodities and includes
project and site work in the Americas, Africa and arctic environments.
4 I have read National Instrument 43-101 – Standards of Disclosure for Mineral Projects (“NI 43-
101”) and certify that by reason of my education, affiliation with a professional association (as
defined in NI 43-101) and past relevant work experience, I fulfil the requirements to be a
"qualified person" for the purposes of NI 43-101.
5 I visited the Property on 10 April 2018.
6 I am responsible for the preparation of parts of Section 26 of the “La Verde Copper Project
Michoacán State, Mexico, Technical Report for Catalyst Copper Corp”, dated effective 30
September 2012 (the “Technical Report) and amended for Equinox Gold Corp. and Solaris
Copper Inc. dated effective 20 June 2018.
7 I am independent of the Issuer and related companies as described in Section 1.5 of
NI 43-101.
8 I have no prior involvement with the Property that is the subject of the Technical Report.
9 I have read NI 43-101 and the section of the Technical Report for which I am responsible has
been prepared in compliance with NI 43-101.
10 As of the effective date of the Technical Report, to the best of my knowledge, information and
belief, the section of the Technical Report for which I am responsible contains all scientific and
technical information that is required to be disclosed to make the Technical Report not
misleading.
Dated 20 June 2018
Original signed and sealed by
Philippe Lebleu, P.Eng.

La Verde Copper Project
Equinox Gold Corp. and Solaris Copper Inc. 718017
amcconsultants.com
Our offices
Australia
Adelaide
Level 1, 12 Pirie Street
Adelaide SA 5000 Australia
T +61 8 8201 1800
Brisbane
Level 21, 179 Turbot Street
Brisbane Qld 4000 Australia
T +61 7 3230 9000
Melbourne
Level 29, 140 William Street
Melbourne Vic 3000 Australia
T +61 3 8601 3300
Perth
Level 1, 1100 Hay Street
West Perth WA 6005 Australia
T +61 8 6330 1100
Canada
Toronto
TD Canada Trust Tower
161 Bay Street, 27th Floor
Toronto, ON M5J 2S1 Canada
T +1 416 640 1212
Vancouver
200 Granville Street, Suite 202
Vancouver BC V6C 1S4 Canada
T +1 604 669 0044
Singapore
Russia
Singapore
30 Raffles Place, Level 17 Chevron House
Singapore 048622
T +65 6809 6132
Moscow
ul. Bakhrushina 32/1
Moscow 115054 Russian Federation
T +7 495 134 01 86
United Kingdom
Maidenhead
Registered in England and Wales
Company No. 3688365
Level 7, Nicholsons House
Nicholsons Walk, Maidenhead
Berkshire SL6 1LD United Kingdom
T +44 1628 778 256
Registered Office: Ground Floor,
Unit 501 Centennial Park
Centennial Avenue
Elstree, Borehamwood
Hertfordshire, WD6 3FG United Kingdom