technical trading techniques with statistical profitability
TRANSCRIPT

Technical Trading Techniques 1
Running head: TECHNICAL TRADING TECHNIQUES
Technical Trading Techniques with Statistical Profitability Back-Testing Analysis
Timothy Todd
A Senior Thesis submitted in partial fulfillment of the requirements for graduation
in the Honors Program Liberty University
Spring 2008
Technical Trading Techniques 2
Acceptance of Senior Honors Thesis
This Senior Honors Thesis is accepted in partial fulfillment of the requirements for graduation from the
Honors Program of Liberty University.
______________________________ Andrew Light, Ph.D. Chairman of Thesis
______________________________ Scott Ehrhorn, M.B.A.
Committee Member
______________________________ Homer Blass, Ph.D. Committee Member
______________________________ James Nutter, D.A.
Honors Director
______________________________ Date

Technical Trading Techniques 3
Abstract
Technical analysis is a category of securities trading that utilizes mathematical formulas in order
to signal buying and selling points. This paper will evaluate the profitability of various technical
methods over a five-year period starting January 1, 2003, with securities in the Dow Jones
Industrial Average (DJIA). The technical strategies evaluated in this paper will be explained
conceptually as well. Computer software will be used to complete the actual back testing.
Computer back testing will be used via TD Ameritrade’s StrategyDesk trading platform
software. The back testing will utilize a base value of $100,000 per trade, neglecting trading
transaction fees and short-term capital gains taxes. The results section of the paper will evaluate
each method on a statistical and profitability basis as compared to a “buy and hold” strategy.

Technical Trading Techniques 4
Technical Trading Techniques
with Statistical Profitability Back-Testing Analysis
Security analysts, investors, and other participants in the financial markets have been
debating over the century over methodologies that yield the largest returns on investments.
Accordingly, several schools of thought have evolved over the years to account for differing
styles and strategies. All of these thoughts can be classified as either one of two basic strategies:
Fundamental or Technical. These two ideologies are normally diametrically opposed and
postulate different criteria on which to trade securities.
Fundamental analysis is the typical “buy and hold” strategy. Fundamental analysis is
basically concerned with the financial health and prospects of a publically traded company. The
main weapons in the arsenal of fundamental analysis are audited financial statements, economic
analysis, and prudent decision making on future trends and opportunities. Succinctly,
fundamental analysis proposes to buy equities (stocks) based on the company’s current and
future prospects of growth, earnings, and share appreciation.
On the other hand, technical analysis is more concerned with mathematical tools, charting
patterns, and disparities in pricing due to market psychology. Moreover, the technical analysts
purport that mathematical indicators, volume, and momentum are paramount to equity selection.
The question concerning which methodology to espouse is dependent on the view of
market efficiency. Market efficiency is the degree to which a stock’s price fairly represents the
true value of the investment. In a truly efficient market, a stock’s price is representative of all the
information disseminated in the world and the aggregate of the consensus of market participants
(bullish and bearish). The fullest and strongest form of market efficiency is known as the Strong

Technical Trading Techniques 5
Form Market Efficiency Model (Malkiel, 1999). Based on this model, the hypothesis asserts that
it is impossible to beat the market on a repetitive basis.
The Strong Form Market Efficiency market would be highly plausible, if not purely true
in a financial system in which participants were constantly prudent, efficient, rational and
emotionless. However, this is far from the financial system in which we participate. Therefore,
where the Strong Form may have theoretical merit, it lacks pure practicality.
There are other forms of market efficiency that arise in financial theory. The theories
range in their degree of market efficiency—Strong-Form being the highest form of efficiency
and Weak-Form being the least efficient (Malkiel, 1999). Weak-Form theory purports that
current prices do not reflect true fair value and is only representative of previous movements and
financial fundamentals.
Now since a background has been laid to some of the theoretical framework in which the
financial markets operate, technical analysis can be evaluated. Technical analysis is akin to
weather forecasting. Technical analysts forecast future price movements based on previous price
movements. Technical analysis does not purport to give exact predictions of prices and
movements but rather what is likely to happen based on historical data analysis. One of the
biggest factors of technical analysis is the function of price to supply and demand. Therefore,
technical analysis can be used for any financial instrument in which their price is a function of
supply and demand. Hence, technical analysis is frequently used for individual stocks, indices,
futures, options, commodities, etc. Also, the time frame is interchangeable. Day traders use
technical analysis on short intervals such as seconds to minutes while swing and momentum
traders may use time frames from a few days to weeks. Even long-term traders can use technical
analysis to identify long-term trends and therefore trade accordingly.
Technical Trading Techniques 6
The origins of technical analysis are clear. At the turn of the 20th century, Charles Dow
formulated his famous theory of patterns in broad stock indexes (Greiner & Whitcomb, 1969).
His writings were not disseminated in one pronouncement of financial theory but rather collected
over several years and fine-tuned by those who followed him. The historical progression of Dow
Theory is beyond the scope of this thesis but is important in understanding the evolution of
technical analysis.
Procedures & Methods
The proceeding section explains the various technical strategies that are evaluated.
Figures and exhibits show how the technical indicators appear in trading platforms. Also, buy
and sell signals are shown on various figures as indicated by green and red arrows, respectively.
The strategies were backtested starting on January 1, 2003 and will cease on December 31, 2007.
The trading-universe for backtesting are the 30 stocks that comprise the Dow Jones Industrial
Average (DJIA). Backtesting was performed by TD Ameritrade’s Strategy Desk (Version 2.2)
trading platform. Also, the in-text figures are also taken from the Strategy Desk software. It is
important to note that charts and illustrations used throughout this paper are not of the same
security, nor over the same time period. Chart selection was based on the ability to convey the
technical indicator in the clearest manner possible. A summary table of the actual backtesting
results is displayed in the respective appendix.
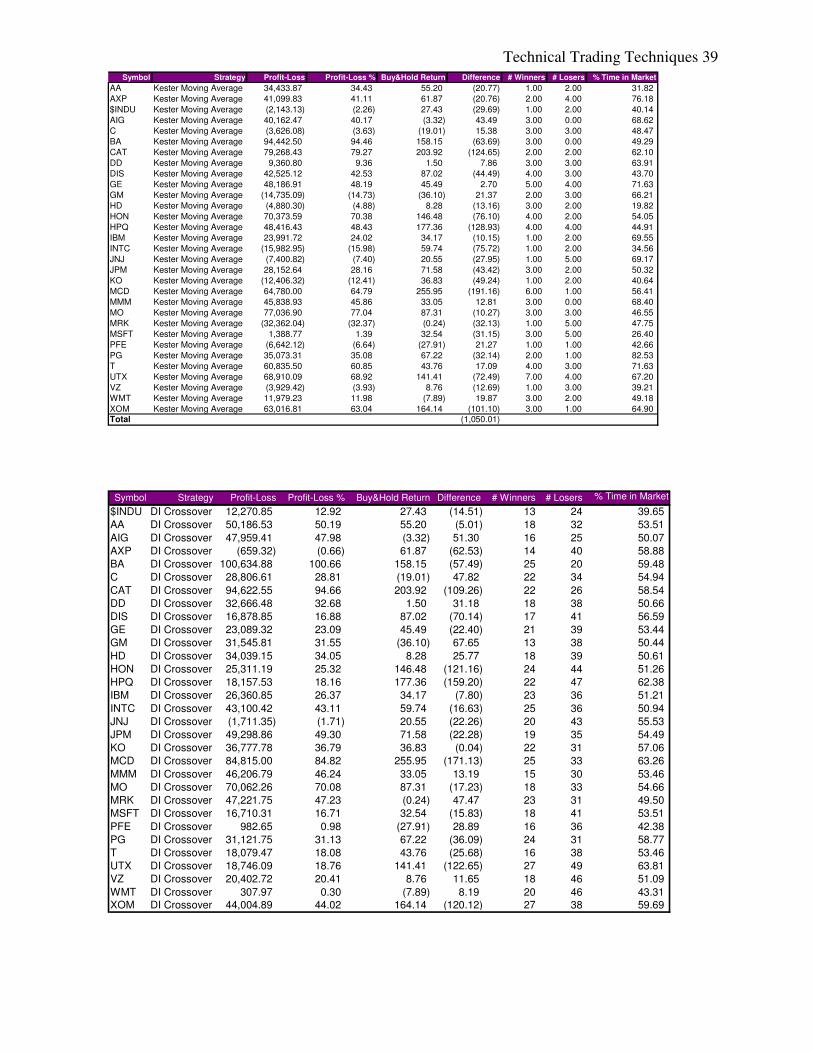
Positive/Negative Directional Indicators
Developed by J. Welles Wilder, the Positive Direction Indicator (+DI) and the Negative
Direction Indicator (-DI) measure price “forces” (Jobman, 1995). The +DI measures the force of
upward price movements whereas the –DI measures the force of downward price movements.
The default period setting for these directional indicators is 14 periods (Jobman, 1995).
Technical Trading Techniques 7
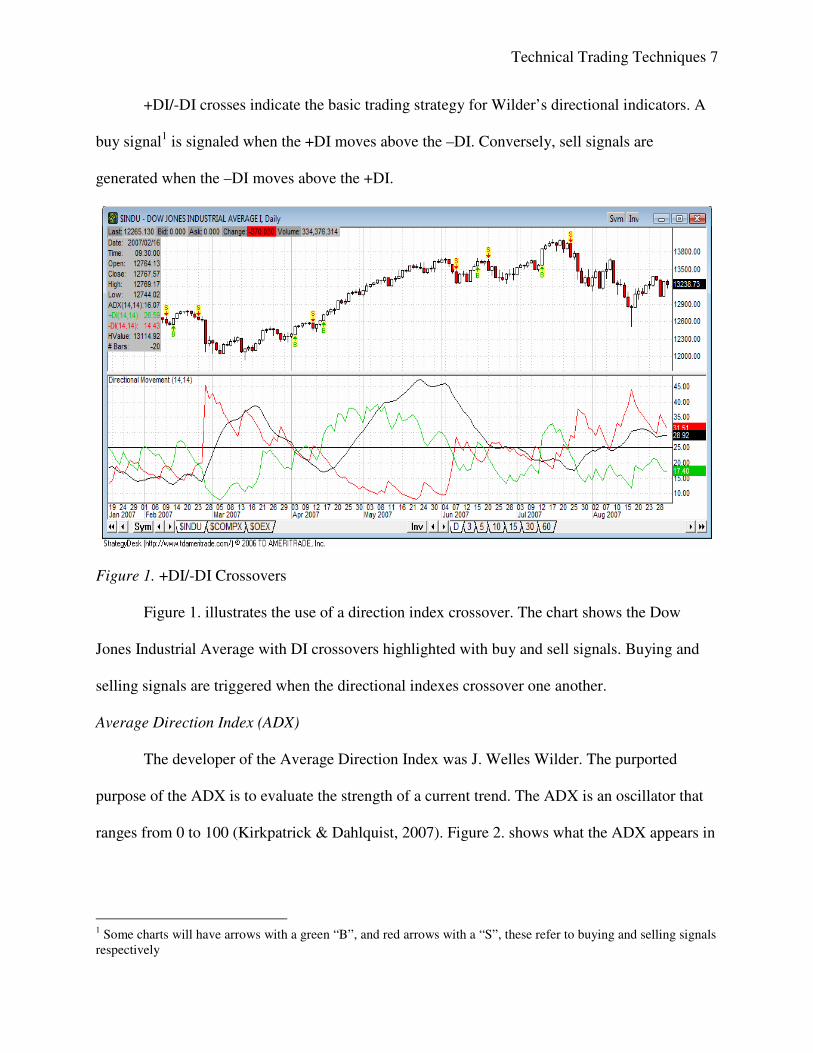
+DI/-DI crosses indicate the basic trading strategy for Wilder’s directional indicators. A
buy signal1 is signaled when the +DI moves above the –DI. Conversely, sell signals are
generated when the –DI moves above the +DI.
Figure 1. +DI/-DI Crossovers
Figure 1. illustrates the use of a direction index crossover. The chart shows the Dow
Jones Industrial Average with DI crossovers highlighted with buy and sell signals. Buying and
selling signals are triggered when the directional indexes crossover one another.
Average Direction Index (ADX)
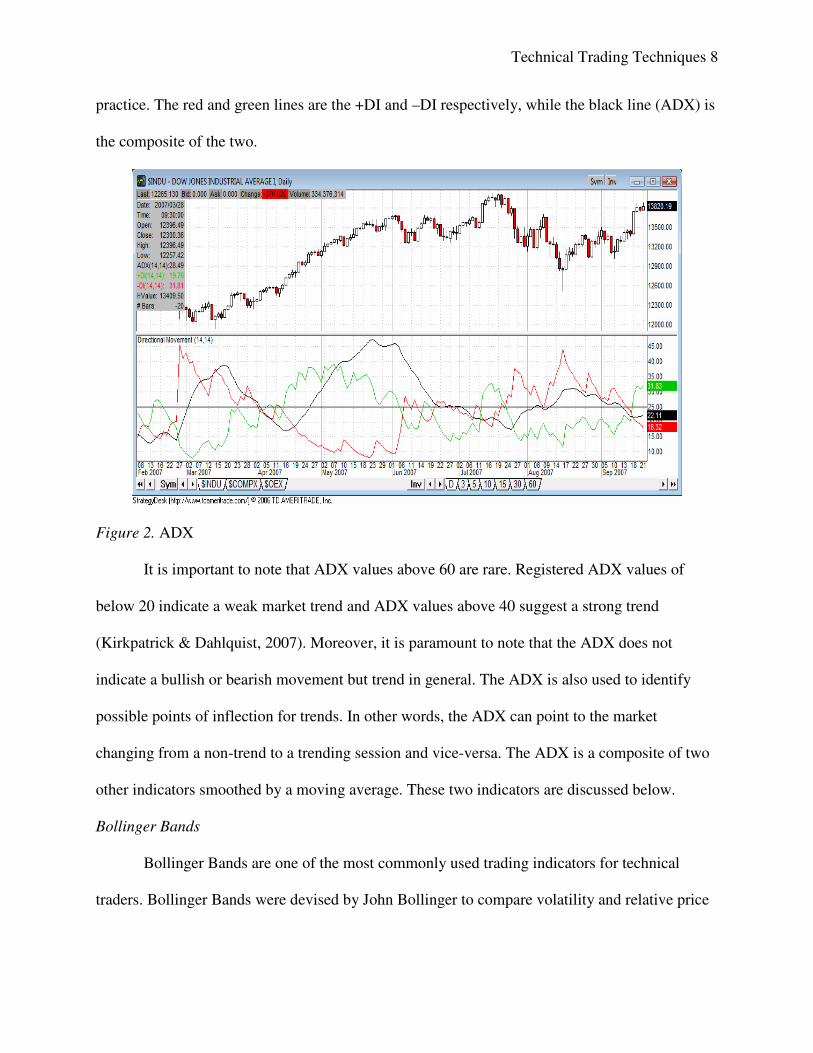
The developer of the Average Direction Index was J. Welles Wilder. The purported
purpose of the ADX is to evaluate the strength of a current trend. The ADX is an oscillator that
ranges from 0 to 100 (Kirkpatrick & Dahlquist, 2007). Figure 2. shows what the ADX appears in
1 Some charts will have arrows with a green “B”, and red arrows with a “S”, these refer to buying and selling signals respectively
Technical Trading Techniques 8
practice. The red and green lines are the +DI and –DI respectively, while the black line (ADX) is
the composite of the two.
Figure 2. ADX
It is important to note that ADX values above 60 are rare. Registered ADX values of
below 20 indicate a weak market trend and ADX values above 40 suggest a strong trend
(Kirkpatrick & Dahlquist, 2007). Moreover, it is paramount to note that the ADX does not
indicate a bullish or bearish movement but trend in general. The ADX is also used to identify
possible points of inflection for trends. In other words, the ADX can point to the market
changing from a non-trend to a trending session and vice-versa. The ADX is a composite of two
other indicators smoothed by a moving average. These two indicators are discussed below.
Bollinger Bands
Bollinger Bands are one of the most commonly used trading indicators for technical
traders. Bollinger Bands were devised by John Bollinger to compare volatility and relative price
Technical Trading Techniques 9
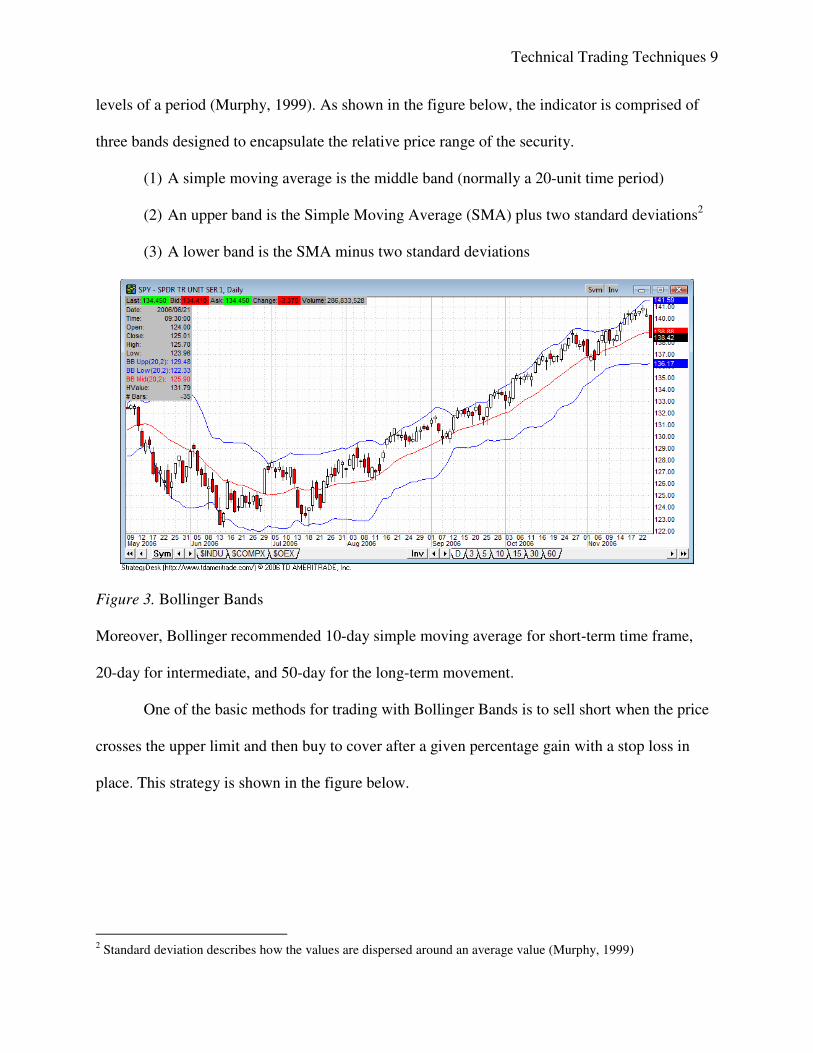
levels of a period (Murphy, 1999). As shown in the figure below, the indicator is comprised of
three bands designed to encapsulate the relative price range of the security.
(1) A simple moving average is the middle band (normally a 20-unit time period)
(2) An upper band is the Simple Moving Average (SMA) plus two standard deviations2
(3) A lower band is the SMA minus two standard deviations
Figure 3. Bollinger Bands
Moreover, Bollinger recommended 10-day simple moving average for short-term time frame,
20-day for intermediate, and 50-day for the long-term movement.
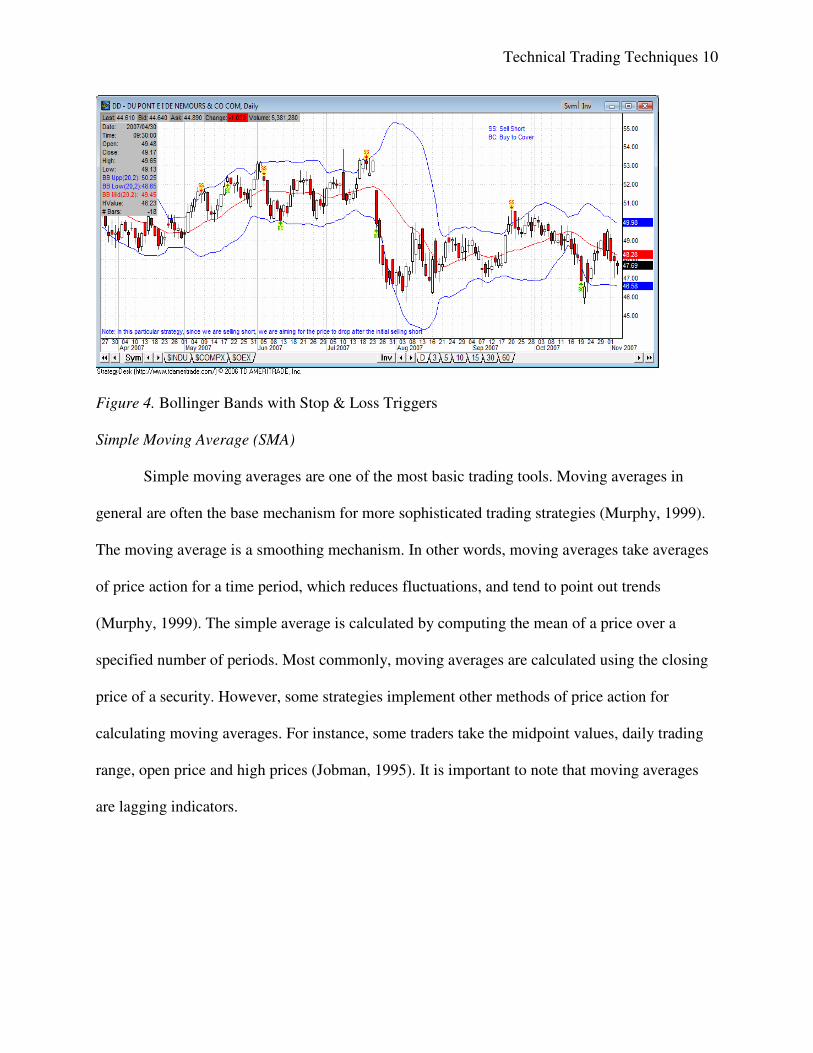
One of the basic methods for trading with Bollinger Bands is to sell short when the price
crosses the upper limit and then buy to cover after a given percentage gain with a stop loss in
place. This strategy is shown in the figure below.
2 Standard deviation describes how the values are dispersed around an average value (Murphy, 1999)
Technical Trading Techniques 10
Figure 4. Bollinger Bands with Stop & Loss Triggers
Simple Moving Average (SMA)
Simple moving averages are one of the most basic trading tools. Moving averages in
general are often the base mechanism for more sophisticated trading strategies (Murphy, 1999).
The moving average is a smoothing mechanism. In other words, moving averages take averages
of price action for a time period, which reduces fluctuations, and tend to point out trends
(Murphy, 1999). The simple average is calculated by computing the mean of a price over a
specified number of periods. Most commonly, moving averages are calculated using the closing
price of a security. However, some strategies implement other methods of price action for
calculating moving averages. For instance, some traders take the midpoint values, daily trading
range, open price and high prices (Jobman, 1995). It is important to note that moving averages
are lagging indicators.
Technical Trading Techniques 11
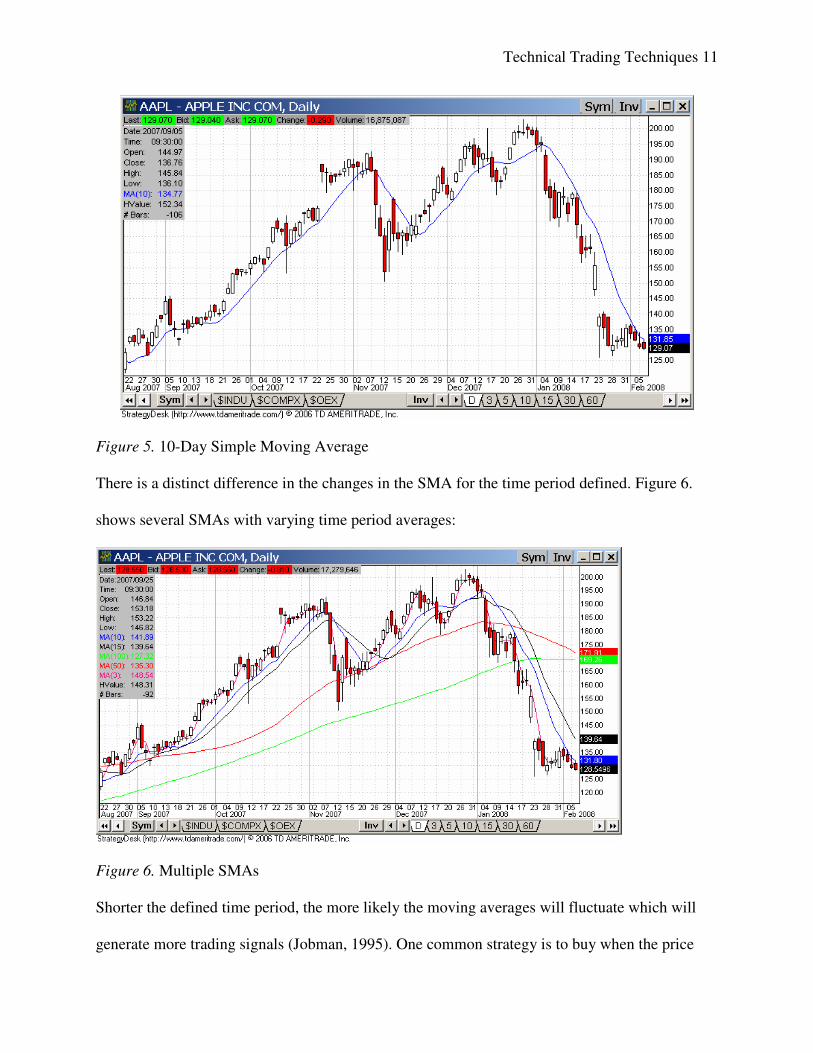
Figure 5. 10-Day Simple Moving Average
There is a distinct difference in the changes in the SMA for the time period defined. Figure 6.
shows several SMAs with varying time period averages:
Figure 6. Multiple SMAs
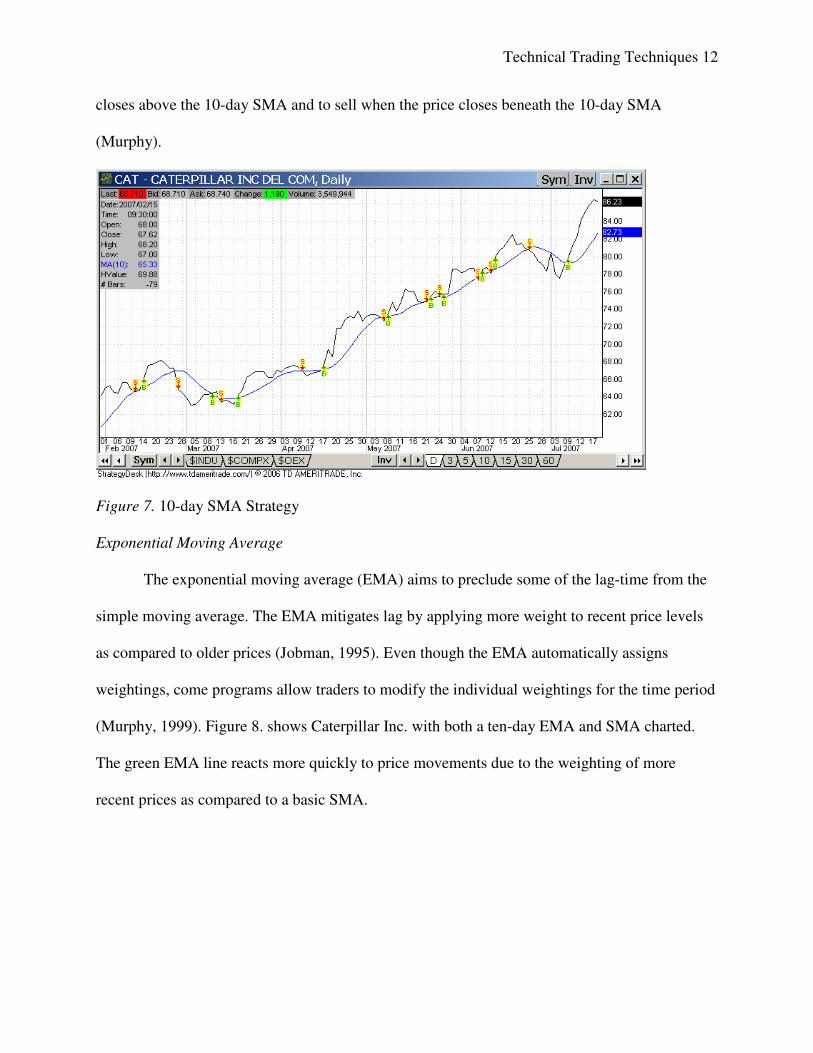
Shorter the defined time period, the more likely the moving averages will fluctuate which will
generate more trading signals (Jobman, 1995). One common strategy is to buy when the price
Technical Trading Techniques 12
closes above the 10-day SMA and to sell when the price closes beneath the 10-day SMA
(Murphy).
Figure 7. 10-day SMA Strategy
Exponential Moving Average
The exponential moving average (EMA) aims to preclude some of the lag-time from the
simple moving average. The EMA mitigates lag by applying more weight to recent price levels
as compared to older prices (Jobman, 1995). Even though the EMA automatically assigns
weightings, come programs allow traders to modify the individual weightings for the time period
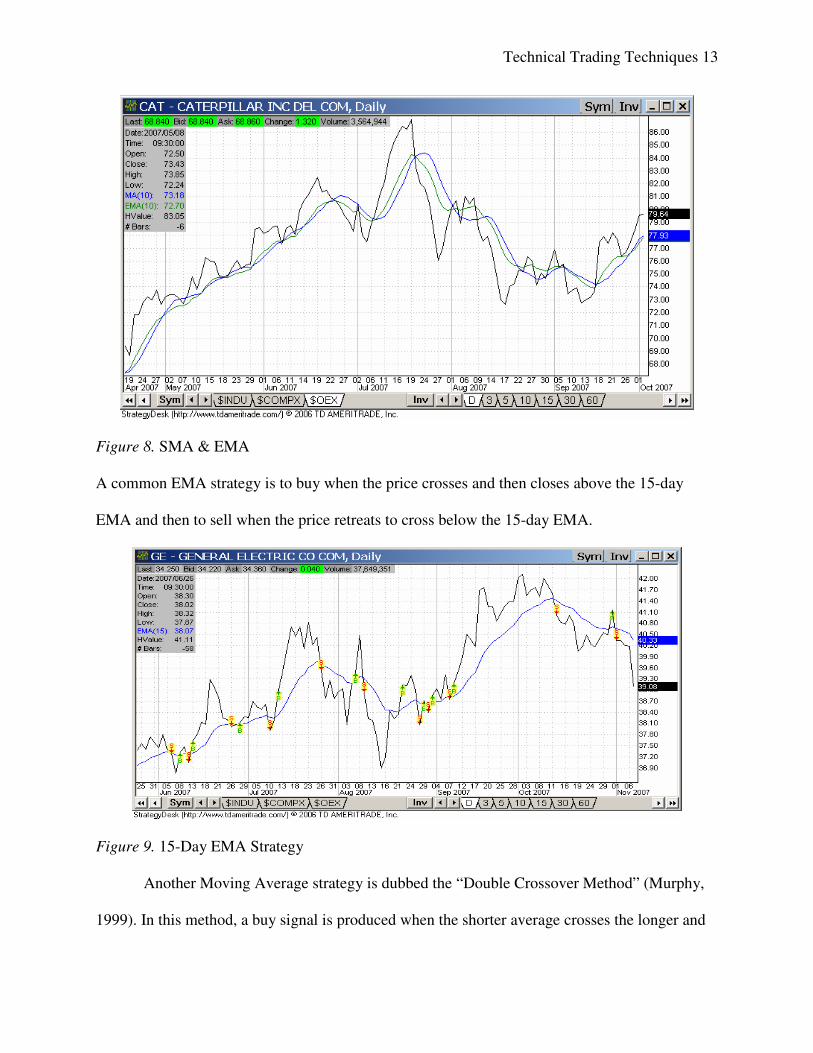
(Murphy, 1999). Figure 8. shows Caterpillar Inc. with both a ten-day EMA and SMA charted.
The green EMA line reacts more quickly to price movements due to the weighting of more
recent prices as compared to a basic SMA.
Technical Trading Techniques 13
Figure 8. SMA & EMA
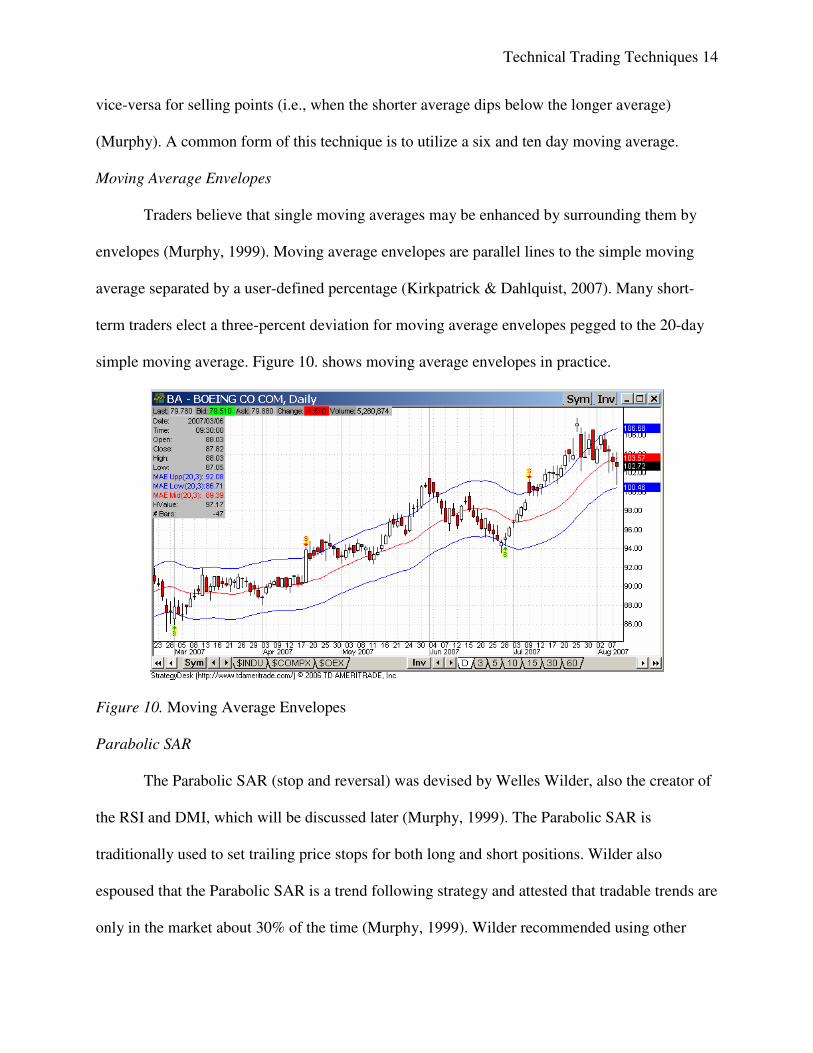
A common EMA strategy is to buy when the price crosses and then closes above the 15-day
EMA and then to sell when the price retreats to cross below the 15-day EMA.
Figure 9. 15-Day EMA Strategy
Another Moving Average strategy is dubbed the “Double Crossover Method” (Murphy,
1999). In this method, a buy signal is produced when the shorter average crosses the longer and
Technical Trading Techniques 14
vice-versa for selling points (i.e., when the shorter average dips below the longer average)
(Murphy). A common form of this technique is to utilize a six and ten day moving average.
Moving Average Envelopes
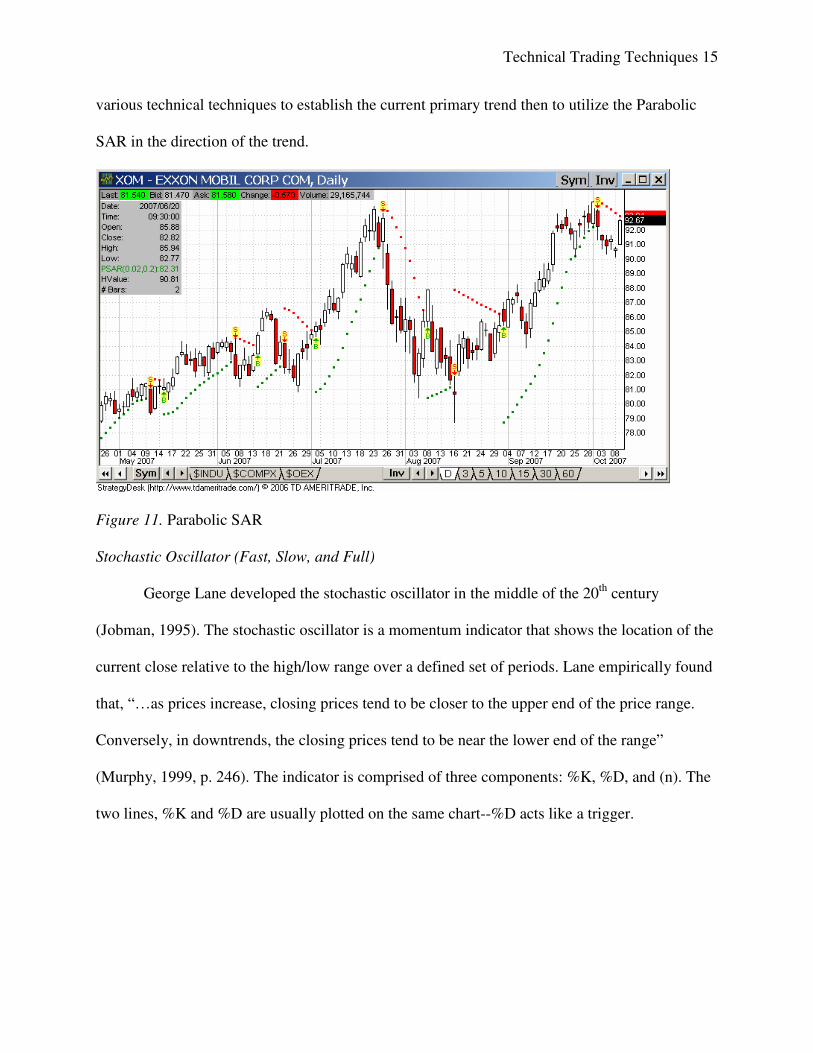
Traders believe that single moving averages may be enhanced by surrounding them by
envelopes (Murphy, 1999). Moving average envelopes are parallel lines to the simple moving
average separated by a user-defined percentage (Kirkpatrick & Dahlquist, 2007). Many short-
term traders elect a three-percent deviation for moving average envelopes pegged to the 20-day
simple moving average. Figure 10. shows moving average envelopes in practice.
Figure 10. Moving Average Envelopes
Parabolic SAR
The Parabolic SAR (stop and reversal) was devised by Welles Wilder, also the creator of
the RSI and DMI, which will be discussed later (Murphy, 1999). The Parabolic SAR is
traditionally used to set trailing price stops for both long and short positions. Wilder also
espoused that the Parabolic SAR is a trend following strategy and attested that tradable trends are
only in the market about 30% of the time (Murphy, 1999). Wilder recommended using other
Technical Trading Techniques 15
various technical techniques to establish the current primary trend then to utilize the Parabolic
SAR in the direction of the trend.
Figure 11. Parabolic SAR
Stochastic Oscillator (Fast, Slow, and Full)
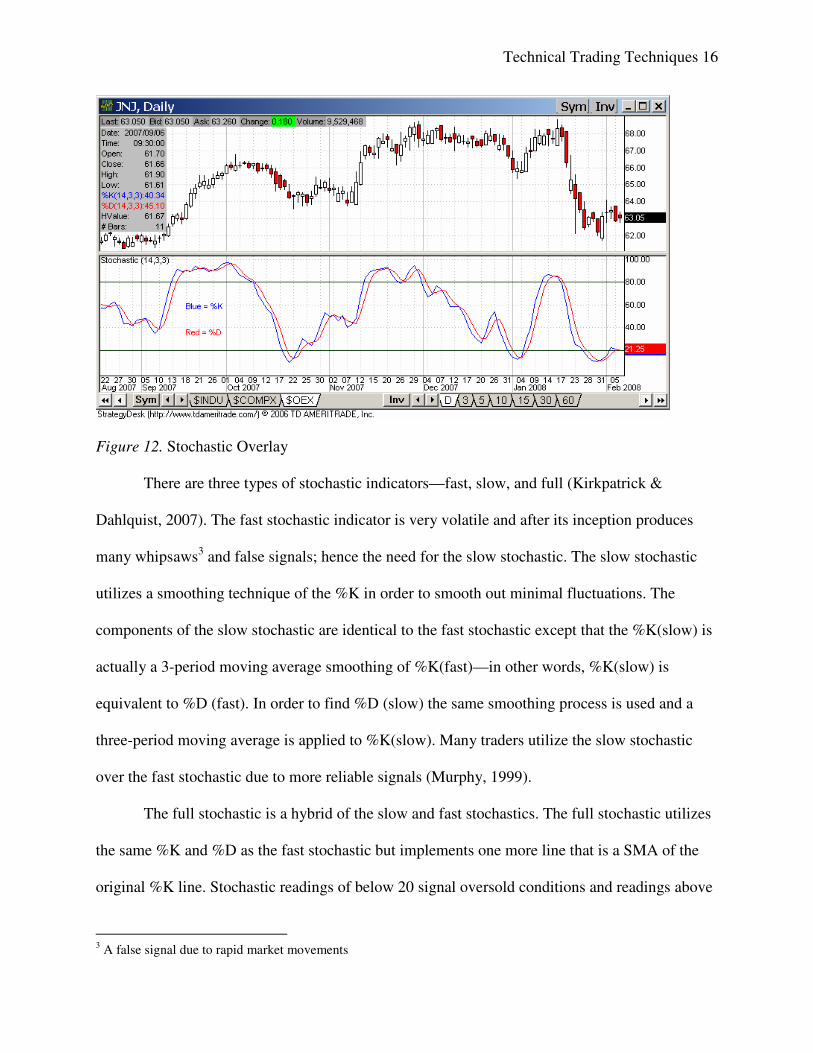
George Lane developed the stochastic oscillator in the middle of the 20th century
(Jobman, 1995). The stochastic oscillator is a momentum indicator that shows the location of the
current close relative to the high/low range over a defined set of periods. Lane empirically found
that, “…as prices increase, closing prices tend to be closer to the upper end of the price range.
Conversely, in downtrends, the closing prices tend to be near the lower end of the range”
(Murphy, 1999, p. 246). The indicator is comprised of three components: %K, %D, and (n). The
two lines, %K and %D are usually plotted on the same chart--%D acts like a trigger.
Technical Trading Techniques 16
Figure 12. Stochastic Overlay
There are three types of stochastic indicators—fast, slow, and full (Kirkpatrick &
Dahlquist, 2007). The fast stochastic indicator is very volatile and after its inception produces
many whipsaws3 and false signals; hence the need for the slow stochastic. The slow stochastic
utilizes a smoothing technique of the %K in order to smooth out minimal fluctuations. The
components of the slow stochastic are identical to the fast stochastic except that the %K(slow) is
actually a 3-period moving average smoothing of %K(fast)—in other words, %K(slow) is
equivalent to %D (fast). In order to find %D (slow) the same smoothing process is used and a
three-period moving average is applied to %K(slow). Many traders utilize the slow stochastic
over the fast stochastic due to more reliable signals (Murphy, 1999).
The full stochastic is a hybrid of the slow and fast stochastics. The full stochastic utilizes
the same %K and %D as the fast stochastic but implements one more line that is a SMA of the
original %K line. Stochastic readings of below 20 signal oversold conditions and readings above
3 A false signal due to rapid market movements
Technical Trading Techniques 17
80 are signal overbought conditions (Kirkpatrick & Dahlquist, 2007). However, Lane did not
mean to imply bearish or bullish implications via the stochastic reading. He elaborated that major
price movement can still happen once the stochastic reached these levels.
The common stochastic strategies are:
Buy when %K(Fast or slow) crosses above 20, Sell when %K(Fast or slow) crosses
below 80
Buy when %K crosses above %D, Sell when %K crosses below %D
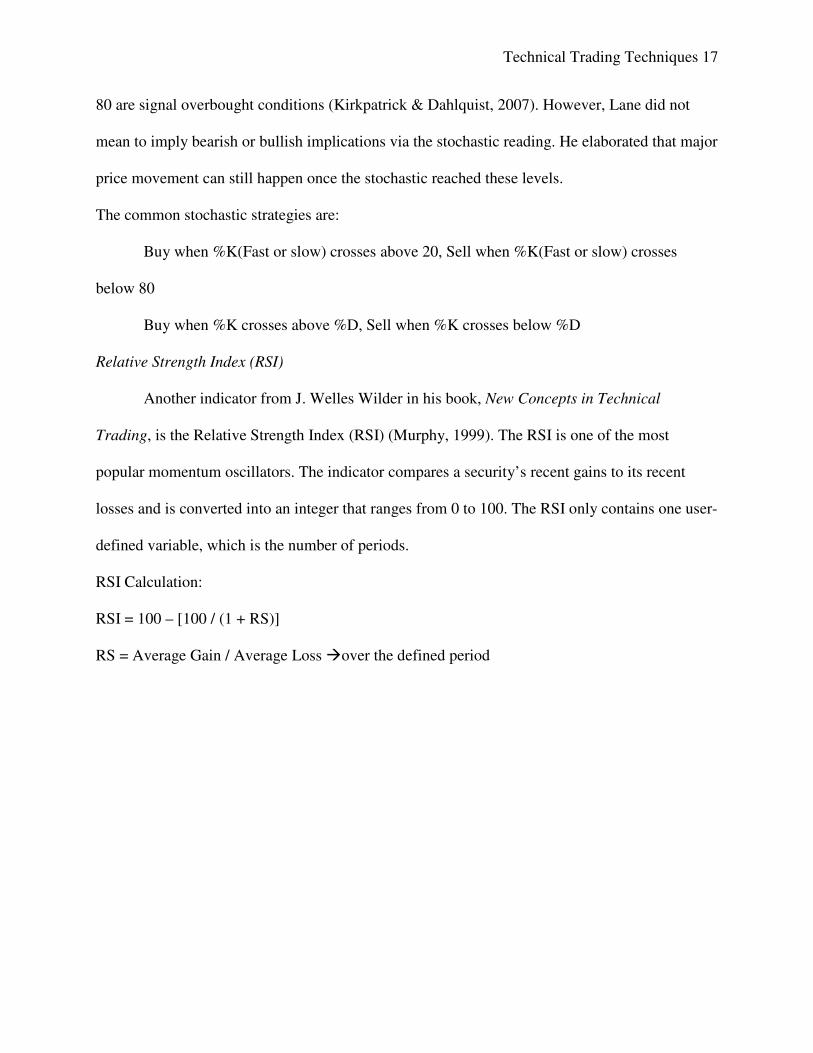
Relative Strength Index (RSI)
Another indicator from J. Welles Wilder in his book, New Concepts in Technical
Trading, is the Relative Strength Index (RSI) (Murphy, 1999). The RSI is one of the most
popular momentum oscillators. The indicator compares a security’s recent gains to its recent
losses and is converted into an integer that ranges from 0 to 100. The RSI only contains one user-
defined variable, which is the number of periods.
RSI Calculation:
RSI = 100 – [100 / (1 + RS)]
RS = Average Gain / Average Loss �over the defined period
Technical Trading Techniques 18
Figure 13. Relative Strength Index
Wilder originally employed periods of 14 for calculation. It is important to note that the
shorter the time period, the more sensitive the oscillator becomes, hence wider amplitude
(Murphy, 1999). Wilder recommended using 70 and 30 for overbought and oversold thresholds
respectively. If the RSI crosses above 30 that is considered bullish and conversely if it crosses
below 70 it points to a bearish movement (Murphy, 1999). A common usage for the RSI is once
the long-term trend has been established by some other technical strategy, to utilize the RSI as
potential market entry and exit points (Kirkpatrick & Dahlquist, 2007). The RSI also contains a
centerline of a value of 50. Traders also use this centerline as a confirmation of the upper and
lower boundaries. For example, if the RSI falls below 70, traders will wait until it continues to
drop below 50 before acting on the signal and vice-versa for bullish movements.
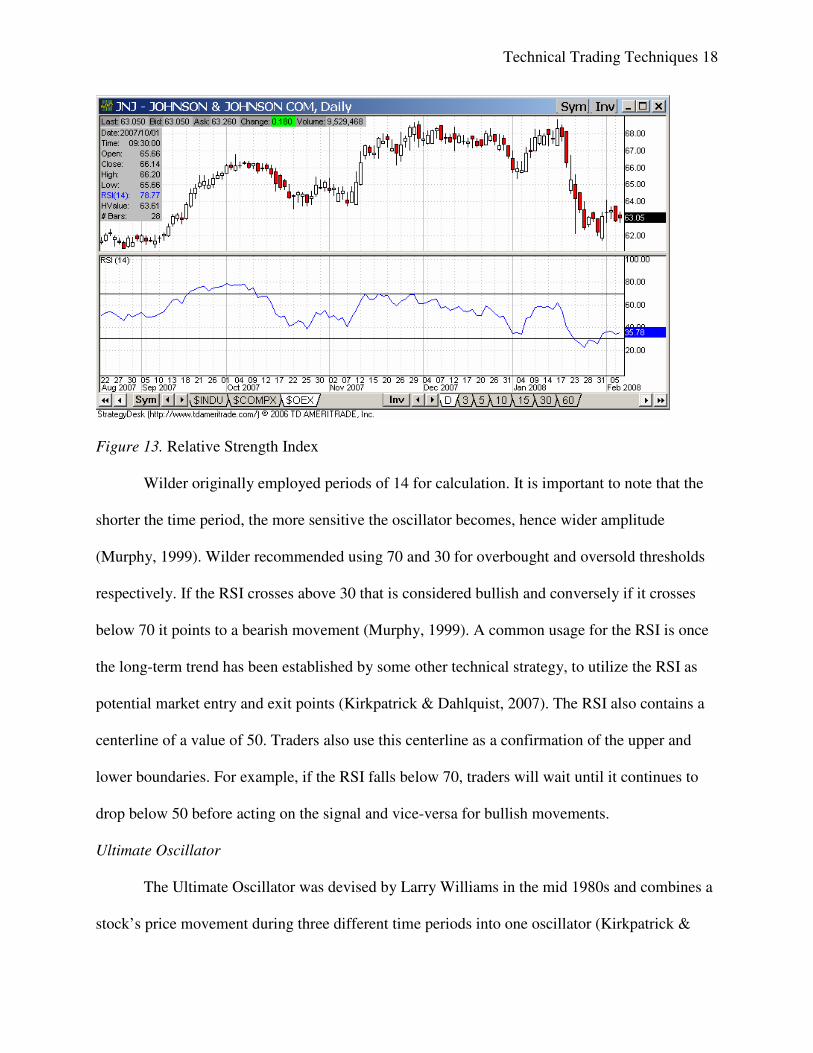
Ultimate Oscillator
The Ultimate Oscillator was devised by Larry Williams in the mid 1980s and combines a
stock’s price movement during three different time periods into one oscillator (Kirkpatrick &
Technical Trading Techniques 19
Dahlquist, 2007). This oscillator also ranges from 0-100. The Ultimate Oscillator also utilizes
three lines, 30, 50, and 70 indicating oversold, centerline, and overbought respectively. The three
time frames most commonly used are 7-periods, 14-periods, and 28-periods—these are exclusive
periods but overlap each other. This overlapping implies that the result is weighted insofar as the
most recent time period (7-periods) is used three times in the calculation and therefore has the
most influence.
Figure 14. Ultimate Oscillator
The basic trading strategy for the Ultimate Oscillator is similar to the RSI, that is to buy when
the oscillator breaks the 30 line and then to sell when it crosses below the 70 line.
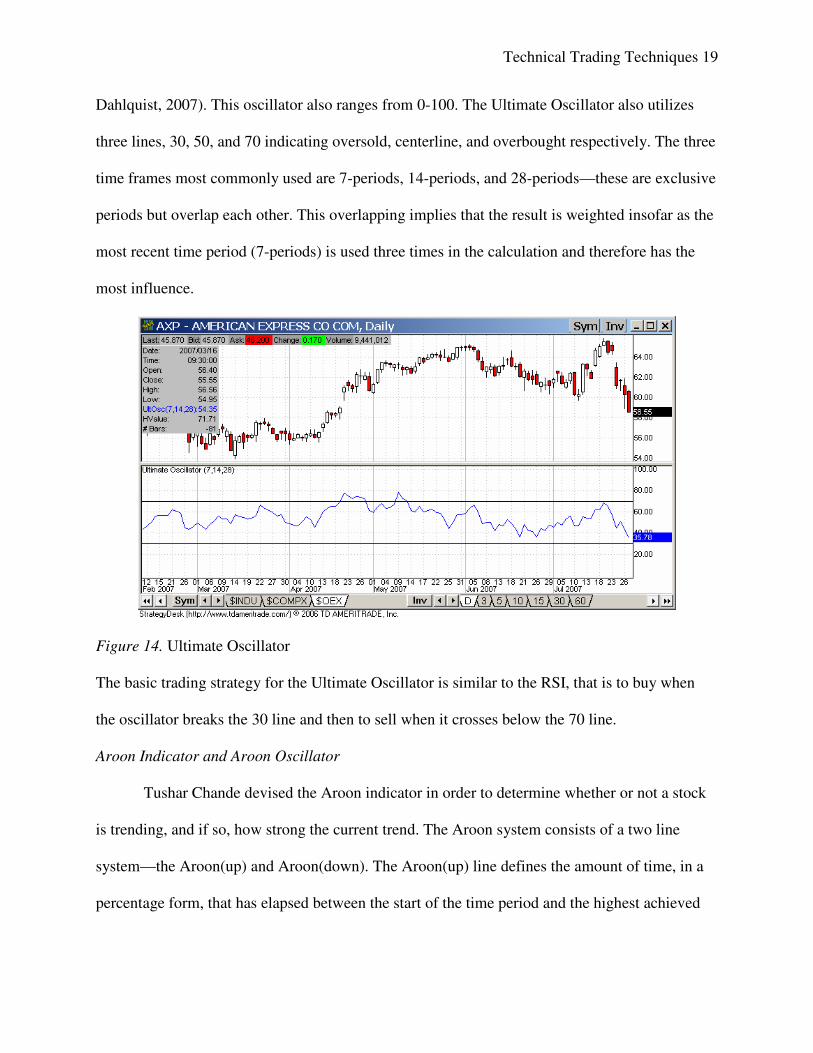
Aroon Indicator and Aroon Oscillator
Tushar Chande devised the Aroon indicator in order to determine whether or not a stock
is trending, and if so, how strong the current trend. The Aroon system consists of a two line
system—the Aroon(up) and Aroon(down). The Aroon(up) line defines the amount of time, in a
percentage form, that has elapsed between the start of the time period and the highest achieved
Technical Trading Techniques 20
price during that period. For example, if the stock closes at a new high for the defined period, the
Aroon(up) measurement would read +100. The derivation for Aroon(up) is:
[(# of periods) – (# of periods since the highest period price) / (# of periods)] x 100
The Aroon(down) is conceived in a converse matter. The Aroon(down) seeks out new
lows rather than new highs for the time period. When a new low is achieved during the time
period, the Aroon(down) will register +100. The formula for Aroon(down) is:
[(# of periods) – (# of periods since lowest period price) / (# of periods)] x 100
The Aroon Oscillator is formed by subtracting the Aroon(down) from Aroon(up). The
range of the Aroon Oscillator is -100 to +100 with zero as the centerline.
Figure 15. Aroon Oscillator
According to Chande, when Aroon(up) dips below 50, it indicates that the current trend
has lost its upward momentum. Conversely, when the Aroon(down) drops below 50, it indicates
that the current trend has lost is downward momentum. A value of 70 in either direction indicates
a strong trend.
Technical Trading Techniques 21
The greater amount that the Aroon Oscillator is from zero the stronger the trend. This
applies in both upward and downward directions. The farther positive the Aroon Oscillator
registers, the stronger the upward trend. Conversely, the more negative that oscillator registers,
the stronger the downward trend.
Moving Average Convergence/Divergence (MACD)
Developed by Gerald Appel, the Moving Average Convergence Divergence (MACD) is a
lagging oscillator that incorporates two exponential moving averages (Murphy, 1999). The
standard MACD measures the difference between a 26-day and a 12-day EMA. The user may
define shorter moving averages to respond more quickly to market movements but they [shorter
moving averages] will be more prone to false signals. On the other hand, the user may define
longer moving average periods in order to reduce false signals and rely more upon primary
trends. In practice, a 9-day smoothing of the MACD using an exponential model is used to
indicate trigger points. A bullish signal (buy) occurs when the MACD moves above its 9-day
EMA. Naturally, a bearish signal (sell) is indicated when the MACD drops below its 9-day EMA
(Murphy, 1999).
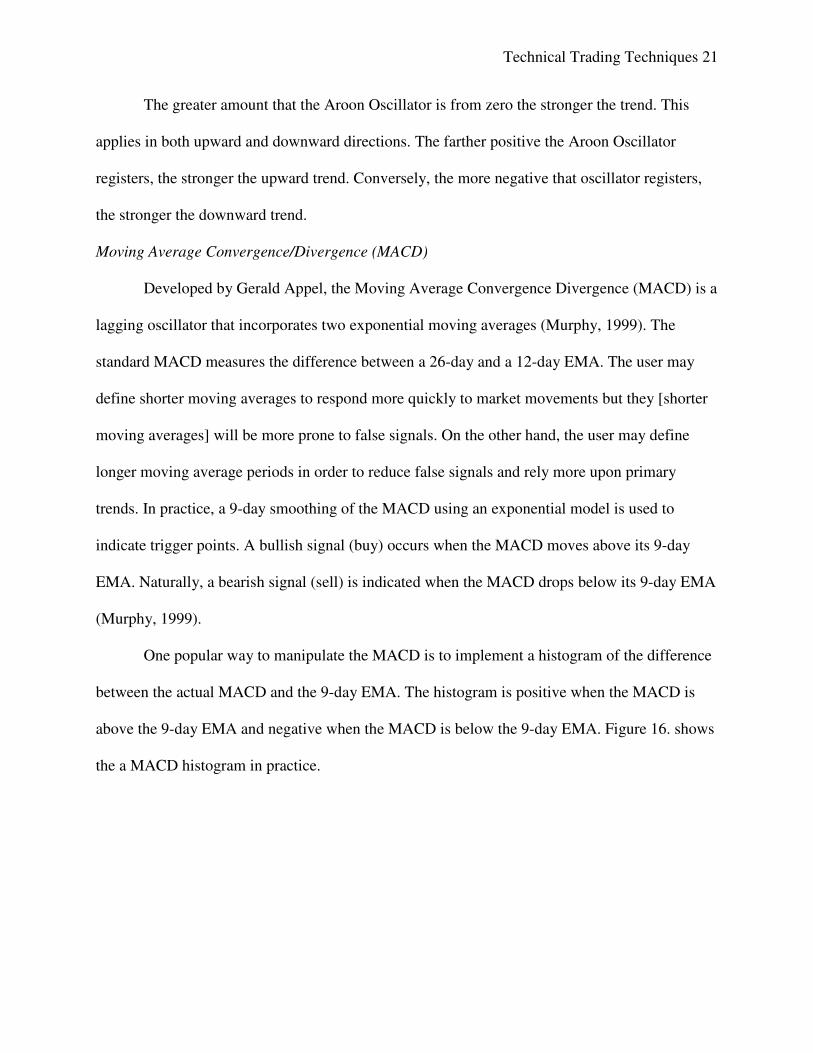
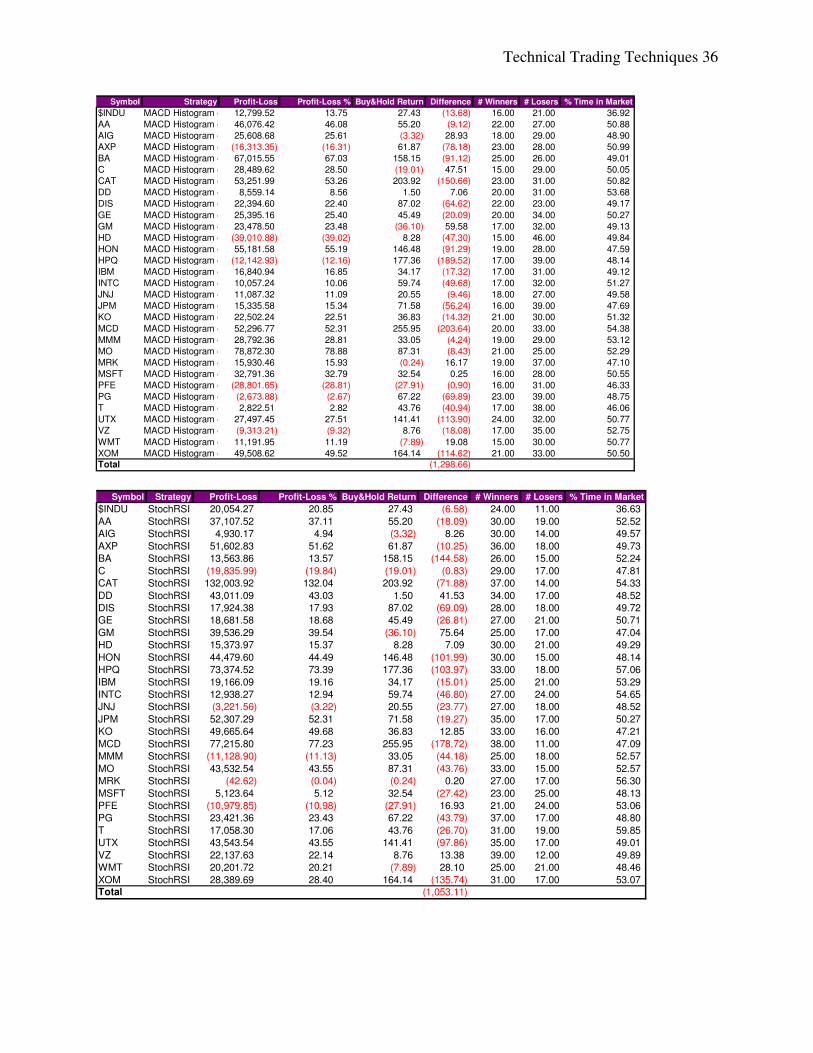
One popular way to manipulate the MACD is to implement a histogram of the difference
between the actual MACD and the 9-day EMA. The histogram is positive when the MACD is
above the 9-day EMA and negative when the MACD is below the 9-day EMA. Figure 16. shows
the a MACD histogram in practice.
Technical Trading Techniques 22
Figure 16. MACD Histogram
The MACD is a rate of change indicator. If the MACD histogram is positive and rising, it
means that the gap between the 12-day EMA and the 26-day EMA is widening. This widening
implies that positive momentum is increasing pointing to a bullish run for the stock. The
converse is also true of declining and negative MACD indicates bearish runs.
The two common bullish signals are moving average crossovers and centerline
crossovers. This happens when the MACD breaks above the 9-day EMA and when the MACD
breaks into positive territory above the zero line respectively. The same applies for bearish
signals but in the opposite directions. The biggest advantage for utilizing the histogram is a
visualization of the growing momentum in the MACD spread (Murphy, 1999).
Technical Trading Techniques 23
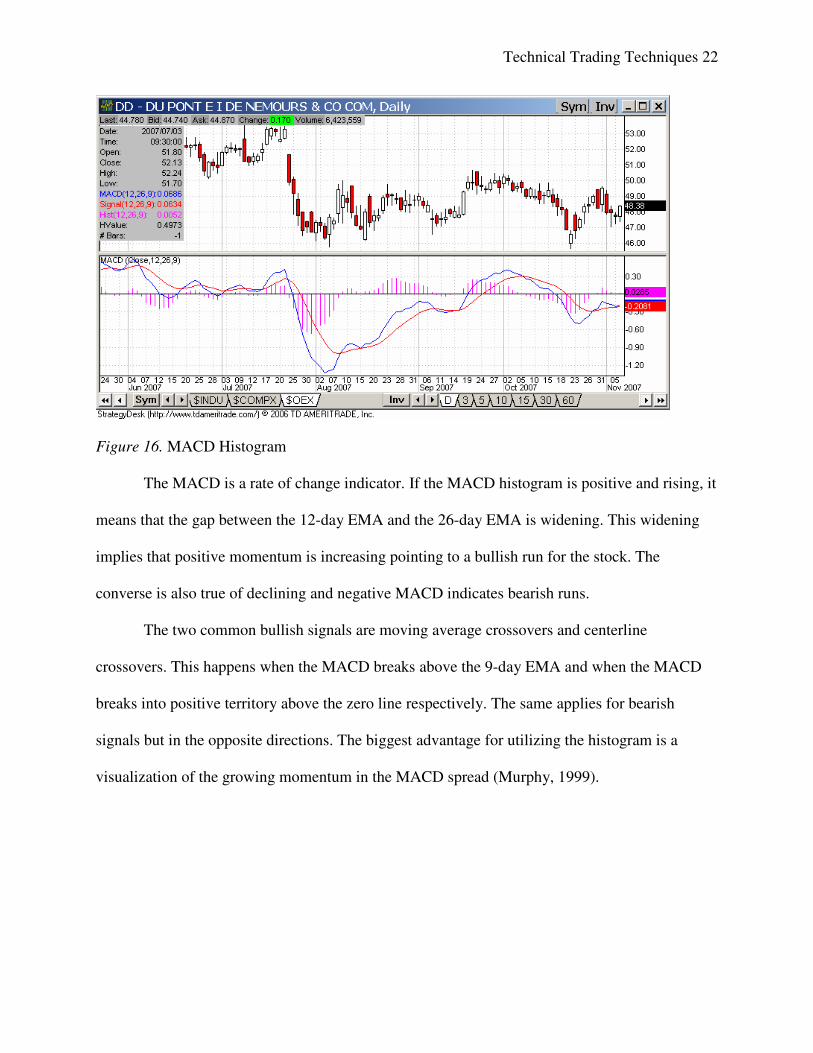
StochRSI
StochRSI is an oscillating indicator that measures the level of RSI relative to its range
over the user-defined period. The oscillator may fluctuate between 0 and 1. Tushar Chande and
Stanley Kroll developed the StochRSI in order to combat one prevalent shortcoming of the
standard RSI—often times the RSI may register between .20 and .80 for extended times but
never reach true oversold and overbought levels respectively. The two traders found that simply
obeying the foundational tenets of RSI may leave the trader with very few pure trades based
upon the fundamentals of standard RSI.
StochRSI = RSI(n) – RSI Lowest Low (n) / RSI Highest High(n) – RSI Lowest Low(n)
The StochRSI is a merging of the standard stochastic formula with RSI instead of price
actions. The new reading of StochRSI implies that when the RSI records a new low for the
period, the StochRSI will read zero. Accordingly, when the RSI registers a new high for the
period, StochRSI will read 1.00.
Figure 17. StochRSI
Technical Trading Techniques 24
Therefore, a StochRSI of .30 translates into that the current RSI is 30% higher than the lowest
RSI and 70% lower than the highest RSI reading for the period. The trading strategies for the
StochRSI mimic those of the standard RSI. Accordingly, buy and sell signals are triggered at the
0.20 and 0.80 limits. Traders often wait until the StochRSI crosses one of these limits and then
proceed in the same direction pass the 0.50 mark in order to reduce false signals.
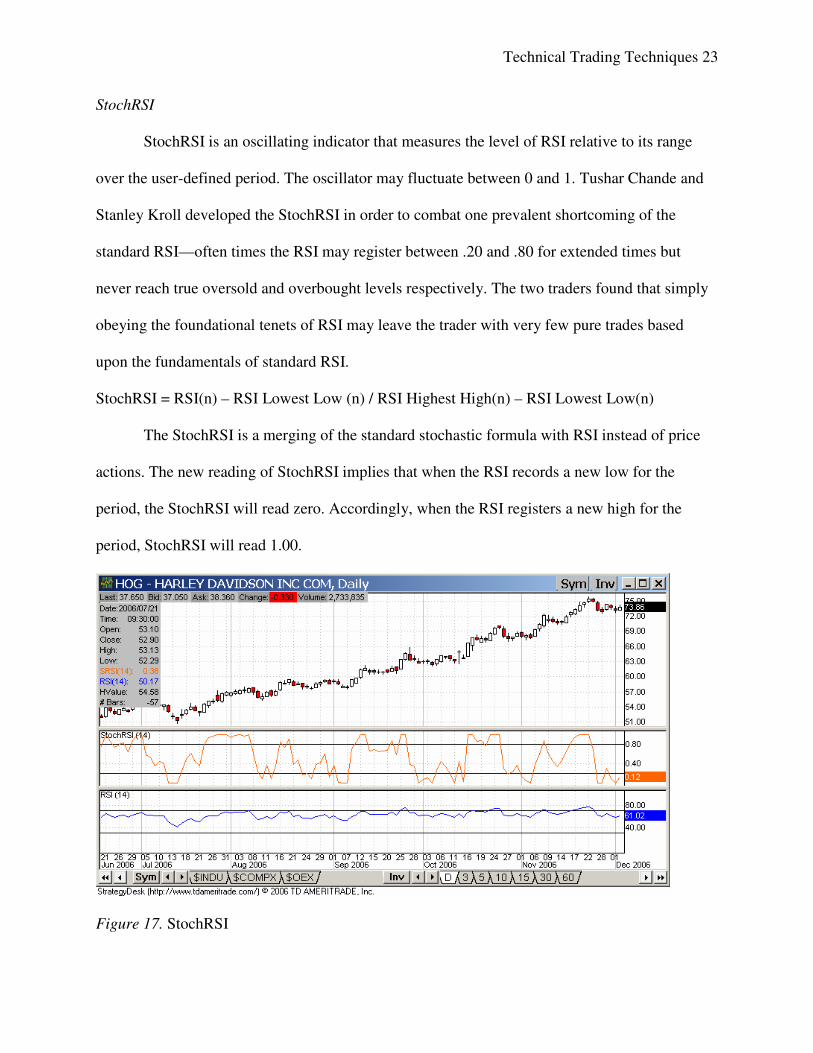
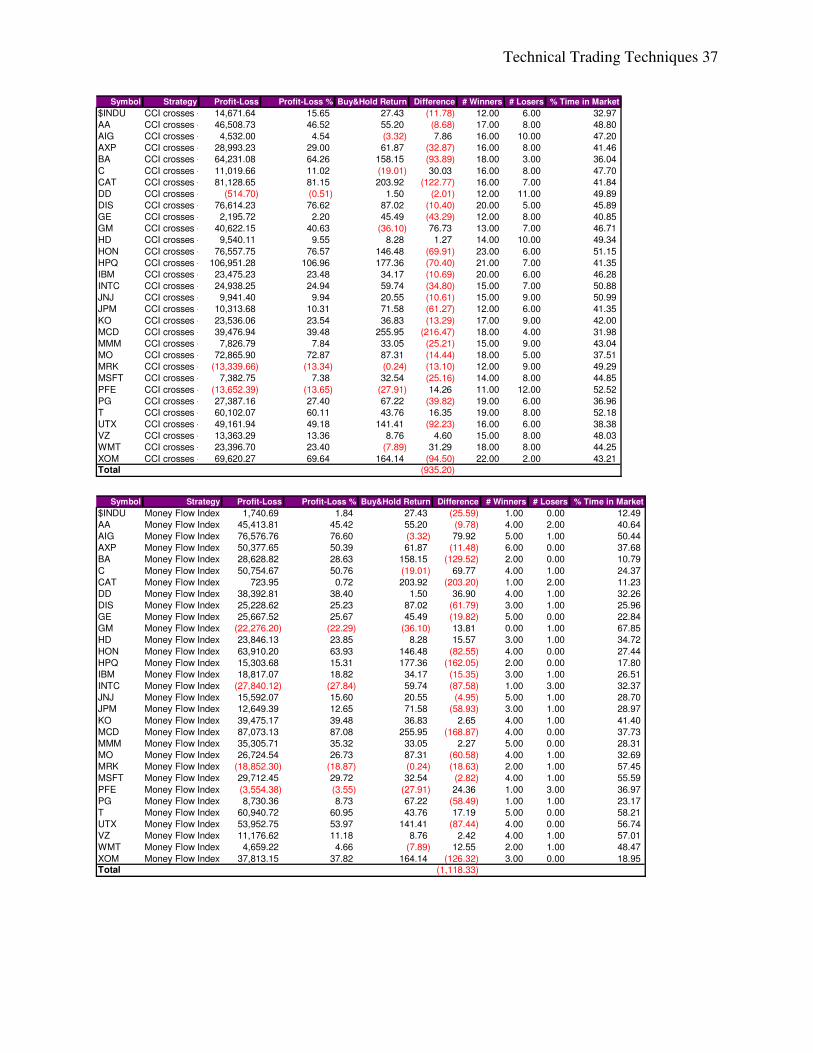
Commodity Channel Index (CCI)
Originally developed by Donald Lambert to identify cyclical movements in commodities,
the CCI has started to be used also indicate movements in equities. Lambert’s underlying
assumption was that commodities moved in cycles (Kirkpatrick & Dahlquist, 2007). The CCI
calculation is four fold and includes finding the typical price (akin to the average price), taking a
period-long simple moving average of the true price, calculating the mean deviation of the
typical price and the true price SMA, and apply a constant (Lambert utilized a constant of 0.15).
Lambert utilized this constant in order to keep the majority (70-80%) of CCI values fall between
-100 and +100.
Figure 18. Commodity Channel Index
Technical Trading Techniques 25
Lambert recommended utilizing movements above +100 and below -100 to signal buying
and selling points. Since Lambert applied a constant factor that empirically placed the CCI
between these values approximately 70-80% of the time, any movements above these values
should be empirically 20-30% of the time. The CCI can be used for both long and short positions
with the thresholds for entering and closing positions being +100 and -100 respectively
(Kirkpatrick & Dahlquist, 2007). Traders today use CCI as another oscillator to determine levels
of overbought and oversold, akin to RSI (Murphy, 1999).
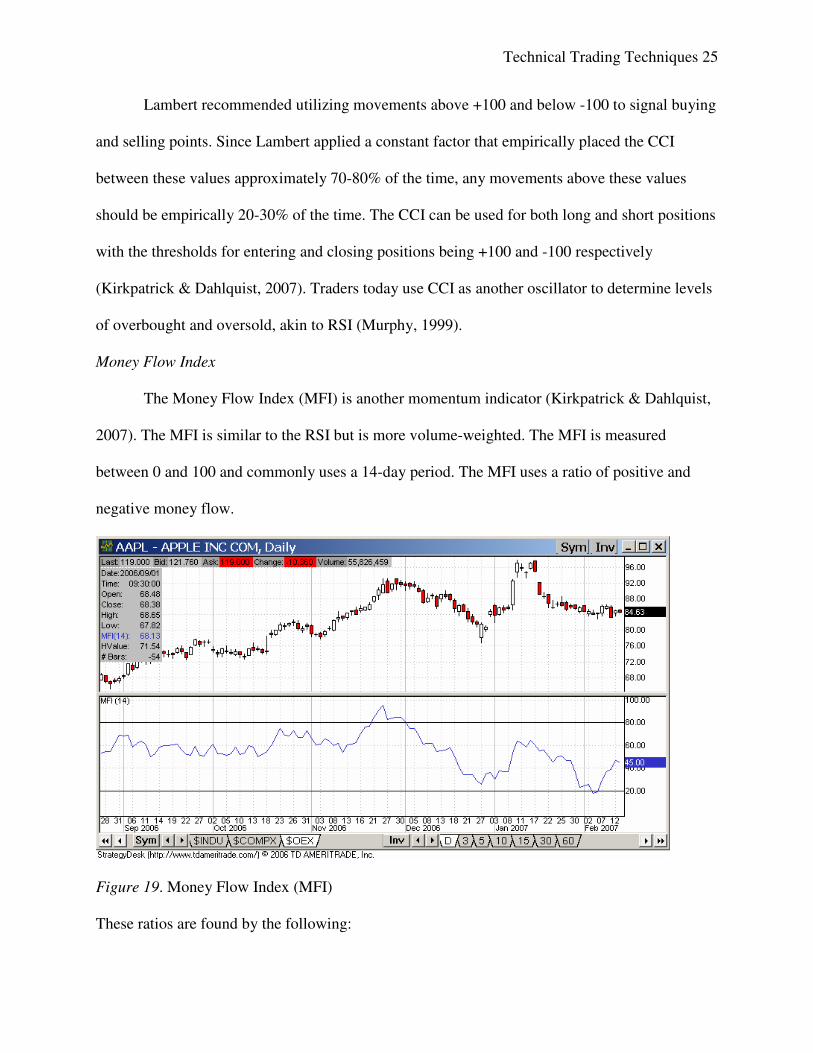
Money Flow Index
The Money Flow Index (MFI) is another momentum indicator (Kirkpatrick & Dahlquist,
2007). The MFI is similar to the RSI but is more volume-weighted. The MFI is measured
between 0 and 100 and commonly uses a 14-day period. The MFI uses a ratio of positive and
negative money flow.
Figure 19. Money Flow Index (MFI)
These ratios are found by the following:

Technical Trading Techniques 26
Typical Price = [(Day High + Day Low + Day Close) / 3]
Money Flow = (Typical Price) x (Volume)
Money flow is considered positive if the typical price is greater today than yesterday.
Conversely, money flow is considered negative if the typical price is less today than yesterday.
The totals for both positive and negative are averaged over a 14-day period and are input in the
equation:
Money Ratio = (Aggregate Average Positive Money Flow / Aggregate Average Negative Money
Flow)
Money Flow Index = 100 – [100 / (1 + Money Ratio)] (Kirkpatrick & Dahlquist, 2007)
Similar trading strategies are implemented with the MFI as with the RSI. Accordingly, a stock is
considered overbought if the MFI reaches above 80 and oversold if below 20.
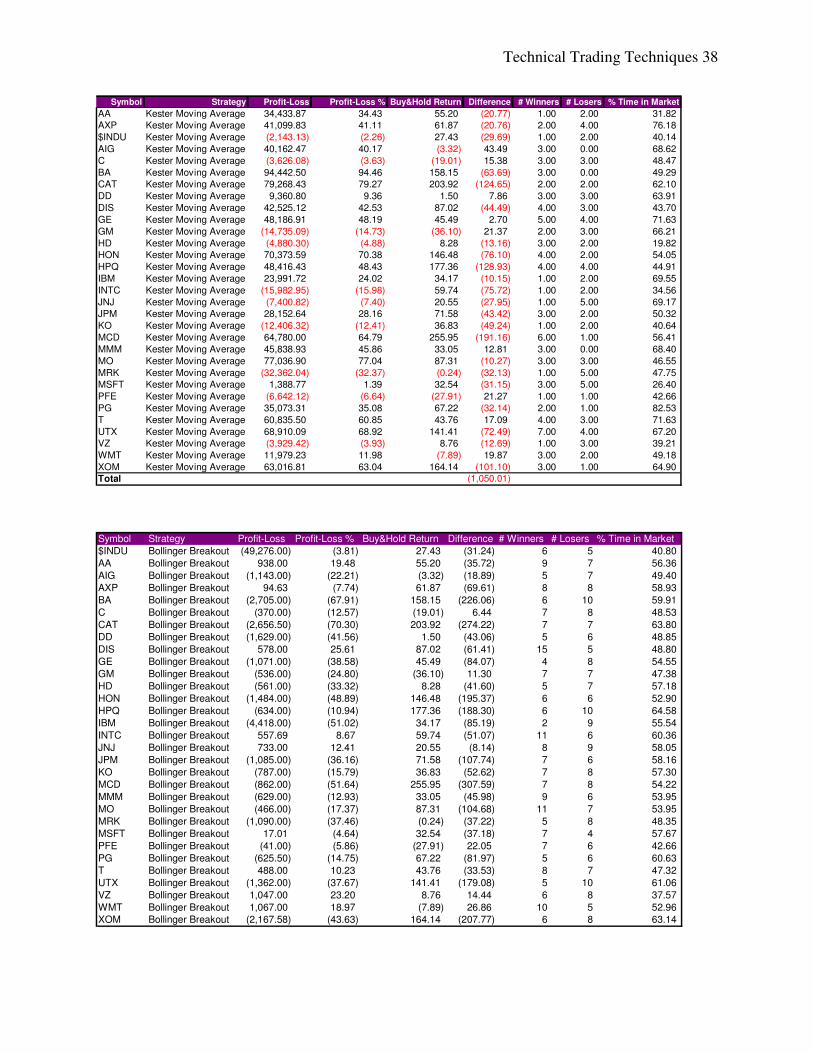
Kester Moving Average System
In his book, Quantitative Trading Strategies, Kester (2003) incorporates the popular
moving average crossover system with a twist, in order to alleviate some of the whipsaws
associated with intermittent market volatility. His proposed strategy uses the moving average of
daily highs and lows, as compared to the traditional closing values. Buy signals are signaled
when the price closes above the SMA of highs for the previous 20 periods; while sell signals are
issued when the price crosses below the SMA of lows for the previous 20 periods. Also, the
moving averages need to be higher or lower than their respective signals 20 periods ago for the
signals to be triggered (Kester, 2003).
Results
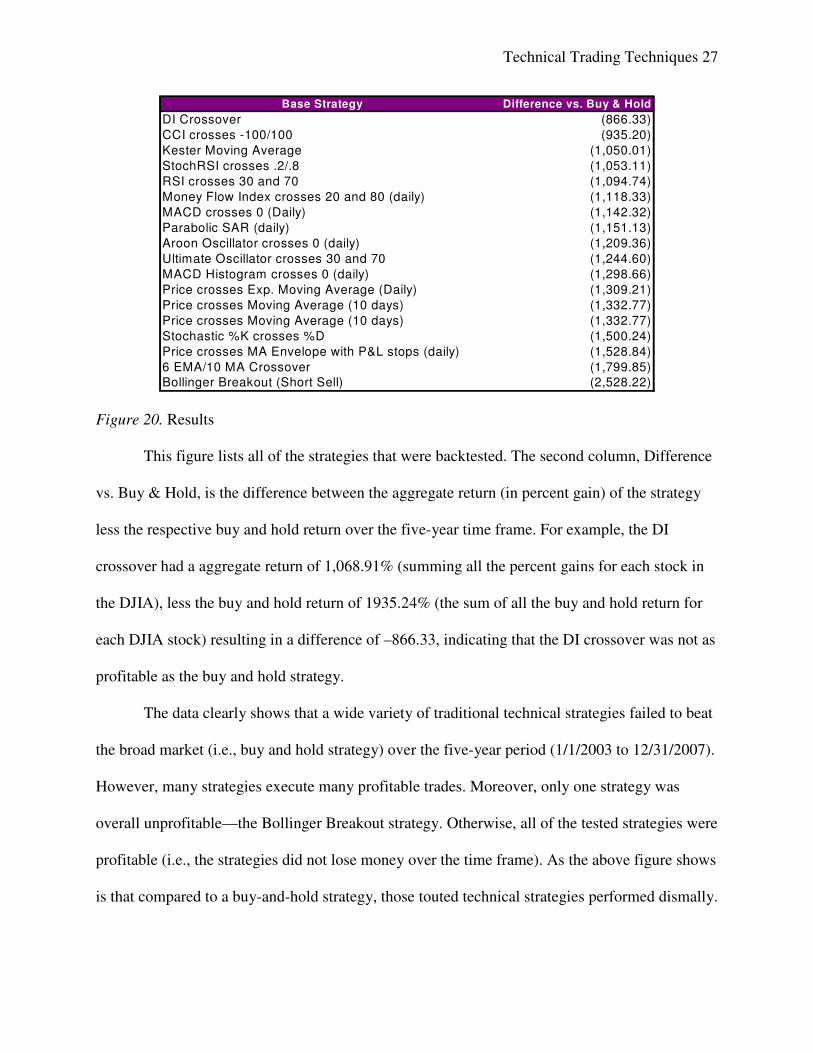
Below is a comparison of the various strategies described in this paper.
Technical Trading Techniques 27
Base Strategy Difference vs. Buy & Hold
DI Crossover (866.33)
CCI crosses -100/100 (935.20)
Kester Moving Average (1,050.01)
StochRSI crosses .2/.8 (1,053.11)
RSI crosses 30 and 70 (1,094.74)
Money Flow Index crosses 20 and 80 (daily) (1,118.33)
MACD crosses 0 (Daily) (1,142.32)
Parabolic SAR (daily) (1,151.13)
Aroon Oscillator crosses 0 (daily) (1,209.36)
Ultimate Oscillator crosses 30 and 70 (1,244.60)
MACD Histogram crosses 0 (daily) (1,298.66)
Price crosses Exp. Moving Average (Daily) (1,309.21)
Price crosses Moving Average (10 days) (1,332.77)
Price crosses Moving Average (10 days) (1,332.77)
Stochastic %K crosses %D (1,500.24)
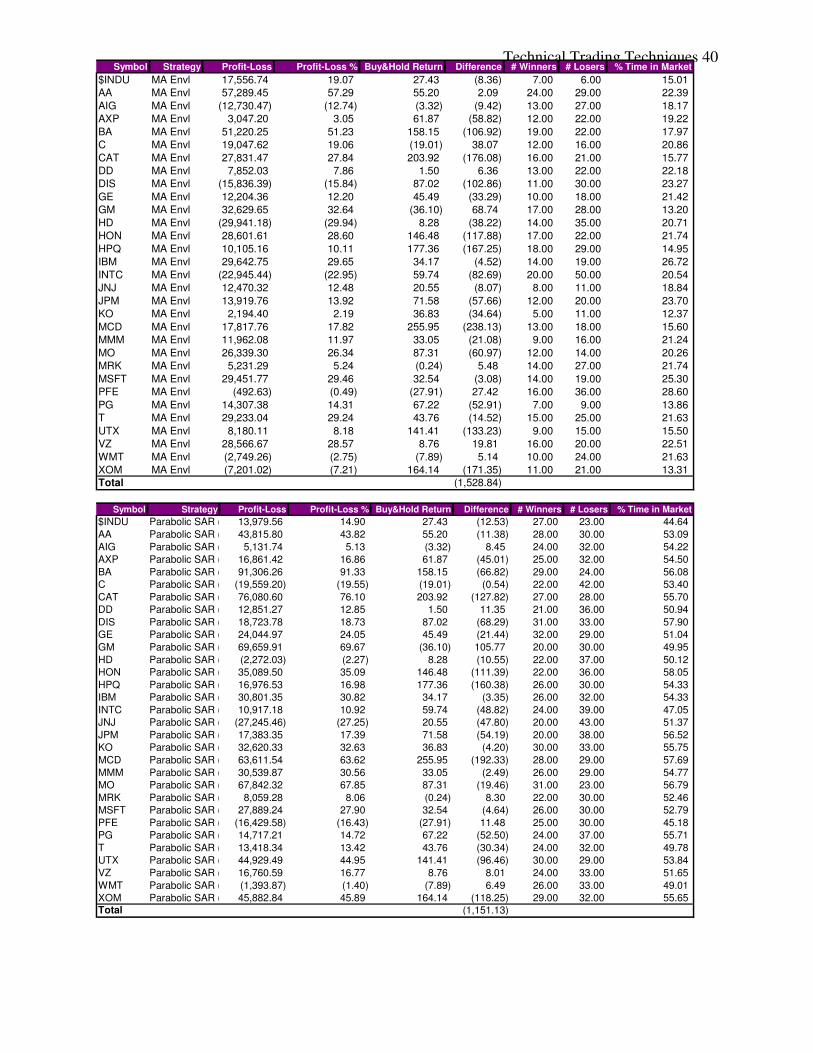
Price crosses MA Envelope with P&L stops (daily) (1,528.84)
6 EMA/10 MA Crossover (1,799.85)Bollinger Breakout (Short Sell) (2,528.22)
Figure 20. Results
This figure lists all of the strategies that were backtested. The second column, Difference
vs. Buy & Hold, is the difference between the aggregate return (in percent gain) of the strategy
less the respective buy and hold return over the five-year time frame. For example, the DI
crossover had a aggregate return of 1,068.91% (summing all the percent gains for each stock in
the DJIA), less the buy and hold return of 1935.24% (the sum of all the buy and hold return for
each DJIA stock) resulting in a difference of –866.33, indicating that the DI crossover was not as
profitable as the buy and hold strategy.
The data clearly shows that a wide variety of traditional technical strategies failed to beat
the broad market (i.e., buy and hold strategy) over the five-year period (1/1/2003 to 12/31/2007).
However, many strategies execute many profitable trades. Moreover, only one strategy was
overall unprofitable—the Bollinger Breakout strategy. Otherwise, all of the tested strategies were
profitable (i.e., the strategies did not lose money over the time frame). As the above figure shows
is that compared to a buy-and-hold strategy, those touted technical strategies performed dismally.
Technical Trading Techniques 28
On a statistical breakdown, the mean gain per trade of all the strategies was 1.52%.
Thousands of trades were made throughout the trading time frame and the fact that the mean was
positive further indicates that the strategies as a whole were profitable.
The highest mean was 6.61, which was for the RSI strategy. The lowest mean per trade was –
1.31 from the Bollinger Breakout strategy.
While conducting several thousands trades over a long-period of time, as is the goal with
general technical strategies and day trading, the dispersion of variation relative to the means
plays an important rule in gauging the efficacy of the strategy. For example, if the mean gain per
trade of a strategy is 5%, one may immediately think that is an absolute gem of a strategy and
implement it. However, if the variation of returns (i.e., the frequency of returns around the mean)
fluctuate greatly or are not a standard normal distribution, the trader could run out of capital
before he is able to reap any financial gain. Continuing with the above strategy of a 5% mean
return with an illustrative standard deviation of 10 units [percent in this case] with a normal
distribution would yield a return of –5 to +5 percent about 68% of the time. Further, the example
strategy would produce returns of –10 to +10 about 95% of the time. Therefore, variation of
return relative is paramount to the program traders4. The distinction of variation is important due
to the fact that even if over a long period of time (five years in this paper) a strategy may be
profitable, but if the variation is large enough, a trader could wipe out their trading funds before
a strategy turned profitable over time. Therefore, technical traders need to focus on profitable
strategies that have minimum variation of returns. The strategy that posted the smallest standard
deviation was the stochastic strategy (2.22 standard deviation). However, the mean was
marginally profitable (0.0546% per trade). In order to solve the low standard deviation with low
4 Program traders are traders, who set technical or mathematical entry points via computer software and trade the same amounts per trade every time their trigger points are reached, regardless of the equity. They purport that by using such disciplined strategies they remove human error in the decision making process.
Technical Trading Techniques 29
profit margin trade-off, evaluating the coefficient of variation5 is warranted. Basically, the
coefficient of variation measures the risk-benefit trade-off—the smaller the coefficient of
variation, the better the risk-benefit trade-off. The strategy with the lowest coefficient of
variation was the RSI strategy. The RSI strategy posted a mean gain of 6.61% per trade with a
standard deviation of 10.61. Based on risk-benefit, this is the most efficient technical strategy
tested. However, in terms of straight profit gains, buy and hold is still more profitable.
5 Coefficient of variation is a measure of the standard deviation relative to the mean

Technical Trading Techniques 30
References
Appel, G. (2005). Technical analysis: Power tools for active investors. Upper Saddle River:
Financial Times Prentice Hall.
Barnes, R.M. (1973). The Dow theory can make you rich. New Rochelle: Arlington House.
Bensignor, R. (Ed.). (2000). New thinking in technical analysis: Trading models form the
masters. Princeton: Bloomberg Press.
Edwards, R.D., & Magee, J. (1998). Technical analysis of stock trends, (7th ed.). Boca Raton: St.
Lucie Press.
Fosback, N. (1976). Stock market logic: A sophisticated approach to profits on Wall Street.
Chicago: Dearborn Financial Publishing, Inc.
Fritz, S., & Shumate, A.M. (1939). Making the Dow theory work. New York: Barron’s.
Greiner, P.P., & Whitcomb, H.C. (1969). The Dow theory and the seventy-year forecast record.
Larchmont: Investors Intelligence, Inc.
Hagin, R.L. (1979). The Dow-Jones guide to modern portfolio theory. Homewood: Dow Jones-
Irwin.
Hamilton, W.P. (1922). The stock market barometer. New York: Harper & Brothers Publishers.
Jobman, D. R. (Ed.). (1995). The handbook of technical analysis: A comprehensive guide to
analytical methods, trading systems and technical indicators. New York: McGraw-Hill.
Kester, L. (2003). Quantitative trading strategies: Harnessing the power of quantitative
techniques to create a winning trading program. New York: McGraw-Hill.
Kirkpatrick, C.D., & Dahlquist, J.R. (2007). Technical analysis: The complete resource for
financial market technicians. Upper Saddle River: Financial Times Press.
Krass, P. (1999). The book of investing wisdom. New York: John Wiley & Sons, Inc.

Technical Trading Techniques 31
Malkiel, B.G. (1999). A random walk down Wall Street. New York: W.W. Norton & Company.
Murphy, J.J. (1999). Technical analysis of the financial markets: A comprehensive guide to
trading methods and applications. Paramus: New York Institute of Finance.
New York Institute of Finance, (1989). Securities analysis: A personal seminar. New York:
Paramus: New York Institute of Finance.
Pistolese, C. (1994). Using technical analysis: A step-by-step guide to understanding and
applying stock market charting techniques. Chicago: Probus Publishing Co.
Pring, M.J. (2002). How to select stocks using technical analysis. New York: McGraw-Hill.
Rhea, R. (1932). The Dow Theory. Binghamton: Vail-Ballou Press, Inc.
Rhea, R. (1938). Dow’s theory applied to business and banking. New York: Simon and Schuster.
Sambul, N.J. (1995). Top trader’s guide to technical analysis. Chicago: Dearborn Financial
Publishing, Inc.
Schwager, J.D. (1996). Technical Analysis. New York: John Wiley & Sons, Inc.
Sheimo, M.D. (1989). Dow theory redux: The classic investment theory revised and updated for
the 1990’s. Chicago: Probus Publishing Co.
Sheimo, M.D. (1998). Cashing in on the Dow: Using Dow theory to trade and determine trends
in today’s markets. Chicago: John Magee, Inc.
Siegel, J.G., Shim, J.K., Qureshi, A., & Brauchler, J. (2000). International encyclopedia of
technical analysis. Chicago: Glenlake Publishing Company, Ltd.
Velez, O., & Capra, G., (2000). Tools and tactics for the master day trader. New York:
McGraw-Hill.
Technical Trading Techniques 32
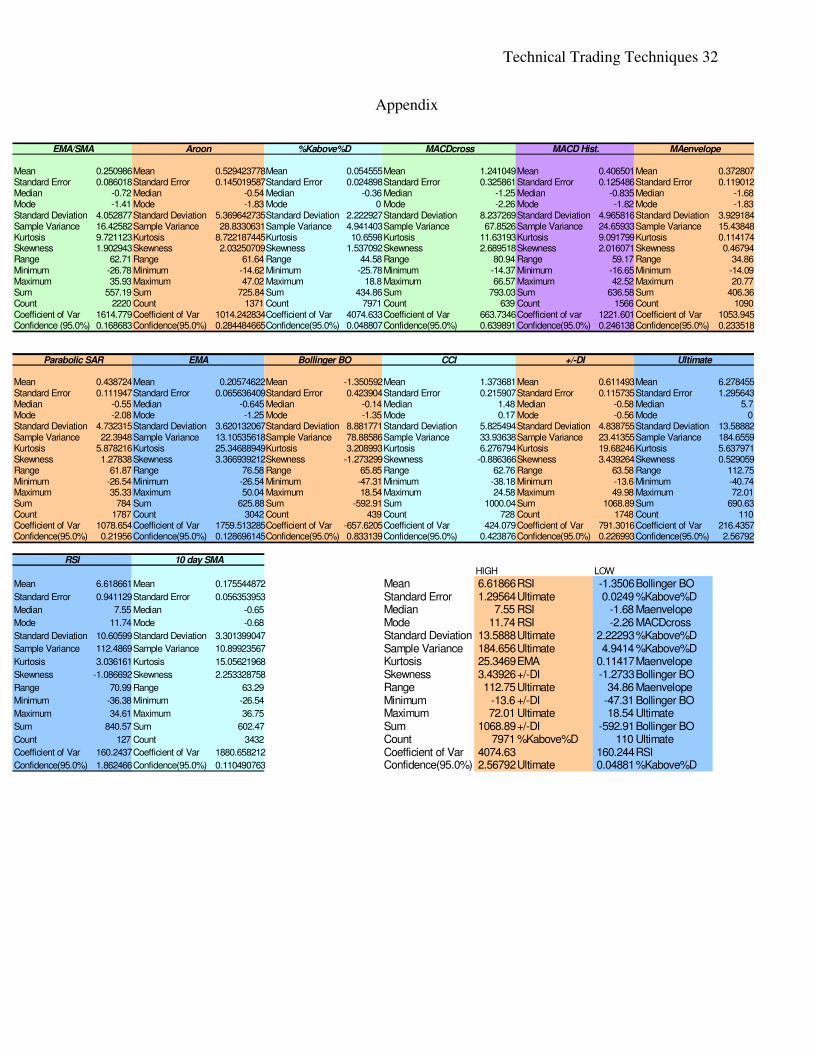
Appendix
EMA/SMA Aroon %Kabove%D MACDcross MACD Hist. MAenvelope
Mean 0.250986 Mean 0.529423778 Mean 0.054555 Mean 1.241049 Mean 0.406501 Mean 0.372807Standard Error 0.086018 Standard Error 0.145019587 Standard Error 0.024898 Standard Error 0.325861 Standard Error 0.125486 Standard Error 0.119012Median -0.72 Median -0.54 Median -0.36 Median -1.25 Median -0.835 Median -1.68 Mode -1.41 Mode -1.83 Mode 0 Mode -2.26 Mode -1.82 Mode -1.83 Standard Deviation 4.052877 Standard Deviation 5.369642735 Standard Deviation 2.222927 Standard Deviation 8.237269 Standard Deviation 4.965816 Standard Deviation 3.929184Sample Variance 16.42582 Sample Variance 28.8330631 Sample Variance 4.941403 Sample Variance 67.8526 Sample Variance 24.65933 Sample Variance 15.43848Kurtosis 9.721123 Kurtosis 8.722187445 Kurtosis 10.6598 Kurtosis 11.63193 Kurtosis 9.091799 Kurtosis 0.114174Skewness 1.902943 Skewness 2.03250709 Skewness 1.537092 Skewness 2.689518 Skewness 2.016071 Skewness 0.46794 Range 62.71 Range 61.64 Range 44.58 Range 80.94 Range 59.17 Range 34.86 Minimum -26.78 Minimum -14.62 Minimum -25.78 Minimum -14.37 Minimum -16.65 Minimum -14.09 Maximum 35.93 Maximum 47.02 Maximum 18.8 Maximum 66.57 Maximum 42.52 Maximum 20.77 Sum 557.19 Sum 725.84 Sum 434.86 Sum 793.03 Sum 636.58 Sum 406.36 Count 2220 Count 1371 Count 7971 Count 639 Count 1566 Count 1090 Coefficient of Var 1614.779 Coefficient of Var 1014.242834 Coefficient of Var 4074.633 Coefficient of Var 663.7346 Coefficient of var 1221.601 Coefficient of Var 1053.945Confidence (95.0%) 0.168683 Confidence(95.0%) 0.284484665 Confidence(95.0%) 0.048807 Confidence(95.0%) 0.639891 Confidence(95.0%) 0.246138 Confidence(95.0%) 0.233518
Parabolic SAR EMA Bollinger BO CCI +/-DI Ultimate Mean 0.438724 Mean 0.20574622 Mean -1.350592 Mean 1.373681 Mean 0.611493 Mean 6.278455Standard Error 0.111947 Standard Error 0.065636409 Standard Error 0.423904 Standard Error 0.215907 Standard Error 0.115735 Standard Error 1.295643Median -0.55 Median -0.645 Median -0.14 Median 1.48 Median -0.58 Median 5.7 Mode -2.08 Mode -1.25 Mode -1.35 Mode 0.17 Mode -0.56 Mode 0 Standard Deviation 4.732315 Standard Deviation 3.620132067 Standard Deviation 8.881771 Standard Deviation 5.825494 Standard Deviation 4.838755 Standard Deviation 13.58882Sample Variance 22.3948 Sample Variance 13.10535618 Sample Variance 78.88586 Sample Variance 33.93638 Sample Variance 23.41355 Sample Variance 184.6559Kurtosis 5.878216 Kurtosis 25.34688949 Kurtosis 3.208993 Kurtosis 6.276794 Kurtosis 19.68246 Kurtosis 5.637971Skewness 1.27838 Skewness 3.366939212 Skewness -1.273299 Skewness -0.886366 Skewness 3.439264 Skewness 0.529059Range 61.87 Range 76.58 Range 65.85 Range 62.76 Range 63.58 Range 112.75 Minimum -26.54 Minimum -26.54 Minimum -47.31 Minimum -38.18 Minimum -13.6 Minimum -40.74 Maximum 35.33 Maximum 50.04 Maximum 18.54 Maximum 24.58 Maximum 49.98 Maximum 72.01 Sum 784 Sum 625.88 Sum -592.91 Sum 1000.04 Sum 1068.89 Sum 690.63 Count 1787 Count 3042 Count 439 Count 728 Count 1748 Count 110 Coefficient of Var 1078.654 Coefficient of Var 1759.513285 Coefficient of Var -657.6205 Coefficient of Var 424.079 Coefficient of Var 791.3016 Coefficient of Var 216.4357Confidence(95.0%) 0.21956 Confidence(95.0%) 0.128696145 Confidence(95.0%) 0.833139 Confidence(95.0%) 0.423876 Confidence(95.0%) 0.226993 Confidence(95.0%) 2.56792
RSI 10 day SMA HIGH LOW
Mean 6.618661 Mean 0.175544872 Mean 6.61866 RSI -1.3506 Bollinger BO Standard Error 0.941129 Standard Error 0.056353953 Standard Error 1.29564 Ultimate 0.0249 %Kabove%D Median 7.55 Median -0.65 Median 7.55 RSI -1.68 Maenvelope Mode 11.74 Mode -0.68 Mode 11.74 RSI -2.26 MACDcross Standard Deviation 10.60599 Standard Deviation 3.301399047 Standard Deviation 13.5888 Ultimate 2.22293 %Kabove%D Sample Variance 112.4869 Sample Variance 10.89923567 Sample Variance 184.656 Ultimate 4.9414 %Kabove%D Kurtosis 3.036161 Kurtosis 15.05621968 Kurtosis 25.3469 EMA 0.11417 Maenvelope Skewness -1.086692 Skewness 2.253328758 Skewness 3.43926 +/-DI -1.2733 Bollinger BO Range 70.99 Range 63.29 Range 112.75 Ultimate 34.86 Maenvelope Minimum -36.38 Minimum -26.54 Minimum -13.6 +/-DI -47.31 Bollinger BO Maximum 34.61 Maximum 36.75 Maximum 72.01 Ultimate 18.54 Ultimate Sum 840.57 Sum 602.47 Sum 1068.89 +/-DI -592.91 Bollinger BO Count 127 Count 3432 Count 7971 %Kabove%D 110 Ultimate Coefficient of Var 160.2437 Coefficient of Var 1880.658212 Coefficient of Var 4074.63 160.244 RSI Confidence(95.0%) 1.862466 Confidence(95.0%) 0.110490763 Confidence(95.0%) 2.56792 Ultimate 0.04881 %Kabove%D
Technical Trading Techniques 33
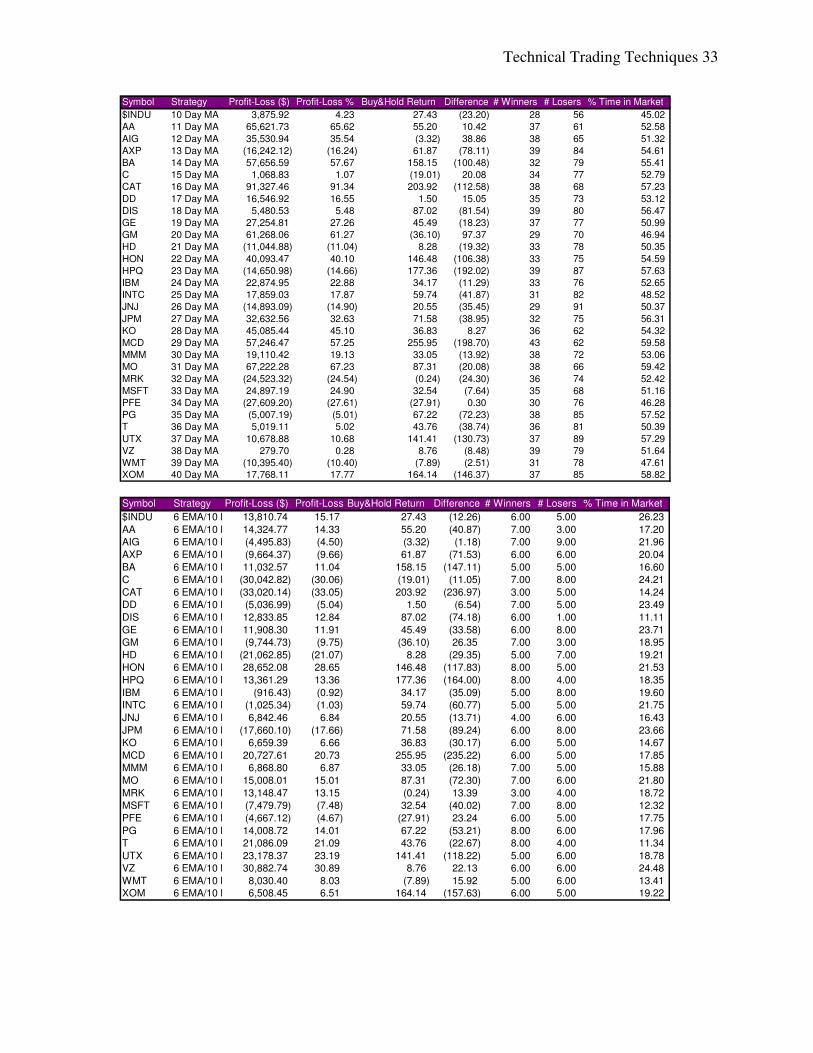
Symbol Strategy Profit-Loss ($) Profit-Loss %Buy&Hold Return Difference # Winners # Losers % Time in Market
$INDU 6 EMA/10 MA Crossover13,810.74 15.17 27.43 (12.26) 6.00 5.00 26.23
AA 6 EMA/10 MA Crossover14,324.77 14.33 55.20 (40.87) 7.00 3.00 17.20AIG 6 EMA/10 MA Crossover(4,495.83) (4.50) (3.32) (1.18) 7.00 9.00 21.96
AXP 6 EMA/10 MA Crossover(9,664.37) (9.66) 61.87 (71.53) 6.00 6.00 20.04
BA 6 EMA/10 MA Crossover11,032.57 11.04 158.15 (147.11) 5.00 5.00 16.60C 6 EMA/10 MA Crossover(30,042.82) (30.06) (19.01) (11.05) 7.00 8.00 24.21
CAT 6 EMA/10 MA Crossover(33,020.14) (33.05) 203.92 (236.97) 3.00 5.00 14.24DD 6 EMA/10 MA Crossover(5,036.99) (5.04) 1.50 (6.54) 7.00 5.00 23.49
DIS 6 EMA/10 MA Crossover12,833.85 12.84 87.02 (74.18) 6.00 1.00 11.11
GE 6 EMA/10 MA Crossover11,908.30 11.91 45.49 (33.58) 6.00 8.00 23.71GM 6 EMA/10 MA Crossover(9,744.73) (9.75) (36.10) 26.35 7.00 3.00 18.95
HD 6 EMA/10 MA Crossover(21,062.85) (21.07) 8.28 (29.35) 5.00 7.00 19.21HON 6 EMA/10 MA Crossover28,652.08 28.65 146.48 (117.83) 8.00 5.00 21.53
HPQ 6 EMA/10 MA Crossover13,361.29 13.36 177.36 (164.00) 8.00 4.00 18.35
IBM 6 EMA/10 MA Crossover(916.43) (0.92) 34.17 (35.09) 5.00 8.00 19.60INTC 6 EMA/10 MA Crossover(1,025.34) (1.03) 59.74 (60.77) 5.00 5.00 21.75
JNJ 6 EMA/10 MA Crossover6,842.46 6.84 20.55 (13.71) 4.00 6.00 16.43
JPM 6 EMA/10 MA Crossover(17,660.10) (17.66) 71.58 (89.24) 6.00 8.00 23.66KO 6 EMA/10 MA Crossover6,659.39 6.66 36.83 (30.17) 6.00 5.00 14.67
MCD 6 EMA/10 MA Crossover20,727.61 20.73 255.95 (235.22) 6.00 5.00 17.85MMM 6 EMA/10 MA Crossover6,868.80 6.87 33.05 (26.18) 7.00 5.00 15.88
MO 6 EMA/10 MA Crossover15,008.01 15.01 87.31 (72.30) 7.00 6.00 21.80
MRK 6 EMA/10 MA Crossover13,148.47 13.15 (0.24) 13.39 3.00 4.00 18.72MSFT 6 EMA/10 MA Crossover(7,479.79) (7.48) 32.54 (40.02) 7.00 8.00 12.32
PFE 6 EMA/10 MA Crossover(4,667.12) (4.67) (27.91) 23.24 6.00 5.00 17.75
PG 6 EMA/10 MA Crossover14,008.72 14.01 67.22 (53.21) 8.00 6.00 17.96T 6 EMA/10 MA Crossover21,086.09 21.09 43.76 (22.67) 8.00 4.00 11.34
UTX 6 EMA/10 MA Crossover23,178.37 23.19 141.41 (118.22) 5.00 6.00 18.78VZ 6 EMA/10 MA Crossover30,882.74 30.89 8.76 22.13 6.00 6.00 24.48
WMT 6 EMA/10 MA Crossover8,030.40 8.03 (7.89) 15.92 5.00 6.00 13.41XOM 6 EMA/10 MA Crossover6,508.45 6.51 164.14 (157.63) 6.00 5.00 19.22
Symbol Strategy Profit-Loss ($) Profit-Loss % Buy&Hold Return Difference # Winners # Losers % Time in Market
$INDU 10 Day MA 3,875.92 4.23 27.43 (23.20) 28 56 45.02
AA 11 Day MA 65,621.73 65.62 55.20 10.42 37 61 52.58
AIG 12 Day MA 35,530.94 35.54 (3.32) 38.86 38 65 51.32
AXP 13 Day MA (16,242.12) (16.24) 61.87 (78.11) 39 84 54.61
BA 14 Day MA 57,656.59 57.67 158.15 (100.48) 32 79 55.41
C 15 Day MA 1,068.83 1.07 (19.01) 20.08 34 77 52.79
CAT 16 Day MA 91,327.46 91.34 203.92 (112.58) 38 68 57.23
DD 17 Day MA 16,546.92 16.55 1.50 15.05 35 73 53.12
DIS 18 Day MA 5,480.53 5.48 87.02 (81.54) 39 80 56.47
GE 19 Day MA 27,254.81 27.26 45.49 (18.23) 37 77 50.99
GM 20 Day MA 61,268.06 61.27 (36.10) 97.37 29 70 46.94
HD 21 Day MA (11,044.88) (11.04) 8.28 (19.32) 33 78 50.35
HON 22 Day MA 40,093.47 40.10 146.48 (106.38) 33 75 54.59
HPQ 23 Day MA (14,650.98) (14.66) 177.36 (192.02) 39 87 57.63
IBM 24 Day MA 22,874.95 22.88 34.17 (11.29) 33 76 52.65
INTC 25 Day MA 17,859.03 17.87 59.74 (41.87) 31 82 48.52
JNJ 26 Day MA (14,893.09) (14.90) 20.55 (35.45) 29 91 50.37
JPM 27 Day MA 32,632.56 32.63 71.58 (38.95) 32 75 56.31
KO 28 Day MA 45,085.44 45.10 36.83 8.27 36 62 54.32
MCD 29 Day MA 57,246.47 57.25 255.95 (198.70) 43 62 59.58
MMM 30 Day MA 19,110.42 19.13 33.05 (13.92) 38 72 53.06
MO 31 Day MA 67,222.28 67.23 87.31 (20.08) 38 66 59.42
MRK 32 Day MA (24,523.32) (24.54) (0.24) (24.30) 36 74 52.42
MSFT 33 Day MA 24,897.19 24.90 32.54 (7.64) 35 68 51.16
PFE 34 Day MA (27,609.20) (27.61) (27.91) 0.30 30 76 46.28
PG 35 Day MA (5,007.19) (5.01) 67.22 (72.23) 38 85 57.52
T 36 Day MA 5,019.11 5.02 43.76 (38.74) 36 81 50.39
UTX 37 Day MA 10,678.88 10.68 141.41 (130.73) 37 89 57.29
VZ 38 Day MA 279.70 0.28 8.76 (8.48) 39 79 51.64
WMT 39 Day MA (10,395.40) (10.40) (7.89) (2.51) 31 78 47.61XOM 40 Day MA 17,768.11 17.77 164.14 (146.37) 37 85 58.82
Technical Trading Techniques 34
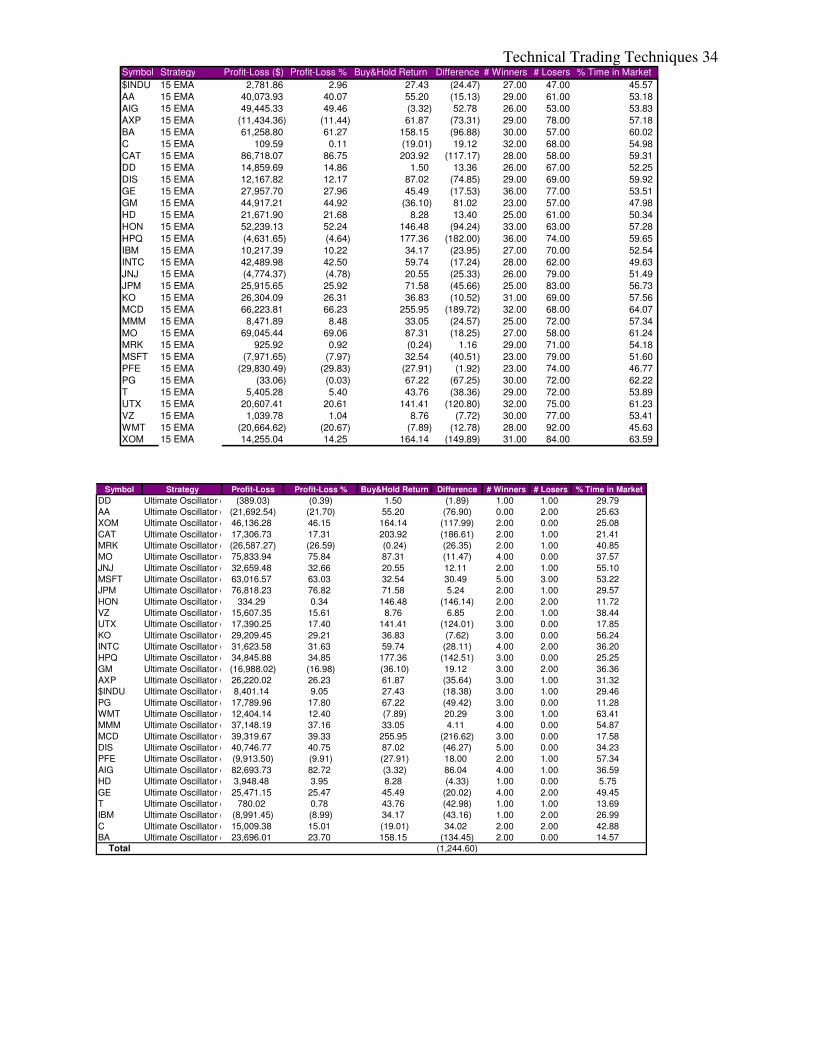
Symbol Strategy Profit-Loss Profit-Loss % Buy&Hold Return Difference # Winners # Losers % Time in Market
DD Ultimate Oscillator crosses 30 and 70(389.03) (0.39) 1.50 (1.89) 1.00 1.00 29.79AA Ultimate Oscillator crosses 30 and 70(21,692.54) (21.70) 55.20 (76.90) 0.00 2.00 25.63
XOM Ultimate Oscillator crosses 30 and 7046,136.28 46.15 164.14 (117.99) 2.00 0.00 25.08
CAT Ultimate Oscillator crosses 30 and 7017,306.73 17.31 203.92 (186.61) 2.00 1.00 21.41MRK Ultimate Oscillator crosses 30 and 70(26,587.27) (26.59) (0.24) (26.35) 2.00 1.00 40.85MO Ultimate Oscillator crosses 30 and 7075,833.94 75.84 87.31 (11.47) 4.00 0.00 37.57
JNJ Ultimate Oscillator crosses 30 and 7032,659.48 32.66 20.55 12.11 2.00 1.00 55.10MSFT Ultimate Oscillator crosses 30 and 7063,016.57 63.03 32.54 30.49 5.00 3.00 53.22JPM Ultimate Oscillator crosses 30 and 7076,818.23 76.82 71.58 5.24 2.00 1.00 29.57
HON Ultimate Oscillator crosses 30 and 70334.29 0.34 146.48 (146.14) 2.00 2.00 11.72VZ Ultimate Oscillator crosses 30 and 7015,607.35 15.61 8.76 6.85 2.00 1.00 38.44UTX Ultimate Oscillator crosses 30 and 7017,390.25 17.40 141.41 (124.01) 3.00 0.00 17.85
KO Ultimate Oscillator crosses 30 and 7029,209.45 29.21 36.83 (7.62) 3.00 0.00 56.24
INTC Ultimate Oscillator crosses 30 and 7031,623.58 31.63 59.74 (28.11) 4.00 2.00 36.20HPQ Ultimate Oscillator crosses 30 and 7034,845.88 34.85 177.36 (142.51) 3.00 0.00 25.25
GM Ultimate Oscillator crosses 30 and 70(16,988.02) (16.98) (36.10) 19.12 3.00 2.00 36.36
AXP Ultimate Oscillator crosses 30 and 7026,220.02 26.23 61.87 (35.64) 3.00 1.00 31.32$INDU Ultimate Oscillator crosses 30 and 708,401.14 9.05 27.43 (18.38) 3.00 1.00 29.46
PG Ultimate Oscillator crosses 30 and 7017,789.96 17.80 67.22 (49.42) 3.00 0.00 11.28
WMT Ultimate Oscillator crosses 30 and 7012,404.14 12.40 (7.89) 20.29 3.00 1.00 63.41MMM Ultimate Oscillator crosses 30 and 7037,148.19 37.16 33.05 4.11 4.00 0.00 54.87
MCD Ultimate Oscillator crosses 30 and 7039,319.67 39.33 255.95 (216.62) 3.00 0.00 17.58
DIS Ultimate Oscillator crosses 30 and 7040,746.77 40.75 87.02 (46.27) 5.00 0.00 34.23PFE Ultimate Oscillator crosses 30 and 70(9,913.50) (9.91) (27.91) 18.00 2.00 1.00 57.34
AIG Ultimate Oscillator crosses 30 and 7082,693.73 82.72 (3.32) 86.04 4.00 1.00 36.59
HD Ultimate Oscillator crosses 30 and 703,948.48 3.95 8.28 (4.33) 1.00 0.00 5.75
GE Ultimate Oscillator crosses 30 and 7025,471.15 25.47 45.49 (20.02) 4.00 2.00 49.45T Ultimate Oscillator crosses 30 and 70780.02 0.78 43.76 (42.98) 1.00 1.00 13.69IBM Ultimate Oscillator crosses 30 and 70(8,991.45) (8.99) 34.17 (43.16) 1.00 2.00 26.99
C Ultimate Oscillator crosses 30 and 7015,009.38 15.01 (19.01) 34.02 2.00 2.00 42.88BA Ultimate Oscillator crosses 30 and 7023,696.01 23.70 158.15 (134.45) 2.00 0.00 14.57
Total (1,244.60)
Symbol Strategy Profit-Loss ($) Profit-Loss % Buy&Hold Return Difference # Winners # Losers % Time in Market
$INDU 15 EMA 2,781.86 2.96 27.43 (24.47) 27.00 47.00 45.57
AA 15 EMA 40,073.93 40.07 55.20 (15.13) 29.00 61.00 53.18
AIG 15 EMA 49,445.33 49.46 (3.32) 52.78 26.00 53.00 53.83
AXP 15 EMA (11,434.36) (11.44) 61.87 (73.31) 29.00 78.00 57.18
BA 15 EMA 61,258.80 61.27 158.15 (96.88) 30.00 57.00 60.02
C 15 EMA 109.59 0.11 (19.01) 19.12 32.00 68.00 54.98
CAT 15 EMA 86,718.07 86.75 203.92 (117.17) 28.00 58.00 59.31
DD 15 EMA 14,859.69 14.86 1.50 13.36 26.00 67.00 52.25
DIS 15 EMA 12,167.82 12.17 87.02 (74.85) 29.00 69.00 59.92
GE 15 EMA 27,957.70 27.96 45.49 (17.53) 36.00 77.00 53.51
GM 15 EMA 44,917.21 44.92 (36.10) 81.02 23.00 57.00 47.98
HD 15 EMA 21,671.90 21.68 8.28 13.40 25.00 61.00 50.34
HON 15 EMA 52,239.13 52.24 146.48 (94.24) 33.00 63.00 57.28
HPQ 15 EMA (4,631.65) (4.64) 177.36 (182.00) 36.00 74.00 59.65
IBM 15 EMA 10,217.39 10.22 34.17 (23.95) 27.00 70.00 52.54
INTC 15 EMA 42,489.98 42.50 59.74 (17.24) 28.00 62.00 49.63
JNJ 15 EMA (4,774.37) (4.78) 20.55 (25.33) 26.00 79.00 51.49
JPM 15 EMA 25,915.65 25.92 71.58 (45.66) 25.00 83.00 56.73
KO 15 EMA 26,304.09 26.31 36.83 (10.52) 31.00 69.00 57.56
MCD 15 EMA 66,223.81 66.23 255.95 (189.72) 32.00 68.00 64.07
MMM 15 EMA 8,471.89 8.48 33.05 (24.57) 25.00 72.00 57.34
MO 15 EMA 69,045.44 69.06 87.31 (18.25) 27.00 58.00 61.24
MRK 15 EMA 925.92 0.92 (0.24) 1.16 29.00 71.00 54.18
MSFT 15 EMA (7,971.65) (7.97) 32.54 (40.51) 23.00 79.00 51.60
PFE 15 EMA (29,830.49) (29.83) (27.91) (1.92) 23.00 74.00 46.77
PG 15 EMA (33.06) (0.03) 67.22 (67.25) 30.00 72.00 62.22
T 15 EMA 5,405.28 5.40 43.76 (38.36) 29.00 72.00 53.89
UTX 15 EMA 20,607.41 20.61 141.41 (120.80) 32.00 75.00 61.23
VZ 15 EMA 1,039.78 1.04 8.76 (7.72) 30.00 77.00 53.41
WMT 15 EMA (20,664.62) (20.67) (7.89) (12.78) 28.00 92.00 45.63XOM 15 EMA 14,255.04 14.25 164.14 (149.89) 31.00 84.00 63.59
Technical Trading Techniques 35
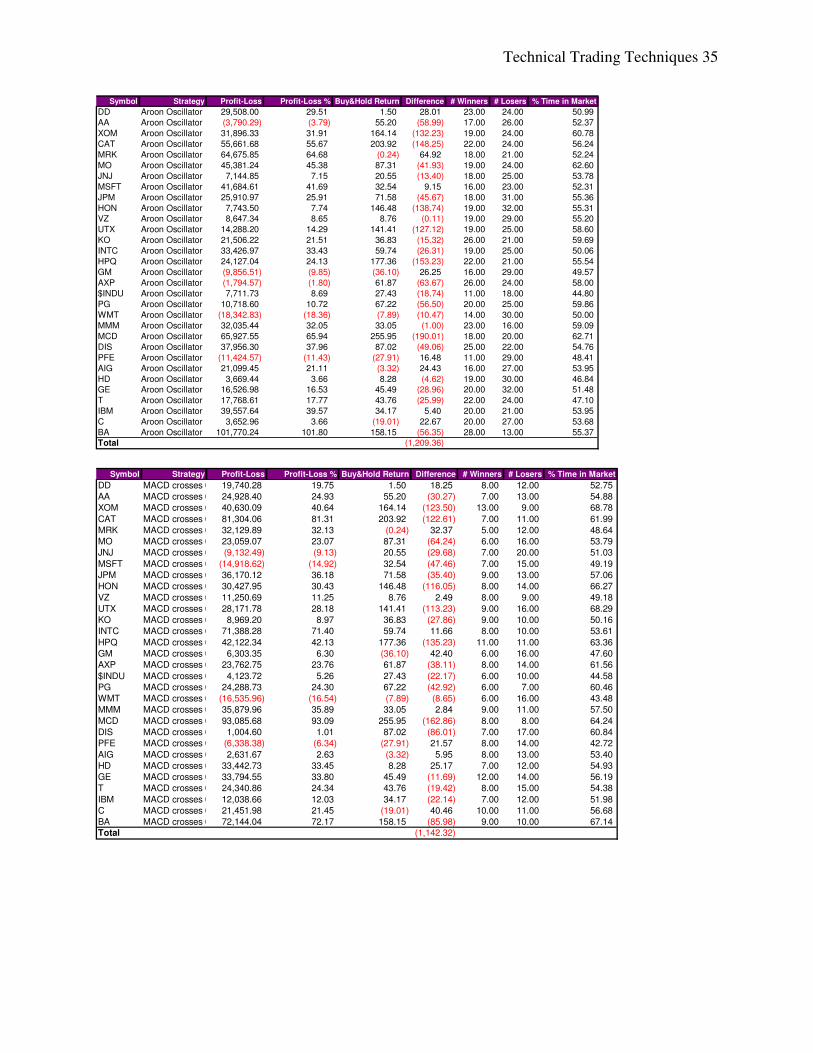
Symbol Strategy Profit-Loss Profit-Loss % Buy&Hold Return Difference # Winners # Losers % Time in Market
DD Aroon Oscillator crosses 0 (daily)29,508.00 29.51 1.50 28.01 23.00 24.00 50.99
AA Aroon Oscillator crosses 0 (daily)(3,790.29) (3.79) 55.20 (58.99) 17.00 26.00 52.37
XOM Aroon Oscillator crosses 0 (daily)31,896.33 31.91 164.14 (132.23) 19.00 24.00 60.78
CAT Aroon Oscillator crosses 0 (daily)55,661.68 55.67 203.92 (148.25) 22.00 24.00 56.24
MRK Aroon Oscillator crosses 0 (daily)64,675.85 64.68 (0.24) 64.92 18.00 21.00 52.24
MO Aroon Oscillator crosses 0 (daily)45,381.24 45.38 87.31 (41.93) 19.00 24.00 62.60
JNJ Aroon Oscillator crosses 0 (daily)7,144.85 7.15 20.55 (13.40) 18.00 25.00 53.78
MSFT Aroon Oscillator crosses 0 (daily)41,684.61 41.69 32.54 9.15 16.00 23.00 52.31
JPM Aroon Oscillator crosses 0 (daily)25,910.97 25.91 71.58 (45.67) 18.00 31.00 55.36
HON Aroon Oscillator crosses 0 (daily)7,743.50 7.74 146.48 (138.74) 19.00 32.00 55.31VZ Aroon Oscillator crosses 0 (daily)8,647.34 8.65 8.76 (0.11) 19.00 29.00 55.20
UTX Aroon Oscillator crosses 0 (daily)14,288.20 14.29 141.41 (127.12) 19.00 25.00 58.60
KO Aroon Oscillator crosses 0 (daily)21,506.22 21.51 36.83 (15.32) 26.00 21.00 59.69
INTC Aroon Oscillator crosses 0 (daily)33,426.97 33.43 59.74 (26.31) 19.00 25.00 50.06
HPQ Aroon Oscillator crosses 0 (daily)24,127.04 24.13 177.36 (153.23) 22.00 21.00 55.54
GM Aroon Oscillator crosses 0 (daily)(9,856.51) (9.85) (36.10) 26.25 16.00 29.00 49.57
AXP Aroon Oscillator crosses 0 (daily)(1,794.57) (1.80) 61.87 (63.67) 26.00 24.00 58.00
$INDU Aroon Oscillator crosses 0 (daily)7,711.73 8.69 27.43 (18.74) 11.00 18.00 44.80
PG Aroon Oscillator crosses 0 (daily)10,718.60 10.72 67.22 (56.50) 20.00 25.00 59.86
WMT Aroon Oscillator crosses 0 (daily)(18,342.83) (18.36) (7.89) (10.47) 14.00 30.00 50.00
MMM Aroon Oscillator crosses 0 (daily)32,035.44 32.05 33.05 (1.00) 23.00 16.00 59.09
MCD Aroon Oscillator crosses 0 (daily)65,927.55 65.94 255.95 (190.01) 18.00 20.00 62.71
DIS Aroon Oscillator crosses 0 (daily)37,956.30 37.96 87.02 (49.06) 25.00 22.00 54.76
PFE Aroon Oscillator crosses 0 (daily)(11,424.57) (11.43) (27.91) 16.48 11.00 29.00 48.41
AIG Aroon Oscillator crosses 0 (daily)21,099.45 21.11 (3.32) 24.43 16.00 27.00 53.95
HD Aroon Oscillator crosses 0 (daily)3,669.44 3.66 8.28 (4.62) 19.00 30.00 46.84GE Aroon Oscillator crosses 0 (daily)16,526.98 16.53 45.49 (28.96) 20.00 32.00 51.48
T Aroon Oscillator crosses 0 (daily)17,768.61 17.77 43.76 (25.99) 22.00 24.00 47.10
IBM Aroon Oscillator crosses 0 (daily)39,557.64 39.57 34.17 5.40 20.00 21.00 53.95
C Aroon Oscillator crosses 0 (daily)3,652.96 3.66 (19.01) 22.67 20.00 27.00 53.68
BA Aroon Oscillator crosses 0 (daily)101,770.24 101.80 158.15 (56.35) 28.00 13.00 55.37Total (1,209.36)
Symbol Strategy Profit-Loss Profit-Loss % Buy&Hold Return Difference # Winners # Losers % Time in Market
DD MACD crosses 0 (60-minutes)19,740.28 19.75 1.50 18.25 8.00 12.00 52.75AA MACD crosses 0 (60-minutes)24,928.40 24.93 55.20 (30.27) 7.00 13.00 54.88XOM MACD crosses 0 (60-minutes)40,630.09 40.64 164.14 (123.50) 13.00 9.00 68.78
CAT MACD crosses 0 (60-minutes)81,304.06 81.31 203.92 (122.61) 7.00 11.00 61.99MRK MACD crosses 0 (60-minutes)32,129.89 32.13 (0.24) 32.37 5.00 12.00 48.64MO MACD crosses 0 (60-minutes)23,059.07 23.07 87.31 (64.24) 6.00 16.00 53.79JNJ MACD crosses 0 (60-minutes)(9,132.49) (9.13) 20.55 (29.68) 7.00 20.00 51.03
MSFT MACD crosses 0 (60-minutes)(14,918.62) (14.92) 32.54 (47.46) 7.00 15.00 49.19JPM MACD crosses 0 (60-minutes)36,170.12 36.18 71.58 (35.40) 9.00 13.00 57.06HON MACD crosses 0 (60-minutes)30,427.95 30.43 146.48 (116.05) 8.00 14.00 66.27
VZ MACD crosses 0 (60-minutes)11,250.69 11.25 8.76 2.49 8.00 9.00 49.18UTX MACD crosses 0 (60-minutes)28,171.78 28.18 141.41 (113.23) 9.00 16.00 68.29KO MACD crosses 0 (60-minutes)8,969.20 8.97 36.83 (27.86) 9.00 10.00 50.16INTC MACD crosses 0 (60-minutes)71,388.28 71.40 59.74 11.66 8.00 10.00 53.61
HPQ MACD crosses 0 (60-minutes)42,122.34 42.13 177.36 (135.23) 11.00 11.00 63.36GM MACD crosses 0 (60-minutes)6,303.35 6.30 (36.10) 42.40 6.00 16.00 47.60AXP MACD crosses 0 (60-minutes)23,762.75 23.76 61.87 (38.11) 8.00 14.00 61.56
$INDU MACD crosses 0 (60-minutes)4,123.72 5.26 27.43 (22.17) 6.00 10.00 44.58PG MACD crosses 0 (60-minutes)24,288.73 24.30 67.22 (42.92) 6.00 7.00 60.46WMT MACD crosses 0 (60-minutes)(16,535.96) (16.54) (7.89) (8.65) 6.00 16.00 43.48MMM MACD crosses 0 (60-minutes)35,879.96 35.89 33.05 2.84 9.00 11.00 57.50
MCD MACD crosses 0 (60-minutes)93,085.68 93.09 255.95 (162.86) 8.00 8.00 64.24DIS MACD crosses 0 (60-minutes)1,004.60 1.01 87.02 (86.01) 7.00 17.00 60.84PFE MACD crosses 0 (60-minutes)(6,338.38) (6.34) (27.91) 21.57 8.00 14.00 42.72
AIG MACD crosses 0 (60-minutes)2,631.67 2.63 (3.32) 5.95 8.00 13.00 53.40HD MACD crosses 0 (60-minutes)33,442.73 33.45 8.28 25.17 7.00 12.00 54.93GE MACD crosses 0 (60-minutes)33,794.55 33.80 45.49 (11.69) 12.00 14.00 56.19T MACD crosses 0 (60-minutes)24,340.86 24.34 43.76 (19.42) 8.00 15.00 54.38
IBM MACD crosses 0 (60-minutes)12,038.66 12.03 34.17 (22.14) 7.00 12.00 51.98C MACD crosses 0 (60-minutes)21,451.98 21.45 (19.01) 40.46 10.00 11.00 56.68BA MACD crosses 0 (60-minutes)72,144.04 72.17 158.15 (85.98) 9.00 10.00 67.14Total (1,142.32)
Technical Trading Techniques 36
Symbol Strategy Profit-Loss Profit-Loss % Buy&Hold Return Difference # Winners # Losers % Time in Market
$INDU MACD Histogram crosses 0 (daily)12,799.52 13.75 27.43 (13.68) 16.00 21.00 36.92
AA MACD Histogram crosses 0 (daily)46,076.42 46.08 55.20 (9.12) 22.00 27.00 50.88
AIG MACD Histogram crosses 0 (daily)25,608.68 25.61 (3.32) 28.93 18.00 29.00 48.90
AXP MACD Histogram crosses 0 (daily)(16,313.35) (16.31) 61.87 (78.18) 23.00 28.00 50.99
BA MACD Histogram crosses 0 (daily)67,015.55 67.03 158.15 (91.12) 25.00 26.00 49.01
C MACD Histogram crosses 0 (daily)28,489.62 28.50 (19.01) 47.51 15.00 29.00 50.05
CAT MACD Histogram crosses 0 (daily)53,251.99 53.26 203.92 (150.66) 23.00 31.00 50.82
DD MACD Histogram crosses 0 (daily)8,559.14 8.56 1.50 7.06 20.00 31.00 53.68
DIS MACD Histogram crosses 0 (daily)22,394.60 22.40 87.02 (64.62) 22.00 23.00 49.17
GE MACD Histogram crosses 0 (daily)25,395.16 25.40 45.49 (20.09) 20.00 34.00 50.27
GM MACD Histogram crosses 0 (daily)23,478.50 23.48 (36.10) 59.58 17.00 32.00 49.13
HD MACD Histogram crosses 0 (daily)(39,010.88) (39.02) 8.28 (47.30) 15.00 46.00 49.84
HON MACD Histogram crosses 0 (daily)55,181.58 55.19 146.48 (91.29) 19.00 28.00 47.59
HPQ MACD Histogram crosses 0 (daily)(12,142.93) (12.16) 177.36 (189.52) 17.00 39.00 48.14
IBM MACD Histogram crosses 0 (daily)16,840.94 16.85 34.17 (17.32) 17.00 31.00 49.12
INTC MACD Histogram crosses 0 (daily)10,057.24 10.06 59.74 (49.68) 17.00 32.00 51.27
JNJ MACD Histogram crosses 0 (daily)11,087.32 11.09 20.55 (9.46) 18.00 27.00 49.58
JPM MACD Histogram crosses 0 (daily)15,335.58 15.34 71.58 (56.24) 16.00 39.00 47.69
KO MACD Histogram crosses 0 (daily)22,502.24 22.51 36.83 (14.32) 21.00 30.00 51.32
MCD MACD Histogram crosses 0 (daily)52,296.77 52.31 255.95 (203.64) 20.00 33.00 54.38
MMM MACD Histogram crosses 0 (daily)28,792.36 28.81 33.05 (4.24) 19.00 29.00 53.12
MO MACD Histogram crosses 0 (daily)78,872.30 78.88 87.31 (8.43) 21.00 25.00 52.29
MRK MACD Histogram crosses 0 (daily)15,930.46 15.93 (0.24) 16.17 19.00 37.00 47.10
MSFT MACD Histogram crosses 0 (daily)32,791.36 32.79 32.54 0.25 16.00 28.00 50.55
PFE MACD Histogram crosses 0 (daily)(28,801.65) (28.81) (27.91) (0.90) 16.00 31.00 46.33
PG MACD Histogram crosses 0 (daily)(2,673.88) (2.67) 67.22 (69.89) 23.00 39.00 48.75
T MACD Histogram crosses 0 (daily)2,822.51 2.82 43.76 (40.94) 17.00 38.00 46.06
UTX MACD Histogram crosses 0 (daily)27,497.45 27.51 141.41 (113.90) 24.00 32.00 50.77
VZ MACD Histogram crosses 0 (daily)(9,313.21) (9.32) 8.76 (18.08) 17.00 35.00 52.75
WMT MACD Histogram crosses 0 (daily)11,191.95 11.19 (7.89) 19.08 15.00 30.00 50.77
XOM MACD Histogram crosses 0 (daily)49,508.62 49.52 164.14 (114.62) 21.00 33.00 50.50Total (1,298.66)
Symbol Strategy Profit-Loss Profit-Loss % Buy&Hold Return Difference # Winners # Losers % Time in Market
$INDU StochRSI crosses .2/.820,054.27 20.85 27.43 (6.58) 24.00 11.00 36.63
AA StochRSI crosses .2/.837,107.52 37.11 55.20 (18.09) 30.00 19.00 52.52AIG StochRSI crosses .2/.84,930.17 4.94 (3.32) 8.26 30.00 14.00 49.57
AXP StochRSI crosses .2/.851,602.83 51.62 61.87 (10.25) 36.00 18.00 49.73BA StochRSI crosses .2/.813,563.86 13.57 158.15 (144.58) 26.00 15.00 52.24
C StochRSI crosses .2/.8(19,835.99) (19.84) (19.01) (0.83) 29.00 17.00 47.81CAT StochRSI crosses .2/.8132,003.92 132.04 203.92 (71.88) 37.00 14.00 54.33
DD StochRSI crosses .2/.843,011.09 43.03 1.50 41.53 34.00 17.00 48.52DIS StochRSI crosses .2/.817,924.38 17.93 87.02 (69.09) 28.00 18.00 49.72GE StochRSI crosses .2/.818,681.58 18.68 45.49 (26.81) 27.00 21.00 50.71
GM StochRSI crosses .2/.839,536.29 39.54 (36.10) 75.64 25.00 17.00 47.04HD StochRSI crosses .2/.815,373.97 15.37 8.28 7.09 30.00 21.00 49.29
HON StochRSI crosses .2/.844,479.60 44.49 146.48 (101.99) 30.00 15.00 48.14HPQ StochRSI crosses .2/.873,374.52 73.39 177.36 (103.97) 33.00 18.00 57.06
IBM StochRSI crosses .2/.819,166.09 19.16 34.17 (15.01) 25.00 21.00 53.29INTC StochRSI crosses .2/.812,938.27 12.94 59.74 (46.80) 27.00 24.00 54.65JNJ StochRSI crosses .2/.8(3,221.56) (3.22) 20.55 (23.77) 27.00 18.00 48.52
JPM StochRSI crosses .2/.852,307.29 52.31 71.58 (19.27) 35.00 17.00 50.27KO StochRSI crosses .2/.849,665.64 49.68 36.83 12.85 33.00 16.00 47.21
MCD StochRSI crosses .2/.877,215.80 77.23 255.95 (178.72) 38.00 11.00 47.09MMM StochRSI crosses .2/.8(11,128.90) (11.13) 33.05 (44.18) 25.00 18.00 52.57
MO StochRSI crosses .2/.843,532.54 43.55 87.31 (43.76) 33.00 15.00 52.57MRK StochRSI crosses .2/.8(42.62) (0.04) (0.24) 0.20 27.00 17.00 56.30
MSFT StochRSI crosses .2/.85,123.64 5.12 32.54 (27.42) 23.00 25.00 48.13PFE StochRSI crosses .2/.8(10,979.85) (10.98) (27.91) 16.93 21.00 24.00 53.06PG StochRSI crosses .2/.823,421.36 23.43 67.22 (43.79) 37.00 17.00 48.80
T StochRSI crosses .2/.817,058.30 17.06 43.76 (26.70) 31.00 19.00 59.85UTX StochRSI crosses .2/.843,543.54 43.55 141.41 (97.86) 35.00 17.00 49.01
VZ StochRSI crosses .2/.822,137.63 22.14 8.76 13.38 39.00 12.00 49.89WMT StochRSI crosses .2/.820,201.72 20.21 (7.89) 28.10 25.00 21.00 48.46
XOM StochRSI crosses .2/.828,389.69 28.40 164.14 (135.74) 31.00 17.00 53.07Total (1,053.11)
Technical Trading Techniques 37
Symbol Strategy Profit-Loss Profit-Loss % Buy&Hold Return Difference # Winners # Losers % Time in Market
$INDU CCI crosses -100/10014,671.64 15.65 27.43 (11.78) 12.00 6.00 32.97
AA CCI crosses -100/10046,508.73 46.52 55.20 (8.68) 17.00 8.00 48.80
AIG CCI crosses -100/1004,532.00 4.54 (3.32) 7.86 16.00 10.00 47.20
AXP CCI crosses -100/10028,993.23 29.00 61.87 (32.87) 16.00 8.00 41.46
BA CCI crosses -100/10064,231.08 64.26 158.15 (93.89) 18.00 3.00 36.04
C CCI crosses -100/10011,019.66 11.02 (19.01) 30.03 16.00 8.00 47.70
CAT CCI crosses -100/10081,128.65 81.15 203.92 (122.77) 16.00 7.00 41.84
DD CCI crosses -100/100(514.70) (0.51) 1.50 (2.01) 12.00 11.00 49.89
DIS CCI crosses -100/10076,614.23 76.62 87.02 (10.40) 20.00 5.00 45.89
GE CCI crosses -100/1002,195.72 2.20 45.49 (43.29) 12.00 8.00 40.85GM CCI crosses -100/10040,622.15 40.63 (36.10) 76.73 13.00 7.00 46.71
HD CCI crosses -100/1009,540.11 9.55 8.28 1.27 14.00 10.00 49.34
HON CCI crosses -100/10076,557.75 76.57 146.48 (69.91) 23.00 6.00 51.15
HPQ CCI crosses -100/100106,951.28 106.96 177.36 (70.40) 21.00 7.00 41.35
IBM CCI crosses -100/10023,475.23 23.48 34.17 (10.69) 20.00 6.00 46.28INTC CCI crosses -100/10024,938.25 24.94 59.74 (34.80) 15.00 7.00 50.88
JNJ CCI crosses -100/1009,941.40 9.94 20.55 (10.61) 15.00 9.00 50.99
JPM CCI crosses -100/10010,313.68 10.31 71.58 (61.27) 12.00 6.00 41.35
KO CCI crosses -100/10023,536.06 23.54 36.83 (13.29) 17.00 9.00 42.00MCD CCI crosses -100/10039,476.94 39.48 255.95 (216.47) 18.00 4.00 31.98
MMM CCI crosses -100/1007,826.79 7.84 33.05 (25.21) 15.00 9.00 43.04
MO CCI crosses -100/10072,865.90 72.87 87.31 (14.44) 18.00 5.00 37.51
MRK CCI crosses -100/100(13,339.66) (13.34) (0.24) (13.10) 12.00 9.00 49.29
MSFT CCI crosses -100/1007,382.75 7.38 32.54 (25.16) 14.00 8.00 44.85
PFE CCI crosses -100/100(13,652.39) (13.65) (27.91) 14.26 11.00 12.00 52.52
PG CCI crosses -100/10027,387.16 27.40 67.22 (39.82) 19.00 6.00 36.96
T CCI crosses -100/10060,102.07 60.11 43.76 16.35 19.00 8.00 52.18
UTX CCI crosses -100/10049,161.94 49.18 141.41 (92.23) 16.00 6.00 38.38
VZ CCI crosses -100/10013,363.29 13.36 8.76 4.60 15.00 8.00 48.03
WMT CCI crosses -100/10023,396.70 23.40 (7.89) 31.29 18.00 8.00 44.25
XOM CCI crosses -100/10069,620.27 69.64 164.14 (94.50) 22.00 2.00 43.21Total (935.20)
Symbol Strategy Profit-Loss Profit-Loss % Buy&Hold Return Difference # Winners # Losers % Time in Market
$INDU Money Flow Index crosses 20 and 80 (daily)1,740.69 1.84 27.43 (25.59) 1.00 0.00 12.49AA Money Flow Index crosses 20 and 80 (daily)45,413.81 45.42 55.20 (9.78) 4.00 2.00 40.64
AIG Money Flow Index crosses 20 and 80 (daily)76,576.76 76.60 (3.32) 79.92 5.00 1.00 50.44
AXP Money Flow Index crosses 20 and 80 (daily)50,377.65 50.39 61.87 (11.48) 6.00 0.00 37.68
BA Money Flow Index crosses 20 and 80 (daily)28,628.82 28.63 158.15 (129.52) 2.00 0.00 10.79
C Money Flow Index crosses 20 and 80 (daily)50,754.67 50.76 (19.01) 69.77 4.00 1.00 24.37CAT Money Flow Index crosses 20 and 80 (daily)723.95 0.72 203.92 (203.20) 1.00 2.00 11.23
DD Money Flow Index crosses 20 and 80 (daily)38,392.81 38.40 1.50 36.90 4.00 1.00 32.26
DIS Money Flow Index crosses 20 and 80 (daily)25,228.62 25.23 87.02 (61.79) 3.00 1.00 25.96
GE Money Flow Index crosses 20 and 80 (daily)25,667.52 25.67 45.49 (19.82) 5.00 0.00 22.84
GM Money Flow Index crosses 20 and 80 (daily)(22,276.20) (22.29) (36.10) 13.81 0.00 1.00 67.85
HD Money Flow Index crosses 20 and 80 (daily)23,846.13 23.85 8.28 15.57 3.00 1.00 34.72
HON Money Flow Index crosses 20 and 80 (daily)63,910.20 63.93 146.48 (82.55) 4.00 0.00 27.44
HPQ Money Flow Index crosses 20 and 80 (daily)15,303.68 15.31 177.36 (162.05) 2.00 0.00 17.80
IBM Money Flow Index crosses 20 and 80 (daily)18,817.07 18.82 34.17 (15.35) 3.00 1.00 26.51
INTC Money Flow Index crosses 20 and 80 (daily)(27,840.12) (27.84) 59.74 (87.58) 1.00 3.00 32.37
JNJ Money Flow Index crosses 20 and 80 (daily)15,592.07 15.60 20.55 (4.95) 5.00 1.00 28.70JPM Money Flow Index crosses 20 and 80 (daily)12,649.39 12.65 71.58 (58.93) 3.00 1.00 28.97
KO Money Flow Index crosses 20 and 80 (daily)39,475.17 39.48 36.83 2.65 4.00 1.00 41.40
MCD Money Flow Index crosses 20 and 80 (daily)87,073.13 87.08 255.95 (168.87) 4.00 0.00 37.73
MMM Money Flow Index crosses 20 and 80 (daily)35,305.71 35.32 33.05 2.27 5.00 0.00 28.31MO Money Flow Index crosses 20 and 80 (daily)26,724.54 26.73 87.31 (60.58) 4.00 1.00 32.69
MRK Money Flow Index crosses 20 and 80 (daily)(18,852.30) (18.87) (0.24) (18.63) 2.00 1.00 57.45
MSFT Money Flow Index crosses 20 and 80 (daily)29,712.45 29.72 32.54 (2.82) 4.00 1.00 55.59
PFE Money Flow Index crosses 20 and 80 (daily)(3,554.38) (3.55) (27.91) 24.36 1.00 3.00 36.97
PG Money Flow Index crosses 20 and 80 (daily)8,730.36 8.73 67.22 (58.49) 1.00 1.00 23.17T Money Flow Index crosses 20 and 80 (daily)60,940.72 60.95 43.76 17.19 5.00 0.00 58.21
UTX Money Flow Index crosses 20 and 80 (daily)53,952.75 53.97 141.41 (87.44) 4.00 0.00 56.74
VZ Money Flow Index crosses 20 and 80 (daily)11,176.62 11.18 8.76 2.42 4.00 1.00 57.01
WMT Money Flow Index crosses 20 and 80 (daily)4,659.22 4.66 (7.89) 12.55 2.00 1.00 48.47
XOM Money Flow Index crosses 20 and 80 (daily)37,813.15 37.82 164.14 (126.32) 3.00 0.00 18.95Total (1,118.33)
Technical Trading Techniques 38
Symbol Strategy Profit-Loss Profit-Loss % Buy&Hold Return Difference # Winners # Losers % Time in Market
AA Kester Moving Average 34,433.87 34.43 55.20 (20.77) 1.00 2.00 31.82AXP Kester Moving Average 41,099.83 41.11 61.87 (20.76) 2.00 4.00 76.18
$INDU Kester Moving Average (2,143.13) (2.26) 27.43 (29.69) 1.00 2.00 40.14
AIG Kester Moving Average 40,162.47 40.17 (3.32) 43.49 3.00 0.00 68.62
C Kester Moving Average (3,626.08) (3.63) (19.01) 15.38 3.00 3.00 48.47
BA Kester Moving Average 94,442.50 94.46 158.15 (63.69) 3.00 0.00 49.29CAT Kester Moving Average 79,268.43 79.27 203.92 (124.65) 2.00 2.00 62.10
DD Kester Moving Average 9,360.80 9.36 1.50 7.86 3.00 3.00 63.91
DIS Kester Moving Average 42,525.12 42.53 87.02 (44.49) 4.00 3.00 43.70
GE Kester Moving Average 48,186.91 48.19 45.49 2.70 5.00 4.00 71.63
GM Kester Moving Average (14,735.09) (14.73) (36.10) 21.37 2.00 3.00 66.21
HD Kester Moving Average (4,880.30) (4.88) 8.28 (13.16) 3.00 2.00 19.82HON Kester Moving Average 70,373.59 70.38 146.48 (76.10) 4.00 2.00 54.05
HPQ Kester Moving Average 48,416.43 48.43 177.36 (128.93) 4.00 4.00 44.91
IBM Kester Moving Average 23,991.72 24.02 34.17 (10.15) 1.00 2.00 69.55
INTC Kester Moving Average (15,982.95) (15.98) 59.74 (75.72) 1.00 2.00 34.56
JNJ Kester Moving Average (7,400.82) (7.40) 20.55 (27.95) 1.00 5.00 69.17JPM Kester Moving Average 28,152.64 28.16 71.58 (43.42) 3.00 2.00 50.32
KO Kester Moving Average (12,406.32) (12.41) 36.83 (49.24) 1.00 2.00 40.64
MCD Kester Moving Average 64,780.00 64.79 255.95 (191.16) 6.00 1.00 56.41
MMM Kester Moving Average 45,838.93 45.86 33.05 12.81 3.00 0.00 68.40
MO Kester Moving Average 77,036.90 77.04 87.31 (10.27) 3.00 3.00 46.55
MRK Kester Moving Average (32,362.04) (32.37) (0.24) (32.13) 1.00 5.00 47.75MSFT Kester Moving Average 1,388.77 1.39 32.54 (31.15) 3.00 5.00 26.40
PFE Kester Moving Average (6,642.12) (6.64) (27.91) 21.27 1.00 1.00 42.66
PG Kester Moving Average 35,073.31 35.08 67.22 (32.14) 2.00 1.00 82.53
T Kester Moving Average 60,835.50 60.85 43.76 17.09 4.00 3.00 71.63
UTX Kester Moving Average 68,910.09 68.92 141.41 (72.49) 7.00 4.00 67.20VZ Kester Moving Average (3,929.42) (3.93) 8.76 (12.69) 1.00 3.00 39.21
WMT Kester Moving Average 11,979.23 11.98 (7.89) 19.87 3.00 2.00 49.18
XOM Kester Moving Average 63,016.81 63.04 164.14 (101.10) 3.00 1.00 64.90Total (1,050.01)
Symbol Strategy Profit-Loss Profit-Loss % Buy&Hold Return Difference # Winners # Losers % Time in Market
$INDU Bollinger Breakout (49,276.00) (3.81) 27.43 (31.24) 6 5 40.80
AA Bollinger Breakout 938.00 19.48 55.20 (35.72) 9 7 56.36
AIG Bollinger Breakout (1,143.00) (22.21) (3.32) (18.89) 5 7 49.40
AXP Bollinger Breakout 94.63 (7.74) 61.87 (69.61) 8 8 58.93
BA Bollinger Breakout (2,705.00) (67.91) 158.15 (226.06) 6 10 59.91
C Bollinger Breakout (370.00) (12.57) (19.01) 6.44 7 8 48.53
CAT Bollinger Breakout (2,656.50) (70.30) 203.92 (274.22) 7 7 63.80
DD Bollinger Breakout (1,629.00) (41.56) 1.50 (43.06) 5 6 48.85
DIS Bollinger Breakout 578.00 25.61 87.02 (61.41) 15 5 48.80
GE Bollinger Breakout (1,071.00) (38.58) 45.49 (84.07) 4 8 54.55
GM Bollinger Breakout (536.00) (24.80) (36.10) 11.30 7 7 47.38
HD Bollinger Breakout (561.00) (33.32) 8.28 (41.60) 5 7 57.18
HON Bollinger Breakout (1,484.00) (48.89) 146.48 (195.37) 6 6 52.90
HPQ Bollinger Breakout (634.00) (10.94) 177.36 (188.30) 6 10 64.58
IBM Bollinger Breakout (4,418.00) (51.02) 34.17 (85.19) 2 9 55.54
INTC Bollinger Breakout 557.69 8.67 59.74 (51.07) 11 6 60.36
JNJ Bollinger Breakout 733.00 12.41 20.55 (8.14) 8 9 58.05
JPM Bollinger Breakout (1,085.00) (36.16) 71.58 (107.74) 7 6 58.16
KO Bollinger Breakout (787.00) (15.79) 36.83 (52.62) 7 8 57.30
MCD Bollinger Breakout (862.00) (51.64) 255.95 (307.59) 7 8 54.22
MMM Bollinger Breakout (629.00) (12.93) 33.05 (45.98) 9 6 53.95
MO Bollinger Breakout (466.00) (17.37) 87.31 (104.68) 11 7 53.95
MRK Bollinger Breakout (1,090.00) (37.46) (0.24) (37.22) 5 8 48.35
MSFT Bollinger Breakout 17.01 (4.64) 32.54 (37.18) 7 4 57.67
PFE Bollinger Breakout (41.00) (5.86) (27.91) 22.05 7 6 42.66
PG Bollinger Breakout (625.50) (14.75) 67.22 (81.97) 5 6 60.63
T Bollinger Breakout 488.00 10.23 43.76 (33.53) 8 7 47.32
UTX Bollinger Breakout (1,362.00) (37.67) 141.41 (179.08) 5 10 61.06
VZ Bollinger Breakout 1,047.00 23.20 8.76 14.44 6 8 37.57
WMT Bollinger Breakout 1,067.00 18.97 (7.89) 26.86 10 5 52.96XOM Bollinger Breakout (2,167.58) (43.63) 164.14 (207.77) 6 8 63.14
Technical Trading Techniques 39
Symbol Strategy Profit-Loss Profit-Loss % Buy&Hold Return Difference # Winners # Losers % Time in Market
$INDU DI Crossover 12,270.85 12.92 27.43 (14.51) 13 24 39.65
AA DI Crossover 50,186.53 50.19 55.20 (5.01) 18 32 53.51
AIG DI Crossover 47,959.41 47.98 (3.32) 51.30 16 25 50.07
AXP DI Crossover (659.32) (0.66) 61.87 (62.53) 14 40 58.88
BA DI Crossover 100,634.88 100.66 158.15 (57.49) 25 20 59.48
C DI Crossover 28,806.61 28.81 (19.01) 47.82 22 34 54.94
CAT DI Crossover 94,622.55 94.66 203.92 (109.26) 22 26 58.54
DD DI Crossover 32,666.48 32.68 1.50 31.18 18 38 50.66
DIS DI Crossover 16,878.85 16.88 87.02 (70.14) 17 41 56.59
GE DI Crossover 23,089.32 23.09 45.49 (22.40) 21 39 53.44
GM DI Crossover 31,545.81 31.55 (36.10) 67.65 13 38 50.44
HD DI Crossover 34,039.15 34.05 8.28 25.77 18 39 50.61
HON DI Crossover 25,311.19 25.32 146.48 (121.16) 24 44 51.26
HPQ DI Crossover 18,157.53 18.16 177.36 (159.20) 22 47 62.38
IBM DI Crossover 26,360.85 26.37 34.17 (7.80) 23 36 51.21
INTC DI Crossover 43,100.42 43.11 59.74 (16.63) 25 36 50.94
JNJ DI Crossover (1,711.35) (1.71) 20.55 (22.26) 20 43 55.53
JPM DI Crossover 49,298.86 49.30 71.58 (22.28) 19 35 54.49
KO DI Crossover 36,777.78 36.79 36.83 (0.04) 22 31 57.06
MCD DI Crossover 84,815.00 84.82 255.95 (171.13) 25 33 63.26
MMM DI Crossover 46,206.79 46.24 33.05 13.19 15 30 53.46
MO DI Crossover 70,062.26 70.08 87.31 (17.23) 18 33 54.66
MRK DI Crossover 47,221.75 47.23 (0.24) 47.47 23 31 49.50
MSFT DI Crossover 16,710.31 16.71 32.54 (15.83) 18 41 53.51
PFE DI Crossover 982.65 0.98 (27.91) 28.89 16 36 42.38
PG DI Crossover 31,121.75 31.13 67.22 (36.09) 24 31 58.77
T DI Crossover 18,079.47 18.08 43.76 (25.68) 16 38 53.46
UTX DI Crossover 18,746.09 18.76 141.41 (122.65) 27 49 63.81
VZ DI Crossover 20,402.72 20.41 8.76 11.65 18 46 51.09
WMT DI Crossover 307.97 0.30 (7.89) 8.19 20 46 43.31XOM DI Crossover 44,004.89 44.02 164.14 (120.12) 27 38 59.69
Symbol Strategy Profit-Loss Profit-Loss % Buy&Hold Return Difference # Winners # Losers % Time in Market
AA Kester Moving Average 34,433.87 34.43 55.20 (20.77) 1.00 2.00 31.82
AXP Kester Moving Average 41,099.83 41.11 61.87 (20.76) 2.00 4.00 76.18
$INDU Kester Moving Average (2,143.13) (2.26) 27.43 (29.69) 1.00 2.00 40.14
AIG Kester Moving Average 40,162.47 40.17 (3.32) 43.49 3.00 0.00 68.62
C Kester Moving Average (3,626.08) (3.63) (19.01) 15.38 3.00 3.00 48.47
BA Kester Moving Average 94,442.50 94.46 158.15 (63.69) 3.00 0.00 49.29
CAT Kester Moving Average 79,268.43 79.27 203.92 (124.65) 2.00 2.00 62.10
DD Kester Moving Average 9,360.80 9.36 1.50 7.86 3.00 3.00 63.91
DIS Kester Moving Average 42,525.12 42.53 87.02 (44.49) 4.00 3.00 43.70
GE Kester Moving Average 48,186.91 48.19 45.49 2.70 5.00 4.00 71.63
GM Kester Moving Average (14,735.09) (14.73) (36.10) 21.37 2.00 3.00 66.21
HD Kester Moving Average (4,880.30) (4.88) 8.28 (13.16) 3.00 2.00 19.82
HON Kester Moving Average 70,373.59 70.38 146.48 (76.10) 4.00 2.00 54.05
HPQ Kester Moving Average 48,416.43 48.43 177.36 (128.93) 4.00 4.00 44.91
IBM Kester Moving Average 23,991.72 24.02 34.17 (10.15) 1.00 2.00 69.55
INTC Kester Moving Average (15,982.95) (15.98) 59.74 (75.72) 1.00 2.00 34.56
JNJ Kester Moving Average (7,400.82) (7.40) 20.55 (27.95) 1.00 5.00 69.17
JPM Kester Moving Average 28,152.64 28.16 71.58 (43.42) 3.00 2.00 50.32
KO Kester Moving Average (12,406.32) (12.41) 36.83 (49.24) 1.00 2.00 40.64
MCD Kester Moving Average 64,780.00 64.79 255.95 (191.16) 6.00 1.00 56.41
MMM Kester Moving Average 45,838.93 45.86 33.05 12.81 3.00 0.00 68.40
MO Kester Moving Average 77,036.90 77.04 87.31 (10.27) 3.00 3.00 46.55
MRK Kester Moving Average (32,362.04) (32.37) (0.24) (32.13) 1.00 5.00 47.75
MSFT Kester Moving Average 1,388.77 1.39 32.54 (31.15) 3.00 5.00 26.40
PFE Kester Moving Average (6,642.12) (6.64) (27.91) 21.27 1.00 1.00 42.66
PG Kester Moving Average 35,073.31 35.08 67.22 (32.14) 2.00 1.00 82.53
T Kester Moving Average 60,835.50 60.85 43.76 17.09 4.00 3.00 71.63
UTX Kester Moving Average 68,910.09 68.92 141.41 (72.49) 7.00 4.00 67.20
VZ Kester Moving Average (3,929.42) (3.93) 8.76 (12.69) 1.00 3.00 39.21
WMT Kester Moving Average 11,979.23 11.98 (7.89) 19.87 3.00 2.00 49.18
XOM Kester Moving Average 63,016.81 63.04 164.14 (101.10) 3.00 1.00 64.90Total (1,050.01)
Technical Trading Techniques 40
Symbol Strategy Profit-Loss Profit-Loss % Buy&Hold Return Difference # Winners # Losers % Time in Market
$INDU MA Envl 17,556.74 19.07 27.43 (8.36) 7.00 6.00 15.01AA MA Envl 57,289.45 57.29 55.20 2.09 24.00 29.00 22.39
AIG MA Envl (12,730.47) (12.74) (3.32) (9.42) 13.00 27.00 18.17AXP MA Envl 3,047.20 3.05 61.87 (58.82) 12.00 22.00 19.22
BA MA Envl 51,220.25 51.23 158.15 (106.92) 19.00 22.00 17.97C MA Envl 19,047.62 19.06 (19.01) 38.07 12.00 16.00 20.86
CAT MA Envl 27,831.47 27.84 203.92 (176.08) 16.00 21.00 15.77DD MA Envl 7,852.03 7.86 1.50 6.36 13.00 22.00 22.18DIS MA Envl (15,836.39) (15.84) 87.02 (102.86) 11.00 30.00 23.27
GE MA Envl 12,204.36 12.20 45.49 (33.29) 10.00 18.00 21.42GM MA Envl 32,629.65 32.64 (36.10) 68.74 17.00 28.00 13.20
HD MA Envl (29,941.18) (29.94) 8.28 (38.22) 14.00 35.00 20.71HON MA Envl 28,601.61 28.60 146.48 (117.88) 17.00 22.00 21.74
HPQ MA Envl 10,105.16 10.11 177.36 (167.25) 18.00 29.00 14.95IBM MA Envl 29,642.75 29.65 34.17 (4.52) 14.00 19.00 26.72
INTC MA Envl (22,945.44) (22.95) 59.74 (82.69) 20.00 50.00 20.54JNJ MA Envl 12,470.32 12.48 20.55 (8.07) 8.00 11.00 18.84
JPM MA Envl 13,919.76 13.92 71.58 (57.66) 12.00 20.00 23.70KO MA Envl 2,194.40 2.19 36.83 (34.64) 5.00 11.00 12.37
MCD MA Envl 17,817.76 17.82 255.95 (238.13) 13.00 18.00 15.60MMM MA Envl 11,962.08 11.97 33.05 (21.08) 9.00 16.00 21.24
MO MA Envl 26,339.30 26.34 87.31 (60.97) 12.00 14.00 20.26MRK MA Envl 5,231.29 5.24 (0.24) 5.48 14.00 27.00 21.74
MSFT MA Envl 29,451.77 29.46 32.54 (3.08) 14.00 19.00 25.30PFE MA Envl (492.63) (0.49) (27.91) 27.42 16.00 36.00 28.60
PG MA Envl 14,307.38 14.31 67.22 (52.91) 7.00 9.00 13.86T MA Envl 29,233.04 29.24 43.76 (14.52) 15.00 25.00 21.63
UTX MA Envl 8,180.11 8.18 141.41 (133.23) 9.00 15.00 15.50VZ MA Envl 28,566.67 28.57 8.76 19.81 16.00 20.00 22.51
WMT MA Envl (2,749.26) (2.75) (7.89) 5.14 10.00 24.00 21.63XOM MA Envl (7,201.02) (7.21) 164.14 (171.35) 11.00 21.00 13.31Total (1,528.84)
Symbol Strategy Profit-Loss Profit-Loss % Buy&Hold Return Difference # Winners # Losers % Time in Market
$INDU Parabolic SAR (daily)13,979.56 14.90 27.43 (12.53) 27.00 23.00 44.64
AA Parabolic SAR (daily)43,815.80 43.82 55.20 (11.38) 28.00 30.00 53.09
AIG Parabolic SAR (daily)5,131.74 5.13 (3.32) 8.45 24.00 32.00 54.22AXP Parabolic SAR (daily)16,861.42 16.86 61.87 (45.01) 25.00 32.00 54.50
BA Parabolic SAR (daily)91,306.26 91.33 158.15 (66.82) 29.00 24.00 56.08C Parabolic SAR (daily)(19,559.20) (19.55) (19.01) (0.54) 22.00 42.00 53.40
CAT Parabolic SAR (daily)76,080.60 76.10 203.92 (127.82) 27.00 28.00 55.70DD Parabolic SAR (daily)12,851.27 12.85 1.50 11.35 21.00 36.00 50.94
DIS Parabolic SAR (daily)18,723.78 18.73 87.02 (68.29) 31.00 33.00 57.90GE Parabolic SAR (daily)24,044.97 24.05 45.49 (21.44) 32.00 29.00 51.04
GM Parabolic SAR (daily)69,659.91 69.67 (36.10) 105.77 20.00 30.00 49.95
HD Parabolic SAR (daily)(2,272.03) (2.27) 8.28 (10.55) 22.00 37.00 50.12HON Parabolic SAR (daily)35,089.50 35.09 146.48 (111.39) 22.00 36.00 58.05
HPQ Parabolic SAR (daily)16,976.53 16.98 177.36 (160.38) 26.00 30.00 54.33IBM Parabolic SAR (daily)30,801.35 30.82 34.17 (3.35) 26.00 32.00 54.33
INTC Parabolic SAR (daily)10,917.18 10.92 59.74 (48.82) 24.00 39.00 47.05JNJ Parabolic SAR (daily)(27,245.46) (27.25) 20.55 (47.80) 20.00 43.00 51.37
JPM Parabolic SAR (daily)17,383.35 17.39 71.58 (54.19) 20.00 38.00 56.52KO Parabolic SAR (daily)32,620.33 32.63 36.83 (4.20) 30.00 33.00 55.75
MCD Parabolic SAR (daily)63,611.54 63.62 255.95 (192.33) 28.00 29.00 57.69
MMM Parabolic SAR (daily)30,539.87 30.56 33.05 (2.49) 26.00 29.00 54.77MO Parabolic SAR (daily)67,842.32 67.85 87.31 (19.46) 31.00 23.00 56.79
MRK Parabolic SAR (daily)8,059.28 8.06 (0.24) 8.30 22.00 30.00 52.46MSFT Parabolic SAR (daily)27,889.24 27.90 32.54 (4.64) 26.00 30.00 52.79
PFE Parabolic SAR (daily)(16,429.58) (16.43) (27.91) 11.48 25.00 30.00 45.18PG Parabolic SAR (daily)14,717.21 14.72 67.22 (52.50) 24.00 37.00 55.71
T Parabolic SAR (daily)13,418.34 13.42 43.76 (30.34) 24.00 32.00 49.78UTX Parabolic SAR (daily)44,929.49 44.95 141.41 (96.46) 30.00 29.00 53.84
VZ Parabolic SAR (daily)16,760.59 16.77 8.76 8.01 24.00 33.00 51.65
WMT Parabolic SAR (daily)(1,393.87) (1.40) (7.89) 6.49 26.00 33.00 49.01XOM Parabolic SAR (daily)45,882.84 45.89 164.14 (118.25) 29.00 32.00 55.65Total (1,151.13)
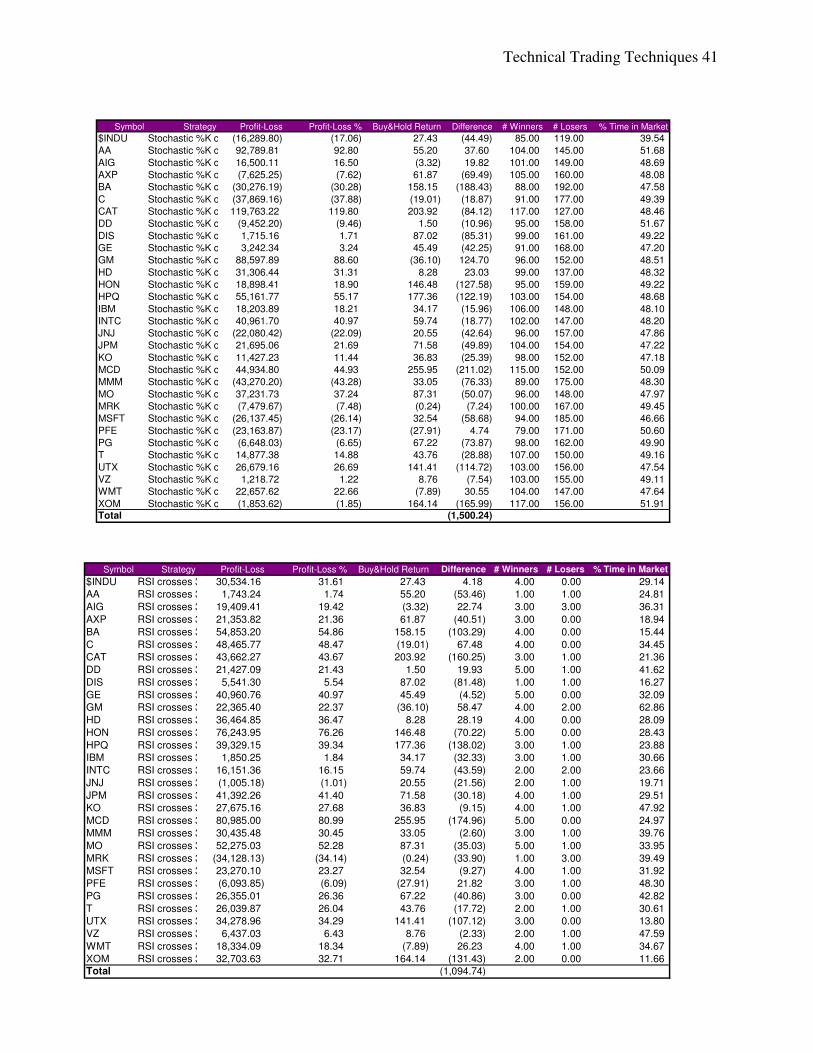
Technical Trading Techniques 41
Symbol Strategy Profit-Loss Profit-Loss % Buy&Hold Return Difference # Winners # Losers % Time in Market
$INDU Stochastic %K crosses %D (16,289.80) (17.06) 27.43 (44.49) 85.00 119.00 39.54
AA Stochastic %K crosses %D 92,789.81 92.80 55.20 37.60 104.00 145.00 51.68
AIG Stochastic %K crosses %D 16,500.11 16.50 (3.32) 19.82 101.00 149.00 48.69
AXP Stochastic %K crosses %D (7,625.25) (7.62) 61.87 (69.49) 105.00 160.00 48.08
BA Stochastic %K crosses %D (30,276.19) (30.28) 158.15 (188.43) 88.00 192.00 47.58
C Stochastic %K crosses %D (37,869.16) (37.88) (19.01) (18.87) 91.00 177.00 49.39
CAT Stochastic %K crosses %D 119,763.22 119.80 203.92 (84.12) 117.00 127.00 48.46
DD Stochastic %K crosses %D (9,452.20) (9.46) 1.50 (10.96) 95.00 158.00 51.67
DIS Stochastic %K crosses %D 1,715.16 1.71 87.02 (85.31) 99.00 161.00 49.22
GE Stochastic %K crosses %D 3,242.34 3.24 45.49 (42.25) 91.00 168.00 47.20
GM Stochastic %K crosses %D 88,597.89 88.60 (36.10) 124.70 96.00 152.00 48.51
HD Stochastic %K crosses %D 31,306.44 31.31 8.28 23.03 99.00 137.00 48.32
HON Stochastic %K crosses %D 18,898.41 18.90 146.48 (127.58) 95.00 159.00 49.22
HPQ Stochastic %K crosses %D 55,161.77 55.17 177.36 (122.19) 103.00 154.00 48.68
IBM Stochastic %K crosses %D 18,203.89 18.21 34.17 (15.96) 106.00 148.00 48.10
INTC Stochastic %K crosses %D 40,961.70 40.97 59.74 (18.77) 102.00 147.00 48.20
JNJ Stochastic %K crosses %D (22,080.42) (22.09) 20.55 (42.64) 96.00 157.00 47.86
JPM Stochastic %K crosses %D 21,695.06 21.69 71.58 (49.89) 104.00 154.00 47.22
KO Stochastic %K crosses %D 11,427.23 11.44 36.83 (25.39) 98.00 152.00 47.18
MCD Stochastic %K crosses %D 44,934.80 44.93 255.95 (211.02) 115.00 152.00 50.09
MMM Stochastic %K crosses %D (43,270.20) (43.28) 33.05 (76.33) 89.00 175.00 48.30
MO Stochastic %K crosses %D 37,231.73 37.24 87.31 (50.07) 96.00 148.00 47.97
MRK Stochastic %K crosses %D (7,479.67) (7.48) (0.24) (7.24) 100.00 167.00 49.45
MSFT Stochastic %K crosses %D (26,137.45) (26.14) 32.54 (58.68) 94.00 185.00 46.66
PFE Stochastic %K crosses %D (23,163.87) (23.17) (27.91) 4.74 79.00 171.00 50.60
PG Stochastic %K crosses %D (6,648.03) (6.65) 67.22 (73.87) 98.00 162.00 49.90
T Stochastic %K crosses %D 14,877.38 14.88 43.76 (28.88) 107.00 150.00 49.16
UTX Stochastic %K crosses %D 26,679.16 26.69 141.41 (114.72) 103.00 156.00 47.54
VZ Stochastic %K crosses %D 1,218.72 1.22 8.76 (7.54) 103.00 155.00 49.11
WMT Stochastic %K crosses %D 22,657.62 22.66 (7.89) 30.55 104.00 147.00 47.64
XOM Stochastic %K crosses %D (1,853.62) (1.85) 164.14 (165.99) 117.00 156.00 51.91Total (1,500.24)
Symbol Strategy Profit-Loss Profit-Loss % Buy&Hold Return Difference # Winners # Losers % Time in Market
$INDU RSI crosses 30 and 7030,534.16 31.61 27.43 4.18 4.00 0.00 29.14AA RSI crosses 30 and 701,743.24 1.74 55.20 (53.46) 1.00 1.00 24.81
AIG RSI crosses 30 and 7019,409.41 19.42 (3.32) 22.74 3.00 3.00 36.31
AXP RSI crosses 30 and 7021,353.82 21.36 61.87 (40.51) 3.00 0.00 18.94
BA RSI crosses 30 and 7054,853.20 54.86 158.15 (103.29) 4.00 0.00 15.44
C RSI crosses 30 and 7048,465.77 48.47 (19.01) 67.48 4.00 0.00 34.45CAT RSI crosses 30 and 7043,662.27 43.67 203.92 (160.25) 3.00 1.00 21.36
DD RSI crosses 30 and 7021,427.09 21.43 1.50 19.93 5.00 1.00 41.62
DIS RSI crosses 30 and 705,541.30 5.54 87.02 (81.48) 1.00 1.00 16.27
GE RSI crosses 30 and 7040,960.76 40.97 45.49 (4.52) 5.00 0.00 32.09GM RSI crosses 30 and 7022,365.40 22.37 (36.10) 58.47 4.00 2.00 62.86
HD RSI crosses 30 and 7036,464.85 36.47 8.28 28.19 4.00 0.00 28.09
HON RSI crosses 30 and 7076,243.95 76.26 146.48 (70.22) 5.00 0.00 28.43
HPQ RSI crosses 30 and 7039,329.15 39.34 177.36 (138.02) 3.00 1.00 23.88IBM RSI crosses 30 and 701,850.25 1.84 34.17 (32.33) 3.00 1.00 30.66
INTC RSI crosses 30 and 7016,151.36 16.15 59.74 (43.59) 2.00 2.00 23.66
JNJ RSI crosses 30 and 70(1,005.18) (1.01) 20.55 (21.56) 2.00 1.00 19.71
JPM RSI crosses 30 and 7041,392.26 41.40 71.58 (30.18) 4.00 1.00 29.51KO RSI crosses 30 and 7027,675.16 27.68 36.83 (9.15) 4.00 1.00 47.92
MCD RSI crosses 30 and 7080,985.00 80.99 255.95 (174.96) 5.00 0.00 24.97
MMM RSI crosses 30 and 7030,435.48 30.45 33.05 (2.60) 3.00 1.00 39.76
MO RSI crosses 30 and 7052,275.03 52.28 87.31 (35.03) 5.00 1.00 33.95
MRK RSI crosses 30 and 70(34,128.13) (34.14) (0.24) (33.90) 1.00 3.00 39.49MSFT RSI crosses 30 and 7023,270.10 23.27 32.54 (9.27) 4.00 1.00 31.92
PFE RSI crosses 30 and 70(6,093.85) (6.09) (27.91) 21.82 3.00 1.00 48.30
PG RSI crosses 30 and 7026,355.01 26.36 67.22 (40.86) 3.00 0.00 42.82
T RSI crosses 30 and 7026,039.87 26.04 43.76 (17.72) 2.00 1.00 30.61UTX RSI crosses 30 and 7034,278.96 34.29 141.41 (107.12) 3.00 0.00 13.80
VZ RSI crosses 30 and 706,437.03 6.43 8.76 (2.33) 2.00 1.00 47.59
WMT RSI crosses 30 and 7018,334.09 18.34 (7.89) 26.23 4.00 1.00 34.67
XOM RSI crosses 30 and 7032,703.63 32.71 164.14 (131.43) 2.00 0.00 11.66Total (1,094.74)