technically speaking - march 16, 2016
TRANSCRIPT
8/19/2019 Technically Speaking - March 16, 2016
http://slidepdf.com/reader/full/technically-speaking-march-16-2016 1/12
Technically SpeakingMarch 16, 2016
Inside this ReportS&P 500: Potential Short-term Pullback From 200-dayMA ..............................................................................2
S&P/TSX Composite Index: Breaks Above ItsIntermediate Downtrend .............................................3
Canadian Dollar: Possible Break Of Downtrend .........4
CRB Commodity Index: Approaching Its Downtrend ..5
WTI Oil: Also Approaching Its Downtrend ..................6
Gold Price: Add On Weakness ................. ................. .7
S&P/TSX Capped Telecommunications Index:Trading In An Upward Channel .............................. ....8
S&P/TSX Capped Materials Index: At Its Long-termDowntrend ..................................................................9
Glossary ................................................................... 10
Important Investor Disclosures ................. ................ 12
Ryan Lewenza, CMT, CFASVP, Private Client Strategist
Highlights In last month’s publication, we cited the potential for a rally in the S&P 500 Index (S&P 500). Since that short-
term call, the S&P 500 has rallied 116 points, or roughly 6%. In the near term, we note that the S&P 500 is
overbought with 90% of S&P 500 stocks trading above their 50-day moving averages (MAs) and is trading at its
200-day MA. As such, we see the potential for some near-term profit taking.
The S&P/TSX Composite Index (S&P/TSX) has broken out from its year-long downtrend. In the short term, like
the S&P 500, the S&P/TSX is technically overbought and is trading at the important 200-day MA. Therefore, we
see the potential for some backing and filling to work off the overbought condition.
With the recent strength in oil prices, the Canadian dollar (CAD) has rallied sharply off its January lows and has
marginally broken above its downtrend since July 2014. We have been bearish on the CAD for some time, so the
recent strength has us on alert for a potential change in trend. If the CAD were to break above its 200-day MA,currently at $.7539/US, this would likely cause us to re-evaluate our bearish stance.
Commodities have had a good run, with the CRB Commodity Index up 11% over the last month. The index is
now approaching its long-term downtrend around the 175 level. With the CRB Index technically overbought, and
at its important long-term downtrend, we expect a short-term pullback in commodities.
With energy representing roughly 40% of the CRB Commodity Index, it ’s no surprise that WTI is also approaching
its long-term downtrend. For us to turn more bullish on WTI we would need to see WTI break above its
downtrend (US$39/bbl) and its 200-day MA (US$43.25/bbl).
Following gold’s technical breakout, it had become technically overbought with an RSI reading above 70. It is
now pulling back to help work off the overbought condition. We have become more constructive on gold given
the breakout, and would recommend increasing exposure on any short-term weakness. Since we upgraded the S&P/TSX Telecom sector in December, it is up over 8%, being led by BCE Inc. (BCE-T)
which is up 9.4% YTD. The sector continues to trade in a solid upward channel, is above its 50- and 200-day MAs,
and is showing good relative strength. In the short term, the sector is due for a pause, but given the strong
technical trend, we would use any weakness to increase exposure.
Like commodities, the S&P/TSX Capped Materials Index is trading at its long-term downtrend, around the 205
level. We have been bearish on the materials sector for some time, but will need to re-evaluate this thesis if the
index breaks above the key 205 level.
8/19/2019 Technically Speaking - March 16, 2016
http://slidepdf.com/reader/full/technically-speaking-march-16-2016 2/12
Technically Speaking
March 16, 2016 | Page 2 of 12
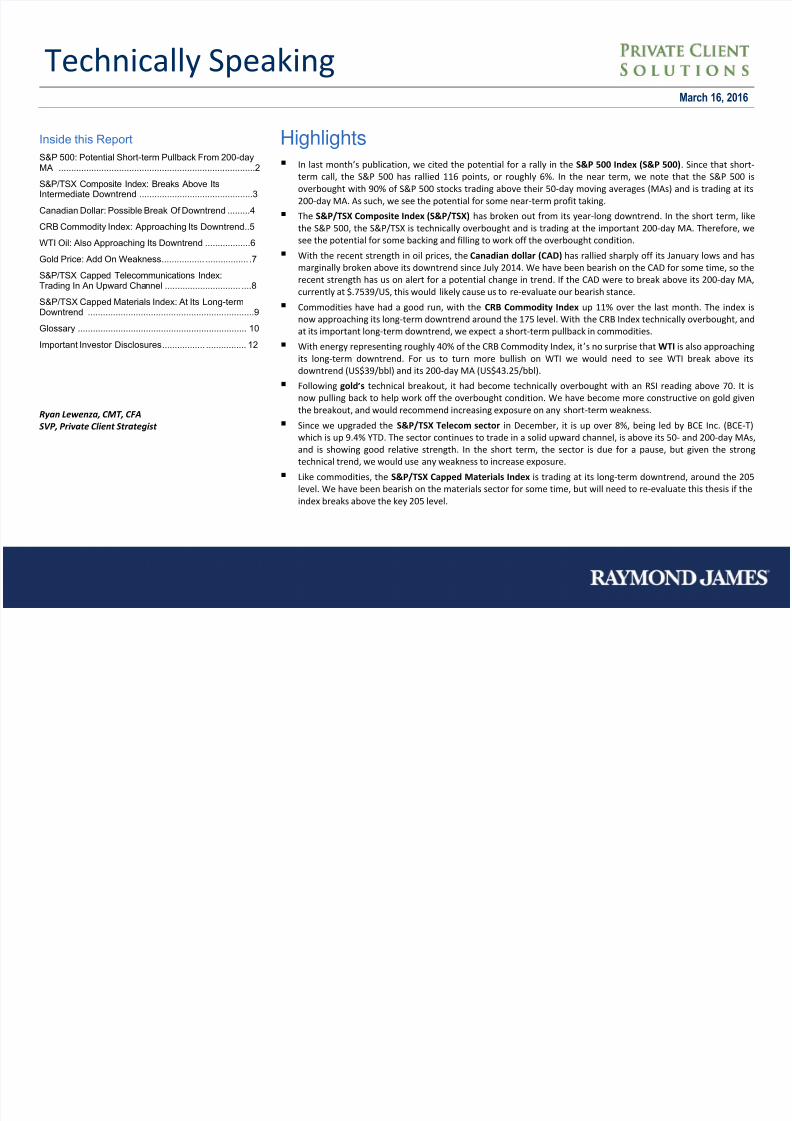
S&P 500: Potential Short-term Pullback From 200-day MA
Source: Stockcharts.com, Raymond James Ltd.
In last month’s publication we noted a “momentum divergence” that “is setting the stage for a rally in the short term”. Since that short-term call, the S&P 500 has rallied116 points, or roughly 6%.
With the recent strength there has been a notable improvement in the S&P 500’s technical profile. First, the S&P 500 has broken out from its “double bottom” chart pattern
which has a measuring implication up to 2,090. Second, the S&P 500 has broken above its 50-day MA.
However, in the near term we note that the S&P 500 is overbought with 90% of S&P 500 stocks trading above their 50-day MAs (above 80 indicates overbought) and is
trading at its 200-day MA.
As such, we see the potential for some near-term profit taking. But, after the expected short-term pullback, we see the potential for the S&P 500 to break above its 200-day
MA, and rally up to 2,090, where key resistance comes into play.
8/19/2019 Technically Speaking - March 16, 2016
http://slidepdf.com/reader/full/technically-speaking-march-16-2016 3/12
Technically Speaking
March 16, 2016 | Page 3 of 12
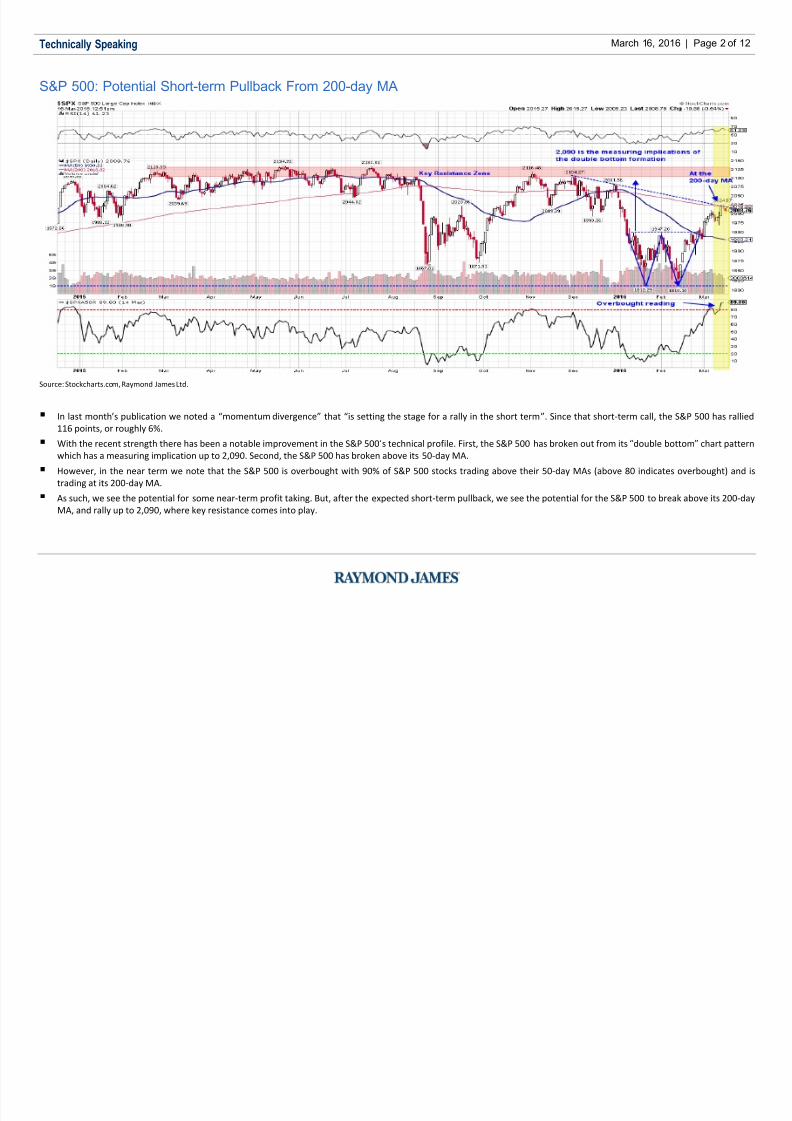
S&P/TSX Composite Index: Breaks Above Its Intermediate Downtrend
Source: Stockcharts.com, Raymond James Ltd.
Well it’s official. The S&P/TSX has broken out from its year-long downtrend. The S&P/TSX had been trading in a well-defined downtrend (red arrows) since May 2015, but it
finally broke above this downtrend in early March. Given this important technical breakout, we have become more constructive on Canadian equities.
In the short term, like the S&P 500, the S&P/TSX is technically overbought (percentage of stocks above their 50-day MA is at 85%) and is trading at the important 200-day
MA. Therefore, we see the potential for some backing and filling to work off the overbought condition.
Should the S&P/TSX hold above the 12,750 (downtrend intersection) to 12,661 (50-day MA) range on the expected pullback, we would view this positively, as this would
confirm that the downtrend is over.
8/19/2019 Technically Speaking - March 16, 2016
http://slidepdf.com/reader/full/technically-speaking-march-16-2016 4/12
Technically Speaking
March 16, 2016 | Page 4 of 12
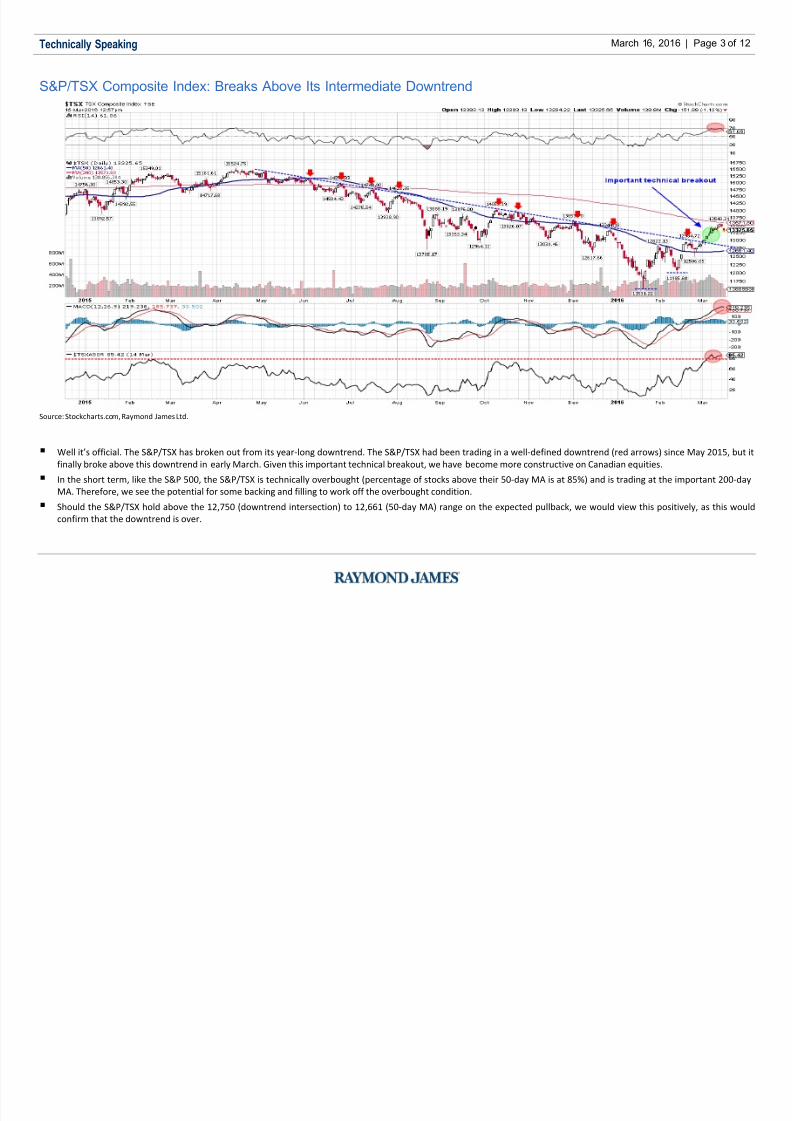
Canadian Dollar: Possible Break Of Downtrend
Source: Stockcharts.com, Raymond James Ltd.
With the recent strength in oil prices (CAD has a 0.96 correlation with WTI over the last 21 days), the CAD has rallied sharply off its January lows of $0.6820/US, and has
marginally broken above its downtrend since July 2014.
CAD is currently testing its 200-day MA, and with the MACD indicator possibly rolling over, we see the potential for some near-term weakness.
We have been bearish on the CAD for some time, so the recent strength has us on alert for a potential change in trend. If the CAD were to break above its 200-day MA,
currently at $.7539/US, this would likely cause us to re-evaluate our bearish stance.
8/19/2019 Technically Speaking - March 16, 2016
http://slidepdf.com/reader/full/technically-speaking-march-16-2016 5/12
Technically Speaking
March 16, 2016 | Page 5 of 12
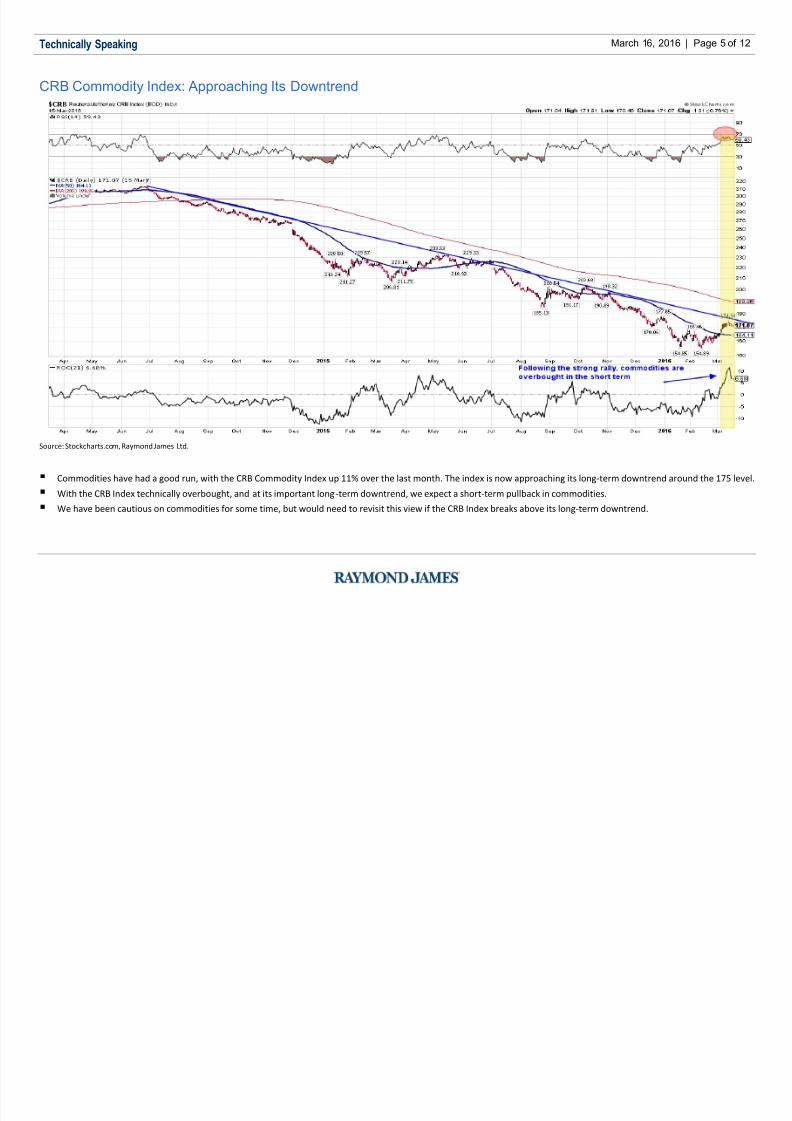
CRB Commodity Index: Approaching Its Downtrend
Source: Stockcharts.com, Raymond James Ltd.
Commodities have had a good run, with the CRB Commodity Index up 11% over the last month. The index is now approaching its long-term downtrend around the 175 level.
With the CRB Index technically overbought, and at its important long-term downtrend, we expect a short-term pullback in commodities.
We have been cautious on commodities for some time, but would need to revisit this view if the CRB Index breaks above its long-term downtrend.
8/19/2019 Technically Speaking - March 16, 2016
http://slidepdf.com/reader/full/technically-speaking-march-16-2016 6/12
Technically Speaking
March 16, 2016 | Page 6 of 12
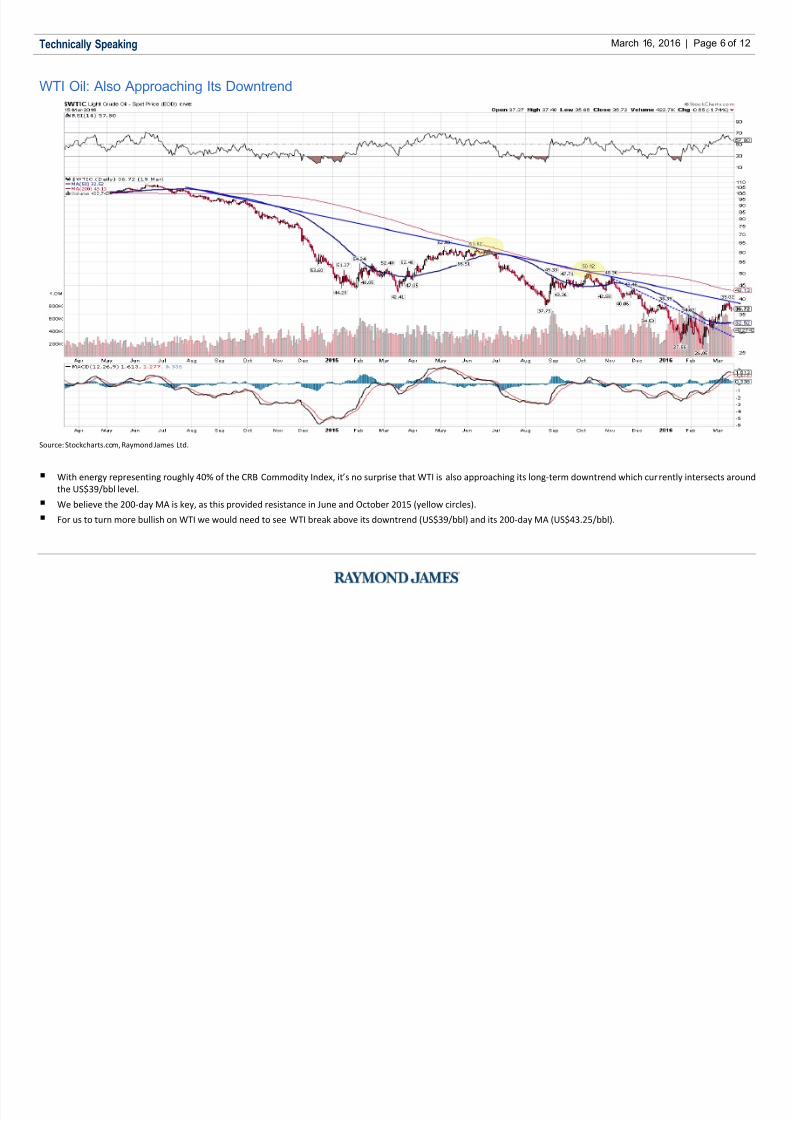
WTI Oil: Also Approaching Its Downtrend
Source: Stockcharts.com, Raymond James Ltd.
With energy representing roughly 40% of the CRB Commodity Index, it’s no surprise that WTI is also approaching its long-term downtrend which currently intersects around
the US$39/bbl level.
We believe the 200-day MA is key, as this provided resistance in June and October 2015 (yellow circles).
For us to turn more bullish on WTI we would need to see WTI break above its downtrend (US$39/bbl) and its 200-day MA (US$43.25/bbl).

8/19/2019 Technically Speaking - March 16, 2016
http://slidepdf.com/reader/full/technically-speaking-march-16-2016 7/12
Technically Speaking
March 16, 2016 | Page 7 of 12
Gold Price: Add On Weakness
Source: Stockcharts.com, Raymond James Ltd.
Following gold’s technical breakout, it had become technically overbought with an RSI reading above 70. It is now pulling back to help work off the overbought condition.
If gold pulls back and holds key support around the US$1,200/oz. level, we would view this positively, as it would confirm the downtrend is over.
Overall, we have become more constructive on gold given the breakout, and would recommend increasing exposure on any short-term weakness.

8/19/2019 Technically Speaking - March 16, 2016
http://slidepdf.com/reader/full/technically-speaking-march-16-2016 8/12
Technically Speaking
March 16, 2016 | Page 8 of 12
S&P/TSX Capped Telecommunications Index: Trading In An Upward Channel
Source: Stockcharts.com, Raymond James Ltd.
Since we upgraded the S&P/TSX Telecom sector to overweight in December, it is up over 8%, being led by BCE Inc. (BCE-T) which is up 9.4% YTD.
The sector continues to trade in a solid upward channel, is above its 50- and 200-day MAs, and is showing good relative strength.
In the short term, the sector is due for a pause, but given the strong technical trend, we would use any weakness to increase exposure.
8/19/2019 Technically Speaking - March 16, 2016
http://slidepdf.com/reader/full/technically-speaking-march-16-2016 9/12
Technically Speaking
March 16, 2016 | Page 9 of 12
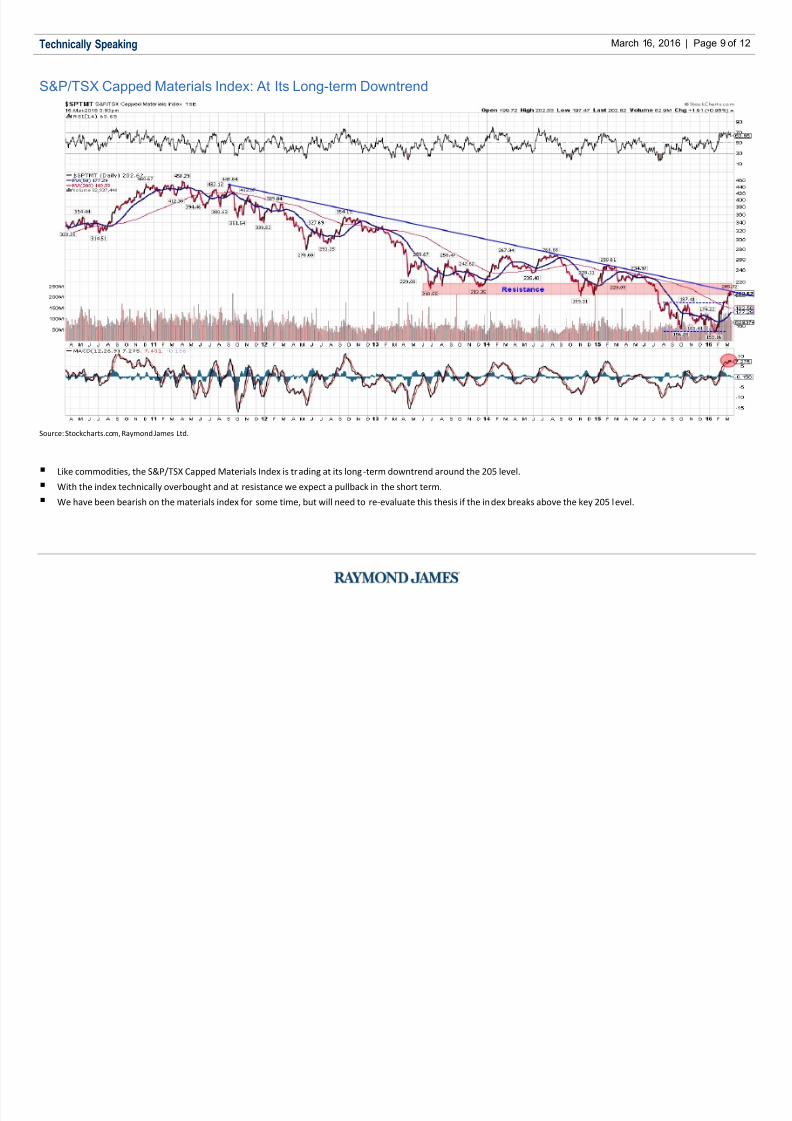
S&P/TSX Capped Materials Index: At Its Long-term Downtrend
Source: Stockcharts.com, Raymond James Ltd.
Like commodities, the S&P/TSX Capped Materials Index is trading at its long-term downtrend around the 205 level.
With the index technically overbought and at resistance we expect a pullback in the short term.
We have been bearish on the materials index for some time, but will need to re-evaluate this thesis if the index breaks above the key 205 level.

8/19/2019 Technically Speaking - March 16, 2016
http://slidepdf.com/reader/full/technically-speaking-march-16-2016 10/12
Technically Speaking
March 16, 2016 | Page 10 of 12
Glossary
Ascending Triangle
A continuation pattern where the period of consolidation takes the shape of an upward sloping triangle with an ascending lower trendline. A break down through the support trendline
can sometimes mark a reversal pattern.
Bollinger Bands
Bollinger bands gauge a security’s trading activity and trend by showing a range of normal price swings.
Candlestick Chart
A graphical representation of prices where opening and closing prices are connected to form coloured boxes. Generally, a series of dark candlesticks suggest downside momentum and
light candlesticks upside momentum.
Continuation Pattern
A chart formation that signals the continuation of the prevailing trend. Continuation patterns often occur after a period of brief consolidation.
Descending Triangle
A continuation pattern where the period of consolidation takes the shape of a downward sloping triangle with a declining upper resistance trendline. A break up through the resistance
trendline can sometimes mark a reversal pattern.
Double Bottom
Chart formation that normally occurs after an extended downtrend and resembles a W. Double bottoms signal potential price reversals.
Double Top
Chart formation that normally occurs after an extended uptrend and resembles an M. Double tops signal potential price reversals.
Fibonacci Sequences
Mathematical relationships that help predict points of support or resistance. The key Fibonacci ratio is 61.8% also referred to as "the golden ratio" or "the golden mean".
Flag
A chart formation in which prices move sharply to create a near vertical line (the flag pole) followed by a small move in the opposite direction (the flag). Flags are often continuation
patterns.
Gap
An open space on a chart. A gap is created when the low of one time period is above the high of the previous period, or the high of one time period is below the low of the previous
period. Gaps can signal breakouts or continuations of up or down trends.

8/19/2019 Technically Speaking - March 16, 2016
http://slidepdf.com/reader/full/technically-speaking-march-16-2016 11/12
Technically Speaking
March 16, 2016 | Page 11 of 12
Head-and-Shoulders Formation
A reversal chart formation that looks like a head and shoulders (with both a defined left and right shoulder). Head-and-shoulders formations can occur at both the bottom and top of a
trend.
MACD
The moving average convergence/divergence determines turning points in a trend by differencing two exponential moving averages of specific periods. The trendline of the MACD can
also signal continuation or reversal trends for share prices.
Moving Average
A statistical tool that plots smoothed prices to signal future price trends. 50-day and 200-day moving averages are the most common indicators.
On Balance Volume (OBV)
A cumulative indicator that adds volume on up days and subtracts volume on down days. OBV shows buying or selling pressure. An upward sloping OBV confirms an uptrend, while a
downward sloping OBV confirms a downtrend.
Resistance Level
A technical level that prices may have trouble rising above (i.e., where the price may experience selling pressure).
Rounded Bottom
A bullish reversal pattern taking the shape of a U. Ideally, the rounded bottom should be accompanied by a similar volume pattern.
RSI
The relative strength index measures the velocity of directional price movements with extreme values indicating overbought and oversold conditions. The trendline of the RSI can also
signal continuation or reversal trends for share prices.
Support Level
A technical level that prices may have trouble falling below (i.e., where the price should have buying support).
Trendline
A line connecting a series of ascending lows (in the case of an up trendline) or descending highs (in the case of a down trendline).
8/19/2019 Technically Speaking - March 16, 2016
http://slidepdf.com/reader/full/technically-speaking-march-16-2016 12/12
Technically Speaking
March 16, 2016 | Page 12 of 12
Important Investor Disclosures
Complete disclosures for companies covered by Raymond James can be viewed at: www.raymondjames.ca/researchdisclosures.
This newsletter is prepared by the Private Client Services team (PCS) of Raymond James Ltd. (RJL) for distribution to RJL’s r etail clients. It is not a product of the Research
Department of RJL.All opinions and recommendations reflect the judgement of the author at this date and are subject to change. The author’s recommendations may be based on technical
analysis and may or may not take into account information contained in fundamental research reports published by RJL or its affiliates. Information is from sources believed to
be reliable but accuracy cannot be guaranteed. It is for informational purposes only. It is not meant to provide legal or tax advice; as each situation is different, individuals should
seek advice based on their circumstances. Nor is it an offer to sell or the solicitation of an offer to buy any securities. It is intended for distribution only in those jurisdictions
where RJL is registered. RJL, its officers, directors, agents, employees and families may from time to time hold long or short positions in the securities mentioned herein and may
engage in transactions contrary to the conclusions in this newsletter. RJL may perform investment banking or other services f or, or solicit investment banking business from, any
company mentioned in this newsletter. Securities offered through Raymond James Ltd., Member-Canadian Investor Protection Fund. Insurance products & services offered
through Raymond James Financial Planning Ltd., not a Member-Canadian Investor Protection Fund.
Commissions, trailing commissions, management fees and expenses all may be associated with mutual funds. Please read the pros pectus before investing. Mutual funds are not
guaranteed, their values change frequently and past performance may not be repeated. The results presented should not and cannot be viewed as an indicator of future
performance. Individual results will vary and transaction costs relating to investing in these stocks will affect overall performance.
Information regarding High, Medium, and Low risk securities is available from your Financial Advisor.
RJL is a member of Canadian Investor Protection Fund. ©2015 Raymond James Ltd.