techniques and evaluation from a cross-platform imaging
TRANSCRIPT

IEEE TransacTIons on UlTrasonIcs, FErroElEcTrIcs, and FrEqUEncy conTrol, vol. 60, no. 7, JUly 20131386
0885–3010/$25.00 © 2013 IEEE
Techniques and Evaluation From a Cross-Platform Imaging Comparison of Quantitative
Ultrasound Parameters in an In Vivo Rodent Fibroadenoma Model
lauren a. Wirtzfeld, Member, IEEE, Kibo nam, yassin labyed, Goutam Ghoshal, alexander Haak, Ellora sen-Gupta, Zhi He, nathaniel r. Hirtz, rita J. Miller, sandhya sarwate,
douglas G. simpson, Member, IEEE, James a. Zagzebski, Member, IEEE, Timothy a. Bigelow, Michael l. oelze, Senior Member, IEEE, Timothy J. Hall, Senior Member, IEEE,
and William d. o’Brien Jr., Life Fellow, IEEE
Abstract—This contribution demonstrates that quantitative ultrasound (QUS) capabilities are platform independent, using an in vivo model. Frequency-dependent attenuation estimates, backscatter coefficient, and effective scatterer diameter esti-mates are shown to be comparable across four different ultra-sound imaging systems with varied processing techniques. The backscatter coefficient (BSC) is a fundamental material prop-erty from which several QUS parameters are estimated; there-fore, consistent BSC estimates among different systems must be demonstrated. This study is an intercomparison of BSC estimates acquired by three research groups (UIUC, UW, ISU) from four in vivo spontaneous rat mammary fibroadenomas us-ing three clinical array systems and a single-element laborato-ry scanner system. Because of their highly variable backscatter properties, fibroadenomas provided an extreme test case for BSC analysis, and the comparison is across systems for each tumor, not across the highly heterogeneous tumors. RF echo data spanning the 1 to 12 MHz frequency range were acquired in three dimensions from all animals using each system. Each research group processed their RF data independently, and the resulting attenuation, BSC, and effective scatterer diameter (ESD) estimates were compared. The attenuation estimates across all systems showed the same trends and consistently fit the power-law dependence on frequency. BSCs varied among the multiple slices of data acquired by each transducer, with variations between transducers being of a similar magnitude as those from slice to slice. Variation between BSC estimates was assessed via functional signal-to-noise ratios derived from back-scatter data. These functional signal-to-noise ratios indicated that BSC versus frequency variations between systems ranged from negligible compared with the noise level to roughly twice the noise level. The corresponding functional analysis of vari-ance (fANOVA) indicated statistically significant differences between BSC curves from different systems. However, root
mean squared difference errors of the BSC values (in decibels) between different transducers and imaging platforms were less than half of the BSC magnitudes in most cases. Statistical comparison of the effective scatterer diameter (ESD) estimates resulted in no significant differences in estimates from three of the four transducers used for those estimates, demonstrating agreement among estimates based on the BSC. This technical advance demonstrates that these in vivo measurements can be made in a system-independent manner; the necessary step toward clinical implementation of the technology.
I. Introduction
quantitative ultrasound (qUs) imaging is a model-based approach aimed at lesion detection and clas-
sification. In contrast to conventional B-mode imaging that provides primarily qualitative images of tissue, qUs attempts to extract quantitative values associated with tissue microstructure by analyzing the rF echo data. The frequency-dependent backscatter coefficient (Bsc) is a fundamental material property that describes the echo-genicity of a material on an absolute scale. The Bsc is a system-independent and operator-independent quantity and is the basis of many qUs parameter estimates. The frequency-dependent attenuation is a necessary parameter for obtaining accurate Bsc estimates, and additionally provides independent material information.
qUs has been used successfully in identifying and dis-criminating ocular [1], [2] and prostate [3], [4] tumors, for measuring renal arteriolar and glomerular diameters [5], [6], and for detecting diffuse liver disease [7]. For qUs estimates to translate to the clinic, system independence is imperative. Interlaboratory comparison studies allow for an assessment of measurement agreement among dif-ferent groups and systems. Previous comparison studies have evaluated quantitative backscatter and attenuation for physical phantoms with known properties, including those having glass bead scatterers with different diam-eter distributions. When methods to account for system dependencies on phantom-based echo data were applied, excellent agreement (nominally unbiased with about 1-dB standard deviation in well-characterized phantoms) be-
Manuscript received december 27, 2012; accepted april 5, 2013. This work was supported by national Institutes of Health (nIH) grant num-ber r01ca111289 and by the canadian national science and Engineer-ing research council for l. a. Wirtzfeld.
l. a. Wirtzfeld, G. Ghoshal, a. Haak, E. sen-Gupta, r. J. Miller, s. sarwate, M. l. oelze, and W. d. o’Brien Jr. are with the department of Electrical and computer Engineering, University of Illinois at Urbana-champaign, Urbana, Il (e-mail: [email protected]).
K. nam, J. a. Zagzebski, and T. J. Hall are with the department of Medical Physics, University of Wisconsin–Madison, Madison, WI.
y. labyed and T. a. Bigelow are with the department of Electrical and computer Engineering, Iowa state University, ames, Ia.
Z. He, n. r. Hirtz, and d. G. simpson are with the department of statistics, University of Illinois at Urbana-champaign, champaign, Il.
doI http://dx.doi.org/10.1109/TUFFc.2013.2711

wirtzfeld et al.: cross-platform in vivo qUs imaging comparison 1387
tween measured values and scattering theory was demon-strated among different measurement systems (with both single-element and array transducers) and laboratories [8]–[10]. To demonstrate system independence in more weakly scattering media, two laboratory systems were used to examine scattering from agar spheres in an agar background of different density [11]. Bsc results for this model measured by the two systems were in good agree-ment with predictions from scattering theory.
The next logical step in these qUs measurement sys-tem comparisons is to progress to Bsc estimates for ani-mal models. a preliminary study [12] demonstrated some variability (quantified via the root mean square error) among Bscs in six spontaneous rat tumors (one carcino-ma and five fibroadenomas). From the experience gained in that preliminary study, another cross-platform compar-ison study was conducted, and is reported herein, using the same four ultrasound systems but improved experi-mental techniques. This contribution details the systems, experimental procedure, and processing procedures used to evaluate Bscs and reports results for four additional rat fibroadenomas.
The goal of this study was to perform a cross-platform comparison of Bsc estimates using a single-element labo-ratory scanner and three clinical array system scanners in an in vivo animal tumor model. The experimental design employed in this study called for each laboratory group to acquire echo data for the same tumors in live animals at essentially the same time. Each group of investigators [from the University of Wisconsin–Madison (UW), Iowa state University (IsU), and the University of Illinois at Urbana-champaign (UIUc)] assembled at the UIUc lab-oratory with representative ultrasonic systems that are used in their laboratories; that is, siemens (UW), Zonare (IsU), Ultrasonix (UIUc), and a single-element labora-tory system (UIUc). additionally, for each ultrasonic system, those who operated the equipment during data acquisition and data processing dealt only with their own equipment and data. no data analysis comparisons were conducted while the data were being acquired; all analyses were performed at the investigators’ respective home loca-tions. The key aspect of the study was to assess system-independent parameter estimates with the four imaging systems on live tissue, which required each group of inves-tigators to work independently.
This study expanded upon [12] with an additional four rat fibroadenomas, and by determining the attenuation for each individual tumor from the backscattered ultrasound rF data. Using this strategy, the appropriate attenuation compensation was specific to each fibroadenoma. This is in contrast to the preliminary study [12], in which an at-tenuation slope of 1 dB/cm·MHz was used for all fibroade-nomas and all systems for consistency. However, the use of a consistent, but only approximate, attenuation slope for all specimens disregards individual differences in attenua-tion that can lead to inaccuracies in Bsc estimation. Fur-ther, in this study, the Esd was estimated for each tumor from the attenuation-compensated Bsc for that tumor.
spontaneous rat fibroadenomas were used to provide a heterogeneous, uncharacterized material in which to test the attenuation and attenuation-compensated Bsc tech-niques and to compare the results across systems. Thus, the comparison is made across systems for each tumor and not across tumors. Given previous work in homoge-neous and well-characterized materials, the next step is to perform a comparison of parameter estimates in live tissue for which the true parameter values are unknown. although there are experimental tumor types that can produce very homogeneous tumors, it was desired to use a tumor more consistent with clinical imaging tasks in which a heterogeneous mix of tissues types and proper-ties is common. Fibroadenoma heterogeneity is consider-able, thus providing a near worst-case biological medium to challenge the cross-platform qUs capability. attenua-tion, Bsc, and Esds within the tumors were estimated using data from each system, and results were compared. a functional anoVa method was used for comparison of the Bsc versus frequency curves across systems [13].
II. Methods
A. Animal Model
Four female sprague-dawley (sd) rats (Harlan labo-ratories Inc., Indianapolis, In) weighing 290 ± 63 g, and at age 9 ± 1 mo, with spontaneous mammary tumors were imaged. This animal model results in primarily fibroad-enomas, the most common benign neoplasm of the rat mammary gland, with a smaller number of carcinomas. Because these tumors were spontaneous, the location, rate of growth and histological category, as assessed by a board-certified pathologist (ss), varied from animal to animal. The experimental protocol was approved by the Institutional animal care and Use committee (IacUc) of the University of Illinois at Urbana-champaign and satisfied all university and national Institutes of Health (nIH) rules for the humane use of laboratory animals.
B. Ultrasound Systems
Three array-based clinical systems and one single-ele-ment laboratory system were used to image the same rat tumors. The systems not housed at UIUc were transport-ed to enable all data acquisition to take place at UIUc by the respective research group. The three clinical systems were a sonixrP (Ultrasonix Medical corporation, rich-mond, Bc); a Zonare Z.one scan engine diagnostic system (ZonarE Medical systems Inc., Mountain View, ca); and a siemens acuson s2000 (siemens Medical solutions Usa Inc., Malvern, Pa). The individual transducers used on each system and their nominal center frequencies are summarized in Table I. In addition, the bandwidth over which the analyses were performed is included, and the cut-off criteria that were used to obtain those bandwidths are described.

IEEE TransacTIons on UlTrasonIcs, FErroElEcTrIcs, and FrEqUEncy conTrol, vol. 60, no. 7, JUly 20131388
C. Animal Handling
The study was performed at the University of Illinois at Urbana-champaign (UIUc) to enable sequential data collection from each animal with each system. all four rats were provided food ad libitum. The anatomic loca-tions of the tumors varied, with one adjacent to the left fore limb, one by the left hind limb, and two next to the right hind limb. Each rat was anesthetized with 87 mg/kg of ketamine hydrochloride and 13 mg/kg of xylazine intra-peritoneally. The hair over the tumor was shaved and de-pilated to maximize sound transmission. a rectangular 20 × 4 mm box was drawn on the skin over the tumor region to indicate the region where data were to be acquired. a small piece of tape was placed in the upper left corner of the box to aid in guiding the different imaging probes to approximately the same tissue region. The tape could be observed in the B-mode images and allowed for the probe to be aligned to the same tumor region. This probe-guid-ing procedure assured that rF echo data were acquired from nearly the same in situ tumor region, given that the study was focused on cross-platform performance, not on comparisons among the fibroadenomas (we expected the results to differ between fibroadenomas). The rat was mounted in a custom holder which allowed direct ultra-sonic beam access to the tumor, and partially submerged in a tank of room-temperature degassed water. rF echo data were acquired from each scanner without moving the rat relative to the holder to aid in the scanning of the same tumor region by all the imaging systems. Variations in alignment between the tumor and transducer occurred because of limitations in manually orienting them rela-tive to each other. The linear array probes used in this study had up to a 2-cm water path between the tumor and transducer to keep the focal zone within the tumor. For the laboratory system, the single-element transducers were positioned so that the focal plane was mid-tumor. For all systems, data were acquired from a total of five image planes separated by 1 mm.
Tumors were scanned by each imaging system in vary-ing (pseudo-random) order to avoid biases that may arise
based on the time duration the rat was under anesthe-sia. Total scanning time for an individual tumor with all four systems was approximately three hours. The on-site anesthesia level for each rat was carefully monitored by a veterinarian (rJM). after imaging, the animals were euthanized and the tumors were excised. The tumors were placed in 10% neutral buffered formalin for 24 to 72 h, stained with hematoxylin and eosin (H&E), and sent to the pathologist (ss) for diagnosis.
D. Reference Techniques
For the three array-based clinical systems, reference scans were acquired from a well-characterized reference phantom after acquiring the experimental data from the tumors and without adjusting any of the system settings [14]. In all cases, the phantom was positioned at the same depth as the sample to keep the water path the same length in both cases. The phantom was 20 cm thick, pro-viding reference signals throughout the entire depth from which tumor data were acquired. The reference phantom was made with 6.4 g of 1- to 45-µm-diameter glass beads uniformly distributed in a 1600-cm3 gel background mate-rial. The gel background material was an emulsion con-taining 70% safflower oil [15]. The top of the phantom was covered with a 25-µm-thick saran layer. acoustic properties of the reference phantom were determined us-ing a laboratory-based narrowband substitution method [16], applied to material in test cylinders manufactured at the same time as the phantom. The sound speed was 1492 m/s at 2.5 MHz. a polynomial was fit to the mea-sured attenuation data to model the frequency-dependent attenuation coefficient, and is represented by the function α = 0.033f 2 + 0.26f + 0.18, where f is in megahertz and α is in decibels per centimeter. This function applies to the frequency range from 2 to 10 MHz.
For the laboratory system, a reference scan was ac-quired from a planar poly(methyl methacrylate) (PMMa) reflector (with a pressure reflection coefficient of 37%) that was stepped through the entire depth of field of the transducer in quarter-wavelength steps.
TaBlE I. Transducers Used, Their nominal center Frequencies, and approximate Bandwidths covered by the Transducers for Each system are summarized, along With the cutoff criterion Used to determine the Bandwidth.
Ultrasound system Transducer
nominal center frequency (MHz)
approximate combined bandwidth (MHz)
Bandwidth cutoff criterion
data sampling rate (MHz)
Ultrasonix sonixrP l9–4/38 5 2 to 8 −15 dB 40l14–5/38 6
Zonare Z.one l8–3 7 4 to 9 −20 dB 50l14–5sp 10
siemens acuson s2000 4V1 3 2 to 14 10 dB higher than noise floor 409l4 618l6 10
laboratory 3.5f3 3.5 0.6 to 10.5 −6 dB 407.5f4 7.5

wirtzfeld et al.: cross-platform in vivo qUs imaging comparison 1389
E. Attenuation
For each of the three clinical systems, the frequency-dependent attenuation coefficient was estimated from the rF backscatter signal data for each tumor. The data from the laboratory system were too noisy to extract attenua-tion estimates because no waveform averaging could be employed with a live animal, and therefore no attenuation data were available from this system. a reference phantom technique that uses the spectral difference algorithm [14] was implemented independently by each laboratory group to estimate the attenuation coefficient versus frequency. Thus, the selection of regions of interest (roIs) and indi-vidual analysis window sizes and locations were performed independently by each group on their own data.
In all cases, power spectral ratios of the rF echo data from the tumor region to data from the reference phan-tom at equivalent depths were computed to account for system-dependent factors, including the ultrasound field, on the sample echo data. First, B-mode images were con-structed from the rF data. Using the B-mode image, an overall roI was chosen within the tumor where the tis-sue appeared to be the least heterogeneous, to meet the uniform scattering assumption of the spectral difference attenuation estimation method. Within the overall roI, overlapping analysis windows were used to analyze power spectra as a function of depth. The analysis windows se-lected by each group varied in dimensions, exact place-ment, and windowing, as summarized in Table II.
For each analysis window, the ratio of the echo signal power spectrum from the sample to that of the reference phantom, Pssamp/Psref, was estimated. according to [14, Eq. (12)] , Pssamp/Psref can be approximated by
PSPS
BSCBSC
samp
ref
samp samp
ref ref=
−−
( )exp( ( ) )( )exp( (f f df
44αα ff d) ) , (1)
where αsamp( f ) and αref( f ) are the frequency-depen-dent attenuation coefficients for the sample and refer-ence, respectively; d is the depth; and f is the frequency. Bscsamp( f ) and Bscref( f ) represent the frequency-depen-dent Bscs of the sample and reference, respectively. as-suming constant Bsc within the roI, the change in the natural logarithm of the ratio as a function of tissue depth is of the form
∂∂
= − − = −d f fln ( ( ) ( ))
PSPSsamp
refsamp4 4α αref ∆∆α( ),f
(2)
where Δα( f ) is the difference between the attenuation coefficients of the tumor and the reference phantom. a ln(Pssamp/Psref) versus depth linear regression was per-formed using the model ln(Pssamp/Psref) = p1d + p0 for each frequency, where p1 is equal to −4Δα( f ) at that frequency and p0 is a constant. The sample attenuation coefficient was obtained by adding the known attenuation coefficient of the reference phantom [as in (2)].
For the sonixrP system (UIUc), specific spectral anal-ysis parameters are given in Table II. The wavelength λ was estimated using the speed of sound as 1540 m/s and the center frequency of the respective transducer. For ex-ample, for the l9-4/38 transducer, the size of each analy-sis windows was 4.6 mm. Each analysis window consisted of approximately 30 acoustic scan lines. To obtain smooth reference power spectra, all scan lines from the reference phantom for the respective transducer were used. The roI was selected in a homogeneous region in the tumor judging from the B-mode images.
For the Zonare system (IsU), roIs varied in spatial ex-tent to allow for the largest homogeneous region possible to be analyzed, based on a visual assessment of the grayscale images. To determine the number of uncorrelated acoustic scan lines in the roI, the correlation coefficient was mea-sured among adjacent lines from the reference phantom. The correlation coefficient was less than 0.2 between the uncorrelated echo lines that were separated by at least two adjacent lines. only the uncorrelated echoes were used to estimate the power spectra. The power spectrum for each analysis window within the roI of the tumor as well as within the reference phantom was estimated by applying a rectangular window to each acoustic scan line signal segment, performing an FFT, and then averaging laterally across the echo lines in the analysis window.
For the siemens s2000 system (UW), rF echo data were acquired through the manufacturer’s axius direct ultrasound research interface (UrI) [17], where the signals from acoustic scan lines are stored with 16-bit resolution at 40-MHz sample frequency. The roIs varied in spatial extent, because a homogeneous region needed to be se-lected within the tumor. For each tumor, the largest re-
TaBlE II. summary of Parameters for attenuation Estimation Used by Each array-Based Imaging system.
Ultrasound system
analysis window size analysis window overlap Windowing functionaxial lateral axial lateral
Ultrasonix sonixrP 15 λ 50 scan lines (7.5 mm)
50% 90% rectangular
Zonare Z.one 5 pulse lengths (0.847 mm for the l14–5sp and 0.524 mm for the l8–3)
Width of tumor (3.7 to 11.5 mm)
50% one analysis region rectangular
siemens acuson s2000 3 mm (3.9 µs) 3 mm (24–30 scan lines)
75% 75% Hann

IEEE TransacTIons on UlTrasonIcs, FErroElEcTrIcs, and FrEqUEncy conTrol, vol. 60, no. 7, JUly 20131390
gion that appeared to have a homogeneous texture in the B-mode image was selected. To determine the amount of independent data within the 3 × 3 mm analysis windows employed, an autocorrelation analysis of the rF echo data from the reference phantom was used. Using the distance over which correlation in the rF data dropped 20 dB as a metric, the average axial extent of the analysis window (among the three transducers) was nine pulse durations, and the average lateral extent was 3.8 decorrelated pulse-echo beam widths. The power spectrum for each analysis window within the roI of the tumor as well as within the reference phantom was estimated by applying a Hann window to each 3-mm (3.9-µs) acoustic scan line signal segment, computing its chirp-z transform, and then aver-aging laterally across the analysis window.
For each tumor, attenuation coefficient estimates from all three systems were plotted in decibels per centimeter versus frequency. a power law of the form
α α= 0f n (3)
was fit to the data from all three systems using a nonlin-ear least squares fit. This combined estimate of the tumor attenuation in the form of a power law was then used in processing the data for the Bsc estimates from all sys-tems. The same tumor-specific attenuation estimate was used to compensate for attenuation across all systems to minimize compounding differences in results between at-tenuation and Bsc.
F. Backscatter Coefficient
For each system, the frequency-dependent Bsc was computed for each tumor. The roI within the tumor was outlined within each 2-d slice and divided into analysis windows, with sizes summarized in Table III. The analysis windows allowed for the Bsc estimates to be made locally to provide information regarding variations in estimates of the Esds within a tumor.
For the clinical imaging systems, the Bscs were esti-mated using the reference phantom technique [14]. For each analysis window, the ratio of the echo signal pow-er spectrum from the sample to that of the reference,
Pssamp/Psref, was corrected for the difference between the total attenuation of the reference phantom and the tumor at the depth of the analysis window, as determined by the power law fit. Eq. (1) was then solved for Bscsamp( f ), the frequency-dependent Bsc of the tumor tissue within the analysis window.
For the laboratory system, the Bsc was estimated us-ing a planar reflector to compensate for the system-depen-dent factors [11], [18], [19].
The tumor surface was first outlined in the B-mode im-age. Because the tumor has a curved surface, each rF echo line in the roI was then compensated for attenuation as per the distance from the tumor surface to the roI for that particular rF line as outlined in the B-mode image. For the siemens system, the mean distance between the tumor surface and scan lines within the analysis window was calculated and used for attenuation compensation for all scan lines within the analysis window. For the Zonare system, the distances for attenuation compensation in each analysis window were based on the central scan line within the analysis window and applied to all scan lines. For the sonixrP and laboratory systems, the distances for attenuation compensation were determined for each scan line individually within the analysis window.
For all systems, within each analysis window, the rF signals from individual acoustic scan lines were processed to estimate Bscs; these were then averaged to give a Bsc for the analysis window. The average of all the analysis windows was used to estimate the Bsc for the entire slice (see Table III).
With the laboratory system (UIUc), the entire visible portion of the tumor from the B-mode image was outlined into an roI and segmented for analysis. The size and the percent overlap of the analysis windows are listed in Table III. Because of the fixed focus and often high attenuation within the fibroadenomas, some regions had a poor signal-to-noise ratio. Generally, the back wall of the tumor could not be observed, so these regions were not included in the selected roI. The tissue chosen for segmentation was located within the depth of focus for each transducer used to scan the tumor. The planar reference echo signals were acquired with the same overall electronic system settings for each transducer. The planar reference echo signals were
TaBlE III. summary of Parameters for Backscatter coefficient (Bsc) analysis Used by Each Ultrasound system.
Ultrasound system
analysis window sizeanalysis window
overlap
scan lines employedaxial lateral axial lateral
Ultrasonix sonix rP 15 λ 15 λ 50% 50% all scan lines – 0.15 mm spacing
Zonare Z.one 5 pulse lengths (0.847 mm for the l14–5sp and 0.524 mm for the l8–3)
30 scan lines (2.57 to 4.78 mm)
90% 90% Every second scan line – decorrelated to 20%
siemens acuson s2000 4 mm 4 mm 90% 90% all scan lines – 3.8 decorrelated pulse widths in analysis window
laboratory 15 λ 15 λ 75% 75% all scan lines – 1/4 λ line spacing for each transducer

wirtzfeld et al.: cross-platform in vivo qUs imaging comparison 1391
acquired by finding the maximum signal at the focus and then moving the single-element transducer to cover the zone where the echo signal from the reflector varied from a third of the maximum amplitude, through the focus back to a third of the maximum amplitude. The reference data were acquired after each transducer was used to acquire tumor data and/or each time any electronic system set-ting was changed to account for system dependencies. For each analysis region, the reference power spectra obtained from within the gated range were averaged. The Bsc was then estimated using the method described by chen et al. [20].
G. Statistical Analysis
rF echo data from multiple planes, each separated by 1 mm, had been acquired from each tumor. Each plane of data was considered to provide an independent sample. Because of the different center frequencies of the trans-ducers, each rF data set ranged over a different frequency bandwidth. Two frequency ranges were selected to pro-vide comparisons between Bsc versus frequency curves from different systems—a lower frequency range (3.9 to 4.9 MHz) and a higher frequency range (6.55 to 7.9 MHz). These two frequency ranges provided maximum overlap between systems (Fig. 1).
The following model equation was employed to sepa-rate system effects and noise effects on the measurement of Bsc (in decibels):
10 10 0log ( ( )) ( ) ( ) ( ), ,BSC syst sampf f f e f f= + + ∈µ β Ω (4)
where Ω is the frequency range of interest, μ0( f ) is the system-independent Bsc parameter (in decibels), βsyst( f )
is the system-dependent bias, if any, and esamp( f ) denotes the random sample noise, which was correlated across dif-ferent frequencies f. The noise component was assumed to have a constant mean equal to zero, a stationary auto-correlation function, and a constant variance σe
2. Using (4), the null hypothesis of no system bias had the form
H f f02 0: ( )βsyst d for each system.
Ω∫ = (5)
Because of the correlation within Bsc versus frequency curves, functional anoVa (fanoVa) was used to test the hypothesis in (5), using bootstrap resampling to deter-mine the significance of the fanoVa F-statistic [13], [21], [22]. This was accomplished by: 1) linearly interpolating the gridded Bsc estimates to a common grid of frequen-cies; 2) estimating the mean frequency-dependent Bsc (in decibels) within and across systems via frequency spe-cific averaging; 3) computing the mean (over frequencies) within and between system sums of squares functions; 4) computing the resulting fanoVa test statistic (appendix (a.4), [13], [21]); and 5) evaluating the significance of the observed fanoVa statistic via bootstrap resampling from the entire collection of Bsc estimates [23]. Further details are provided in the appendix.
For cases in which statistically significant system differ-ences were detected, functional signal-to-noise ratios were computed to compare the magnitudes of system effects to the noise level. These were measured by the root mean signal-to-noise ratio (rsnr) derived in the appendix; see (a.11). The formula in (a.11) is a fanoVa generalization of cohen’s d [24] (mean square difference between means divided by standard deviation), a standard effect size esti-mate in univariate anoVa and regression analysis. Table IV provides the rsnr values for each tumor.
H. Effective Scatterer Diameter Estimates
Esd estimates were performed using one transducer for each imaging system that provided overlapping band-width with data from other systems. The transducers em-ployed for the Esd estimates were the sonixrP l14-5/38 transducer, the Zonare l8-3 transducer, the siemens 9l4 transducer, and the laboratory system 7.5f4 transducer. Estimates were performed using both the full bandwidth of each transducer and also with the bandwidth limited to a common range for all transducers. For the Zonare system, the limited bandwidth case was the same as the full bandwidth case.
The Esd was estimated for each roI using the Gauss-ian form factor. The Bsc σ is expressed in terms of the Gaussian form factor as
σ ∝ −k ka4 0 827 2exp ,. (6)
where k is the wave number and a is the effective scatterer radius. The Esd from the laboratory and Zonare sys-tems were estimated by minimizing the mean square error
Fig. 1. Frequency ranges for calculating the backscatter coefficient (Bsc) for the nine scanning system/transducer combinations, with the selected low (3.9 to 4.9 MHz) and high (6.55 to 7.9 MHz) frequency ranges su-perimposed.
IEEE TransacTIons on UlTrasonIcs, FErroElEcTrIcs, and FrEqUEncy conTrol, vol. 60, no. 7, JUly 20131392
(MsE) between the Bsc and the Gaussian form factor. The Esds from the siemens and Ultrasonix systems were estimated based on closed-form solutions detailed in [25] and [26], respectively. Parametric images of both the Esd and the corresponding MsE were constructed to provide information about the spatial distribution of parameter estimates. Where multiple analysis windows overlapped, the parametric image displays the average value.
To determine if there were statistically significant dif-ferences in Esd estimates across the imaging systems, an additive linear model with factor variables for rat, imag-ing system, and bandwidth (full or limited) was run on the Esd data with p-values less than 0.05 considered sig-nificant. The method is a weighted least squares approach, with weights equal to the numbers of Esd estimates.
III. results
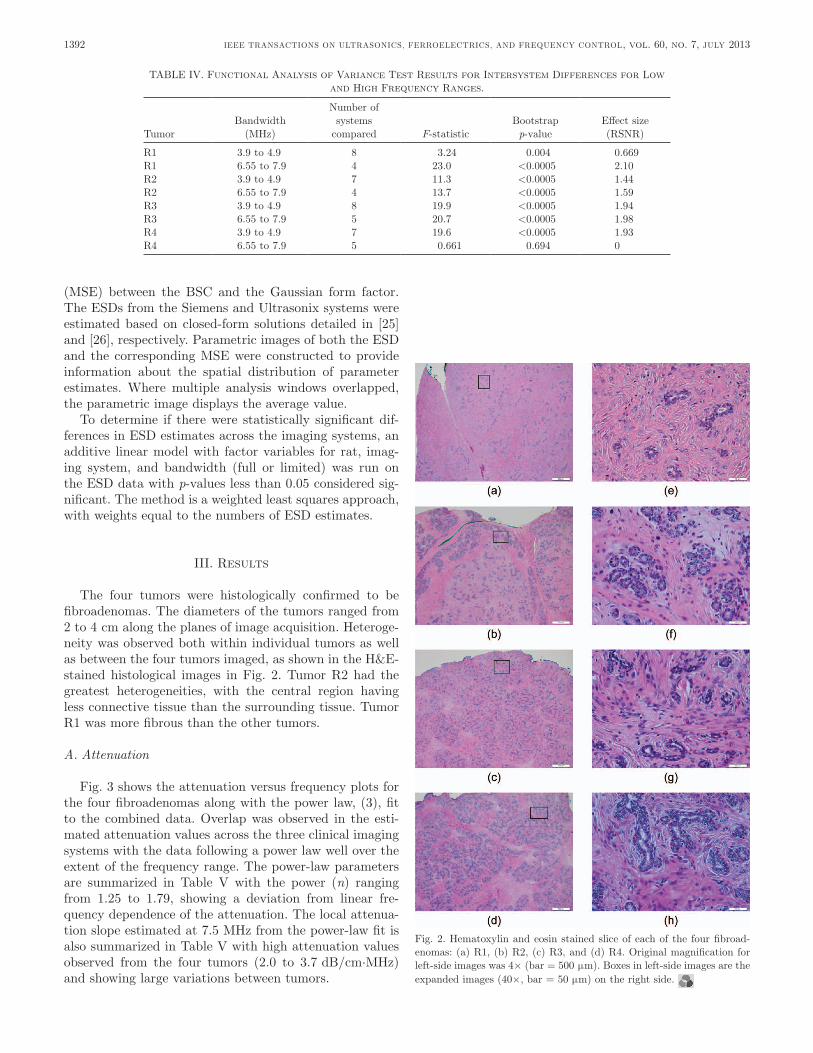
The four tumors were histologically confirmed to be fibroadenomas. The diameters of the tumors ranged from 2 to 4 cm along the planes of image acquisition. Heteroge-neity was observed both within individual tumors as well as between the four tumors imaged, as shown in the H&E-stained histological images in Fig. 2. Tumor r2 had the greatest heterogeneities, with the central region having less connective tissue than the surrounding tissue. Tumor r1 was more fibrous than the other tumors.
A. Attenuation
Fig. 3 shows the attenuation versus frequency plots for the four fibroadenomas along with the power law, (3), fit to the combined data. overlap was observed in the esti-mated attenuation values across the three clinical imaging systems with the data following a power law well over the extent of the frequency range. The power-law parameters are summarized in Table V with the power (n) ranging from 1.25 to 1.79, showing a deviation from linear fre-quency dependence of the attenuation. The local attenua-tion slope estimated at 7.5 MHz from the power-law fit is also summarized in Table V with high attenuation values observed from the four tumors (2.0 to 3.7 dB/cm·MHz) and showing large variations between tumors.
TaBlE IV. Functional analysis of Variance Test results for Intersystem differences for low and High Frequency ranges.
TumorBandwidth
(MHz)
number of systems
compared F-statisticBootstrap p-value
Effect size (rsnr)
r1 3.9 to 4.9 8 3.24 0.004 0.669r1 6.55 to 7.9 4 23.0 <0.0005 2.10r2 3.9 to 4.9 7 11.3 <0.0005 1.44r2 6.55 to 7.9 4 13.7 <0.0005 1.59r3 3.9 to 4.9 8 19.9 <0.0005 1.94r3 6.55 to 7.9 5 20.7 <0.0005 1.98r4 3.9 to 4.9 7 19.6 <0.0005 1.93r4 6.55 to 7.9 5 0.661 0.694 0
Fig. 2. Hematoxylin and eosin stained slice of each of the four fibroad-enomas: (a) r1, (b) r2, (c) r3, and (d) r4. original magnification for left-side images was 4× (bar = 500 µm). Boxes in left-side images are the expanded images (40×, bar = 50 µm) on the right side.

wirtzfeld et al.: cross-platform in vivo qUs imaging comparison 1393
B. Backscatter Coefficient
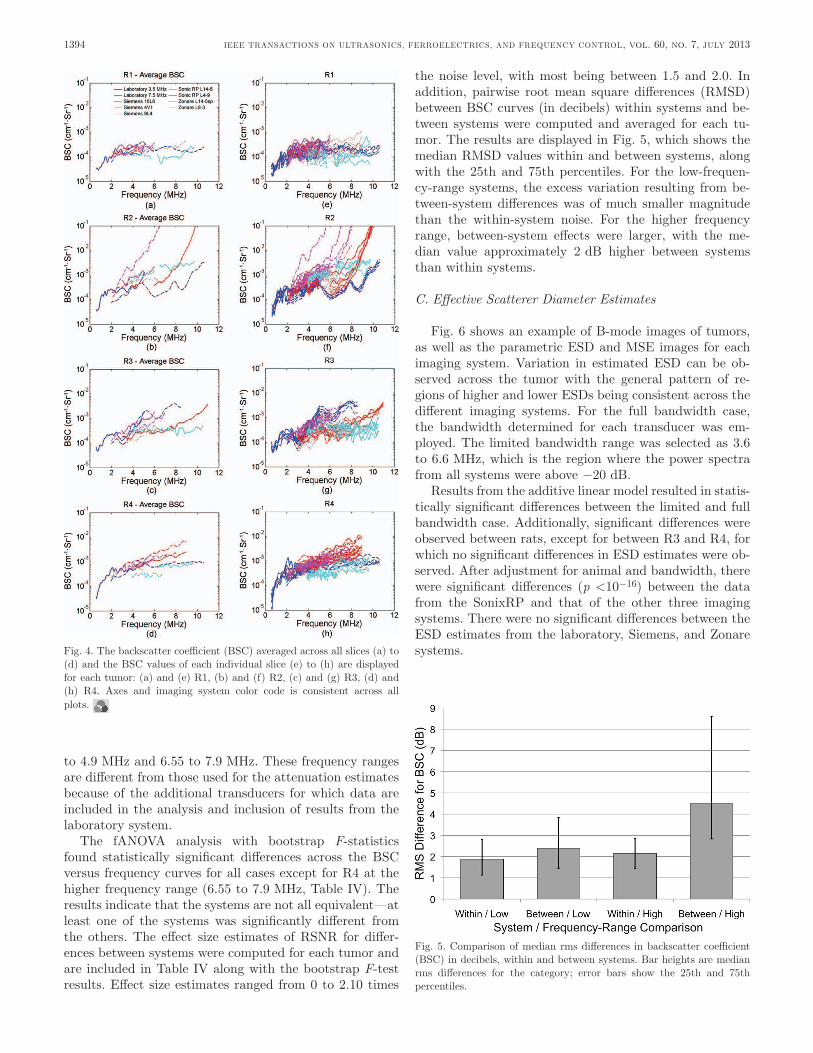
all transducers had considerable overlap in bandwidth with several other transducers, allowing for a direct visual comparison of the Bsc magnitude and trends when dis-played graphically. Figs. 4(a) to 4(d) show the Bsc as a function of frequency for each of the four fibroadenomas. Both the individual data slices [Figs. 4(e) to 4(h)] and the averaged data [Figs. 4(a) to 4(d)] for each transducer are plotted to demonstrate the amount of variability within a tumor compared with the variability between data from different transducers and imaging systems. a substantial amount of overlap is observed in results from many of the
transducers, with comparable variations between systems, transducers, and individual slices in many cases. Fig. 4(b) for r2 shows the greatest variability, with results from the siemens 18l6 and the Ultrasonix l14-5/38 exhibiting a very different trend in the magnitude and the frequency dependence compared with the results for other transduc-ers.
To perform the fanoVa and calculate the rsnr to compare across data from multiple transducers, relevant bandwidths needed to be selected for the analyses. as il-lustrated in Fig. 1, the two frequency ranges that allowed for all transducers to be included in at least one range while keeping the bandwidth as wide as possible were 3.9
Fig. 3. The attenuation as a function of frequency is plotted for each tumor: (a) r1, (b) r2, (c) r3, and (d) r4. axes and imaging system color code is consistent across all plots. The power law fits to the data are shown in black, and the equation is displayed in each plot.
TaBlE V. coefficients for the Power law Fit to the Fibroadenoma attenuation data in the Form of α = α0f n With associated 95% confidence Intervals (cI).
Tumor α0 (95% cI) n (95% cI)@ 7.5 MHz
(dB/cm·MHz)
r1 0.44 (0.38 to 0.50) 1.79 (1.72 to 1.85) 3.2r2 1.11 (0.94 to 1.24) 1.42 (1.36 to 1.49) 3.7r3 0.99 (0.86 to 1.12) 1.43 (1.37 to 1.50) 3.3r4 1.00 (0.86 to 1.12) 1.25 (1.21 to 1.29) 2.0
attenuation data from all five slices of data were averaged to provide one estimate per imaging system, which was then used to fit the power law to the data from all three imaging systems. Estimated attenuation slope at 7.5 MHz is provided for each tumor.
IEEE TransacTIons on UlTrasonIcs, FErroElEcTrIcs, and FrEqUEncy conTrol, vol. 60, no. 7, JUly 20131394
to 4.9 MHz and 6.55 to 7.9 MHz. These frequency ranges are different from those used for the attenuation estimates because of the additional transducers for which data are included in the analysis and inclusion of results from the laboratory system.
The fanoVa analysis with bootstrap F-statistics found statistically significant differences across the Bsc versus frequency curves for all cases except for r4 at the higher frequency range (6.55 to 7.9 MHz, Table IV). The results indicate that the systems are not all equivalent—at least one of the systems was significantly different from the others. The effect size estimates of rsnr for differ-ences between systems were computed for each tumor and are included in Table IV along with the bootstrap F-test results. Effect size estimates ranged from 0 to 2.10 times
the noise level, with most being between 1.5 and 2.0. In addition, pairwise root mean square differences (rMsd) between Bsc curves (in decibels) within systems and be-tween systems were computed and averaged for each tu-mor. The results are displayed in Fig. 5, which shows the median rMsd values within and between systems, along with the 25th and 75th percentiles. For the low-frequen-cy-range systems, the excess variation resulting from be-tween-system differences was of much smaller magnitude than the within-system noise. For the higher frequency range, between-system effects were larger, with the me-dian value approximately 2 dB higher between systems than within systems.
C. Effective Scatterer Diameter Estimates
Fig. 6 shows an example of B-mode images of tumors, as well as the parametric Esd and MsE images for each imaging system. Variation in estimated Esd can be ob-served across the tumor with the general pattern of re-gions of higher and lower Esds being consistent across the different imaging systems. For the full bandwidth case, the bandwidth determined for each transducer was em-ployed. The limited bandwidth range was selected as 3.6 to 6.6 MHz, which is the region where the power spectra from all systems were above −20 dB.
results from the additive linear model resulted in statis-tically significant differences between the limited and full bandwidth case. additionally, significant differences were observed between rats, except for between r3 and r4, for which no significant differences in Esd estimates were ob-served. after adjustment for animal and bandwidth, there were significant differences (p <10−16) between the data from the sonixrP and that of the other three imaging systems. There were no significant differences between the Esd estimates from the laboratory, siemens, and Zonare systems.Fig. 4. The backscatter coefficient (Bsc) averaged across all slices (a) to
(d) and the Bsc values of each individual slice (e) to (h) are displayed for each tumor: (a) and (e) r1, (b) and (f) r2, (c) and (g) r3, (d) and (h) r4. axes and imaging system color code is consistent across all plots.
Fig. 5. comparison of median rms differences in backscatter coefficient (Bsc) in decibels, within and between systems. Bar heights are median rms differences for the category; error bars show the 25th and 75th percentiles.

wirtzfeld et al.: cross-platform in vivo qUs imaging comparison 1395
IV. discussion
Fibroadenomas are known to be very heterogeneous tumors, both within an individual tumor and between dif-ferent tumors. Fig. 2 shows the variations across the four fibroadenoma samples, including one tumor (r2) that is highly heterogeneous within the sample slice shown. de-spite local variations, the attenuation, Bsc, and Esd esti-mates agreed well across all systems and transducers. The attenuation estimates agreed well across systems for the most part. larger attenuation variations were observed for r3 than for the other tumors, although r3 was not the most heterogeneous tumor. overall, the power law model consistently fit all the attenuation versus frequency data. although a linear fit would be a reasonable estimate for some tumors, for other tumors, particularly for r1, a power law was required, and therefore was consistently
employed. This allowed for the measured attenuation for the individual tumor to be used to perform attenuation compensation before Bsc estimation. The nonlinear fre-quency dependence of attenuation observed demonstrates the complex nature of the attenuation value that was con-sistently observed across systems.
The agreement among Bsc estimates measured by the estimated signal-to-noise ratio statistics rsnr indicates that, even with limitations on obtaining data from the exact same region with every system, the variation be-tween systems was at most twice the variation within sys-tems for the four tumors. With the variability between systems and transducers being only slightly higher than the variability between individual slices obtained with a single transducer, for the heterogeneous tumors imaged, the inter-system variability is not dominating the varia-tions in estimates observed. The ability to obtain con-
Fig. 6. B-mode images and parametric images enhanced by effective scatterer diameter (Esd) and mean square error (MsE) of r4 are shown as an example. First the B-mode image, followed by the Esd image and the MsE of the Gaussian form factor fit for each imaging system: (a) Ultrasonix, (b) Zonare, (c) siemens, and (d) laboratory system. The color map for the Esd values all range from 50 to 200 µm.
IEEE TransacTIons on UlTrasonIcs, FErroElEcTrIcs, and FrEqUEncy conTrol, vol. 60, no. 7, JUly 20131396
sistent Bsc estimates across systems, after appropriate attenuation compensation, is the cornerstone required to translate qUs techniques into clinical practice. The great-est variability in Bsc was observed with tumor r2, for which the siemens 18l6 and the sonixrP l14–5/38 had a very steep Bsc versus frequency slope at the upper end of their respective frequency ranges. although this trend does not fit with the trends from other transducers or even other slices of data obtained from the same transducers, it is interesting to note that the histology slides from this tumor [an example slide is shown in Fig. 2(b)] showed a greater heterogeneity than the other tumors with a central region that had more connective tissue than the surround-ing tissue. It is possible that variations in regions where the data were acquired could result in some data being acquired from a region with substantially different tissue properties.
despite the differences in processing techniques, includ-ing the different types of reference signals required be-tween the single-element and array systems, differences in window analysis sizes, system architecture, and trans-ducer characteristics, it was possible to maintain good agreement in Bsc versus frequency among systems. This suggests that the obtained Bsc is a fairly robust esti-mate and not particularly sensitive to the analysis pa-rameters when these are properly accounted for in the analysis methods. room for improvement may lie within the experimental procedures to control for variations from one scan to the other to allow for more consistent data to be acquired. Improvements in maintaining more con-sistent processing techniques may also prove valuable. In particular, the selection of the analysis bandwidth varied across the groups when the data were processed. In some cases, the power spectra from the reference phantom alone was used to select a bandwidth. However, particularly for cases of high attenuation in tumors, differences in spectra between the reference and sample could result in selecting an inappropriate bandwidth.
There is no literature base for determining the neces-sary level of agreement, nor the most appropriate metric to evaluate the agreement, across multiple Bsc estimates. Presented here is an extension of previous fanoVa meth-ods to allow for the functional form of Bsc data to be considered in evaluating the results and allowing a com-parison across Bsc estimates. It will be an important con-sideration as the field of qUs goes forward to determine how to compare results between different imaging plat-forms.
The Esd estimate has demonstrated potential for dis-tinguishing different types of tumors [27], [28], and is pre-sented here to demonstrate the consistency in estimates across systems. This is of particular significance because the Esd parameter could be used in clinical practice to aid diagnosis. The consistency in gradation of Esd esti-mates, including data for the one system that showed sig-nificant differences across the tumor, indicates that there was sensitivity to changes in properties that influence the Esd. It is interesting to note from Fig. 4 that the differ-
ent orientations of the transducer relative to the tumor did not change the pattern observed for the lowest Esd estimates near the center of the tumor, suggesting this is likely a true result from the tissue rather than an artifact of the orientation.
V. conclusion
In vivo qUs imaging of rat fibroadenomas increases the level of complexity and heterogeneity applied to qUs estimates when compared with images of tissue-mimicking phantoms. nevertheless, agreement was observed in the at-tenuation, Bsc, and Esd estimates between four imaging systems for four different rat fibroadenomas. Variations in image acquisition and data processing techniques are still able to yield comparable backscatter and attenuation coefficient versus frequency results, demonstrating that these measurements can be made in a system-independent manner, which demonstrates the potential for clinical ap-plications of qUs.
appendix Functional anoVa analysis
For notational convenience, let S denote the number of systems compared and let ns denote the number of scanning planes for system s (s = 1, 2, …, S). The to-tal number of scanning planes is N = n1 + … + nS. Furthermore, denote the Bsc versus frequency curve (in decibels) for the ith rF data slice from system s by ysi( f ) := 10 log10Bsc( f ). For a fixed frequency, f, the one-way anoVa F-statistic for intersystem variation is given by [29]
F fff( )
( )( ),=
MSBMSW (a.1)
where the mean square deviations between groups (sys-tems) is
MSB( ) ( ) ( ) ,f S n y f y fs ss
S
=−
−=∑1
11
2 (a.2)
the mean square deviations within groups (systems) is
MSW( ) ( ) ( ) ,f N S y f y fsi si
n
s
S s
=−
−==∑∑1 2
11
(a.3)
and where y fs( ) and y f( ) denote the system mean and overall mean across all rF data planes, for frequency f. Because of the need to test over an interval of frequencies, the frequency-specific statistics in (a.1)–(a.3) are inte-grated over frequencies to obtain the fanoVa statistics via the spatial mean sums-of-squares over the frequency range Ω [13], [21]. The resulting fanoVa statistic is
wirtzfeld et al.: cross-platform in vivo qUs imaging comparison 1397
Ffuncfunc
func
MSBMSW= , (a.4)
where
MSB MSB d MSBfunc = ≈∫ ∑∈
1 1ΩΩ Ω
( ) ( ),f f T fgfg
(a.5)
MSW MSW d MSWfunc = ≈∫ ∑∈
1 1ΩΩ Ω
( ) ( ),f f T fgfg
(a.6)
and (f1, …, fT) is the grid of frequencies over the range of interest. significance testing for system differences was accomplished via bootstrap resampling [23] of the func-tional F-statistic in (a.4) because the exact distribution is not available [13]. results were based on 2000 bootstrap samples.
To measure the magnitude of system differences com-pared with noise, it is observed here that the functional F-statistic provides the means to estimate the weighted average squared signal-to-noise ratio or effect size. In par-ticular, the model in (4) implies that the expected mean squares are given by
ENSe s( ) ,MSB WAVEfunc = +−
σ β2 2
1 (a.7)
and
E e( ) ,MSWfunc = σ2 (a.8)
where WaVExs = N n xs ss− ∑1 , the weighted average,
and
β βs s f f= ∫1 2
1 2
Ω Ω( ) .d
/
(a.9)
Eqs. (a.7)–(a.9) yield an expression for the theoretical root average signal-to-noise ratio (rsn):
RSN WAVEMSBMSW
func
func= =
−−
1 112
σ βe
sSN
EE
( )( ) .
(a.10)
To compute an estimate of (a.10) from the data, the corresponding quantity is given by the empirical root sig-nal-to-noise ratio estimate (rsnr):
RSNR WAVE func= =−
−1 1
12
ˆ ˆ ( ).σ βe
sSN F
(a.11)
Here, σe2 = MsWfunc and ˆ ( )βs f is the estimated system
component function of the Bsc compared with the overall average across systems (s = 1, …, S).
acknowledgments
The authors acknowledge contributions by I. M. ro-sado-Mendez, a. P. Battles, and J. P. Blue Jr. in data acquisition and animal handling. The authors also thank siemens Healthcare Ultrasound division for an equipment loan that made this study possible.
references
[1] F. l. lizzi, M. ostromogilsky, E. J. Feleppa, M. c. rorke, and M. M. yaremko, “relationship of ultrasonic spectral parameters to fea-tures of tissue microstructure,” IEEE Trans. Ultrason. Ferroelectr. Freq. Control, vol. 34, no. 3, pp. 319–329, 1987.
[2] E. J. Feleppa, F. l. lizzi, d. J. coleman, and M. M. yaremko, “di-agnostic spectrum analysis in ophthalmology: a physical perspec-tive,” Ultrasound Med. Biol., vol. 12, no. 8, pp. 623–631, 1986.
[3] K. c. Balaji, W. r. Fair, E. J. Feleppa, c. r. Porter, H. Tsai, T. liu, a. Kalisz, s. Urban, and J. Gillespie, “role of advanced 2 and 3-dimensional ultrasound for detecting prostate cancer,” J. Urol., vol. 168, no. 6, pp. 2422–2425, 2002.
[4] E. J. Feleppa, a. Kalisz, J. B. sokil-Melgar, F. l. lizzi, T. liu, a. l. rosado, M. c. shao, W. r. Fair, y. Wang, M. s. cookson, V. E. reuter, and W. d. W. Heston, “Typing of prostate tissue by ultra-sonic spectrum analysis,” IEEE Trans. Ultrason. Ferroelectr. Freq. Control, vol. 43, no. 4, pp. 609–619, 1996.
[5] M. F. Insana, J. G. Wood, T. J. Hall, G. G. cox, and l. a. Har-rison, “Effects of endothelin-1 on renal microvasculature measured using quantitative ultrasound,” Ultrasound Med. Biol., vol. 21, no. 9, pp. 1143–1151, 1995.
[6] T. J. Hall, M. F. Insana, l. a. Harrison, and G. G. cox, “Ultrasonic measurement of glomerular diameters in normal adult humans,” Ul-trasound Med. Biol., vol. 22, no. 8, pp. 987–997, 1996.
[7] B. Garra, M. Insana, T. shawker, r. F. Wagner, M. Bradford, and M. russell, “quantitative ultrasonic detection and classification of diffuse liver disease. comparison with human observer perfor-mance,” Invest. Radiol., vol. 24, no. 3, pp. 196–203, 1989.
[8] K. a. Wear, T. a. stiles, G. r. Frank, E. l. Madsen, F. cheng, E. J. Feleppa, c. s. Hall, B. s. Kim, P. lee, W. d. o’Brien Jr., M. l. oelze, B. I. raju, K. K. shung, T. a. Wilson, and J. r. yuan, “Interlaboratory comparison of ultrasonic backscatter coefficient measurements from 2 to 9 MHz,” J. Ultrasound Med., vol. 24, pp. 1235–1250, sep. 2005.
[9] J. J. anderson, M.-T. Herd, M. r. King, a. Haak, Z. T. Hafez, J. song, M. l. oelze, E. l. Madsen, J. a. Zagzebski, W. d. o’Brien Jr., and T. J. Hall, “Interlaboratory comparison of backscatter coef-ficient estimates for tissue-mimicking phantoms,” Ultrason. Imaging, vol. 32, no. 1, pp. 48–64, 2010.
[10] K. nam, I. M. rosado-Mendez, l. a. Wirtzfeld, a. d. Pawlicki, V. Kumar, E. l. Madsen, G. Ghoshal, r. J. lavarello, M. l. oelze, T. a. Bigelow, J. a. Zagzebski, W. d. o’Brien Jr., and T. J. Hall, “Ul-trasonic attenuation and backscatter coefficient estimates of rodent-tumor-mimicking structures: comparison of results among clinical scanners,” Ultrason. Imaging, vol. 33, no. 1, pp. 233–250, 2011.
[11] M. r. King, J. J. anderson, M.-T. Herd, d. Ma, a. Haak, l. a. Wirtzfeld, E. l. Madsen, J. a. Zagzebski, M. l. oelze, T. J. Hall, and W. d. o’Brien Jr., “Ultrasonic backscatter coefficients for weakly scattering, agar spheres in agar phantoms,” J. Acoust. Soc. Am., vol. 128, no. 2, pp. 903–908, 2010.
[12] l. a. Wirtzfeld, G. Ghoshal, Z. T. Hafez, K. nam, y. labyed, J. J. anderson, M.-T. Herd, a. Haak, Z. He, r. J. Miller, s. sarwate, d. G. simpson, J. a. Zagzebski, T. a. Bigelow, M. l. oelze, T. J. Hall, and W. d. o’Brien Jr., “cross-imaging platform comparison of ultrasonic backscatter coefficient measurements of live rat tumors,” J. Ultrasound Med., vol. 29, no. 7, pp. 1117–1123, 2010.
[13] q. shen and J. Faraway, “an F test for linear models with func-tional responses,” Statist. Sinica, vol. 14, no. 4, pp. 1239–1257, 2004.
[14] l. X. yao, J. a. Zagzebski, and E. l. Madsen, “Backscatter coef-ficient measurements using a reference phantom to extract depth-dependent instrumentation factors,” Ultrason. Imaging, vol. 12, no. 1, pp. 58–70, 1990.

IEEE TransacTIons on UlTrasonIcs, FErroElEcTrIcs, and FrEqUEncy conTrol, vol. 60, no. 7, JUly 20131398
[15] E. l. Madsen, M. a. Hobson, H. shi, T. Varghese, and G. r. Frank, “stability of heterogeneous elastography phantoms made from oil dispersions in aqueous gels,” Ultrasound Med. Biol., vol. 32, no. 2, pp. 261–270, 2006.
[16] K. a. Wear, T. a. stiles, G. r. Frank, E. l. Madsen, F. cheng, E. J. Feleppa, c. s. Hall, B. s. Kim, P. lee, W. d. o’Brien Jr., M. l. oelze, B. I. raju, K. K. shung, T. a. Wilson, and J. r. yuan, “In-terlaboratory comparison of ultrasonic backscatter coefficient mea-surements from 2 to 9 MHz,” J. Ultrasound Med., vol. 24, no. 9, pp. 1235–1250, 2005.
[17] s. s. Brunke, M. F. Insana, J. J. dahl, c. Hansen, M. ashfaq, and H. Ermert, “an ultrasound research interface for a clinical system,” IEEE Trans. Ultrason. Ferroelectr. Freq. Control, vol. 54, no. 1, pp. 198–210, 2007.
[18] r. lavarello, G. Ghoshal, and M. l. oelze, “on the estimation of backscatter coefficients using single-element focused transducers,” J. Acoust. Soc. Am., vol. 129, no. 5, pp. 2903–2911, 2011.
[19] J. J. anderson, M.-T. Herd, M. r. King, a. Haak, Z. T. Hafez, J. song, M. l. oelze, E. l. Madsen, J. a. Zagzebski, W. d. o’Brien Jr., and T. J. Hall, “Interlaboratory comparison of backscatter coef-ficient estimates for tissue-mimicking phantoms,” Ultrason. Imaging, vol. 32, no. 1, pp. 48–64, 2010.
[20] X. chen, K. q. schwarz, and K. J. Parker, “acoustic coupling from a focused transducer to a flat plate and back to the transducer,” J. Acoust. Soc. Am., vol. 95, no. 6, pp. 3049–3054, Jun. 1994.
[21] a. cuevas, M. Febrero, and r. Fraiman, “an anoVa test for func-tional data,” Comput. Stat. Data Anal., vol. 47, no. 1, pp. 111–122, 2004.
[22] J. o. ramsay and B. W. silverman, Functional Data Analysis. new york, ny: springer, 1997.
[23] B. Efron and r. J. Tibshirani, An Introduction to the Bootstrap. new york, ny: chapman and Hall; 1993.
[24] J. cohen, Statistical Power Analysis for the Behavioral Sciences, 2nd ed., Hillsdale, nJ: lawrence Erlbaum associates, 1988.
[25] a. Gerig, J. Zagzebski, and T. Varghese, “statistics of ultrasound scatterer size estimation with a reference phantom,” J. Acoust. Soc. Am., vol. 113, no. 6, pp. 3430–3437, Jun. 2003.
[26] M. l. oelze, J. F. Zachary, and W. d. o’Brien Jr., “characteriza-tion of tissue microstructure using ultrasonic backscatter: Theory and technique for optimization using a Gaussian form factor,” J. Acoust. Soc. Am., vol. 112, no. 3, pt. 1, pp. 1202–1211, 2002.
[27] M. l. oelze, W. d. o’Brien Jr., J. P. Blue, and J. F. Zachary, “dif-ferentiation and characterization of rat mammary fibroadenomas and 4T1 mouse carcinomas using quantitative ultrasound imaging,” IEEE Trans. Med. Imaging, vol. 23, no. 6, pp. 764–771, 2004.
[28] M. l. oelze and J. F. Zachary, “Examination of cancer in mouse models using high-frequency quantitative ultrasound,” Ultrasound Med. Biol., vol. 32, no. 11, pp. 1639–1648, 2006.
[29] J. neter, W. Wasserman and M. H. Kutner, Applied Linear Sta-tistical Models: Regression, Analysis of Variance, and Experimental Designs. Homewood, Il: r. d. Irwin, 1989.
Lauren Wirtzfeld was born in Toronto, ontar-io, in 1981. she earned her B.a.sc. degree in engi-neering science, biomedical engineering option, in 2003 from the University of Toronto, Toronto, canada, and her Ph.d. degree in biomedical engi-neering from the University of Western ontario in 2008. dr. Wirtzfeld was a postdoctoral fellow at the University of Illinois at Urbana-champaign from 2009 to 2011. currently, dr. Wirtzfeld is a postdoctoral fellow at ryerson University, Toron-to, canada, where she is conducting research in
medical ultrasound. Her research interests include quantitative ultra-sound, tissue characterization, and applications of ultrasound for moni-toring cancer treatment response.
Kibo Nam was born in seoul, south Korea, in 1977. she received the B.E. degree in electrical and electronic engineering in 2000 from Korea University, seoul, south Korea, and her M.s. and Ph. d degrees in electrical and computer engineer-ing from University of Wisconsin–Madison in 2003 and 2012, respectively. dr. nam was a postdoc-toral research associate at the University of Illi-nois at Urbana-champaign in 2012, conducting research in ultrasound. she is currently working at samsung Medison, Infrastructure Technology
lab. Her research interests include ultrasound tissue characterization and quantitative ultrasound imaging.
Goutam Ghoshal earned his B.E. degree in me-chanical engineering in 2000 from the University of Pune, Pune, India, and his M.s. and Ph.d. de-grees in engineering mechanics from the Universi-ty of nebraska–lincoln, lincoln, nE, in 2003 and 2008, respectively. dr. Ghoshal was a Postdoctor-al research associate at the University of Illinois at Urbana-champaign conducting research in medical ultrasound from 2009 to 2012. currently, dr. Ghoshal is a research Engineer at the acous-tic Medsystem Inc., savoy, Il. His research inter-
ests include biomedical imaging, quantitative ultrasound imaging, thera-peutic ultrasound, and computational methods. He is a member of the aIUM, asa, and sigma Xi.
Ellora Sen-Gupta was born in sydney, austra-lia, in 1987. she moved to auckland, Miami, and then ended up in chicago during high school. she graduated from the University of Illinois at Urba-na-champaign (UIUc) in 2009 with a bachelor’s degree in bioengineering. she then went on to work full time with the Bioacoustics research laboratory at UIUc while completing her materi-als science and engineering master’s degree in 2012. she is now working as a research specialist for the department of nursing at the University of
Illinois at chicago (UIc). Her research includes ultrasound imaging, quantitative ultrasound, and ultrasonic tissue characterization.
Zhi He received the B.s. and M.s degrees in mathematics from nanjing University, china; the M.a. degree in mathematics from Johns Hopkins University, Md; and the M.s. and Ph.d. degrees in statistics from the University of Illinois at Ur-bana-champaign, Il, in 2010. after 2010, he worked for alcatel-lucent Bell lab and Travelers Insurance as a statistician. now he is a quantita-tive analyst in the Google ads Metrics Team.
Nathaniel R. Hirtz received the B.s. and B.s.E. degrees from southeast Missouri state University, the M.s. degree from Murray state University, and another M.s. degree from the University of Illinois at Urbana-champaign. since 2008, he has been at Kaplan University, where he is adjunct Professor of the department of Mathematics. In addition, since 2012, he has been at Parkland col-lege, where he is a part-time faculty member in the department of Mathematics.
wirtzfeld et al.: cross-platform in vivo qUs imaging comparison 1399
Rita J. Miller received her d.V.M. degree at the University of Wisconsin–Madison in 1992. dr. Miller completed a small animal medical/surgical internship at the University of Illinois at Urbana-champaign in 1993. she then worked as a Veteri-nary Poison Information specialist at the nation-al animal Poison control center, also at the University of Illinois at Urbana-champaign. she started doing basic research in 1995, with a vet-erinary emphasis. she joined the Bioacoustics re-search laboratory in 1998, where she is a senior
research specialist in Bioengineering and her research has an ultrasound emphasis. Her current research involves the assessment of the biological effects of ultrasound on tissue, including the heart, capillary beds, and large arteries, and the interaction of contrast agents with ultrasound.
Sandhya Sarwate received the MBBs degree from the University of Jabalpur, Jabalpur, India, in 1970. Following internships at the Pt Jawahar-lal nehru Memorial Medical college Hospital in raipur, India, and overlook Hospital, summit, nJ, she worked in the department of Pathology of Mercy Hospital (later renamed Provena covenant Medical center, and very recently renamed Pres-ence covenant Medical center), Urbana, Il, from 1975 until her retirement at the end of 2007. she was a Member of the active Medical staff of this
hospital from 1980 to 2007, first in association with University Park Pathology associates of Urbana, Il (1980–1988) and then with christie clinic of champaign, Illinois (1989–2007). she served as Medical direc-tor of christie clinic laboratory from 2003 to 2007, and as Medical di-rector of the Provena Medcenter Medical laboratory during 2003. she also served as Medical director of the University of Illinois McKinley student Health center (UIUc) laboratory from 1997 to 2007. she was appointed to the clinical Faculty of the department of Pathology of the University of Illinois college of Medicine in Urbana-champaign in 1981, where she is currently a clinical associate Professor, and has taught medical students in the classroom and supervised their clinical clerk-ships. In 2008, she joined the Bioacoustics research laboratory of the University of Illinois at Urbana-champaign as a research pathologist. during 2009–2010, she completed a Fellowship in Pediatric Pathology at Washington University in st. louis Medical center and st. louis chil-dren’s Hospital. since september 2011, she has been a Member of the active Medical staff of the children’s national Medical center, Wash-ington, dc, where she works part-time as a staff Pathologist. dr. sar-wate is a diplomate of the american Board of Pathology in anatomic Pathology (1982) and clinical Pathology (1986) with recertification in both in 1997. she is a Fellow of the college of american Pathologists (caP) and the american society of clinical Pathologists (ascP), and a member of the U.s/canadian academy of Pathology (UscaP) and the society for Pediatric Pathology (sPP).
Douglas G. Simpson received the B.a. degree from carleton college and the M.s. and Ph.d. degrees from the University of north carolina at chapel Hill. From 1982 to 1985, he worked as a Mathematical statistician with the Biometry and risk assessment Program at the national Insti-tute of Environmental Health sciences. since 1985, he has been at the University of Illinois, where he is Professor and chair of the depart-ment of statistics and an affiliated Professor in the Beckman Institute for advanced science and
Technology. His research interests include applied and computational statistics, quantitative image analysis, multivariate longitudinal analysis, and the general theory of robust and semiparametric statistical methods. dr. simpson is a Fellow of the american statistical association and Fel-low of the Institute of Mathematical statistics. He has served as associ-ate Editor of the Journal of the American Statistical Association (1996–1999), Biometrics (2000–2006) and Chemometrics and Intelligent
Laboratory Systems (1999–2006), as a regular member of the Biostatisti-cal research and design (BMrd) study section of the national Insti-tutes of Health (2006–2010), and as chair-elect, chair, and Past-chair of the american statistical association caucus of academic representa-tives (2007–2010).
James A. Zagzebski was born in stevens Point, WI. He obtained his B.a. degree from st. Mary’s college, Winona, Mn, and his M.s. degree in physics and his Ph.d. in radiological sciences from the University of Wisconsin–Madison. dr. Zagze-bski currently is professor and chair of the depart-ment of Medical Physics at the University of Wis-consin, where he has affiliate appointments in biomedical engineering, radiology, and human on-cology. His research interests are directed toward ultrasound imaging and tissue characterization
and ultrasound equipment performance testing. He is a fellow of the american Institute of Ultrasound in Medicine and of the american as-sociation of Physicists in Medicine, and a member of the IEEE Ultrason-ics, Ferroelectrics, and Frequency control society.
Timothy A. Bigelow is an assistant Professor with a joint appointment in electrical/computer engineering and mechanical engineering at Iowa state University. His research interests focus on improving the diagnostic and therapeutic effec-tiveness of medical ultrasound. specifically, he fo-cuses on quantifying the physical properties of tissue for diagnostic purposes using backscattered ultrasound signals, applying ultrasound-induced cavitation to destroy unwanted cells, and explor-ing new ultrasound-induced biological effects for
both ultrasound safety and ultrasound therapy applications. dr. Bigelow graduated in May 2004 with a Ph.d. degree in electrical engineering from the University of Illinois at Urbana-champaign, where he worked under dr. William d. o’Brien, Jr. in the Bioacoustics research labora-tory. after completing his education, he was a Visiting assistant Profes-sor in the Electrical and computer Engineering department at the Uni-versity of Illinois at Urbana-champaign for a year. dr. Bigelow was then an assistant Professor in Electrical Engineering at the University of north dakota for three years prior to coming to Iowa state University in august 2008. In 2012, he was named a Harpole-Pentair assistant Profes-sor in Electrical and computer Engineering at Iowa state University.
Michael L. Oelze earned his B.s. degree in physics and mathematics in 1994 from Harding University, searcy, ar, his M.s. degree in physics in 1996 from the University of louisiana at lafay-ette, lafayette, la, and his Ph.d. degree in phys-ics in 2000 from the University of Mississippi, ox-ford, Ms. dr. oelze was a post-doctoral fellow at the University of Illinois at Urbana-champaign from 2000 to 2004, conducting research in ultra-sound. currently, dr. oelze is an associate profes-sor in the department of Electrical and computer
Engineering at the University of Illinois at Urbana-champaign. His re-search interests include the acoustic interaction with soil, ultrasound tissue characterization, quantitative ultrasound, ultrasound bioeffects, ultrasound tomography techniques, therapeutic ultrasound, and applica-tion of coded excitation to ultrasound imaging. dr. oelze is an associate editor for IEEE Transactions on Biomedical Engineering and serves as a member of the Editorial Board for Ultrasonic Imaging and on the advi-sory Editorial Board of Ultrasound in Medicine and Biology. dr. oelze is a member of the acoustical society of america (asa), a senior member of IEEE, and a fellow of the american Institute of Ultrasound in Medi-cine (aIUM).

IEEE TransacTIons on UlTrasonIcs, FErroElEcTrIcs, and FrEqUEncy conTrol, vol. 60, no. 7, JUly 20131400
Timothy J. Hall received his B.a. degree in physics from the University of Michigan–Flint in 1983. He received his M.s. and Ph.d. degrees in medical physics from the University of Wisconsin–Madison in 1985 and 1988, respectively. From 1988 to 2002, he was in the radiology department at the University of Kansas Medical center, where he worked on measurements of acoustic scattering in tissues, metrics of observer performance in ul-trasound imaging, and developed elasticity imag-ing methods and phantoms for elasticity imaging.
In 2003, he returned to the University of Wisconsin–Madison, where he is a Professor in the Medical Physics department. His research interests continue to center on developing new image formation strategies based on acoustic wave propagation and tissue viscoelasticity, the development of methods for system performance evaluation, and quantitative bio-marker development.
William D. O’Brien Jr. (s’64–M’70–sM’79–F’89–lF’08) received the B.s., M.s., and Ph.d. degrees from the University of Illinois at Urbana-champaign. From 1971 to 1975, he worked with the Bureau of radiological Health (currently the center for devices and radiological Health) of the U.s. Food and drug administration. In 1975, he joined the faculty at the University of Illinois. He is currently research Professor of Electrical and computer Engineering and director of the Bio-
acoustics research laboratory. His research interests involve the many areas of ultrasound–tissue interaction, including biological effects and quantitative ultrasound imaging, for which he has published 371 papers. dr. o’Brien is a life Fellow of the Institute of Electrical and Electronics Engineers, a Fellow of the acoustical society of america, and a Fellow of the american Institute of Ultrasound in Medicine, and is a Founding Fellow of the american Institute of Medical and Biological Engineering. He was recipient of the IEEE centennial Medal (1984), the aIUM Pres-idential recognition awards (1985 and 1992), the aIUM/WFUMB Pio-neer award (1988), the IEEE outstanding student Branch counselor award for region 4 (1989), the aIUM Joseph H. Holmes Basic science Pioneer award (1993), the IEEE Ultrasonics, Ferroelectrics, and Fre-quency control society distinguished lecturer (1997–1998), the IEEE Ultrasonics, Ferroelectrics, and Frequency control society’s achieve-ment award (1998), the IEEE Millennium Medal (2000), the IEEE Ul-trasonics, Ferroelectrics, and Frequency control society’s distinguished service award (2003), the aIUM William J. Fry Memorial lecture award (2007), and the IEEE Ultrasonics, Ferroelectrics, and Frequency control society’s rayleigh award (2008). He has served as President (1982–1983) of the IEEE sonics and Ultrasonics Group (currently the IEEE Ultrasonics, Ferroelectrics, and Frequency control society), Edi-tor-in-chief (1984–2001) of the IEEE Transactions on Ultrasonics, Fer-roelectrics, and Frequency Control, and President (1988–1991) of the american Institute of Ultrasound in Medicine.
Photographs and biographies for Yassin Labyed and Alexander Haak were unavailable at time of publication.