techniques for the control of steady state voltage in … · with regulated 11kv busbar 0 1,000...
TRANSCRIPT

© Electric Power Consulting Pty Ltd
1
Techniques for the Control of Steady State Voltage in MV and LV Networks
by
Dr Robert Barr, Electric Power Consulting Pty Ltd
Prof. Vic Gosbell, University of Wollongong
Mr Chis Halliday, Electrical Consulting & Training
Energy 21C Sydney, November 2007
© Electric Power Consulting Pty Ltd
2
Introduction• Many Australian LV sites have poor LV steady state voltage
performance– outside 230V-2% to 230V+10% range
• Adverse impacts on customer equipment– performance and life
• In most cases steady state voltage performance can be improved with the application of simple principles and procedures
• This paper is a “how to” guide for distributors
• Achieve alignment with the Australian Steady State Voltage Standard that is currently under development

© Electric Power Consulting Pty Ltd
3
The Ideal LV Supply 230V +10% - 2%

© Electric Power Consulting Pty Ltd
4
Well Controlled LV Supply
Voltage Variation with Time
210215220225230235240245250255260
Tues
day
Wed
nesd
ay
Thur
sday
Frid
ay
Sat
urda
y
Sun
day
Mon
day
RM
S Vo
lts Regulated230V+10%230V-2%

© Electric Power Consulting Pty Ltd
5
Well Controlled LV SupplyLV Customer Supply
with Regulated 11kV Busbar
0
1,000
2,000
3,000
4,000
5,000
6,000
220
222
224
226
228
230
232
234
236
238
240
242
244
246
248
250
252
254
256
258
260
Voltage - 1 volt bins
Freq
uenc
y of
Occ
urre
nce
30 second readings
253.
0V225.
4V
Nom
inal
230
V

© Electric Power Consulting Pty Ltd
6
11kV Feeder System
Zone Substation Regulated 11kV Busbar

© Electric Power Consulting Pty Ltd
7
Typical Network Arrangement
66kV
11kV
66kV
230/400V
On Load Tap Changing Transformer66kV (+7x1.5% - 14x1.5%)/11kV
Off Load Tap Change Transformer
tap "1" 11kV+5% / 433Vtap "2" 11kV+2.5% / 433Vtap "3" 11kV / 433Vtap "4" 11kV-2.5% / 433Vtap "5" 11kV-5% / 433V

© Electric Power Consulting Pty Ltd
8
OLTC BehaviourVoltage
11kV +1.5%
11kV
11kV -1.5%
Time
Float voltage
Upper limit
Lower limit
Delay (~30 seconds)
Tap change
© Electric Power Consulting Pty Ltd
9
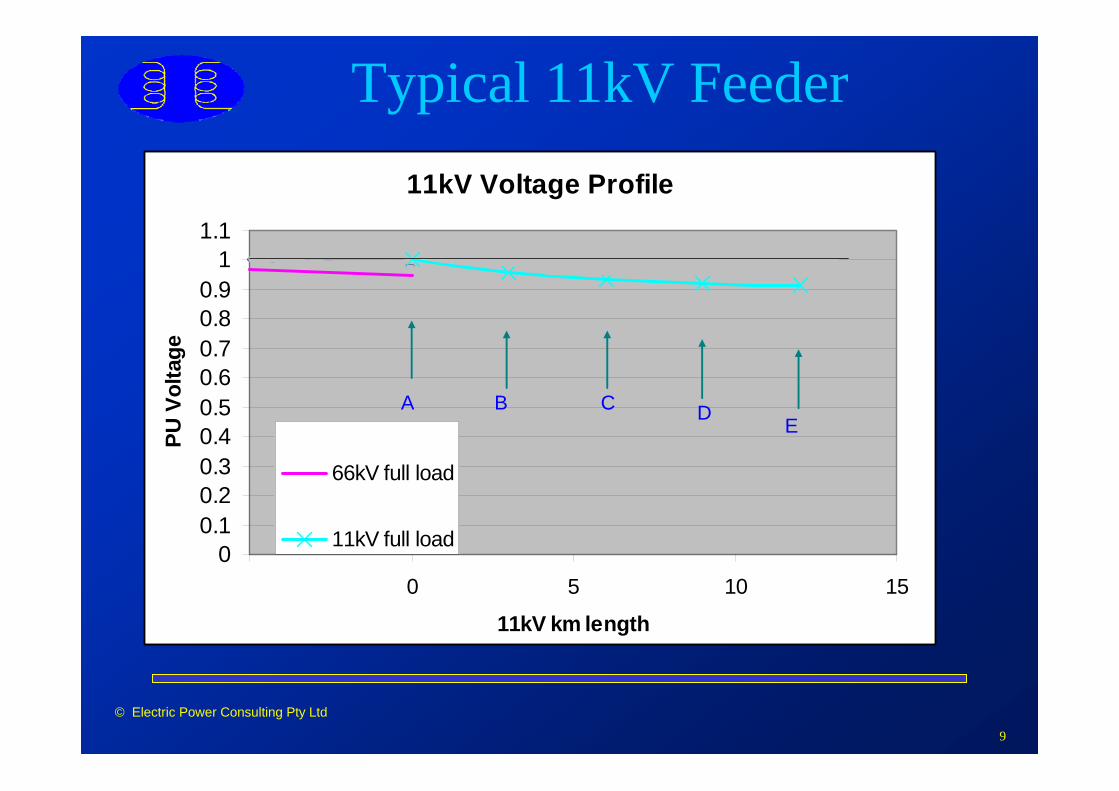
Typical 11kV Feeder11kV Voltage Profile
00.10.20.30.40.50.60.70.80.9
11.1
-5 0 5 10 15
11kV km length
PU V
olta
ge
66kV no load66kV full load11kV no load11kV full load
A B C D E

© Electric Power Consulting Pty Ltd
10
Typical 11kV Feeder11kV Voltage Profile
00.10.20.30.40.50.60.70.80.9
11.1
-5 0 5 10 15
11kV km length
PU V
olta
ge
66kV no load66kV full load11kV no load11kV full load
A B C D E

© Electric Power Consulting Pty Ltd
11
Typical 11kV Feeder11kV Voltage Profile
0.7
0.8
0.9
1
1.1
-5 0 5 10 15
11kV km length
PU V
olta
ge
66kV no load66kV full load11kV no load11kV full load
A B C DE
Point of 11kV Regulation

© Electric Power Consulting Pty Ltd
12
Light Load Conditions
259.5252.8246.5240.5234.812E
260.0253.3247.0241.0235.29D
261.3254.6248.2242.1236.46C
263.3256.5250.1244.0238.23B
267.1260.2253.7247.6241.70A
tap 5tap 4tap 3tap 2tap 1
Light Load Voltage with 11kV±1.5% at regulated 11kV busbar
km from ZS
Location

© Electric Power Consulting Pty Ltd
13
Full Load Conditions
237.0231.0225.2219.7214.512E
238.5232.4226.6221.1215.89D
242.2236.0230.1224.5219.16C
248.1241.8235.7230.0224.53B
259.2252.6246.2240.2234.50A
tap 5tap 4tap 3tap 2tap 1
Full Load Voltagekm from ZS
Location

© Electric Power Consulting Pty Ltd
14
Line Drop Compensation11kV Voltage Profile - with LDC
0.7
0.8
0.9
1
1.1
-5 0 5 10 15
11kV km length
PU V
olta
ge
66kV no load66kV full load11kV no load11kV full load
A B C D E
Point of 11kV LDC Control
Point of 11kV Regulation

© Electric Power Consulting Pty Ltd
15
LDC – Tap Selection11kV Voltage Profile - with LDC
0.7
0.8
0.9
1
1.1
-5 0 5 10 15
11kV km length
PU V
olta
ge
A B C D E
Tap selection governed by
light load curve
Tap selectiongoverned by
full load curve

© Electric Power Consulting Pty Ltd
16
Tap Selection with LDC
248.5242.2236.1230.4224.912E full load255.7249.1242.9236.9231.312E light load
259.8253.1246.8240.8235.13B full load257.4250.8244.5238.6232.93B light load
271.0264.1257.5251.2245.20A full load263.2256.4250.0243.9238.10A light loadtap 5tap 4tap 3tap 2tap 1
Voltage - 11kV with LDCkm from ZS
Location

© Electric Power Consulting Pty Ltd
17
Voltage Signature 1Tap setting - too much boost
Source impedance - low
0
1,000
2,000
3,000
4,000
5,000
6,00022
022
2
224
226
228
230
232
234
236
238
240
242
244
246
248
250
252
254
256
258
260
Voltage - 1 volt bins
Freq
uenc
y of
Occ
urre
nce
30 second readings
253.
0V
225.
4V
Nom
inal
230
V

© Electric Power Consulting Pty Ltd
18
Voltage Signature 2Tap setting - too little boost
Source impedance - low
0
1,000
2,000
3,000
4,000
5,000
6,000
220
222
224
226
228
230
232
234
236
238
240
242
244
246
248
250
252
254
256
258
260
Voltage - 1 volt bins
Freq
uenc
y of
Occ
urre
nce
30 second readings
253.
0V225.
4V

© Electric Power Consulting Pty Ltd
19
Voltage Signature 3Tap setting - too little boostSource impedance - high
0
200
400
600
800
1,000
1,200
1,400
1,600
220
222
224
226
228
230
232
234
236
238
240
242
244
246
248
250
252
254
256
258
260
Voltage - 1 volt bins
Freq
uenc
y of
Occ
urre
nce
30 second readings
253.
0V225.
4V

© Electric Power Consulting Pty Ltd
20
11kV Tapping Zones
Tap 2 zone
Tap 3 zone
Tap 4 zone

© Electric Power Consulting Pty Ltd
21
Best Practice Procedures• Electricity distributors need clear voltage control objectives and processes
• OLTC transformer float, bandwidth, time delay method, time delay and LDC settings need to be carefully selected, documented and implemented
• Consider time delay methods - fixed, inverse or integrated:
– tap changer operations and maintenance– restores voltage levels quicker in response to large load changes e.g. due to a feeder
trip– consider fast tap changer response – capacitor switching– grading with upstream OLTC transformer operation (hunting)
• Light load and full load MV distribution profiles (11kV & 22kV) need to be modelled on a regular basis – say every 2 years
– particularly where LDC is used – volts can creep up with load growth

© Electric Power Consulting Pty Ltd
22
Best Practice Procedures• Based on VRR settings & voltage profile
– allocate a tap setting for every distribution transformer via tapping zone plans
• Field staff – implement distribution tap setting at every maintenance or other
opportunity– understand practices– information and training sessions needed
• VRR and tap settings– No unauthorised adjustment– Voltage regulating relays need to be carefully set and tested on a regular
basis
• Monitoring of network voltages– essential to ensure proper control is being achieved

© Electric Power Consulting Pty Ltd
23
Operational Issues• Alternate switching configurations
– can adequate voltage levels be maintained?– isolate supply if voltage cannot be maintained between predetermined limits – be careful of LDC impacts with load transfers
• OLTC transformer operation– be prepared for possible VRR maloperation– if necessary limit OLTC range to prevent extreme under or over voltage conditions
• Distribution transformers issues– inconsistent taping ratios– incompatible tapping ranges– different tap names– be prepared to scrap incompatible transformers
• Embedded generation and switched field capacitor banks– Requires special consideration on the voltage profiles and voltage control strategies
• Routine monitoring of strong and weak sites

© Electric Power Consulting Pty Ltd
24
Conclusions
• There are considerable customer benefits to be gained by improving voltage control in many distribution networks
– extended equipment life– better equipment performance– Compliance with standards
• Achieving voltage control:– is not technically difficult - no rocket science required– clear objectives– requires discipline and good engineering systems– requires both office staff and field staff cooperation and coordination – optimises use of network assets– can defer the need for capital expenditure– is an essential part of good network planning– can be achieved at low cost