techniques of flow-charting - ideals
TRANSCRIPT
TECHNIQUES OF FLOW-CHARTING
Louis A. Schultheiss
INTRODUCTION, by Edward Heiliger
Automation of libraries must come about through close coopera-tion between librarians and "machine people." Each must understand
something of the other's specialty. For a starter, a good commonlanguage is provided by flow charts, which are simple work- flowcharts written in yes -no terms. They can be quickly understood bythe "machine people," and the technique of making them can be
learned by a librarian in a very short time.
Because each member of the library staff knows his own workbetter than does anyone else, he is, therefore, better qualified to do
the flow charting of his work. In flow charting the library's work,all of the staff take part and contribute to the process of preparingfor automation. Staff members lose some of their fears in the proc-ess and take pride in their contribution to the joint effort. This grass-roots approach develops interest in the whole problem and makes the
next step easier. The staff member benefits by learning to think of
his work in terms of logical alternatives. He discovers that the old
routines were illogical in many ways and that many changes are
needed, automation or no. Reasons for work conflict are uncoveredand outmoded routines left over from previous changes are discovered.
One by-product has been a new kind of staff manual, consistingof flow charts. An uninitiated staff member seems to be able to under-
stand the workings of a new department much more quickly by readingflow charts than by reading text. It is also easier to see each depart-ment's relation to the whole library by studying the whole library's
charting.
Louis A. Schultheiss is Technical Services Librarian, University of
Illinois Library, Chicago Undergraduate Division, and Edward Heil-
iger, formerly Librarian, University of Illinois Library, Chicago
Undergraduate Division, is Director of The Florida Atlantic Univer-
sity Library, Boca Raton, Florida.
62

63
It is evident that data processing will be most effective when all
of the library's work is tied into one system and when that system is
planned before the implementation of any part of the work is begun.Flow charting is an essential part of planning the system and is the
first step that must be taken. The paper by Mr. Schultheiss includes
a description of the flow charting method and this can be a guide for
those interested in using this approach. A complete set of the charts
developed in the University of Illinois study can be found in the book
published on the project. 1 E. H.
"Flow-charting* is a very broad term used to describe a num-ber of charting and diagramming operations, many of them not pecu-liar to data processing. Decision flow charting and work flow
charting and diagramming have been used in other fields for manyyears, although the concept seems to be a relatively new one amonglibrarians.
Since this conference is made up primarily of librarians, I
will concentrate on decision flow charting, with a few examples of
other types, and will show samples of both early and recent work at
the University of Illinois Undergraduate Division Library at NavyPier, Chicago, during the past three years.
All librarians know about procedure manuals, instruction sheets,and other means of maintaining uniformity of procedures and of in-
structing new personnel. The primary difficulty with these (other
than the fact that they always seem to be out of date) is that they give
only broad steps, on an action basis, and cannot show HOW to makethe value judgments and decisions that must be made if the procedureis to be carried out intelligently.
Flow charts, on the other hand, combine both physical actions
and decision making in one logical flow. The type of operation (action,
decision requirement, hold, etc.) is indicated by the shape of the box
surrounding the written inscription. The choice of box shapes and
sizes may become very elaborate and representational, and may be
transcribed in a variety of formats; the Head of our Data ProcessingDepartment has often jokingly remarked that by using flow charts and
magnetic tape reels we have rediscovered the pictogram and the
scroll and are calling this progress.For work at Navy Pier, however, choices were limited to a
small number of the shapes provided by the IBM DiagrammingTemplate:
1. Circles are used to indicate the start or the end of a com-
plete process.
64
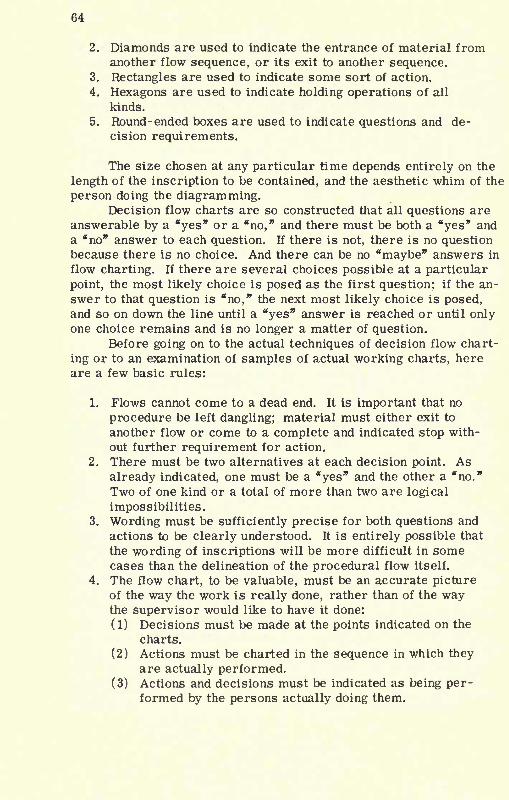
2. Diamonds are used to indicate the entrance of material fromanother flow sequence, or its exit to another sequence.
3. Rectangles are used to indicate some sort of action.
4. Hexagons are used to indicate holding operations of all
kinds.
5. Round-ended boxes are used to indicate questions and de-
cision requirements.
The size chosen at any particular time depends entirely on the
length of the inscription to be contained, and the aesthetic whim of the
person doing the diagramming.Decision flow charts are so constructed that all questions are
answerable by a 'yes* or a "no," and there must be both a "yes* and
a "no" answer to each question. If there is not, there is no questionbecause there is no choice. And there can be no "maybe* answers in
flow charting. If there are several choices possible at a particular
point, the most likely choice is posed as the first question; if the an-
swer to that question is "no," the next most likely choice is posed,and so on down the line until a "yes" answer is reached or until onlyone choice remains and is no longer a matter of question.
Before going on to the actual techniques of decision flow chart-
ing or to an examination of samples of actual working charts, here
are a few basic rules:
1. Flows cannot come to a dead end. It is important that no
procedure be left dangling; material must either exit to
another flow or come to a complete and indicated stop with-
out further requirement for action.
2. There must be two alternatives at each decision point. As
already indicated, one must be a "yes" and the other a "no."
Two of one kind or a total of more than two are logical
impossibilities.3. Wording must be sufficiently precise for both questions and
actions to be clearly understood. It is entirely possible that
the wording of inscriptions will be more difficult in somecases than the delineation of the procedural flow itself.
4. The flow chart, to be valuable, must be an accurate pictureof the way the work is really done, rather than of the waythe supervisor would like to have it done:
( 1) Decisions must be made at the points indicated on the
charts.
(2) Actions must be charted in the sequence in which theyare actually performed.
(3) Actions and decisions must be indicated as being per-formed by the persons actually doing them.

65
There are many ways of constructing preliminary flow charts.
Perhaps one of the easiest is to indicate each action, decision, or
other operation on a separate slip of paper and then to arrange the
slips on a corkboard or to tape them onto a large surface. This will
eliminate a great deal of tearing up and starting over, as few peopleare able to visualize a flow chart in the beginning or to estimate
properly the amount of space it will take. The staff at Navy Pier
began with small slips of paper, grease pencils, cellophane tape, and
a poster typewriter; the slips were taped to large sheets of jute
board, and grease pencil lines were eventually drawn onto the boards
to connect the various steps (see Example 1). For purposes of
crowding as much as possible onto one 8-l/2"x 11" sheet, the slips
used in this example are much smaller than those we actually used.
"P" slips are about right, with boards of about 30" x 36" inches.
After steps in a given process have been written on slips, boxed,and arranged on the backing board, flows are traced through to be
sure that they are mechanically correct; i.e., have no dead ends, have
the proper number and variety of choices, etc. When this has been
accomplished, it is usually well to review the work thus far with
another staff member who has some knowledge of the procedure under
examination. This may not lead to continuing friendships, but it does
increase the chances of accuracy. Then, after errors have been cor-
rected and missing steps inserted, the entire chart is ready for
transfer to some more permanent and manageable form. Do not be
too upset if the first few charts cannot be corrected at all, or if
another member of the staff walks up and immediately sees the an-
swer to the problem that has been stumping you for the past half-
hour; this is something of a new technique to most librarians, and it
also requires the ability to stand off and see a familiar routine as if
it were being observed for the first time.
There are at least two common ways of transcribing flow charts
to paper: from top to bottom, and from left to right. In the beginning,the staff at Navy Pier were taught to chart from top to bottom. This
technique is the one used by IBM and works very well on short flows.
The other method of transcribing, from left to right, is used by the
Burroughs Company and is the method now used for new work within
the Technical Services Division at Navy Pier, though we continue to
use the IBM template. The primary reason for the change was simplyone of convenience; these charts are used a great deal for trainingand instructional purposes, and it is easier to connect distant portionsof the same routine by lines rather than by exit symbols. Such
entrance and exit symbols seem to be difficult for the clerical mindto understand, and they always seem to feel that something else is
going on between the point of exit and the point of re-appearance. So
we attach additional sheets to the right side of the first page and

66
accordion-fold the whole thing when we are finished; by doing this, wecan keep both the flow chart and the accompanying procedures write-
up in the same notebook and both can be consulted without having to
turn the notebook at a 90 angle. Examples 2 and 3 are illustrations
of transcription. Example 2 is an elaboration of Example 1, readingfrom top- to-bottom; and Example 3 is the same as Example 2, but is
transcribed from left to right.
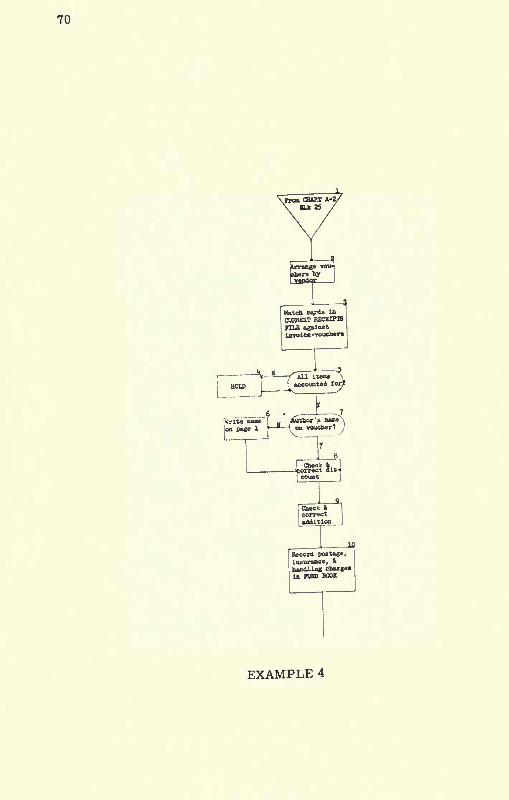
Examples 4, 5, and 6 indicate three generations in the flow
charting of the same procedure. The first operation was done for the
Information Systems Section of General Electric in the spring of 1960,
and was laid out in very broad steps (Example 4). Example 5 is a
portion of the same procedure, as revised in July of 1961. Examples6-A and 6-B are a revision of the same procedure as it is carried
out at the present time.
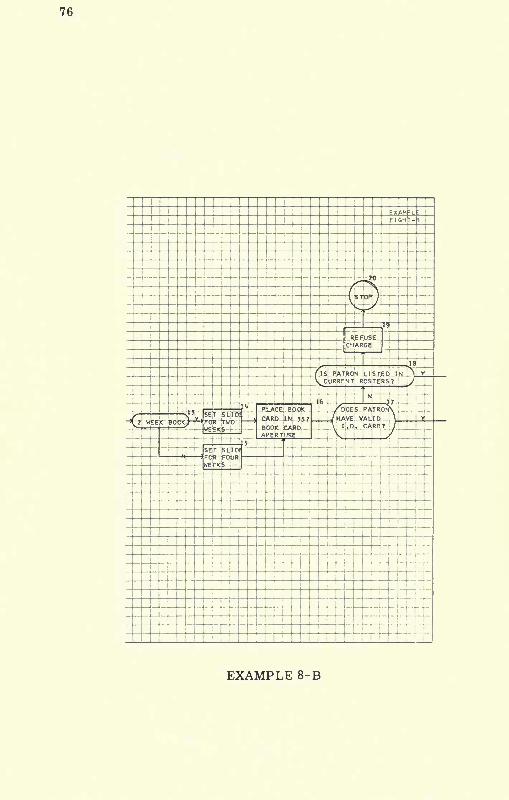
Example 7 is a bit different. In this case we have a diagram of
proposed system flow for a circulation system. If the system outlined
in Example 7 is put into operation, the "people flow" or decision flow,
will go something like what is shown in Examples 8-A and 8-B.
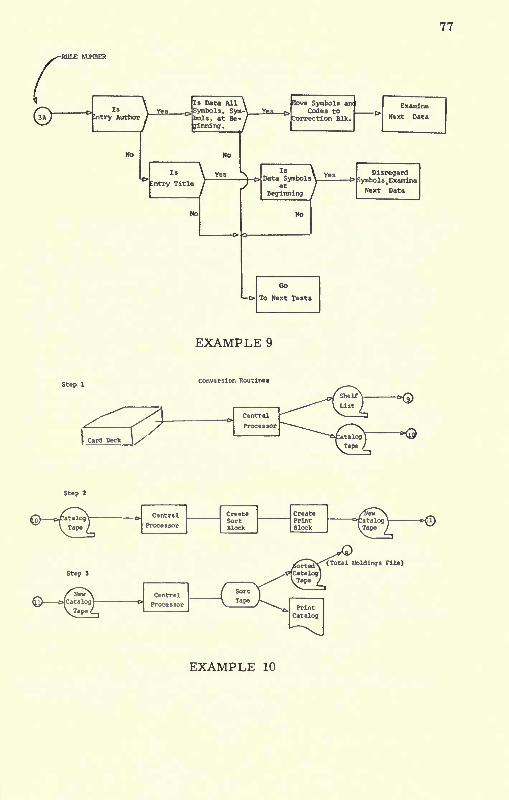
Example 9 is an illustration of the Burroughs Company's flow
charting, and shows some differences in symbols and technique.
Example 10 is somewhat more pictorial than the ones we have
seen so far, and is a very sweeping description of the conversion of
catalog data contained on punched cards to magnetic tape and to a
book catalog.The final example, Example 11, is of a completely different sort.
This one is an example of a block diagram, and contains one block
for each computer operation. After completion, diagrams of this
type are coded into the language of the computer, punched into cards,and are put into the computer itself.
REFERENCES
1. Schultheiss, Louis A., et. al. Advanced Data Processing in
the University Library. New York, Scarecrow Press, 1962.

67
EXAMPLE ONE
ORDER RE-QUEST CCMESTO SERIALSDESK
/'SUBSCRIPTION BASIS? ~1
EXAMPLE 1

68

69
EXAMPLE 3
70
Record postage,Insurance, fc
ft^iing chargesla MB WOK
EXAMPLE 4

71
Pg 2 of S
EXAMPLE 5

72

73
EXAMPLE 6-B

74

75
IS BOOK ,CARO_(N,Mt:BOOK POCKET?
EXAMPLE 8-A
76
EXAMPLE 8-B
77
\ Ye kEntry Title
j "7
EXAMPLE 9
Step 1Conversion Routine*
Step 2
EXAMPLE 10

78
File Creation
No