techno-economic evolution of an existing operational ngl
TRANSCRIPT
HAL Id: hal-02564676https://hal.archives-ouvertes.fr/hal-02564676
Submitted on 5 May 2020
HAL is a multi-disciplinary open accessarchive for the deposit and dissemination of sci-entific research documents, whether they are pub-lished or not. The documents may come fromteaching and research institutions in France orabroad, or from public or private research centers.
L’archive ouverte pluridisciplinaire HAL, estdestinée au dépôt et à la diffusion de documentsscientifiques de niveau recherche, publiés ou non,émanant des établissements d’enseignement et derecherche français ou étrangers, des laboratoirespublics ou privés.
Techno-economic evolution of an existing operationalNGL plant with adding LNG production part
Omid Sabbagh, Mohammad Ali Fanaei, Alireza Arjomand
To cite this version:Omid Sabbagh, Mohammad Ali Fanaei, Alireza Arjomand. Techno-economic evolution of an existingoperational NGL plant with adding LNG production part. Oil & Gas Science and Technology - Revued’IFP Energies nouvelles, Institut Français du Pétrole, 2020, 75, pp.27. �10.2516/ogst/2020018�. �hal-02564676�

Techno-economic evolution of an existing operational NGLplant with adding LNG production partOmid Sabbagh1, Mohammad Ali Fanaei1,*, and Alireza Arjomand2
1Department of Chemical Engineering, Ferdowsi University of Mashhad, 9177948974 Mashhad, Iran2 Faculty of Chemical and Materials Engineering, Shahrood University of Technology, 3619995161 Shahrood, Iran
Received: 1 February 2020 / Accepted: 12 March 2020
Abstract. Natural gas is the fastest-growing fossil fuel and LNG is playing a growing role in the world’s gassupply. The liquefaction process is also by far the most energy-consuming part of the LNG chain. It is thus apriority today for the gas industry to decrease the cost and improve the efficiency of the liquefaction process of aplant. In this way, a novel techno-economic evolution of an existing NGL plant with adding an appropriateLNG production part is presented. Concerning the availability of propane, use of existing equipments andconditions of no structural changes in the existing installation, C3MR is used as the refrigeration system.For full recognition of the process, a high-accuracy surrogate model based on D-optimal approach is developed.MR composition (nitrogen, methane, ethane, and propane), inlet gas pressure of the LNG production part,demethanizer pressure, and high and low pressure of MR as the eight manipulated variables of the surrogatemodel predict the earned profit of the integrated plant. To increase profit, a hybrid GA-SQP optimizationmethod is used. The results show that the earned profit of the optimized proposed plant with the LNG produc-tion capacity of 3.33 MTPA is 60.2% more than the existing NGL plant. In addition to increased earned profit,the thermodynamic efficiency is improved in the liquefaction section, too. Furthermore, the SPC value of0.347 kWh kg�1 LNG shows that the optimized plant has acceptable liquefaction efficiency. According tothe optimization results, mixture variables are more effective than process variables on the earned profit.It is noticeable that increasing the ethane recovery not always increases profit in such integrated units.
Nomenclature
AR Annualized Revenue, $ year�1
BM Bare-Module Cost, $Cbuildings Building costs, $Cequipment Equipment cost, $Cinstall Installed cost, $Csite Site preparation cost, $CWC Working capital cost, $EP Earned Profit, $ year�1
IAR Increased Annualized Revenue, $ year�1
IEC Increased Electricity Cost, $ year�1
ISC Increased Steam Cost, $ year�1
MTA Minimum Temperature Approach, �CSPC Specific Power Energy Consumption,
kWh kg�1 LNGTIAC Total Increased Annualized Cost, $ year�1
TIBM Total Increased Bare-Module Investment, $TICI Total Increased Capital Investment, $ year�1
TIOC Total Increased Operating Cost, $ year�1
xi Manipulated variables
Abbreviations
ANOVA Analysis Of VarianceAPEA Aspen Process Economic Analyzer�
AP-SMR Air Products’ Single Mixed RefrigerantARS Absorption Refrigeration SystemC3MR Propane Precooled Mixed RefrigerantCNG Compressed Natural GasDMR Double Mixed RefrigerantDOF Degree of FreedomEDR Exchanger Design and RatingGA Genetic AlgorithmKBO Knowledge-Based OptimizationKSMR Korea Single Mixed Refrigerant* Corresponding author: [email protected]
This is an Open Access article distributed under the terms of the Creative Commons Attribution License (https://creativecommons.org/licenses/by/4.0),which permits unrestricted use, distribution, and reproduction in any medium, provided the original work is properly cited.
Oil & Gas Science and Technology – Rev. IFP Energies nouvelles 75, 27 (2020) Available online at:�O. Sabbagh et al., published by IFP Energies nouvelles, 2020 ogst.ifpenergiesnouvelles.fr
https://doi.org/10.2516/ogst/2020018
REGULAR ARTICLEREGULAR ARTICLE

LNG Liquefied Natural GasMFC Mixed Fluid CascadeMR Mixed RefrigerantMTPA Million Tons Per AnnumNG Natural GasNGL Natural Gas LiquidsNRU Nitrogen Rejection UnitOCLP ConocoPhillips Optimized Cascade LNG
ProcessSMR Single Mixed RefrigerantSQP Sequential Quadratic Programming
1 Introduction
Natural gas plays a growing role in the energy mix by dis-placing coal due to its relative economic and/or environ-mental advantages in some markets. Today, its share inthe energy mix is 23%, compared to 21% in 2010 [1]. NGis used as a combustible for every consuming sector (powergeneration, industry, and buildings) excepted transport.It is also increasingly utilized as a feedstock for industry,especially petrochemicals, thanks to the growing develop-ments of high-liquids fields in the US and Middle East.After extracting natural gas, it must be transported to dif-ferent places for each of its various applications. There arethree main technological options for this work: transmissionthrough pipeline, LNG, and CNG. Each of these methodshas its applications, but this investigation focused on theLNG. Liquefaction of natural gas is the most dynamic sec-tor of the gas industry. It is playing a fast growing role inthe gas supply, driving the expansion and globalization ofgas markets. LNG should in particular overtake pipelinegas to become the most important way of trading gas overlong distance by the late 2020s. Long distance LNG trade isforecast to grow 5%/year in the next decade, compared toonly 1%/year for pipeline gas. Nowadays, more than 30%of the worldwide gas trading is done via LNG [2].
The cost of pipeline transportation varies roughlylinearly with the distance, while the LNG technology islittle dependent. LNG is more economical to transport tolong-distance than an onshore high-pressure pipeline, over3500 km, when a new greenfield LNG project (rather thana brownfield project) is considered [3]. There are differenttechnologies for liquefying natural gas, in onshore facilities,that can be classified into three general categories. Mixedrefrigerant based methods such as SMR, KSMR, AP-SMR,C3MR, and DMR place in the first category. These pro-cesses have higher thermal efficiency, because of avoidingthe difference of temperatures between the enthalpic pro-files of MR and NG, and less equipment will be required.But reliability and operations of the processes are moresensitive against the pure refrigerant systems and needmore accurate design [4, 5]. Using MRs in small plants withrespect to increasing the capital cost are less desirable [6].In the second category, methods such as OCLP and MFCutilize a cascade of pure or mixed refrigerants for NG
liquefaction. The pure refrigerant cascade processes likeOCLP, usually use methane, ethylene, and propane asrefrigerants. These processes in one hand have a simpleoperation with high reliability and loss of one train doesnot cause the plant shutdown. On the other hand, the cas-cade processes require relatively high capital and mainte-nance costs due to the amount of equipment needed forthe refrigerant cycle. Therefore, the pure refrigerant cascadeprocesses are suitable for large-capacity trains. The MR cas-cade processes like MFC can obtain a closer matching ofMR warming and NG cooling curves inside heat exchan-gers, so display better thermal efficiency in compared tothe pure refrigerant cascade processes, but these technolo-gies are very sensitive to changing NG composition[5, 7–9]. Finally, the third category included hybrid pro-cesses such as Liquefin and AP-X, combine two or moreNG liquefaction technologies with the aim of higher operat-ing efficiency and lower operating cost. The main problemin using these methods is the lack of operational experience.
Due to the extensive nature of NG liquefaction pro-cesses, whether in terms of energy or equipment cost, afew improvements can be highly valuable. Accordingly, inrecent years many efforts have been made to optimize theprocesses. Shirazi and Mowla [10], Khan et al. [7], Khanand Lee [11], Moein et al. [12], and Lee and Moon [13] simu-lated an SMR cryogenic cycle for producing LNG. Theysuccessfully improved efficiency of the process by decreasingthe compression energy requirement. In this way, differentoptimization methods such as GA, nonlinear programming,and particle swarm paradigm were utilized. Alabdulkaremet al. [14] studied on a C3MR plant with a large numberof variables. They reduced the complexity of the GA opti-mization problem by carrying it out in two stages. First,MR and then the propane cycle were optimized. The resultsshowed that optimization decreased the power consump-tion near 9.08%. Wang et al. [15, 16] performed a thermo-dynamic analysis based study of the minimization of theenergy consumption of a C3MR process. Their optimizationresults by applying an SQP and nonlinear programmingalgorithm indicated that energy savings can be around13%. Hwang et al. [17] determined the optimal operatingconditions for the DMR cycle by considering power effi-ciency. These conditions obtained from the mathematicalmodel formulated by using a hybrid optimization methodconsisting of the GA and SQP. As a result, the requiredpower at the obtained conditions decreased by 34.5% com-pared with the conditions obtained from the used patent.Sanavandi and Ziabasharhagh [18] modeled a three-stagepropane precooling cycle. In this study, the minimizationof specific energy consumption has been defined as the mainobjective function. MR composition has been recognized asthe most effective parameter on the performance of thecycle. Therefore, MR composition has been optimized bytwo methods; HYSYS optimizer functions and sensitivityanalysis of MR composition. The specific energy consump-tion at a sustainable optimized condition decreased5.35%. Khan et al. [19] developed the DMR process lique-faction followed by its optimization using Box methodologyand controlled elitist GA. They optimized this process by
O. Sabbagh et al.: Oil & Gas Science and Technology – Rev. IFP Energies nouvelles 75, 27 (2020)2

minimizing specific compression energy and overall heattransfer coefficient (UA). There existed a partial trade-offbetween the objective functions, thus a multi-objective opti-mization performed that results in a simultaneous decreasedof 24% and 3% in the specific compression energy and UAvalues. Sun et al. [20] simulated the AP-X process and opti-mized it by decreasing the power consumption with GA.The optimized unit power consumption was 15.56% lessthan of the base case. Ding et al. [21] simulated the MFCprocess and analyzed the effects of different parameterson the unit power consumption. Their optimization resultswith GA indicated the reduction power consumption by4.655 kWh kmol�1. Nawaz et al. optimized the MFC pro-cess by reducing the exergy losses. According to their resultsoverall exergy losses can be minimized to 34.4% that made25.4% energy savings compared to base MFC processes [22].He et al. studied on a modified SMR and nitrogen expan-sion processes. They optimized the processes by minimizingspecific energy consumption and total investment. Then theexergy efficiency and capability of handling different feedgas conditions for liquefaction of mentioned processes werecomprised. Their results showed that the modified SMRhad a lower specific energy consumption, higher exergy effi-ciency, lower total investment, and higher flexibility thanthe nitrogen expansion process [23].
In recent years, some studies have evaluated the effectsof integration of NGL/LNG and NGL/LNG/NRU pro-cesses. The reasons for this issue are due to the lowoperating temperature and existence of some identicalequipments in the mentioned processes that introduce themas series plants. It is also necessary to express that when thecontent of nitrogen in the natural gas is more than 4%(mole fraction); its separation is economically feasible.Vatani et al. [24] introduced and analyzed a novel inte-grated process configuration for NGL/LNG productionthat included two MR cycles. SPC and ethane recovery inthe process are 0.414 kWh kg�1 LNG and higher than93.3% respectively. He and Ju [25] proposed and optimizedanother novel integrated process for the small-scale LNGplant. Their results showed that the energy consumptionand flow rate of the MRs can be reduced by 9.64% and11.68% compared with the base case respectively. Thisstudy is also one of the few articles in the field of NGL/LNG integration that has done economic analysis. The ana-lysis indicated that the proposed process demonstrates goodprofitability and a short payback period. Khan et al. [26]presented three configurations of the NGL/LNG integra-tion process with using the developed KSMR cycle. Theycompared the configurations in the aspect of the amountof energy consumption. Then the best case optimized forthe compression energy requirement by varying therefrigerant composition and operating pressure levels witha KBO methodology. The results demonstrated that inthe optimal case, the amount of SPC is equal to0.3863 kWh kg�1 LNG and the compression energy require-ment is decreased by 9% compared to the base case.Mehrpooya et al. [27] introduced and analyzed three novelprocess configurations for the integration of NGL andLNG based on C3MR, DMR, and MFC. The results
indicated that these integrated processes have high ethanerecovery and low SPC (0.391, 0.375 and 0.364 kWh kg�1
LNG, respectively). Uwitonze et al. [28] presented new inte-grated schemes based on the DMR process which the mainhighlight of them is splitting of demethanizer into rectifyingand stripping sections. They optimized these processes byvarying the refrigerant composition and operating pressurelevels through KBO methodology. The results demon-strated that the scheme with a fully thermally coupleddistillation column has the lowest energy consumption.Ghorbani et al. [29] proposed an NGL/LNG/NRU processbased on the C3MR refrigeration system. This integrationled to removing reboilers and condensers in demethanizerand denitrogenizer columns. The results showed that theintegrated process has SPC of 0.359 kWh kg�1 LNG andrecover NGL more than 90%. They [4] also designedanother integrated process recovery of NGL/LNG/NRUbased on MFC by ethane recovery 92% and SPC0.343 kWh kg�1 LNG. Finally, they used GA to minimizeof SPC and according to the results, reduced it by 6%(0.3205 kWh kg�1 LNG). Recently, it is evaluated the effectof implementing ARS instead of the precooling stage ofC3MR, DMR, and MFC on the reduction of energyconsumption. As the results of related studies, using of thismethod in the NGL/LNG structure in comparison withMFC process and in the NGL/LNG/NRU structure incomparison with C3MR, DMR and MFC processeshas reduced the power consumption by about 35.67%,18.4%, 12.6% and 38.94%, respectively [30–32]. Theseinvestigations are listed among the few articles whichhave been carried out the economic analysis. This is whilethat according to recent studies, the power consumptionis the most commonly selected objective function, consid-ered as a performance indicator, followed by the exergyefficiency.
As mentioned, all of the presented articles in the field ofimproving the economic efficiency of natural gas liquefac-tion processes have been based on two overall approaches:optimization of individual LNG processes, and design andoptimization of integrated processes. According to the stu-dies, constructing an integrated NGL/LNG unit has moreadvantages than constructing two individual NGL andLNG units. But what has not been evaluated is the addedvalue resulting from adding an LNG production part toan existing NGL plant. This paper investigated the effectof this integration without applying any structural changesin the current units by examining the earned profit.Another highlighted part of this investigation is concernedwith the selection of design variables. Inlet gas pressure ofthe LNG production part and especially operating pressureof demethanizer column are variables that their optimalvalues in the integration processes are barely determined.And finally in this article, a surrogate model based onD-optimal approach was used for optimization and fullrecognition of the process. It should be noted, the reasonsof simultaneous studying of the four-member set of NGLplant (dehydration, propane gas refrigeration, ethane recov-ery and NGL fractionation units) are their impact onhydrocarbons recovery and energy consumption.
O. Sabbagh et al.: Oil & Gas Science and Technology – Rev. IFP Energies nouvelles 75, 27 (2020) 3

2 Process description
The integrated process is based on the adding LNG produc-tion part to the existing NGL plant. As can be seen inFigure 1, the existing plant contains four main units whichinclude dehydration, propane refrigeration, ethane recoveryand NGL fractionation (solid lines). However, due to thelow operating temperature and existence of the same equip-ment between this plant and the liquefaction natural gasprocess, adding an LNG production part is proposed.Figure 1 indicates the block flow diagram of the integratedplant without any structural changes. More details aboutthe process are given in the next sections. Black, blue, pinkand green lines in Figures 2 and 3 indicate streams relatedto NG, propane, MR, and water, respectively.
2.1 Dehydration unit
Figure 2a illustrates the schematic of dehydration unit.Natural gas after passing through the pretreatment systemsand removing acid gases enters this unit. Table 1 shows thefeed gas conditions. Feed gas stream 43 is combined withrecycle stream 42 and then is cooled in two stages(104-E101 and 104E-102). Eighty-eight percent of thewater content of stream 31 is removed in inlet separator,104-D101, and the rest of it is eliminated in molecular sieveadsorbent bed, 104-R101. Stream 35 after decreasing pres-sure, is splitted into two parts. The first part (93%, stream36), is warmed by LP steam in 104-E103. Finally stream 51,as the feed gas, enters the ethane recovery unit. Theremaining 7% of dried gas, stream 37, is heated in furnace104-H101 and used for regeneration of molecular sievebed. Accordingly, this stream is moistened and thereforeafter cooling in air cooler 104-A101, enters regenerationgas separator, 104-D102. The current operating conditionsof this unit are shown in Table 2.
2.2 Propane refrigeration unit
Propane cycle in the existing NGL plant is used for coolingdifferent parts of the dehydration and ethane recoveryunits. As can be seen in Figure 2b, propane is compressedin two stages compressor, 111-K101A and 111-K101B.The outlet temperature of the first stage is decreased bymixing with stream 148. While outlet stream of the secondstage, stream 149, is cooled by heat exchange with air and
ethane in 111-A101 and 105-E106, respectively. This streamis divided into two parts and then their pressure decreased.The first part (85%, stream 142), follows to kettle shell andtube heat exchanger which is modeled by heat exchanger104-E102 and drum 111-VD101. Stream 143 as the secondpart follows to 105-E101 and its outlet, stream 257, mixeswith vapor outlet of 111-VD101 and then returns to111-K101B. Liquid outlet of 111-VD101 is splitted intotwo parts. Part one, containing 33% of liquid outlet, afterdecreasing pressure is warmed in 105-E101. The remainingpart of the liquid outlet of 111-VD101, stream 144, is usedto produce cooling in the condenser of deethanizer column,105-E105, and then with mixing to stream 146 returns to111-K101A. The current operating conditions of this unitare shown in Table 2.
2.3 Ethane recovery and NGL fractionation units
Figure 2c shows a schematic of the ethane recovery andNGL fractionation units in the existing NGL plant. Stream51 is directed to a multi-stream heat exchanger, 105-E101,and its temperature decreases to �35 �C. The outlet stream52, flows to separator 105-D101 and its gas product isdivided into two parts. The first part (near 30%) is cooledin 105-E102 and then with decreasing pressure, entersdemethanizer column, 105-C101. While another part ofthe 105-D101 gas product, as same as its liquid product,just after depressurizing enters column 105-C101. Accord-ing to Table 3, demethanizer column contains 18 theoreticaltrays, operates at 30 bar and has two liquid side streams.Side streams 249 and 250 are heated in 105-E101 and returnto the column. Stream 248, provides required refrigerationin heat exchangers 105-E102, 105-E101, and 104-E101.Stream 57 is compressed in two stages; at first in105-K101 by using the expander shaft power and then incompressor 106-K101. The compressed lean gas afterdecreasing temperature in air cooler is sent to pipelines.The bottom product of demethanizer enters deethanizercolumn, 105-C102, which uses propane as refrigerant ofthe condenser to achieve high purity of ethane (98 wt.%without CO2). As shown in Table 3, this column has32 theoretical trays and operates at 30.5 bar. Stream63 cools propane stream 141 in 105-E106 and the bottomproduct of deethanizer column is directed to NGL fractiona-tion unit. Stream 64 is depressurized and then is mixed withthe same stream that comes from the parallel unit. Stream
Fig. 1. Block flow diagram of the existing NGL (solid lines) and the integrated NGL/LNG plants.
O. Sabbagh et al.: Oil & Gas Science and Technology – Rev. IFP Energies nouvelles 75, 27 (2020)4

Fig. 2. Schematic of the existing NGL plant (a) dehydration unit, (b) propane refrigeration unit, (c) ethane recovery and NGLfractionation units.
O. Sabbagh et al.: Oil & Gas Science and Technology – Rev. IFP Energies nouvelles 75, 27 (2020) 5

81 enters depropanizer column, 107-C101. As shown inTable 3, this column contains 29 theoretical trays and oper-ates at 22.3 bar. Propane and C4
+ exit from the top andbottom of depropanizer column. Stream 85 after decreasingpressure enters debutanizer column, 107-C102 which
corresponding to Table 3, contains 27 theoretical traysand operates at 8.2 bar. The current operating conditionsof the ethane recovery and NGL fractionation units areshown in Table 2.
2.4 Added LNG production part
According to Figures 2c and 3, the top outlet of demethani-zer column after providing the required cooling in heatexchangers 105-E102, 105-E101 and 104-E101 and com-pressed to 75 bar, instead of being sent to pipelines, entersLNG production part. Due to the availability of propane,and condition of no structural changes in the current units,C3MR technology is used for the liquefaction process whichhas a proven track record in LNG applications worldwide.The existence of precooling stage in this multi-cycle processcauses increasing the number of variables and DOFs andhence the difficulty of searching for optimum conditions,compared to a single-cycle process. The maximal LNGcapacity which can be reached for this process is around fiveMTPA because of construction limitations and exchangers’transportation limitations [8]. Nevertheless, the main rea-sons for extensive use of C3MR are related to utilizing ofMR and recognition of its operational problems. As canbe seen in Figure 3, propane is compressed in three stagesand then divided into two parts. The first part (23%,stream C3-2) and the second are used to precool the com-pressed lean gas (NG-3) and MR (MR-4) to �38.3 �C.Along this path, the NG temperature is decreased in airand water cooler AC-1 and WC-1 and heat exchangersE-4, E-5, and E-6, respectively. While MR (6% nitrogen,
Fig. 3. Schematic of proposed design of LNG production part.
Table 1. Properties of the feed gas.
Property Value
Temperature (�C) 44.8Pressure (bar) 65.2Flow (kmol hr�1) 23849Composition (%mol)*N2 3.53CO2 1.00CH4 86.44C2H6 5.52C3H8 2.02i-C4H10 0.35n-C4H10 0.52i-C5H12 0.14n-C5H12 0.13n-C6H14 0.10n-C7H16 0.08H2O 0.15* Very small amounts of H2S, COS, CH4S, and C2H6S arealso present in the feed gas.
O. Sabbagh et al.: Oil & Gas Science and Technology – Rev. IFP Energies nouvelles 75, 27 (2020)6

46% methane, 33% ethane, and 15% propane) is com-pressed in two stages and precooled in AC-2&3, WC-2&3,E-1, E-2, and E-3. In the liquefaction section, NG is lique-fied and subcooled in MPHX-1 and MPHX-2 by MR. Thenwith passing through V-ATM reaches to approximately�166.5 �C at atmospheric pressure. The design conditionsof the added LNG production part are shown in Table 2.The MTA of added heat exchangers (WC, AC, E, and
MPHX) are considered 10, 5, 2, and 1 �C, respectively. Itshould be noted, the local ambient air temperature isassumed 37 �C and the temperature of sea water is assumed25 �C.
The reason for the lower temperature of LNG in thisarticle compared to other studies is related to the existenceof 3.5% nitrogen in the feed gas. Accordingly, if the tem-perature of NG-5 (before reaching atmospheric pressure)
Table 2. Operating and design conditions of the existing NGL plant and added LNG part.
Stream T (�C) P (bar) Flow (kmol hr�1) Stream T (�C) P (bar) Flow (kmol hr�1)
31 22.0 64.4 25 649 142 19.0 8.2 340332 22.0 64.4 25 612 144 2.4 5.1 86535 23.0 63.7 25 607 145 �1.6 4.5 42336 22.7 63.1 23 814 146 �0.1 4.5 42338 300.0 61.0 1792 147 1.6 4.5 128839 60.0 59.4 1880 148 19 8.0 271241 60.0 59.3 1800 149 77.3 22.6 400042 71.5 65.2 1800 247 �84.5 60.8 669751 27.7 62 23 814 248 �87.2 30.0 22 08552 �35 61 23 814 249 9.3 30.1 271453 �35 61 803 250 �38.9 30.1 314354 �66.8 30.4 16 315 256 14.3 29.8 271455 �48.8 30.4 803 261 �15.4 29.8 314356 16.2 28.8 22 085 NG-3 �38.3 75.0 22 08557 33.4 28.3 22 085 MR-1 35.0 48.0 29 76558 36.3 30.2 1729 MR-4 �38.3 48.0 29 76559 36.6 33.2 1729 MR-5V �130.0 48.0 887463 8.7 30 954 MR-5L �130.0 48.0 20 89164 104.6 30.8 776 MR-7V �166.4 2.9 887481 89.3 22.8 1551 MR-8V �136.3 2.9 887485 134.2 22.6 631 MR-10 �135.1 2.9 29 76586 89.5 8.7 631 MR-14 102.9 48.0 29 76589 60.7 7.5 413 C3-1 35.0 12.2 30 74690 127.5 8.5 218 C3-2 35.0 12.2 696491 61.8 21.6 920 C3-8 �14.9 2.45 17 186141 60.0 21.6 4000 C3-10 14.1 5.47 30 746
Table 3. Specification of the existing columns.
Parameter Demethanizer Deethanizer Depropanizer Debutanizer
Height (m) 38.35 36.9 32.9 31.1Diameter of 1st/2nd section (m) 4.2/2.0 2.0/3.4 4.2 2.3No. of theoretical stages 18 32 29 27Type of tray Ballast valve Ballast valve Ballast valve Ballast valveCondenser press (bar) – 30 21.6 7.5TOP/BTM operating press (bar) 30/30.2 30.5/30.8 22.3/22.6 8.2/8.5Feed stages 1, 5, 6, 9, 14 12 13 15Side stream stages 8, 13 – – –
O. Sabbagh et al.: Oil & Gas Science and Technology – Rev. IFP Energies nouvelles 75, 27 (2020) 7

is higher than �162 �C, a large volume of natural gas exitsfrom the top of D-6. Figure 4 compares the phase envelopesof the feed gases used in this study and some of the otherresearches. It is obvious that reaching to the subcooled zonewith the current feed, needs more refrigeration.
3 Simulation and validation
In the literature, many process simulators with differentthermodynamic packages, especially PR and similar equa-tions, were used to simulate natural gas cryogenic processes([2, 3, 8] and [27]). In this way, simulation of the entireexisting NGL plant, Figure 2, was carried out in AspenPlus� (V.10) with three different thermodynamic packages(PR, modified PR, and SRK). Modified PR is the PR whichits binary interaction coefficients (Kij) are corrected in ac-cordance with Table A1. The validation of the simulationresults is done by comparing with industrial plant data.The details of validation of the thermodynamic packagesare presented in Table A2. It indicates that the differencesof these packages are significant especially in prediction ofhigh concentrations of heavy components. According to thistable, modified PR has the least error (3.13%) in the valida-tion of the existing NGL plant than other thermodynamicpackages.
4 Optimization
4.1 Objective function
Earned profit is the important parameter needs to be con-sidered in the modification of chemical units. The profitof the existing NGL plant is due to the sale of its productsminus the operating costs. In addition to the increasedrevenue, increased capital and operating costs should bedetermined in adding the LNG production part. It is worthnoting that the equipments which exceed their acceptableoperating capacity in optimization procedure are modi-fied with adding appropriate equipments. Otherwise, the
existing equipment is replaced with the new one. The objec-tive function is defined as follows:
Maximize : EP ¼ IAR –TIAC; ð1Þwhere
IAR ¼ ARIntegrated plant –ARNGLplant; ð2Þ
TIAC ¼ 0:33TICI þ TIOC; ð3Þ
TICI ¼ 1:18 ðTIBM þ Csite þ CbuildingsÞ þ CWC; ð4Þ
TIBM ¼X
i:each of added process equipmentBMi; ð5Þ
BM ¼ Cequipment þ Cinstall; ð6Þ
Csite ¼ 5% TIBM; ð7Þ
Cbuildings ¼ 5% TIBM; ð8Þ
CWC ¼ 5% TICI; ð9Þ
TIOC ¼ ISC þ IEC: ð10ÞAs can be seen, concerning to Table 4, the value ofincreased annualized revenue is determined. Next, the totalincreased annualized cost is calculated with the assumptionof 3-year payback period. Various methods exist to estimateinvestment costs, which have different accuracy due to theircomplexity. The Guthrie method, with precision of about20%, is applied to determine the total increased capitalinvestment in this study [36]. The bare-module cost consistsof installed and purchased equipment cost which is esti-mated by Aspen Process Economic Analyzer� (V.10).Installed and purchased equipment cost represents the totaldirect material and labor, and the bare equipment costs as-sociated with the project component, respectively. Five per-cent of TIBM is considered for the cost of site preparationand building costs, and the working capital can be esti-mated at 5% of the total capital investment. At last, totalincreased operating cost is determined by the summationof increased electricity and steam costs. It is necessary tomention that the integrated plant is anticipated to operate300 days a year.
Fig. 4. Phase envelopes of the different feed gases.
Table 4. Basic cost of products and utilities (2016).
Component Cost Ref.
NG 2.50 $ MMBtu�1 [33]LNG 6.06 $ MMBtu�1 [34]Ethane 0.325 $ kg�1 [35]Propane 0.325 $ kg�1 [35]Electricity 0.078 $ kWh�1 APEA� (V.10)LP steam, 100 psi 8.14 $ klb�1 APEA� (V.10)
O. Sabbagh et al.: Oil & Gas Science and Technology – Rev. IFP Energies nouvelles 75, 27 (2020)8

4.2 Design variables and constraints
One of the important issues in the optimization problems isthe selection of independent variables that have significanteffects on the performance of the objective function. To thisaim, at first, all of independent variables of the integratedplant were determined. Then with the help of sensitivityanalysis, the effects of changing these variables on theobjective function were evaluated. Variables with highimpact on the objective function were chosen as design vari-ables. MR composition (included nitrogen, methane,ethane, and propane), high and low pressure of MR (outletpressure of K-4, and V-7&8), inlet gas pressure of the LNGproduction part (outlet pressure of 106-K101), and operat-ing pressure of demethanizer column are variables of theoptimization problem. Upper and lower limits of these vari-ables, concerning process recognition and maintenance ofexisting equipments as much as possible, are shown in equa-tions (11)–(18). It should be noted during the optimization,hydraulic conditions of each column, especially thedemethanizer, had been checked that do not have anyoperational problems.
6 � x1 : N2 content inMR; mole% � 10; ð11Þ
42 � x2 : C1 content inMR; mole% � 47; ð12Þ
30 � x3 : C2 content inMR; mole% � 39; ð13Þ
13 � x4 : C3 content inMR; mole% � 20; ð14Þ
45 � x5 : POut;K�4; bar � 51; ð15Þ
2:5 � x6 : POut;V�7&8; bar � 3:2; ð16Þ
55 � x7 : PInlet gas of the LNGproduction part; bar � 75; ð17Þ
25 � x8 : P105�C101; bar � 30: ð18Þ
4.3 Optimization method
According to the literature, most researches done in thefield of NG liquefaction optimization were used one of thedeterministic, stochastic, or KBO methods. Each of theseoffers several benefits in terms of calculation time, conver-gence and ease of implementation. Whereas, a statisticalmethod was used in this research to full recognition of theprocess and simplify the optimization problem concerning
the extent and complexity of the integrated plant. In thisway, D-optimal design approach was utilized for developinga surrogate model which predicted the plant behavior withhigh accuracy. A D-optimal is a computer-generated design,which chooses runs that minimizes the determinant of thevariance-covariance matrix of the parameter estimates ofthe model. This has the effect of minimizing the volumeof the joint confidence ellipsoid for the coefficients. Theoptimal approach has more flexibility and lower runs incompared with the standard designs such as central compo-site or Box–Behnken. In addition it supports irregularexperimental regions, and mixture and process variablesin the same design. Accordingly, the effects of design vari-ables of the integrated plant on the objective function wereinvestigated through conducting 155 simulation runs basedon the design matrix of D-optimal approach in Design-Expert� (V.10). The correctness of the generated surrogatemodel was verified by several statistical criterions. Then,concerning the nonlinearity of the model behavior, a hybridmethod consists of the GA and SQP was used to find theglobal optimal point of the surrogate model [17, 37]. TheGA and SQP as powerful stochastic and deterministic opti-mization methods are used widely for solving optimizationproblems. The GA searches the global solution in a popula-tion which is randomly generated. This method is able tosolve nonlinear problems after a large number of genera-tions. The SQP, as a fast method, is very sensitive to thechoice of initial point and not able to solve the highly non-linear problems. While the hybrid GA-SQP method is ableto determine the final solution considerably faster than theGA while it is not sensitive to the initial point. In this meth-od, the result of GA as an initial guess was used in SQP toimprove the results. The tuning parameters of this methodused in MATLAB� are listed in Table 5.
5 Results and discussion
5.1 Model regression and statistical analysis
The obtained results from the simulation runs were ana-lyzed to determine the quadratic-quadratic model, mixtureand process orders, for the earned profit from the modifica-tion of the existing NGL plant. The regressed model is pre-sented in equation (19) and its coefficients based on thecoded and actual values are shown in Table A3.
Table 5. Tuning parameter of GA.
Tuning parameters Value
Population size 300Crossover fraction 0.8Mutation Adaptive feasibleSelection method Stochastic uniformCrossover function ScatterNumber of generations 800
O. Sabbagh et al.: Oil & Gas Science and Technology – Rev. IFP Energies nouvelles 75, 27 (2020) 9

Objective function ¼X88
i¼ 1
aif iðXÞ
whereX ¼ x1; x2; x3; x4; x5; x6; x7; x8½ �: ð19Þ
The coded equation can be used to make predictions aboutthe response for given levels of each factor. The high andlow levels of the factors are coded as +1 and �1, respec-tively. This type of equation is useful for identifying therelative impact of the factors by comparing their coeffi-cients. While for predicting of response in the equationincluded actual factors, the levels should be specified inthe original units. This equation cannot be used to deter-mine the relative impact of each factor because the coeffi-cients are scaled to accommodate the units of each factorand the intercept is not at the center of the design space.
Several statistical criterions should be checked to verifythe correctness of the generated model. Fisher test via divid-ing the model mean square by its residual mean square isa statistical significance test used in the ANOVA table.The results of ANOVA for the earned profit show thatthe model is significant for the 95% confidence interval withF-value of 49.60. The insignificant terms with p-valuegreater than 0.1, were removed from the model to improveits regression quality and the optimization results. However,as can be seen in the ANOVA, some of the insignificantterms in reason to the hierarchy of model were preserved.It should be noted that due to the lack of repetition in thesimulation runs, lack-of-fit test is not practical. Adequateprecision is a signal-to-noise ratio that investigates the pre-cision of the developed model. It compares the range of thepredicted values at the design points to the average predic-tion error. Ratios greater than 4 are favorable for adequateprecision. The value of this parameter for the proposed
Fig. 5. (a) Normal plot of residuals, (b) residuals vs. predicted, (c) predicted vs. actual data.
Table 6. Optimal conditions and corresponding observed and predicted objective function.
Mixture variable Process variable Objective function
x1 x2 x3 x4 x5 x6 x7 x8 Predicted Observed* Error(%mol) (bar) ($ min�1) (%)
9.01 43.23 31.55 16.22 50.72 3.19 66.60 25.99 623.62 628.32 0.75* Observed means the value is predicted by simulated plant.
Fig. 6. Perturbation plot at the optimal conditions.
O. Sabbagh et al.: Oil & Gas Science and Technology – Rev. IFP Energies nouvelles 75, 27 (2020)10
model is equal to 32.214. Another criterion, R-squared, is ameasure of the amount of variation around the meanexplained by the model. It can be artificially inflated bysimply continuing to add terms to the model, even if theterms are not statistically significant. The adjustedR-squared plateaus when insignificant terms are added tothe model and the predicted R-squared will decrease whenthere are too many insignificant terms. Adjusted R-squaredis a measure of the amount of variation around the meanexplained by the model, adjusted for the number of termsin the model, while the predicted R-squared indicates how
well a developed model predicts responses for new observa-tions. High values of the mentioned parameters (0.9807 forR-squared, 0.9610 for adjusted R-squared, and 0.9215 forpredicted R-squared) indicate that the second-order fittedmodel is significant for describing the integrated NGL/LNG plant.
Examining the residuals by diagnostic plots are theother criterions that are checked to confirm the fittedmodel. To this aim, at first, the normal probability of thestudentized residuals was plotted. As shown in Figure 5a,convergence of the residuals on the red line indicates the
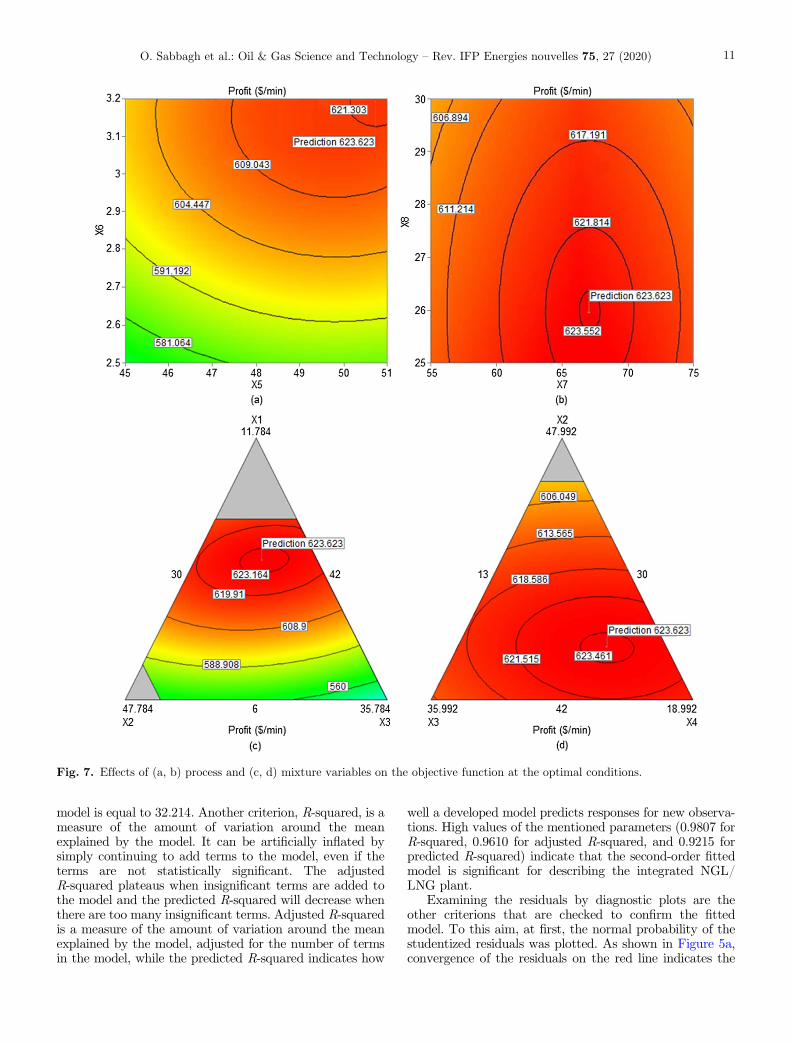
Fig. 7. Effects of (a, b) process and (c, d) mixture variables on the objective function at the optimal conditions.
O. Sabbagh et al.: Oil & Gas Science and Technology – Rev. IFP Energies nouvelles 75, 27 (2020) 11

satisfaction of the normality assumption. Another step wasplotting the externally studentized residuals versus pre-dicted values. In an adequate model, the data without aparticular trend scatter randomly above and below thezero residual line. According to this and with attention toFigure 5b, the variances of the error are constant and thereare no outliers. The final test is concerned with the plot ofpredicted versus actual data which indicates the amount ofdeviation of actual data from the model predicted data.Figure 5c shows that the fitted model, predicts the earnedprofit data with enough precision.
5.2 Optimization results
As mentioned earlier, the optimization of the generated sur-rogate model was applied to detecting the maximum profitearned from the modification of the existing NGL plant byadding the LNG production part. The obtained optimummixture and process variables and their corresponding pre-dicted response of the model are tabulated in Table 6. Thecomparison of predicted response with its observed valuerepresents the high accuracy of the modeling.
The details of determination of the objective functionincluding the changes of type and quantity of productsand changes in operating and investment costs are pre-sented in Table A4–Table A6. It should be noted thatdetermination of the bare-module cost of multi-stream heatexchangers needs to design specifications of them. For thesack of reliability and validity, Aspen EDR� (V.10) wasused in obtaining appropriate, accurate, and acceptable siz-ing and specifications of MPHX-1&2. The overall geometryof these heat exchangers is shown in Table A7.
In order to evaluate the behavior of the process factorsat the optimal point, the perturbation plot was studied. Inthis plot, the response is drawn by varying only one factorover its range while the other factors are held constant.Figure 6 illustrates the effect of high and low pressure ofMR, inlet gas pressure of the LNG production part, andoperating pressure of the demethanizer column at theoptimal conditions which shown in Table 6. According toFigure 6, the earned profit increased with increasing highand low pressure of MR (x5 and x6); although the steep cur-vature in the behavior of low pressure of MR (x6) impliedthat the profit was more rapid in response to this factor.
Fig. 8. Composite curves of the liquefaction section at the design and optimal conditions.
Table 7. Liquefaction efficiency comparison.
Author Year Refrigeration system SPC (kWh kg�1 LNG) Ref.
Wang et al.* 2013 C3MR 0.408 [38]Mehrpooya et al. 2014 C3MR 0.391 [27]Wang et al.* 2014 C3MR 0.358 [38]Khan et al. 2014 KSMR 0.386 [26]Ghorbani et al. 2016 C3MR 0.359 [29]Ansarinasab and Mehrpooya 2017 C3MR-ARS 0.207 [39]Current study 2020 C3MR 0.347 –
* This note is extracted from the review paper of Song et al. [38]
O. Sabbagh et al.: Oil & Gas Science and Technology – Rev. IFP Energies nouvelles 75, 27 (2020)12

The contour plot shown in Figure 7a, confirms theabove results. While there are trades-off in the detectionof the optimal values of inlet gas pressure of the LNG pro-duction part (x7) and operating pressure of the demethani-zer column (x8). As can be seen in Figure 6, increasing theinlet gas pressure of the LNG production part (x7) at firstincreases the earned profit by decreasing the required heattransfer area in heat exchangers. However, keep increasingthe inlet gas pressure warms the gas and increases thebare-module cost and electricity consumed of 106-K101and subsequently decreases the profit. Moreover, reducingthe operating pressure of the demethanizer column (x8)increases the ethane recovery. On the other hand, reducingthe operating pressure decreases the amount of producedLNG, increases the bare-module cost and electricity con-sumed of 106-K101, and as indicated in Table A4 increasesthe steam consumed. Accordingly, an optimal value wasfound for the dimethanizer columns’ pressure, and contraryto expectation this variable does not fell on the lowerbound. The contour plot shown in Figure 7b, confirmsthe observed behavior of x7 and x8 variables. Investigatingthe effects of mixture variables on the economic objectivefunction at the optimal conditions requires the study ofternary plots. Such plots were obtained considering threemixture factors at a time while keeping the others constant.Figure 7c represents the simultaneous effects of nitrogen,methane, and ethane concentration on the model responseat the optimal point. It was found that keeping nitrogenconstant at any values and increasing methane (decreasingethane) or vice versa did not contribute to a significantchange in the earned profit around the optimal point.Whereas, increasing nitrogen causes rapid increase in theearned profit especially at the middle levels of methaneand ethane.
The interaction effects of nitrogen, methane, and pro-pane when the other factors are at the optimal conditionsare similar to Figure 7c. Figure 7d indicates the ternary plotof methane, ethane, and propane when the other factors areat optimal values. It shows that variations of methanearound the optimal conditions are more effective thanethane and propane changes.
Actually, according to the above-mentioned due to thecurvature of response, the optimum values of the mixturevariables located neither at its upper nor its lower levels,but somewhere within the range. Also it should be notedthat as can be seen in Table A3, the greatest coefficientsare related to the mixture variables. Therefore all of thesefactors have a strong impact on the economic objectivefunction while Figures 7c and 7d just evaluate the effectsof mixture variables when the other factors are at optimalconditions. The determination of optimal values of designvariables, especially MR composition, in addition toincreasing the earned profit, improve thermodynamic effi-ciency by closing hot and cold composite curves in the lique-faction section of the LNG production part, as shown inFigure 8.
According to the literature review, most articles in thefield of NGL/LNG integration were used liquefaction effi-ciency, SPC, as the objective function. However, althoughthe presented paper is maximized the earned profit, with
respect to determination of the optimal conditions espe-cially MR composition, the amount of electrical powerconsumed, Table A5, for production of the LNG isdecreased. It should be noted the greatest reduction isrelated to electrical power consumption of the compressorsof the MR cycle. As seen in Table 7, there is low range inthe SPC values of C3MR process and the optimized pro-posed integrated plant has high liquefaction efficiencyamong similar conventional cases. Moreover the structureand operating conditions of the LNG production part, thecomposition of the feed gas is effective on the SPC.
6 Conclusion
The evaluation of integrating an existing operational NGLplant with adding an appropriate LNG production part wasperformed. In this way, with respects to the conditions of nostructural changes in the current units and keeping theexisting equipments as much as possible, the structure ofthe LNG production part was determined. Whereas theanalysis of the phase envelope curves of different composi-tions of feed gases showed that the amount of N2 in feedhas a reverse effect on the LNG temperature. In the next,D-optimal design approach was utilized to full recognitionof the integrated process and generation of a surrogatemodel for determination of the earned profit. MR composi-tion (nitrogen, methane, ethane, and propane), high andlow pressure of MR, inlet gas pressure of the LNG produc-tion part, and operating pressure of demethanizer columnwere introduced as manipulated variables. Accordingly, aquadratic-quadratic model was developed and statisticaltests confirmed its high accuracy (0.98 for R-squared, 0.96for adjusted R-squared, and 0.92 for predicted R-squared).The coefficients of the coded surrogate model indicated thatthe composition of MR has the most effect in the earnedprofit. At the last step, the optimization of the integratedplant was on the agenda. In this way, the optimal operatingconditions from the surrogate model were obtained using ahybrid optimization method that consists of the GA andSQP. Then, the effects of the main process variables andMR composition on the earned profit were investigatedwith perturbation and contour plots. Accordingly, the opti-mum values of the mixture variables located neither at itsupper nor its lower levels, but somewhere within the range.The increasing high and low pressure of MR caused anincrease in the objective function with different gradients.While increasing the inlet gas pressure of the LNG produc-tion part at first increased the profit but with keeping thistrend, the profit was decreased. Moreover, an optimal valuewas found for demethanizer pressure and it did not fall onthe lower bound. Finally, the optimization results indicatedthat with shifting from the NGL plant to the integratedNGL/LNG, a profit equal to 623.62 $ min�1 can be earned.In addition to the increased earned profit in the developedintegrated plant, the thermodynamic efficiency was im-proved by closer matching of hot and cold composite curvesin the liquefaction section. Furthermore, the optimized pro-posed integrated plant has acceptable SPC with the valueof 0.347 kWh kg�1 LNG.
O. Sabbagh et al.: Oil & Gas Science and Technology – Rev. IFP Energies nouvelles 75, 27 (2020) 13

References
1 International Energy Agency, Market Report Series: Gas2019, https://www.iea.org/topics/naturalgas/ (accessed 16November 2019).
2 Castillo L., Dahouk M.M., Di Scipio S., Dorao C.A. (2013)Conceptual analysis of the precooling stage for LNGprocesses, Energy Convers. Manage. 66, 41–47.
3 Lim W., Lee I., Tak K., Cho J.H., Ko D., Moon I. (2014)Efficient configuration of a natural gas liquefaction processfor energy recovery, Ind. Eng. Chem. Res. 53, 5, 1973–1985.
4 Ghorbani B., Hamedi M.H., Amidpour M., Mehrpooya M.(2016) Cascade refrigeration systems in integrated cryogenicnatural gas process (natural gas liquids (NGL), liquefiednatural gas (LNG) and nitrogen rejection unit (NRU)),Energy 115, 88–106.
5 Khan M.S., Karimi I.A., Wood D.A. (2017) Retrospectiveand future perspective of natural gas liquefaction andoptimization technologies contributing to efficient LNGsupply: A review, J. Nat. Gas Sci. Eng. 45, 165–188.
6 Mazyan W., Ahmadi A., Ahmed H., Hoorfar M. (2016)Market and technology assessment of natural gas processing:A review, J. Nat. Gas Sci. Eng. 30, 487–514.
7 Khan M.S., Lee S., Lee M. (2012) Optimization of singlemixed refrigerant natural gas liquefaction plant with non-linear programming, Asia-Pacific J. Chem. Eng. 7, S62–S70.
8 Lee S., Long N.V.D., Lee M. (2012) Design and optimizationof natural gas liquefaction and recovery processes for offshorefloating liquefied natural gas plants, Ind. Eng. Chem. Res.51, 30, 10021–10030.
9 Lim W., Choi K., Moon I. (2013) Current status andperspectives of liquefied natural gas (LNG) plant design, Ind.Eng. Chem. Res. 52, 9, 3065–3088.
10 Shirazi M.M.H., Mowla D. (2010) Energy optimization forliquefaction process of natural gas in peak shaving plant,Energy 35, 7, 2878–2885.
11 Khan M.S., Lee M. (2013) Design optimization of singlemixed refrigerant natural gas liquefaction process using theparticle swarm paradigm with nonlinear constraints, Energy49, 146–155.
12 Moein P., Sarmad M., Ebrahimi H., Zare M., Pakseresht S.,Vakili S.Z. (2015) APCI-LNG single mixed refrigerantprocess for natural gas liquefaction cycle: analysis andoptimization, J. Nat. Gas Sci. Eng. 26, 470–479.
13 Lee I., Moon I. (2016) Total cost optimization of a singlemixed refrigerant process based on equipment cost and lifeexpectancy, Ind. Eng. Chem. Res. 55, 39, 10336–10343.
14 Alabdulkarem A., Mortazavi A., Hwang Y., RadermacherR., Rogers P. (2011) Optimization of propane pre-cooledmixed refrigerant LNG plant, Appl. Therm. Eng. 31, 6–7,1091–1098.
15 Wang M., Zhang J., Xu Q., Li K. (2011) Thermodynamic-analysis-based energy consumption minimization for naturalgas liquefaction, Ind. Eng. Chem. Res. 50, 22, 12630–12640.
16 Wang M., Zhang J., Xu Q. (2012) Optimal design andoperation of a C3MR refrigeration system for natural gasliquefaction, Comput. Chem. Eng. 39, 84–95.
17 Hwang J.H., Roh M.I., Lee K.Y. (2013) Determination of theoptimal operating conditions of the dual mixed refrigerantcycle for the LNG FPSO topside liquefaction process,Comput. Chem. Eng. 49, 25–36.
18 Sanavandi H., Ziabasharhagh M. (2016) Design and com-prehensive optimization of C3MR liquefaction natural gas
cycle by considering operational constraints, J. Nat. Gas Sci.Eng. 29, 176–187.
19 Khan M.S., Karimi I.A., Lee M. (2016) Evolution andoptimization of the dual mixed refrigerant process of naturalgas liquefaction, Appl. Therm. Eng. 96, 320–329.
20 Sun H., Ding D.H., He M., Sun S.S. (2016) Simulationand optimization of AP-X process in a large-scale LNG plant,J. Nat. Gas Sci. Eng. 32, 380–389.
21 Ding H., Sun H., Sun S., Chen C. (2017) Analysis andoptimization of a mixed fluid cascade (MFC) process,Cryogenics 83, 35–49.
22 Nawaz A., Qyyum M.A., Qadeer K., Khan M.S., Ahmad A.,Lee S., Lee M. (2019) Optimization of mixed fluid cascadeLNG process using a multivariate Coggins step-up approach:Overall compression power reduction and exergy lossanalysis, Int. J. Ref. 104, 189–200.
23 He T., Liu Z., Ju Y., Parvez A.M. (2019) A comprehensiveoptimization and comparison of modified single mixedrefrigerant and parallel nitrogen expansion liquefactionprocess for small-scale mobile LNG plant, Energy 167, 1–12.
24 Vatani A., Mehrpooya M., Tirandazi B. (2013) A novelprocess configuration for co-production of NGL and LNGwith low energy requirement, Chem. Eng. Proc. Proc.Intens. 63, 16–24.
25 He T., Ju Y. (2014) Design and optimization of a novelmixed refrigerant cycle integrated with NGL recoveryprocess for small-scale LNG plant, Ind. Eng. Chem. Res.53, 13, 5545–5553.
26 Khan M.S., Chaniago Y.D., Getu M., Lee M. (2014) Energysaving opportunities in integrated NGL/LNG schemesexploiting: Thermal-coupling common-utilities and processknowledge, Chem. Eng. Proc. Proc. Intens. 82, 54–64.
27 Mehrpooya M., Hossieni M., Vatani A. (2014) Novel LNG-based integrated process configuration alternatives forcoproduction of LNG and NGL, Ind. Eng. Chem. Res. 53,45, 17705–17721.
28 Uwitonze H., Lee I., Hwang K.S. (2016) Alternatives ofintegrated processes for coproduction of LNG and NGLsrecovery, Chem. Eng. Proc. Proc. Intens. 107, 157–167.
29 Ghorbani B., Hamedi M.H., Amidpour M. (2016) Develop-ment and optimization of an integrated process configurationfor natural gas liquefaction (LNG) and natural gas liquids(NGL) recovery with a nitrogen rejection unit (NRU), J.Nat. Gas Sci. Eng. 34, 590–603.
30 Ghorbani B., Shirmohammadi R., Mehrpooya M. (2018) Anovel energy efficient LNG/NGL recovery process usingabsorption and mixed refrigerant refrigeration cycles–Economicand exergy analyses, Appl. Therm. Eng. 132, 283–295.
31 Ghorbani B., Hamedi M.H., Amidpour M., Shirmohammadi R.(2017) Implementing absorption refrigeration cycle in lieu ofDMR and C3MR cycles in the integrated NGL, LNG andNRU unit, Int. J. Ref. 77, 20–38.
32 Ghorbani B., Mehrpooya M., Shirmohammadi R., HamediM.H. (2018) A comprehensive approach toward utilizingmixed refrigerant and absorption refrigeration systems in anintegrated cryogenic refrigeration process, J. Cleaner Prod.179, 495–514.
33 EIA (2019) Henry Hub Natural Gas Spot Price, https://www.eia.gov/dnav/ng/hist/rngwhhdm.htm (accessed 16November.
34 METI, Spot LNG Price Statistics, https://www.meti.go.jp/english/statistics/sho/slng/index.html (accessed 16 Novem-ber 2019).
O. Sabbagh et al.: Oil & Gas Science and Technology – Rev. IFP Energies nouvelles 75, 27 (2020)14

35 Jiang H., Zhang S., Jing J., Zhu C. (2019) Thermodynamicand economic analysis of ethane recovery processes based onrich gas, Appl. Therm. Eng. 148, 105–119.
36 Seider W.D., Seader J.D., Lewin D.R. (2009) Product andprocess design principles: synthesis, analysis and evaluation,Wiley, USA, pp. 534–601.
37 Ku N.K., Lee J.C., Roh M.I., Hwang J.H., Lee K.Y. (2012)Multi-floor layout for the liquefaction process systems ofLNG FPSO using the Optimization Technique, J. Soc. NavalArch. Korea 49, 1, 68–78.
38 Song Q., Zhang J.P., Zhao Z., Luo J.L., Wang Q., Chen G.M.(2019) Development of natural gas liquefaction processesusing mixed refrigerants: a review of featured processconfigurations and performance, J. Zhejiang Univ-Sci A 20,10, 727–780.
39 Ansarinasab H., Mehrpooya M. (2017) Advanced exergoe-conomic analysis of a novel process for production of LNG byusing a single effect absorption refrigeration cycle, Appl.Therm. Eng. 114, 719–732.
O. Sabbagh et al.: Oil & Gas Science and Technology – Rev. IFP Energies nouvelles 75, 27 (2020) 15

Table A1. Binary interaction coefficients (Kij) of the modified PR package.
N2 CO2 H2S C1 C2 C3 i-C4 n-C4 i-C5 n-C5 C6 C7 COS M-MER E-MER H2O
N2 �0.0200 0.1676 0.036 0.05 0.08 0.095 0.09 0.095 0.1 0.149 0.1439 0 0 0 �0.3156CO2 �0.0200 0.1 0.1 0.1298 0.135 0.1298 0.1298 0.125 0.125 0.125 0.1199 0 0 0 0.0445H2S 0.1676 0.1 0.085 0.084 0.075 0.05 0.06 0.06 0.065 0.06 0.06 0 0 0 0.0819C1 0.036 0.1 0.085 0.0022 0.0068 0.0131 0.0123 0.0176 0.0179 0.0235 0.0289 0.0289 0.0592 0.0592 0.5C2 0.05 0.1298 0.084 0.0022 0.0013 0.0046 0.0041 0.0074 0.0076 0.0114 0.0153 0.025 0.0694 0.0608 0.5C3 0.08 0.135 0.075 0.0068 0.0013 0.001 0.0008 0.0026 0.0027 0.0051 0.0079 0.0105 0.0657 0.0564 0.5i-C4 0.095 0.1298 0.05 0.0131 0.0046 0.001 0 0.0003 0.0004 0.0016 0.0032 0 0.0399 0.0602 0.5n-C4 0.09 0.1298 0.06 0.0123 0.0041 0.0008 0 0.0005 0.0005 0.0019 0.0036 0.0158 0.072 0.0369 0.5i-C5 0.095 0.125 0.06 0.0176 0.0074 0.0026 0.0003 0.0005 0 0.0004 0.0015 0 0.0594 0.0594 0.5n-C5 0.1 0.125 0.065 0.0179 0.0076 0.0027 0.0004 0.0005 0 0.0004 0.0014 0 0.0593 0.0593 0.48C6 0.149 0.125 0.06 0.0235 0.0114 0.0051 0.0016 0.0019 0.0004 0.0004 0.0003 0 0.058 0.058 0.5C7 0.1439 0.1199 0.06 0.0289 0.0153 0.0079 0.0032 0.0036 0.0015 0.0014 0.0003 0 0.0563 0.0563 0.5COS 0 0 0 0.0289 0.025 0.0105 0 0.0158 0 0 0 0 0 0 0M-MERC 0 0 0 0.0592 0.0694 0.0657 0.0399 0.072 0.0594 0.0593 0.058 0.0563 0 0 0E-MERC 0 0 0 0.0592 0.0608 0.0564 0.0602 0.0369 0.0594 0.0593 0.058 0.0563 0 0 0H2O �0.3156 0.0445 0.0819 0.5 0.5 0.5 0.5 0.5 0.5 0.48 0.5 0.5 0 0 0
Appendix
O.Sabbagh
etal.:
Oil&
Gas
Scienceand
Technology
–Rev.
IFP
Energies
nouvelles75,
27(2020)
16

Table A2. Details of validation of the different thermodynamic packages in simulation of the existing NGL plant.
Parameter Current value PR Error (%) Mod. PR Error (%) SRK Error (%)
Temp. of 52 (�C) �35.00 �36.30 3.70 �36.02 2.91 �35.28 0.79Temp. of 54 (�C) �66.80 �66.96 0.24 �66.70 0.15 �65.94 1.29Temp. of 56 (�C) 16.20 17.31 6.87 16.82 3.83 16.34 0.86Temp. of 58 (�C) 36.30 37.71 3.89 37.88 4.35 36.28 0.04Temp. of 63 (�C) 8.70 7.69 11.65 7.74 11.06 7.30 16.06Temp. of 64 (�C) 104.60 104.50 0.10 104.61 0.01 104.59 0.01Temp. of 86 (�C) 89.50 91.62 2.37 91.70 2.46 90.70 1.45Temp. of 91 (�C) 60.00 60.36 0.60 60.34 0.57 59.96 0.07Temp. of 248 (�C) �87.20 �87.10 0.12 �87.13 0.08 �86.63 0.65Flow of 58 (kmol hr�1) 1729 1709 1.19 1695 1.92 1775 2.62Flow of 63 (kmol hr�1) 954 924 3.15 909 4.63 989 3.74Flow of 91 (kmol hr�1) 920 938 2.02 939 2.08 938 1.98C5
+ content of 89 (%mol) �0.0032 0.0120 275.72 0.0019 0.00 0.0119 272.79Deethanizer cond. duty (kW) 4020 3585 10.83 3548 11.47 3545 11.83Depropanizer cond. duty (kW) 11 980 11 744 1.97 11 759 1.85 11 805 1.46Debutanizer cond. duty (kW) 6500 5532 14.89 6338 2.49 5546 14.68Demethanizer reb. duty (kW) 3450 3648 5.75 3568 3.43 3016 12.57Deethanizer reb. duty (kW) 7670 7253 5.43 7182 6.36 7499 2.23Depropanizer reb. duty (kW) 11 430 11 093 2.95 11 112 2.78 11 116 2.74Debutanizer reb. duty (kW) 4695 3878 17.41 4686 0.19 3867 17.64Average error (%) 18.54 3.13 18.28
O. Sabbagh et al.: Oil & Gas Science and Technology – Rev. IFP Energies nouvelles 75, 27 (2020) 17

Table A3. The amounts of ai in equation (19).
i fi (X) ai i fi (X) ai i fi (X) aiActual Coded Actual Coded Actual Coded
1 x1 �5682.3 464.6 40 x1x6x7 �1.9 0.6 79 x1x4x6x7 0.1 29.82 x2 �2305.7 606.2 41 x1x6x8 3.8 0.1 80 x1x4x6x8 �0.3 �22.13 x3 748.7 565.2 42 x2x3x5 0.2 24.3 81 x2x3x5x8 �5.2 � 10�3 �3.24 x4 �5421.3 596.6 43 x2x3x6 �33.8 57.5 82 x2x3x6x7 �0.1 �16.55 x1x2 181.1 63.3 44 x2x3x7 0.2 11.6 83 x3x4x5x7 1.0 � 10�2 25.56 x1x3 �47.4 308.1 45 x2x3x8 0.2 �4.7 84 x1x2x6
2 13.6 135.27 x1x4 117.0 250.1 46 x2x4x5 �3.8 �2.2 85 x1x4x5
2 0.1 52.88 x1x5 98.6 �54.8 47 x2x4x6 �27.6 57.1 86 x2x3x6
2 6.9 68.99 x1x6 3442.2 �13.0 48 x2x5x6 �4.2 �20.0 87 x2x4x5
2 3.9 � 10�2 28.410 x1x7 0.2 �1.5 49 x2x5x7 4.3 � 10�2 0 88 x2x4x6
2 5.2 51.511 x1x8 �7.9 �6.3 50 x2x5x8 0.1 �1.112 x2x3 27.7 �8.6 51 x2x6x7 1.1 �3.413 x2x4 126.8 5.5 52 x2x6x8 �0.3 014 x2x5 25.9 14.3 53 x3x4x5 �0.7 �2.815 x2x6 1404.7 �35.1 54 x3x4x6 1.2 34.016 x2x7 �5.3 �1.4 55 x3x4x7 �0.5 3.117 x2x8 �2.8 �0.9 56 x3x5x6 3.5 9.818 x3x4 29.7 5.0 57 x3x5x7 �0.1 �0.719 x3x5 �41.4 �32.6 58 x3x5x8 0.2 �0.520 x3x6 405.4 �7.1 59 x3x6x7 1.8 �2.921 x3x7 �1.2 �9.7 60 x3x6x8 �0.3 022 x3x8 �5.7 �1.2 61 x4x5x6 3.3 7.923 x4x5 205.1 �24.7 62 x4x5x7 �0.3 �6.324 x4x6 47.1 �10.6 63 x4x5x8 �0.1 025 x4x7 18.2 �8.7 64 x4x6x7 �1.2 1.026 x4x8 �3.6 �2.0 65 x4x6x8 2.0 3.127 x1x2x5 �1.8 87.5 66 x1x5
2 �0.6 4.228 x1x2x6 �108.1 183.3 67 x1x6
2 �397.2 �1.929 x1x3x5 0.8 198.5 68 x1x7
2 1.0 � 10�3 030 x1x3x6 3.7 104.0 69 x2x5
2 �0.2 1.731 x1x3x7 4.3 � 10�2 34.5 70 x2x6
2 �232.7 �57.132 x1x3x8 �4.6 � 10�2 �9.4 71 x2x7
2 1.0 � 10�3 033 x1x4x5 �6.3 164.1 72 x3x5
2 0.3 034 x1x4x6 4.8 88.5 73 x3x6
2 �128.9 �15.335 x1x4x7 �0.2 62.7 74 x3x7
2 1.0 � 10�3 036 x1x4x8 0.9 11.9 75 x4x5
2 �2.0 �18.937 x1x5x6 �31.5 �15.2 76 x4x6
2 �44.7 �3.538 x1x5x7 0.1 6.7 77 x4x7
2 �7.2 � 10�3 �7.539 x1x5x8 �0.1 0 78 x1x2x5x6 0.8 65.5
O. Sabbagh et al.: Oil & Gas Science and Technology – Rev. IFP Energies nouvelles 75, 27 (2020)18

Table A4. Comparison of products and steam consumed of the existing and optimized plants.
Parameter Existing NGL plant Optimized integrated plant
NG (kg hr�1) 3 77 092 –
Ethane (kg hr�1) 26 135 32 408Propane (kg hr�1) 40 917 41 144LNG (kg hr�1) – 344,217Ethane/Propane recovery (%mol) 64.72/94.39 80.11/94.92Consumed steam (klb hr�1) 107.57 109.09AR ($ min�1) 1043.65 1958.56
Table A5. Electrical power consumed of added equipments at the optimal conditions.
Equipment Powera (kW) Equipment Power (kW) Equipment Power (kW)
P-WC1 12.72 K-1 3368.49 K-5b �702.79P-WC2 20.17 K-2 9623.12 106-K101c 19 228.52P-WC3 24.86 K-3 43 122.26 Total AC 212.61P-WC4 820.23 K-4 24 567.52 105-P-101d 25.69a Isentropic efficiency of pumps and compressors is equal to 75%.b Current 106-K101 is replaced to this equipment and the presented power is the difference of them.c New equipment that is replaced to current 106-K101.d New equipment that is replaced to current 105-P101 and the presented power is the difference of them.
Table A6. Bare-module cost of added and changed equipments at the optimal conditions.
Equipment BM ($) Equipment BM ($) Equipment BM ($)
AC-1 1 393 200 D-3 299 800 106-K101 (new) 10 146 300AC-2 2 765 800 D-4 220 800 E-1 2 492 300AC-3 2 199 800 D-5 1 366 300 E-2 3 158 400AC-4 3 561 600 D-6 541 800 E-3 2 795 400WC-1 285 000 D-7 867 700 E-4 727 600WC-2 269 400 K-1 15 615 200 E-5 1 042 800WC-3 383 200 K-2 19 923 500 E-6 1 134 100WC-4 7 902 700 K-3A 28 863 100 105-P-101 (new) 132 500D-1 531 500 K-3B 28 863 100 MPHX-1 4 203 400D-2 417 000 K-4 12 406 300 MPHX-2 1 410 800
O. Sabbagh et al.: Oil & Gas Science and Technology – Rev. IFP Energies nouvelles 75, 27 (2020) 19

Table A7. Overall geometry of MPHX-1&2 at the optimal conditions.
Specification MPHX-1 MPHX-2
Number of exchangers in parallel 40 6Number of layers per exchanger 192 (109, 8, 11, 64) 87 (16, 17, 54)Core length (m) 7.6998 4.2938Core width (m) 0.5983 0.5986Core depth (m) 1.7163 0.7818Distributor length – end A (m) 0.4419 0.2369Main heat transfer length (m) 6.9634 3.8439Distributor length – end B (m) 0.2945 0.213Internal (effective) width (m) 0.5753 0.5756Side bar width (m) 0.0115 0.0115Parting sheet thickness (m) 0.0025 0.0025Cap sheet thickness (m) 0.005 0.005Exchanger metal Aluminum AluminumExchanger weight – empty (kg) 521 480.1 19 857Exchanger weight – operating (kg) 593 582.5 22 882.1
O. Sabbagh et al.: Oil & Gas Science and Technology – Rev. IFP Energies nouvelles 75, 27 (2020)20