techno-economic feasibility study of a small-scale biogas ...741758/fulltext01.pdf · master of...
TRANSCRIPT

Master of Science Thesis
KTH School of Industrial Engineering and Management
Energy Technology EGI-2014-083MSC
Division of Energy and Climate
SE-100 44 STOCKHOLM
Techno-economic feasibility study of
a small-scale biogas plant for
treating market waste in the city of
El Alto
Adriana Perez Garcia

Master of Science Thesis EGI 2014:083MSC
Techno-economic feasibility study of a small-
scale biogas plant for treating market waste
in the city of El Alto
Adriana Perez Garcia
Approved
Examiner
Semida Silveira
Supervisor
Dilip Khatiwada
Commissioner
Contact person

I
Abstract
Every day 493 tonnes of waste containing 67% of organic material is generated in the city of El Alto in
Bolivia. The majority of the waste is disposed to a landfill that is expected to reach its maximum capacity by
2015. Therefore, new waste treatment methods need to be explored. The high content of organic material
in waste makes biogas technologies a potential solution for waste treatment in El Alto. These technologies
can generate a renewable energy source and organic fertilizer that can provide several benefits to the city.
The objective of this study is to investigate the techno-economic feasibility of a small-scale biogas plant for
treating organic market waste in the city of El Alto. To this end, a multi-criteria analysis was performed to
identify a suitable technology. The garage-shaped digester was selected as the most appropriate technology
for the conditions of El Alto. By implementing this technology, 1.8 GWh of electricity and 2,340 tonnes of
organic fertilizer can be produced annually. Furthermore, an economic analysis of two scenarios was
conducted. The Net Present Value (NPV), Internal Rate of Return, Payback time, Levelized Cost of
Electricity (LCOE) and sensitivity analysis were evaluated. The biogas plant resulted economically viable in
both cases. However, the LCOE estimated (0.17-0.26 USD/kWh) were very high in comparison to the
LCOE from natural gas in Bolivia (0.026 USD/kWh). Regarding the sensitivity analysis, several parameters
were evaluated from which the compost price was the most influential on changing the NPV. The study
also included the estimation of the emission savings. A total of 900 tonnes of CO2/year could be avoided
for producing electricity from biogas. Moreover, social benefits could also be generated such as new job
opportunities. The use of a small-scale biogas plant for treating organic market waste in the city of El Alto
is a cost-effective option. Though, it is fundamental that the government support the waste-to-biogas
technologies by introducing economic mechanisms and promoting awareness to ensure the markets for
both, biogas and organic fertilizer.
Keywords: Small-scale biogas plant, techno-economic feasibility, emission savings, social benefits.

II
Executive summary
In the city of El Alto, the waste management is regulated by the city’s municipality. The municipality works
together with private concessionary companies that are in charge of collecting, transporting and disposing
the waste. The main waste disposal in the city of El Alto is the Villa Ingenio landfill. This landfill is expected
to reach its maximum capacity by 2015. Therefore, it is necessary to explore other waste treatment methods
to reduce the amount of waste ending to landfill.
The waste generated in El Alto contains a large fraction of organic material (about 67%) that can be suitable
for anaerobic digestion. Several studies have been performed for proposing the implementation of biogas
technologies in Bolivia. However, these studies were focused on treating animal manure and organic fraction
of Municipal Solid Waste at large-scale. This study is focused on investigating the potential of a small-scale
biogas plant for treating organic waste from vegetable and fruit markets in the city of El Alto. A techno-
economic analysis was conducted for this purpose. The study included the selection of a technology that
can suit the local conditions, an economic analysis and the identification of environmental and social
benefits. The analysis was done considering that 10,000 tonnes of biowaste per year will be available from
the markets in the city of El Alto.
The selection of the biogas technology was based in a multi-criteria analysis (MCA) and literature study of
four biogas technologies: the tubular digester, the Chinese dome digester, the Indian floating drum digester
and the garage-shaped digester. Four criteria were evaluated in the analysis: life span, technical knowledge
and skills, physical structure of the digester and investment costs. The results from the MCA showed that
the most appropriate technology for treating the market waste in El Alto was the garage-shaped digester.
Based on the characteristics of this technology, it was determined the biogas potential and the organic
fertilizer production. The biogas production was estimated to be 1,000,000 Nm3 per year from which can
be generated 1.8GWh of electricity per year. The organic fertilizer was calculated based on the mass balance
of the digestate. It was estimated that 2,340 tonnes of organic fertilizer per year can be produced for
commercialization.
The economic analysis was developed considering the characteristics of the selected technology. The
methods used were the NPV, the IRR, the Payback Time and LCOE. The data used in the analysis was
based on a biogas plant of 250 kWel of capacity. Two scenarios were taken into account in the economic
analysis: Scenario I in which the biogas plant is a concessionary company only responsible for treating the
waste and Scenario II in which the biogas plant is a concessionary company on charge of the collection,
transport and treatment of waste. Both scenarios were evaluated with and without carbon credits. The most
attractive option was Scenario II with carbon credits. However, all the cases resulted in positive NPV, IRR
higher than the assumed discount rate of 5% and payback time of about 5 years, which indicates that both
scenarios are economically viable. It has to be mentioned that these results are estimated when electricity
(sold to the grid at a price of 0.09 USD/kWh) and organic fertilizer (sold at price of 140 USD/tonne of
fertilizer) are commercially used for earning revenues.
Regarding the LCOE, it is was estimated a value of 0.17 USD/kWh for Scenario I and 0.26 USD/kWh for
Scenario II. These values are significantly higher in comparison to the current LCOE of natural gas in Bolivia
of 0.026 USD/kWh. The main reason for this difference is because the natural gas is highly subsidized by
the Bolivian government. Thus, implementations of economic mechanisms are necessary to obtain
comparable values. The last part of the economic analysis included a sensitivity analysis. This analysis was
done in order to see how changes in parameters such as investment costs, the electricity price, the compost
price, etc., can affect the NPV. In the analysis, the parameters were evaluated by changing every 10 % from
-50% to 50%. From these parameters, the compost price had the larger impact on the NPV. Furthermore,
the sensitivity results showed that even variations of ±50% resulted in positive NPV, indicating that the
biogas plant can also be feasible having these changes.
The techno-economic analysis also included a brief study of the markets for the anaerobic digestion
byproducts. In this study, the biogas was considered only for electricity generation and the digestate for

III
composting. It was identified that the markets for these byproducts could exist in the city of El Alto if there
is support from the Bolivian government. It is necessary to introduce economic mechanisms such as
investment subsidies, financial loans at low interest rates, feed- in tariffs or increment of the sanitary tariff
in the city of El Alto to ensure the market for electricity generated from biogas. In the case of the organic
fertilizer, there could be the possibility to introduce this product in the market for example by replacing the
imported fertilizers. However, the government also has to intervene to promote and guarantee the use of
the organic fertilizers in the country.
As last point of the study, there were analyzed the environmental and social benefits. The environmental
benefits were evaluated based on the avoided emissions of electricity generation from biogas. It was
estimated that a total of 900 tonnes of CO2 per year could be avoided. Therefore, the implementation of the
biogas plant could lead the city of El Alto to an active contribution for the mitigation of climate change.
The biogas plant could also provide several social benefits to the city. It could help to reduce the dependency
on fossil fuels for electricity generation by providing a new renewable source for energy generation. It can
help to reduce the amount of waste ending to landfill in approximately 6%. It can provide six new job
opportunities for the inhabitants of the city. It could help to promote the production and consumption of
local products by giving the possibility of using the organic fertilizer for soil recovery and agriculture, and
finally it can help to improve the environmental conditions providing a better life environment and sanitary
conditions for the inhabitants of El Alto.
In conclusion, a small-scale biogas plant for treating organic market waste in the city of El Alto could be a
potential generator for green electricity and organic fertilizer production. The biogas plant can achieve cost-
recovery in El Alto if markets for the byproducts are ensured. It is necessary that government and
municipalities support the waste to biogas technologies by implementing subsidies, awareness promotion
and other economic mechanisms. The implementation of a small-scale biogas plant can provide the city of
El Alto not only with economic profits but also environmental and social benefits.

IV
Acknowledgements
I would like to express my special appreciation to my father, mother and brother for the emotional support
and love during my master studies in Sweden.
In addition, my sincere gratitude is to my supervisor Dilip Khatiwada for the useful comments and guidance
in the learning process of my master thesis.
And finally my deepest appreciation to the Swedish Institute which provided me with a study scholarship
and unforgettable experiences during my stay in Sweden.

V
List of acronyms
AD- Anaerobic Digestion
BMP - Biochemical Methane Potential
Bs.-Boliviano, Bolivian currency. 1Bs.=6.9 USD.
CC- Carbon Credits
CPTS - Centro de Promocion de Technologias Sostenibles, Centre for Promotion of Sustainable Technologies,
Bolivia
DM- Dry matter
EMALT- Empresa Municipal de Aseo El Alto, Municipal Company for Waste Management and cleaning
operating in El Alto
GAMLP- Autonomous Municipal Government of El Alto
GHG- Green House Gases
INE- National Statistics Institute
KTH - Royal Institute of Technology
kWh- Kilowatt hour
LCOE-Levelized Cost of Electricity
MSW- Municipal Solid Waste
NPV - Net Present Value
OFMSW - Organic Fraction of the Municipal Solid Waste
PB – Payback time
TREBOL - Private waste management company for collection and transport in El Alto
USD - US currency
WABB - Waste to Biogas in Bolivia – Promoting Sustainable Development
YPFB -Yacimientos Petrolíferos Fiscales Bolivianos

Table of Contents
Abstract ........................................................................................................................................................................... I
Executive summary ......................................................................................................................................................II
Acknowledgements .................................................................................................................................................... IV
List of acronyms ........................................................................................................................................................... V
1 Introduction .......................................................................................................................................................... 1
1.1 Background ......................................................................................................................................................... 3
1.2 Objectives ............................................................................................................................................................ 6
1.3 Research questions ............................................................................................................................................. 6
1.4 Scope and Limitation of the study .................................................................................................................. 6
1.5 Structure of the thesis ........................................................................................................................................ 7
2 Generation and characterization of waste in El Alto ..................................................................................... 8
3 State-of-the-art systems in Anaerobic Digestion.......................................................................................... 12
3.1 Anaerobic digestion process ........................................................................................................................... 12
3.2 Process parameters .......................................................................................................................................... 13
3.3 Operational and design parameters ............................................................................................................... 14
3.4 Feedstock ........................................................................................................................................................... 15
3.5 Products ............................................................................................................................................................. 15
3.6 AD Technologies ............................................................................................................................................. 16
4 Methodology ...................................................................................................................................................... 22
4.1 Determining the AD technology ................................................................................................................... 22
4.2 Biogas and organic fertilizer potential .......................................................................................................... 23
4.3 Economic Analysis .......................................................................................................................................... 25
4.4 Environmental benefits ................................................................................................................................... 26
4.5 Social Benefits ................................................................................................................................................... 27
5 Results and Discussion ..................................................................................................................................... 28
5.1 AD technology selection ................................................................................................................................. 28
5.2 Biogas and organic fertilizer ........................................................................................................................... 32
5.3 Techno-economic analysis .............................................................................................................................. 34
5.4 Markets for AD byproducts in El Alto ........................................................................................................ 41
5.5 Avoided Emissions .......................................................................................................................................... 42
5.6 Social Benefits ................................................................................................................................................... 43
6 Conclusion .......................................................................................................................................................... 45
7 Bibliography ....................................................................................................................................................... 47
Appendix ......................................................................................................................................................................... 1
Appendix A-1 Cash Flows Scenario I with Carbon Credits .................................................................................... i

Appendix A-2 Cash Flows Scenario I without Carbon Credits ............................................................................. ii
Appendix A-3 LCOE Scenario I................................................................................................................................ iii
Appendix B-1 Cash flow Scenario II with Carbon Credits ...................................................................................iv
Appendix B-2 Cash flow Scenario II without Carbon Credits .............................................................................. v
Appendix B-3 LCOE Scenario II ..............................................................................................................................vi

List of Figures Figure 1.1 Sources and products of the waste to biogas AD plant ...................................................................... 2
Figure 1.2 El Alto satellite view ................................................................................................................................. 4
Figure 1.3 Villa Ingenio landfill satellite view .......................................................................................................... 4
Figure 1.4 Recycling point in the city of El Alto ...................................................................................................... 5
Figure 1.5 The boundary of the study ........................................................................................................................ 7
Figure 1.6 Layout of the report ................................................................................................................................... 7
Figure 2.1 Waste generation in El Alto in tons and percentages per day ............................................................. 8
Figure 2.2 Average waste generated per year by source in the city of La Paz ..................................................... 9
Figure 2.3 Average composition of organic waste in the city of El Alto ........................................................... 10
Figure 3.1 Anaerobic digestion process stages ....................................................................................................... 12
Figure 3.2 Tubular digester diagram ......................................................................................................................... 17
Figure 3.3 Chinese dome digester ............................................................................................................................ 19
Figure 3.4 Indian floating drum digester ................................................................................................................. 20
Figure 3.5 Garage-shape biogas plant ...................................................................................................................... 21
Figure 5.1 Biogas production for different feedstock and biogas yield .............................................................. 33
Figure 5.2 Biogas and organic fertilizer balance results ......................................................................................... 34
Figure 5.3 Income distribution of Scenario I and Scenario II.............................................................................. 38
Figure 5.4 Sensitivity Analysis ................................................................................................................................... 40
List of Tables
Table 1.1 Sanitary Fees included in the electricity bill ............................................................................................. 5
Table 2.1 Physical composition of the organic waste from market Rodriguez in La Paz ............................... 10
Table 2.2 Chemical parameters of organic waste in markets and households................................................... 11
Table 3.1 Biogas composition ................................................................................................................................... 16
Table 3.2 Tubular digester investment costs ........................................................................................................... 18
Table 3.3 Dome digester's investment costs ........................................................................................................... 19
Table 4.1 Performance matrix of the MCA ............................................................................................................ 22
Table 5.1 Required maintenance of the digesters ................................................................................................... 28
Table 5.2 Lifespan of AD digesters .......................................................................................................................... 29
Table 5.3 Technical knowledge and skills of biogas technologies ....................................................................... 29
Table 5.4 Physical structure of digesters .................................................................................................................. 30
Table 5.5 Digester’s MCA performance matrix...................................................................................................... 31
Table 5.6 Biogas results .............................................................................................................................................. 32
Table 5.7 Organic fertilizer production .................................................................................................................. 34
Table 5.8 Investment costs in USD .......................................................................................................................... 35
Table 5.9 O&M and Transportation costs .............................................................................................................. 36
Table 5.10 Data used for income calculations ........................................................................................................ 36
Table 5.11 Description of scenarios ......................................................................................................................... 37
Table 5.12 Investment, O&M and transport costs for a 250 kWel plant ........................................................... 37
Table 5.13 Incomes of Scenario I and Scenario II ................................................................................................. 38
Table 5.14 Economic analysis results ....................................................................................................................... 39
Table 5.15 LCOE results ............................................................................................................................................ 39

1 Introduction
Developing countries lack of suitable waste treatment methods and safe disposal systems. The rapid
population growth has increased the demand for collection, transport and disposal of Municipal Solid Waste
(MSW). For this reason, municipalities and institutions are not able to totally cover these services in the
cities. Waste management in developing countries is not a priority for municipalities, since other needs have
to be satisfied first (1). However, social and economic conflicts as well as environmental impacts are caused
due to inappropriate waste management.
The main drivers for improving waste management are public health and climate change. Public health is
one of the main issues connected to improper waste handling in low-income countries (1). The deficient
waste disposal systems are responsible for spreading diseases and pests having a direct impact on human
health. Furthermore, improper waste disposal can generate odors and affect negatively the aesthetics of the
city. Regarding climate change, it is a worldwide concern and it is mainly caused by Greenhouse Gas (GHG)
emissions from combustion of fossil fuels (1). Improving the waste management systems can contribute to
the mitigation of this impact.
In low and middle-income countries the organic fraction of MSW represents more than the 50% of the total
waste generated (2). For this reason, waste to biogas technologies can be an attractive option for treating
the waste. Biogas technologies can help to reduce the amount of waste, generate a renewable energy source,
reduce the GHG emissions and improve the living conditions in developing countries. There are two waste
to biogas technologies: landfill and anaerobic digestion. These methods are briefly described in the following
sections.
Landfill
Landfill is an old and a common treatment method for disposing waste. This disposal system can create
significant environmental impacts under unregulated conditions. In the last decade, the number of active
landfills has been reducing in developed countries. For example, Sweden has had a reduction from 350 to
85 landfills in the past ten years (4). In contrast, in low and middle-income countries open dump landfills
are still commonly used for disposing waste. However, improvements to have sanitary landfills have been
doing in some developing countries (5).
The advantages and disadvantages of landfill systems depend on the conditions and engineering of the
landfill. One advantage of properly designed landfill systems is the active extraction of landfill gas. The
landfill gas is produced from the decomposition of the organic material contained in the landfill. The landfill
gas can be used in energy generation, but the collection efficiency is rather low (approximately 50 % or less)
(6). The landfill gas is in its majority generated in the first 15 to 25 years, and under optimal conditions the
main fraction of the landfill gas can be extracted during the first 3 to 10 years (4). Other advantage of
landfilling waste is the reuse of land. If the landfill has been regulated, it can be used for parks or other
purposes after its closure.
On the other hand, landfilling the waste has disadvantages such as environmental impacts and the use of
large areas for the landfill site. Since the waste has different components, several environmental impacts can
be generated due to toxic substances contained in the leachate and the emissions of gaseous compounds.
Leachate can be responsible for eutrophication and can have toxic effects on different organisms due to the
large content of noxious metals and persistent organic compounds. Therefore, the leachate collected from
landfill needs further treatment. Emissions of gaseous organic compounds such as methane, ammonia and
hydrogen sulphide can also be released from the landfill being toxic for the environment. Furthermore, large
areas are required for landfilling the waste, since the material that ends to landfill is just compacted but not
reduce in mass. Moreover if the landfill is not regulated, other problems are generated such pests, odors and
flying pieces of waste material that contaminate the environment (4).

2
The compounds released to the environment depend on three main aspects: waste characteristics, site
selection and landfilling techniques. The waste composition affects directly to the content of compounds
contained in the leachate or gaseous compounds. The site selection influences in the leachate generation
and its route. The site selection can determine the risk of polluting surface water or ground water (4). The
landfilling techniques are based in the regulations from the Council Directive on Landfills 1999/31/EC (4).
For instance in the EU, the waste categories (Class 1 hazardous waste, Class 2 non-hazardous waste, Class
3 inert waste) should be land filled separately after passing through their respective pretreatment.
Additionally, no liquid waste and organic waste should be land filled.
Regarding the structure of landfill, it consists of several layers. The landfill is built in a sequence of horizontal
cells. Each cell consists in compacted waste of 1.3 to 5 m height followed by an intermediate layer of 0.1-
0.5 m of inert material. This structure allows having a good control and maintenance of the landfill site and
moreover it reduces the amount of leachate. Furthermore, landfills need a solid foundation in order to avoid
releasing of pollutants. This foundation contains a drainage layer for transporting water and installing
drainpipes for leachate collection. Once the landfill has reached its maximum capacity, it is covered by a top
layer.
Anaerobic digestion
Anaerobic digestion (AD) is the process of degradation of organic matter in absence of oxygen (4).
Anaerobic digestion is suitable for treating different feedstock such as animal manure, agricultural waste and
organic fraction of MSW. The main products of the process are the biogas and the digestate. Biogas mainly
consists in methane and carbon dioxide in proportions of about 60% to 40% respectively and it can be used
for energy generation. The digestate can be utilized for different purposes. Depending on its characteristics,
it can be used for energy generation by incineration, be disposed in landfill or be used as fertilizer (6).
The anaerobic digestion stabilizes, disinfects and deodorizes the waste. During the process, several
microorganisms take part in the degradation. The complex compounds of the organic matter are degraded
into simple compounds in order to finally obtain methane and carbon dioxide. The anaerobic digestion
consists in four stages: hydrolysis, acidogenesis, acetogenesis and methanogenesis. The methane formation
occurs in its majority in the last stage of the process (6).
The final characteristics of the AD products depend on the several aspects: the properties of the waste,
process parameters, and characteristics and design of the digester. These aspects should be evaluated before
implementing the biogas system in order to determine the products’ potential and the conditions for having
an efficient process. Figure 1.1 illustrates the waste to biogas and organic fertilizer production chain.
Figure 1.1 Sources and products of the waste to biogas AD plant Source: Based on (6)

3
Biogas technologies in developing countries
Both waste management methods, landfill and anaerobic digestion, have been implemented in developed
and developing countries (7). However, this study will be focused on anaerobic digestion at small-scale for
the city of El Alto in Bolivia. For this reason, it will be given a brief introduction of the implementation of
this technology in developing countries. It has to be noticed that in this study, the term small-scale biogas
plant is referred to a plant with electric capacity of less or equal to 250 kWel (8).
In low and medium-income countries, small-scale biogas systems have been implemented for treating waste
from households, animal manure, organic waste fraction of MSW and agricultural waste. Technologies such
as the tubular digester, the dome digester and the floating drum digester have been installed. For example
by 2003, Nepal had around 260,000 household digesters implemented to treat agricultural waste, manure
and organic waste. (7). Other countries such as China, India, Bangladesh, Mexico and Indonesia have also
been using these technologies (7; 9; 10). Biogas technologies have provided a new fuel option for cooking,
lighting or cooling.
Furthermore, several studies concerning small-biogas production from animal manure in the Peruvian and
Bolivian Andes have been conducted. In this region, tubular digesters for treating llama, sheep, guinea pig
and caw manure are a common and a known technology. The biogas produced is mainly used for cooking,
but in some cases it is also used for lighting. This has replaced the use of firewood, air dried manure and
agricultural residues for energy production (11).
Anaerobic digestion has been proved and adapted to the conditions in different countries. Many benefits
have been identified from utilizing this technology such as reduction of GHG emissions, reduction on
dependence on fossil fuels, reduction of waste volume, energy generation and addition of economic value
to waste (7). How to determine which AD technology to use depends on the composition, properties and
availability of waste to be treated as well as the economic factors.
This study will be focused on determining the potential of a small-scale biogas plant for treating organic
waste from vegetable and fruit markets in the city of El Alto, located in the department of La Paz, Bolivia.
The potential of the biogas plant will be determined based on a techno-economic study. The techno-
economic analysis consists in the selection of a technology, the development of an economic feasibility study
based on the technology selected and the determination of the possible environmental and social benefits.
1.1 Background
As the study is focused in the city of El Alto, it is important to introduce the current situation in this location
concerning the general characteristics and the waste management practices.
General characteristics of El Alto
El Alto is located in the province Murillo of the department of La Paz, Bolivia. It is divided in 14 districts
and about 880 zones (12). El Alto is at approximately 4,150 meters above the sea level. The city is part of
the Bolivian high plateau (‘El Altiplano’) where in average the maximum temperature reaches 14.88 °C and
the minimum 0.61°C (13). The population of El Alto is approximately 1,000,000 inhabitants with a growth
rate of 5% (14). Figure 1.2 shows the satellite view of the city of El Alto. The white borders illustrates the
geographical limits of the city.

4
Figure 1.2 El Alto satellite view Source: (15)
Waste Management in Bolivia and El Alto
The waste management systems in Bolivia are regulated for each city’s Municipality. The Municipalities work
together with concessionary private companies. These companies are in charge of collecting, controlling and
transporting the waste to their final disposal. The common waste disposals in Bolivia are regulated and semi-
regulated landfills, but uncontrolled dumping areas still exist in the country (16).
The operations of control, regulation and supervision of waste in El Alto are on charge of the municipal
entity EMALT. This entity supervises the activities of the private concessionary companies TREBOL,
TERSA and COLINA. Furthermore, EMALT supports the development of environmental and waste
management projects (14).
The private company TREBOL is responsible for cleaning, collection and transport of waste in the city of
El Alto. The final disposal of waste in El Alto is the landfill of Villa Ingenio which is operated by the
company COLINA. This landfill has one area in operation (about 4 hectares) and one area in process of
closure. See Figure 1.3. The landfill has a passive extraction for capturing biogas. The biogas extracted is
flared without any energy recovery. It is estimated that the Villa Ingenio landfill will reach its maximum
capacity by 2015 (14). Therefore, new waste disposal and treatment systems should be explored.
Figure 1.3 Villa Ingenio landfill satellite view Source: (17)
The costs for the companies on charge of the collection, transport and disposal of waste are subsidized by
the municipality. This subsidy covers 70 % of the costs and the rest 30% is covered by the sanitary tariff
Active Disposal
Area: 4 hectares
Area in closure

5
paid by the consumers of electricity (17). The sanitary fee is included in the electricity bill and it varies
depending on the electricity consumption per month. The sanitary fee per electricity consumption can be
seen in Table 1.1.
Table 1.1 Sanitary Fees included in the electricity bill
Consumption [kWh/month] Fee [USD]
0-50 0.14
51-100 0.36
101-200 0.72
201-300 1.16
301- more 1.74
Source: (17)
Regarding waste recycling in El Alto, formal and informal recycling points can be found in the city where
people can sell glass, paper, plastics, cardboard and aluminum. Figure 1.4 illustrates one of this collection
points. These materials are then re-sell to other recycling companies to be processed. In the case of
hazardous waste, it is collected from health centers and disposed in special cells in Villa Ingenio landfill (14).
Figure 1.4 Recycling point in the city of El Alto Source: (17)
Furthermore, part of the organic waste generated in the markets is used for worm culture treatment.
Recently, a pilot composting plant was installed in the city of El Alto. The plant aims at producing 70 tons
of compost per month by treating vegetable and fruit waste from the market Villa Tunari (18). This shows
the interest from the Municipality to implement new waste treatment systems in the city.
Regarding biogas technologies, around 300 families have implemented plastic tubular digesters in El Alto
(19), and in Bolivia around 2,000 units have been installed since 2002 (20). Furthermore, proposals for
implementation of tubular digesters and dome digesters in Bolivia have been presented in the last years.
These studies are focused on the rural area and for treatment of animal manure. Studies for co-digestion of
waste from slaughterhouses and market waste by anaerobic digestion are also available but they have not
been implemented yet (21).
Moreover, studies for treating MSW with anaerobic digestion have been done under the project Waste to
Biogas in Bolivia-Promoting Sustainable Development (WABB1). The WABB project began in November 2011 with
1 The project is being developed by the Division of Energy and Climate of the KTH Royal Institute of Technology in collaboration with the Bolivian organizations CPTS and GAMLP, and the Swedish partners Mälardalen University and the VafabMiljö. Besides, the project is being developed with the financial support from the Nordic Climate Facility, the Nordic Development Fund and the Nordic Environment Finance Cooperation (14)

6
the purpose of developing a strategy for the generation of renewable energy (biogas) from organic waste in
the cities of La Paz and El Alto. The studies Waste to Biogas in Bolivia Techno-economic feasibility study Final Report
(D8) and Draft Report (D6): Waste management and characterization in La Paz and El Alto are important literature
sourcea for this study case. This thesis will be based on information from these studies.
Importance of the study
Waste management methods need to be explored in the city of El Alto, since the main waste disposal system,
the landfill of Villa Ingenio, is expected to reach its maximum capacity by 2015. As mentioned before, several
studies have been conducted for improving the waste management in the city of El Alto. However, these
studies were focused on treating animal manure and organic fraction of MSW at large-scale. Studies
concerning the treatment of only market waste at small-scale have not been conducted yet. It is necessary
to make a deeper study and explore the potential for producing biogas from vegetable and fruit waste of the
markets in the city El Alto. This thesis aims at covering this point.
This study is important since it will help to find an option for reducing the waste ending to landfill and also
to improve the conditions of the city of El Alto. The implementation of biogas plants could lead the city
towards sustainable development by reducing the dependence on fossil fuels, reducing GHG emissions and
providing a better environment for the inhabitants. Moreover, treating organic waste by biogas digesters can
generate energy and services, creating new income for the city and helping to reduce social and
environmental problems (7).
1.2 Objectives
The general objective of this study is to scrutinize the techno-economic feasibility of a small-scale biogas
plant for treating organic market waste in the city of El Alto, Bolivia.
To achieve the general objective, the following sub-objectives are presented:
i. Evaluate the potential small-scale biogas technologies for treating organic market waste in El Alto.
ii. Investigate the economic feasibility of a small-scale biogas plant for handling organic market waste
in the city of El Alto.
iii. Analyze the possible direct benefits that can be obtained from a small-scale biogas plant in the city
of El Alto.
1.3 Research questions
The objectives presented above lead to the formulation of the following research questions. These questions
are the main focus of this study.
1. What is the most appropriate small-scale biogas technology for treating organic market waste in the
city of El Alto?
2. Is the small-scale biogas plant economically viable for being implemented in the city El Alto?
3. What are the direct economic, social and environmental benefits that the small-scale biogas plant
can provide to the city?
1.4 Scope and Limitation of the study
This study is limited to the treatment of organic waste generated from the vegetable and fruit markets in the
city of El Alto. The biogas produced from the AD process is assumed to be used only for electricity
generation and the digestate for composting. The investment costs, operation and maintenance costs
including the transport of organic waste from the markets to the biogas plant are included in the analysis.
The costs for external distribution of electricity and compost are not taken into consideration in the study.
Figure 1.5 shows the outline of AD process, including the scope of the study. This includes transportation
of organic wastes from vegetable markets, processing of the feedstock for biogas and digestate production,
electricity generation and composting.

7
Figure 1.5 The boundary of the study
Note: The red border shows the scope of the study.
1.5 Structure of the thesis
This report is structured in seven chapters. Chapter 1 contains the introduction, background, objectives,
research questions, the scope and limitation of the study, and structure of the thesis. Chapter 2 introduces
the waste characterization and waste generation in the city of El Alto. Chapter 3 describes in detail the
anaerobic digestion treatment including the important parameters of the process, the feedstock and the AD
technologies. Chapter 4 presents the methodology selected for developing this study which is divided in five
sections: determining the AD technology, biogas and organic fertilizer potential, economic analysis,
environmental analysis, and social benefits. Chapter 5 presents the results and the discussion regarding the
technology selection, the biogas and organic fertilizer, the techno-economic analysis, the markets for the
AD byproducts in El Alto, the avoided environmental emissions, and the social benefits. Chapter 6 contains
the conclusions and the suggestions for further studies, and Chapter 7 the bibliography.
The layout of the report can be seen in Figure 1.6.
Figure 1.6 Layout of the report

8
2 Generation and characterization of waste in El Alto
In this chapter is described the waste generation and availability of organic waste from markets in the city
of El Alto. It is also presented the physical characteristics of a sample of fruit and vegetable waste and the
chemical properties of the organic waste.
Generation of waste in El Alto
The average solid waste generation per capita in the city of El Alto is approximately 0.38 kg per day. Every
day a total of 493 tonnes of waste is generated containing 67.4 % of organic waste, 9.8 % of plastic, 5.5 %
of paper and cardboard, 1.9 % of glass, 1.8% of metals and 13.6 % of other materials (12). Figure 2.1
illustrates this distribution in tonnes and percentages according to the waste type.
Figure 2.1 Waste generation in El Alto in tons and percentages per day Source: (12)
In the city of El Alto, 332 tonnes per day of organic waste is collected which represents the largest fraction
of the total waste (12). From this amount, approximately 82 % of organic material is household waste (14).
The rest of the organic waste, about 60 tonnes, is generated by other sources such as markets, industries
and slaughterhouses.
Information about the specific amounts of waste generated from the vegetable and fruit markets in the city
of El Alto was not found in literature. However, information from the city of La Paz was found and could
be used as an indicator for the city of El Alto since both cities, La Paz and El Alto, have similar characteristics
about population, waste generation and waste management systems. The population in these cities is
approximately 1,000,000 inhabitants per city. The waste generated per capita in El Alto and La Paz is
estimated to be 0.281 kg 0.378 kg of biowaste per day respectively. Moreover, the total shared of organics
in is near 66% in El Alto and 50 % in La Paz (23). Regarding the waste management, both cities work based
on concessionary companies that work together with the municipalities. Different private concessionary
companies are on charge of the collection, transport and treatment of waste. In both cases, the majority of
the waste is landfilled.
Figure 2.2 illustrates the waste distribution by source in the city of La Paz. The values are presented in tonnes
of waste per year and percentages. The data are taken from the National Statistics Institute of Bolivia for
the period 2003 to 2011. Figure 2.2 shows that the main waste generators in La Paz are the households
representing 79% of the total waste. The rest 21% is waste from markets, other sources (industry and
slaughterhouses), public areas and health centers.
33267.40%
489.80%
275.50%
91.90%
91.80%
6713.60%
Organic material
Plastic
Paper and carboard
Glass
Metals
Others

9
Figure 2.2 Average waste generated per year by source in the city of La Paz2 Source: (24)
Waste availability from vegetable and fruit markets in El Alto
As mentioned before, information from La Paz was used as an indicator to estimate the amount of organic
waste generated in the markets. A waste characterization study of the main market of La Paz, ‘Mercado
Rodriguez’, identified that about 8 tonnes/day were collected from the market from Tuesday to Friday and
16 tonnes per day on Mondays. This amount was collected per truck, and five trucks were available for this
task. Approximately a total of 30 tonnes/day of organic matter were generated in the markets in the city of
La Paz in 2004 (25).
If the 30 tonnes per day are used to calculate the annual amount of organic waste from the markets, the
result is comparable to the value presented in Figure 2.2. For this reason, it will be assumed that 7% of the
total waste generated in El Alto is market waste. This percentage represents approximately 34.5 tonnes per
day of the total 493 tonnes of waste generated in the city. By considering 95% of organic matter in waste,
the total organic waste from markets in El Alto is estimated to be 32.8 tonnes per day.
In this techno-economic study, it will be assumed that 10,000 tonnes per year of organic waste will be
collected from markets in El Alto. This value represents approximately 85 % of the total organic market
waste available from per year. This percentage was assumed due to two reasons: the first one is that the rest
15% of waste is considered to be treated in the worm culture plant and the second reason is the technology’s
capacity. The treatment of 10,000 tonnes of biowaste per year was found to be common for small-scale
plants in the literature reviewed (26; 8).
Physical composition of the organic waste
The physical composition of the substrate is an important aspect to take into consideration when analyzing
biogas technologies. The physical composition of solid waste provides data for studying the chemical
composition of the substrate (14). Figure 2.3 shows the average physical composition of organic waste
generated in the city of El Alto. It can be seen that the largest fraction of the waste comes from the peelings
(52.83%) follow by the food leftovers (36.72%) and impurities. The fraction of impurities in the figure
includes metals, glass, plastic and others.
It should be noticed that the waste composition from Figure 2.3 is from the document Draft Report (D6):
Waste management and characterization in La Paz and El Alto, in which the waste characterization study was done
from the households in the city of El Alto. This means that the composition of waste in the markets is
probably different.
2 Data taken from the National Statistics Institute of Bolivia. The values presented are average values from the year 2003 to 2011.
120,94579%
8,1575%
10,6937%
2,8582%
10,9267%
Household
Public Areas
Markets
Health Centers
Others

10
Figure 2.3 Average composition of organic waste in the city of El Alto3 Source: (23)
An example of the waste composition from the markets in La Paz is presented in Table 2.1. The data pertain
to a sample of organic waste consisting in fruits and vegetables. It can be seen that the largest percentage in
the sample comes from the oranges and onions which could influence by lowering the pH of the substrate
mass.
Table 2.1 Physical composition of the organic waste from market Rodriguez in La Paz
Name sample [wt %] Name sample [wt %]
Pumpkin (peeling and seeds) 5.15 Turnip 0.88
Eggplant 6.2 Radish 0.64
Tomato 5.84 Potato 2.74
Lettuce 0.92 Watermelon 0.88
Calabash 6.26 Lemons 1.5
Carrot 2.34 Gray fruit 6.8
Onion 11.5 Pineapple peeling 1.5
Chili 3.79 Oranges 21.6
Red Pepper 7.66 Banana 2.23
Green and fava beans peelings 0.72 Source: (25)
Chemical parameters
The chemical parameters are important to determine the biogas process and the characteristics of the
digestate. Table 2.2 presents examples of the main parameters of the substrate studied. The data was found
in literature regarding organic waste from markets in Bolivia, Mexico and Indonesia and household waste
from Bolivia and Sweden. It can be observed that most of the values of the chemical parameters from the
markets are similar to the values from the parameters of the household waste.
3 The values are based on a weighted mean value.
52.38%
2.25%0.38%
36.72%
5.86%
0.93% 1.48%Peelings
Meat and fishbone, prawnsand crayfish shells
Paper towels and napkins
Food leftovers
Impurities
Garden waste
Bread, biscuits, cakes, coffeeand tea filters

11
Table 2.2 Chemical parameters of organic waste in markets and households
Parameter Unit Markets Household
El Alto Household
Sweden Source
pH - 4.9-7.25 6.83 4.5 (21), (10)
Dry matter [%] 14-16.81 20.8 30 (21), (10), (9) (14)
Nitrogen [%DM] 2.1 3.82 2.1 (21)
Ashes [%DM] 14 4.87 13 (21), (14)
P [%DM] 0.31 0.45 0.39 (21), (10), (14)
Na [%DM] 0.27 - - (21)
K [%DM] 0.63-2.7 2.93 0.91 (21), (10), (14)
Ca [%DM] 0.91 2.67 1.8 (21), (14)

12
3 State-of-the-art systems in Anaerobic Digestion
As mention in Chapter 1, this study is focused on anaerobic digestion of organic material from vegetable
and fruit markets in the city of El Alto. This chapter aims at describing the anaerobic digestion process, the
important process parameters, the feedstock suitable for this treatment method, the byproducts and the
technologies used in anaerobic digestion.
3.1 Anaerobic digestion process
Anaerobic digestion (AD) or biomethanation is a process in absence of oxygen where organic matter is
decomposed by microbiological activity. Anaerobic digestion is suitable for treating different feedstock such
as animal manure, MSW and agricultural waste. This treatment process consists of four stages: hydrolysis,
acidogenesis, acetogenesis and methanogenesis. At each stage, specific microorganisms are on charge of
decomposing complex molecules from the organic matter into simple molecules, giving as final products:
biogas and digestate (27). Figure 3.1 shows the elements involved at each stage of the AD process.
Figure 3.1 Anaerobic digestion process stages Source: (27)
The following section presents a description of the AD process stages. It includes information of the
organisms involved and the main products of each stage.
Hydrolysis
Hydrolysis is the first stage of the anaerobic digestion process where polymers (complex molecules) of the
substrate are decomposed into mono and oligomers (small molecules). In other words during hydrolysis,
carbohydrates, proteins and lipids are decomposed into glucose, glycerol, purines and pyridines (27).
Several microorganisms known as facultative anaerobes are involved in the hydrolysis stage (6). These
microorganisms produce different exoenzymes that help to decompose the complex molecules of the
substrate. For example, the lipase enzyme is responsible for breaking and splitting the chemical bonds of
lipids to produce fatty acids and glycerol (27). The time for the hydrolysis varies depending on the
characteristics of the compound. For instance, decomposition of cellulose and hemicellulose can take more
time in comparison to decomposition of proteins (28).

13
Acidogenesis
The acidogenesis process or acid forming stage consists in the degradation of sugars, amino acids and fatty
acids (products from the hydrolysis) into methanogenic substrates (acetic acid, carbon dioxide and
hydrogen) by fermentative bacteria also known as acidogenic bacteria (27). The major products from this
stage are organic acids, e.g. acetic acid, butyric acid and propionic acid, alcohols, ammonia, carbon dioxide
and hydrogen (28).
Acetogenesis
From the last stage, some products cannot be converted to methanogenic substrates such as volatile fatty
acids and alcohols. Acetogenic bacteria have the function of oxidizing these large compounds to obtain
acetic acid, carbon dioxide and hydrogen. At this stage, both acetogenic and methanogenic bacteria are active
in the anaerobic digestion process (27).
Methanogenesis
Methagonesis is the main methane formation stage of the anaerobic digestion and the slower biochemical
reaction. This stage is on charge of methanogenic bacteria which converts the acetic acid into methane and
carbon dioxide, and the hydrogen and carbon dioxide into methane and water. Approximately 70% of the
methane produced comes from the acetates and the rest 30% is originated from the conversion of carbon
dioxide and hydrogen (27). This process is critical influenced by the digestion conditions, thus it is important
to have a controlled AD process in order to have good results.
3.2 Process parameters
Several parameters influence on the potential of methane production. As explained in the last sub-chapter,
different microorganisms are involved in the process of anaerobic digestion and they require certain
conditions to growth. The main parameters in the AD process and their importance are presented in this
section.
Temperature
The biomethanation process can occur at different temperature ranges: between 25-42°C known as the
mesophilic range, between 43-55 °C thermophilic range and at temperature below 20°C psychrophilic range
(27). At mesophilic temperatures the anaerobic digestion process is more stable than at thermophilic and
psychrophilic conditions due to at this temperature range the anaerobic bacteria are more tolerant to changes
in the environment (2).
Temperature has direct relation with the Hydraulic Retention Time (HRT). At low temperatures, the
methane production takes longer than at high temperatures. The methane rate production decreases under
temperatures below 35°C because of the slow degradation of organic matter (27). At high altitude, the
anaerobic digestion process takes place at psychrophilic conditions requiring long retention times over 55
days. In contrast, the positive aspect of having the process at low temperatures is the low ammonia toxicity
(11).
Furthermore, the temperature influences directly in the efficiency of the AD process and therefore it should
be kept constant to have an efficient process. A rapid variation in the temperature may cause up to 30% of
gas yield loss or discontinue the process (29).
pH
The acidity or alkalinity of solutions is measure by the pH. This parameter influences on the growth of
methanogenic bacteria and thus on the methane production. The optimum pH value for the anaerobic
digestion process is the range of 6.5-7.5 (2). The pH is a determining parameter for AD because at low pH
values the methane formation is inhibited. When the pH value is low, it can be regulated by the addition of
lime or sodium carbonate. However, this can represents additional costs for the AD process.

14
Pressure
In the AD process, pressure is the mixing power which influences the gas recirculation especially for
technologies lacking mixing systems. An increment in pressure during the AD process leads to high carbon
dioxide concentrations in liquid phase. Carbon dioxide has a high solubility in comparison to methane. The
solubility of carbon dioxide is approximately 40 times more than methane. For this reason, an increase of
pressure can result in high concentration of CO2 in the substrate stimulating the methane production.
Additionally, an increase in the partial CO2 pressure decreases the pH value lowering the non-ionized
ammonia concentration. On the other hand, a decrease in the partial CO2 partial pressure increases the pH
level lowering the non-ionized hydrogen sulphide concentration (11).
The partial pressure of hydrogen is also a relevant parameter for the AD process. The partial pressure of
hydrogen should be low enough to offer a balanced environment for methanogenic and acetogenic bacteria.
Methanogenic bacteria consume hydrogen in order to produce methane, so it is important to have
availability of hydrogen during the AD process. On the other hand, acetogenic bacteria produce hydrogen
thus the hydrogen’s partial pressure should be low enough to give space to the hydrogen molecules produced
by the acetogenic bacteria (29).
Toxic compounds
The formation of toxic compounds is dependent on the pH and composition of the substrate. Ammonia,
sulfides and volatile fatty acids are present in substrates containing significant amount of carbohydrates and
lipids. The effects of these compounds can cause inhibition in bacteria growth and methane production.
Ammonia is toxic for the AD bacteria at pH higher than 7 and hydrogen sulfide and volatile fatty acids are
toxic at pH below 7. Other toxic compounds are the heavy metals, but often they are present in low
concentration rates (29).
3.3 Operational and design parameters
There are two operational and design parameters to be considered for the anaerobic digestion. The hydraulic
retention time (HRT) and the organic loading rate (OLR). These are described in the text sections.
Hydraulic Residence Time (HRT)
HRT is the average time interval at which the substrate is been kept in the reactor. This parameter is relevant
for determining the dimensions of the digester since it relates the digester volume with the flow rate of
feedstock fed per time unit (2). The HRT value decreases when the organic load is increased. The HRT
should be long enough to guarantee the availability of microorganisms in the substrate. This means that the
amount of microorganisms removed in the digestate does not have to be bigger than the amount of
reproduced organisms. A stable fermentation at long retention times results in higher methane yield and a
volatile solids reduction (27).
In cold regions where the anaerobic digestion process is conducted at psycrophilic range, a long HRT is
needed. Studies in the Andean Plateau have shown that 55-100 days of HRT are required for producing
biogas from animal manure (11). However, the degradation’s velocity varies depending on the characteristics
of the feedstock.
Organic Loading Rate (OLR)
The OLR indicates the amount of organic dry matter (DM) that can be fed into the digester per volume and
time unit (27). Several factors influence in the determination of the OLR such as the type of digester, the
substrate and the temperature. The microorganisms have to adapt to the rate load, thus it is important to
determine the optimum frequency of loading the digester. At high altitude where the reactor operates at low
pressure, e.g. 4,000 m.a.s.l. and 65.8 kPa, the organic loading rate can be higher in comparison to reactors
at sea level (101.3 kPa) due to their buffer capacity is stronger (30).

15
3.4 Feedstock
Agricultural waste, animal manure and MSW are some examples of feedstock suitable for anaerobic
digestion. In some cases, co-digestion (digestion of two or more different feedstock) results in a higher
amount of methane production and resource savings in comparison to digestion of only one type of
feedstock, e.g. combination of pig slurries with manure reduces the amount of water needed for the dilution
of solids (30). This section presents a brief description of each of feedstock suitable for anaerobic digestion.
Animal Manure and Slurries
Animal manure and slurries are a common type of feedstock for anaerobic digestion in rural areas and farms.
The feedstock contains anaerobic bacteria and has high water content that helps to dilute the substrates,
improving the mixing and flowing of the biomass. Slurries contain between 4-8 % of DM and they are
suitable for wet fermentation. In contrast, other animal manure contains around 35% of DM being suitable
for dry digestion. Animal manure and slurries are easy to be collected from the animal farming and also
cheap (27).
Digestion of animal manure requires long retention time due to its content in complex organic compounds
and high concentration of ammonia nitrogen. The methane content of treating animal manure and slurries
varies from 20 to 60%. Studies performed in the Andean high plateau have determined methane content of
20 – 57 % when treating llama manure and from 40 - 60% for caw manure (11). Additionally, these substrates
are considered good for AD due to their nitrogen and phosphorus content and high content of volatile
solids.
Municipal Solid Waste
Anaerobic digestion is suitable for treating both mixed MSW and organic fraction of MSW. MSW is
composed by household waste, food waste, garden waste, etc. The waste fractions and characteristics vary
depending on the country’s conditions. In developing countries, there is a high availability of organic waste
(above 50 %) (2). For this reason, the anaerobic digestion and compost are possible options for waste
treatment (27).
In the case of the city of El Alto, there is a high percentage of organic waste that can be suitable for anaerobic
digestion. The share of organics is approximately 67 % of the total waste generated in the city of 493 tonnes
(12). As mentioned in Chapter 2, it is estimated that 7% of the waste generated in the markets, containing
95% of organic matter. This amount of waste can be a potential source of energy for the city.
Agricultural waste
This feedstock is generated by an agricultural activity. There are several locations around the world such as
US where anaerobic digestion has been covering the electricity of the farms and also the fuel used for
cooking. In most cases, agricultural waste contains high percentage of cellulose requiring longer times to
complete the digestion process (31).
Sewage sludge
Sewage sludge is originated from the wastewater treatment plants. The biogas produced from digesting
sewage sludge has a moisture content of approximately 60 -70% (27). The digestate can be used as soil
conditioner, be incinerated or be disposed to landfill. The final use of the digestate depends on its toxicity
level in heavy metals and other compounds. The benefits obtained for treating sewage sludge with anaerobic
digestion are reduction of volume and disposal (32).
3.5 Products
As mentioned in the beginning of this chapter, the main products of the anaerobic digestion are the biogas
and the digestate. A brief description of each of them can be found in this section.

16
Biogas
Biogas is mainly composed by methane and carbon dioxide. The biogas properties depend on the feedstock
characteristics, digestion technologies, HRT, temperature, OLR, etc (4). The average composition of the
biogas is presented in Table 3.1.
Table 3.1 Biogas composition
Component Percentage[%]
Methane 50-60
Carbon dioxide 35-45
Source: (4)
The biogas energy content is chemically related to the methane content. For example, biogas with 50% of
methane content gives a heating value is 21MJ/Nm3 (32). Biogas can be used directly to generate heat and
power or use as cooking fuel, and also be used as vehicle fuel after passing through the upgrading process.
Digestate
The digestate is the residue from the anaerobic digestion process. Depending on the properties of the
substrate, the digestate obtained can be rich in nutrients such as nitrogen, phosphorus, potassium and other
micronutrients. The common range values of nutrient content in the digestate per ton are: 2.3-4.2 kg of
nitrogen, 0.2 -1.5 kg of phosphorus and 1.3 -5.2 kg of potassium (33). The advantage of using digestate as
fertilizer instead of raw animal manure is the reduction of odors and the higher ratio of carbon/hydrogen.
3.6 AD Technologies
Anaerobic digestion technologies have been implementing in different countries in small and large scale.
The plants are located in rural and urban areas and the technologies vary from simple systems, e.g. tubular
digesters, to complex plants. The technologies can also be adapted depending on the volume and
characteristics of the feedstock. These technologies provide renewable energy and in many cases can be a
feasible and efficient way for treating and reducing the amounts of waste.
Several small- scale biogas systems are used in domestic cooking and lighting purposes in developing
countries. These systems replace conventional fuels for cooking such as firewood and air-dried manure and
also contribute the reduction of GHG emissions, promote the conservation of wood, increase rural incomes
and improve the kitchen environment.
Small-scale biogas plants have an electricity capacity up to 250 kWel (8). The small-scale biogas technologies
commonly include the following components and systems (7).
Structural components: Inlet tank , outlet chamber and digester
Piping components: Gas pipeline and valve
Biogas utilization systems: Biogas stove and biogas lamp
Effluent disposal systems: Storage of digestate and reuse
Elements related to Anaerobic Digestion process: Biogas production
Electricity generation component: microturbine
Classification of AD technologies
The anaerobic digester is the main element for the AD process. According to the dry matter (DM) content
fed into the digester, the fermentation process can be classified as wet or dry digestion. The DM content of
the feedstock is a relevant factor when selecting AD technologies due to it determines the design of the
plant and the type of the digester (2).

17
Dry digestion is suitable for feedstock with dry matter values >25%. Sometimes, the term half-dry digestion
is referred for DM content in the range of 15 to 20% (4). The common systems for dry digestion are batch-
wise. Dry digestion systems have a smaller digester volume in comparison to wet digesters. These
technologies usually do not need stirring or mixing during the digestion process resulting in low operational
costs and low costs of mechanical technology. However, the maintenance costs are high and the process is
energy consuming. The feedstock for dry digestion is commonly garden waste, household waste, etc. In the
other hand, wet digestion technologies are suitable for treating feedstock such as slurries and sewage sludge
that have dry matter content lower than 15% (27; 4).
Other way to classify the AD technologies is by its feeding mode. The technologies can be continuous or
batch-wise. The process is continuous when new biomass is added to the digester and the same amount of
digestate leaves the system. In this mode of operation, the waste material is moved through the digester by
mechanical pressure or pressure from the feedstock. Continuous digesters are commonly suitable for wet
digestion. In the case of batch-wise digesters, the feedstock is fed once at a time. The feedstock is left inside
the digester until the AD process has been completed to then be removed. This technology has a simpler
structure in comparison to continuous digesters and it is suitable for dry digestion or combined dry-wet
digestion for stackable feedstock (27).
AD Digesters
Four different small-scale biogas technologies commonly found in developed and developing countries were
identified: the plug-flow bag digester or tubular digester, the Chinese fixed-dome digester, the Indian floating
drum digester and the garage-shaped digester. These digesters are described including in the following
sections.
Plug-flow bag digesters
This technology is also known as plastic tubular digester. It is easy to implement, inexpensive, and a widely
well-known technology in rural areas. Countries such as China, India, Taiwan and Costa Rica, are examples
where this technology has been using (34). Tubular digesters have also been adapted for mountainous areas
with low temperatures and extreme conditions. In the Andean Plateau in Peru and Bolivia, low-cost tubular
digesters have been adapted to the environment and availability of sources (30).
The common material used for constructing tubular digesters is polyethylene, but also PVC (geo-membrane)
is beginning to be used. PVC digesters are more expensive in comparison of polyethylene digester but they
have longer life time due to its resistance. The digester consists of a tubular bag through which the slurry
flows from the inlet to the outlet. The biogas is collected in the top part of the digester by a gas pipe
connected to a reservoir. The biogas passes from the reservoir to their final destination, e.g. kitchen (34).
This technology does not count with a system of heating or mixing. Figure 3.2 shows a tubular digester’s
diagram.
Figure 3.2 Tubular digester diagram Source: (35)

18
The gas pressure of the digester can be regulated by placing weights on the digester’s bag. However, this has
to be done carefully in order to avoid damaging the digester. Tubular digesters are fragile and therefore need
protection from the solar radiation and animals. The life span of the digester varies from 2 to 5 years
depending on the maintenance practices (2).
In locations of high altitude and low temperatures such as El Alto, it is necessary to insulate the digester in
order to minimize the fluctuations of temperature during the night. For this purpose, the tubular plastic
digester is buried in a trench and covered with a greenhouse. Generally, long hydraulic retention times of 60
to 90 days are needed for these conditions in cold mountainous areas. Furthermore, the volume of bio-
digesters for cold conditions needs to be larger in comparison of digesters implemented in warm climate
(34).
The investment costs of this technology in Bolivia are presented in Table 3.2. 20 to 30 kg of animal manure
per day are fed in this digester (0.02 to 0.03 tonnes per day) to produce 1.1 to 1.5 m3 (20).
Table 3.2 Tubular digester investment costs
Volume [m3]
8 11 17 24
Cost [USD] 413 503 647 842
Load [kg of animal manure/day] 20 30 45 65 Source: (20)
Chinese fixed dome digesters
Chinese fixed dome digesters have a structure located underground and operate in a semi-continuous mode,
e.g. feedstock addition once per day. The structure includes no moving parts and the material construction
commonly consists of bricks and cement. This technology does not have a mixing system and for this reason
it is necessary to remove the suspended solids sediments from 2 to 3 times per year (29).
In this type of digester, the feedstock is fed in the mixing tank to then pass to the digestive chamber. The
biogas is storage in the top part (the dome) of the digester. When gas is been produced, the slurry is directed
to the displacement tank. The slurry goes back to the digester chamber once the gas is consumed. These
movements in the slurry create mixing movement of the substrate. The digester’s design makes it suitable
for cold temperatures, due to the structure is underground and therefore it has an insulation system to keep
the temperature inside the digester (7). Figure 3.3 shows the diagram of the digester.
Advantages
•Known technology in Bolivia
•Low investment cost and low material transport costs
•Adaptable to cold weather and bedrock areas due to the use of greenhouse roof and the thin layer of the digester bag which allows fast heating
•Easy and fast to install
Disadvantages
•The desing requires a large space for its installation in comparison of other technologies
•Requires external protection to avoid accidents that can damage the digester
•Requires an external gas reservoir
•Short life spam (approx. 4 years).
•Easy to break and difficult to repair

19
Figure 3.3 Chinese dome digester Source: (36)
Studies from Nepal, where the physical characteristics are similar to the city of El Alto, have demonstrated
that the main technical problems in this technology are caused by the lack of knowledge at both technical
and operational level. Low quality construction, leakage of pipelines, low biogas production and lack of
maintenance are the main problems registered in this area (7). In Bolivia, technical knowledge still is missing
regarding the Chinese dome digester technology. However, proposals for national campaigns promoting the
implementation of this digester at household level have been already presented (20). The costs for this type
of digester are relatively low. The investment costs in Bolivia are presented in Table 3.3.
Table 3.3 Dome digester's investment costs
Volume [m3]
4 6 9 13
Cost [USD] 908 1,004 1,368 1,607
Load[kg of animal manure/day] 20 30 45 65 Source: (20)
Indian Floating Drum Digester
In Indian floating drum digesters, the design is similar to the Chinese dome digester but it has the difference
of having a floating gas bell function for collecting biogas. This system has been implemented to treat food
waste in India and China. The digester’s structure consists on a mixing tank (a concrete digester) with two
chambers. The chambers are divided by a partition wall but connected with each other at the top of the
digester. The digester also has a stainless cylindrical drum or gas holder, and an outlet tank through which
the slurry leaves the system (2). See Figure 3.4.
Advantages
•Low investment costs
•Life time of approximately 20 years
•Good insulation system
•No superficial space required due to the structure is underground
•Good gas pressure
•Mixing of substrate inside the digester avoids a large accumulation of solids in the digester's bottom
•Technology implemented in several parts of the world
Disadvantages
•Difficult to build specially in bedrock regions
•High technical skills are required for the construction to avoid structural failures and therefore gas leakages
•Lack of traineed technicians in Bolivia; the trainning program represent extra costs
•Higher material trasportation cost in comparison of tubular digesters

20
During the process, the substrate is mixed in the mixing tank and fed to the digester. The cylindrical drum
floats on the slurry collecting the gas generated. The matter is decomposed in the first chamber and once it
has reached a maximum volume it overflows to the next chamber. Afterwards the slurry leaves the system
by the outlet pipe.
The costs of this technology are higher in comparison to the Chinese dome digester due to the steel floating
drum (36). Regular maintenance of the digester is needed. A cover coating of the floating drum should be
done once per year in order to avoid rusting. A regular maintained drum can last between 3-5 years in humid
areas or 8 -12 years in dry locations (2). The loading rate depends on the size of the digester. For example,
a digester of 25 m3 has an ORL of 12.47 kg of VS per day when treating food waste (37).
Figure 3.4 Indian floating drum digester Source: (36)
Garage-shape digesters
The last sections presented technologies suitable for wet digestion. The next digester is suitable for dry
digestion. This technology has a more advanced system and is widely used in European countries (26). It
has higher investment costs compared to the technologies presented before, but it allows controlling the
Advantages
•Life time of approximately 15 years.
•Constant pressure of the gas due to the drum weight
•Technology implemented in several parts of the world
•Errors during the digester contruction do not represent a big issue in the operation and the gas yield.
Disadvantages
•Difficult to build special in bedrock regions
•High technical skills are required for the construction
•Lack of trainned technicians in Bolivia; trainnig represents extra costs
•High transport costs cost materials in comparison to tubular digesters.
•There are not studies and knowledge of implementing this technology at high low temperature locations
•Expensive technology in comparison of tubular digesters
•Continuous maintenance is required to avoid damages in the floating drum

21
AD process in a more efficient way and also has a larger capacity for treating feedstock. It can be designed
for treating from 5,000 to 100,000 tonnes of biowaste per year (38).
Garage-shaped digesters have a dry fermentation process. Garage- shaped digesters are able to treat organic
fractions of MSW, agricultural waste and food waste. This technology is compact and has a shape of a garage
designed for using wheel loaders to remove and fill in the digesters. See Figure 3.5. This saves time and
makes the process more time efficient (26). Garage-shaped digesters operate under batch mode, and can
easily increase its capacity due to their modular construction. This technology counts with an integrated
system for heating the walls and floor of the digester where the AD process is conducted under mesophilic
temperature (approx. 38 °C). The digesters are constructed with gas-proof reinforced concrete avoiding the
leakages of biogas (26).
The fermentation process inside the digester last between 4-5 weeks. Once this period has passed, the
digestate is removed and the digester is cleaned for the next load. The time for doing these operations is
one working day. The removed digestate is transported to the mixing area, where approximately 50% is
separated for composting and the rest 50% is mixed with the fresh substrate. The filling process of new
material also takes one day. All these operations are done by using wheel loaders (26).
The material to be digested does not need a pretreatment process and once inside the digester does not
required to be stir or mixed. This digester requires just a little amount of water due to the percolation liquid
is recycled in the process (27). Figure 3.5 shows the diagram of the digester.
Figure 3.5 Garage-shape biogas plant Source: (26)
Advantages
•Life time of approximately 30 years
•Constant pressure of the gas
•Constant temperature inside the digester
•The supplier company provides trainning of the personnel
•Better control of the AD process
•Adaptable to the conditions of El Alto
•Larger volume capacity
•Technology implemented in several parts of the world
Disadvantages
•High investment costs.
•Technology not tested in Bolivia.

22
4 Methodology
In this chapter, it is explained the methods and assumptions used in this study. As mentioned in Chapter 1,
the methodology is divided in five sections: determining the AD technology, biogas and organic fertilizer
potential, economic analysis, environmental benefits and social benefits. In each section, it is explained the
methods used for developing the study. The main methods used are: multi-criteria analysis, literature review,
NPV, IRR, Payback Time and LCOE. These methods are described in following sections.
4.1 Determining the AD technology
This step was based on literature review of journal articles and other sources concerning small-scale biogas
technologies in the different countries. These factors were evaluated considering the actual characteristics
of the city of El Alto. The method used for comparing the technologies was the Multi-criteria Analysis
(MCA).
Multi-criteria Analysis
The MCA is useful for decision-making and it is based on the evaluation of several options according to
certain criteria. It can be used for identifying the most preferred option, giving a hierarchy to the options or
identifying acceptable and unacceptable possibilities (39).
The MCA involves 8 steps for its development (39).
1. Establish the decision context including the aim of the MCA, the decision makers and other players.
2. Identify the options.
3. Identify the criteria.
4. Define the performance of the option for each criterion by giving the scores.
5. Give the weights for each criterion according to their importance to the final decision.
6. Combine the scoring and weighting values for each option and determine the overall value.
7. Examine the results.
8. Perform the sensitivity analysis of variations in scores and weighs.
The MCA consist of a performance matrix where the rows represent the options and the columns the
performance of the criteria for each option (39). Table 4.1 illustrates the matrix.
Table 4.1 Performance matrix of the MCA
Criteria Criteria 1 Criteria 2 Criteria 3 … Criteria n
Options w1 w2 w3 wn
Option 1 s11 s12 s13 … s1n
Option 2 s21 s22 s23 … s2n
Option 3 s31 s32 s33 … s3n
… … … … … …
Option i si1 si2 si3 … sin Source: (39)
In the performance matrix, the wn represents the weight of the criterion n and sin the score of option i
corresponding to the criterion n. The performance of each criterion is commonly expressed in numbers but
other codes such as colors can also be used (39).
To ensure a consistent scoring between the criteria, it is conventional to use a scale between 0 and 100,
where 0 is given to the lowest performance and 100 to the highest one (39). The values between these
intervals can be determined by using three options. Only two will be explained and used in this report.
The first option uses the idea of a value function in which the two extreme values correspond to the values
0 and 100 (39). This generates a linear graph where the vertical axis represents the score and the horizontal

23
axis the value of the option for the criteria. In this way, the scores for the other values can be directly read
from the graph in the vertical axis.
The other option is direct rating. Direct rating is used in the case that there is not a determined scale of
measurement or when there is not time or resources for taking the measures. This approach can be very
variable according to the judgment of the evaluator. The scores in this case are also given in the range of 0
to 100 (39).
The final results from the MCA can be obtained by the application of several techniques. Simple and
complex techniques exist for conducting a MCA. They depend on the objectives and the purpose of the
analysis. The techniques commonly consist of numerical analysis of scoring the criterion for each option
and weighing the criteria according to their strength independently of the preference (39).
The technique used in this report is the linear additive model where each score given is multiplied for the
criterion weight, This values are then finally sum up to obtain a total weighted scores together for each
option (39). See Equation 1.
𝑺𝒊 = ∑ 𝒘𝒋
𝒏
𝒋=𝟏
𝒔𝒊𝒋 = 𝒘𝟏𝒔𝒊𝟏 + 𝒘𝟐𝒔𝒊𝟐 + ⋯ + 𝒘𝒏𝒔𝒊𝒏
Equation 1 Linear additive model
In this study, the aim of the MCA is simply to identify which of the technologies presented in Chapter 3
could suit better the characteristics of the city of El Alto. This is done in order to define the model for the
techno-economic analysis. Usually the MCA involves several actors but in this case it will only be done base
on literature review and the judgment of the author of this report.
The options to be evaluated are the four technologies presented in Chapter 3, i.e. the tubular digester,
Chinese dome digester, Indian floating drum digester and the garage-shaped type digester. The criteria to be
considered for this assessment are based on the aspects that can influence in the performance of the digester
considering the conditions of the city of El Alto. The criteria to be evaluated are: lifespan, technical
knowledge and skills, physical structure and investment costs. The results of the analysis can be found in
section 5.2.
4.2 Biogas and organic fertilizer potential
As mentioned in Chapter 2, the waste characterization and availability is mainly based on literature review
and assumptions. The main documents used in this step are previous reports from the WABB project
regarding biogas production in El Alto and La Paz and a study conducted by the University of San Andres
in La Paz in 2004 regarding waste characterization of the markets. To validate the data, information from
the National Statistics Institute of Bolivia, journal articles and reports from different countries were also
reviewed.
Biogas potential
The total amount of biogas can be theoretically estimated considering the biogas yield (40). Equation 2
represents this value.
�̇�𝒃𝒊𝒐𝒈𝒂𝒔 = �̇�𝒃𝒊𝒐𝒘𝒂𝒔𝒕𝒆 ∗ 𝜸
Equation 2 Amount of biogas produced
Where
�̇�𝑏𝑖𝑜𝑔𝑎𝑠 is the mass flow of biogas [m3/h]
�̇�𝑏𝑖𝑜𝑤𝑎𝑠𝑡𝑒 is the mass of biowaste [kg/h]

24
𝛾 is biogas yield [m3/kg]
The total mass of biowaste is assumed to be 10,000 tonnes per year. This value was determined considering
that 7% of the total waste generated in El Alto comes from the vegetable and fruit markets. In addition, it
was assumed that 95% of the market waste is organic. The value of 10,000 tonnes represents approximately
85 % of total waste generated from the markets in the city of El Alto.
The methane yield and biogas yield are important factors of the biogas, since methane is the main
component influencing on the energy content of the biogas and therefore also the biogas yield. They can be
calculated theoretically if the exact waste composition is known. Due to the waste contains several organic
components, methane and biogas yield can be difficult to estimate theoretically. For this reason, it is
necessary to measure the methane potential in practice and under controlled conditions. However, the yield
values obtained when treating waste in AD reactors differs from theoretical values and lab measures. This
is because several parameters affect the process of degradation such as limitation of nutrients, retention
time, etc. (31).
For this study, a biogas yield value of 100 Nm3/t biowaste was assumed considering a methane content of
61% (32). This value is a general estimation found in literature for biowaste, thus it is necessary to perform
a sensitivity analysis. The details of this analysis will be explained in section 4.3.
Electricity generated from biogas
The electricity generated will be calculated based on the amount of biogas produced, energy content in the
biogas and the efficiency of the electric generator. In this study, it is assumed an energy content of 6
kWh/Nm3 (32) and an efficiency of 30 % (9). The total amount of electricity generated is calculated by
Equation 3.
𝐸[𝑘𝑊ℎ/𝑦𝑒𝑎𝑟] = �̇�𝑏𝑖𝑜𝑔𝑎𝑠 ∗ 𝐸𝑛𝑒𝑟𝑔𝑦 𝑐𝑜𝑛𝑡𝑒𝑛𝑡 𝑏𝑖𝑜𝑔𝑎𝑠 ∗ 𝜂𝑒𝑙
Equation 3 Electricity equation
Where,
�̇�𝑏𝑖𝑜𝑔𝑎𝑠 is the amount of biogas per year [Nm3/year]
𝐸𝑛𝑒𝑟𝑔𝑦 𝑐𝑜𝑛𝑡𝑒𝑛𝑡 𝑏𝑖𝑜𝑔𝑎𝑠 is the low calorific value of biogas [kWh/Nm3]
𝜂𝑒𝑙 is the efficiency of the electric generator [%]
Organic fertilizer
The calculation of organic fertilizer is based on the mass balance of the digestate. The volume of the mass
treated after AD process remains with 90 to 95 % of their original volume. This material is then pass to the
compost process in which occurs the final degradation of the organic matter under aerobic conditions. As
mention in Chapter 3, one of the main parameter when composting is the moisture content. For this study,
it will be assumed that the digestate to be composted contains 43 % of moisture which is a standard value
suitable for composting (4).
The mass lost during composting of fresh material is approximately to 2/3 of the initial volume. This means
that from 100% of the material composted approximately about 37 % of the incoming waste results in
compost and the other 63% leaves the system as evaporated water and degraded volatile solids (31). It is
important to mention that these values are for composting fresh material. In this study composting will be
done after the anaerobic digestion process, where a large fraction of the organic material has already been
degraded. For this reason, it will be assumed that the 80 % of the digestate will result in compost (14). It is
assumed that the final compost contains about 33% of water, 43 % of VS and 24 % of ash (31).

25
4.3 Economic Analysis
This section presents the methods used in the economic analysis. The Net Present Value (NPV), Internal
Rate of Return (IRR), Payback time (PB) and Levelized Cost of Electricity are following described.
Furthermore, it is presented the scenario development and sensitivity analysis considerations.
Net present value (NPV)
The NPV method is used to evaluate the feasibility of a project. It is based on the calculation of the present
value of the cash flows in a determined period of time. The cash flows represent the difference between the
benefits and the costs of a determined year (41). The NPV can be calculated by Equation 4.
𝑁𝑃𝑉 = ∑𝑅𝑡
(1 + 𝑖)𝑡⁄
𝑁
𝑡=0
Equation 4 Net Present Value
Where,
𝑖 is the discount rate [%]
𝑁 is the total number of periods [year]
𝑅𝑡 is the cash flow in year t [USD]
The discount rate in Equation 4 is the interest rate used to calculate the present value of future cash flows.
It also reflects the risk of the inversion. For this study, it is assumed a value of 5% and the number of periods
is assumed to be 15 years (41). This period of time is the average lifespan for biogas technologies with
regular maintenance.
The interpretation of the NPV results depend on the number obtained. If the NPV value is positive, the
project is profitable and the opposite if the number is negative. The purpose of the NPV method is to
indicate if the capital costs of a project can be covered by the return of investment during a period of time
(41).
Internal rate of return (IRR)
Usually when evaluating NPV, it is also calculated the internal rate of return. The IRR is the discount rate
at which the NPV is cero. Therefore, the IRR is the value when the present value of the costs and the
present value of the benefits are equal (41). As rule if the IRR is bigger to the discount rate of a project, the
investment should be done. In contrast, if the IRR is lower to the discount rate the project should not be
conducted. Equation 5 can be used to calculate the IRR.
𝐼𝑅𝑅 = 𝑁𝑃𝑉 = ∑𝑅𝑡
(1 + 𝑖)𝑡⁄
𝑁
𝑡=0
= 0
Equation 5 Internal Rate of Return
Payback time (PB)
The payback time represents the necessary number of years to recover all the investment costs (41). The PB
is calculated using Equation 6.
𝑃𝐵 = 𝑇𝑜𝑡𝑎𝑙 𝑎𝑚𝑜𝑢𝑛𝑡 𝑖𝑛𝑣𝑒𝑠𝑡𝑒𝑑𝐸𝑠𝑡𝑖𝑚𝑎𝑡𝑒𝑑 𝐴𝑛𝑛𝑢𝑎𝑙 𝐶𝑎𝑠ℎ 𝐹𝑙𝑜𝑤𝑠⁄
Equation 6 Payback time

26
Levelized Cost of Electricity (LCOE)
The LCOE is a tool used to calculate the cost per kWh of electricity generated (41). This indicator is
commonly used for comparing the costs of different energy generation technologies over their economic
life. The benefit of using LCOE is the inclusion of avoided emissions of CO2 for using a renewable
technology. The LCOE can be calculated by Equation 7.
𝐿𝐶𝑂𝐸 =∑ ((𝐼𝑡 + 𝑂&𝑀𝑡 + 𝐵𝑡 − 𝐶𝑡𝑡 + 𝐷𝑡) ∗ (1 + 𝑖)−𝑡)
∑ (𝐸𝑡 ∗ (1 + 𝑖)−𝑡)𝑡
Equation 7 Levelized Cost of Electricity
Where,
𝐼𝑡 is the investment cost in year t [USD]
𝑂&𝑀𝑡 is the operational and maintenance costs in year t [USD]
𝐵𝑡 is the cost of producing the biowaste in year t [USD]
𝐶𝑡 is the carbon credits [USD/kWh]
𝐷𝑡 is the decommissioning costs in year at the end of the life time of the plant [USD]
𝐸𝑡 is the electricity produced in year t [kWh]
Scenario Development
Scenario development is the evaluation of possible future situations through the consideration of different
plausible conditions. Scenario development is important to determine the outcomes of certain situations in
a context that is relevant for the stakeholders. Scenarios provide a better view of the situation helping in the
process of decision-making (42).
In this study, two scenarios will be evaluated. Scenario I in which the biogas plant is a concessionary
company responsible for only treating the waste, and Scenario II in which the biogas plant is a concessionary
company on charge of the collection, transport and treatment of waste. The description and the business
model of the scenarios are presented in detail in Chapter 5.
Sensitivity analysis
The sensitivity analysis is done in order to identify how changes in certain parameters can vary the results
of the economic analysis. Some factors suggested for sensitivity analysis when analyzing biogas technologies
are the availability of feedstock, the expected biogas production and its effects by the climate conditions,
the economic lifetime of the technology, the interest rate, the investment costs and the operational and
maintenance costs (41).
In this study, the parameters to be analyzed are the investment costs, the O&M costs (including transport
costs), the transport costs, the biogas yield, the carbon credits, the electricity price and price of compost.
The sensitivity analysis was done for the most economical attractive option. The parameters were evaluated
increasing every 10 % and in a range from -50% to 50%. The results will be presented in Chapter 5.
4.4 Environmental benefits
The environmental benefits are determined based on avoided emissions for electricity generation from
biogas. The fuel replaced by biogas will be natural gas. The value used for the calculation is taken from the
“Projected costs of generating electricity” from the International Energy Agency and the Nuclear Energy Agency
(51). The avoided emissions factor was considered 0.5 tonnes of CO2 per MWh (52; 51). The total avoided
emissions are calculated by Equation 8.

27
𝑨𝒗𝒐𝒊𝒅𝒆𝒅 𝒆𝒎𝒊𝒔𝒔𝒊𝒐𝒏𝒔 𝒆𝒍 = 𝑬𝒍𝒆𝒄𝒕𝒓𝒊𝒄𝒊𝒕𝒚 𝒃𝒊𝒐𝒈𝒂𝒔 ∗ 𝑨𝒗𝒐𝒊𝒅𝒆𝒅 𝒆𝒎𝒊𝒔𝒔𝒊𝒐𝒏𝒔 𝒇𝒂𝒄𝒕
Equation 8 Avoided Emissions for electricity generation
Where,
𝐴𝑣𝑜𝑖𝑑𝑒𝑑 𝑒𝑚𝑖𝑠𝑠𝑖𝑜𝑛𝑠 𝑒𝑙 is the amount of avoided emissions [t CO2/year]
𝐸𝑙𝑒𝑐𝑡𝑟𝑖𝑐𝑖𝑡𝑦 𝑏𝑖𝑜𝑔𝑎𝑠 is the total electricity produced from biogas [MWh]
𝐴𝑣𝑜𝑖𝑑𝑒𝑑 𝑒𝑚𝑖𝑠𝑠𝑖𝑜𝑛𝑠 𝑓𝑎𝑐𝑡𝑜𝑟 is the emissions of electricity produced by natural gas [t CO2/MWh]
4.5 Social Benefits
The method used for the identification of the social benefits is literature review. Several sources of
information regarding the possible benefits of implementing waste to biogas technologies were analyzed.
The main potential social benefits found are:
Renewable energy source
Contribution of the environmental targets.
Waste reduction
Job creation
Improvement in soil conditions
Improving living environment
The results obtained from the previous subchapters will be evaluated according to these aspects taking into
consideration the local conditions of the city of El Alto.

28
5 Results and Discussion
This chapter presents the results and the discussions of the study. The results are presented in same order
of the methodology explained in the Chapter 4. This means: section 5.1 presents the AD technology
selection in which is developed the multi-criteria analysis of the small-scale digesters. Section 5.2 presents
the biogas and organic fertilizer production based on the specifications of the technology and the mass
balance. Section 5.3 describes the input data and the techno- economic analysis. Section 5.4 presents the
markets of the AD byproducts biogas and organic fertilizer. Section 5.6 presents the avoided emissions and
section 5.7 the social benefits. Each of these sections includes their respective results and discussion.
5.1 AD technology selection
The comparison of the technologies was based on the Multi-criteria analysis method mentioned in Chapter
4. The tubular digester, the Chinese fixed dome digester, the Indian floating drum digester and the garage-
shaped digester were analyzed. The criteria for the analysis were selected after a literature study concerning
the required general characteristics of the digesters for achieving good biogas performance. The local
characteristics of the city of El Alto were taken into consideration when evaluating the criteria. The selected
technology should be optimum for working at low temperatures, be adapted to the bedrock soil conditions
and cover the amount of waste generated in the vegetable and fruit markets of the city of El Alto.
Five criteria were chosen to be analyzed: lifespan, technical knowledge and skills, physical structure and
investment costs. The elements considered in each criterion and the criterion importance are described in
the next sections. The summary of the results of each parameter is presented in the performance matrix of
the MCA in the last part of this section.
Criterion 1 Lifespan
The lifespan indicates the time available for using the technology before it is necessary to replace it by a new
unit. This criterion is important since it is necessary to ensure the electricity generation and therefore it is
preferred to have a long lifespan to avoid long time disruptions in the electricity supply and production of
organic fertilizer. As mentioned before, the average lifespan for biogas plants at small-scale is 15 years so it
is expected that the technology selected last at least this period of time.
Furthermore, the lifespan of these technologies is related to its maintenance. Regular maintenance is
necessary in order to have a good performance for biogas production. Maintenance involves mainly activities
of cleaning the digester’s bottom by removing the settling solids and cleaning the connection pipes in order
to avoid clogging. Table 5.1 summarizes the maintenance needed for each technology.
Table 5.1 Required maintenance of the digesters
Digester Type Characteristics
Tubular It requires regular maintenance to control possible leakages and avoid settling
solids (20).
Chinese fixed dome
The digester need to pass through the process of maintenance every 5 years.
This maintenance involves cleaning the settled solids and fix possible fractures
in the digester’s structure (53).
Indian floating drum
The digester need to be maintained every 5 years for removing the settled
solids. Additionally, the drum has to be repainted once per year to avoid
corrosion problems (53).
Garage-shaped Due to its design and operational mode, maintenance of this technology is
done regularly after each unload of the digestate (26).

29
Considering an optimum and regular maintenance of the digesters, the life spans of Table 5.2 can be
achieved. The values given are for digester implemented in places with low humidity.
Table 5.2 Lifespan of AD digesters
Digester type Life time [years]
Tubular
Chinese dome
Floating drum
Garage-shaped
45
206
157
308
To convert this values to scores in the interval 0 to 100, it was used the linear function described in Chapter
4. In the linear function the two extreme values correspond to the values 0 and 100 (39). In this case 4
corresponds to the value 0 and 30 to the value 100. Taking into account this two points, it is generated a
linear graph where the vertical axis represents the score and the horizontal axis the value of the option for
the criteria. In this way, the scores for the other values (20 and 15) can be directly read from the graph in
the vertical axis. The scores obtained can be seen in Table 5.5 of this section.
Criterion 2. Technical knowledge and skills
This criterion refers to the required knowledge for construction, operation and maintenance of the
technologies. This criterion is important because the technical knowledge and skills affect directly the
efficiency of the biogas production. The summary of these aspects for each technology can explained in
Table 5.3.
Table 5.3 Technical knowledge and skills of biogas technologies
Digester Type Characteristics
Tubular
Tubular digesters are fast and easy to install. The knowledge and skills required
are easy to acquire. This technology is well-known in Bolivia and has been
proved to work in the conditions of El Alto (20).
Chinese fixed dome
Chinese dome digesters require high technical skills and knowledge for its
construction and maintenance. The constructions’ quality affects directly to the
performance of the digester. A bad structure can lead to leakages of biogas,
affecting the product efficiency and extraction of biogas (7). There are studies
and proposals for implementing this technology in Bolivia which state that this
technology could be suitable for the cold weather (20).
Indian floating drum
Technical skills and knowledge of this technology lack in Bolivia. Furthermore,
there were not found studies of the applicability of this technologies in cold
weather.
Garage-shaped
Technical skills are required for implementing and operating the technology.
Training of the personnel is needed. There are previous studies under the
WABB project that shown that this technology can be suitable for the city of El
Alto (14).
5 (20) 6 (2) 7 (2) 8 (3)

30
The scoring for this criterion was done by direct rating. A score of 0 is given if the technology has not been
implemented yet and if there are not studies regarding the implementation of this technology in Bolivia. A
score of 33 is given if studies and proposal for the implementation of the technology have been developed
in Bolivia. A score of 66 is given if the pilot plants of the technology are being tested at local conditions. A
score of 100 is given if the technology has been fully implemented in local conditions. Table 5.5 shows the
results of the scoring.
Criterion 3. Physical structure
The design and the material’s structure have important effects on the biogas performance. The structure of
the digester should provide a good anaerobic condition inside the digester for having a suitable environment
for the development of the microorganisms (54). Considering the conditions of the city of El Alto, the
digester’s structure should also provide a good insulation system. The weather conditions in El Alto are
extreme and temperatures fluctuate during the day and night. During the night the temperature can reach -
10°C. For this reason, the structure of the digester should keep constant the temperature inside the digester.
This is important since the temperature influences on the level of activity of the microorganisms as well as
their growth and therefore the biogas production. The characteristics concerning this criterion for each
technology are given in Table 5.4.
Table 5.4 Physical structure of digesters
Digester Type Characteristics
Tubular
The tubular digester has low structural strength due to its construction material
(polyethylene or PVC). Tubular digesters have a large area in contact with the
external environment. In cold conditions, the digester is half buried in a trench
and cover by a greenhouse top to avoid temperature fluctuations inside the
digester and provide protection from animals, kids and weather conditions that
can harm the digester’s structure (20).
Chinese fixed dome
Chinese dome digesters are commonly built with concrete. These digesters can
be suitable for cold temperatures due to most of its structure is built
underground. The spherical shape in its design creates a distributed biogas
pressure inside the digester. However, the biogas pressure fluctuates along it is
being consumed which can cause fractures in the structure and generate biogas
leakages (7).
Indian floating drum
Indian floating drum digesters have a structure of concrete and a floating drum
made of steel. The structural strength of the digester is lower than the Chinese
dome digester due to the floating steel drum. The floating drum of the digester
has a large area in contact to the exterior. This makes the digester more
sensitive to temperature fluctuations (2).
Garage-shaped
This technology has a good structural strength and it is designed to stand and
avoid changes of pressure and temperature inside the digester. It has a robust
concrete structure and an internal heating system which makes it suitable for
cold conditions (26).
To give the scores to this criterion, it was use the direct rating technique. The highest score is given to the
digester with a robust structure that could better adapt to the cold weather of El Alto. The other scores are
given according to the level of structural strength and sensitivity to low temperatures. The results are
presented in Table 5.5.

31
Criteria 5 Investment costs
The investment costs are the total costs to implement the biogas plant. The digester, pipes and other
structures needed for the production of the biogas are included in the investment costs. Variables such as
the capacity of the digester, material, and training of the personnel are different for each specific case. For
these reasons the technologies are listed from the lower to the highest investment cost:
1. Tubular digester,
2. Chinese dome digester
3. Floating drum digester
4. Garage-type digester
Direct rating is used for scoring this criterion. The highest score is given to lowest investment cost
technology and the lower score to the highest investment cost technology. The results can be seen in Table
5.5.
Performance Matrix
The results from the analysis are presented in the performance matrix. To complete the matrix it was
necessary to define the weighs for the criteria. The weighing was done by equally distributing 100 points
between the criteria. Each criteria will be assigned 25 points of the 100 which means that all the criteria are
considered to have the same level of importance. The total scores were calculated by the linear additive
model explained in Chapter 4. The score and weight values as well as final results are presented in Table 5.5.
Table 5.5 Digester’s MCA performance matrix
Criteria Lifespan Knowledge Structure Investment cost Total
Digester 0.25 0.25 0.25 0.25
Tubular 0 100 0 100 50
Chinese dome 67 33 66 66 57
Floating drum 8 0 33 33 27
Garage-shaped 100 33 100 0 58
The highest value from the MCA shows that the technology suiting better to the conditions of El Alto is
the garage-shaped digester. It can also be seen the result of the Chinese dome digester is very similar to the
score of the garage-shaped digester. These results in some extent can be subjective. For this reason, a deeper
literature study was done to find information that can support the decision of choosing the garage-shaped
digester over the Chinese dome digester.
One reason is the fact the garage-shaped digester allow saving water due to its design by the recycling of
percolate liquid from the biowaste. In contrast, the Chinese dome digester, the tubular digester and the
Indian floating drum digester need a constant and a larger water supply since they are a wet digestion
technologies. This aspect is relevant for the case of El Alto since the availability of water is variable and it is
common that the city has water management issues. Therefore, the garage-shaped digester can have an
advantage over the other technologies.
Other reason to support the decision is that the garage-shaped technology results in dry digestate that can
be composted. The other technologies generates sludge as digestate which needs further treatment such as
dewatering or need to be transported by pipes or other means for their final use representing extra-costs for
the investor. Thus, the garage-shaped digester seems to have better results.
Finally, another reason for selecting the garage shaped-digester is that previous studies have shown that this
technology can be a suitable option for treating OFMSW waste at large-scale in the city of El Alto. This can
be an indicator that the garage-shaped digester could also be suitable for treating the organic waste from the
vegetable and fruit markets in the city of El Alto.
From this point a head, the data and model used will be based on the characteristics of this technology.

32
5.2 Biogas and organic fertilizer
This section presents the estimations of the amounts of biogas and organic fertilizer that can be generated
by treating the waste using the garage-shaped digester. As mentioned in section 4.2 the calculations are done
considering that 10,000 tonnes of organic waste per year will be treated.
Biogas production
The total amount of biogas was calculated using Equation 2 and taking into account a biogas yield value of
100 Nm3 /t of biowaste (32). The annual biogas production was estimated to be of 1,000,000 Nm3/year.
The amount of biogas produced per tonne of waste was estimated 0.115 t/t of biowaste. This value was
calculated considering a biogas density of 1.15 kg/Nm3 which is the average value found in literature for
biogas produced from AD processes. A summary of these results can be seen in Table 5.6.
Table 5.6 Biogas results
Biogas characteristic Value Unit
Biogas yield 1009 [Nm3/t biowaste]
Biogas density 1.15010 [kg/ Nm3]
Biogas estimated production per ton of biowaste 0.115 [t biogas/t of biowaste]
Total biogas produced 1,000,000 [Nm3/year]
Methane content 6111 [%]
Total methane produced 610,000 [Nm3/year]
The biogas yield is totally dependent on the waste composition. The value used in this calculation is an
average value for biowaste. As explained in Chapter 4 Methodology, this assumption was made in order to
make an approximation of the data concerning the vegetable and fruit market waste from the city of El Alto.
To show the effect of the biogas yield in the production of biogas, values of biogas yield from different
feedstock were used to estimate the amount of biogas that can be produced. Figure 5.1 shows the results of
this estimations. The x axis of the figure represents the type of substrate and y axis the biogas production.
The numbers in blue color are the biogas yield for each substrate. The biogas production is calculated for
10,000 tons of fresh biowaste. The red bar in Figure 5.1 illustrates the biogas production of this study case.
Comparing the values of the figure, it can be seen that the biogas production of this study case is
approximately an average value of the biogas that can be produced from other types of feedstock.
Furthermore, it can be observed that the biogas yield of animal manure is low and therefore low amounts
of biogas are produced. This is the due to the slow degradation of complex compounds contained in the
animal manure. In contrast, cereal silage has the highest production of biogas. For this reason, in some cases
co-digestion is suggested to improve the biogas yield. In this study case, co-digestion is not absolutely
necessary.
9 (32) 10 (58; 60; 59) 11 (32)

33
Figure 5.1 Biogas production for different feedstock and biogas yield12
Electricity generated from biogas
The calculation of the electricity generated is based on the energy content in the biogas which is assumed 6
kWh/Nm3 (32) and the efficiency of the electric generator which is considered to be 30 % (9). The total
amount of electricity generated is calculated by Equation 3 presented in Chapter 4. From the total electricity
generated, a percentage of 20 % will be assumed to be consumed at the plant for heating purposes and the
operation of equipment (31).
It is estimated that 1.800,000 kWh per year can be generated. Based on this value, the operational hours of
the plant and the capacity factor can be estimated the electric capacity of the plant. It was assumed that the
plant will be working 70% of the operational hours and at 85% of the total plant capacity. Taking into
consideration these aspects, the capacity of the plant was determined to be 250 kWel which is a comparable
value for biogas plants treating 10,000 tons of biowaste. Furthermore from this amount, it was estimated
that approximately 1,440,000 kWh per year can be sold to the grid.
Organic fertilizer production
The amount of organic fertilizer is the amount of digestate composted. The digestate to be composted was
estimated assuming that 90 % of the actual waste volume leaves the system and the rest 10 % is converted
to biogas (33). Furthermore, the waste density was assumed to be 0.53 t/m3. This results in 9,000 t/year of
digestate to be withdrawn from the digester and 1,000 tonnes of fresh biowaste to be converted to biogas.
Considering the mode of operation of the garage-shaped technology, 50 % of the digestate is separated and
mixed with new material to be processed in the AD digester and the rest 50 % is composted. The digestate
to be composted is 4,500 tonnes (assumed moisture content of 43%). The compost to be obtained is 3,600
t/year, this is because approximately 20 % of the mass (14) (84% water and 16% volatile solids (31)) is lost
during the compost process. The compost obtained is assumed to contain 33% of water, 43% of volatile
solids and 24% of ash (31). The compost for commercialization is 2,340 t/year which corresponds to 65 %
of the total compost. This is due to the compost passes through a sieving process. The material separated
in this process is taken back to composting. Table 5.7 shows these results.
12 Based on information from (32)

34
Table 5.7 Organic fertilizer production
Organic fertilizer characteristic Value [t/year]
Amount of digestate obtained 9,000
Digestate reintroduced to the digester 4,500
Digestate to be composted 4,500
Compost to be obtained 3,600
Compost for commercialization 2,340
Compost re-used in the composting process 1,260
The biogas and organic fertilizer results are summarized in Figure 5.2. It can also be seen that the figure
shows the electricity generation per year.
Figure 5.2 Biogas and organic fertilizer balance results
5.3 Techno-economic analysis
This section presents the results of the techno-economic analysis. As mentioned in the previous section, the
techno-economic analysis was based on information of the selected technology. The results of the
investment returns as well as the sensitivity analysis are explained in this chapter.

35
Input data
The data used in the techno-economic analysis is following explained. The values presented in this section
are taken from different literature sources.
Investment costs
The investment costs represent the total amount of money invested in the biogas plant. The total investment
cost consists of the internal - derived capital and the borrowed capital. Furthermore, the life time of the
system is being assumed to be 15 years which is the average value for biogas plants (41).
Costs of land will not be considered for this study since it is assumed that there is availability of it in the
area. The costs for the technology including the reactor, storage tanks, connection pipes for diffusion,
mixing and distributions will be taken into consideration, as well as the turbine for the production of energy
will be included. These costs are only for the biogas plant, the distribution for external connections are not
included.
The values used in this section are taken from different literature sources. The total investment costs include
the cost for the biogas plant, the microturbine and the compost system. The biogas plant’s investment cost
is the average value of a plant of 250 kWel of capacity. The cost of the microturbine is also taken considering
this capacity. The cost for the composting system was estimated as the average value for in-vessel
composting systems found in different literature sources. All these costs are summarized in .
Table 5.8 Investment costs in USD
Item Value Unit Source
Biogas plant 5,000 [USD/kWel] (32)
Microturbine 1,100 [USD/kWel] (44)
Composting system 110 [USD/t] (38; 45; 46)
For the cash flow calculations, the depreciation of the plant will be calculated by dividing the investment
costs into equal amounts over their lifetime. This depreciation will only be used for taxation purposes in
order to get the cash generated from operations (47).
Operation and Maintenance (O&M) costs
Operation costs include all the costs needed for the treatment of the organic waste including costs for the
wheel loader labor (administrative and operational), and production costs. The costs for the energy used in
the process are not considered since it is assumed that the energy required for running the plant is covered
by electricity produced within the plant.
The maintenance costs of the plant are assumed to be 2% of the investment costs (48). This value is based
in several sources found in literature. It includes the costs for repairs and general maintenance of the
equipment. The maintenance costs of the electricity generator are assumed to be 0.012 USD per kWh
produced (44).
The insurance cost of the plant is not considered in this report. Commonly, the value represents between
0.5 -1.2 % of the investment costs (48). The operational and administrative labor costs are considered as the
minimum salary in Bolivia 1,200 Bs. per month for the employees on charge of the operational activities
and 1,700 Bs (20) for administrative employees. The transportation costs are determined based on the
WABB techno-economic study and assuming that the biogas plant will be located at the same distance of
the Villa Ingenio landfill. The values used can be seen in Table 5.9.

36
Table 5.9 O&M and Transportation costs
Item Value Unit Source
Maintenance biogas plant (from the total investment costs) 2 [%] (32)
O&M microturbine 0.012 [USD/kWel] (44)
Operational labor (413 persons) 8,348 [USD] (20)
Administration labor (2 persons) 5,913 [USD] (20)
Wheel loader costs 60 [USD/hour] (49)
Unit fuel cost 0.506 [USD/t biowaste] (14)
Other transport costs 11 [USD/t biowaste] (14)
Income
The income of the biogas plant is generated from the electricity sales, the compost sales, the gate-fee for
treating the waste and the carbon credits. It is assumed that the amount of waste to be treated is available
all the time and that the electricity production is constant along the entire lifetime of the project. The
operational hours are assumed as the 70% of the total 8,760 operational hours per year.
The calculation of the electricity income is based on the electricity available be sold the grid calculated in
section 5.2 and the electricity price. The electricity available is 1,440,000 kWh per year and the electricity
price is 0.09 USD/kWh. To calculate the gate-fee for treating waste, it was used the currently value paid
from the Municipality of the city of El Alto to the company on charge of operating the landfill. The
collection and transport incomes were also calculated based on the current value paid to the company
TREBOL. All the data used for the incomes’ estimation can be seen in Table 5.10.
Table 5.10 Data used for income calculations
Item Value Unit Source
Electricity price 0.09 [USD/kWh] (55)
Compost price 140 [USD/t] (14)
Gate- Fee for waste treatment 9.3 [USD/t waste] (17)
Collection and transportation 14 [USD/t waste] (17)
The carbon credits in this model are calculated as avoided emissions of producing electricity by biogas
instead of using fossil fuels. They are presented in form of the possible revenues that can be generated by
using a renewable technology. It has to be noticed that Bolivia is against this economic mechanism, and it
is not currently being put into practice (50). However, it was decided to include this parameter in the analysis
in order to identify the benefits that can be obtained from it. The values used for the calculation are 30
USD/t CO2 for carbon price and 0.5 t CO2/MWh for the emission factor. This results in 15 USD/MWh
(51; 52).
Economic analysis
The following part presents the results of the economic analysis. Two scenarios were created: Scenario I
and Scenario II. The characteristic of each of them are in Table 5.11.
13 Average number of employees for a biogas plant for treating 10,000 t/y.

37
Table 5.11 Description of scenarios
Scenario I Scenario II
Description The biogas plant is a concessionary
company responsible for treating the waste.
The collection and transport operations are
assumed to be done by the transportation
company TREBOL currently operating in
the city of El Alto.
The plant is a concessionary company
on charge of the collection, transport
and treatment of the vegetable and fruit
market waste.
Business model In this scenario, the waste treatment
company could be a new private
concessionary company or the municipality
of the city of El Alto. Also the company
COLINA responsible for the disposal of
waste in the landfill could be on charge.
The company that could be suitable for
this scenario is the current
transportation company of the city of El
Alto, TREBOL. Since, it already have
the equipment for the transportation of
waste in the city.
Both, Scenario I and Scenario II will be evaluated taking into consideration and not the carbon credits. This
is due in Bolivia this economic mechanism is not put into practice. However, it is important to evaluate how
the carbon revenues can affect in the economic analysis.
Investment costs, O&M costs and Transportation costs.
The investment costs and the O&M costs for both, Scenario I and Scenario II, are considered to be the
same. The transportation costs are only considered for Scenario II. The total costs can be seen in
Table 5.12. It can be seen that the total investment costs are 2,017,016 USD. The total O&M
costs are 107,401USD and the transportation costs for Scenario II are estimated 115,056 USD.
Table 5.12 Investment, O&M and transport costs for a 250 kWel plant15
Costs Scenario I Scenario II
Investment costs Value [USD]
Biogas plant 1,247,554 1,247,554
Gas engine 247,462 247,462
Composting system 495,000 495,000
Total Investment costs 2,017,016 2,017,016
O&M costs
Wheel loader operational costs 31,200 31,200
Maintenance plant 40,340 40,340
Electricity generator 21,600 21,600
Labor costs 14,261 14,261
Total O&M costs 107,401 107,401
Transport costs
Cost of diesel per year - 5,056
Other transport costs - 110,000
Total transport costs - 115,056
15 Values estimated based on information from Table 5.8 and Table 5.9.

38
Incomes
As mention before, the incomes come from the electricity sales, compost sales, gate -fee and in the case of
Scenario II also from the transport-fee. The incomes for Scenario I and Scenario II are presented in Table
5.13.
Table 5.13 Incomes of Scenario I and Scenario II16
Income Scenario I with CC17
Scenario I without CC
Scenario II with CC
Scenario II without CC
Electricity sales 129,600 129,600 129,600 129,600
Compost sales 327,600 327,600 327,600 327,600
Gate-fee 93,000 93,000 93,000 93,000
Carbon revenues - 27,000 - 27,000
Transport-fee - - 140,000 140,000
Total income 550,200 577,200 690,200 717,200
Figure 5.3 shows the distribution of the incomes per source. In the four cases, the compost sales are the
main contributor of the total income with a shares of over 46% while the electricity sales contribute with
values of 18 to 24 % of the income. Regarding the gate-fee, 13 to 17% of the total income comes from it
and only 4 to 5% from the carbon revenues. In the cases of Scenario II the income from transport represents
about 20% of the total income.
Figure 5.3 Income distribution of Scenario I and Scenario II
Investment returns
All the data presented before were used for the calculations of the NPV, IRR, Payback time and the LCOE.
Table 5.14 shows the results of each scenario. It can be seen that the NPV is positive in all the cases. It
indicates that the scenarios are economically feasible. The Scenario II with carbon credits is the most
attractive since the NPV and IRR are the highest values (2,183,366 USD and 18.49% respectively).
Therefore, the concessionary company responsible for collecting, transporting and treating the waste can
16 Values estimated based on information form Table 5.10. 17 Carbon Credits

39
recover the investment costs and get benefits from implementing the biogas plant. Furthermore, the IRR
results from all the scenarios are bigger than the assumed discount rate of 5 % supporting the results of the
NPV method. Concerning the payback time, Scenario I and Scenario II have similar results. Approximately
5 years are needed to recover 100 % of the investment costs of the project.
The results of the scenarios are similar because the only difference between Scenario I and Scenario II is the
transport consideration. The difference between the transport costs (115,056 USD/year) and the transport
income (140,000 USD/year) is only 24,994 USD. For this reason, the NPV and the IRR for Scenario II are
approximately 10% higher than for Scenario I. It has to be mentioned, in this study it was assumed that the
biogas plant is located at the same distance of the Villa Ingenio Landfill. The transport costs could be reduce
if the biogas plant is located close to the collection point. In this way, the NPV of Scenario I could be even
a higher value.
Table 5.14 Economic analysis results
Scenario NPV [USD] IRR Payback time [years]
I with CC 1,989,18018 17.41% 5.2
I without CC 1,778,99219 16,23% 5.5
II with CC 2,183,36620 18.49% 5.0
II without CC 1,973,17821 17,32% 5.2
Levelized Costs of Electricity
The Levelized Cost of Electricity resulted in 0.17 USD per kWh for Scenario I and 0.26 USD per kWh for
Scenario II. See Table 5.15. Considering only this method, the Scenario I will be preferred because the
LCOE is lower. However, it has to be considered that this method evaluates only the costs of generating
the electricity. For this reason, this method is used for comparing energy costs from different technologies
and not for decision-making such as is the case of the NPV and IRR methods that evaluate the whole project
costs and revenues including the energy value.
Comparing the results of the LCOE of Scenario I and Scenario II with the LCOE of Bolivia, it can be seen
that the difference between these values is representative. The LCOE values calculated are significantly
higher than the current levelized cost for electricity generation from natural gas in Bolivia of 0.026 USD per
kWh (22). This difference is mainly due to the natural gas is highly subsidized by the Bolivian government
(the price of natural gas is 1.3 USD per Mcf) (22). This makes difficult to find an incentive for producing
biogas in El Alto. Therefore, it is necessary to search for economic mechanisms to reduce the LCOE for
biogas. This point will be discussed in the section 5.4.
Table 5.15 LCOE results
Scenario LCOE [USD/kWh]
I 0.1723
II 0.2624
18 Refer to Appendix A-1 for cash flow. 19 Refer to Appendix A-2 for cash flow. 20 Refer to Appendix B-1 for cash flow. 21 Refer to Appendix B-2 for cash flow. 23 The result includes carbon credits. Refer to Appendix A-3 for more details. 24 The result includes carbon credits. Refer to Appendix B-3 for more details.
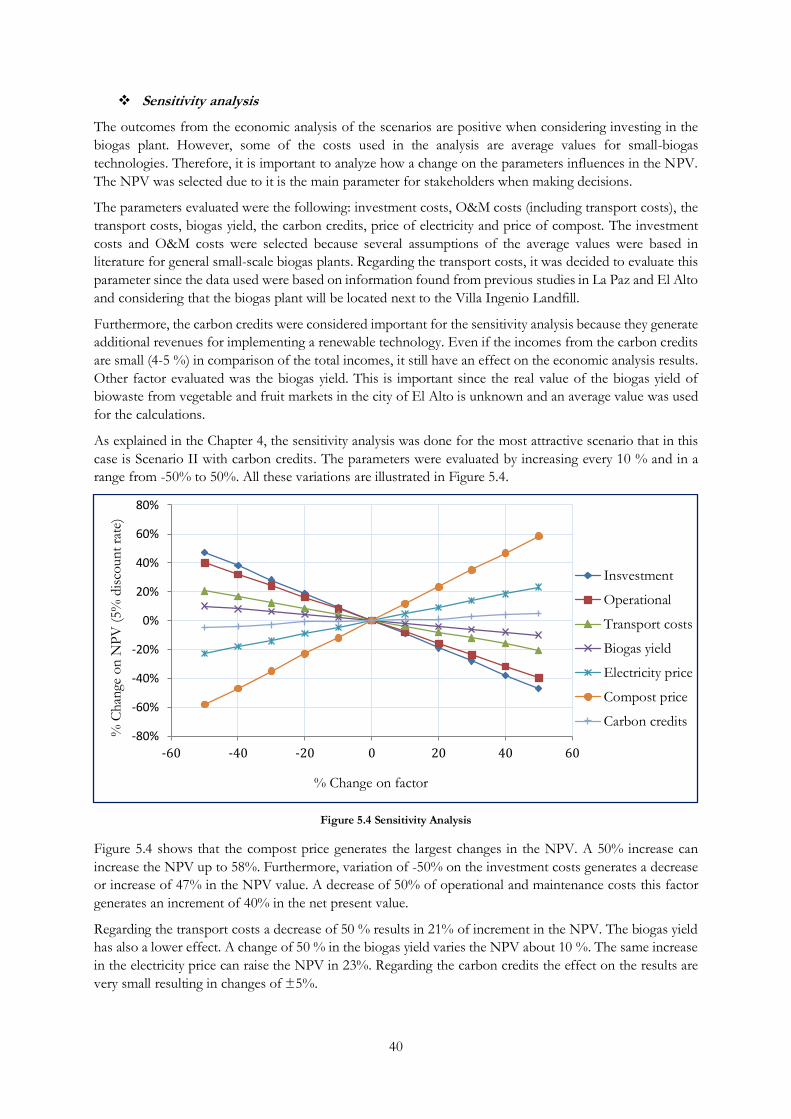
40
Sensitivity analysis
The outcomes from the economic analysis of the scenarios are positive when considering investing in the
biogas plant. However, some of the costs used in the analysis are average values for small-biogas
technologies. Therefore, it is important to analyze how a change on the parameters influences in the NPV.
The NPV was selected due to it is the main parameter for stakeholders when making decisions.
The parameters evaluated were the following: investment costs, O&M costs (including transport costs), the
transport costs, biogas yield, the carbon credits, price of electricity and price of compost. The investment
costs and O&M costs were selected because several assumptions of the average values were based in
literature for general small-scale biogas plants. Regarding the transport costs, it was decided to evaluate this
parameter since the data used were based on information found from previous studies in La Paz and El Alto
and considering that the biogas plant will be located next to the Villa Ingenio Landfill.
Furthermore, the carbon credits were considered important for the sensitivity analysis because they generate
additional revenues for implementing a renewable technology. Even if the incomes from the carbon credits
are small (4-5 %) in comparison of the total incomes, it still have an effect on the economic analysis results.
Other factor evaluated was the biogas yield. This is important since the real value of the biogas yield of
biowaste from vegetable and fruit markets in the city of El Alto is unknown and an average value was used
for the calculations.
As explained in the Chapter 4, the sensitivity analysis was done for the most attractive scenario that in this
case is Scenario II with carbon credits. The parameters were evaluated by increasing every 10 % and in a
range from -50% to 50%. All these variations are illustrated in Figure 5.4.
Figure 5.4 Sensitivity Analysis
Figure 5.4 shows that the compost price generates the largest changes in the NPV. A 50% increase can
increase the NPV up to 58%. Furthermore, variation of -50% on the investment costs generates a decrease
or increase of 47% in the NPV value. A decrease of 50% of operational and maintenance costs this factor
generates an increment of 40% in the net present value.
Regarding the transport costs a decrease of 50 % results in 21% of increment in the NPV. The biogas yield
has also a lower effect. A change of 50 % in the biogas yield varies the NPV about 10 %. The same increase
in the electricity price can raise the NPV in 23%. Regarding the carbon credits the effect on the results are
very small resulting in changes of ±5%.
-80%
-60%
-40%
-20%
0%
20%
40%
60%
80%
-60 -40 -20 0 20 40 60
Insvestment
Operational
Transport costs
Biogas yield
Electricity price
Compost price
Carbon credits
% Change on factor
% C
han
geon N
PV
(5%
dis
count
rate
)

41
The sensitivity analysis showed that an increase in the costs reduces the net present value. In contrast, higher
benefits result in bigger NPV. From all the parameters evaluated, the compost price was the factor with the
largest influence. This is due the compost revenues are the largest contributor to the total income. From the
costs analyzed, the investment costs have a largest effect on the result, followed by the O&M costs.
When analyzing only the changes in the transportation costs, they do not represent a significant change in
the NPV. However, transportation costs are depended on the distance that the waste has to be transported
and therefore a way to increase the NPV could be implementing the biogas plant close to the waste collection
points.
Regarding the results of the biogas yield, the percentages of change in the NPV value are approximately
10%. However, as mentioned before this can be due to the costs considered in the analysis are for a biogas
plant of 250 kW of electric capacity. Furthermore, the effect of changes in the carbon credits is lower than
5% on the NPV. So, in the case if the company does not decide to take into account the carbon revenues,
the NPV will still be positive.
In conclusion, the sensitivity analysis showed that even changing the parameters in percentages of ±50%,
the NPV is still positive for the Scenario II. Therefore, the investor could have possibilities to ensure the
cost-recovery by implementing the plant considering the characteristics of Scenario II.
5.4 Markets for AD byproducts in El Alto
As mentioned in Chapter 3, the byproducts of the AD process are biogas and digestate. In order to identify
if the biogas plant is a sustainable option, the byproducts should have a market. The possible markets for
these products are analyzed and discussed in this section.
Markets for biogas
As mentioned in previous chapters, the biogas produced by anaerobic digestion can have several uses. The
biogas can be used directly for cooking, electricity generation or heating. It can also be used as a vehicle fuel
after passing through an upgrading process. In this study case, it was assumed that the biogas will be used
only for electricity generation. 20 % of the total electricity from biogas is assumed to be used to cover the
electricity of the biogas plant. The rest 80% could be used to cover the electricity of the markets as it is done
in countries such as Indonesia, used to provide electricity to small and medium enterprises or provide
electricity to households located the close to the biogas plant.
The major challenge presented to introduce the electricity production from biogas to the Bolivian market is
the cost. The cost for producing 1 kWh of electricity from natural gas in Bolivia is 0.026USD due to the
subsidies of natural gas in the country. This value is really low in comparison of the costs of 0.17 and 0.26
USD/kWh estimated for electricity generation from biogas in the techno-economic section. Therefore, it is
necessary to implement certain economic mechanisms for reducing these values.
One way of reducing the costs for the production of electricity from biogas could be the implementation of
investment grants of the biogas plants. For example, the government could cover certain percentage of the
total investment costs. Giving financial loans at low interest rates can also be an option to promote waste
to biogas technologies. Countries such as Brazil, have been implementing this economic mechanism for
biogas produced in farms. Gradual reduction of the natural gas subsidies or allocation of these subsidies to
biogas can also help to encourage the implementation of biogas technologies. This gradual reduction should
be done carefully in order to avoid social conflicts in the country. Another way for supporting the biogas
technologies and reducing the costs for generating electricity could be that municipal institutions is on charge
of the biogas plant. For this situation, part of the means from the municipality could be allocated to
implement the biogas plant.
Other economic mechanism is to increase the sanitary tariff. As mentioned in Chapter 1, the sanitary costs
are subsidized in Bolivia. In the city of El Alto, 30% of the sanitary tariff is cover by the electricity consumers
and 70% is subsidized. The tariff is included in the electricity bill and depends on the range of electricity

42
consumed per year. This tariff could be increase slowly in order to support biogas technologies. Another
economic mechanism which is widely used in developed countries to support renewable technologies is the
feed-in tariff. The feed-in tariff is a subsidy given for kWh of electricity generated by biogas and it depends
on the plant capacity. A deep study should be done to determine the value of the feed-in tariff in Bolivia.
Markets for digestate
The main revenues from the anaerobic digestion plant result from the compost sales. Thus, it is necessary
to determine if the compost produced can be introduced in the Bolivian market. Bolivia has an annual
fertilizer demand of approximately 27,06926 tonnes per year. This market is covered by donations from
Japan, products from the open market and official imported products in percentages of 40%, 50 % and 10%
respectively. The donations from Japan have given the opportunity to agricultural producers to have access
to the chemical fertilizer DAP 16-48-0. The agriculture producers can buy the product directly from stores
managed by the government at the price of 43.5 USD per 50 kg of fertilizer or buy the fertilizer from the
market at of 59 USD per a bag of 50 kg of fertilizer27.
Other source for production of fertilizer is the plant of potassium chloride located in the department of
Potosi. It is estimated a currently production of 5 to 6 tonnes of fertilizer per day and it is expected that in
the next years it will generate 30 tonnes per day. Furthermore, in the city of El Alto and La Paz the worm
culture compost plant aims at producing 70 tonnes month but the product is planned to be used for
gardening purposes.
There is lack of information of the demand of fertilizer in the city of El Alto. However, studies estimated
that the department of La Paz represents 20 % of the countries demand. This represents about 5,413 tonnes
per year. The compost obtained from the biogas plant could cover 43% which could be positive since it will
be promoted the use of local organic fertilizer. Furthermore, the organic fertilizer can help to reduce the
amount of imported product which this will be beneficial for the environment due to transportation will be
reduced and therefore the CO2 emissions.
The properties of compost obtained from the digestate are rich in macronutrients and micronutrients. For
this reason, the organic fertilizer could be suitable for being used as a for soil improvement purposes
enhancing the conditions for agriculture. However, its properties should further be analyzed to determine
if it can substitute some of the fertilizers that are actually used in Bolivia.
In order to ensure the markets for biogas and organic fertilizer, it is necessary that government is actively
involved and support the waste to biogas technologies. National campaigns for awareness propagation at
local and national level should be done to promote these technologies. The implementation of the biogas
plant should be seen by the stakeholders from a broader perspective considering not only the economic
aspects but also the social and environmental benefits of this technology. Wastes to biogas technologies are
a green alternative for electricity generation and this should weight in the decision-making process.
Producing electricity by biogas reduces significantly the GHG emissions and therefore it helps to mitigate
the climate change. The implementation of biogas technologies helps to reduce the waste volume and adds
an economical value to waste.
5.5 Avoided Emissions
In order to determine the environmental benefits of implementing the biogas plant, the avoided emissions
for producing electricity by biogas instead of using natural gas were calculated. It has to be noticed that
26 (65) 27 (66)

43
avoided emissions due to replacement of fossil based fertilizers are not considered. The factor used was 0.5
tons of CO2 per MWh of electricity produced. The total avoided emissions per year were calculated to be:
𝑨𝒗𝒐𝒊𝒅𝒆𝒅 𝒆𝒎𝒊𝒔𝒔𝒊𝒐𝒏𝒔 = 𝟗𝟎𝟎 𝒕𝒐𝒏𝒔 𝒐𝒇 𝑪𝑶𝟐/𝒚𝒆𝒂𝒓
As mentioned in Chapter 1, climate change is a problem that affects developing and developed countries.
By producing electricity by biogas, Bolivia could contribute to the mitigation of the climate change. But why
is important that Bolivia contributes to the mitigation of climate change? The geographical location of
Bolivia and the poverty level of the country make it more susceptible to the effects of the climate change.
Floods, draughts and forest fires are some examples of disasters that can occur due to the climate change.
Therefore, this affects directly to the development of the agriculture in the country and therefore to the
economy.
The Bolivian government should cooperate and support technologies to reduce the emissions of GHG.
Studies have shown that the Bolivian glaciers, which provide fresh water to the country, have retracted
significantly. It is estimated 35% of the water supply for La Paz will disappear in the next 20 to 30 years.
This should be a red alert for the government since it could have serious effects in agricultural production
and clean water.
To have a more clear idea of how many the avoided emissions could represent if the biogas plant is
implemented, it can be compared with the amount of CO2 emissions per capita in Bolivia. The avoided
emissions calculated will be the equivalent to the emission generated per year of 600 persons in Bolivia.
These are only emissions avoided for replacing the natural gas by biogas for electricity generation. The total
emissions for installing the biogas plant are higher due to emissions for avoiding the disposal organic waste
into the landfill and others emissions saving can be achieved and also contribute to the reduction of carbon
dioxide emissions and therefore to the mitigation of climate change.
5.6 Social Benefits
Several benefits can be obtained by implementing anaerobic digestion plant for waste treatment. The
benefits presented in this chapter are a summary of the benefits found in literature regarding AD
technologies implemented in different countries and the possible benefits for the city of El Alto.
Renewable energy source
The climate change has been showing its consequences over the world. Disturbances and flooding and
ecological disasters have been presenting in this decades. Even if developing countries have a small
contribution of GHG emissions in comparison of developed and industrialized companies, in proportion
of its size, the emissions are an important percentage to be considered. The implementation of biogas
technologies can help the city of El Alto to be one of the contributors for the mitigation of the climate
change. Bolivia is a country is rich in natural gas and this makes it highly dependent on this fossil fuel.
Natural gas is highly pollutant and therefore new energy sources should be explored. Waste to biogas
technologies can be one of the feasible options reduce the dependency on fossil fuels in Bolivia.
Waste reduction and avoided to end in landfill
The implementation of the biogas plant could reduce the amount of waste ending in the landfill. 10,000
tonnes per year of biowaste could be reduced. This will represent approximately 6% of the total waste ending
in the landfill of Villa Ingenio. This aspect is also connected to the reduction of greenhouse gases, since
avoiding the land filling of organic waste can reduce the GHG emissions.
Job Creation
The implementation of the biogas plant in the city of El Alto can generate job opportunities for the citizens.
It was estimated a possible generation of six jobs opportunities for the biogas plant: four positions for the
operators and two positions for administrative positions. Furthermore, if the second scenario is included it
could be possible to open job opportunities for the collection and transport services needed.

44
Additionally, the implementation of a small-scale biogas plant in the city of El Alto can be the driver for
implementing AD technologies in other cities of the country. This could generate more job opportunities
for the inhabitants of Bolivia. Biogas technologies need operators and administrators for running the plant
and also capacitated technicians for building and installing the plant. This could provide short-term incomes
as well as long-term incomes for the citizens.
Improve soil condition
The compost obtained from the digestate can be used for enhancing the properties of the soil. In this study,
it was assumed that the biowaste to be treated will be 100% organic waste. Therefore, the properties of the
compost obtained could be suitable for being used for gardening or agriculture. This will promote the
production of local and organic products, generating incomes for the local producers. The compost will be
a way for recycling the nutrients such as phosphorus, potassium and nitrogen, but also several micronutrients
can be recovered.
Improve living environment
The decomposition of waste in open air causes odors which can be very uncomfortable for the market
sellers and the rest of the inhabitants of the city of El Alto. The implementation of the AD technology will
help to improve the waste management in the city and thus reduce the negative effects of waste
decomposition. The sanitary conditions and visual aspect of the market will be also improved bringing a
better environment for the citizens of El Alto.

45
6 Conclusion
The waste generated from markets in the city of El Alto was estimated to be 10,000 tonnes of organic waste
waste per year. This amount represents the 85% of the total waste generated from the markets in the city.
The technology selected for treating this amount of waste was the garage-shaped digester. This technology
suits better the conditions of El Alto in comparison to the other small-scale biogas technologies evaluated
when analyzing the lifespan, the technical knowledge and skills, the physical structure and the investment
costs. Furthermore, this technology allows saving water and provides a dry digestate which is easier to
manipulate than the slurries resulted from the other technologies.
The model for the techno-economic analysis was defined based on the garage-shaped technology. The
results from techno-economic analysis showed that implementing a small-scale biogas plant in the city of El
Alto is economically feasible for the scenarios analyzed. It has to be mentioned that these results are
estimated when electricity (sold to the grid at a price of 0.09 USD/kWh) and organic fertilizer (140
USD/tonne of fertilizer) are commercially used for earning revenues.
It was also determined that the Scenario II with the carbon revenues is the most attractive option having
the highest NPV and IRR. From a business model perspective, this could indicate that the current transport
company could be a good candidate for implementing the biogas plant. Furthermore, the analysis showed
that in Scenario II the investment costs can be recovered in a period of 5 years. The techno-economic
analysis also showed that the results from both scenarios are similar. Thus, Scenario I in which the company
(a private concessionary company or the municipality) is only on charge of treating the waste could also be
a viable option.
Regarding the LCOE, the values calculated in the two scenarios were very high in comparison to the current
LCOE of natural gas in Bolivia. LCOE values of 0.17 USD/kWh for Scenario I and 0.26 USD/kWh for
Scenario II were estimated in comparison to 0.026 USD/kWh. Therefore, implementations of economic
mechanisms are necessary to obtain comparable values. However, it has to be considered that the biogas
plant generates organic fertilizer as other byproduct. The treatment of 10,000 tonnes of biowaste can result
in 2,340 tonnes of organic fertilizer per year.
Besides, the study showed that when including the carbon credits in the analysis the NPV can be increased
in about 11%. This should be an incentive for implementing this economic mechanism in Bolivia.
Concerning the sensitivity analysis, it indicated that the NPV is strongly dependent on the compost price
and therefore on the compost sales. It was also seen that even changes of ±50% in the parameters analyzed
(costs, electricity price, compost price, carbon credits and biogas yield) results in positive NPV.
In addition, markets for the AD byproducts could exist in the city El Alto if there is support from the
Bolivian government. Economic mechanisms such as investment subsidies, financial loans at low interest
rates, feed- in tariffs or increment of the sanitary tariffs, need to be introduced in the city of El Alto to
ensure the market for electricity generated from biogas. Regarding the markets for organic fertilizer, there
could be the possibility to introduce this product in the market for example by replacing the imported
fertilizers. In this case, the government also has to intervene to promote and guarantee the use of the organic
fertilizers in the country.
The environmental benefits from the biogas plant were estimated based on the avoided emissions. A total
of 900 tonnes of CO2 per year could be avoided for electricity generation from biogas. This could lead the
city of El Alto to an active contribution for the mitigation of climate change. Moreover, several social
benefits were identified. The biogas implementation could help to reduce the dependency on fossil fuels for
electricity generation in the city of El Alto by providing a new renewable source for energy generation.
Approximately 6% of the total waste generated in the city of El Alto can be avoided to end in landfill. The
possibility of 6 new job opportunities could be open for the inhabitants of the city. The possibility of using
the organic fertilizer for soil recovery and agriculture can help to promote the production and consumption
of local products. And finally, the improvement in the environmental conditions could provide a better life
environment and sanitary conditions for the inhabitants of El Alto.

46
In conclusion, a small-scale biogas plant in the city of El Alto could be a potential generator for green
electricity and compost production when treating organic market waste. The biogas plant can achieve costs-
recovery in El Alto if markets for the byproducts are ensured. For this reason, support from the government
and municipalities in form of subsidies, awareness promotion and other economic mechanisms are essential.
The small-scale biogas plant can provide the city of El Alto not only with economic profits but also
environmental and social benefits.
Future work
A deep waste characterization study of the biowaste from the markets in the city of El Alto should be
performed in order to determine the exact biogas yield. The implementation of the pilot biogas digester
plant should be done in order to test the performance of the garage-shaped technology in the local
conditions. Specific costs for the garage-shaped technology should be obtained in order to have more
accurate results. A deeper study of the markets for biogas and organic fertilizer is necessary to be done to
define the operational sustainability of the biogas plant. Further studies concerning other uses of biogas
such as upgrading of biogas for vehicle use or injection of the natural gas to the grid should be conducted.
This study could be presented to the company TREBOL, concessionary company for collecting and
transporting the waste in the city El Alto, since the biogas plant could be an attractive option for it.

47
7 Bibliography
1. System approaches to integrated solid waste management in developing countries. Marshall, Rachael E and
Farahbakhsh, Khosrow. 4, s.l. : ELSEVIER, 2013, Vol. 33.
2. Vögeli, Yvonne, et al. Anaerobic digestion of Biowaste in Developing Countries. [Document] Dübendorf : Eawag
– Swiss Federal Institute of Aquatic Science and Technology, 2014. 978-3-906484-58-7.
3. The techno-economic potential of renewable energy through the anaerobic digestion of microalgae. Zamalloa, Carlos, et al.
102, s.l. : ELSEVIER, 2011.
4. Persson, Per Olof, et al. Cleaner Production-Strategies & Technology for Environmental Protection. Stockholm :
KTH-Royal Institute of Technology, Industrial Ecology, 2011.
5. Johannessen, Lars Mikkel and Boyer, Gabriela. Observations of Solid Waste Landfills in Developing Countries:
Africa, Asia and Latin America. Washington : The World Bank, 1999.
6. Williams, Paul T. Waste Treatment and Disposal. Chichester : Wiley, 2005. 0-470-84912-6.
7. Application of fault tree approach for technical assessment of small-scale biogas systems in Nepal. Cheng, Shikun, et al.
s.l. : ELSEVIER, 2014, Vol. 113.
8. Electrigaz Technologies Inc. Feasibility Study – Anaerobic Digester and Gas Processing Facility in the Fraser Valley,
British Columbia . s.l. : Electrigaz Technologies Inc, 2007.
9. Design of Biogas Plant from Fruit Market Waste in Indonesia. Cahyari, Khamdan and Anugrah, Putra Ryan.
Berlin : Renewable Energy Conference, 2010.
10. La digestion anaerobia como alternativa de tratamiento a los residuos solidos organicos generados en los mercados
municipales. Buenrostro, Otoniel, et al. 1, Coyoacan : Centro de Ciencias de la Atmosfera, UNAM, 2000, Vol.
16.
11. Boigas production from lllama and caw manure at high altitute. Alvarez, Rene, Villca, Saul and Liden, Gunnar.
30, s.l. : ELSEVIER, 2006.
12. Swisscontact Bolivia. Ecovecindarios Trabajamos en comunidad Memoria 2009-2012. [Document] s.l. :
Swisscontact Fundacion Suiza de Cooperacion para el Desarrollo Tecnicode , 2013.
13. INE Instituto Nacional de Estadistica. Informacion Estadistica Clima y Atmosfera. INE Instituto Nacional
de Estadistica. [Online] November 2, 2011. [Cited: 01 15, 2014.]
http://www.ine.gob.bo/indice/EstadisticasSocial.aspx?codigo80101.
14. Division of Energy and Climate. Waste to Biogas in Bolivia Techno-economic feasibility study Final Report (D8).
Stockholm : s.n., 2012.
15. Google Maps. El Alto. [Online] Google Maps, 2014. [Cited: 06 30, 2014.]
https://www.google.co.uk/maps/place/El+Alto,+Bolivia/@-16.496666,-
68.169479,47073m/data=!3m1!1e3!4m7!1m4!3m3!1s0x915edebe842e2473:0x3a1f8a2f17f89d8f!2sEl+Alto,
+Bolivia!3b1!3m1!1s0x915edebe842e2473:0x3a1f8a2f17f89d8f?hl=en.
16. Banco Interamericano de Desarrollo . PROGRAMA PARA LA IMPLEMENTACIÓN DE LA
GESTIÓN INTEGRAL DE RESIDUOS SÓLIDOS EN BOLIVIA. [Document] s.l. : Banco
Interamericano de Desarrollo .
17. EMALT Empresa Municipal de Aseo El Alto. Gestion de Residuos Solidos en la ciudad De El Alto.
[Document] El Alto : EMALT.
18. Rivas, Miguel. Terminan de instalar planta que producira 70 toneladas de abono al mes. La Razon. Week
day, 06 10, 2013.

48
19. Aue, Gabriela. The Possibilities for Biogas in Bolivia: Symbioses Between Generators of Organic Residues,Biogas
Producers and Biogas Users. Stockholm : Royal Institute of Technology, 2010.
20. Marti Herrero, Jaime, Acosta Bedoya, Fernando and Gonzalez, Liliana. Plan del Programa Nacional de
Biodigestores de Bolivia. [Document] s.l. : HIVOS, SNV, CIMNE (BeeGroup), Soluciones Practicas, 2013.
21. Alvarez A., Rene, Riera T., Victor and Villca, Saul. Proyecto 09 Produccion anaerobica de biogas Aprovechamiento
de los residuos del proceso anaerobico. La Paz : Camara Nacional de Industrias IIDEPROQ, 2004.
22. Aliaga Lordemann, Javier, Buch, Franziska and Bueno L., Adriana. El Sector Eléctrico en Bolivia .
[Domcument] s.l. : Instituto de Investigaciones Socio Economicas, 2012.
23. Division of Energy and Climate. Draft Report D6: Waste management and characterization in La Paz and El
Ato. s.l. : Division of Energy and Climate, 2012.
24. INE Instituto Nacional de Estadistica. Residuos Solidos . INE Instituto Nacional de Estadistica. [Online]
INE Instituto Nacional de Estadistica, 05 07, 2014. [Cited: 02 20, 2014.]
http://www.ine.gob.bo/indice/EstadisticaSocial.aspx?codigo=80501.
25. Rivera T., Victor, Villca, Saul and Alvarez A., Rene. Produccion anaerobica de biogas Aprovechamiento de los
residuos del proceso anaerobico. La Paz : Camara de Nacional de Industrias IIDEPROQ, 2004.
26. BEKON. BEKON. References BEKON Germany. [Online] BEKON. [Cited: March 03, 2014.]
http://www.bekon.eu/biogas-plants-103.html.
27. Al Seadi, Teodorita, et al. Biogas Handbook. Esbjerg : University of Southern Denmark Esbjerg, 2008.
ISBN 987-87-992962-0-0.
28. Schnürer, Anna and Jarvis, Åsa. Microbiological Handbook for Biogas Plants. [Document] Malmö : Swedish
Waste Management U2009:03/ Swedish Gas Centre Report 207, 2009.
29. Tesfaye Tefera, Tadious. Potential for biogas production from slaughter houses residues in Bolivia (Systematic approach
and solutions to problems related to biogas production at psycrophilic temperature). Stockholm : Royal Institute of
Technology KTH, 2009.
30. Biogas production in low-cost household digesters at the Peruvian Andes. Ferrer, Ivet, et al. 35, s.l. : ELSEVIER,
2011.
31. Christensen, Thomas. Solid Waste technology and Management. Hoboken : Wiley, 2010. 9780470666968.
32. AEBIOM European Biomass Association. A biogas roadmap for Europe. [Document] Brussels : Renewable
Energy House, 2009.
33. NNFCC The Bioeconomy Consultants. What is digestate? Anaerobic Digestion. [Online] [Cited: March 2,
2014.] http://www.biogas-info.co.uk/what-is-digestate.html.
34. Design methodology for low cost tubular digesters. Marti-Herrero, J. and Cipriano, J. s.l. : ELSEVIER, 2012, Vol.
108.
35. Energypedia. Low-Cost Polyethylen Digester. Energypedia. [Online] March 27, 2014. [Cited: March 29,
2014.] https://energypedia.info/wiki/Fixed-dome_Biogas_Plants#Low-
Cost_Polyethylen_Tube_Digester.
36. Natural Resources Management and Environment Department. Biomass and Coal (The non-petroleum
fuels). FAO Corporate Document Repository. [Online] [Cited: March 29, 2014.]
http://www.fao.org/docrep/010/ah810e/AH810E13.htm.
37. Field performance of small-scale anerobic digesters treating food waste. Fang Lou, Xian, Nair, Jaya and Ho, Goen.
16, s.l. : El Sevier, 2012.

49
38. Zero Waste Enery . Systems & Approaches that Deliver a Solid Return on Investment. Zero Waste Enery
. [Online] Zero Waste Enery, 2013. [Cited: 03 15, 2014.] http://zerowasteenergy.com/getting-
started/financial-return/.
39. Department of Communities and Local Goverment. Multi-criteria analysis: a manual. [Document] London :
Communities and Local Goverment Publications, 2009. ISBN: 978-4098-1023-0.
40. Technocal and economical assessment of Power Generation from Biogas. Surroop, Dinesh and Romeela, Mohee.
Singapore : IACSIT Press, 2012, Vol. 30.
41. Information and Advisory Service on Appropriate Technology and GTZ. Biogas Digest Volume III Biogas
- Costs and Benefits and Biogas - Programme Implementation. [Document] s.l. : Information and Advisory Service
on Appropriate Technology.
42. A formal framework for scenario development in support of environmental decision-making. Mahmoud Mohammed,
et.al. 24, s.l. : El Sevier, 2009.
43. Delta Consult Ltda. Impuestos que afectan a las compañías, directa o indirectamente . Delta Consult Ltda.
[Online] Delta Consult Ltda., 2007. [Cited: 03 10, 2014.] http://www.dcl.com.bo/negocio_impuestos.htm.
44. U.S. Environmental Protection Agency, Combined Heat and Power Partnership. Biomass Combined Heat
and Power Catalog of Technologies. [Document] s.l. : U.S. Environmental Protection Agency, 2007.
45. Regenstain, Joe M., et al. Small and medium scale composting of food waste in New York City. [Document] New
York : Cornell University, City Green Inc., 1999.
46. Celtic BioEnery. Rose Hill Compost Facility. [Document] s.l. : Celtic BioEnery, 2009.
47. Jiambalvo, James. The Cash Flow Statement and Decisions. [Document] s.l. : Wiley, 2013.
48. Information and Advisory Service on Appropiate Technology and GTZ. Biogas Digest Volume III Biogas-
Costs and Benefits and Biogas - Programme Implementation. [Document] s.l. : Information and Advisory Service on
Appropiate Technology and GTZ.
49. Hinojosa Maquinarias y Construccion S.R.L. Maquinaria en alquiler. Hinojosa Maquinarias y Construccion
S.R.L. [Online] Hinojosa Maquinarias y Construccion S.R.L., 2010. [Cited: 03 15, 2014.] http://hmc-
maquinarias.com/maquinaria-alquiler.php.
50. Benton-Connell, Kylie. Will Programs to Off-Set Carbon Emissions Fuel Further Conflict in Bolivia's
Forests? AlterNet. [Online] 11 21, 2011. [Cited: 03 20, 2014.]
http://www.alternet.org/story/153161/will_programs_to_off-
set_carbon_emissions_fuel_further_conflict_in_bolivia's_forests.
51. International Energy Agency, Nuclear Energy Agency, Organization for Economic Co-operation and
Development. Projected Costs of Generating Electricity . [Document] Paris : Organization for Economic Co-
operation and Development, 2010. 978-92-64-08430-8.
52. Brander, Matthew, et al. Technical Paper/ Electricity scpecific emission factors for grid electricity. [Document] s.l. :
Ecometrica.
53. Balasubramaniyam, Urmila, et al. Biogas production in climates with long winters. [Document] Wageningen :
Wageningen UR, 2008.
54. Lam, Jam and ter Heegde, Felix. Domestic biogas compact course. [Hand-out for students] s.l. : University of
Oldenburg, 2012.
55. Anf- Agencia. Gobierno crea Delapaz y anuncia rebaja de tarifas de electricidad en provincias. Los
Tiempos. 2013.

50
56. Bobeck, Michaela. Organic Household Waste in Dveloping Countries An overview of environmental anf health
consequences, and appropiate decentralized technologies and strategies for sustainable managent. s.l. : Miduniversitetet Mid
Sweden University, 2010.
57. European Biomass Association. European Biomass Association. European Biomass Association A Biogas
road Map for Europe. [Online] October 2009. [Cited: February 26, 2014.] http://www.aebiom.org/wp/wp-
content/uploads/file/Publications/Brochure_BiogasRoadmap_WEB.pdf.
58. Swedish Gas Technology Centre Ltd (SGC). Basic Data on Biogas. MALMÖ : SGC, 2012. ISBN: 978-91-
85207-10-7.
59. Jørgensen, Peter Jacob and Planenergi. Biogas Green Energi . Aarhus : Faculty of Agricultural Sciences,
Aarhus University, 2009. ISBN 978-87-992243-2-1.
60. Baltic Biogas Bus. Baltic Biogas Bus. About Biogas. [Online] Baltic Biogas Bus Project, 2009. [Cited: March
3, 2014.] http://www.balticbiogasbus.eu/web/about-biogas.aspx.
61. Agencia Nacioanal de Hidrocarburos. REGULACIÓN ECONÓMICA. Agencia Nacional de Hitrocarburos
Web site. [Online] Agencia Nacional de Hitrocarburos, March 6, 2014. [Cited: March 5, 2014.]
http://www.anh.gob.bo/index.php?N=dre.
62. 2cg Waste Management Consulting Services . The Composting Process. [Document] s.l. : 2cg Waste
Management Consulting Services .
63. All Power Labs. Gasifier Types. All Power Labs personal scale power . [Online] All Power Labs, 2014. [Cited:
04 2014, 27.] http://www.gekgasifier.com/info/gasification-basics/gasifier-types.
64. Slunge, Daniel and von Walter, Susanne. Environment and Climate Change in Bolivia Challenges and
Opportunities for Development. [Ducument] Gothenburg : Sida’s Helpdesk for environment and climate change,
2013.
65. ORGANIZACIÓN DE LAS NACIONES UNIDAS PARA LA AGRICULTURA Y. Bolivia hacia una
estrategia de Fertilizantes. [Document] Rome : FAO, 1999.
66. Estado Plurinacional de Bolivia Ministerio de Desarrollo Productivo y Economia Plural. Fertilizantes para
Pequeños Productores . [Document] La Paz : Insumos Bolivia.
67. Evaluating benefits of low-cost household digesters for rural Andean communities. Garfi, Marianna, et al. 16,
Barcelona : ELSEVIER, 20012.

Appendix

i
Appendix A-1 Cash Flows Scenario I with Carbon Credits
2014 2015 2016 2017 2018 2019 2020 2021 2022 2023 2024 2025 2026 2027 2028 2029
0 1 2 3 4 5 6 7 8 9 10 11 12 13 14 15
(+)Revenues 577,200 577,200 577,200 577,200 577,200 577,200 577,200 577,200 577,200 577,200 577,200 577,200 577,200 577,200 577,200
(-)O&M costs 107,401 107,401 107,401 107,401 107,401 107,401 107,401 107,401 107,401 107,401 107,401 107,401 107,401 107,401 107,401
(-) Transport costs 0 0 0 0 0 0 0 0 0 0 0 0 0 0 0
TOTAL O&M COSTS 107,401 107,401 107,401 107,401 107,401 107,401 107,401 107,401 107,401 107,401 107,401 107,401 107,401 107,401 107,401
Earnings before interest, taxes, depreciation and amortization 469,799 469,799 469,799 469,799 469,799 469,799 469,799 469,799 469,799 469,799 469,799 469,799 469,799 469,799 469,799
(-)Depreciation and Amortization 134,468 134,468 134,468 134,468 134,468 134,468 134,468 134,468 134,468 134,468 134,468 134,468 134,468 134,468 134,468
Earnings before interest and taxes 335,331 335,331 335,331 335,331 335,331 335,331 335,331 335,331 335,331 335,331 335,331 335,331 335,331 335,331 335,331
(-)Taxes 25% 83,833 83,833 83,833 83,833 83,833 83,833 83,833 83,833 83,833 83,833 83,833 83,833 83,833 83,833 83,833
Net Income 251,498 251,498 251,498 251,498 251,498 251,498 251,498 251,498 251,498 251,498 251,498 251,498 251,498 251,498 251,498
(+)Depreciation and Amortization 134,468 134,468 134,468 134,468 134,468 134,468 134,468 134,468 134,468 134,468 134,468 134,468 134,468 134,468 134,468
(-)Investments 2,017,016
Free cash flow (2,017,016) 385,966 385,966 385,966 385,966 385,966 385,966 385,966 385,966 385,966 385,966 385,966 385,966 385,966 385,966 385,966
Discount rate 5.00%
Net Present Value(NPV) $1,989,180
Internal Rate of Return(IRR) 17.41%
Payback time[year] 5.2

ii
Appendix A-2 Cash Flows Scenario I without Carbon Credits
2014 2015 2016 2017 2018 2019 2020 2021 2022 2023 2024 2025 2026 2027 2028 2029
0 1 2 3 4 5 6 7 8 9 10 11 12 13 14 15
(+)Revenues 550,200 550,200 550,200 550,200 550,200 550,200 550,200 550,200 550,200 550,200 550,200 550,200 550,200 550,200 550,200
(-)O&M costs 107,401 107,401 107,401 107,401 107,401 107,401 107,401 107,401 107,401 107,401 107,401 107,401 107,401 107,401 107,401
(-) Transport costs 0 0 0 0 0 0 0 0 0 0 0 0 0 0 0
TOTAL O&M Costs 107,401 107,401 107,401 107,401 107,401 107,401 107,401 107,401 107,401 107,401 107,401 107,401 107,401 107,401 107,401
Earnings before interest, taxes, depreciation and amortization 442,799 442,799 442,799 442,799 442,799 442,799 442,799 442,799 442,799 442,799 442,799 442,799 442,799 442,799 442,799
(-)Depreciation and Amortization 134,468 134,468 134,468 134,468 134,468 134,468 134,468 134,468 134,468 134,468 134,468 134,468 134,468 134,468 134,468
Earnings before interest and taxes 308,331 308,331 308,331 308,331 308,331 308,331 308,331 308,331 308,331 308,331 308,331 308,331 308,331 308,331 308,331
(-)Taxes 25% 77,083 77,083 77,083 77,083 77,083 77,083 77,083 77,083 77,083 77,083 77,083 77,083 77,083 77,083 77,083
Net Income 231,248 231,248 231,248 231,248 231,248 231,248 231,248 231,248 231,248 231,248 231,248 231,248 231,248 231,248 231,248
(+)Depreciation and Amortization 134,468 134,468 134,468 134,468 134,468 134,468 134,468 134,468 134,468 134,468 134,468 134,468 134,468 134,468 134,468
(-)Investments 2,017,016
Free cash flow (2,017,016) 365,716 365,716 365,716 365,716 365,716 365,716 365,716 365,716 365,716 365,716 365,716 365,716 365,716 365,716 365,716
Discount rate 5.00%
Net Present Value(NPV) 1,778,992
Internal Rate of Return(IRR) 16.23%
Payback time[year] 5.5

iii
Appendix A-3 LCOE Scenario I
Levelized Cost of electricity/year 0 1 2 3 4 5 6 7 8 9 10 11 12 13 14 15
Investment costs 2,017,016 134,468 134,468 134,468 134,468 134,468 134,468 134,468 134,468 134,468 134,468 134,468 134,468 134,468 134,468 134,468
O%M costs 107,401 107,401 107,401 107,401 107,401 107,401 107,401 107,401 107,401 107,401 107,401 107,401 107,401 107,401 107,401
Transport Costs 0 0 0 0 0 0 0 0 0 0 0 0 0 0 0
Carbon Credits 15.00 15.00 15.00 15.00 15.00 15.00 15.00 15.00 15.00 15.00 15.00 15.00 15.00 15.00 15.00
Carbon Price [USD/ton CO2] 30 30 30 30 30 30 30 30 30 30 30 30 30 30 30
Avoided emissions [ton CO2/MWh] 0.50 0.50 0.50 0.50 0.50 0.50 0.50 0.50 0.50 0.50 0.50 0.50 0.50 0.50 0.50
Electricity produced[kWh/year] 1,800,000 1,800,000 1,800,000 1,800,000 1,800,000 1,800,000 1,800,000 1,800,000 1,800,000 1,800,000 1,800,000 1,800,000 1,800,000 1,800,000 1,800,000
Carbon Revenues 27,000 27,000 27,000 27,000 27,000 27,000 27,000 27,000 27,000 27,000 27,000 27,000 27,000 27,000 27,000
Discount rate 5.00%
SUMt(It+O&M+At-Ct+Dt)*(1+r)^-t 3,223,033 214,869 214,869 214,869 214,869 214,869 214,869 214,869 214,869 214,869 214,869 214,869 214,869 214,869 214,869 214,869
SUM(Et*(1+r)^-t) 18,683,384 1,714,286 1,632,653 1,554,908 1,480,864 1,410,347 1,343,188 1,279,226 1,218,311 1,160,296 1,105,044 1,052,423 1,002,307 954,578 909,122 865,831
LCOE[USD/kWh] 0.17

iv
Appendix B-1 Cash flow Scenario II with Carbon Credits
2014 2015 2016 2017 2018 2019 2020 2021 2022 2023 2024 2025 2026 2027 2028 2029
0 1 2 3 4 5 6 7 8 9 10 11 12 13 14 15
(+)Revenues 717,200 717,200 717,200 717,200 717,200 717,200 717,200 717,200 717,200 717,200 717,200 717,200 717,200 717,200 717,200
(-)O&M costs 107,401 107,401 107,401 107,401 107,401 107,401 107,401 107,401 107,401 107,401 107,401 107,401 107,401 107,401 107,401
(-) Transport costs 115,056 115,056 115,056 115,056 115,056 115,056 115,056 115,056 115,056 115,056 115,056 115,056 115,056 115,056 115,056
TOTAL O&M COSTS 222,457 222,457 222,457 222,457 222,457 222,457 222,457 222,457 222,457 222,457 222,457 222,457 222,457 222,457 222,457
Earnings before interest, taxes, depreciation and amortization 494,743 494,743 494,743 494,743 494,743 494,743 494,743 494,743 494,743 494,743 494,743 494,743 494,743 494,743 494,743
(-)Depreciation and Amortization 134,468 134,468 134,468 134,468 134,468 134,468 134,468 134,468 134,468 134,468 134,468 134,468 134,468 134,468 134,468
Earnings before interest and taxes 360,276 360,276 360,276 360,276 360,276 360,276 360,276 360,276 360,276 360,276 360,276 360,276 360,276 360,276 360,276
(-)Taxes 25% 90,069 90,069 90,069 90,069 90,069 90,069 90,069 90,069 90,069 90,069 90,069 90,069 90,069 90,069 90,069
Net Income 270,207 270,207 270,207 270,207 270,207 270,207 270,207 270,207 270,207 270,207 270,207 270,207 270,207 270,207 270,207
(+)Depreciation and Amortization 134,468 134,468 134,468 134,468 134,468 134,468 134,468 134,468 134,468 134,468 134,468 134,468 134,468 134,468 134,468
(-)Investments 2,017,016
Free cash flow (2,017,016) 404,674 404,674 404,674 404,674 404,674 404,674 404,674 404,674 404,674 404,674 404,674 404,674 404,674 404,674 404,674
Discount rate 5.00%
Net Present Value(NPV) 2,183,366
Internal Rate of Return(IRR) 18.49%
Payback time[year] 5.0

v
Appendix B-2 Cash flow Scenario II without Carbon Credits
2014 2015 2016 2017 2018 2019 2020 2021 2022 2023 2024 2025 2026 2027 2028 2029
0 1 2 3 4 5 6 7 8 9 10 11 12 13 14 15
(+)Revenues 690,200 690,200 690,200 690,200 690,200 690,200 690,200 690,200 690,200 690,200 690,200 690,200 690,200 690,200 690,200
(-)O&M costs 107,401 107,401 107,401 107,401 107,401 107,401 107,401 107,401 107,401 107,401 107,401 107,401 107,401 107,401 107,401
(-) Transport costs 115,056 115,056 115,056 115,056 115,056 115,056 115,056 115,056 115,056 115,056 115,056 115,056 115,056 115,056 115,056
TOTAL O&M Costs 222,457 222,457 222,457 222,457 222,457 222,457 222,457 222,457 222,457 222,457 222,457 222,457 222,457 222,457 222,457
Earnings before interest, taxes, depreciation and amortization 467,743 467,743 467,743 467,743 467,743 467,743 467,743 467,743 467,743 467,743 467,743 467,743 467,743 467,743 467,743
(-)Depreciation and Amortization 134,468 134,468 134,468 134,468 134,468 134,468 134,468 134,468 134,468 134,468 134,468 134,468 134,468 134,468 134,468
Earnings before interest and taxes 333,276 333,276 333,276 333,276 333,276 333,276 333,276 333,276 333,276 333,276 333,276 333,276 333,276 333,276 333,276
(-)Taxes 25% 83,319 83,319 83,319 83,319 83,319 83,319 83,319 83,319 83,319 83,319 83,319 83,319 83,319 83,319 83,319
Net Income 249,957 249,957 249,957 249,957 249,957 249,957 249,957 249,957 249,957 249,957 249,957 249,957 249,957 249,957 249,957
(+)Depreciation and Amortization 134,468 134,468 134,468 134,468 134,468 134,468 134,468 134,468 134,468 134,468 134,468 134,468 134,468 134,468 134,468
(-)Investments 2,017,016
Free cash flow (2,017,016) 384,424 384,424 384,424 384,424 384,424 384,424 384,424 384,424 384,424 384,424 384,424 384,424 384,424 384,424 384,424
Discount rate 5.00%
Net Present Value(NPV) 1,973,178
Internal Rate of Return(IRR) 17.32%
Payback time[year] 5.2

vi
Appendix B-3 LCOE Scenario II
Levelized Cost of electricity/year 0 1 2 3 4 5 6 7 8 9 10 11 12 13 14 15
Investment costs 2,017,016 134,468 134,468 134,468 134,468 134,468 134,468 134,468 134,468 134,468 134,468 134,468 134,468 134,468 134,468 134,468
O%M costs 107,401 107,401 107,401 107,401 107,401 107,401 107,401 107,401 107,401 107,401 107,401 107,401 107,401 107,401 107,401
Transport Costs 115,056 115,056 115,056 115,056 115,056 115,056 115,056 115,056 115,056 115,056 115,056 115,056 115,056 115,056 115,056
Carbon Credits 15.00 15.00 15.00 15.00 15.00 15.00 15.00 15.00 15.00 15.00 15.00 15.00 15.00 15.00 15.00
Carbon Price [USD/ton CO2] 30 30 30 30 30 30 30 30 30 30 30 30 30 30 30
Avoided emissions [ton CO2/MWh] 0.50 0.50 0.50 0.50 0.50 0.50 0.50 0.50 0.50 0.50 0.50 0.50 0.50 0.50 0.50
Electricity produced[kWh/year] 1,800,000 1,800,000 1,800,000 1,800,000 1,800,000 1,800,000 1,800,000 1,800,000 1,800,000 1,800,000 1,800,000 1,800,000 1,800,000 1,800,000 1,800,000
Carbon Revenues 27,000 27,000 27,000 27,000 27,000 27,000 27,000 27,000 27,000 27,000 27,000 27,000 27,000 27,000 27,000
Discount rate 5.00%
SUMt(It+O&M+At-Ct+Dt)*(1+r)^-t 4,948,866 329,924 329,924 329,924 329,924 329,924 329,924 329,924 329,924 329,924 329,924 329,924 329,924 329,924 329,924 329,924
SUM(Et*(1+r)^-t) 18,683,384 1,714,286 1,632,653 1,554,908 1,480,864 1,410,347 1,343,188 1,279,226 1,218,311 1,160,296 1,105,044 1,052,423 1,002,307 954,578 909,122 865,831
LCOE[USD/kWh] 0.26