techno-economics of methane mitigation at oil sites in … · techno-economics of methane...
TRANSCRIPT

EERL Methane SymposiumCarleton University, Ottawa, Canada,
November 21, 2017
© David Tyner and Matthew Johnson, 2017 1
Techno-Economics of
Methane Mitigation at Oil Sites in AlbertaImplications for Achieving Reductions
David Tyner, Ph.D.
Prof. Matthew Johnson, Ph.D., P.Eng.
EERL Methane Symposium
November 21, 2017
2015 Methane Emissions
▪ ECCC 2015 Alberta total 1.06 MtCH4 (26.4 MtCO2e)
▪ Methane from reported flaring and venting in Alberta
totalled 254 ktCH4 in 2015
▪ 90% of reported CH4 emissions
from conventional oil sites
2
EERL Methane SymposiumCarleton University, Ottawa, Canada,
November 21, 2017
© David Tyner and Matthew Johnson, 2017 2
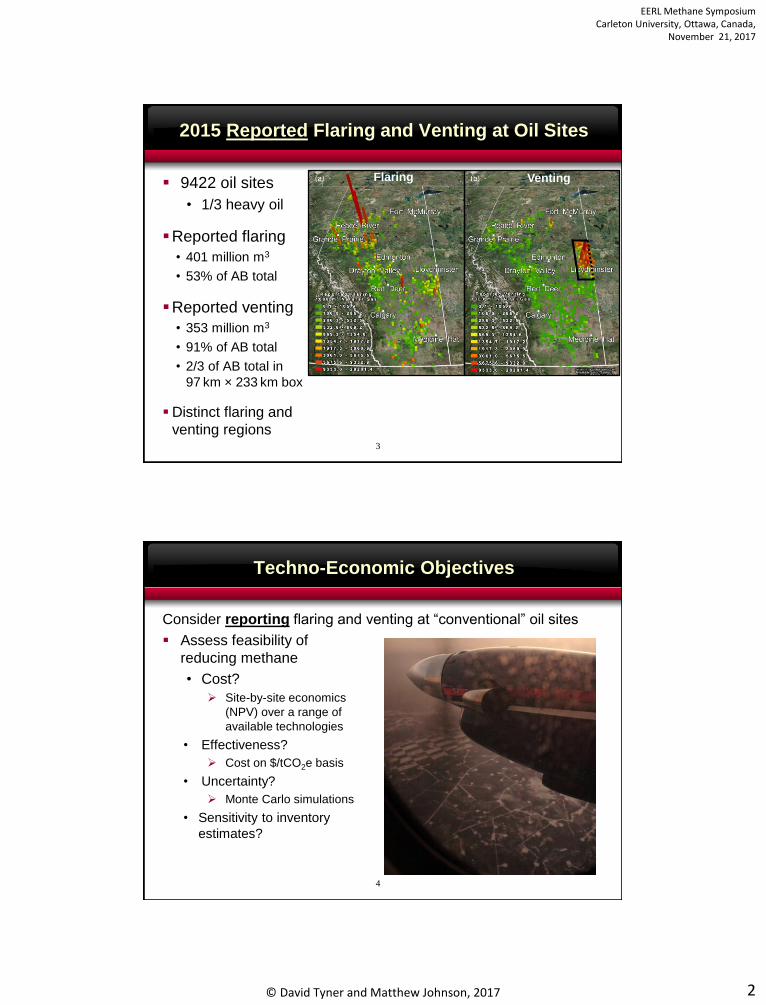
2015 Reported Flaring and Venting at Oil Sites
▪ 9422 oil sites
• 1/3 heavy oil
▪Reported flaring
• 401 million m3
• 53% of AB total
▪Reported venting
• 353 million m3
• 91% of AB total
• 2/3 of AB total in
97 km × 233 km box
▪Distinct flaring and
venting regions3
Flaring Venting
Techno-Economic Objectives
Consider reporting flaring and venting at “conventional” oil sites
▪ Assess feasibility of
reducing methane
• Cost?
➢ Site-by-site economics
(NPV) over a range of
available technologies
• Effectiveness?
➢ Cost on $/tCO2e basis
• Uncertainty?
➢ Monte Carlo simulations
• Sensitivity to inventory
estimates?
4

EERL Methane SymposiumCarleton University, Ottawa, Canada,
November 21, 2017
© David Tyner and Matthew Johnson, 2017 3
Conventional Oil includes Small Sites
▪ CHOPS well site near
Lloydminster
5
35m
Conventional Oil includes Big Sites
▪ Crude Bitumen Multi-well
Proration Battery near Peace
River (Seal Lake)
6
350m
EERL Methane SymposiumCarleton University, Ottawa, Canada,
November 21, 2017
© David Tyner and Matthew Johnson, 2017 4
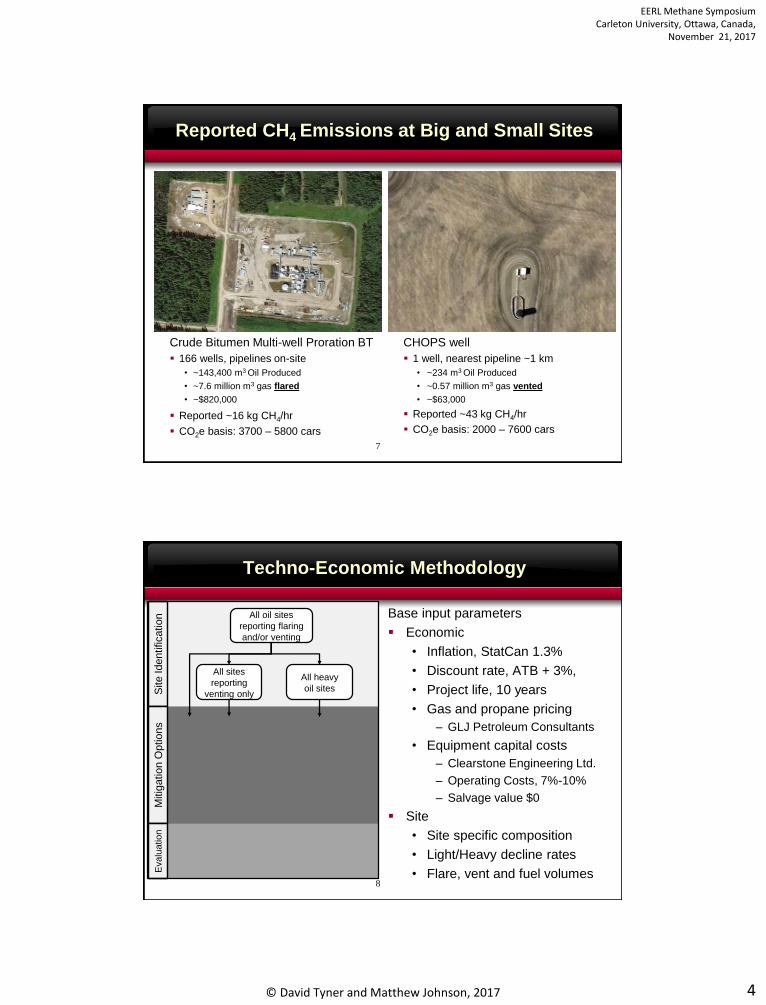
Reported CH4 Emissions at Big and Small Sites
Crude Bitumen Multi-well Proration BT
▪ 166 wells, pipelines on-site
• ~143,400 m3 Oil Produced
• ~7.6 million m3 gas flared
• ~$820,000
▪ Reported ~16 kg CH4/hr
▪ CO2e basis: 3700 – 5800 cars
7
CHOPS well
▪ 1 well, nearest pipeline ~1 km
• ~234 m3 Oil Produced
• ~0.57 million m3 gas vented
• ~$63,000
▪ Reported ~43 kg CH4/hr
▪ CO2e basis: 2000 – 7600 cars
Techno-Economic Methodology
Base input parameters
▪ Economic
• Inflation, StatCan 1.3%
• Discount rate, ATB + 3%,
• Project life, 10 years
• Gas and propane pricing
– GLJ Petroleum Consultants
• Equipment capital costs
– Clearstone Engineering Ltd.
– Operating Costs, 7%-10%
– Salvage value $0
▪ Site
• Site specific composition
• Light/Heavy decline rates
• Flare, vent and fuel volumes8
All oil sites
reporting flaring
and/or venting
All heavy
oil sites
All sites
reporting
venting onlySite Identificatio
n
Mitig
atio
n O
ptio
ns
Evalu
ation

EERL Methane SymposiumCarleton University, Ottawa, Canada,
November 21, 2017
© David Tyner and Matthew Johnson, 2017 5
Techno-Economic Methodology
9
Site Identificatio
n
Mitig
atio
n O
ptio
ns
All oil sites
reporting flaring
and/or venting
All sites
reporting
venting only
All heavy
oil sites
Tie-in
Evalu
ation
Techno-Economic Methodology
10
Site Identificatio
n
Mitig
atio
n O
ptio
ns
All oil sites
reporting flaring
and/or venting
All sites
reporting
venting only
All heavy
oil sites
Tie-in
Evalu
ation

EERL Methane SymposiumCarleton University, Ottawa, Canada,
November 21, 2017
© David Tyner and Matthew Johnson, 2017 6
Techno-Economic Methodology
11
Site Identificatio
n
Mitig
atio
n O
ptio
ns
All oil sites
reporting flaring
and/or venting
All sites
reporting
venting only
All heavy
oil sites
Tie-in Flare
Evalu
ation
Techno-Economic Methodology
12
Site Identificatio
n
Mitig
atio
n O
ptio
ns
All oil sites
reporting flaring
and/or venting
All sites
reporting
venting only
All heavy
oil sites
Tie-in Flare
Catalytic Line Heaters
Auxiliary Burners
Evalu
ation
EERL Methane SymposiumCarleton University, Ottawa, Canada,
November 21, 2017
© David Tyner and Matthew Johnson, 2017 7
Techno-Economic Methodology
13
Site Identificatio
n
Mitig
atio
n O
ptio
ns
All oil sites
reporting flaring
and/or venting
All sites
reporting
venting only
All heavy
oil sites
Tie-in Flare
Catalytic Conversion
Catalytic Line Heaters
Auxiliary Burners
Vapour Combustors
Evalu
ation
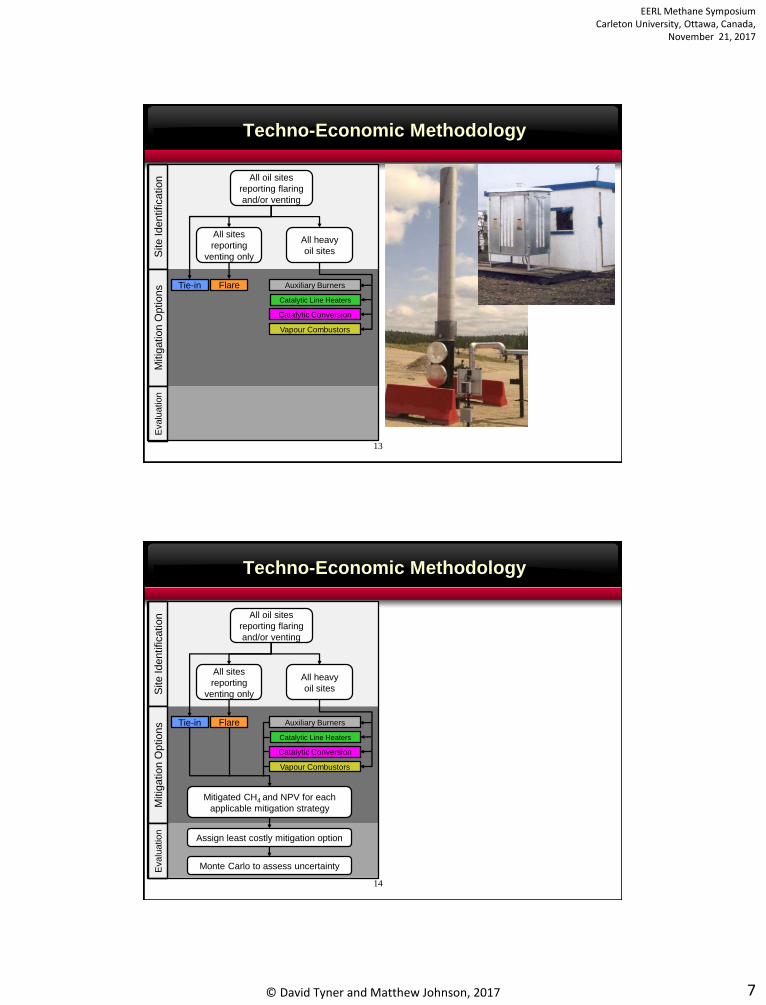
Techno-Economic Methodology
14
Site Identificatio
n
Mitig
atio
n O
ptio
ns
All oil sites
reporting flaring
and/or venting
All sites
reporting
venting only
All heavy
oil sites
Tie-in Flare
Catalytic Conversion
Catalytic Line Heaters
Auxiliary Burners
Vapour Combustors
Mitigated CH4 and NPV for each
applicable mitigation strategy
Evalu
ation
Assign least costly mitigation option
Monte Carlo to assess uncertainty
EERL Methane SymposiumCarleton University, Ottawa, Canada,
November 21, 2017
© David Tyner and Matthew Johnson, 2017 8
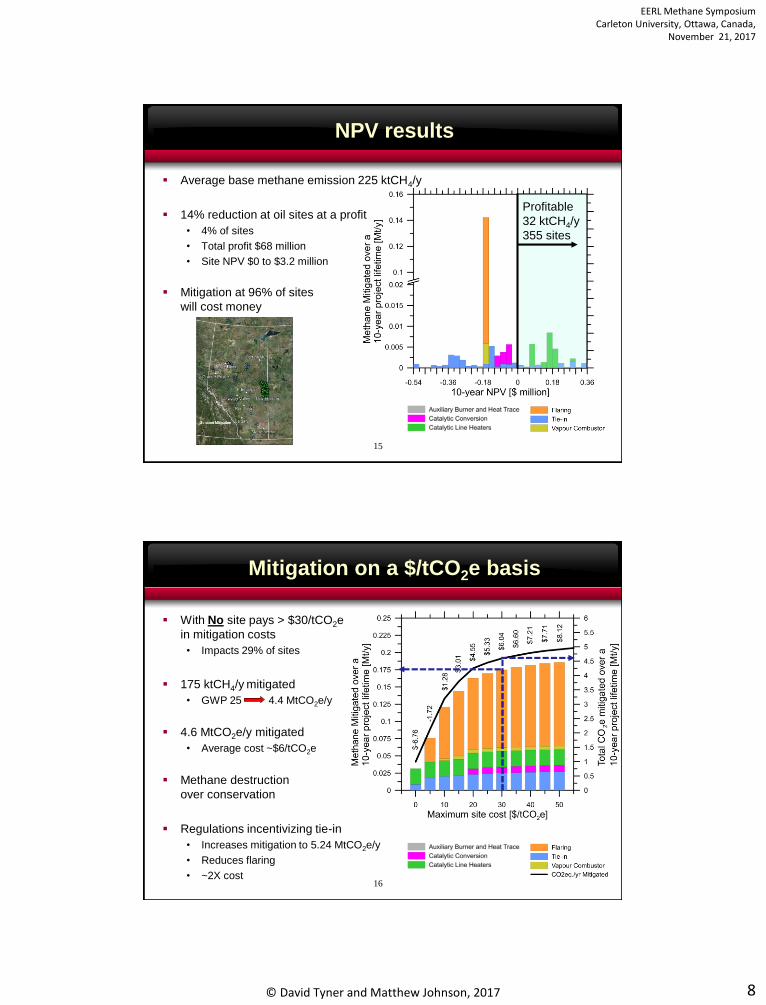
NPV results
▪ Average base methane emission 225 ktCH4/y
▪ 14% reduction at oil sites at a profit
• 4% of sites
• Total profit $68 million
• Site NPV $0 to $3.2 million
▪ Mitigation at 96% of sites
will cost money
15
Profitable
32 ktCH4/y
355 sites
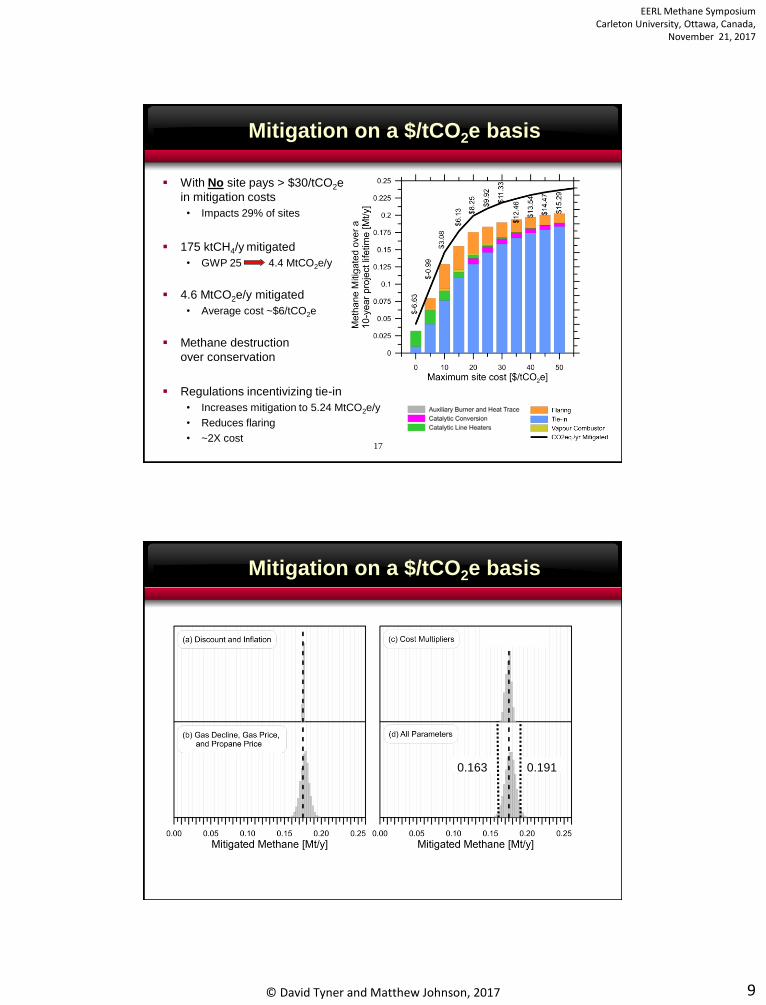
Mitigation on a $/tCO2e basis
▪ With No site pays > $30/tCO2e
in mitigation costs
• Impacts 29% of sites
▪ 175 ktCH4/y mitigated
• GWP 25 4.4 MtCO2e/y
▪ 4.6 MtCO2e/y mitigated
• Average cost ~$6/tCO2e
▪ Methane destruction
over conservation
▪ Regulations incentivizing tie-in
• Increases mitigation to 5.24 MtCO2e/y
• Reduces flaring
• ~2X cost 16
EERL Methane SymposiumCarleton University, Ottawa, Canada,
November 21, 2017
© David Tyner and Matthew Johnson, 2017 9
Mitigation on a $/tCO2e basis
▪ With No site pays > $30/tCO2e
in mitigation costs
• Impacts 29% of sites
▪ 175 ktCH4/y mitigated
• GWP 25 4.4 MtCO2e/y
▪ 4.6 MtCO2e/y mitigated
• Average cost ~$6/tCO2e
▪ Methane destruction
over conservation
▪ Regulations incentivizing tie-in
• Increases mitigation to 5.24 MtCO2e/y
• Reduces flaring
• ~2X cost 17
σNet Cost
σ CO2e≈ $6/tCO2e
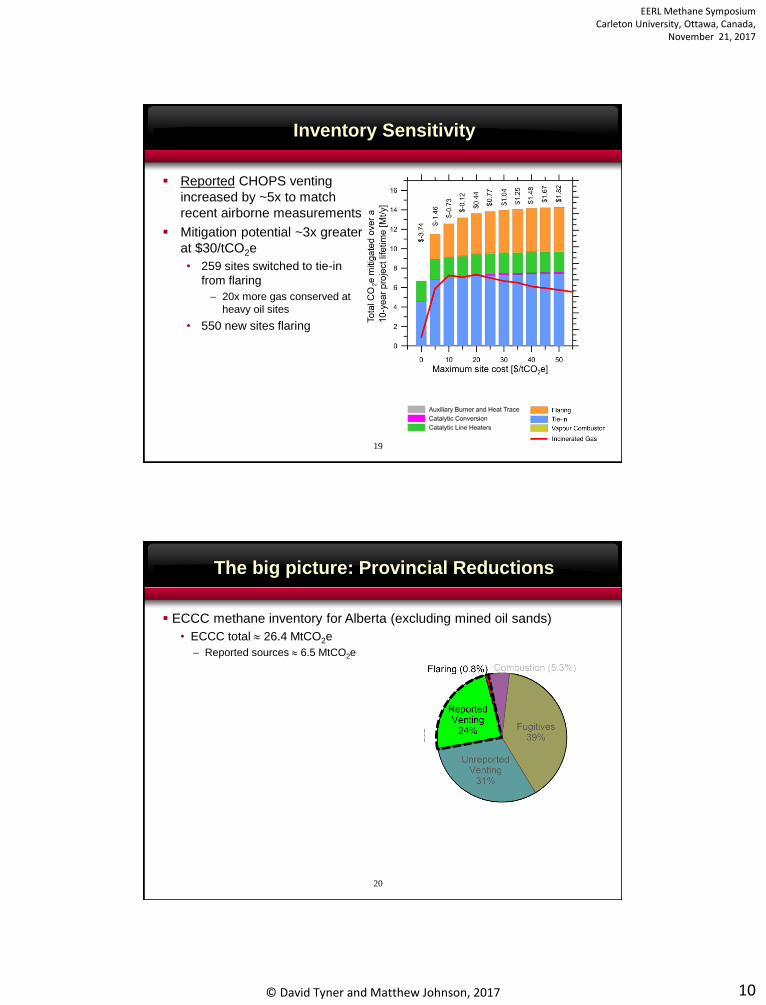
Mitigation on a $/tCO2e basis
▪ With No site pays > $30/tCO2e
in mitigation costs
• Impacts 29% of sites
▪ 175 ktCH4/y mitigated
• GWP 25 4.4 MtCO2e/y
▪ 4.6 MtCO2e/y mitigated
• Average cost ~$6/tCO2e
▪ Methane destruction
over conservation
▪ Regulations incentivizing tie-in
• Increases mitigation to 5.24 MtCO2e/y
• Reduces flaring
• ~2X cost 18
σNet Cost
σ CO2e≈ $6/tCO2e
0.163 0.191
EERL Methane SymposiumCarleton University, Ottawa, Canada,
November 21, 2017
© David Tyner and Matthew Johnson, 2017 10
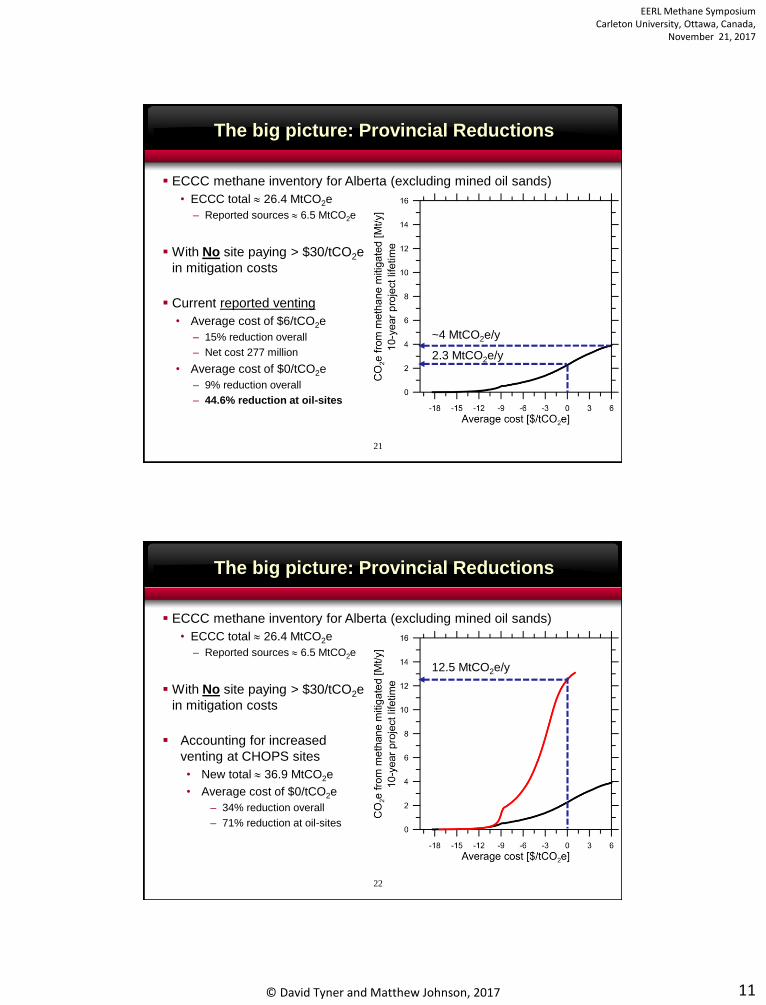
Inventory Sensitivity
▪ Reported CHOPS venting
increased by ~5x to match
recent airborne measurements
▪ Mitigation potential ~3x greater
at $30/tCO2e
• 259 sites switched to tie-in
from flaring
– 20x more gas conserved at
heavy oil sites
• 550 new sites flaring
19
The big picture: Provincial Reductions
20
▪ ECCC methane inventory for Alberta (excluding mined oil sands)
• ECCC total 26.4 MtCO2e
– Reported sources 6.5 MtCO2e
EERL Methane SymposiumCarleton University, Ottawa, Canada,
November 21, 2017
© David Tyner and Matthew Johnson, 2017 11
The big picture: Provincial Reductions
21
▪ ECCC methane inventory for Alberta (excluding mined oil sands)
• ECCC total 26.4 MtCO2e
– Reported sources 6.5 MtCO2e
▪ With No site paying > $30/tCO2e
in mitigation costs
▪ Current reported venting
• Average cost of $6/tCO2e
– 15% reduction overall
– Net cost 277 million
• Average cost of $0/tCO2e
– 9% reduction overall
– 44.6% reduction at oil-sites
2.3 MtCO2e/y
~4 MtCO2e/y
The big picture: Provincial Reductions
22
12.5 MtCO2e/y
▪ ECCC methane inventory for Alberta (excluding mined oil sands)
• ECCC total 26.4 MtCO2e
– Reported sources 6.5 MtCO2e
▪ With No site paying > $30/tCO2e
in mitigation costs
▪ Accounting for increased
venting at CHOPS sites
• New total 36.9 MtCO2e
• Average cost of $0/tCO2e
– 34% reduction overall
– 71% reduction at oil-sites
EERL Methane SymposiumCarleton University, Ottawa, Canada,
November 21, 2017
© David Tyner and Matthew Johnson, 2017 12
Implications
▪ Mitigation of reported venting at oil sites is technically and
economically viable
▪ Larger volumes suggested by recently published airborne
measurements improve economics
▪ >45% reductions in methane from reported venting are
possible at conventional oil sites
• Achievable at minimal net cost and <$30/tCO2e at all sites
• Represents overall reduction of 9% in current inventory
• Represents overall reduction of 34% in corrected inventory
▪ Mitigation opportunities for remaining 75% of methane in
current inventory should be considered separately
23
Acknowledgements
24
More information at:Website: https://carleton.ca/eerl
Email: [email protected]