technological and economic perspectives on more sustainable … tim persoons web.pdf ·...
TRANSCRIPT

Technological and economic perspectives on more sustainable data centre thermal management
Dr Tim Persoons
Dept. Mechanical & Manufacturing Engineering, Trinity College Dublin ([email protected])

Why care about data centre energy use?
• Data centre electricity demand• World (‘10): 27 GW, 1.5% of total
Increased +11%/year (‘00-’10), slower growth since then
• Ireland (‘18): 400 MW (12% of total), to rise to 31% by 2027
• Thermal management uses10-30% for cooling infrastructure
+ 5% for fans within IT equipment
2
0
50
100
150
200
250
2000 2005 2010
Dat
a ce
nte
r el
ectr
icit
y u
sage
, TW
h/y
r Cooling infrastructure
Power distribution
IT equipment
10
100
1000
10000
2000 2005 2010
Wo
rld
wid
e el
ectr
icit
y u
sage
, TW
h/y
r
Sum of all sectors
Data centers
+3%/year
+11%/year
Ging, 2nd Data Centres Ireland Conference, Dublin, 5-6 Nov 2013Garimella et al., Applied Energy 107: 66-80, 2013EirGrid, All-Island Generation Capacity Statement 2018-2027, Oct 2018

Why care about data centre energy use?
• Data volume generated globally each year• From 0.1 to 8.5 ZB in 10 years
• Video streaming (58%), web and email (17%), gaming (8%)
• Increasing +49%/year
• Number of networked devices• Increasing +23%/year
• Similar trends in Eirgrid’sforecasts for DC capacity
3
0.01
0.1
1
10
100
2005 2010 2015 2020
Glo
bal
dat
a am
ou
nt
gen
era
ted
an
nu
ally
, ZB
×1.49 annually
100
1000
2016 2021 2026
Dat
a ce
ntr
e ca
pac
ity
inst
alle
d i
n Ir
ela
nd
, MV
A
×1.30 annually
1
10
100
2005 2010 2015 2020
# d
evi
ces,
bill
ion ×1.23 annually
Gantz & Reinsel, International Data Corporation (IDC), Dec 2012Bauer et al., McKinsey Insights, Dec 2014Garimella et al., IEEE Trans CPMT 7: 1191-1205, 2017Sandvine Global Internet Phenomena Report. Oct 2018EirGrid, All-Island Generation Capacity Statement 2018-2027, Oct 2018

Uptime Institute, Data Center Industry Survey, Dec 2015
Data centre cooling system performance
• Power Utilization Effectiveness has focused DC community’s attention on energy efficiency• Worldwide average PUE
• 1.89 in 2011, small improvement to1.70 in 2014
• Distinction between DC types• Large ‘barebones’ DCs (e.g., Google): PUE < 1.2
• Smaller chilled DCs (multi-client): PUE ≈ 1.7
• Specialised DC/HPC (e.g., IBM SuperMUC, immersed)featuring liquid cooling
4
0
50
100
150
200
250
2000 2005 2010
Dat
a ce
nte
r el
ectr
icit
y u
sage
, TW
h/y
r Cooling infrastructure
Power distribution
IT equipment
PUE =𝑃𝑡𝑜𝑡𝑃𝐼𝑇
=𝑃𝐼𝑇 + 𝑃𝑇 + 𝑃𝐸
𝑃𝐼𝑇= 1 +
𝑃𝑇 + 𝑃𝐸𝑃𝐼𝑇𝜖
𝑃𝐼𝑇
𝑃𝑇
𝑃𝐸
Designed for:Resilience
Redundancy
Sustainability
=𝜖𝑃𝐼𝑇

Data centre cooling system performance
• Sankey diagrams for air vs liquid cooled DCs
5
Persoons & Weibel, IEEE Trans CPMT 7: 1189, 2017Garimella et al., IEEE Trans CPMT 7: 1191-1205, 2017Garimella et al., Applied Energy 107: 66-80, 2013
Grid PowerAlternative
Energy Supplies
IT EquipmentCooling Infrastructure Electrical Power Distribution
Processing AC/DCConversion
Rack-internalCooling
Incoming Power Ptot
Waste Heat
PIT
Rack Level
PT PE
PUE =
Ptot/PIT
Grid PowerAlternative
Energy Supplies
IT EquipmentCooling Infrastructure Electrical Power Distribution
Processing AC/DCConversion
Rack-internalCooling
Incoming Power Ptot
Waste Heat
Waste Heat
Recuperation
PIT
Liquid Cooling
Rack Level
PUE = Ptot/PIT
PUE =𝑃𝑡𝑜𝑡𝑃𝐼𝑇
= 1 +𝑃𝐶𝑜𝑜𝑙 + 𝑃𝑃𝐷
𝑃𝐼𝑇𝜖

Next generation data centres:The industry perspective
• Survey at 7th Int. Electronics Cooling Technology Workshop, Nov 2015, Redwood City, CA among industry representatives (Amazon, CoolIT, Intel, HP, Fujitsu, Huawei, EXA, Qualcomm, Samsung, Toyota)
• Q1: Optimal DC design should
(A) reduce PUE = 1 + 𝜖 → 1.0i.e., working on ‘𝜖’
(B) reduce absolute energy usei.e., working on ‘1’
6Garimella et al., IEEE Trans CPMT 7: 1191-1205, 2017
26%
74%
0%
10%
20%
30%
40%
50%
60%
70%
80%
A B

Next generation data centres:The industry perspective
• Q2: Penetration of liquid cooling in DCs by 2021?
7
Mean = 4.1
1 = Air only Liquid only = 9
Current
53 4 6 7 8 91 2
Garimella et al., IEEE Trans CPMT 7: 1191-1205, 2017
Low cost
Heatspreading
Co-design
Colla-boration
IC inte-gration
Materials
High per-formance
Passivecooling
all participants
large-scale interests
small-scale interests
• Q3: Top challenges for next genthermal management?• Personal electronics
companies: low cost
• Large scale ICT companies: integrationand collaborative design

• Challenge 1: Multi-scale cooling• Length scales ~10m to >10m
• Cooling heat fluxes from>1000 W/cm2 to <0.1W/cm2
• At low temperature (<100C)
More sustainable data centres:Technological challenges
8
CPU hot spots
Sun’s surface
Reentry from space
Jet turbine blade cooling
Solar irradiation on earth
CPU package
Server/rack level
0.1
1.
10.
100.
1,000.
10,000.
100 1,000 10,000
Hea
t fl
ux,
W/c
m2
Temperature, K

Michel, IBM, 2012 / Sharma et al., IJHMT 88:6 84-694, 2015
More sustainable data centres:Technological challenges
• Challenge 2: Non-uniform heat load• Spatial: main heat generating chips = 1 ppm of DC space
• Temporal: stable at DC level but fluctuates at CPU level
• Main research opportunitiesand our goals within ESIPP:
(1) Develop solutions for adaptivehigh grade heat recoveryfor new and existing DCs
(2) Economics of system integrationof hybrid (air/liquid) cooled DCs
9

ESIPP Work Package EUI6Sustainable DC Thermal Management
• Team EUI6: Tim Persoons, Eleanor Denny, Jaakko McEvoy (PhD), Assel Sakanova/Sara Battaglioli (PD), Bryan Coyne (PhD)
• Scientific objectives:(1a) Adaptive liquid-cooled heat sinks (McEvoy)
(1b) New hybrid cooled servers (Sakanova/Battaglioli)
(2) Techno-economic challenges for ESI (Coyne)
10
Tim Persoons Eleanor Denny Jaakko McEvoy Assel SakanovaBryan Coyne Sara Battaglioli

RQ1 – How does Irish data centre electricity use change if more efficient cooling adopted?
• All mechanical air cooled - 1/3 energy use (Garimella et al.)
• Adoption eliminates need for chillers
• Capacity factor of 0.75 (IWEA)
• Every data centre adopts by 2026
• Does not quantify benefit of reusable waste heat
Three EirGrid (2017) scenarios (Low/Medium/High) + two new scenarios:
4. New only (ND): Upcoming data centres adopt new technology
5. All (AD): Existing and upcoming data centres adopt new technology following a market adoption curve(*)
(*) Slow adoption initially, then faster adoption, levelling off as market saturates (Yin et al.)
11
Ass
um
pti
on
s
EirGrid, All-Island Generation Capacity Statement 2017-2026, 2017Yin et al., A flexible sigmoid function of determinate growth. Ann. Bot. 91, 2003IWEA, Data Centre Implications for Energy Use in Ireland: Irish Data-Centre Load Projections to 2020, 2015Garimella et al., Technological drivers in data centers and telecom systems, Appl. Energy 107, 2013
Bryan Coyne

RQ1 – How does Irish data centre electricity use change if more efficient cooling adopted?
12
Data Centres: ↓19% electricity use over
10 year period (2017-26)
Notes: Data centre capacity factor of 0.75 assumed
BAU = No adoption, EirGrid GCS demand scenarios
ND: Liquid cooling adopted in new data centres
AD: Liquid cooling adopted in all data centres (following Adoption Curve)
RQ2 – Potential for air-side heat recovery from DC server with liquid cooled CPUs?
13
Assel Sakanova
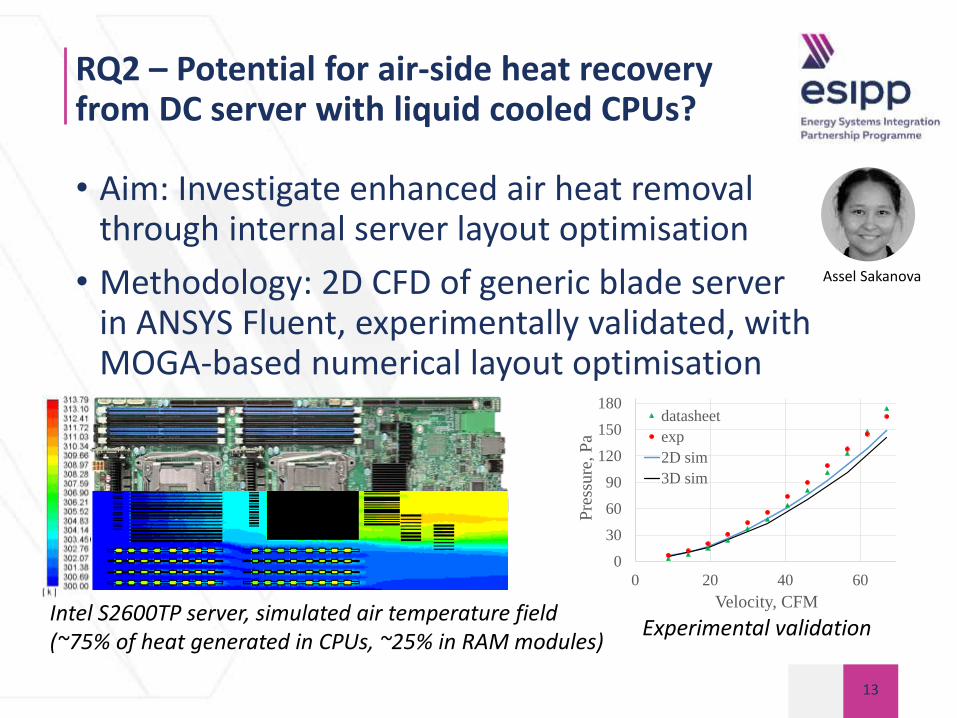
• Aim: Investigate enhanced air heat removal through internal server layout optimisation
• Methodology: 2D CFD of generic blade server in ANSYS Fluent, experimentally validated, with MOGA-based numerical layout optimisation
Intel S2600TP server, simulated air temperature field(~75% of heat generated in CPUs, ~25% in RAM modules)
Experimental validation
0
30
60
90
120
150
180
0 20 40 60P
ress
ure
, P
aVelocity, CFM
datasheet
exp
2D sim
3D sim

RQ2 – Potential for air-side heat recovery from DC server with liquid cooled CPUs?
• Layout optimisation:1. Limit chip temp
2. Min pumping power
3. Max avg outlet temp
4. Max outlet temp uniformity
i.e., maximising potential for air-side heat recovery
Objectives in terms of entropy generation minimisation
14
0.25*(B-90)+90
0.5*(B-90)+90
0.75*(B-90)+90
B
C
C
C
C
8mm
C
C
0.25*(A-90)+90
0.5*(A-90)+90
0.75*(A-90)+90
A 8mm
7mm
Pressure
outlet
Mass
flow
inlet
symmetry wall
A>90
Abdelsalam et al., THERMINIC, 2017Sakanova et al., THERMINIC, 2018Bejan, J Appl Phys 79: 1191-1218, 1996
-80
-40
0
40
Sen
siti
vity
SΔT,int SΔT,ext SΔp Tout,av ΔTout
DIMM angle A DIMM angle B DIMM spacing C Flow rate
RQ2 – Potential for air-side heat recovery from DC server with liquid cooled CPUs?
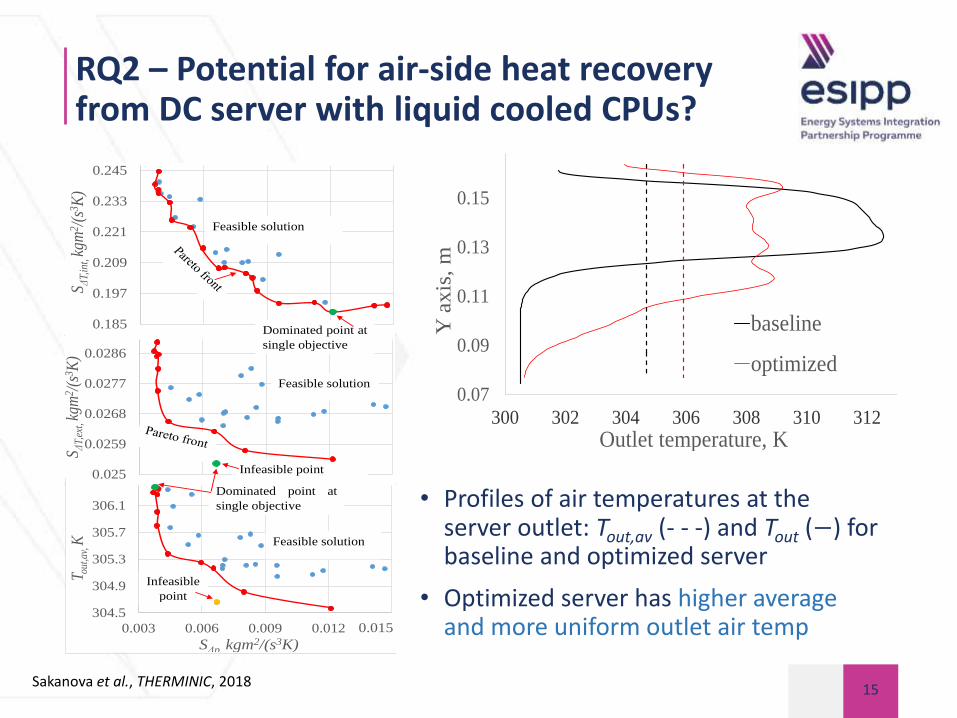
15Sakanova et al., THERMINIC, 2018
• Profiles of air temperatures at the server outlet: Tout,av (- - -) and Tout (−) for baseline and optimized server
• Optimized server has higher average and more uniform outlet air temp
0.185
0.197
0.209
0.221
0.233
0.245
S ΔT,
int,
kgm
2 /(s
3 K)
0.025
0.0259
0.0268
0.0277
0.0286
S ΔT,
ext,
kgm
2 /(s
3 K)
304.5
304.9
305.3
305.7
306.1
0.003 0.006 0.009 0.012 0.015
T out,
av, K
SΔp, kgm2/(s3K)
Feasible solution
Infeasible point
Infeasible
point
Feasible solution
Feasible solution
Dominated point at
single objective
Dominated point at
single objective
0.015
0.07
0.09
0.11
0.13
0.15
300 302 304 306 308 310 312
Y a
xis
, m
Outlet temperature, K
baseline
optimized

RQ3 – How to recover high grade heat from liquid cooled CPUs under variable load?
16
Ribbed Nitinol micro fin
• Methodology: µ-PIV flow field, temp, pressure• Active control methods:
Flow pulsation using piezo actuator,varying waveform shape and frequency to control convection
• Passive control methods:Nitinol microstructures fabricated as different geometries, deform as a function of coolant tempto alter flow conditions
Jaakko McEvoy

RQ3 – How to recover high grade heat from liquid cooled CPUs under variable load?
• Results• For asymmetric
waveforms and higher frequency, 𝑢𝑓grows rapidly in amplitude
• Potential for enhanced flow control near resonant frequency
• Asymmetric waveforms show higher order fluctuations due to impulse like stroke
17

RQ3 – How to recover high grade heat from liquid cooled CPUs under variable load?
• Results• Flow pulsation waveform can reduce
pressure drop while maintaining high shear, thus, good potential for increased heat transfer in these conditions
18
Reduced pressure drop with increased
wall shear stress
16.55Hz F(1) (slowed down 10x)
McEvoy et al., 5th Int Conf Exp Fluid Mech, Munich, 2018
Summary
• High impact potential on energy demand
• Several challenges related to data centre thermal management, interdisciplinary approach needed• Verifying economic viability of new technological
solutions
• Mutual benefits in closer industry/academic partnership
• ESIPP EUI6 team working on three strategic areas:• Techno-economic challenges for ESI (Coyne)
• New hybrid cooled servers (Sakanova/Battaglioli)
• Adaptive liquid-cooled heat sinks (McEvoy)
19

20
This publication has emanated from research conducted with thefinancial support of Science Foundation Ireland under the SFI StrategicPartnership Programme Grant Number SFI/15/SPP/E3125. Theopinions, findings and conclusions or recommendations expressed inthis material are those of the author(s) and do not necessarily reflectthe views of the Science Foundation Ireland.
Contact Details
www.esipp.ie
www.esipp.ie/research/datacentres
www.datacentresresearch.com