technological competitiveness of china's internet ... › jp › publications › dp ›...
TRANSCRIPT

DPRIETI Discussion Paper Series 20-E-045
Technological Competitiveness of China's Internet Platforms: Comparison of Google and Baidu Using Patent Text Information
MOTOHASHI, KazuyukiRIETI
ZHU, ChenUniversity of Tokyo
The Research Institute of Economy, Trade and Industryhttps://www.rieti.go.jp/en/

1
RIETI Discussion Paper Series 20-E-045 May 2020
Technological Competitiveness of China’s Internet Platforms: Comparison of Google and Baidu Using Patent Text Information1
Kazuyuki Motohashi (RIETI and U of Tokyo) and Chen Zhu (U of Tokyo)
Abstract Internet platforms in China (BAT: Baidu, Alibaba, Tencent) are receiving growing attention in terms of their technological competitiveness compared to US players (GAFA: Google, Amazon, Facebook, Apple). Using text information of patent information in China and the US, this study analyzes Baidu’s technological catching up process with Google. Based on document-level embedding results, we conduct cluster analysis and generate new indicators of technology cumulativeness and impact based on neighbor patents in the content space. The results reveal that Baidu follows a trend of US rather than Chinese technology which suggests Baidu is aggressively seeking to catch up with US players in the process of its technological development. At the same time, the impact index of Baidu patents increases over time, reflecting its upgrading of technological competitiveness. Key words: patent text analysis, internet technology, China, US JEL codes: O31, O57
The RIETI Discussion Paper Series aims at widely disseminating research results in the form of professional papers, with the goal of stimulating lively discussion. The views expressed in the papers are solely those of the author(s), and neither represent those of the organization(s) to which the author(s) belong(s) nor the Research Institute of Economy, Trade and Industry.
1 This study is conducted as part of the Project “Digitalization and Innovation Ecosystem: A Holistic Approach” undertaken at the Research Institute of Economy, Trade, and Industry (RIETI). In addition, Financial support from JSPS-KAKEN Fostering Joint International Research Program B (Grant No. 19K0035) is acknowledged. The authors would like to thank the participants of the discussion seminar at RIETI for their helpful comments.

2
1. Introduction
Advancement of AI (machine leaning) could turn massive data from the internet and
IoT sensors into a gold mine (Agrawal et. al, 2018). AI technology is versatile and its
application spans over various industries (Trajtenberg, 2018; Motohashi, 2020) so that
not only the data size (improving accuracy of prediction), but also the economy of scope
contributes to the value of big data analysis. The nature of general purpose technology
of AI, or non-rivalry of big data for various applications, allows internet business firms
to grow as internet platforms, expanding their services to a variety of industries
(Goldfarb and Trefler, 2018). Accordingly, Google, Amazon, Facebook, and Apple
(GAFA) have become top listed firms in stock market valuation ranking.
At the same time, the concentration of data into a small number of firms, such as GAFA,
has raised concern among national authorities outside the US. Google has been fined a
combined $9.5 billion since 2017 by EU antitrust regulators, and EU regulatory bodies
have kept a close watch on the activities of other US internet firms. The EU also
imposes General Data Protection Regulation (GDPR) to ensure privacy protection of
European standards when private data are transferred beyond EU borders. Such policy
actions could lead to “virtual nationalism,” where the cyber space is compartmentalized
by nation/region (Economist, 2020).
In this regard, China is going its own way by virtually banning internet business of US
internet platforms and international data transfer (Chorzempa et. al, 2018). As a result,
indigenous internet giants Baidu, Alibaba, and Tencent (BAT) have emerged in a
domestically segmented cyberspace insulated from international competition. Based on
huge amounts of data from 800 million smart phone users, as well as large domestic
markets in China, Alibaba and Tencent are listed in the global top 20 in terms of market
capitalization. Recently, BAT have invested heavily in AI technology based on a large-
scale talent pool inside China. The Chinese government plans to become a global AI
leader by 2025 and BAT is supposed to play a key role (Biancotti and Ciocca, 2018).
This study focuses on Baidu and Google and assesses the technological capability of
Chinese internet platforms compared to US ones. These two firms are quite comparable
in terms of their business domain and advertising based on internet search queries, and
both firms have recently made substantial investments in autonomous driving
technology. We use text information (abstract) of patents applications submitted to the
US Patents and Trademarks Office (USPTO) and CNIPR (China patent authority). The
text information of patent data is assumed to precisely reflect the content of the
invention. The similarity score of two patents based on patent abstract provides more
accurate information than their IPC code (Arts et. al, 2017). In addition, the vector space
model with a high dimension of continuous variables gives finer grained information
of patent contents, as compared to one-dimension IPC codes with discrete variables
(Younge and Kuhn, 2016; Motohashi et. al, 2019).
Understanding the technological capability of Chinese firms is important from the

3
perspective of both business and policy. A firm in a developed economy, such as Japan,
cannot conduct internet/IoT business in China by itself, but needs to collaborate with
local firms such as BAT. Under such conditions, it is critical to access the technological
capability of Chinese counterparts since the bargaining position in partnership
negotiation depends on relative management resources, particularly technological
capacity capacity Chinese firms are eager to gain access to. In addition, as tensions
between the US and China due to trade disputes become intense, information on
technological competitiveness in both countries is essential intelligence for
policymakers in third countries. This is particularly the case for Japan, since both
countries are very important partners, and inappropriate strategy to deal with them may
cause substantial damage to the domestic economy.
The remainder of this paper is organized as follows. Section 2 outlines the data source
and methodology of our vector space model based on internet technology patents from
USPTO and CNIPR. Google and Baidu patents are compared via two types of empirical
analysis in sections 3 and 4. One is an overview of technologies of these two firms
using clustering analysis. The other is based on a more micro view of individual patents,
together with the distribution of patented technologies of its neighbors in technology
space. Finally, we conclude with a summary of the findings and policy implications in
section 5.
2. Vector space model of Internet technology
2-1. Data source
To conduct a fair comparison of a US firm (Google) and a Chinese firm (Baidu), we
use the patent data from USPTO and CNIPR. Specifically, we retrieve all patent
application information by Google (26,383 USPTO patents) and Baidu (6,695 CNIPR
patents) from PATSTAT 2019 Spring version. We then check the IPC subgroups of these
patents to identify internet-related technology patents. We identify a total of 2,350 IPC
subgroups, but many of them contain a very small number of Google or Baidu patents.
We treat the subgroups with at least 100 Google or Baidu patents as a core technology
of internet search engine-related business, and retrieve all patents belonging to these 50
subclasses for subsequent analysis. There are 680,241 US patents and 427,628 CN
patents from 1959 to 2018. The subgroups span over seven IPC classes, “F24,” “G01,”
“G02,” “G06,” “G09,” “‘G10,” “‘H04,” but more than 95% of patents belong to the
G06 (computing, calculating, counting) and H04 (electric communication technique)
classes. Figure 1 shows the numbers of patents by application year. It should be noted
that most patent applications via CNPIR have been made within the last five years,
while USPTO patents applications were made relatively earlier. A drop in the number
of patent applications in recent years comes from data truncation associated with the
time lag between application and publication years, particularly for USPTO patents.
(Figure 1)

4
2-2. Vector space model
A myriad of patents makes it difficult to mine out useful information and relationships
among them. Recent text mining techniques have been proposed to turn a document
into a vector form so that existing machine learning algorithms can be used. We
followed the classic Skip-gram model proposed by Mikolov et al. (2003) to build word
vector representations for our patent corpus. We then calculated the document
embedding for a patent by averaging all nouns occurring in that patent. To do so, we
first conducted basic preprocess on the patent corpus. Wang et al. (2019) noted that the
word representations should be able to demonstrate multifacetedness. That is, the
trained Word2Vec model should yield meaningful representations for words in different
forms (e.g., in different tenses). Furthermore, many pre-trained word embedding
models (e.g., Google pre-trained Word2Vec models) kept words in their original forms.
Along with this convention, without conducting lemmatization, we only removed
punctuation and placed all words in lower case, turning all digits into a token “<num>.”
An original text information of the abstracts of all 1,107,869 patents.2 The corpus
consisted of all words with frequencies higher than four. A Skip-gram model was
adopted to build a 300-dimensional vector for each word in the corpus. Our Skip-gram
model generated vector representations for 170,340 words, of which 73,780 (43%) were
nouns.
From the results of this word embedding (300 dimension vector expressions for each
word), the document vector 𝑑𝑗 (corresponding to the patent content expression) is
computed by
𝑑𝑗 =1
𝑛𝑗∑ 𝑣𝑖
𝑤𝑖 ∈ 𝑁
where 𝑣𝑖 is the vector representation of word 𝑤𝑖 , 𝑛𝑗 is the number of nouns
occurring in the document 𝑑𝑗, and 𝑁 is a set of all nouns in the dictionary.
2-3. Validation of document embedding results
The document embedding results are created in two steps, (1) word embedding and (2)
aggregation at document level. In terms of the first step, we conduct a face validation
of word embedding results. Specifically, we conduct k-means clustering of embedded
words to check that similar words are clustered into the same cluster. The results of
clustering analysis are presented in Appendix A. For example, the first cluster consists
of “image related” words, including “image,” “position,” “display,” and “picture.” The
second one shows the list of text related words (“document,” “language,” etc.).
2 A total of 680,241 US patents + 427,628 China patents. The abstracts of CNIPR patents are
translated into English.

5
Accordingly, it is possible to conclude that our word embedding results are reasonable.
In the second step (aggregation at document level), we take a simple average of word
embedding vectors in each document. To assess the document embedding results, we
use Doc-DB patent family information. Within each patent family, all patents are based
on the same invention, so that the contents of these patents should be close to each other.
We calculate pairwise cosine similarities of the patents corresponding to the same
patent family. It should be noted that one patent family could have both USPTO and
CNIPR patents. Therefore, we could evaluate document embedding results separately
using US-US, CN-CN, and US-CN pairs.
Figure 2 shows the distribution of cosine similarity of document embedding results
between patent family pairs. For a given patent family, we calculated all pairwise cosine
values of US patents and then described the results separately using US-US, CN-CN
and US-CN pairs. The mode points of each type of pairs correspond to 1 (showing
exactly same vector), and most pairs have cosine similarity close to 1. We could
conclude our document embedding method produces reasonable results. In addition,
the US-US patent family pair is relatively closer in terms of the contents, as compared
to the CN-CN pairs, and the US-CN pairs are in the middle. Therefore, there may not
be any systematic bias associated with the data source (USPTO or CNIPR patents),
which is important to make fair comparison between Google and Baidu in the following
sections.
(Figure 2)
Table 1 shows the results of descriptive statistics of cosine similarities of patent pairs
by type of family and by type of document-level aggregation. We have again confirmed
that the median point of each type of pairs is close to 1 (at least 0.97), suggesting the
validity of document embedding results. Table 1 also reports the results using TF-IDF
weighted averages of word embedding results (figures with asterisks). The cosine
similarity of these figures is even lower than that of the simple mean. Therefore, we
proceed with the subsequent analysis by using the document embedding results with a
simple average of word embedding vectors.
Table 1. Cosine similarity between within patent family pairs
MEAN STD MIN 25% 50% 75% MAX
US 0.97 0.05 0.25 0.99 1.00 1.00 1.00
CN 0.95 0.07 0.53 0.92 0.98 0.99 1.00
USCN 0.97 0.05 0.28 0.96 0.99 1.00 1.00
US* 0.95 0.10 0.14 0.99 1.00 1.00 1.00
CN* 0.89 0.14 0.24 0.84 0.97 0.99 1.00
USCN* 0.94 0.10 0.11 0.94 0.98 1.00 1.00
(*) denotes the results of TF-IDF weighted document embedding.

6
3. Clustering analysis
The contents of the patent corpus are explored by dividing the whole corpus into several
clusters. We used k-means to conduct clustering based on the vectorized patent contents
information. In terms of the granularity of clustering, we take the number of IPC
subclasses, that is, 11. We could set this number arbitrarily, but it become difficult to
gain a broad picture from too many clustering results. In addition, the number of
clusters could not be too small, since the whole corpus would be divided much more
finely. We applied k-means clustering for 1,107,869 patents, and the word crowd of
each cluster is presented in Figure 3. The number of words in this figure corresponds
to the aggregated TF-IDF value of each word in each cluster (sum of patent level TF-
IDF to each cluster level), or can be formally expressed as follows:
𝐴𝑔𝑔𝑟𝑒𝑔𝑎𝑡𝑒𝑑 𝑇𝐹𝐼𝐷𝐹𝑖 = ∑ 𝑡𝑗𝑖
𝑤𝑖∈𝐷𝑗;𝐷𝑗∈𝐶
where 𝐷𝑗’s are patents in cluster 𝐶, and 𝑡𝑗𝑖 is the TF-IDF value of word 𝑤𝑖 in patent
𝐷𝑗 . Figure 3 also shows the label of each cluster, created using this “word crowd”
information, together with 10 patents located near the center point of each cluster (A
list of titles of these patents are presented in Appendix B).
(Figure 3)
Figure 4 visualizes the contents of 1.1 million patents, together with the location of
each of the 11 clusters. For this purpose, the 300-dimensional document vectors have
to be reduced into 2-dimensional space. We use the Uniform Manifold Approximation
and Projection (UMAP), which has a superior run-time efficiency (McIness et. al, 2018).
UMAP can convert high dimensional data into a low dimensional space while
preserving both local and global structures. There are three broad types of patent
content: (1) web application such as data analytics, language modeling, and web content
application, (2) display interface such as image recognition and human interface, and
(3) ICT infrastructure such as storage system, file management, and mobile
communication.
(Figure 4)
Figure 5 shows the share of patent applications by cluster and country (USPTO or
CNIPR). The share of ICT infrastructure patents (such as storage, file management
system, wireless communication) is found to be larger for the US, while there are
relatively more application-related patents (such as mobile user interaction and data
analytics) for China. Such differences come from the difference in the timing of
technological development in both countries. US patent applications start in the 1990s
and grow rapidly in the early 2000s, while for China, most patent applications are
submitted after 2010. Players in China, including Baidu, therefore focus more on
application developments based on ICT infrastructure technologies developed by US
7
players.
(Figure 5)
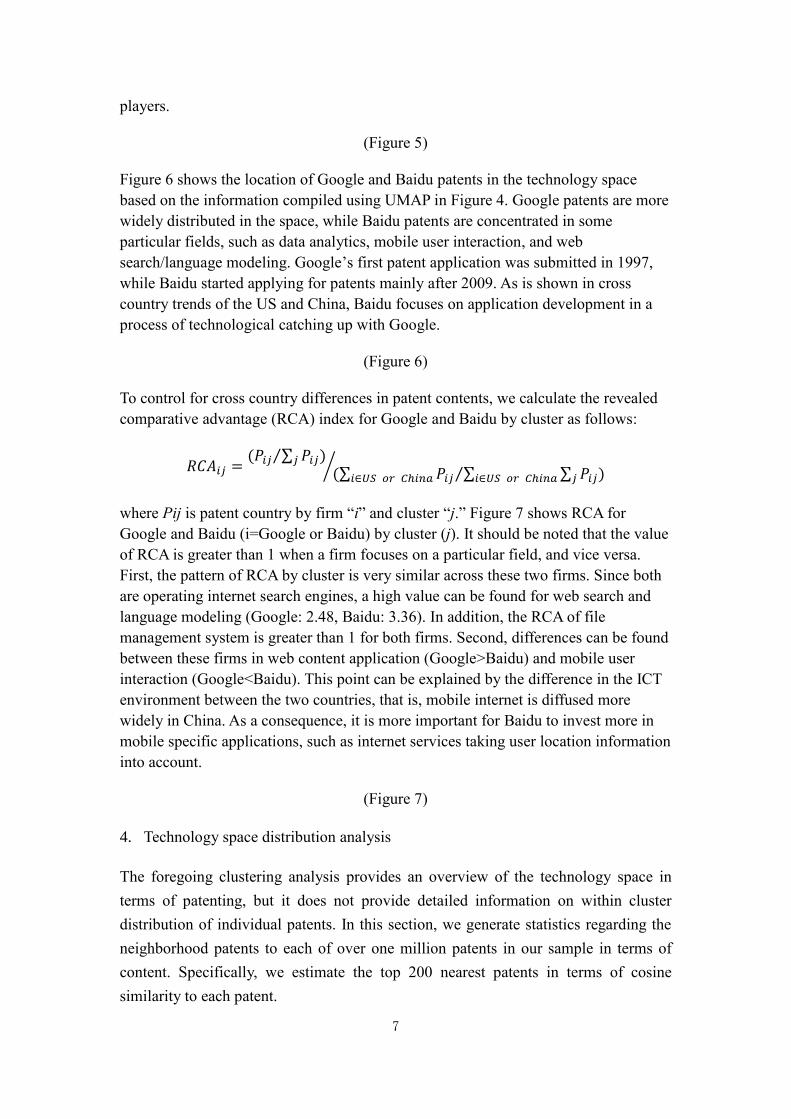
Figure 6 shows the location of Google and Baidu patents in the technology space
based on the information compiled using UMAP in Figure 4. Google patents are more
widely distributed in the space, while Baidu patents are concentrated in some
particular fields, such as data analytics, mobile user interaction, and web
search/language modeling. Google’s first patent application was submitted in 1997,
while Baidu started applying for patents mainly after 2009. As is shown in cross
country trends of the US and China, Baidu focuses on application development in a
process of technological catching up with Google.
(Figure 6)
To control for cross country differences in patent contents, we calculate the revealed
comparative advantage (RCA) index for Google and Baidu by cluster as follows:
𝑅𝐶𝐴𝑖𝑗 =(𝑃𝑖𝑗 ∑ 𝑃𝑖𝑗)𝑗⁄
(∑ 𝑃𝑖𝑗𝑖∈𝑈𝑆 𝑜𝑟 𝐶ℎ𝑖𝑛𝑎 ∑ ∑ 𝑃𝑖𝑗)𝑗𝑖∈𝑈𝑆 𝑜𝑟 𝐶ℎ𝑖𝑛𝑎⁄⁄
where Pij is patent country by firm “i” and cluster “j.” Figure 7 shows RCA for
Google and Baidu (i=Google or Baidu) by cluster (j). It should be noted that the value
of RCA is greater than 1 when a firm focuses on a particular field, and vice versa.
First, the pattern of RCA by cluster is very similar across these two firms. Since both
are operating internet search engines, a high value can be found for web search and
language modeling (Google: 2.48, Baidu: 3.36). In addition, the RCA of file
management system is greater than 1 for both firms. Second, differences can be found
between these firms in web content application (Google>Baidu) and mobile user
interaction (Google<Baidu). This point can be explained by the difference in the ICT
environment between the two countries, that is, mobile internet is diffused more
widely in China. As a consequence, it is more important for Baidu to invest more in
mobile specific applications, such as internet services taking user location information
into account.
(Figure 7)
4. Technology space distribution analysis
The foregoing clustering analysis provides an overview of the technology space in
terms of patenting, but it does not provide detailed information on within cluster
distribution of individual patents. In this section, we generate statistics regarding the
neighborhood patents to each of over one million patents in our sample in terms of
content. Specifically, we estimate the top 200 nearest patents in terms of cosine
similarity to each patent.

8
An apparent difficulty is that deriving all pairwise cosine similarities among one million
involves a massive amount of computations. We therefore used a neighborhood graph
and tree (NGT) proposed by Sugawara et al. (2016) for indexing, which is an
approximate similarity search method. NGT has been developed for efficient retrieval
of relevant internet content by search engine, but it can be applied to any type of text
information. Motohashi et. al (2019) use NGT results for patent title and abstract
published by the Japan Patent Office to understand the characteristics of academic
patents (as compared to firm patents).
NGT uses a tree structure for indexing network graphs efficiently. A parameter is
epsilon as a range of search of nearest neighbors. There is a trade-off between the search
range and search time. We fit our samples and use epsilon=0.35 with an accuracy rate
of 0.997 (See Appendix C for details).
Figure 8 presents the average cosine similarity of the 200th nearest patents (i.e., the
patents ranked 200th in terms of the cosine similarity) with each of 1.1 million patents
by application year and patent authority. An upward time trend (technology space
becomes denser by time) can be found in CNIPR patents, while it is not the case for
USPTO patents. As a result, the cosine similarity of the 200th nearest patents for CNIPR
patents (around 0.90) becomes greater than that of USPTO patents (around 0.88) on
average.
(Figure 8)
Figure 9 shows the share of USPTO patents in the top 200 nearest patents by patent
authority (CNIPR or USPTO). The share for USPTO patents is stable around 70%,
meaning 30% of the top 200 nearest patents are CNIPR patents. In contrast, the share
for CNIPR patents rises until 2006, then falls. The upward trend corresponds to the
period in which the number of USPTO patents increases, while a downward trend
occurs when the number of CNIPR patent applications overtakes USPTO patents.
More importantly, a pattern of technology divergence is revealed between the two
countries, that is, increasing numbers of same country patents pairs in terms of
content similarity, rather than cross country pairs.3
(Figure 9)
The information on 200 near patents in terms of patent contents provides a picture of
3 Based on the validation of document embedding with patent family information, it should be noted
that any difference in the type of document (USPTO or CNIPR patents) does not cause such a pattern,
as discussed in section 2.

9
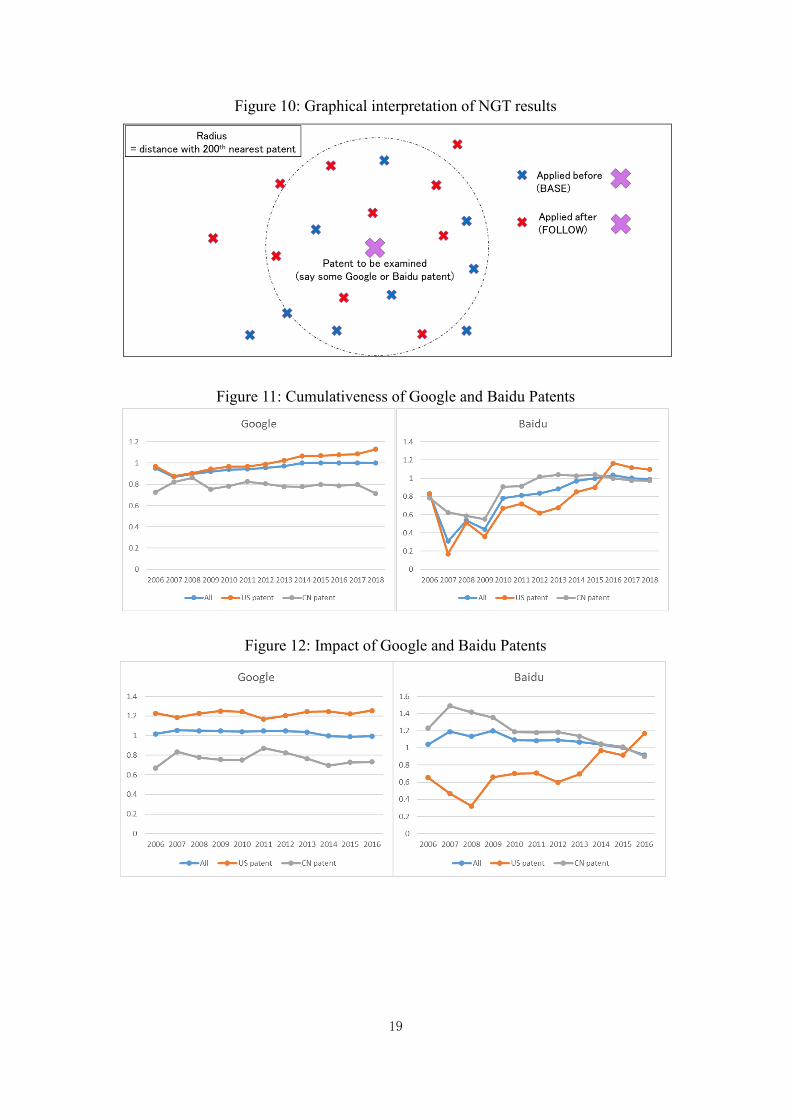
technology space around the patent to be examined. As shown in Figure 10, finding
near patents corresponds to drawing a border within which 200 near patents are
located. The boarder is a hypersphere (300 dimension) with a radius of the distance
(e.g., 1-cosine similarity) between the patent to be examined and the 200th nearest
patent. The technology space is densely populated with surrounding patents if the
radius (1-cosine similarity) is small, and vice versa. It should be noted that there are
two types of surrounding patents. One is the patent applied for before the patent to be
examined, and the other is one thereafter. A patent application provides information
on preceding patents, and we refer to such patents as BASE. We refer to the latter as
FOLLOW, since these patent applications were submitted following the patent to be
examined.
(Figure 10)
BASE could be considered as a backward citation and FOLLOW as a forward citation.
Hence, the number of BASE patents can be used as an indicator of the novelty of a
patent (smaller BASE means more novelty), and the number of FOLLOW patents
indicates the impact of a patent (larger FOLLOW means more impact).
We use this information to assess the technological capability of Google and Baidu. As
is the case for citation information, this indicator can be biased by data truncation, that
is, the newer the patent to be examined, the more BASE patents and the fewer
FOLLOW patents could be found. Therefore, we normalized the number of BASE and
FOLLOW (200-BASE) using the number of patent applications before and after,
respectively. In addition, there is a time trend of such indicators, particularly for CNIPR
patents. Since the number of patent applications increases (Figure 1) in densely
populated fields (Figure 8) for CNIPR patents, IMPACT tends to be larger, while BASE
is smaller. Therefore, we need to control for the patent authority difference (USPTO or
CNIPR). Finally, we derive the following indicator for cumulativeness (less novel) and
impact for each patent.
𝐶𝑢𝑚𝑢𝑙𝑎𝑡𝑖𝑣𝑒𝑛𝑒𝑠𝑠𝑖 =(𝐵𝐴𝑆𝐸𝑖 ∑ 𝑃𝑡)𝑡<𝑇⁄
𝐴𝑉𝐸𝑅𝐴𝐺𝐸𝑖,𝑐∈𝑈𝑆 𝑜𝑟 𝐶ℎ𝑖𝑛𝑎(𝐵𝐴𝑆𝐸𝑖 ∑ 𝑃𝑡)𝑡<𝑇⁄⁄
𝐼𝑚𝑝𝑎𝑐𝑡𝑖 =(𝐹𝑂𝐿𝐿𝑂𝑊𝑖 ∑ 𝑃𝑡)𝑡>𝑇⁄
𝐴𝑉𝐸𝑅𝐴𝐺𝐸𝑖,𝑐∈𝑈𝑆 𝑜𝑟 𝐶ℎ𝑖𝑛𝑎(𝐹𝑂𝐿𝐿𝑂𝑊𝑖 ∑ 𝑃𝑡)𝑡>𝑇⁄⁄
Where BASEi and FOLLOWi are the number of BASE patents of patent “i” with
application date “T” and patent authority “c” (US or China), and Pt is a patent count of
patent applications at the application date “T.” Here we conduct double normalization
by the timing (BASE is normalized by the number of patent applications before the
patent to be examined, all candidate of BASE, and the same for FOLLOW) and by the
country of patent authority.
Since cumulativeness and impact is a patent level indicator, we could aggregate this at

10
firm level. Figure 11 presents the trend of cumulativeness indicators of Google and
Baidu. Here, we produce three types of these indicators: (1) using all patents, (2) using
USPTO patents only, and (3) using CNIPR patents only in the 200 nearest patents. The
distinction of patent authority allows us to investigate the technology trajectory of these
firms within and cross countries. The cumulativeness of Google used to be below 1,
suggesting relatively novel patents under the USPTO patent standards, but has recently
reached 1 due to an increasing trend of US neighbor patents. This could be explained
by technology convergence of internet technologies among major players such as
(G)AFA. The increasing trend of cumulativeness clearer in the case of Baidu. Baidu
patents used to be relatively novel (less than 1) under Chinese standards, but this has
also recently reached 1. Increasing numbers of USPTO patents are used as a base, and
Baidu has aggressively caught up with US players in the process of its technological
development.
(Figure 11)
Figure 12 shows the impact indicators of Google and Baidu. Google’s performance is
stable over time around 1, reflecting an average impact under US standards. However,
the impact of USPTO patents is found to be more than average (around 1.2), while the
impact of CNIPR patents is less than average (0.7 to 0.8). In contrast, Baidu shows
quite dynamic patterns for this indicator. While the overall impact indicator has
recently fallen, USPTO neighbor patents reveal an increase regarding this indicator.
Together with the finding in Figure 11, Baidu is found to pay more attention to
technological development in China, and started patenting in mainstream technologies
in the US, so that both cumulativeness and impact measured by US patents increases
over time. It should be noted that the USPTO-based impact indicator has recently
become greater than 1, suggesting Baidu has achieved technological catching up with
US players to some extent.
(Figure 12)
5. Conclusion
Technology upgrading of China’s internet platforms has received growing attention
given their huge data assets of a billon of mobile users together with ample engineering
talents for AI and data science. China has set a goal of becoming a global leader in AI
by 2025, and it is assumed that BAT (Baidu, Alibaba, and Tencent; China’s GAFA
equivalent) will play a vital role. Using Google as the benchmark, this study assessed
the technological capability of BAIDU. We use patent text information (abstract of
invention) to examine how these two firms have developed over time.
We extract internet-related technology patents from USPTO and CNIPR patent
publication information to determine the technology trajectory of both countries’ patent
applicants. Internet-related patent applications to CNIPR have increased significantly
in the last five years, and the contents of patent applications in both countries are found

11
to be diverging. This may be due to the fact that China’s internet market is segmented
from the rest of the world and evolving in its own way. The rapid progress of mobile
internet in China also explains the difference of technology portfolios across two
countries.
Given such general trend of technological development, Baidu and Google show
similar patterns of focused areas of R&D in general, such as web search technology
and data analytics for language modeling, based on common business models based on
internet search engines. However, our results reveal some differences, such as more
mobile applications in Baidu and more web content applications in Google. In terms of
the dynamics of technological development, Baidu follows a trend of US rather than
Chinese technology, and it is assumed that Baidu is aggressively seeking to catch up in
the process of technological development. At the same time, the impact index of Baidu
patents increases over time, suggesting its upgrading of technological competitiveness.
This study proposes a new methodology to analyze technology mapping and evolution
based on patent text information. The citation information has been used extensively
for patent characteristics (mainly patent quality) and technology spillover (Nagaoka et.
al, 2010). However, patent citation information is not available in many countries,
including China. In contrast, our methodology can be used more widely, particularly in
the case of using patent information in developing countries, since the patent abstract
information is available in most countries.
However, there are also some limitations in our methodology. First, we use fixed word
embedding information over time. The content of the same term, such as “machine
learning” for example, should change over time as its technology progresses. Therefore,
our document embedding results could the range of various technologies, while it is
weak to measure the progress (or depth) of some particular technology component.
Using a word embedding methodology that takes the context of each word within
paragraphs into account, such as BERT, may be a potential solution. In addition, the
size of neighbor patents (200 in our case) is arbitrary. We could decrease or increase
this size, but the number depends on the scope of our analysis, or the degree to what
extent we want to identify the density of technology (patent) distribution. We may use
kernel smoothing technique in multi-dimension space for future research.

12
References
Agrawal. A., J. Gans and A. Goldfarb (2018), Prediction Machines: The Simple
Economics of Artificial Intelligence, Harvard Business School Press, April 2018
Arts, S., Cassiman, B., and Gomez, J. C. (2017), Text Matching to Measure Patent
Similarity, Strategic Management Journal, 39
Biancotti C. and Ciocca, P. (2018), Regulating data superpower in the Age of AI,
Realtime Economic Issues Watch, October 23, 2018, Peterson Institute for
International Economics
Chorzempa, M., Triolo, P. and Saks, S. (2018), China’s social credit system: A mark of
progress or a threat to privacy?, Peterson Institute for International Economics,
Policy Brief 18-14
Economist (2020), Special Report: The Data Economy, The Economist, Feb 22, 2020,
London
Goldfarb, A. and Trefler, D. (2018), AI and International Trade, NBER Working Paper
#24254, Cambridge MA
Mikolov, T., Chen, K., Corrado, G., & Dean, J. (2013). Efficient estimation of word
representations in vector space. In ICLR.
McInnes, L., Healy, J and Melville, J. (2018). UMAP: Uniform Manifold
Approximation and Projection for Dimension Reduction. 6, Dec 2018, arXiv
preprint arXiv:1802.03426
Motohashi (2020), Science and Technology Co-evolution in AI: Empirical
Understanding through a Linked Dataset of Scientific Articles and Patents, RIETI
Discussion Paper Series 20-E-010, RIETI, Tokyo Japan
Motohashi, K. Koshiba, H. and Ikeuchi, K. (2019), A method of extracting content
information from patent documents and comparison of their characteristics by
applicant type by using the vector space model of distributed expressions,
NISTEP Discussion Paper No. 175, MEXT Japan, Tokyo, December 2019 (in
Japanese)
Nagaoka, S., Motohashi, K. and Goto, A. (2010), Patent statistics as an innovation
indicator, in Handbook of the Economics of Innovation 2 (Hall, B. and Rosenberg,
N. ed), North Holland
Sugawara, K., Kobayashi, H., and Iwasaki, M. (2016). On Approximately Searching
for Similar Word Embeddings. In Proceedings of the 54th Annual Meeting of the
Association for Computational Linguistics
Trajtenberg, M. (2018), Artificial Intelligence as the Next GPT: A Political-Economy
Perspective, NBER Working Paper #24245, Cambridge MA
Wang, B., Wang, A., Chen, F., Wang, Y., Kuo, C. (2019). Evaluating word embedding
models: Methods and experimental results. APSIPA Transactions on Signal and
Information Processing.
Younge, K. A. and Kuhn, J. M (2016), Patent-to-Patent Similarity: A Vector Space
Model, SSRN

13
Figure 1: Internet related patents by application year
Figure 2: Distribution of cosine similarity between within patent family pairs

14
Figure 3: Word Crowd of Clustering Results
Image (Face) Recognition
Memory and Data Storage
Web Contents Application
Display Human Interface
Internet Search/Language Model
File Management System

15
Display Signal Control
Mobile User Interaction
Data Analytics
Wireless Communication
Software Engineering

16
Figure 4: UMAP visualization of patent contents and clustering results
Figure 5: Composition of patent contents by country

17
Figure 6: Comparison of Google and Baidu Patents
Figure 7: RCA of Google/Baidu Patents in each country

18
Figure 8 : Cosine similarity of 200th nearest patents
Figure 9: Share of USPTO patents in 200 neighbors by country
19
Figure 10: Graphical interpretation of NGT results
Figure 11: Cumulativeness of Google and Baidu Patents
Figure 12: Impact of Google and Baidu Patents

20
Appendix
A. WORD CLOUD RESULTS FOR WORD EMBEDDING
k-means++ was used to assign all words derived by the Skip-gram model into 24
clusters. We chose the number of clusters arbitrarily. The words in each cluster were
presented in the form of word cloud. The Skip-gram model assumes that similar words
are more likely to appear in the same context (window). Therefore, in fact, the words
in each cluster are supposed to be associative and related, not exactly to be similar.

21

22

23
B. DOCUMENT CLUSTER LABELS
Instead of labeling document clusters only by the word clouds, we also adopted the
patent titles as complementary information. We picked up ten patents of each cluster,
which were nearest to its centroid.
labels nearest10_title IPC
0 Method and device for obtaining combined image G06K9/62
0 Digital image visualized management and retrieval for communication network G06F17/30
0 Terminal device, intelligent mobile phone, and face identification-based authentication method and
system G06K9/00
0 Remote sensing image significance target detection method and system based on Hadoop G06F17/30
0 Method for detecting over-exposure area in monitoring video image combining multiple features G06K9/62
0 Method and system for detection of representative area of automatic quasi object type image G06F17/30
0 Station identification method and device G06K9/00
0 Method for generating and applying image search code technique G06F17/30
0 Image matching method and image matching device G06K9/62
0 Method and system for replacing background images of smart camera in real time G06F3/0484
1 Distributed storage method and apparatus, and data processing method and apparatus G06F17/30
1 Massive real-time data synchronization system based on private cloud storage H04L29/08
1 Distribution and utilization global total data transmission and storage method and device and
electronic equipment G06F17/30
1 Data rapid distribution method and device H04L29/06
1 Method for acquiring and converting data of metering system of intelligent transformer substation G06F17/30
1 Method of pre-caching or pre-fetching data utilizing thread lists and multimedia editing systems using
such pre-caching G06F3/06
1 Database normalization storage system and method suitable for use in multi-model satellite testing G06F17/30
1 Data audits based on timestamp criteria in replicated data bases within digital mobile
telecommunication system G06F17/30
1 Write operation control method, system and device and computer storage medium G06F3/06
1 SMART STORAGE PLATFORM APPARATUS AND METHOD FOR EFFICIENT STORAGE
AND REAL-TIME ANALYSIS OF BIG DATA G06F3/06
2 Context Based Photograph Sharing Platform for Property Inspections G06F17/30
2 Systems and methods for constructing and using models of memorability in computing and
communications applications G06F3/048
2 Systems and methods for constructing and using models of memorability in computing and
communications applications G06F3/048
2 Systems and methods for constructing and using models of memorability in computing and
communications applications G06F3/048
2 Incentives for content consumption G06Q30/00
2
METHOD AND APPARATUS FOR LOCATING ERRORS IN DOCUMENTS VIA DATABASE
QUERIES, SIMILARITY-BASED INFORMATION RETRIEVAL AND MODELING THE
ERRORS FOR ERROR RESOLUTION
G06F17/30
2 Method and system for electronic display of photographs G06F17/30

24
2 Three dimensional web crawler G06F17/30
2 Intelligent integrating system for crowdsourcing and collaborative intelligence in human- and device-
adaptive query-response networks G06F17/30
2 METHODS AND SYSTEMS FOR ANNOTATION OF DIGITAL INFORMATION G06F17/24
3 Intelligent liquid warehousing device G06K9/00
3 Internet-of-things-based water level monitoring system for water conservancy and hydropower
engineering H04L29/08
3 Touch control input device used for electronic information equipment G06F3/041
3 Output device and wearable display G09G5/00
3 Diversified reinforced tablet computer system G06F1/16
3 Force touch module, preparation method thereof, touch screen panel and display device G06F3/041
3 Luminous band display type sliding touch bar and display method of touch luminous band G06F3/041
3 Economical skin-pattern-acquisition and analysis apparatus for access control; systems controlled
thereby G06K9/00
3 Shield machine posture solving device based on VBA writing G06F9/44
3 Touch-control module, touch screen and intelligent device and stereo touch-control method G06F3/041
4 Method for understanding questions in question type automatic question-answer systems on basis of
rule G06F17/27
4 Data searching method and system based on semantic analysis G06F17/27
4 Information searching method based on metadata G06F17/30
4 Relevancy priority ordering method used for environmental protection regulation retrieval G06F17/30
4 Information management, retrieval and display system and associated method G06F17/30
4 Information management, retrieval and display systems and associated methods G06F7/00
4 Information management, retrieval and display system and associated method G06F17/30
4 Method of indexing words in handwritten document images using image hash tables G06F17/30
4 Method for searching pattern matching index G06F17/30
4 System, method and program product for answering questions using a search engine G06F17/30
5 Search engine method based on keyword resolution scheduling G06F17/30
5 Method and system for automatically converting dynamic form page to HTML5 page G06F17/22
5 Automatic access of electronic information through machine-readable codes on printed documents G06F12/00
5 Electronic commerce system for updating information G06F12/00
5 Web service multithreading file uploading system H04L29/08
5 System and method for creating and posting media lists for purposes of subsequent playback G06F3/0482
5 System and method for creating and posting media lists for purposes of subsequent playback G06F15/16
5 System and method for creating and posting media lists for purposes of subsequent playback G06F15/16
5 Pay per record system and method H04L29/06
5 Dynamic generation of target files from template files and tracking of the processing of target files G06F7/00
6 Wired security access control device of financial industry network and access method of wired
security access control device H04L29/06
6 Vehicle identification system and method G06F17/30
6 Control system G06F3/16
6 Plug type audio device and signal processing method G06F3/16
6 Touch display device and touch display method G06F3/041

25
6 Method and device for playing audio data in sound card signal input channel in real time G06F3/16
6 PORTAL ACCESS CONTROL SYSTEM G06F7/04
6 Method and device for displaying states of ports of switch H04L12/24
6 Computer control system G06F3/00
6 Login method and device for user identified by radio frequency G06F21/00
7 Device, method and equipment for information data interaction for processing information data G06F17/30
7 Smart instant interaction technology for use in radius range of position G06F17/30
7 Information processing method, terminal and electronic device G06F17/30
7 System information security monitoring method and device, computer device and storage medium G06Q10/10
7 Novel electronic device information collection and selective information orientation distribution
method H04L29/06
7 Interested object information acquisition method and system with mobile terminals coordinating with
cloud terminal H04L29/08
7 Information display method and device H04L12/58
7 Method and device for feeding back information, and terminal H04L12/58
7 Method, device and system for storing social networking service (SNS) content G06F17/30
7 Method and system for automatically ordering dishes and settling account G06Q30/02
8 Facial action unit strength estimation-based expression analysis method G06K9/00
8 Spatial data matching method based on machine learning G06F17/30
8 Method for quickly sorting EEG (Electroencephalo-graph) signal based on threshold analysis G06F3/01
8 Intelligent analysis method for components of camera scene image G06K9/62
8 Method and system for generating RFID (Radio Frequency Identification) data into tripping OD
(Origin Destination) matrix on the basis of Spark G06F17/30
8 Target identification method based on geometry reconstruction and multi-scale analysis G06K9/00
8 Time sequence similarity measurement method based on self-adaptive piecewise statistical
approximation G06F17/30
8 Judgment standard establishment method for identifying red and black time sequence through
resistance method G06K9/62
8 Data flow abnormality detection and multiple verification method based on enhancement-type angle
abnormality factor G06F17/30
8 Wi-Fi-based indoor personnel passive detection method G06K9/00
9 Systems and Methods of Network Operation and Information Processing G06F15/16
9 Systems and Methods of Network Operation and Information Processing G06F17/30
9 Systems and Methods of Network Operation and Information Processing, Including Engaging Users
of a Public-Access Network G06F15/16
9
SYSTEMS AND METHODS OF NETWORK OPERATION AND INFORMATION PROCESSING,
INCLUDING USE OF UNIQUE/ANONYMOUS IDENTIFIERS THROUGHOUT ALL STAGES
OF INFORMATION PROCESSING AND DELIVERY
G06F15/16
9 Video broadcast creation method and system, access device and management device H04L29/06
9 System and method for realizing signaling firewall based on signaling point-free access technology H04L29/06
9 Network device access authentication method in network video monitoring H04L29/06
9 System and method for simulating an application for subsequent deployment to a device in
communication with a transaction server G06F7/00

26
9 Method and system for managing personal information G06Q30/00
9 Method for monitoring resource utilization of server H04L12/24
10 Off-line engine system based on software as a service (SaaS) mode G06F17/30
10 System and method for providing a messaging application program interface G06F3/00
10 Integrated chaining process for continuous software integration and validation G06F9/44
10 Method for implementing configuration clause processing of policy-based network in cloud
component software system H04L29/06
10 Method for providing a virtual execution environment on a target computer using a virtual software
machine G06F9/44
10 Frame driving method of application construction platform G06F9/44
10 Internal control management system capable of applying response type shared application architecture G06F9/44
10 Computer flexible management construction system and interface storage and explanation method G06F9/44
10 METHOD AND SYSTEM FOR CONNECTING WORDS, PHRASES, OR SYMBOLS WITHIN
THE CONTENT OF TRANSMITTED DATA TO URI OR IP ADDRESS G06F17/30
10 Realization method and system for device control by using HTTP interface H04L29/08

27
C: TUNING OF EXPLORED RANGE IN NGT
NGT has a primary parameter 𝜖 that defines the explored range for the graph, allowing
us to achieve higher precision. As the ‘No Free Lunch’ theorem, the more extensive the
explored range, the higher the precision, the longer the search time. To investigate the
relationship between the explored range 𝜖 and accuracy, we randomly collect 𝑛
patents from the corpus. Denote 𝑁𝑡𝑟𝑢𝑒(𝑖) as the true nearest 200 neighbors of patent
𝑖, and 𝑁𝑛𝑔𝑡(𝑖, 𝜖) the approximated nearest 200 neighbors of patent 𝑖 given by NGT.
Then, the accuracy of given 𝜖 value is calculated by
𝐴𝑐𝑐𝑢𝑟𝑎𝑐𝑦(𝜖) =1
𝑛∑
𝑙𝑒𝑛(𝑁𝑡𝑟𝑢𝑒(𝑖) ∩ 𝑁𝑛𝑔𝑡(𝑖, 𝜖))
200
𝑛
𝑖=1
In our case, we collected a random sample of 500 patents and set the range of 𝜖 from
0.05 to 1 with a step 0.05. The following figures shows the change of accuracy by tuning
the value of 𝜖 . For the following results, we set the 𝜖 as 0.35, which had a 0.997
accuracy rate and plausible running time in the experiment.