technological developments in education and...
TRANSCRIPT

Technological Developments in Educationand Automation

Magued Iskander · Vikram Kapila ·Mohammad A. KarimEditors
TechnologicalDevelopmentsin Educationand Automation
123

EditorsMagued Iskander Dr. Vikram KapilaPolytechnic Institute of NYU
Dept.Civil Engineering Dept.Mechanical Engineering333 Jay Street 333 Jay StreetBrooklyn NY 11201 Brooklyn NY 11201USA [email protected] [email protected]
Dr. Mohammad A. KarimOld Dominion University4111 Monarch WayNorfolk VA [email protected]
ISBN 978-90-481-3655-1 e-ISBN 978-90-481-3656-8DOI 10.1007/978-90-481-3656-8Springer Dordrecht Heidelberg London New York
Library of Congress Control Number: 2009942235
c© Springer Science+Business Media B.V. 2010No part of this work may be reproduced, stored in a retrieval system, or transmitted in any form or byany means, electronic, mechanical, photocopying, microfilming, recording or otherwise, without writtenpermission from the Publisher, with the exception of any material supplied specifically for the purpose ofbeing entered and executed on a computer system, for exclusive use by the purchaser of the work.
Printed on acid-free paper
Springer is part of Springer Science+Business Media (www.springer.com)
Polytechnic Institute of NYU

Preface This book includes the proceedings of the 2008 International Conference on Engineering Education, Instructional Technology, Assessment, and E-learning (EIAE 08) and International Conference on Industrial Electronics, Technology & Automation (IETA08). Both conferences were part of the International Joint Conferences on Computer, Information, and Systems Sciences, and Engineering (CISSE 08). The proceedings are a set of rigorously reviewed world-class manuscripts presenting recent technological developments in education and automation. CISSE 08 was a high-caliber research conference that was conducted online. CISSE 08 received 948 paper submissions and the final program included 390 accepted papers from 77 countries, representing the six continents. Each paper received at least two reviews, and authors were required to address review comments prior to presentation and publication. Conducting EIAE 08 online presented a number of unique advantages, as follows:
• All communications between the authors, reviewers, and conference organizing committee were done on line, which permitted a short six week period from the paper submission deadline to the beginning of the conference.
• PowerPoint presentations, final paper manuscripts were available to registrants for three weeks prior to the start of the conference
• The conference platform allowed live presentations by several presenters from different locations, with the audio and PowerPoint transmitted to attendees throughout the Internet, even on dial up connections. Attendees were able to ask both audio and written questions in a chat room format, and presenters could mark up their slides as they deem fit
• The live audio presentations were also recorded and distributed to participants along with the power points presentations and paper manuscripts within the conference DVD.
The conference organizers and us are confident that you will find the papers included in this volume interesting and useful. We believe that technology will continue to infuse education thus enriching the educational experience of both students and teachers. Magued Iskander. PhD, PE Vikram Kapila, PhD Mohammad Karim, Ph.D. June 2009
.
.
V
Table of Contents
VII
Preace ............................................................................................................................................................. V Acknowledgements ..................................................................................................................................... XV Technical Committees ...............................................................................................................................XVII 1. Performance-Based Measurement for Thai Educational Organization: A DEA Management Model .... 1 Sangchan Kantabutra 2. E-learning and Blended Learning in the Gulf Region ............................................................................. 7 Dr.Soly Mathew Biju 3. Scene Change Detection for Uncompressed Video ............................................................................... 11 Patrick Seeling 4. ZigBee Performance in 400 KV Air Insulated Power Substation.......................................................... 15 Qingshan Shan et al. 5. Content Management System Effort Estimation Using Bagging Predictors ......................................... 19 Naveen Aggarwal et al. 6. Weighted Gaussian Kernel with Multiple Widths and Network Kernel Pattern.................................... 25 Jing Tian and Lifeng Zhao 7. New Advanced Graduate Course Designed to Provide Students Exposure to Today’s
Developing and Challenging World ...................................................................................................... 29 Zheng (Jeremy) Li, Ph.D. 8. Dynamic Fire 3D Modeling Using a Real-time Stereovision System ................................................... 33 L. Rossi and M. Akhloufi 9. Obtaining Initial Controller Parameters for Approximate Pole Placement Iterative
Feedback Tuning ................................................................................................................................... 39 J. Sikaundi 10. Organizational Learning and Knowledge Management ........................................................................ 45 Dr. PhD Margareth Stoll 11. System to Produce Mechanical Inertial Force and/or Torque................................................................ 51 Dan Ciulin 12. Active Groups in Complex Mechanisms Structures .............................................................................. 57 Adriana Comanescu et al. 13. Dimensions of Online Behavior: Implications for Engineering E-Learning.......................................... 61 Genevieve Marie Johnson and Julia Ann Johnson 14. Concept Classification Model for Digital Divide .................................................................................. 67 J. Naarmala and O. Mäkinen
VIII TABLE OF CONTENTS 15. A Virtual Explosion or SNAFU is Always Better Than a Real One: Exploring the Use of
Virtual Worlds for Simulation and Training…and Developing the Leaders of Tomorrow................... 73 David C. Wyld
16. Active-based Key-skills Learning in Engineering Curriculum to Improve Student Engagement ......... 79 Cecilia K.Y. Chan and Mike Murphy
17. Assessment & Efficacy of an M-Learning Course in Industrial Hygiene and Occupational Safety............................................................................................................................... 85
T. J. Ryan
18. A Simplified Array Configuration based GSC-SSF Method................................................................. 91 Zhang Cong
19. “UniTeSys” - High School Student Knowledge Assessment Tool........................................................ 97 Borislav Slavov
20. On the Percolation Behavior of the Thin Films of the PEDT/PSS Complex: a Mesoscale Simulation Study................................................................................................................ 103
Toomas Kaevand et al.
21. Online Learning Barriers ..................................................................................................................... 109 Jozef Simuth and Ivan Sarmany-Schuller
22. Good and Bad in Information Retrieval: Information Literacy and Ethics.......................................... 113 Olli Mäkinen et al.
23. Formative Research for Enhancing Instructional and Design Methods: A Focus on Virtual Reality (VR)-Based Learning Environment ............................................................................ 119
24. Results on H-Infinity Static Output-Feedback Control of an Electro-Mechanical System.................. 123 Jyotirmay Gadewadikar et al.
25. Design of Nonlinear Frequency Controller for Isolated Thermal Power System with Generation Rate Constraint .................................................................................................................................... 129
Ognjen Kuljaca et al.
26. Designing a Virtual Reality (VR) Storytelling System for Educational Purposes............................... 135 Siew Yung Lau and Chwen Jen Chen
27. Automated Marking of Transfer Function Problems ........................................................................... 139 David Moore
28. Predicting Persistence of College Freshmen Using Neural Networks ................................................. 145 Cameron Ian Cooper
29. Euro-QLIO a New Educational Tool for Specialist Training at European Level ................................ 149 H. Pop et al.
30. Design, Development and Implemementation of a Steering Controller Box for an Automatic Agricultural Tractor Guidance system, Using Fuzzy Logic. ............................................................... 153
A. Carrera_González et al.
Chwen Jen Chen
IXTABLE OF CONTENTS
31. A Screen Sharing Broadcast Scheme in Distance Learning ................................................................ 159 Tzong-An Su and Han-Chun Young 32. Robotics-based Curriculum Development for An Immigration Course into Computer Systems
Engineering.......................................................................................................................................... 165 C. N. Thai et al. 33. Bridging the Emotional Divide in Instructional Design: A Kansei Perspective .................................. 173 Chwen Jen Chen et al. 34. Fuzzy Knowledge Processing for Unveiling Correlations between Preliminary
Knowledge and the Outcome of Learning New Knowledge ............................................................... 179 Sylvia Encheva and Sharil Tumin 35. Accuracy Improvement Evaluation in Sensorless Dc Motor Speed Estimation by Combining the
Dynamic Motor Model and the Ripple Component Detection. ........................................................... 183 Ernesto Vázquez Sánchez et al. 36. Defining Adaptive Assessments Using Open Specifications............................................................... 189 Héctor G. Barbosa León et al. 37. Using the Virtual Model in Teaching Digital Signal Processing ......................................................... 195 Krystyna Maria Noga 38. Comparative Study of Sliding Mode and Relay Enhanced PI Controllers for MIMO Systems .......... 201 Regina P. and Mija S. J 39. Modeling, Simulation and Control of Chemical Industrial Reactor .................................................... 207 Z. Prokopova 40. A Robust Method for Detecting Vehicle Positions and Their Movements Even in Bad Weather
Using Infrared Thermal Images........................................................................................................... 213 Yoichiro Iwasaki and Shinya Kawata 41. Virtual Oxygen Sensor Implementation Using Artificial Neural Networks ........................................ 219 Thiago Richter et al. 42. Pattern-Based Usability Analysis: Comparison with a Case-Study..................................................... 225 Dmitry Zub and Erki Eessaar 43. The Effect of Pressure in Two-Dimensional Luikov Drying Problem ................................................ 231 João Batista Furlan Duarte et al. 44. Design of Man Machine Interface for Real-Time Online Control of DC Drives ................................ 237 Jagadeesh Chandra A.P and R.D Sudhaker Samuel 45. The Output Regulation for Tracking Unusual Motion Patterns by Active Disturbance
Rejection Control................................................................................................................................. 243 Wei Wang 46. Design of a High Performance, Low Power, Fully Differential Telescopic Cascode Amplifier
using Common-Mode Feedback Circuit .............................................................................................. 249 Tushar Uttarwar
TABLE OF CONTENTSX 47. Development of Children’s Communicative Competence using Case Method of Technology........... 253 Giedrė Strakšienė and Dalia Baziukaitė
48. Making the University Admission Decision Making Process Lean .................................................... 259 Kai Jin and Manisha Kachroo
49. Control Circuitry for Self-Repairable MEMS Accelerometers............................................................ 265 Xingguo Xiong et al.
50. The Learning Process Management in E-learning Environment in the Technology School “Electronic Systems” Associated with the Technical University of Sofia............................... 271
Ludmilla Yordanova Stoyanova
51. Taxonomy of E-courses ....................................................................................................................... 275 Leszek Rudak and Dorota Sidor
52. One Dimensional IIR Digital Filter Modeling Based on Recurrent Neural Network.......................... 281 Stefanova S.A.
53. The Development of a Lecture Capture System Based on a Tool to Support Hearing Impaired Students. .............................................................................................................................................. 287
Iain Stewart et al.
54. Research on Disparity and Background-based Object Segmentation in Stereo Video ........................ 293 Tian-xiao Guan et al.
55. Dynamic modeling and VR Simulation of 3DOF medical parallel robots .......................................... 297 Nadia Ramona Raţ et al.
56. Possibilities Concerning Control of a Laser Welding Cell Utilizing Servomotors and PLC............... 303 R. Pacurari et al.
57. Generalized Net Model of E-learning System with Privacy Protection Module ................................. 309 Daniela A. Orozova and Veselina G. Jecheva
58. Advanced Knowledge Assessment System – Functional and Conceptual Specification..................... 315
59. Diplek: an Open Educational Platform that Supports the Composition of Learning, Management and Communication Services......................................................................................... 321
C. T. Rodosthenous et al.
60. Double Degrees: Concerns Regarding Overall Standards and Graduate Attributes such as Probabilistic Reasoning........................................................................................................... 327
Bruce Moulton
61. Pro Bono in Engineering: Towards an Improved Understanding ........................................................ 333 Bruce Moulton
62. Experiences from Software Maintenance Seminars: Organizing Three Seminars with 127 Groups .................................................................................................................................. 339
Jussi Koskinen
63. A Vector Based Smoothing Algorithm of High Speed Motion at Trajectory Corner.......................... 345 Lei Luo, Jun Hu
Jan Genci

TABLE OF CONTENTS XI
64. Teamwork and ABET Review: A Template for Assessment .............................................................. 349 Karl Perusich, Ph.D. 65. Modelling Single Cell Electroporation with Bipolar Pulse: Simulating Dependance of
Electroporated Fractional Pore Area on the Bipolar Field Frequency ................................................. 355 Sadhana Talele et al. 66. A Web-based System to Support Group Idea Generation for Creative Problem Solving.................... 361 Ken'ichi Minamino and Tetsuo Kinoshita 67. Unsupervised Segmentation of Industrial Images Using Markov Random Field Model..................... 369 Mofakharul Islam et al. 68. MRF Model Based Unsupervised Color Textured Image Segmentation Using Multidimensional
Spatially Variant Finite Mixture Model............................................................................................... 375 Mofakharul Islam et al. 69. Creating a Novel Multi Platform Technology Based System for School Quality Assessment............ 381 Anirudh Roy Popli, Preeti Choudhary 70. PC-Based Modeling and Simulation of Large Marine Propulsion Plant ............................................. 385 Sun Jianbo and Guo Chen 71. Evolutionary Techniques for Deterministic Chaos Control................................................................. 391 Roman Senkerik et al. 72. Active Vision for Human Action Sensing ........................................................................................... 397 M. Mackay et al. 73. Effects of Online MCQ Tests on Student Learning............................................................................. 403 B. Issac and S.M. Jacob 74. Knowledge Assessment – Practical Example in Testing ..................................................................... 409
75. View-Independent Face Recognition with RBF Gating in Mixture of Experts
Method by Teacher-Directed Learning................................................................................................ 413 Salman Khaleghian et al. 76. Dependability Comparison of Explicit and Numerical GPC Algorithms ............................................ 419 Piotr Gawkowski et al. 77. Efficient Predictive Control Algorithms Based on Soft Computing Approaches: Application
to Glucose Concentration Stabilization ............................................................................................... 425 Maciej Ławryńczuk et al. 78. Eteacher – Interactive and Individualized Training of Software Applications in the
Original user Interface ......................................................................................................................... 431 Peter Krumhauer 79. Fuzzy Control of a 3 Degree of Freedom Parallel Robot..................................................................... 437 Sergiu-Dan Stan et al.
Jan Genci

TABLE OF CONTENTSXII
80. eduPAL: An Online Service to Create, Manage and Evaluate Educational Projects........................... 443 Jhilmil Jain 81. Integrating Web 2.0 Technologies in Undergraduate Teaching: Experiences with a
Wiki Implementation ........................................................................................................................... 449 Ilias Karasavvidis 82. Actor-Critic Algorithms for Variance Minimization ........................................................................... 455 Yogesh P. Awate 83. e-Education as a State Service to Citizens of Different Ages .............................................................. 461 Deniss Kumlander 84. A Context-Aware Biometric Security System for e- Learning Applications....................................... 467 Deniss Kumlander 85. Creating an Immersive Virtual World through Integration of 2D and 3D Technologies
to Implement E-Learning Curricula for Middle School Students ........................................................ 473
86. Three Leveled Fuzzy System for Traffic Light and Urban Traffic Control Based on
Cellular Automata................................................................................................................................ 477 Moein Shakeri et al. 87. Inter-Machine Cooperation Mechanism for Dynamic Scheduling ...................................................... 483 Ana Madureira, Joaquim Santos 88. 3D Simulation of Suicide Bombing – Using Computers to Save Lives .............................................. 489 Zeeshan-ul-hassan Usmani et al. 89. Reliability Investigation of a Hybrid Fuel Cell Electric Vehicle Powered by Downsized
Fuel Cells............................................................................................................................................. 495 Pardis Khayyer et al. 90. Dispatching of Active Power Reserve for Higher Reliability of Restructured Power Systems........... 499 Mohammad Taghi Ameli et al. 91. Notes on Implementation of Novel Approach for Microscopic Measurement with
Stereo Correlation................................................................................................................................ 505 Avramov, M. Z. and Soklev, B 92. Distance Interaction in Education Processes using a Telepresence Tool............................................. 509 Fáber Giraldo et al. 93. A Study on the Lifetime Estimates of Aluminum Cable, Steel Reinforced (ACSR)
Transmission Lines Under Flame Exposure ........................................................................................ 513 Young-Dal Kim et al. 94. A Study on the Vibration Phenomenon of a Power Transformer in Operation
(154kV/60MVA/Single-phase)............................................................................................................ 519 Young-Dal Kim et al. 95. Distinguishing Fall Activities using Human Shape Characteristics..................................................... 523 Homa Foroughi et al.
C. Coton, et al.
TABLE OF CONTENTS XIII
96. Limits in Process Diagnosis Using Thermographic Images Processing .............................................. 529 Alina Dinca et al. 97. E-learning Tools in Naval Engineering ............................................................................................... 535 G. Popescu 98. Augmented Reality Used to Control a Robot System via Internet ...................................................... 539 R. Tarca et al. 99. Simultaneous Use of Scaled and Virtual Models in Early Architectural Design Education................ 545 Neander F. Silva, Ecilamar M. Lima 100. Modeling A Deburring Process, Using DELMIA V5®....................................................................... 549 Mohammad Mohammad et al. Index............................................................................................................................................................ 559

Acknowledgements The 2008 International Conference on Engineering Education, Instructional Technology, Assessment, and E-learning (EIAE) and the resulting proceedings could not have been organized without the assistance of a large number of individuals. EIAE is part of the International Joint Conferences on Computer, Information, and Systems Sciences, and Engineering (CISSE). CISSE was founded by Professors Tarek Sobh and Khaled Elleithy in 2005, and they set up mechanisms that put it into action. Andrew Rosca wrote the software that allowed conference management, and interaction between the authors and reviewers online. Mr. Tudor Rosca managed the online conference presentation system and was instrumental in ensuring that the event met the highest professional standards. We also want to acknowledge the roles played by Sarosh Patel and Ms. Susan Kristie, our technical and administrative support team. The technical co-sponsorship provided by the Institute of Electrical and Electronics Engineers (IEEE) and the University of Bridgeport is gratefully appreciated. We would like to express our thanks to Prof. Toshio Fukuda, Chair of the International Advisory Committee and the members of the EIAE and IETA Technical Program Committees. The excellent contributions of the authors made this world-class document possible. Each paper received two to four reviews. The reviewers worked tirelessly under a tight schedule and their important work is gratefully appreciated. In particular, we want to acknowledge the contributions of the technical committee members who provided the bulk of peer review. The first and second authors are grateful to the National Science Foundation’s GK-12 program grant DGE- 0741714 that permitted them to extend their pedagogical interests beyond their own classroom into the k-12 community and share these results through international forums such as EIAE. Finally, we wish to gratefully acknowledge the support we received from our employers Polytechnic Institute of New York University and Old Dominion University. Magued Iskander. PhD, PE Vikram Kapila, PhD Mohammad Karim, Ph.D. June 2009
XV

Technical Committee of the 2008 International Conference on Engineering Education, Instructional Technology, Assessment, and E-learning (EIAE 08)
Eman Abdelfattah, University of Bridgeport, USA Selim Akl, Queen's University, Canada
Michael E. Auer, Carinthia University of Applied Sciences, Austria Svetlana Baigozina, Datorzinibu Centrs, Latvia, Riga
Hector Barbosa, University of Salmanca, Spain & Technical Institute of Colima, Mexico Paul Botosani, University of Fairfield, USA
Sylvia Encheva, Stord/Haugesund University College, Norway James Feher, McKendree University, USA
Navarun Gupta, University of Bridgeport, USA Alan J. Hadad, University of Hartford, USA
Abdolloh Homaifar, North Carolina A&T University, USA Magued Iskander, Polytechnic Institute of New York University, USA
Sangchan Kantabutra, Mae Fah Luang University, Thailand Vikram Kapila, Polytechnic Institute of NYU, USA Noel Kriftcher, Polytechnic Institute of NYU, USA
Olli Mäkinen, Seinäjoki University of Applied Sciences, Finland Atef Al Najjar, King Fahd University, Saudi Arabia
Krystyna Maria Noga, Gdynia Maritime University, Poland Santiago de Pablo, University of Valladolid, Spain
Sarosh H. Patel, University of Bridgeport, USA James A. Redmond, University of Dublin, Trinity College, Ireland
Adnan Salihbegovic, University of Sarajevo, Bosnia Mohmoud E. Sawan, Wichita State University, USA
Neander Silva, Universidade de Brasilia, Brazil Suwanna Sombunsukno, King Mongkut's University of Technology, Thailand
Margareth Stoll, EURAC Research, Free University of Bozen, Italy Bill Taylor, Fairfield University, USA
Mare Teichmann, Tallinn University of Technology, Estonia Chi N. Thai, University of Georgia, USA
Abilash Tibrewal, University of Bridgeport, USA Alexander Vaninsky, The City University of New York, USA
Ahmed Zobaa, University of Exeter, UK
XVII

Technical Committee of the 2008 International Conference on Industrial Electronics, Technology & Automation (IETA 08)
Giua Alessandro, University of Cagliari, Italy Essam Badreddin, University of Mannheim, Germany
John Billingsley, University of Southern Queensland, Australia Angela Di Febbraro, Politecnico Di Torino, Italy
Aydan Erkmen, Middle East Technical University, Turkey Navarun Gupta, University of Bridgeport, USA
Junling (Joyce) Hu, University of Bridgeport, USA Mohamed Kamel, Universityof Waterloo, Canada
Heba A. Hassan, Cairo University, Egypt Heikki N. Koivo, Helsinki University of Technology, Finland
Larry Hmurcik, University of Bridgeport, USA Luu Pham, Pitney Bowes, USA
Saeid Nahavandi, School of Engineering & Technology, Australia ElSayed Orady, University of Michigan, Dearborn, USA
Angel Pobil, Jaume-I University, Spain Anatoly Sachenko, Ternopil Academy of National Economy, Ukraine
Sadiq M. Sait, King Fahd University, Saudi Arabia Nariman Sepehri, The University Of Manitoba, Canada
Bruno Siciliano, University of Naples Federico II
XVIII

Sangchan Kantabutra School of Management
Mae Fah Luang University, Chiangrai, Thailand [email protected]
Abstract- This study employs the Data Envelopment Analysis
(DEA) technique, an efficiency model, to measure public schools in Thailand. Data came from 455 public upper secondary schools in Northern Thailand. The results reveal that the schools mostly operate inefficiently. To ascertain the efficiency measures, sensitivity analysis reveals the robustness of the resulting efficiency measures on efficiency. Policy to improve school efficiency may thus consider using efficiency-based analysis for measuring school performance to identify which school will yield higher marginal returns to prioritize inefficient schools for treatment, in addition to allocating budget based on block grants or enrolments.
I. INTRODUCTION
With the scope of unstoppable change under globalization
age, governments in the Asia-Pacific region are finding it increasingly more difficult to put their educational policies into practices [[1], [2]]. Although spending on education is major government expenditure for the region’s countries, the capacity of their educational systems to meet the new demands of this global age is still in question [3].
Thailand, one of the relatively fast-growing economies of
Southeast Asia, has been providing the largest share of total public expenditure to education since 1991--even after the 1997 economic crisis began, the government provided 25% of total expenditures, or 4.3% of GDP, for education, which was a greater portion than before, demonstrating its commitment to education for the nation’s recovery and development [4]. However, although the Thai government has committed significant resources, its degree of efficiency in providing educational services and procedures is still unclear [4].
This study employs a DEA technique to assess public general upper secondary school efficiency in Northern Thailand. DEA has been recognized as a useful management tool that can be applied for evaluating the relative efficiency of various organizations, e.g., hospitals [5], banks [6], or schools [7], as it compares a given unit to the best-performing units in its peer. The results obtained can identify relatively efficient/inefficient organizations and allow policy makers to develop performance-based policies to assist inefficient ones to improve their performance.
The purpose of this study is to estimate school efficiency and examines the robustness of resulting measures on efficiency by using sensitivity analysis. During the past decade, while most DEA studies have measured school efficiency in the U.S., U.K., Finland, Spain and Australia, very few studies have dealt with schools in Thailand. The novel methodological contribution of this study is a statistical foundation of output efficiencies along with a sensitivity analysis for the robustness on efficiency.
II. THE ANALYTICAL FRAMEWORK
The analytical framework of this study would entail: (1) measuring school efficiency, and (2) testing the robustness of resulting on efficiency measures.
The data envelopment analysis (DEA), an efficiency model
initially introduced by [8], is used to assess school efficiency, through viewing schools as productive units using multiple inputs to generate multiple outputs. DEA is a deterministic means of constructing a “piece-wise linear” approximation to the frontier based on the available sample. In simple terms, the distribution of sample points is observed and a “kinked” line is constructed around the outside of them, “enveloping’’ them (hence the term “data envelopment analysis”). DEA provides a comprehensive analysis of relative efficiency by evaluating each decision-making unit (DMU) and measuring its performance relative to an envelopment surface composed of other DMUs. Each DMU in a given set can then be ranked according to how efficiently it either utilizes its inputs to produce its outputs or it maximizes its outputs using its given inputs, depending on the measuring propose. Units that lie on the surface are deemed “efficient” in DEA terminology, while units that do not lie on the surface are termed “inefficient”. The unit of measurement of DMU performance used is an efficiency score. After evaluation of the relative efficiency of the present set of units, the analysis shows how inputs and outputs have to be changed in order to maximize the efficiency of the target DMU. DEA also suggests a benchmark for each inefficient DMU at the level of its individual mix of inputs and outputs.
DEA has been used and cited as an important approach to
assess school efficiency internationally [[7], [9], [10], [11],
M. Iskander et al. (eds.), Technological Developments in Education and Automation, DOI 10.1007/978-90-481-3656-8_1, © Springer Science+Business Media B.V. 2010
Performance-Based Measurement for Thai Educational Organization: A DEA Management Model
[12]] and has been proposed and assessed Thai school efficiency [[13], [14], [15], [16], [17]] due to its several unique advantages over other traditional techniques, e.g., ratio analysis and regression analysis [18], [19]]. First, DEA can handle multiple inputs and outputs on a simultaneous basis in the input/output education production function. Second, DEA does not require parametric specification of the production function in mathematical form. Third, DEA does not assume behavioral assumptions, e.g., like cost-minimizing or profit-seeking behavior, and this is especially relevant to public schools, which are non-profit organizations. Fourth, inputs and outputs that are contributing to inefficiency are identified and administrators can decide whether a reallocation of resources is necessary or feasible. Finally, managerial strategies for improvement of inefficient decision-making units can be determined.
In the context of public schools, [11] noted that an output
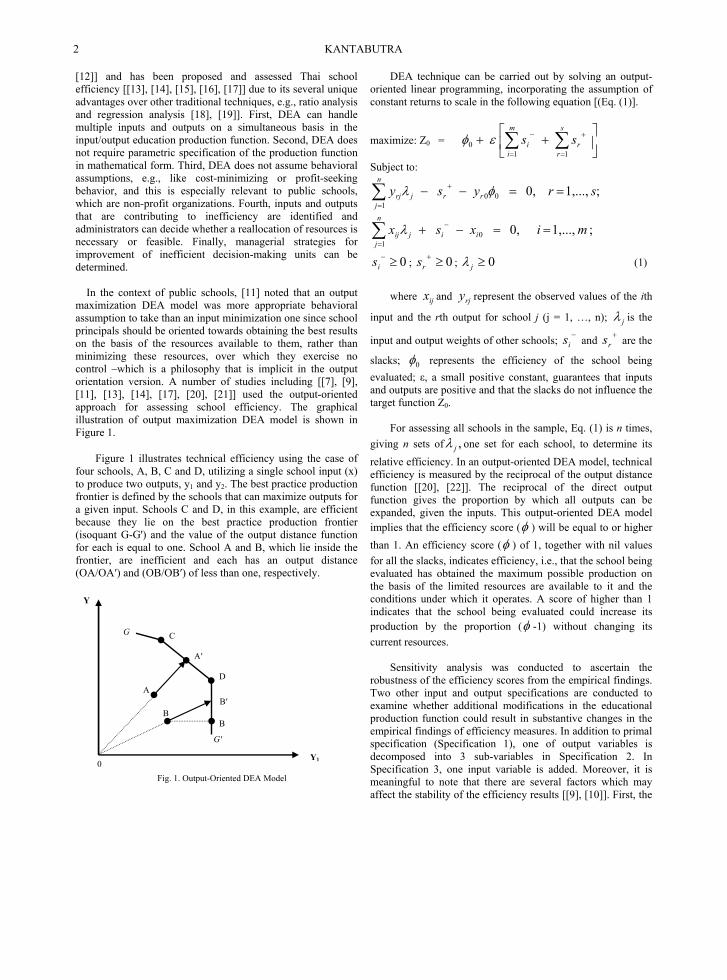
maximization DEA model was more appropriate behavioral assumption to take than an input minimization one since school principals should be oriented towards obtaining the best results on the basis of the resources available to them, rather than minimizing these resources, over which they exercise no control –which is a philosophy that is implicit in the output orientation version. A number of studies including [[7], [9], [11], [13], [14], [17], [20], [21]] used the output-oriented approach for assessing school efficiency. The graphical illustration of output maximization DEA model is shown in Figure 1.
Figure 1 illustrates technical efficiency using the case of four schools, A, B, C and D, utilizing a single school input (x) to produce two outputs, y1 and y2. The best practice production frontier is defined by the schools that can maximize outputs for a given input. Schools C and D, in this example, are efficient because they lie on the best practice production frontier (isoquant G-G') and the value of the output distance function for each is equal to one. School A and B, which lie inside the frontier, are inefficient and each has an output distance (OA/OA′) and (OB/OB′) of less than one, respectively.
Fig. 1. Output-Oriented DEA Model
DEA technique can be carried out by solving an output-oriented linear programming, incorporating the assumption of constant returns to scale in the following equation [(Eq. (1)].
maximize: Z0 = 1 1
0
++ ∑ ∑
= =
+−m
i
s
rri ssεφ
Subject to:
∑=
+ =−−n
jrrjrj ysy
100 0, φλ ; 1,..., sr =
∑=
− =−+n
jiijij xsx
10 0, λ ; 1,..., mi =
0≥−is ; 0≥+
rs ; 0≥jλ (1) where ijx and rjy represent the observed values of the ith
input and the rth output for school j (j = 1, …, n); jλ is the
input and output weights of other schools; −is and +
rs are the
slacks; 0φ represents the efficiency of the school being evaluated; ε, a small positive constant, guarantees that inputs and outputs are positive and that the slacks do not influence the target function Z0.
For assessing all schools in the sample, Eq. (1) is n times,
giving n sets of ,jλ one set for each school, to determine its relative efficiency. In an output-oriented DEA model, technical efficiency is measured by the reciprocal of the output distance function [[20], [22]]. The reciprocal of the direct output function gives the proportion by which all outputs can be expanded, given the inputs. This output-oriented DEA model implies that the efficiency score (φ ) will be equal to or higher than 1. An efficiency score (φ ) of 1, together with nil values for all the slacks, indicates efficiency, i.e., that the school being evaluated has obtained the maximum possible production on the basis of the limited resources are available to it and the conditions under which it operates. A score of higher than 1 indicates that the school being evaluated could increase its production by the proportion (φ -1) without changing its current resources.
Sensitivity analysis was conducted to ascertain the
robustness of the efficiency scores from the empirical findings. Two other input and output specifications are conducted to examine whether additional modifications in the educational production function could result in substantive changes in the empirical findings of efficiency measures. In addition to primal specification (Specification 1), one of output variables is decomposed into 3 sub-variables in Specification 2. In Specification 3, one input variable is added. Moreover, it is meaningful to note that there are several factors which may affect the stability of the efficiency results [[9], [10]]. First, the
0
B B″
B′
A′
D
C
A
Y1
Y
G'
G
KANTABUTRA 2
efficiency frontier may be partly based on outlier units or efficient schools that are very different from other units, either genuinely or due to miscoding, measurement error, etc. In such a case, omitting these outliers may change the mean efficiency and rankings based on efficiency scores. Second, the use of different combinations of inputs and outputs may change the ranking of individual schools. Thus, two forms of sensitivity analysis were conducted. First, a form of sensitivity analysis known as “jackknifing” is used to test the robustness of DEA results in regard to outlier schools. Second, Spearman rank correlation between DEA specifications was used to test the changes in their ranking based on efficiency score from one DEA specification to another.
III. DATA AND RESULTS Data came from 455 public general upper secondary
schools that were in Northern Thailand in 2003. All of these schools were under the same regulations of the Office of the Basic Education Commission (OBEC) of the MOE and utilized the same curriculum, thus ensuring homogeneity across the schools, and that all schools had the same production technology.
Inputs (Xi) used here are the teacher-student ratio [[7],
[11], [13], [14]] and proportion of students not from low-income families [[9], [13], [14], [23], [24]], to reflect the quantity of resources available (e.g., teachers) and quality of inputs (e.g., students). This study includes SES input in DEA model since it has been argued that if SES was not included in calculating efficiency, the results obtained would not be operationally valid [25]. Because general upper secondary school lasts for three years, input data covers 2001-2003, measured as an average whenever possible. To measure school outputs (yr), average national test scores [[7], [9], [10], [13], [14]], the number of students who passed their grades after first and second year (average of 2001-02) or were moved up [[10], [13], [14]], and number of graduates [[10], [13], [14]] were included to measure school efficiency. (A full list of descriptive statistics of input and output variables, together with description of variables, is provided in the Appendix.)
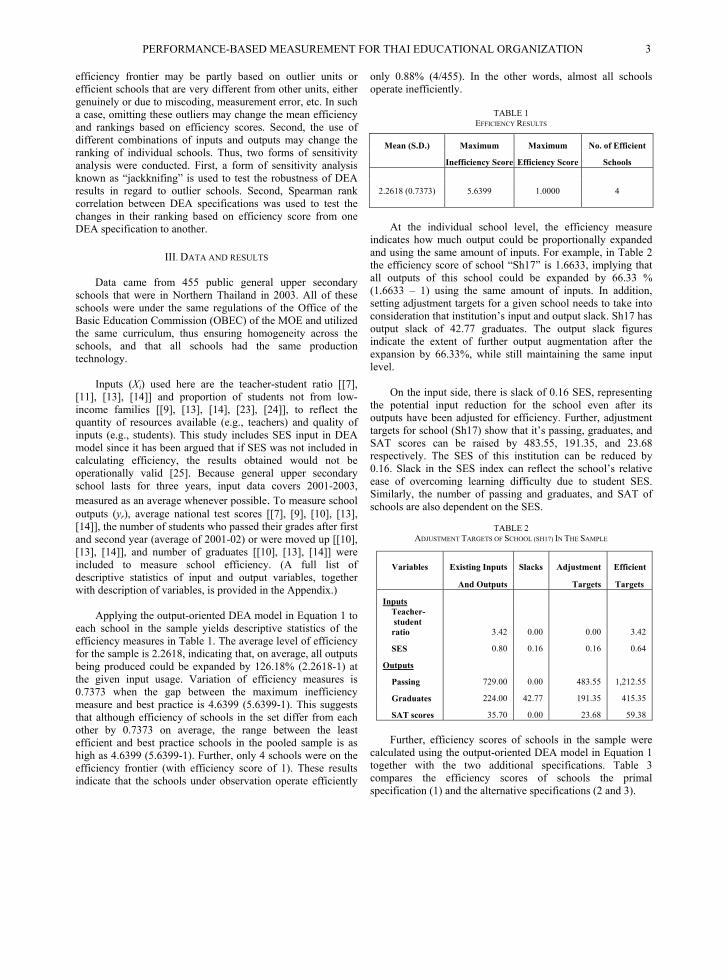
Applying the output-oriented DEA model in Equation 1 to each school in the sample yields descriptive statistics of the efficiency measures in Table 1. The average level of efficiency for the sample is 2.2618, indicating that, on average, all outputs being produced could be expanded by 126.18% (2.2618-1) at the given input usage. Variation of efficiency measures is 0.7373 when the gap between the maximum inefficiency measure and best practice is 4.6399 (5.6399-1). This suggests that although efficiency of schools in the set differ from each other by 0.7373 on average, the range between the least efficient and best practice schools in the pooled sample is as high as 4.6399 (5.6399-1). Further, only 4 schools were on the efficiency frontier (with efficiency score of 1). These results indicate that the schools under observation operate efficiently
only 0.88% (4/455). In the other words, almost all schools operate inefficiently.
TABLE 1
EFFICIENCY RESULTS
Mean (S.D.) Maximum Maximum No. of Efficient
Inefficiency Score Efficiency Score Schools
2.2618 (0.7373) 5.6399 1.0000 4
At the individual school level, the efficiency measure indicates how much output could be proportionally expanded and using the same amount of inputs. For example, in Table 2 the efficiency score of school “Sh17” is 1.6633, implying that all outputs of this school could be expanded by 66.33 % (1.6633 – 1) using the same amount of inputs. In addition, setting adjustment targets for a given school needs to take into consideration that institution’s input and output slack. Sh17 has output slack of 42.77 graduates. The output slack figures indicate the extent of further output augmentation after the expansion by 66.33%, while still maintaining the same input level.
On the input side, there is slack of 0.16 SES, representing
the potential input reduction for the school even after its outputs have been adjusted for efficiency. Further, adjustment targets for school (Sh17) show that it’s passing, graduates, and SAT scores can be raised by 483.55, 191.35, and 23.68 respectively. The SES of this institution can be reduced by 0.16. Slack in the SES index can reflect the school’s relative ease of overcoming learning difficulty due to student SES. Similarly, the number of passing and graduates, and SAT of schools are also dependent on the SES.
TABLE 2
ADJUSTMENT TARGETS OF SCHOOL (SH17) IN THE SAMPLE
Variables Existing Inputs Slacks
Adjustment Efficient
And Outputs Targets Targets
Inputs Teacher- student ratio 3.42 0.00 0.00 3.42
SES 0.80 0.16 0.16 0.64
Outputs
Passing 729.00 0.00 483.55 1,212.55
Graduates 224.00 42.77 191.35 415.35
SAT scores 35.70 0.00 23.68 59.38 Further, efficiency scores of schools in the sample were
calculated using the output-oriented DEA model in Equation 1 together with the two additional specifications. Table 3 compares the efficiency scores of schools the primal specification (1) and the alternative specifications (2 and 3).
PERFORMANCE-BASED MEASUREMENT FOR THAI EDUCATIONAL ORGANIZATION 3
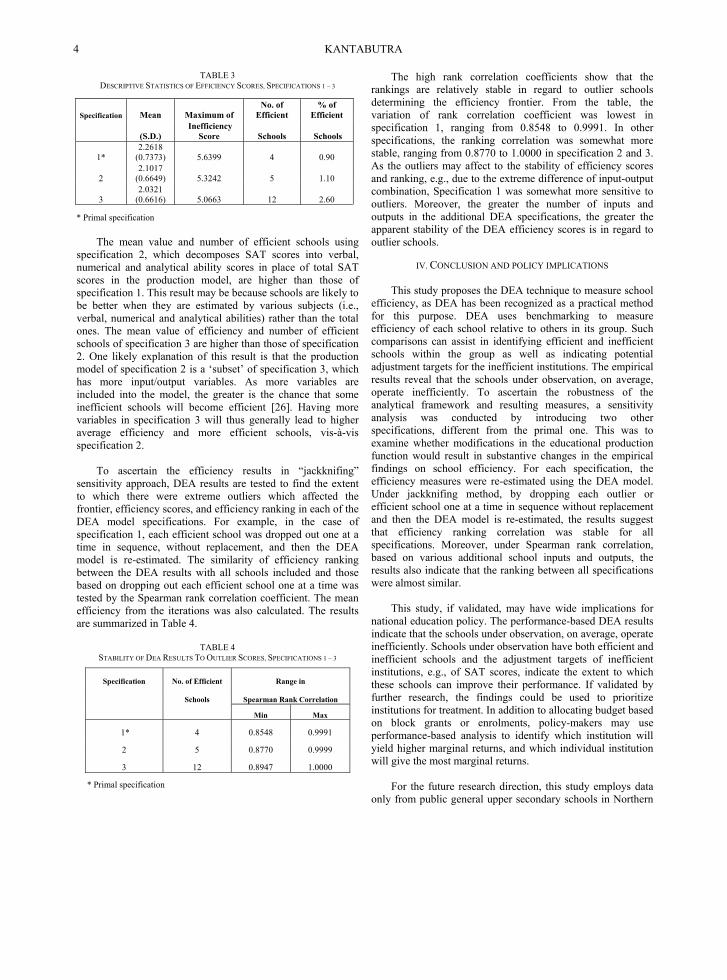
TABLE 3 DESCRIPTIVE STATISTICS OF EFFICIENCY SCORES, SPECIFICATIONS 1 – 3
Specification Mean Maximum of No. of
Efficient % of
Efficient
(S.D.) Inefficiency
Score Schools Schools
1* 2.2618
(0.7373) 5.6399 4 0.90
2 2.1017
(0.6649) 5.3242 5 1.10
3 2.0321
(0.6616) 5.0663 12 2.60
* Primal specification
The mean value and number of efficient schools using specification 2, which decomposes SAT scores into verbal, numerical and analytical ability scores in place of total SAT scores in the production model, are higher than those of specification 1. This result may be because schools are likely to be better when they are estimated by various subjects (i.e., verbal, numerical and analytical abilities) rather than the total ones. The mean value of efficiency and number of efficient schools of specification 3 are higher than those of specification 2. One likely explanation of this result is that the production model of specification 2 is a ‘subset’ of specification 3, which has more input/output variables. As more variables are included into the model, the greater is the chance that some inefficient schools will become efficient [26]. Having more variables in specification 3 will thus generally lead to higher average efficiency and more efficient schools, vis-à-vis specification 2.
To ascertain the efficiency results in “jackknifing” sensitivity approach, DEA results are tested to find the extent to which there were extreme outliers which affected the frontier, efficiency scores, and efficiency ranking in each of the DEA model specifications. For example, in the case of specification 1, each efficient school was dropped out one at a time in sequence, without replacement, and then the DEA model is re-estimated. The similarity of efficiency ranking between the DEA results with all schools included and those based on dropping out each efficient school one at a time was tested by the Spearman rank correlation coefficient. The mean efficiency from the iterations was also calculated. The results are summarized in Table 4.
TABLE 4
STABILITY OF DEA RESULTS TO OUTLIER SCORES, SPECIFICATIONS 1 – 3
Specification No. of Efficient Range in
Schools Spearman Rank Correlation
Min Max
1* 4 0.8548 0.9991
2 5 0.8770 0.9999
3 12 0.8947 1.0000
* Primal specification
The high rank correlation coefficients show that the rankings are relatively stable in regard to outlier schools determining the efficiency frontier. From the table, the variation of rank correlation coefficient was lowest in specification 1, ranging from 0.8548 to 0.9991. In other specifications, the ranking correlation was somewhat more stable, ranging from 0.8770 to 1.0000 in specification 2 and 3. As the outliers may affect to the stability of efficiency scores and ranking, e.g., due to the extreme difference of input-output combination, Specification 1 was somewhat more sensitive to outliers. Moreover, the greater the number of inputs and outputs in the additional DEA specifications, the greater the apparent stability of the DEA efficiency scores is in regard to outlier schools.
IV. CONCLUSION AND POLICY IMPLICATIONS
This study proposes the DEA technique to measure school
efficiency, as DEA has been recognized as a practical method for this purpose. DEA uses benchmarking to measure efficiency of each school relative to others in its group. Such comparisons can assist in identifying efficient and inefficient schools within the group as well as indicating potential adjustment targets for the inefficient institutions. The empirical results reveal that the schools under observation, on average, operate inefficiently. To ascertain the robustness of the analytical framework and resulting measures, a sensitivity analysis was conducted by introducing two other specifications, different from the primal one. This was to examine whether modifications in the educational production function would result in substantive changes in the empirical findings on school efficiency. For each specification, the efficiency measures were re-estimated using the DEA model. Under jackknifing method, by dropping each outlier or efficient school one at a time in sequence without replacement and then the DEA model is re-estimated, the results suggest that efficiency ranking correlation was stable for all specifications. Moreover, under Spearman rank correlation, based on various additional school inputs and outputs, the results also indicate that the ranking between all specifications were almost similar.
This study, if validated, may have wide implications for national education policy. The performance-based DEA results indicate that the schools under observation, on average, operate inefficiently. Schools under observation have both efficient and inefficient schools and the adjustment targets of inefficient institutions, e.g., of SAT scores, indicate the extent to which these schools can improve their performance. If validated by further research, the findings could be used to prioritize institutions for treatment. In addition to allocating budget based on block grants or enrolments, policy-makers may use performance-based analysis to identify which institution will yield higher marginal returns, and which individual institution will give the most marginal returns.
For the future research direction, this study employs data only from public general upper secondary schools in Northern
KANTABUTRA 4
Thailand; therefore, the principal limitation of this study is in the ability to generalize its findings to other level of educational institutions, or in other types of societies which is a limitation of studies in general. Moreover, this study assessed school performance through efficiency analysis only for a given period. Future research could focus on analyzing over a longer time or across subgroups or regions in a panel data setting. By doing so, a fuller understanding on the school efficiency analysis as well as the robustness of resulting measures on efficiency may be achieved. Further, this study uses inputs and outputs of the educational production function that may not be fully amenable to the other types of schools. Future studies might refine the inputs and outputs based on the objectives of each school type.
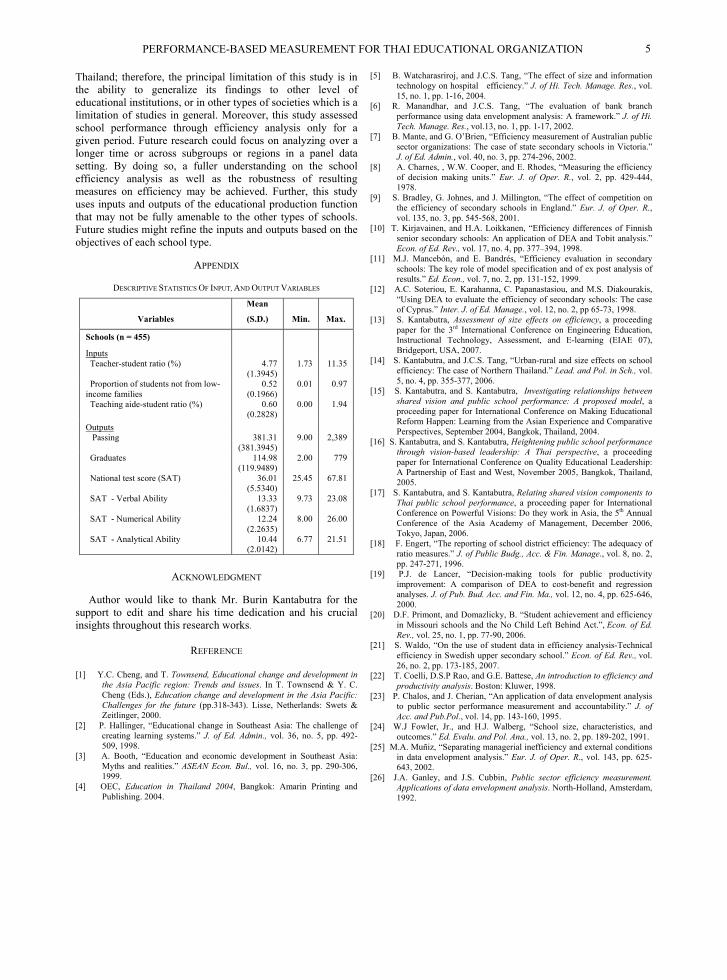
APPENDIX
DESCRIPTIVE STATISTICS OF INPUT, AND OUTPUT VARIABLES
Variables
Mean
(S.D.) Min. Max.
Schools (n = 455)
Inputs Teacher-student ratio (%)
4.77 (1.3945)
1.73
11.35
Proportion of students not from low-income families
0.52 (0.1966)
0.01
0.97
Teaching aide-student ratio (%)
0.60 (0.2828)
0.00
1.94
Outputs Passing
381.31 (381.3945)
9.00
2,389
Graduates
114.98 (119.9489)
2.00
779
National test score (SAT)
36.01 (5.5340)
25.45
67.81
SAT - Verbal Ability
13.33 (1.6837)
9.73
23.08
SAT - Numerical Ability
12.24 (2.2635)
8.00
26.00
SAT - Analytical Ability
10.44 (2.0142)
6.77
21.51
ACKNOWLEDGMENT
Author would like to thank Mr. Burin Kantabutra for the
support to edit and share his time dedication and his crucial insights throughout this research works.
REFERENCE
[1] Y.C. Cheng, and T. Townsend, Educational change and development in
the Asia Pacific region: Trends and issues. In T. Townsend & Y. C. Cheng (Eds.), Education change and development in the Asia Pacific: Challenges for the future (pp.318-343). Lisse, Netherlands: Swets & Zeitlinger, 2000.
[2] P. Hallinger, “Educational change in Southeast Asia: The challenge of creating learning systems.” J. of Ed. Admin., vol. 36, no. 5, pp. 492-509, 1998.
[3] A. Booth, “Education and economic development in Southeast Asia: Myths and realities.” ASEAN Econ. Bul., vol. 16, no. 3, pp. 290-306, 1999.
[4] OEC, Education in Thailand 2004, Bangkok: Amarin Printing and Publishing. 2004.
[5] B. Watcharasriroj, and J.C.S. Tang, “The effect of size and information technology on hospital efficiency.” J. of Hi. Tech. Manage. Res., vol. 15, no. 1, pp. 1-16, 2004.
[6] R. Manandhar, and J.C.S. Tang, “The evaluation of bank branch performance using data envelopment analysis: A framework.” J. of Hi. Tech. Manage. Res., vol.13, no. 1, pp. 1-17, 2002.
[7] B. Mante, and G. O’Brien, “Efficiency measurement of Australian public sector organizations: The case of state secondary schools in Victoria.” J. of Ed. Admin., vol. 40, no. 3, pp. 274-296, 2002.
[8] A. Charnes, , W.W. Cooper, and E. Rhodes, “Measuring the efficiency of decision making units.” Eur. J. of Oper. R., vol. 2, pp. 429-444, 1978.
[9] S. Bradley, G. Johnes, and J. Millington, “The effect of competition on the efficiency of secondary schools in England.” Eur. J. of Oper. R., vol. 135, no. 3, pp. 545-568, 2001.
[10] T. Kirjavainen, and H.A. Loikkanen, “Efficiency differences of Finnish senior secondary schools: An application of DEA and Tobit analysis.” Econ. of Ed. Rev., vol. 17, no. 4, pp. 377–394, 1998.
[11] M.J. Mancebόn, and E. Bandrés, “Efficiency evaluation in secondary schools: The key role of model specification and of ex post analysis of results.” Ed. Econ., vol. 7, no. 2, pp. 131-152, 1999.
[12] A.C. Soteriou, E. Karahanna, C. Papanastasiou, and M.S. Diakourakis, “Using DEA to evaluate the efficiency of secondary schools: The case of Cyprus.” Inter. J. of Ed. Manage., vol. 12, no. 2, pp 65-73, 1998.
[13] S. Kantabutra, Assessment of size effects on efficiency, a proceeding paper for the 3rd International Conference on Engineering Education, Instructional Technology, Assessment, and E-learning (EIAE 07), Bridgeport, USA, 2007.
[14] S. Kantabutra, and J.C.S. Tang, “Urban-rural and size effects on school efficiency: The case of Northern Thailand.” Lead. and Pol. in Sch., vol. 5, no. 4, pp. 355-377, 2006.
[15] S. Kantabutra, and S. Kantabutra, Investigating relationships between shared vision and public school performance: A proposed model, a proceeding paper for International Conference on Making Educational Reform Happen: Learning from the Asian Experience and Comparative Perspectives, September 2004, Bangkok, Thailand, 2004.
[16] S. Kantabutra, and S. Kantabutra, Heightening public school performance through vision-based leadership: A Thai perspective, a proceeding paper for International Conference on Quality Educational Leadership: A Partnership of East and West, November 2005, Bangkok, Thailand, 2005.
[17] S. Kantabutra, and S. Kantabutra, Relating shared vision components to Thai public school performance, a proceeding paper for International Conference on Powerful Visions: Do they work in Asia, the 5th Annual Conference of the Asia Academy of Management, December 2006, Tokyo, Japan, 2006.
[18] F. Engert, “The reporting of school district efficiency: The adequacy of ratio measures.” J. of Public Budg., Acc. & Fin. Manage., vol. 8, no. 2, pp. 247-271, 1996.
[19] P.J. de Lancer, “Decision-making tools for public productivity improvement: A comparison of DEA to cost-benefit and regression analyses. J. of Pub. Bud. Acc. and Fin. Ma., vol. 12, no. 4, pp. 625-646, 2000.
[20] D.F. Primont, and Domazlicky, B. “Student achievement and efficiency in Missouri schools and the No Child Left Behind Act.”, Econ. of Ed. Rev., vol. 25, no. 1, pp. 77-90, 2006.
[21] S. Waldo, “On the use of student data in efficiency analysis-Technical efficiency in Swedish upper secondary school.” Econ. of Ed. Rev., vol. 26, no. 2, pp. 173-185, 2007.
[22] T. Coelli, D.S.P Rao, and G.E. Battese, An introduction to efficiency and productivity analysis. Boston: Kluwer, 1998.
[23] P. Chalos, and J. Cherian, “An application of data envelopment analysis to public sector performance measurement and accountability.” J. of Acc. and Pub.Pol., vol. 14, pp. 143-160, 1995.
[24] W.J Fowler, Jr., and H.J. Walberg, “School size, characteristics, and outcomes.” Ed. Evalu. and Pol. Ana., vol. 13, no. 2, pp. 189-202, 1991.
[25] M.A. Mun iz, “Separating managerial inefficiency and external conditions in data envelopment analysis.” Eur. J. of Oper. R., vol. 143, pp. 625-643, 2002.
[26] J.A. Ganley, and J.S. Cubbin, Public sector efficiency measurement. Applications of data envelopment analysis. North-Holland, Amsterdam, 1992.
PERFORMANCE-BASED MEASUREMENT FOR THAI EDUCATIONAL ORGANIZATION 5
Dr.Soly Mathew Biju
College of Informatics and Computer Science University of Wollongong in Dubai,
Dubai, United Arab Emirates. [email protected]
Abstract In today’s ultra modern world the traditional face to face (F2F)teaching has been replace by e-learning or online learning .Companies find this method very effective to train their employees without using up work hours. E-learning has been implemented by many educational institutions at undergraduate and graduate level in the Gulf region. Blended learning has been adopted by many schools and universities in the Gulf. Blended learning is e-learning along with onsite support. This paper will discuss different modes of e-learning, assignment design techniques and E-learning trends in the Gulf region.
I. Introduction
There has been an increase in the number of universities and colleges implementing in E and blended learning as an integral part of instructional activities. They are trying to make best use of the technology available to promote e-learning and to motivate students to study outside the four walls of a classroom. These technological innovations have a direct impact on current university practices policies and have the potential of changing our traditional definition of education [1].E-learning can also mean extended learning that is learning outside the class room, from anywhere and at anytime. Many schools in the gulf region are adopting this innovative style of teaching. Students find it interesting compared to the traditional method of teaching. Web-based instruction is already revolutionizing how students work, think , and access information [5].Some schools are using the free
Learning Management Systems like ‘Moodle ‘ which provides all the essential features required for blended learning. Universities are also adoption tools like Blackboard.com and WebCT for online support along with the onsite teaching support. This can also be integrated with some classes being held in the second life which is 3D virtual world.
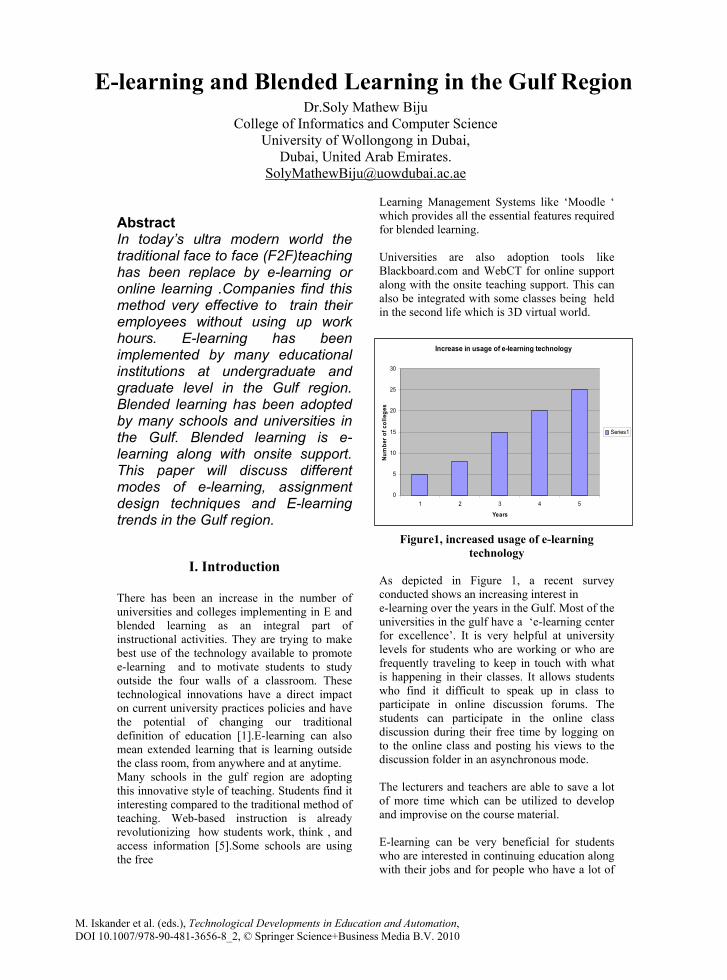
Increase in usage of e-learning technology
0
5
10
15
20
25
30
1 2 3 4 5
Years
Num
ber o
f col
lege
s
Series1
Figure1, increased usage of e-learning
technology As depicted in Figure 1, a recent survey conducted shows an increasing interest in e-learning over the years in the Gulf. Most of the universities in the gulf have a ‘e-learning center for excellence’. It is very helpful at university levels for students who are working or who are frequently traveling to keep in touch with what is happening in their classes. It allows students who find it difficult to speak up in class to participate in online discussion forums. The students can participate in the online class discussion during their free time by logging on to the online class and posting his views to the discussion folder in an asynchronous mode. The lecturers and teachers are able to save a lot of more time which can be utilized to develop and improvise on the course material. E-learning can be very beneficial for students who are interested in continuing education along with their jobs and for people who have a lot of
M. Iskander et al. (eds.), Technological Developments in Education and Automation, DOI 10.1007/978-90-481-3656-8_2, © Springer Science+Business Media B.V. 2010
E-learning and Blended Learning in the Gulf Region

experience in the field or are currently working in the same field and want to enhance their knowledge about the subject. It does not require you to be physically present at a particular location. You can login to your class anytime from anywhere .This definitely saves a lot of time and helps the student to continue working while studying which is one of the major advantages. E-learning is a boon to specially those who have difficulty in travelling to and forth to attend the classes at the university.
II. Modes of online learning A. Asynchronous mode Online learning usually has two modes one is a completely asynchronous mode and synchronous mode. In case of asynchronous mode the lectures, assignment and examination questions are uploaded and available to the students online. The students can study from the lecture notes and specified text and then attempt the quizzes and question uploaded. There is no synchronised session between the lecturer and the student. Any query by the student will be send to the lecturer’s mail id, who will then reply it within 24 hours in most of the online programs. Students used to the traditional mode of teaching may feel a little lost initially but will be able to cope up with online teaching.
B. Synchronous mode In case of synchronous mode, the students and the instructors are required to login to the class at a particular time decided in advance. The lecturer will then conduct the class using PowerPoint presentation which will be visible to the student on his screen. There are many advance softwares that support this facility. The student will be able to listen to the explanation given for each of the slide displayed .He can ask a question to the instructor by clicking on an ion provided for the same which is very similar to raising your hand in the class to ask a question. In this case you can have an experience of a virtual class room. The only drawback in this case is that the student should login to the class at a specific time given. This may be difficult and impossible for students who are constantly travelling. E-learning involves online class discussions where the students can login in their own free time and posting their opinions and views on the topic of discussion. The students are encourages to read each others suggestions and give their view about it. Data collected for this research shows that students enjoy the
discussion session the most. It motivates them to login into the class more often.
III. Just-in-Time Teaching
“One Web-based approach, Just-in-Time Teaching (JiTT), was first devised by Novak, Patterson, Gavrin , and Christian (1999) to teach problem solving in physics” [3].This can be incorporated into online teaching .The students can be given assignments after every class and based on their performance in the assignment, the next lecture could be modified to suit the requirement of the class such that the it addresses the concepts the student have not understood correctly. Universities in the Gulf region have adopted both these modes of e-learning. Many colleges in the U.A.E. prefer having a blended mode of teaching which is online teaching (asynchronous or synchronous) and onsite teaching(face to face) teaching.
IV. Designing Assignments Assignments could be multiple choice questions or essay type questions. There are number of software vendors who provide standard softwares to support e-learning needs.. WebCT provides a facility wherein it is possible to create a question bank and then select the question for multiple choices. These questions banks are also available in the market for certain courses. These could be material that is designed for certain e-learning tools. eg. In WebCT, the instructor can select the required questions from the database of questions. E-learning is not only converting text into an electronic form, it is making content more interactive and interesting with more audio and video effect.
The content design should be student centred. . From [4], a number of studies in recent years have highlighted critical aspects of learner readiness that need to be addressed. Some of these include:
1. Technology skills 2. Access to Technology 3. Technology Literacy and 4. Self-regulated learning
Points 1 to 3 can be addressed easily by the universities in the Gulf .Learning at self pace is a challenging task to achieve due to the fact that the courses are always designed for a particular period of time.
BIJU 8
Online Group Projects: It is very effective as the class can be divided into groups by the instructor and assigned different projects. Separate folder can created for each group. The student can use these folders to post their finding so that it is available to everyone within the group. They can also use the discussion forum or the chat session as a virtual meeting place. Instructor can keep a track of their participation and progress.
V. Other tools used for e-learning E-learning classes could also be designed in Second Life. Second Life is a 3-D virtual world. There are virtual colleges and universities in the second life which have virtual classrooms and labs where experiments are carried out just like in a actual class room .This is very beneficial for some online programs .One such example could be a Chemistry class where experiences can be carried out in the virtual world. All the virtual chemicals used exhibits all the properties of the actual chemical. This also gives the student to explore and experiment without fear of any dangerous accidents. There a number of organizations in the Gulf region which provide training classes for flying a plane or driving a car is also provided online. Colleges and universities are also using technologies like pod casting, wikis and blogs. Colleges, universities and schools in the Gulf are encouraging students to create e-portfolios which can then be given to potential employers. An e-portfolio can be a web-based information management system that uses electronic media and services. The learner builds and maintains a digital repository of artifacts, which they can use to demonstrate competence and reflect on their learning. Having access to their records, digital repository, feedback and reflection students can achieve a greater understanding of their individual growth, career planning and CV building. Accreditation for prior and/or extra-curricular experiences and control over access makes the e-portfolio a powerful tool [2].
Mobile learning is a complete anywhere ,anytime learning technology.As shown in the figure it can acquire data and learning material not only from the internet but also from other mediums. Due to the successful development of Bluetooth, WAP (Wireless Application
Protocol), GPRS (General Packet Radio System) and UMTS (Universal Mobile Telecommunications System), the technological structures for wireless telephony and wireless computing are now ready for use in the field of teaching. In most parts of the world wireless technologies and applications are replacing wired ones: e-Commerce is moving to m-Commerce; m-Business is replacing e-Business. The move to wireless technology in telephony and computing is irreversible.
In the education filed there has been a gradual change from traditional onsite learning to electronic learning (e-Learning) to mobile learning (m-Learning).
VI. Conclusion The is a tremendous and fast increase in the number of colleges in the Gulf adopting for e-learning .E-learning is a very effective tool to making learning a very enjoyable and interesting experience. E-learning requires smart assignment design .The latest learning tool is the m-learning or mobile learning which is portable and a truly anywhere anytime technology. Further study needs to be conducted based on the technology used and favoured the most in the Gulf.
VII. References [1]Daugherty M,Funke B.L. (1998) , ‘University Faculty and Student Perceptions of Web-Based Instruction ‘,Journal of Distance Education ,1998 vol13.1 [2]E-portfolio.Available: http://www.danwilton.com/eportfolios/whatitis.php [Accessed 9th Jan 2008] [3] Benedict ,James O.and Apple, Kevin J. ‘E-xcellence in Teaching’ PsychTeacher Electronic Discussion List July 2004. [4]Oliver R. , Assuring The Quality Of Online Learning In Australian Higher Education. Paper presented at the "Moving Online Conference II" 2-4 September, Southern Cross University, GoldCoast ,Australia, Available: http://www.scu.edu.au/schools/sawd/moconf/MOC2_papers.html [Accessed 9th June 2007] [5] Peck, K. L. and D. Dorricott, "Why Use Technology?" Educational Leadership, Vol. 51, No. 7, April 1994,pp. 11–14;
E-LEARNING AND BLENDED LEARNING IN THE GULF REGION 9
Patrick SeelingDepartment of Computing and New Media Technologies
University of Wisconsin – Stevens PointStevens Point, Wisconsin 54481-3871
Email: [email protected]
Abstract—In this paper, we present a scene change or shotboundary detection method based in the changes in entropyof differences between uncompressed video frames. As in theuncompressed domain, cues for scene or shot boundaries arenot available, detecting video content features is a non-trivialand typically requires additional complexity in the evaluation.The entropy presents a metric for the complexity of information.Used on the differences between video frames, the entropy isable to measure the complexity of changes. We find that due tocontent dependency, however, the relative entropy changes in thesequence of video frames is a better indicator for detection.
An evaluation of the presented approach finds that detectionfor a combination of video test sequences can be reliablyperformed using the U component of uncompressed YUV 4:2:2video only.
I. INTRODUCTION AND RELATED WORK
The domain of video annotation, indexing, and retrieval hasattracted a large body of research in the past. One of themain drivers for this area of research is the readily availablecomputing power in normal desktop computers, digital videoequipment, and motivation to share content over the Internetin various forms of access models, i.e., sharing via web pages,live streaming, and so on. It is expected that the amount ofdigital video that is available will continue to grow. Withthis vast amount of data available, annotation and logicalindexing of video becomes a desired feature. One standard forthe annotation of multimedia data is MPEG-7, see, e.g., [1].Amongst different approaches to annotation, segmenting thevideo into its scenes or shots is the most intuitive and basic.Several different approaches exist to detect shot boundaries invideo, see, e.g., [2], [3] for an extensive overview of differentalgorithms and their classifications.
Reliable and universal detection of scene changes or shotboundaries in the uncompressed domain in a fast manner,however, is still a challenge. While in the compressed videodomain, typically cues can be obtained that are readily avail-able from the encoded video stream (e.g., motion vectorintensity or transform coefficients), these cues are not availablein the uncompressed domain. To alleviate this problem, theauthors in [4] employ a two-stage histogram-based methodto determine scene changes and filter out unwanted falsedetections. More sophisticated approaches have to implementadditional methods, such as edge detection, see, e.g., [5]. Othervenues of research employ neural networks to determine scenechanges based on several pixel- and color-based features ofuncompressed video, see, e.g., [6]. In [7], the authors apply
fuzzy logic approaches to detect scenes. Recently, the authorsof [8] employed an autoregressive model based on the colorhistogram in the uncompressed domain to determine scenechanges.
In the following, we present a scene detection algorithm thatis solely based on the entropy of differences between frames.The motivation for using this approach is that with changesbetween frames, the entropy of the differences will increase.We evaluate the algorithm against a short video test sequenceand a Combined video sequence, which is derived frommultiple test sequences. We present the performance metricsprecision and recall obtained with the proposed algorithmbefore we conclude.
II. ENTROPY OF FRAME DIFFERENCES
The scene boundary detection method introduced in thefollowing is applied on uncompressed video frames using theYUV 4:2:2 format. This format is typically used for videocoding and transcoding for a variety of video codecs. TheYUV format describes each individual pixel by its luminance(Y) and two color differences (U) and (V), also known aschrominance components.
We denote the i-th byte in the n-th frame out of n =0, 1, . . . , N frames as Fn(i). Furthermore, let Yn(iY ) denotethe luminance byte values and Un(iUV ), Vn(iUV ) denotethe i-th byte values for the two chrominance components.Note that due to the chroma sub-sampling, 0 ≤ iUV ≤ iY
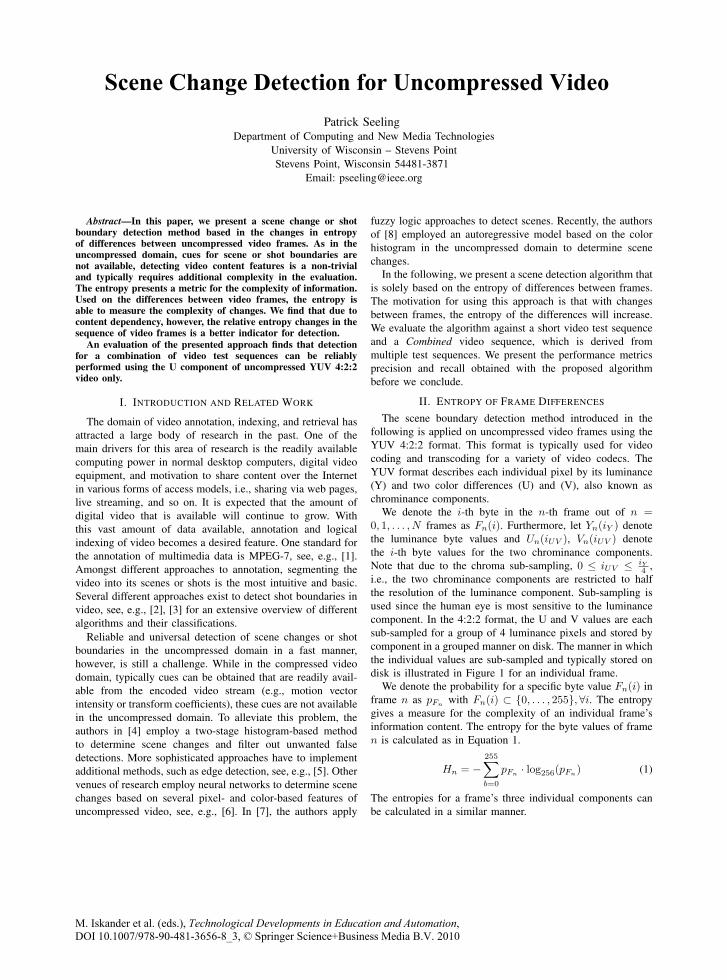
4 ,i.e., the two chrominance components are restricted to halfthe resolution of the luminance component. Sub-sampling isused since the human eye is most sensitive to the luminancecomponent. In the 4:2:2 format, the U and V values are eachsub-sampled for a group of 4 luminance pixels and stored bycomponent in a grouped manner on disk. The manner in whichthe individual values are sub-sampled and typically stored ondisk is illustrated in Figure 1 for an individual frame.
We denote the probability for a specific byte value Fn(i) inframe n as pFn with Fn(i) ⊂ {0, . . . , 255},∀i. The entropygives a measure for the complexity of an individual frame’sinformation content. The entropy for the byte values of framen is calculated as in Equation 1.
Hn = −255∑
b=0
pFn · log256(pFn) (1)
The entropies for a frame’s three individual components canbe calculated in a similar manner.
M. Iskander et al. (eds.), Technological Developments in Education and Automation, DOI 10.1007/978-90-481-3656-8_3, © Springer Science+Business Media B.V. 2010
Scene Change Detection for Uncompressed Video
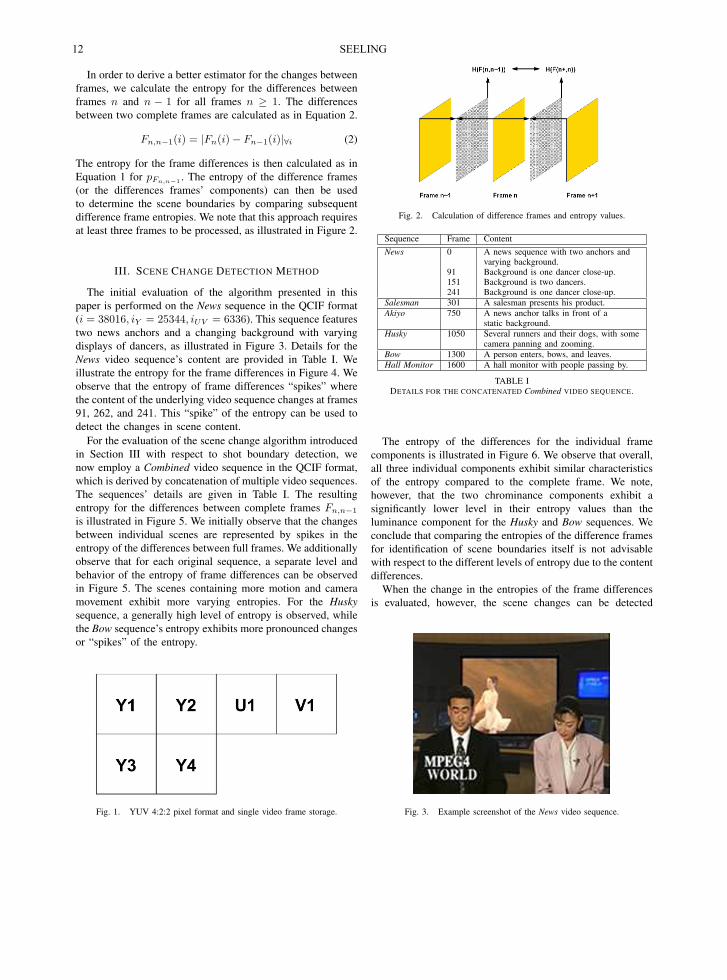
In order to derive a better estimator for the changes betweenframes, we calculate the entropy for the differences betweenframes n and n − 1 for all frames n ≥ 1. The differencesbetween two complete frames are calculated as in Equation 2.
Fn,n−1(i) = |Fn(i)− Fn−1(i)|∀i (2)
The entropy for the frame differences is then calculated as inEquation 1 for pFn,n−1 . The entropy of the difference frames(or the differences frames’ components) can then be usedto determine the scene boundaries by comparing subsequentdifference frame entropies. We note that this approach requiresat least three frames to be processed, as illustrated in Figure 2.
III. SCENE CHANGE DETECTION METHOD
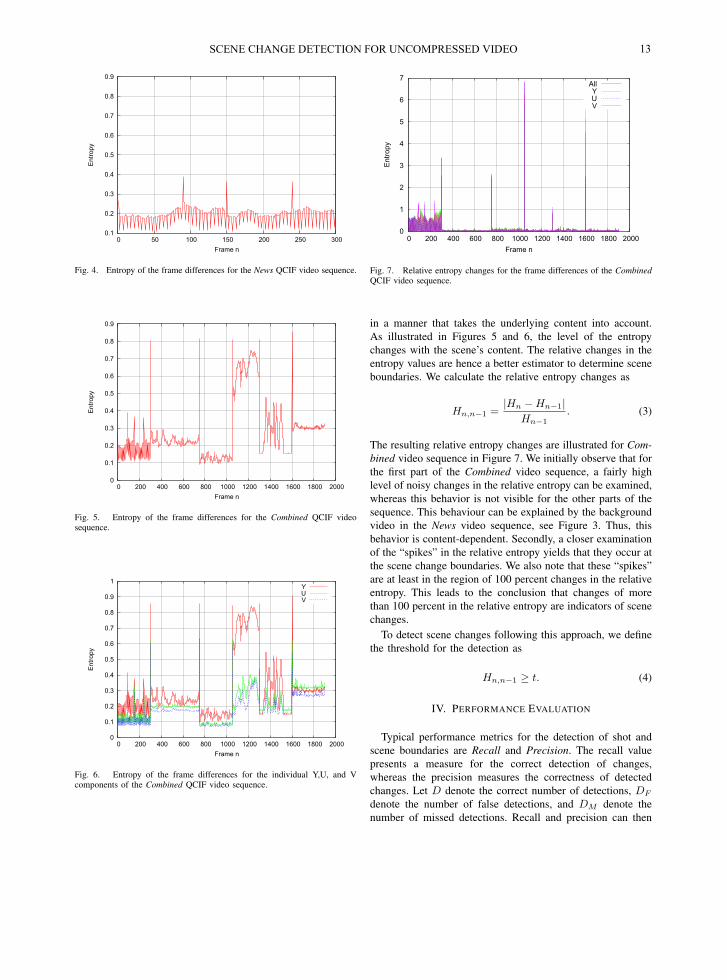
The initial evaluation of the algorithm presented in thispaper is performed on the News sequence in the QCIF format(i = 38016, iY = 25344, iUV = 6336). This sequence featurestwo news anchors and a changing background with varyingdisplays of dancers, as illustrated in Figure 3. Details for theNews video sequence’s content are provided in Table I. Weillustrate the entropy for the frame differences in Figure 4. Weobserve that the entropy of frame differences “spikes” wherethe content of the underlying video sequence changes at frames91, 262, and 241. This “spike” of the entropy can be used todetect the changes in scene content.
For the evaluation of the scene change algorithm introducedin Section III with respect to shot boundary detection, wenow employ a Combined video sequence in the QCIF format,which is derived by concatenation of multiple video sequences.The sequences’ details are given in Table I. The resultingentropy for the differences between complete frames Fn,n−1
is illustrated in Figure 5. We initially observe that the changesbetween individual scenes are represented by spikes in theentropy of the differences between full frames. We additionallyobserve that for each original sequence, a separate level andbehavior of the entropy of frame differences can be observedin Figure 5. The scenes containing more motion and cameramovement exhibit more varying entropies. For the Huskysequence, a generally high level of entropy is observed, whilethe Bow sequence’s entropy exhibits more pronounced changesor “spikes” of the entropy.
Fig. 1. YUV 4:2:2 pixel format and single video frame storage.
Fig. 2. Calculation of difference frames and entropy values.
Sequence Frame ContentNews 0 A news sequence with two anchors and
varying background.91 Background is one dancer close-up.151 Background is two dancers.241 Background is one dancer close-up.
Salesman 301 A salesman presents his product.Akiyo 750 A news anchor talks in front of a
static background.Husky 1050 Several runners and their dogs, with some
camera panning and zooming.Bow 1300 A person enters, bows, and leaves.Hall Monitor 1600 A hall monitor with people passing by.
TABLE IDETAILS FOR THE CONCATENATED Combined VIDEO SEQUENCE.
The entropy of the differences for the individual framecomponents is illustrated in Figure 6. We observe that overall,all three individual components exhibit similar characteristicsof the entropy compared to the complete frame. We note,however, that the two chrominance components exhibit asignificantly lower level in their entropy values than theluminance component for the Husky and Bow sequences. Weconclude that comparing the entropies of the difference framesfor identification of scene boundaries itself is not advisablewith respect to the different levels of entropy due to the contentdifferences.
When the change in the entropies of the frame differencesis evaluated, however, the scene changes can be detected
Fig. 3. Example screenshot of the News video sequence.
SEELING 12
0.1
0.2
0.3
0.4
0.5
0.6
0.7
0.8
0.9
0 50 100 150 200 250 300
Ent
ropy
Frame n
Fig. 4. Entropy of the frame differences for the News QCIF video sequence.
0
0.1
0.2
0.3
0.4
0.5
0.6
0.7
0.8
0.9
0 200 400 600 800 1000 1200 1400 1600 1800 2000
Ent
ropy
Frame n
Fig. 5. Entropy of the frame differences for the Combined QCIF videosequence.
0
0.1
0.2
0.3
0.4
0.5
0.6
0.7
0.8
0.9
1
0 200 400 600 800 1000 1200 1400 1600 1800 2000
Ent
ropy
Frame n
YUV
Fig. 6. Entropy of the frame differences for the individual Y,U, and Vcomponents of the Combined QCIF video sequence.
0
1
2
3
4
5
6
7
0 200 400 600 800 1000 1200 1400 1600 1800 2000
Ent
ropy
Frame n
AllYUV
Fig. 7. Relative entropy changes for the frame differences of the CombinedQCIF video sequence.
in a manner that takes the underlying content into account.
As illustrated in Figures 5 and 6, the level of the entropy
changes with the scene’s content. The relative changes in the
entropy values are hence a better estimator to determine scene
boundaries. We calculate the relative entropy changes as
Hn,n−1 =|Hn − Hn−1|
Hn−1. (3)
The resulting relative entropy changes are illustrated for Com-bined video sequence in Figure 7. We initially observe that for
the first part of the Combined video sequence, a fairly high
level of noisy changes in the relative entropy can be examined,
whereas this behavior is not visible for the other parts of the
sequence. This behaviour can be explained by the background
video in the News video sequence, see Figure 3. Thus, this
behavior is content-dependent. Secondly, a closer examination
of the “spikes” in the relative entropy yields that they occur at
the scene change boundaries. We also note that these “spikes”
are at least in the region of 100 percent changes in the relative
entropy. This leads to the conclusion that changes of more
than 100 percent in the relative entropy are indicators of scene
changes.
To detect scene changes following this approach, we define
the threshold for the detection as
Hn,n−1 ≥ t. (4)
IV. PERFORMANCE EVALUATION
Typical performance metrics for the detection of shot and
scene boundaries are Recall and Precision. The recall value
presents a measure for the correct detection of changes,
whereas the precision measures the correctness of detected
changes. Let D denote the correct number of detections, DF
denote the number of false detections, and DM denote the
number of missed detections. Recall and precision can then
SCENE CHANGE DETECTION FOR UNCOMPRESSED VIDEO 13

TABLE IIPRECISION AND RECALL VALUES FOR DIFFERENT THRESHOLDS FOR THE
Combined VIDEO SEQUENCE.
Thres. All Y U Vt Prec. Rec. Prec. Rec. Prec. Rec. Prec. Rec.
1 1 0.5 1 0.875 1 1 1 0.8751.1 1 0.5 1 0.875 1 1 1 0.8751.25 1 0.5 1 0.75 1 0.75 1 0.751.5 1 0.5 1 0.5 1 0.5 1 0.52 1 0.5 1 0.5 1 0.5 1 0.5
be calculated as
Recall =D
D + DM(5)
Precision =D
D + DF(6)
For the review of the proposed method on the Combined videosequence, we provide the values for precision and recall inTable IV for different thresholds t of the relative entropy.We observe that precision for the entropy of the completeframe differences is high for all components combined andindividually. We furthermore note that there is no impactof different threshold levels on the precision. For the recallvalues, on the other hand, we observe a low value for thecomplete frame’s entropy and slightly higher values for theY and V components. Overall, only the U component yieldscomplete detection of all scene changes with a threshold levelclose to 1.
An additional observation from this characteristic is the timerequired to parse the complete video, especially if resolutionsabove QCIF are considered. As the U component’s size inbytes is only 1
6 of the complete video frame’s size, the scenedetection speed can be greatly increased.
V. CONCLUSION AND OUTLOOK
In this paper, we presented a method to detect scenechanges or shots based on the relative changes in the entropy
of difference frames in the uncompressed domain. As thedifferences between frames increase, the entropy will increaseas well. However, due to content dependency of the level andbehavior of the entropy, we use the relative changes in theentropy of differences between frames for detection. We foundthat based on the performance metrics precision and recall, thefasted and most reliable approach to detect scene changes orshots is to calculate the relative entropy differences for the Ucomponent only.
Future research venues will include evaluation of the de-tection method presented herein for a larger variety of videocontent and additional refinements to detect additional changesin the underlying video based on the entropy of the framedifferences.
REFERENCES
[1] P. Salembier and J. Smith, “Mpeg-7 multimedia description schemes,”IEEE Transactions on Circuits and Systems for Video Technology, vol. 11,no. 6, pp. 748–759, Jun. 2001.
[2] R. Lienhardt, “Reliable transition detection in videos: A survey andpractitioner’s guide,” International Journal of Image and Graphics (IJIG),vol. 1, no. 3, pp. 469–486, 2001.
[3] C. Cotsaces, N. Nikolaidis, and I. Pitas, “Video shot detection andcondensed representation,” IEEE Signal Processing Magazine, vol. 23,no. 2, pp. 28–37, Mar. 2006.
[4] X. Yi and N. Ling, “Fast pixel-based video scene change detection,”in Proc. of the IEEE International Symposium on Circuits and Systems(ISCAS), vol. 4, Kobe, Japan, May 2005, pp. 3443–3446.
[5] R. Zabih, J. Miller, and K. Mai, “A feature-based algorithm for detectingand classification of production effects,” ACM Multimedia Systems, vol. 7,no. 1, pp. 119–128, Jan. 1999.
[6] M.-H. Leea, H.-W. Yoob, and D.-S. Jang, “Video scene change detectionusing neural network: Improved art2,” Expert Systems with Applications,vol. 31, no. 1, pp. 13–25, Jul. 2006.
[7] H. Fanga, J. Jiang, and Y. Feng, “A fuzzy logic approach for detection ofvideo shot boundaries,” Pattern Recognition, vol. 39, no. 11, pp. 2092–2100, Nov. 2006.
[8] W. Chen and Y.-J. Zhang, “Parametric model for video content analysis,”Pattern Recognition Letters, vol. 29, no. 3, pp. 181–191, Feb. 2008.
SEELING 14

Qingshan Shan1, I A Glover1, P J Moore2, I E Portugues2, R Rutherford4, R Atkinson3, Shahzad Bhatti1, R J Watson5
1Centre for Excellence in Signal & image Processing, 2Institute for Energy & Environment
3Centre for Intelligent Dynamic Communications Department of Electronic & Electrical Engineering, University of Strathclyde, 204 George Street, Glasgow G1 1XW, UK,
[email protected] 4Scottish Power – Energy, Networks & Telecommunications, 1 Atlantic Quay, Glasgow G2 8SP, UK
5Department of Electronic & Electrical Engineering, University of Bath, Claverton Down, Bath BA2 7AY, UK
Abstract-An experimental assessment of the impact of the
electromagnetic environment of a 400 kV substation on the performance of ZigBee equipment is described. The experimental assessment includes a pragmatic field trial and a laboratory test. The laboratory test, in which all external noise and interference are excluded, is used as a control. A simple set of metrics are used to compare the performance of ZigBee equipment deployed in the substation with that deployed in a controlled laboratory environment. The results based on more than 1.6 Gbit of transmitted data show no significant adverse impact of the substation electromagnetic environment on the performance of ZigBee equipment.
Keywords: ZigBee, partial discharge, power substation,
IEEE 802.15.4.
I. INTRODUCTION
The infrastructure investment in a national power transmission system is colossal. It is therefore necessary to operate such systems as efficiently as possible, consistent with maintaining acceptable security of supply. Efficient and reliable operation demands continuous monitoring of the system state resulting in instrumentation and control equipment being widely scattered throughout substation compounds. Information and control signals for both normal and abnormal operation are traditionally connected, using cables or optical fibres, to a SCADA (Supervision, Control and Data Acquisition) system [1] and/or its successor UCA (Utilities Communication Architecture) system [2]. Ethernet local area network (LAN) implementations of such UCA/SCADA systems, which simplify the addition/reconfiguration of instrumentation and the coordination of protection systems, have been proposed and are already being evaluated [3].
Significant flexibility and cost advantages over a wired LAN infrastructure would be gained, however, if signals could be routed around electricity substation compounds wirelessly. Furthermore, wireless communication technologies hold out the prospect of ‘hot-line’, sensors that can be deployed on energized high-voltage (HV) equipment without the inconvenience and costs associated with bridging the system’s
primary insulation [4, 5]. WLAN and WPAN technologies represent obvious opportunities to realize these advantages.
The casual deployment of wireless technologies for critical functions is not, however, without risk. Whilst the naturally occurring noise environment is relatively benign at WLAN and WPAN frequencies [6] the man-made noise environment within a substation compound is complex and hostile due, for example, to PD from imperfect insulation and sferic radiation from switching and fault transients. (The term sferic usually relates to radiation from a lightening event but is used here as a shorthand for similar radiation arising from any large current transient.) The latter is of particular concern since it is on just such occasions that control and protection equipment is required to operate reliably. It is possibly for this reason that UCA demonstration systems have until now employed a ‘wired’ (often fibre) transmission medium e.g. [7].
An investigation into the vulnerability of WLAN and WPAN technologies to impulsive noise in electricity transmission substations has been proposed [8]. One of the project objectives requires an assessment of ZigBee technology in impulsive noise environments and its suitability for deployment in HV substations. As part of this assessment a laboratory test and field trial of ZigBee equipment have been carried out.
The field trial comprises a deployment of ZigBee equipment in a 400 kV electricity supply substation. The laboratory test replaces the antennas and radio path between Zigbee transceivers with high-quality coaxial cable and appropriate microwave attenuators.
This paper describes partial discharge as observed in electricity supply substations, briefly reviews the relevant aspects of ZigBee technology, and presents the results of both laboratory test and field trial.
II. PD IN SUBSTATIONS
An electrical discharge is partial if it fails to fully bridge the space between a pair of electrodes. It can occur around an electrode in a gas (corona), within gas bubbles in a liquid or within the space created by voids in a solid. HV plant (transformers, switchgear, cables etc) is especially prone to PD
M. Iskander et al. (eds.), Technological Developments in Education and Automation, DOI 10.1007/978-90-481-3656-8_4, © Springer Science+Business Media B.V. 2010
ZigBee Performance in 400 KV Air Insulated Power Substation

if its insulation is damaged and/or as its insulation ages. If remedial action is not taken the insulation can be seriously compromised leading, ultimately, to catastrophic failure. PD current pulses in strong insulators (e.g. SF6) can have rise-times as short as 50 ps and may contain significant energy at frequencies up to 3 GHz [9]. Such impulsive signals can give rise to electromagnetic resonances within the conducting enclosures in which they occur.
PD propagation within a Gas Insulated Substation (GIS) is by a combination of transverse electric (TE), transverse magnetic (TM) and transverse electromagnetic (TEM) modes [10]. Laboratory tests have suggested that two principal mechanisms are responsible for PD signal damping. These are reflections due to characteristic impedance discontinuities (such as is caused by spacers) and energy conversion from TEM to TE or TM modes [11]. Although the character of PD appears to have some dependence on the size and geometry of plant components (e.g. insulating spacers, L-shaped buses, T-branch buses) damping typically appears to become significant somewhere between 100 MHz and 300 MHz and increases with increasing frequency above this [12]. PD energy in the frequency range 0.5 - 1.2 GHz, however, is readily radiated from apertures formed, for example, by insulating spacers or bushings [13].
Energy from PD processes can be radiated whenever spectral components arising from current pulse edges extend into the radio frequency (RF) region [14]. Signals radiated from open-air substations are typically stronger than those from underground substations due, in the latter case, to an enclosing metallic tank located in a steel-reinforced concrete building [15].
III. ZIGBEE
ZigBee is a specification of a network and security services application layer technology developed by the ZigBee Alliance and based on the IEEE 802.15.4 standard. It is a low-cost, low-power, two-way wireless communications technology. It is primarily intended for domestic and commercial applications e.g. home and building automation, PC peripherals, toys and games but also finds application in other contexts, e.g. medical sensors and industrial control [16]. The IEEE 802.15.4 standard addresses the physical (PHY) and media access control (MAC) layers and defines a 250 kbit/s, 32-chip, direct sequence spread spectrum (DSSS), offset quadrature phase shift keying (OQPSK) radio signal operating in the 2.4 GHz unlicensed Industrial, Scientific and Medical (ISM) band. Alternatives bands exist around 868 MHz and 915 MHz. From a total of 27 frequency channels, one lies in the 868 MHz band, ten in the 915 MHz band and 16 in the 2.4 GHz band. In addition to providing link-layer security including access control, confidentiality, message integrity and optional message freshness, it employs network- and application-layer security services, a 128-bit link key to secure pair-wise communications and a 128-bit network key to secure broadcast communications [17]. A commercial system-on-chip
implementation of a 2.4 GHz IEEE 802.15.4 compliant transceiver is already available [18, 19].
Previous work on the impact of interference on ZigBee systems has concentrated on the coexistence of this technology with similar technologies, especially WLAN and other WPAN transceivers. ZigBee has been shown to be potentially vulnerable to IEEE 802.11b (WiFi) and IEEE 802.15.1 (Bluetooth) transmissions. An analytical model suggests, however, that the IEEE 802.15.4 network should have little effect on the performance of IEEE 802.11b networks [20]. It has been concluded, from practical measurements, that IEEE 802.15.4 transmissions produce no significant impairments on the operation of IEEE 802.11 equipment, but that the converse is not necessarily true, i.e. IEEE 802.11 transmissions might degrade the performance of an IEEE 802.15.4 network [21]. The measurements reported appear to show that interference from IEEE 802.11b transmissions does not significantly impact IEEE 802.15.4 performance providing a physical separation of at least 8 m is maintained [22]. (References [21] and [22] suggest that a frequency offset of at least 7 MHz in operational frequencies is required for a satisfactory IEEE 802.15.4 performance.)
The authors are not aware of any similar work to establish the interfering effects on ZigBee transceivers of impulsive noise of PD origin as found in electricity supply substations. The practical field trial and laboratory test described in section 4 address this.
IV. FIELD TRIAL AND LABORATORY TEST
The field trial was carried out at Strathaven 400 kV Air Insulated Substation (AIS). The trial assesses the performance of ZigBee in this challenging electromagnetic environment. The laboratory test was carried out in the Geoffrey Smith Intelligent Dynamic Communications Laboratory at the University of Strathclyde. The laboratory test represents a control, i.e. a test which replicates that of the field trial but excludes all external noise and interference. The methodologies are described below.
A. Field Trial The field trial system consists of two terminals, one a data
source and the other a data sink, as shown in Figure 1. The data source and data sink terminals comprise a ZigBee module interfaced to a laptop computer. The ZigBee modules are based on the Ember EM250 ZigBeeTM/IEEE802.15.4 chip. The RF
Fig.1. Field trial system
SHAN ET AL.
ZigBee ModuleData source
ZigBee ModuleData sink
Laptop Laptop
Seria
l Por
t
Seria
l Por
t
16
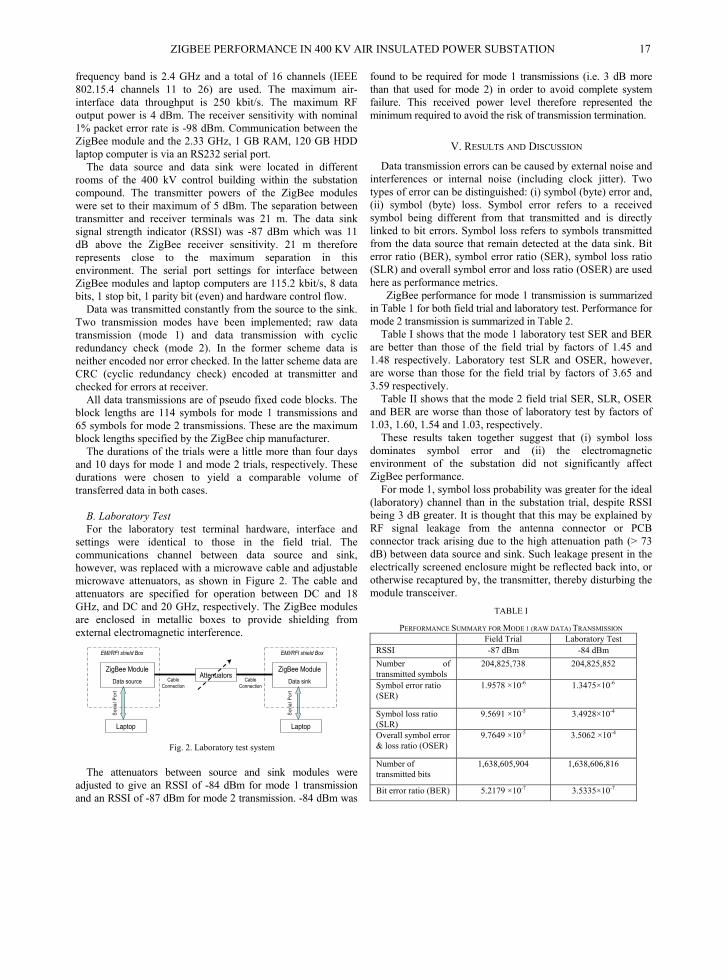
frequency band is 2.4 GHz and a total of 16 channels (IEEE 802.15.4 channels 11 to 26) are used. The maximum air-interface data throughput is 250 kbit/s. The maximum RF output power is 4 dBm. The receiver sensitivity with nominal 1% packet error rate is -98 dBm. Communication between the ZigBee module and the 2.33 GHz, 1 GB RAM, 120 GB HDD laptop computer is via an RS232 serial port.
The data source and data sink were located in different rooms of the 400 kV control building within the substation compound. The transmitter powers of the ZigBee modules were set to their maximum of 5 dBm. The separation between transmitter and receiver terminals was 21 m. The data sink signal strength indicator (RSSI) was -87 dBm which was 11 dB above the ZigBee receiver sensitivity. 21 m therefore represents close to the maximum separation in this environment. The serial port settings for interface between ZigBee modules and laptop computers are 115.2 kbit/s, 8 data bits, 1 stop bit, 1 parity bit (even) and hardware control flow.
Data was transmitted constantly from the source to the sink. Two transmission modes have been implemented; raw data transmission (mode 1) and data transmission with cyclic redundancy check (mode 2). In the former scheme data is neither encoded nor error checked. In the latter scheme data are CRC (cyclic redundancy check) encoded at transmitter and checked for errors at receiver.
All data transmissions are of pseudo fixed code blocks. The block lengths are 114 symbols for mode 1 transmissions and 65 symbols for mode 2 transmissions. These are the maximum block lengths specified by the ZigBee chip manufacturer.
The durations of the trials were a little more than four days and 10 days for mode 1 and mode 2 trials, respectively. These durations were chosen to yield a comparable volume of transferred data in both cases.
B. Laboratory Test For the laboratory test terminal hardware, interface and
settings were identical to those in the field trial. The communications channel between data source and sink, however, was replaced with a microwave cable and adjustable microwave attenuators, as shown in Figure 2. The cable and attenuators are specified for operation between DC and 18 GHz, and DC and 20 GHz, respectively. The ZigBee modules are enclosed in metallic boxes to provide shielding from external electromagnetic interference.
Fig. 2. Laboratory test system The attenuators between source and sink modules were
adjusted to give an RSSI of -84 dBm for mode 1 transmission and an RSSI of -87 dBm for mode 2 transmission. -84 dBm was
found to be required for mode 1 transmissions (i.e. 3 dB more than that used for mode 2) in order to avoid complete system failure. This received power level therefore represented the minimum required to avoid the risk of transmission termination.
V. RESULTS AND DISCUSSION
Data transmission errors can be caused by external noise and interferences or internal noise (including clock jitter). Two types of error can be distinguished: (i) symbol (byte) error and, (ii) symbol (byte) loss. Symbol error refers to a received symbol being different from that transmitted and is directly linked to bit errors. Symbol loss refers to symbols transmitted from the data source that remain detected at the data sink. Bit error ratio (BER), symbol error ratio (SER), symbol loss ratio (SLR) and overall symbol error and loss ratio (OSER) are used here as performance metrics.
ZigBee performance for mode 1 transmission is summarized in Table 1 for both field trial and laboratory test. Performance for mode 2 transmission is summarized in Table 2.
Table I shows that the mode 1 laboratory test SER and BER are better than those of the field trial by factors of 1.45 and 1.48 respectively. Laboratory test SLR and OSER, however, are worse than those for the field trial by factors of 3.65 and 3.59 respectively.
Table II shows that the mode 2 field trial SER, SLR, OSER and BER are worse than those of laboratory test by factors of 1.03, 1.60, 1.54 and 1.03, respectively.
These results taken together suggest that (i) symbol loss dominates symbol error and (ii) the electromagnetic environment of the substation did not significantly affect ZigBee performance.
For mode 1, symbol loss probability was greater for the ideal (laboratory) channel than in the substation trial, despite RSSI being 3 dB greater. It is thought that this may be explained by RF signal leakage from the antenna connector or PCB connector track arising due to the high attenuation path (> 73 dB) between data source and sink. Such leakage present in the electrically screened enclosure might be reflected back into, or otherwise recaptured by, the transmitter, thereby disturbing the module transceiver.
TABLE I
PERFORMANCE SUMMARY FOR MODE 1 (RAW DATA) TRANSMISSION Field Trial Laboratory Test RSSI -87 dBm -84 dBm Number of transmitted symbols
204,825,738 204,825,852
Symbol error ratio (SER)
1.9578 ×10⁻⁶ 1.3475×10⁻⁶
Symbol loss ratio (SLR)
9.5691 ×10⁻⁵ 3.4928×10⁻⁴
Overall symbol error & loss ratio (OSER)
9.7649 ×10⁻⁵ 3.5062 ×10⁻⁴
Number of transmitted bits
1,638,605,904 1,638,606,816
Bit error ratio (BER) 5.2179 ×10⁻⁷ 3.5335×10⁻⁷
ZigBee ModuleData source
ZigBee ModuleData sink
Laptop Laptop
Seria
l Por
t
Seria
l Por
t
AttenuatorsCable
ConnectionCable
Connection
EMI/RFI shield Box EMI/RFI shield Box
ZIGBEE PERFORMANCE IN 400 KV AIR INSULATED POWER SUBSTATION 17

TABLE II
PERFORMANCE SUMMARY FOR MODE 2 (CRC PROTECTED) TRANSMISSION
Field trials Laboratory Test RSSI -87 dBm -87 dBm Number of transmitted symbols
230,806,745 230,806,810
Symbol error ratio (SER)
2.7945 ×10⁻⁶ 2.7036 ×10⁻⁶
Symbol loss ratio (SLR)
3.446 ×10⁻⁵ 2.1516 ×10⁻⁵
Overall symbol error & loss ratio (OSER)
3.7252 ×10⁻⁵ 2.4219 ×10⁻⁵
Number of transmitted bits
1,846,453,960 1,846,454,480
Bit error ratio (BER) 7.4196 ×10⁻⁷ 7.1813 ×10⁻⁷
VI. CONCLUSION
A field trial to determine the practical performance of ZigBee technology operating in the severe electromagnetic environment of a 400 kV electricity supply substation has been described. A laboratory test which excludes all external noise and interference and which has been conducted as a control has also been reported. The results of trial and test suggest that there was no significant adverse impact on the performance of ZigBee technology by the electromagnetic environment (including partial discharge) of the substation.
ACKNOWLEDGMENT
The UK Engineering & Physical Sciences Research Council (EPSRC) is gratefully acknowledged for her financial support of this project.
REFERENCES
[1] IEEE," Definition, Specification, and Analysis of Systems Used for Supervisory Control, Data Acquisition, and Automatic Control," in IEEE Standard C37.1, 1994.
[2] IEC " Communications Networks and Systems in Substations-Part1: Introduction and overview," in IEC Standard 61850-1, 2003.
[3] R. Ehlers, "Using UCA to integrate and deliver diagnostic data from substation," in 12th substation equipment diagnostics conference New Orleans, USA, 2004.
[4] H. Sedding, S. Bomben, S. Rizzeto, and R. Densley, "Assessment of station cable condition using wireless telemetry and diagnostic tests," in 2001 EEIC conference, 2001.
[5] P. Duggan, P. DilLilo, P. DiScala, R. Schwabe, J. Braun, N. Fujimoto, and S. Rizzetto, "Field experience with live wireless telemetry sensors on power equipment operating to 345kV," in 12th substation equipment diagnostics conference New Orleans, USA, 2004.
[6] "Radio noise," in ITU-R Recommendation, 2003, pp. 372-378.
[7] B. Smith, C. McClure, and R. Ehlers, "Integrating UCA at the TVA/Tiptonville switching station for SCADA and relay protection applications," in 12th substation equipment diagnostics conference New Orleans, USA, 2004.
[8] I. A. Glover, Q. Shan, P. J. Mooore, I. E. Portugues, and R. J. Watson "An investigation into the vulnerability of WLAN and WPAN technologies to impulsive noise in electricity transmission substations," in Ninth International Symposium on Communication Theory and Applications ISCTA'07, Ambleside, Lake District, UK, 2007.
[9] M. D. Judd, O. Farish, J. S. Pearson, and B. F. Hampton, "Dielectric
windows for UHF partial discharge detection," Dielectrics and Electrical Insulation, IEEE Transactions on [see also Electrical Insulation, IEEE Transactions on], vol. 8, pp. 953-958, 2001.
[10] C. Chang, C. S. Chang, J. Jin, T. Hoshino, M. Hanai, and N. Kobayashi, "Source classification of partial discharge for gas insulated substation using waveshape pattern recognition," Dielectrics and Electrical Insulation, IEEE Transactions on [see also Electrical Insulation, IEEE Transactions on], vol. 12, pp. 374-386, 2005.
[11] H. Imagawa, K. Emoto, H. Murase, H. Koyama, R. Tsuge, S. Maruyama, and T. Sakakibara, "PD signal propagation characteristics in GIS and its location system by frequency components comparison," Power Delivery, IEEE Transactions on, vol. 16, pp. 564-570, 2001.
[12] T. Sakakibara, H. Murase, E. Haginomori, S. Wakabayashi, K. Emoto, and A. Ogawa, "Study of propagation phenomena of partial discharge pulses in gas insulated substation," Power Delivery, IEEE Transactions on, vol. 13, pp. 768-776, 1998.
[13] T. Hoshino, K. Kato, N. Hayakawa, and H. Okuno, "Frequency characteristics of electromagnetic wave radiated from GIS apertures," Power Delivery, IEEE Transactions on, vol. 16, pp. 552-557, 2001.
[14] P. J. Moore, I. E. Portugues, and I. A. Glover, "Radiometric location of partial discharge sources on energized high-Voltage plant," Power Delivery, IEEE Transactions on, vol. 20, pp. 2264-2272, 2005.
[15] M. Hikita, H. Yamashita, T. Hoshino, T. Kato, N. Hayakawa, T. Ueda, and H. Okubo, "Electromagnetic noise spectrum caused by partial discharge in air at high voltage substations," Power Delivery, IEEE Transactions on, vol. 13, pp. 434-439, 1998.
[16] Z. Alliance, "ZigBee Specification," 1 December 2006, 2006. [17] Z. Jianliang, M. J. Lee, and M. Anshel, "Toward Secure Low Rate
Wireless Personal Area Networks," Mobile Computing, IEEE Transactions on, vol. 5, pp. 1361-1373, 2006.
[18] W. Andrew, "Commercial Applications of Wireless Sensor Networks Using ZigBee," Communications Magazine, IEEE, vol. 45, pp. 70-77, 2007.
[19] W. Kluge, F. Poegel, H. Roller, M. Lange, T. Ferchland, L. Dathe, and D. Eggert, "A Fully Integrated 2.4-GHz IEEE 802.15.4-Compliant Transceiver for ZigBee™ Applications," Solid-State Circuits, IEEE Journal of, vol. 41, pp. 2767-2775, 2006.
[20] I. Howitt and J. A. Gutierrez, "IEEE 802.15.4 low rate - wireless personal area network coexistence issues," in Wireless Communications and Networking, 2003. WCNC 2003. 2003 IEEE 2003, pp. 1481 - 1486.
[21] M. Petrova, J. Riihijarvi, P. Mahonen, and S. Labella, "Performance Study of IEEE 802.15.4 Using Measurements and Simulations," 2006.
[22] D. G. Yoon, S. Y. Shin, W. H. Kwon, and H. S. Park, "Packet Error Rate Analysis of IEEE 802.11b under IEEE 802.15.4 Interference," in Vehicular Technology Conference, 2006. VTC 2006-Spring. IEEE 63rd, 2006,pp.1186-1190.
SHAN ET AL. 18