technology-based product market entries: managerial
TRANSCRIPT

Helsinki University of Technology Institute of Strategy and International Business
Doctoral Dissertations 2003 / 2
Espoo 2003
TECHNOLOGY-BASED PRODUCT MARKET ENTRIES: MANAGERIAL RESOURCES AND DECISION-MAKING PROCESS Marika Osterloff Dissertation for the degree of Doctor of Science in Technology to be presented with due permission of the Department of Industrial Engineering and Management for public examination and debate in Auditorium Luna at Helsinki University of Technology (Espoo, Finland) on the 13th of February, at 12 noon.
Helsinki University of Technology Department of Industrial Engineering and Management Institute of Strategy and International Business Teknillinen korkeakoulu Tuotantotalouden osasto Yritysstrategian ja kansainvälisen liiketoiminnan laboratorio

Abstract
Entering new product markets on the basis of an existing technological competence is
an important possible source of growth for technology intensive companies. The
resource-based view explains resource-based growth in general. Diversification research
has studied patterns of technology-based new product market entries. More research is,
however, needed on managerial and decision-making process factors impacting the
success of technology-based product market entries.
The findings of this dissertation contribute to the knowledge on technology-based new
product market entries. A framework is developed and tested, which explains the impact
of managerial resources and decision-making process characteristics on the success of
technology-based product market entries. Hypotheses are derived from the resource-
based view and decision-making research. The main research question is: Which levers
does the management control that help promote technology-based growth into new
product markets? This question is further broken down into the following three
questions covering the three hypothesized main levers: Do the managerial resources
invested in generating technology-based growth impact the success of technology-based
product market entries? What is the impact of operational capabilities on the success of
individual technology-based product market entries? What is the impact of decision-
making process characteristics on the success of individual technology-based product
market entries?
The framework and the underlying hypotheses are examined in the light of data
collected with a survey of 63 companies. The framework and the survey questionnaire
were developed on the basis of interviews with nine companies as well as a literature
review of previous empirical research on diversification and research on new product
development. The empirical data support the main arguments of the framework. In order
to further examine the conclusions from the analysis of the survey data, five of the
survey respondent-companies were engaged in deepening case studies.

2
Several theoretical contributions are identified and managerial implications are derived.
Primarily, this dissertation contributes to the literature on technology-based product
market entries by creating a better understanding of the managerial levers for promoting
success. Chosen process, management and capability-related factors are studied. The
dissertation contributes to diversification research by examining on the project level the
process, organizational, and managerial components of diversification. The main
contribution related to the resource-based view is further clarification concerning the
role and support to the importance of managerial services in resource-based growth.
Aspects of successful management of technology-based market entry projects are
pointed out. The impact of familiarity with the new product markets on success of the
entry receives support. Further insights are generated on the complex social
phenomenon of participating in a project team with the challenging task of
implementing a technology-based product market entry.
The most important managerial implication is that certain managerial levers are more
effective than others in promoting the success of a growth strategy consisting of
technology-based product-market entries. The findings give an indication of certain
risks and uncertainties related to individual leveraging projects, which managers should
take into account.

Acknowledgements
Thomas Edison used to say that genius is one percent inspiration and 99 percent
perspiration. My motto has been that everything can be achieved through perspiration
only, add good planning and prioritization. The most valuable learning from writing the
dissertation was to gain some respect for the one percent. I learned it in my own work
through experiences of a day off bringing my thought process further than two weeks of
intense analysis. I also learned it through the technology leveraging projects that were
the subject of the thesis: they often did not proceed according to a predefined course but
inspirational moments of insight were required to solve problems. Through both my
work and the projects I studied I learned a few ways of supporting the inspiration. In
addition to taking a day off every now and then, one of the most effective ways was, not
surprisingly, talking with people who think in different ways.
Therefore, I would like to express my deepest gratitude to all the people who gave me
some of their time and, even more importantly, real share of mind. These discussions
are the milestones marking the important breakthroughs in the thought process. Some of
the discussion partners had a world view so different from mine that I still don’t
understand how they can think that way. Even if these discussions did not lead to
concrete new insights, they were also very valuable because they forced me to at least
try to step out of my own thought structures. Other discussion partners had very concrete
methodological or literature ideas, and yet others kept the managerial relevance in the
back of my mind. Two of the sparring partners were unique in seeing my dissertation in
the big picture, and developing the whole concept together with me. Tomi Laamanen,
my supervisor and instructor, proved to be a great, inspiring thinker with the ability of
taking problems to a few steps higher in abstraction without generalizing too much. I am
also infinitely grateful for his support and guidance in the process itself. He kept a very
good balance between critical comments and encouragement. Ove Granstrand of
Chalmers Tekniska Högskolan in Gothenburg, Sweden, seemed to understand early on

2
extremely well what I was after with this dissertation, and he thought it was a good idea.
Just knowing this and getting it confirmed every now and then was vital for not giving
up on the original idea.
In addition to Ove Granstrand, I want to acknowledge Professor Eero Vaara of Helsinki
School of Economics and Business Administration for acting as my external examiners.
Furthermore, I am grateful to Ron Sanchez from IMD in Lausanne, Switzerland for
agreeing to act as my public examiner. Their comments were valuable in the last meters
of the work, especially in helping me to crystallize the findings better.
My two sounding boards deserve special thanks for sticking with me for the whole
period: the Tekes project management group with Eija Ahola, Annareetta Lumme, Virpi
Pitkänen, and Pekka Suomela, and my advisory board from the Helsinki office of The
Boston Consulting Group with Harri Andersson, Kaj Kulp, Jarkko Sairanen, and Seppo
Väkevä. Special thanks to Jarkko for persistently requesting to see the results! Here they
are, I’ve tried to keep it interesting to you.
Other important sparring partners I want to thank are plenty: from Helsinki University
of Technology Erkko Autio, Mikko Junttila, Thomas Keil, Markku Maula, Annaleena
Parhankangas, and Tuukka Seppä. From Politecnico di Milano Lucia Piscitello. From
BCG Berlin Christoph Nettesheim: knowing you had been working with the same type
of issues in the real world gave me faith for the whole period in the importance of the
theme.
Back to perspiration: it would have been much more had not a huge staff at HUT been
keeping me and all the other researchers free of a thousand administrative tasks! Thanks
especially to Maria Tikka (who always does everything just perfectly and better), Katja
Putkonen, Pirjo Ruuskanen, Mikael Kühn, Eerikki Mäki, and Anne Johansson.
I am grateful to several Finnish foundations and institutions for financial support that
enabled me to focus full time on the thesis: Tekes, Liikesivistysrahasto, Alfred Kordelin
Foundation, Wihuri Foundation, Konkordia-liitto, Foundation of Merita Bank, and the
doctoral program of HUT.

3
My family has, like always, been an extraordinary support. The idea of writing a
dissertation originally came from my husband on our first date. His emotional support
has been vital: he has understood my frustrations and cheered me up. Most importantly,
he has put things into perspective and saved the dissertation from being compromised
by my impatience. And he has made my life in general very pleasant! My parents’ faith
in my capabilities knows no limits, which has always helped me in taking big
challenges. Because of that I never doubted I could write the thesis. Thank you for that!
More than anyone, I want to thank the firms who took part in the study. Without such
willingness of busy managers to take some time off for something that will not be
immediately useful for them, strategy research would be impossible. I am grateful that
so many firms expressed interest in this dissertation, and dedicate this work to them.
Writing a dissertation is a highly creative process. With regard to creativity, there is one
learning I especially want to keep in mind for all future projects, which is also depicted
by something Thomas Edison said: "There are no rules here - we're trying to accomplish
something."

1
Table of Contents
1 Introduction........................................................................................................................................... 1
1.1 Background ..................................................................................................................................... 1 1.2 Research questions .......................................................................................................................... 8 1.3 Scope of the research..................................................................................................................... 10 1.4 Structure of the dissertation and research methods........................................................................ 12
2 Discussion and definition of the main concepts ................................................................................ 14
2.1 Technology.................................................................................................................................... 14 2.2 Concepts of the resource-based view............................................................................................. 16 2.3 Technology-based product market entries ..................................................................................... 21
3 Previous research on technology-based product market entries..................................................... 25
3.1 Diversification research................................................................................................................. 25 3.1.1 General diversification research ........................................................................................... 25 3.1.2 Related diversification research ............................................................................................ 26 3.1.3 Technology diversification research...................................................................................... 33
3.2 Research on new product development ......................................................................................... 36 3.3 Summary of previous research on technology-based product market entries ................................ 42
4 Research approaches........................................................................................................................... 44
4.1 Resource-based view ..................................................................................................................... 44 4.1.1 Firm level constraints to growth............................................................................................ 47 4.1.2 Risk and uncertainty related to individual technology-leveraging projects .......................... 56
4.2 Decision-making research.............................................................................................................. 62 4.2.1 Strategic decision-making processes ..................................................................................... 64 4.2.2 Impact of decision-making context and process on results ................................................... 66
4.3 Model of factors affecting technology-based product market entries ............................................ 75
5 Methodology ........................................................................................................................................ 81
5.1 Population, sample and response patterns ..................................................................................... 81 5.2 Statistical methods......................................................................................................................... 82
5.2.1 Testing reliability and validity of the constructs - confirmatory factor analysis ................... 82 5.2.2 Testing the hypotheses - multiple linear regression analysis................................................. 85 5.2.3 Further clarifying the causalities - structural equation modeling......................................... 86
5.3 Operationalization of the constructs .............................................................................................. 87 5.3.1 Firm level constraints to growth............................................................................................ 88 5.3.2 Applicability of existing operational capabilities in the new market..................................... 91 5.3.3 Characteristics of the decision-making process .................................................................... 94 5.3.4 Level of technological competence........................................................................................ 96

2
5.3.5 Dependent and control variables........................................................................................... 98
6 Survey results .................................................................................................................................... 102
6.1 Descriptive data analysis ............................................................................................................. 102 6.2 Firm level context for the technology-based product market entries ........................................... 108 6.3 Model of technology-based product market entries..................................................................... 111
6.3.1 Correlations between the dependent variables.................................................................... 112 6.3.2 Correlations between the model variables .......................................................................... 113 6.3.3 Regression analysis results of the model of technology-based product market entries....... 118 6.3.4 Structural equation model of the project level variables..................................................... 124 6.3.5 Impact of growth projects on firm growth ........................................................................... 127 6.3.6 Interpretation of the results of the statistical analysis ......................................................... 128
6.4 Summary of the survey results..................................................................................................... 133
7 Case analysis ...................................................................................................................................... 134
7.1 Descriptions of each of the five cases.......................................................................................... 138 7.1.1 Project A.............................................................................................................................. 138 7.1.2 Project B.............................................................................................................................. 143 7.1.3 Project C.............................................................................................................................. 147 7.1.4 Project D ............................................................................................................................. 152 7.1.5 Project E.............................................................................................................................. 156
7.2 Cross-case analyses ..................................................................................................................... 160 7.2.1 Firm level factors................................................................................................................. 160 7.2.2 Type of project ..................................................................................................................... 164 7.2.3 Familiarity of the entered market: technology .................................................................... 168 7.2.4 Familiarity of the entered market: marketing and sales and operations............................. 171 7.2.5 Decision-making process characteristics: participation ..................................................... 173 7.2.6 Decision-making process characteristics: quality............................................................... 178
7.3 Summary and interpretation of the case analysis ......................................................................... 183
8 Conclusions ........................................................................................................................................ 186
8.1 Theoretical and empirical contributions ...................................................................................... 186 8.2 Managerial implications .............................................................................................................. 192 8.3 Limitations of the research and suggestions for further research................................................. 194
9 Summary ............................................................................................................................................ 196

3
References ............................................................................................................................................. 198
Appendices ............................................................................................................................................ 227
Appendix 1: Summary of empirical research in new product development....................................... 227 Appendix 2: Operationalizations of the variables.............................................................................. 229 Appendix 3: Questions from the questionnaire.................................................................................. 233 Appendix 4: Dendrogram of the cluster analysis ............................................................................... 240

1
List of Figures
Figure 1: Summary: Resource-based view on related diversification................................................... 62 Figure 2: Different spheres of opportunity and factors setting their boundaries................................... 76 Figure 3: Model of the relationships between the theoretical constructs.............................................. 79 Figure 4: Model of technology-based product market entries ............................................................ 112 Figure 5: Structural equation model of the project level of technology-based product market entries125 Figure 6: Cluster profiles.................................................................................................................... 134 Figure 7: Cases according to expectations reached and growth as percentage of original sales......... 136 Figure 8: The five cases compared to their cluster profiles ................................................................ 137 Figure 9: Project A............................................................................................................................. 143 Figure 10: Project B ........................................................................................................................... 147 Figure 11: Project C ........................................................................................................................... 152 Figure 12: Project D........................................................................................................................... 156 Figure 13: Project E ........................................................................................................................... 160 Figure 14: Conclusions....................................................................................................................... 186

1
List of Tables
Table 1: Technological opportunities................................................................................................. 16 Table 2: Components of competence ................................................................................................. 20 Table 3: Roberts' and Berry's assessment of technological and market familiarity ............................ 23 Table 4: Different conceptualizations of relatedness.......................................................................... 32 Table 5: Dimensions of strategic decision-making processes............................................................. 65 Table 6: Contextual variables, process variables, and project outcome variables in project related
decision-making processes ................................................................................................ 67 Table 7: Summary of hypotheses based on resource-based view....................................................... 77 Table 8: Summary of hypotheses based on decision-making research ............................................... 78 Table 9: Depth and distinctiveness of technological capability.......................................................... 97 Table 10: Pearson's correlation coefficients between quantitative and qualitative assessments of
growth expectations........................................................................................................... 99 Table 11: Operationalization of the control variables ...................................................................... 100 Table 12: Descriptive statistics of variables related to types of firms and types of projects ............ 102 Table 13: Firm size and research and development intensity ........................................................... 103 Table 14: Firm growth and growth aspiration .................................................................................. 103 Table 15: Industries and countries.................................................................................................... 104 Table 16: Growth reached through project as percent of original sales and as percent of
expectations..................................................................................................................... 105 Table 17: Profitability of the projects............................................................................................... 105 Table 18: Amount and consistence of managerial resources available for growth........................... 106 Table 19: Amount and consistence of full time managerial resources available for growth............. 106 Table 20: Technology evaluation and patent citation intensity ........................................................ 107 Table 21: Decision-making process characteristics and applicability of existing operational
capabilities in the new market ......................................................................................... 107 Table 22: Pearson's correlation coefficients between the independent, dependent and control
variables of the technology leveraging model on firm level ............................................ 109 Table 23: Regression analysis results: Firm level context ................................................................ 110 Table 24: Pearson's correlation coefficients between dependent variables ...................................... 112 Table 25: Pearson's correlation coefficients between the dependent, project level and firm level
variables of the model of technology-based product market entries – part 1................... 116 Table 26: Pearson's correlation coefficients between the dependent, project level and firm level
variables of the model of technology-based product market entries – part 2................... 117 Table 27: Regression analysis – Hypothesis 1: Firm level factors ................................................... 118 Table 28: Regression analysis – Hypotheses 2, 3, 4 and 5: Project level factors ............................. 120 Table 29: Regression analysis – Hypotheses 1, 2, 3, 4 and 5: Final model ...................................... 122 Table 30: Maximum likelihood coefficients of the variables in the structural equation model ........ 126 Table 31: Regression analysis results, firm growth as dependent variable: Firm level factors and
growth reached in the studied leveraging project ............................................................ 127 Table 32: Summary of hypotheses based on resource-based view................................................... 133 Table 33: Summary of hypotheses based on decision-making research ........................................... 133

2
Table 34: Firm level factors ............................................................................................................. 164 Table 35: Type of project................................................................................................................. 168 Table 36: Familiarity of the entered market: technology.................................................................. 170 Table 37: Familiarity of the entered market: marketing and operations ........................................... 173 Table 38: Decision-making process characteristics: participation.................................................... 178 Table 39: Decision-making process characteristics: qualitative aspects........................................... 182 Table 40: Managerial implications................................................................................................... 193

1
1 INTRODUCTION
1.1 Background
Finding opportunities for profitable growth is one of the main levers that companies
have for shareholder value creation1. For technology-intensive firms, entries into new
product markets are a potential source of business growth. If the company’s current
market is mature, and its market share already globally large, one of the few possibilities
to find significant growth opportunities may be entering new product-markets. Related
diversification has been found to offer a higher likelihood of succeeding in new markets
than unrelated diversification 2 3 4 5 6 7 8. Related diversification9 10 is usually understood as
involving the application of the firm’s existing competencies or knowledge in new
markets. Two most commonly noted bases of related diversification are knowledge of
the needs of certain customer groups and a technological competence11. Additionally,
related diversification can be based on competencies as specific as, for example, the
ability to manage franchises, distribution capability, manufacturing capability or fast
1 Copeland, T., Koller, T. & Murrin, J. 1994. Valuation: Measuring and managing the value of
companies. John Wiley & Sons, New York, USA. 2 Rumelt, R. P. 1974. Strategy, structure, and economic performance. Harvard University Press,
Cambridge, Massachusettes, USA. 3 Montgomery, C. A. 1979. Diversification, market structure, and performance: an extension of
Rumelt’s work. Doctoral dissertation, Purdue University 4 Palepu, K. 1985. Diversification strategy, profit performance, and the entrophy measure. Strategic
Management Journal, Vol. 6, pp. 239-255. 5 Simmonds, P. G. 1990. The combined diversification breadth and mode dimensions and the
performance of large firms. Strategic Management Journal, Vol. 11, pp. 399-410. 6 Chatterjee, S. & Wernerfelt, B. 1991. The link between resources and the type of diversification –
theory and evidence. Strategic Management Journal, Vol. 12, pp. 33-48. 7 Singh, H. & Montgomery, C. 1987. Corporate acquisition strategies and economic performance.
Strategic Management Journal, Vol. 8, No. 4, pp. 377-386. 8 Bettis, R. 1991. Performance differences in related and unrelated diversified firms. Strategic
Management Journal, Vol. 2, No. 4, pp. 379-394. 9 Prahalad, C. K. & Bettis, R A. 1986. The dominant logic: a new linkage between diversity and
performance. Strategic Management Journal, Vol. 7, No. 6, pp. 485-501. 10 Grant, R. M. 1988. On 'Dominant Logic', Relatedness And The Link Between Diversification.
Strategic Management Journal, Nov/Dec, Vol. 9, No. 6, pp. 693-643. 11 Goold, M., Campbell, A. & Alexander, M. 1997. Leveraging competencies across business. In:
Core-competency based strategy. Campbell, A. & Sommers Luchs, K. Thomson Business Press, UK.

2
new product introduction12. Growth strategy based on related diversification has also
been called competence leveraging13 14 15 16.
Examples exist of successful companies that have grown on the basis of their
technological competencies gradually extending into several additional product-markets.
They have often learned new supporting technologies as a necessity of an entry into a
new product market. Later, companies have utilized also the newly learned technologies
to enter additional product-markets. Examples of companies that have diversified into
new product-markets in order to utilize their technological competencies include
General Electric17, Texas Instruments18, DuPont19, HewlettPackard20, Eastman Kodak21,
Canon22 23, Toray Carbon Fibers24, and 3M25.
There are several constraints to technology-based product market entries. The
management does not discover all opportunities in new product-markets. The practical
implementation of a growth project taking advantage of an identified opportunity may
be characterized by significant uncertainties. Some constraints on technology-based
12 Conrad, G. R. 1997. Unexplored assets for diversification. In: Core-competency based strategy.
Campbell, A. & Sommers Luchs, K. Thomson Business Press, UK. 13 Prahalad, C. K. & Hamel, G. 1996. The core competence of the corporation. In: Burgelman, R. A.,
Maidique, M. A. & Wheelwright, S.C. 1996. Strategic management of technology and innovation. Times Mirror Higher Education Group, USA.
14 Hamel, G. & Prahalad, C. K. 1994. Competing for the future. Harvard Business School Press, USA.
15 Hamel, G. 1994. The concept of core competence. In: Hamel, G. & Heene, A. (Eds.). Competence-based competition. John Wiley & Sons, UK.
16 Sanchez, R., Heene, A. & Thomas, H. 1997. Introduction: towards the theory and practice of competence-based competition. In:Dynamics of competence-based competition. Pergamon, UK.
17 Abetti, P. A. Convergent and divergent technological and market strategies for global leadership. International Journal of Technology Management, Vol. 14, No. 6/7/8, pp. 635-657.
18 Frantz, G. A. 1998. From risky business to big business. Research Technology Management, Washington, Jul/Aug.
19 O’Brien, T. C. & Fadem, J. T. 1999. Identifying new business opportunities. Research Technology Management, Washington, Sep/Oct, pp. 15-19.
20 Barnholt, E. W. 1997. Research Technology Management, Washington, Mar/Apr. 21 Peteraf, M. 1993. The cornerstones of competitive advantage: A resource-based view. Strategic
Management Journal, Vol. 14, pp. 179-191. 22 Markides, C. C. & Williamson, P. J. 1994. Related diversification, core competencies and
corporate performance. Strategic Management Journal, Vol. 15, pp. 149-165 23 Chiesa, V. & Manzini, R. 1997. Competence-based diversification. Long range planning, Vol. 30,
no. 2, pp. 209-217. 24 Abetti, P. A. Convergent and divergent technological and market strategies for global leadership.
International Journal of Technology Management, Vol. 14, No. 6/7/8, pp. 635-657. 25 Goold, M., Campbell, A. & Alexander, M. 1997. Leveraging competencies across business. In:
Core-competency based strategy. Campbell, A. & Sommers Luchs, K. Thomson Business Press, UK.

3
product-market entries could be becoming less restrictive; Stankiewicz26, Kodama27, as
well as Langlois and Robertson28 have written about the scientificness, modularity and
fusibility of technologies, which they claim to be increasingly common features of
technologies. These features, according to Stankiewicz, make technologies increasingly
generic, which implies a larger possible range of applications. Another development that
may diminish constraints on technology-based product market entries is that a business
model relying on a network of subcontractors has become increasingly viable mainly
due to a decrease in information processing costs29 30 31. Such a networked business
model may, depending on the situation and on the industry, help overcome some of the
operative constraints on entering a new market. Such operative constraints may be, for
example, production capacity or marketing channels needed in order to enter a new
market.
One area of focus in diversification research is the kinds of strategies firms in general
should follow in their technology-based growth. One of the questions that have received
a lot of attention is according to what logic should firms choose the markets to enter.
Further, diversification research has tried to explain companies’ growth paths’ impact
on financial performance. Companies’ membership in industries has often been modeled
using industry classification codes32. In general, diversification research has mainly
26 See, for example, Stankiewicz, R. Basic technologies and the innovation process. In: Sigurdson, J.
(Ed.). Measuring the dynamics of technological change. 27 See, for example, Kodama, F. 1992. Technology fusion and the new R&D. Harvard Business
Review, Jul-Aug, pp. 70-78. 28 Langlois, R. N. & Robertson, P. L. 1992. Networks and innovation in a modular system: Lessons
from the microcomputer and stereo component industries. Research Policy, Vol. 21, pp. 297-313. 29 For more on the reasons for operating as an integrated value chain versus employing resources
within a market relationship, see for example Coase, R. 1990. The firm, the market and the law. University of Chicago Press, USA. Williamson, O. 1983. Markets and hierarchies. Free Press, USA. Evans, P. & Wursterer, T. S. 1999. Blown to bits: How the new economics of information
transforms strategy. Harvard Business School Press, Massachusettes, USA. 30 Sampler, J. L. 1998. Redefining industry structure for the information age. Strategic Management
Journal, Chichester, Vol. 19, No. 4, pp. 343-355. 31 Hitt, L. M. 1999. Information technology and firm boundaries: Evidence from panel data.
Information Systems Research, Providence, Vol. 10, No. 2, pp. 134-149 32 Silverman, B. S. 1999. Technological resources and the direction of corporate diversification:
toward an integration of the resource-based view and transaction cost economies. Management Science, pp. 1109-1124.

4
concentrated on topics that can be researched using large, existing databases33.
Silverman34 has recently suggested that more research is needed into the process of
diversifying and the role of managerial resources in this process. In his view, company
internal management, competence and organizational factors lack research, although
they all would seem very important for explaining diversification choices and success.
Resource-based view proposes that the availability of managerial resources is even the
most important restriction to growth35.
In addition, other streams of research have pointed out the importance of clarifying the
management component in technology-based product market entries. For example,
research on effectiveness of research and development investments has identified the
importance of a strategy for leveraging technology, but has not elaborated further on the
possible criteria for a good strategy for technology-based product market entries.
Neither has it elaborated on what it takes to implement the strategy.36 37 38 39 Further,
researchers of new product development have suggested40 that future research should
concentrate on antecedents to development performance such as project leader
characteristics, competitive market intelligence, market orientation, market
attractiveness, resource uncertainty, competitive intensity, market and technological
uncertainty, and project task characteristics such as project complexity. According to the
researchers of new product development, the focus of future research should be on
33 Silverman, B. S. 1999. Technological resources and the direction of corporate diversification:
toward an integration of the resource-based view and transaction cost economies. Management Science, pp. 1109-1124.
34 Silverman, B. S. 1999. Technological resources and the direction of corporate diversification: toward an integration of the resource-based view and transaction cost economies. Management Science, pp. 1109-1124.
35 Penrose, E. 1972 (orig. publ. 1959). The theory of the growth of the firm. Basil Blackwell and Mott, Oxford, 5th edition.
36 Bean, A. S. 1995. Why some R&D organizations are more productive than others. Research Technology Management, Washington, Jan/Feb, pp. 25-.37
37 Bean, A. S., Einolf, K. & Russo, M. J. 1999. Benchmarking your R&D: Results from IRI/CIMS annual R&D survey for FY ’97. Research Technology Management, Washington, Jan/Feb, pp. 24-34.
38 Bean, A. S., Russo, M. J. & Whiteley, R. L. 2000. Benchmarking your R&D: Results from IRI/CIMS annual R&D survey for FY ’98. Research Technology Management, Washington, Jan/Feb, pp. 16-24.
39 Roberts, E. B. 1995. Benchmarking the strategic management of technology – II. Research Technology management, Washington, Mar / Apr, pp. 18-..
40 Tatikonda, M. V. & Montoya-Weiss, M. M. 2001. Integrating operational and marketing perspectives of product innovation: The influence of organizational process factors and capabilities on development performance. Management Science, January, Vol. 47, No. 1, pp. 151-172.

5
project planning rather than project execution, as project execution has been extensively
researched previously. Project planning is important because during this phase of the
project organizational process factors and operational outcome targets are set,
technology alternatives investigated, and important product market choices made. The
uncertainties that a development project faces in its implementation depend on the
choices made in project planning. Organizational process factors and targets set for
development outcomes are key managerial decision variables. Therefore, according to
the researchers of this stream, future research is needed to investigate which groups of
employees or which organizational levels in firms make these decisions, and what the
nature of their influence is on the decision-making process41.
Different aspects of technology-based product market entries have been discussed by
such streams of research as diversification research, research discussing leveraging
technological competencies, research on new product development, research on
effectiveness of research and development investments, as well as the resource-based
view. However, these streams have been lacking in explanations as to the management
of the process of technology-based product market entries.
This study adopts a managerial choice perspective on technology-based product market
entries, concentrating on the levers the management controls that can promote the
success of a firm’s leveraging activities. Two streams of research are used to form a
basis for understanding issues related to technology-based product market entries. These
streams are the resource-based view of strategy and decision-making research. The
resource-based view emphasizes the importance of the availability of managerial
resources for growth, specifying that managerial resources are consumed especially in
identifying and planning growth projects, as well as in managing the risk and
uncertainty related to implementing individual growth projects42. Decision-making
research helps identify in more detail where the management capacity in technology
leveraging projects is consumed, as managing is for a large part executed through
41 Tatikonda, M. V. & Montoya-Weiss, M. M. 2001. Integrating operational and marketing
perspectives of product innovation: The influence of organizational process factors and capabilities on development performance. Management Science, January, Vol. 47, No. 1, pp. 151-172.
42 Penrose, E. 1972 (orig. publ. 1959). The theory of the growth of the firm. Basil Blackwell and Mott, Oxford, 5th edition.

6
decision-making. In addition, research on technology-based diversification is used to
gain further understanding of the phenomenon. Diversification has traditionally been
studied from the perspective of the industrial organization view. There is, however, also
diversification research building on the resource-based view.
The resource-based view of strategy has been a popular topic in the nineties, but it has
been blamed for a lack of empirically founded and detailed academic research on the
operationalization of resources and resource-based strategies at the firm level. The
concept of organizational capabilities has been accused of being too vague for empirical
analysis43. Meanwhile, the focal concepts have received a lot of attention and have been
more clearly defined. Some of the focal themes have gained considerable empirical
support, as well as managerial approval44. One of the themes that have received
empirical support is the proposition that resources matter; the most important strategic
constraints seem to arise from the unique resources and actions of individual
corporations or business units, instead of arising from the industry characteristics45 46.
Another central theme that has been empirically addressed is the question of how to
identify the firm level investments in resources and capabilities that generate above
average returns from the market47. The empirical findings in this area show, for
example, that information routines are positively linked to performance48 49 50.
Experience in product development has been found to influence the financial
43 Kogut, B. & Kulatilaka, N. 1994. Options thinking and platform investments: investing in
opportunity. California Management Review, Berkeley, Winter, pp. 52-. 44 Peteraf, M. A. 1993. The cornerstones of competitive advantage: A resource-based view. Strategic
Management Journal, Chichester, March, Vol. 14, No. 3, pp. 179-192. 45 Rumelt, R. P. 1991. How Much Does Industry Matter? Strategic Management Journal, Chichester,
March, Vol. 12, No. 3, 167-185. 46 Hansen, G. S. & Wernerfelt, B. 1989. Determinants of Firm Performance. Strategic Management
Journal, Chichester, Sep/Oct, Vol. 10, No. 5, pp. 399-411. 47 Moorman, C. & Slotegraaf, R. J. 1999. The contingency value of complementary capabilities in
product development. Journal of Marketing Research, Chicago, May, pp. 239-257. 48 Jaworski, B. J. & Kohli A. K. 1993. Market Orientation: Antecedents and Consequences. Journal
of Marketing, Vol. 57, July, pp. 53-71. 49 Moorman, C. 1995. Organizational Market Information Processes: Cultural Antecedents and New
Product Outcomes. Journal of Marketing Research, Vol. 32, August, pp. 318-35. 50 Narver, J. C. & Slater, S. F. 1990. The Effect of a Market Orientation on Business Profitability.
Journal of Marketing, Vol. 54, October, pp. 20-35.

7
performance of new products 51 52. Different skill sets are required from market pioneers,
early followers, and late entrants 53 54.
A large part of diversification research has been based on analyzing databases of
industry entry and exit information. Therefore, the process of diversifying is relatively
unknown from a company-internal perspective. The operationalization of the resource-
based view of diversification has mostly been limited to broad categorizations of
resources and the industries in which they might be applicable.55 Within the resource-
based view, little research has focused on the process of leveraging resources. The lack
of knowledge of the process and factors affecting it can even be suspected to be a reason
for under-utilizing this growth opportunity, as managers may shun undertaking
technology-based growth projects to new product markets on the grounds that they are
unknown and risky. Possible factors affecting the process could be, for example, the
strength of technological competence to be leveraged relative to other firms, the scope
of applicability of the technological competence, management’s perception of the
growth opportunities, and the capability to execute an entry into a new market.
Technology-based product market entry is an important theme for technology intensive
firms. Therefore, generating a deeper understanding on this theme is essential. Many
companies appear not to have systemized their approaches to utilizing technology-based
growth opportunities according to the author’s consulting experience and the empirical
research conducted for this research. Differences seem to lie in how much managerial
time is invested into generating technology-based growth, and how well the entry
projects are managed. As discussed above, previous research has not focused on these
topics. This dissertation aims at contributing to the understanding of firm growth
through technology-based product market entries and to the understanding of how this
51 Moorman, C. & Miner, A. S. 1997. The Role of Organizational Memory in New Product
Performance and Creativity. Journal of Marketing Research, Vol. 34, February, pp. 91-106. 52 Song, Z. M. & Parry, M. E. 1997. The Determinants of Japanese New Product Successes. Journal
of Marketing Research, Vol. 34, February, pp. 64-76. 53 Bowman, D. & Gatignon, H. 1995. Determinants of Competitor Response Time to a New Product
Introduction. Journal of Marketing Research, Vol. 32, February, pp. 30-41. 54 Kalyanaram, G., Robinson, W. T. & Urban, G. L. 1995. Order of Market Entry: Established
Empirical Generalizations, Emerging Empirical Generalizations, and Future Research. Marketing Science, Vol. 14, Summer, pp. 212-221.

8
growth opportunity could be exploited more. Furthermore, this dissertation aims at
contributing to the body of research on technology-based growth as seen in the resource-
based view. In addition, the study will contribute to the body of research on technology-
based diversification and understanding of diversification processes, as a part of the
diversification research.
1.2 Research questions
Entries into new product markets represent a potential growth opportunity for
technology intensive firms. Being able to develop profitable business on the basis of
technological competence is often important for justifying further investments in
technological competencies. Many streams of empirical research explain some aspects
of technology-based product market entries. Such streams of research are diversification
research, as well as research streams that discuss competence leveraging, new product
development, effectiveness of research and development investments, and
entrepreneurship and corporate venturing. However, as of yet, research clarifying the
role of managerial resources, operational capabilities and decision-making process
characteristics in technology-based diversification, in new product development, or with
regard to the effectiveness of research and development investments has been rare. This
study aims at clarifying these aspects of technology-based growth through answering the
following four research questions. The main research question is as follows:
Research question 1:
Which levers does the management control that help to promote technology-
based growth into new product markets?
It is important to understand to what degree the efforts of management can increase the
number and the success of technology-based product market entries. Several research
streams emphasize the strength of environmental conditions, contextual factors and path
dependencies over managerial choice. With regard to technology-based product market
55 Silverman, B. S. 1999. Technological resources and the direction of corporate diversification:
toward an integration of the resource-based view and transaction cost economies. Management Science, pp. 1109-1124.

9
entries, these can hinder the management in its efforts to find many of the growth
opportunities. They can also reduce the applicability of the technological competence
outside the context where it was originally applied and can render the management
unwilling to start technology-based growth projects leading to new product-markets due
to their perceived high risk of failure. These are relevant constraints to technology-based
product market entries. An important question is how much the management can impact
the success of technology-based product market entries thorough its own efforts, and
how much it is determined by factors outside the control of the management. A
following important question is what the managerial efforts, if any, are that can impact
the success of technology-based product market entries. Therefore, the main research
question is further specified in three questions as follows:
Research question 2:
Do the managerial resources invested in generating technology-based growth
impact the success of technology-based product market entries?
The second research question is important for more concretely assessing the impact of
managerial effort on success of technology-based product market entries.
Research question 3:
What is the impact of operational capabilities on the success of individual
technology-based product market entries?
The third research question is important for dealing with the issue of whether
management can through its efforts in carefully choosing the markets for technology-
based growth increase the chance of success and decrease the influence of negative
environmental and contextual factors. Specifically, the third research question
concentrates on the impact of choosing markets that are as familiar as possible.
Research question 4:
What is the impact of decision-making process characteristics on the success of
individual technology-based product market entries?

10
The fourth research question is important for assessing the significance of managerial
efforts to assure the best possible conditions for the success of technology-based growth
projects to new product-markets. These efforts are directed towards overcoming the
organizational, contextual and environmental factors that could negatively impact the
implementation of a leveraging project. More specifically, these efforts will be studied
through the characteristics of the decision-making process, because decision-making
processes are among the most concrete instances of managerial action.
1.3 Scope of the research
The objects of analysis in this research are technology leveraging projects in individual
companies, that is, the research aims at explaining the factors affecting technology-
based product market entries from the point of view of individual companies. The focus
of the research is on technology-based product market entries. Creating the
technological competencies for firms is not studied. However, technology-based product
market entries very often also require some new technological competencies to be
developed. This competence development can play an important role in the success of
such growth projects, and will be taken into account in discussing factors affecting the
success of the projects. The distinction of competence development and competence
leveraging can be compared to the difference between technology diversification, that is,
acquiring new technological skills, and business diversification, that is, growing into
new geographical or product-markets on the basis of those skills56. Technology
diversification has been defined as increasing the width of the corporate technology base
over time57. This definition is not widely used, however. The definition of technology
diversification as increasing the width of the corporate technology base will be used
here because of the usefulness of distinguishing between technology diversification and
business diversification. The corporate technology base consists of the technological
competencies that a company possesses, as well as the technologies acquired in the form
of, for example, patents. In multi-technology companies, that is technologically
56 Granstrand, O. 1998. Towards a theory of the technology-based firm. Research Policy, September,
pp. 465-489. 57 Oskarsson, C. 1993. Technology diversification: The phenomenon, its causes and effects.
Chalmers University of Technology, Göteborg, Sweden.

11
diversified companies, the technology base has been defined to consist of at least three
different generic technologies.58
Technology and business diversification have often been found to follow each other’s
development. This means that, in order to enter a new product-market, a firm often
needs to acquire some new technological competencies even if the main basis for
entering the market is an existing technological competence. Therefore, one can say that
business diversification often causes technology diversification59. In addition,
technology diversification often causes further business diversification, as the firm
searches for higher returns on its technology investments by leveraging them in new
markets. Realizing that these two processes are intertwined, or even take place in
parallel, this study focuses only on the factors that contribute to the success of business
diversification. However, the linkage is kept in mind all along, as the two processes may
influence each other so much that they cannot be considered fully separately.
Geographically, the empirical part of the study will concentrate on Finland and Sweden.
The inclusion of both countries is necessary in order to achieve a sufficient sample size,
and this should not create comparison problems due to the similarity of the economic
systems of the countries. The industries included are manufacturing industries in which
product technology is one of the main ways for firms to differentiate their products. This
leaves, for example, industries where differentiation is achieved on the basis of brand or
visual appeal alone outside the scope of this study. Furthermore, industries clearly
differentiating only on the basis of process technology are left out. This delineation was
made in order to make the identification of technology leveraging cases easier. Thus in
practice, the largest included industries in Finland and Sweden are electronics, industrial
goods, chemicals, pharmaceuticals, materials, cable, software, and metal industries.
Firms younger than five years are not included, as they are not considered likely to have
yet proceeded with technology-based product market entries to the point at which their
results could be assessed. The types of firms in the sample are discussed in more detail
in a later chapter covering the descriptive statistics of the study. The industries,
58 Granstrand, O. & Sjölander, S. 1990. Managing inovation in multi-technology corporations.
Research Policy, Feb. 59 Granstrand, O. & Sjölander, S. 1990. Managing inovation in multi-technology corporations.
Research Policy, Feb.

12
countries and firm sizes are included in the analyses as control variables, but explaining
why technology leveraging strategies or success may vary between industries, countries
or firm size classes is outside the scope of this study.
1.4 Structure of the dissertation and research methods
The following chapter, Chapter 2 presents an analysis and definitions of the main
concepts of the study, ending with a definition of the object of interest, technology-
based product market entries.
In Chapter 3, research streams discussing technology-based product market entries are
reviewed. First, diversification research is discussed. Starting with the classic writings
on diversification research, research in this area, including related diversification and
technology diversification, is reviewed. Second, research on new product development
and the effectiveness of research and development investments is summarized.
Chapter 4 reviews the theoretical approaches used in this dissertation. These are based
on the resource-based view and decision-making research. Hypotheses based on the
theoretical approaches are presented. The topics within the resource-based view that are
discussed relate to the amount of managerial resources available for growth, other firm
level growth constraints, knowledge concerning growth, and risk and uncertainty related
to individual technology-leveraging projects. The topics within decision-making
research that are discussed relate to strategic decision-making processes in general and
the impact of the decision-making context and process on results. At the end of the
chapter, a hypothetical model of factors affecting technology-based product market
entries is presented, as well as a summary of hypotheses.
Chapter 5 presents the methodology used in this study. Data for the empirical testing of
the hypotheses was collected with a mail survey. A careful identification of respondents
was carried out through multiple telephone discussions with representatives of the firm.
The respondent finally identified was contacted via telephone prior to sending the
questionnaire in order to explain the background of the study and questionnaire and
receive his or her agreement to return the questionnaire. This way, it was assured that
the questions were understood correctly and that the response rate was increased through

13
higher motivation. Follow-up telephone calls and mailings were also made. In Chapter
5, the population, sample and response patterns are presented. The statistical methods
used for the analysis of the empirical data are discussed. Confirmatory factor analysis is
used for testing the reliability and validity of the constructs. Multiple linear regression
analysis is conducted for testing the hypotheses. Structural equation modeling is used to
further verify the model.
Theoretical constructs are operationalized by adopting and adapting measures used in
previous studies, or by deriving new measures based on the applied theoretical
perspectives of previous research, or on exploratory interviews with nine companies. In
Chapter 5, the operationalization of the variables measured is also discussed. The
variables include managerial services available for growth, other firm level growth
constraints, characteristics of the decision-making process, applicability of existing
operational capabilities in the new market, and several control variables. The reliability
and validity of the measures is discussed.
Chapter 6 presents the results of the statistical analysis, beginning with a descriptive
data analysis. The results are presented at two levels, at the firm level and the project
level after first analyzing the firm level context to the growth projects. First, the
correlations between variables are presented, then the regression analysis results, and
finally a structural equation model. Chapter 7 deepens the analysis with the help of five
case analyses.
Finally, in Chapter 8 the conclusions of the dissertation are analyzed with regard to
theoretical and empirical contributions, managerial implications, as well as limitations
and suggestions for further research.

14
2 DISCUSSION AND DEFINITION OF THE MAIN CONCEPTS
In this chapter, the key concepts of this dissertation are discussed. These include the
following concepts: the concept of “technology”, several concepts from the resource-
based view and technology related diversification, as well as technology-based product
market entries.
2.1 Technology60
Technology is a multi-faceted concept that, for the purposes of this dissertation, is best
described with the help of its dimensions and qualities. Stankiewicz has suggested that
the more “generic” a technology, the wider the range of its possible applications61. He
names as examples of generic technologies laser technology, nuclear technology, protein
engineering, and material technology. According to Stankiewicz, the generity of
technology can be explained in more detail through two other characteristics: the
fusibility and the modularity of technology. The fusibility of technology can be defined
as the degree to which a technological innovation can be fused with other technologies
to form new, hybrid technologies62. Modularity of technology can be defined as the
degree to which a technological innovation can be modularized, thereby forming a
platform with standardized interfaces upon which diverse systems can be built based on
different combinations of modules63. According to Stankiewicz, both the fusibility and
modularity of technology increase its generity.
In addition to generity, several other dimensions of technology have also been identified
in previous literature. Some of these dimensions are relevant when defining technology
60 For an extensive discussion on the many components and dimensions of technology, see Autio, E.
1995. Symplectic and generative impacts of new, technology-based firms in innovation networks: An international comparative study. Doctoral dissertation, Helsinki University of Technology, Finland.
61 Stankiewicz, R. Basic technologies and the innovation process. In: Sigurdson, J, (Ed.), Measuring the dynamics of technological change.
62 See, for example, Kodama, F. 1992. Technology fusion and the new R&D. Harvard Business Review, Jul-Aug, pp. 70-78.

15
for the purpose of conceptualizing technology leveraging. The dimensions are related to
possible restricting and enabling features in the transferability and extendability of
different technologies into new product-markets. Such dimensions of technology
include, for example64 whether technology is tacit or articulable, independent or an
element of a system, and teachable or not teachable. Application specificity may be an
important constraint to growth to new product markets. One form of this application
specificity has been named in previous research as “technological embeddedness”65,
which means that a firm’s technological competence is so tightly linked to its original
context or applications that it has little or no value outside the original context or
applications.
Defining the boundaries of a technology area is difficult, as technologies are often a
fusion of many component technologies. Sometimes the boundaries can be set according
to the boundaries of an industry or a block of related industries, or alternatively they can
be defined according to the boundaries of a certain technology as an academic
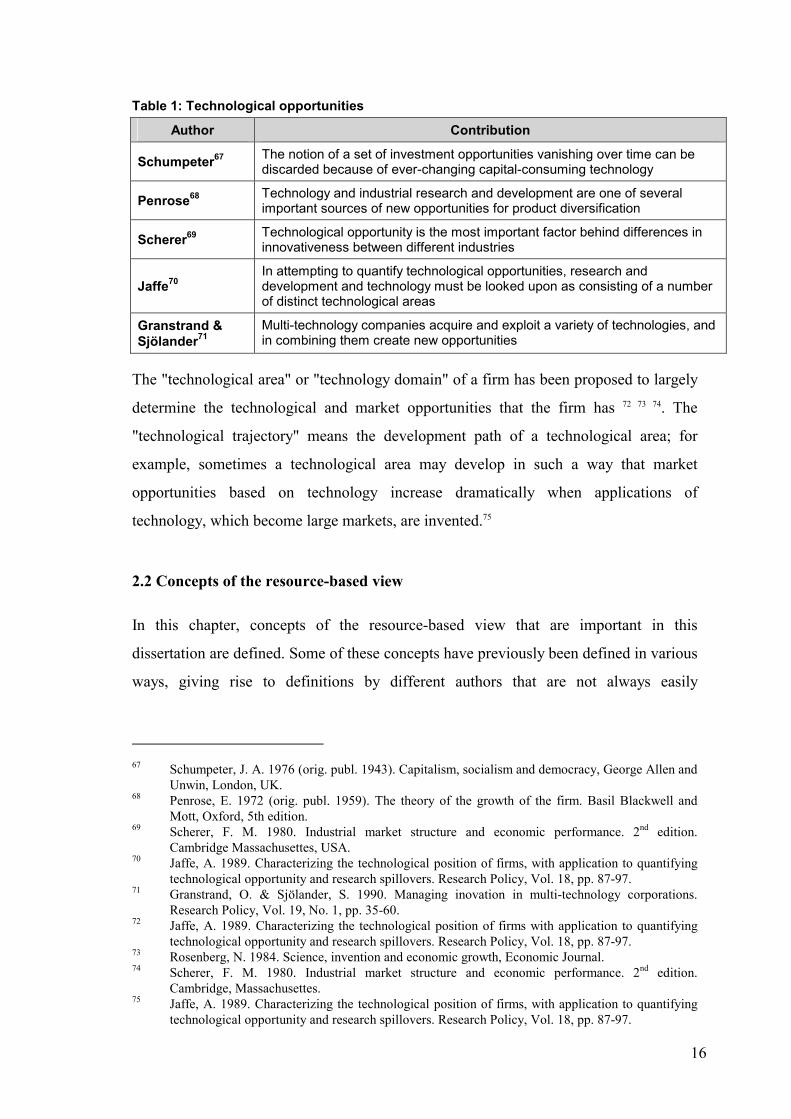
discipline66. Scholarly interest towards “technological opportunities” is summarized in
the following table.
63 See, for example, Langlois, R. N. & Robertson, P. L. 1992. Networks and innovation in a modular
system: Lessons from the microcomputer and stereo component industries. Research Policy, Vol. 21, pp. 297-313.
64 Autio, E. 1995. Symplectic and generative impacts of new, technology-based firms in innovation networks: An international comparative study. Doctoral dissertation, Helsinki University of Technology, Finland.
65 Autio, E. 1996. In: Kuusi, O. (Ed.) Innovation systems and competitiveness. Taloustieto Oy, Helsinki, Finland
66 Autio, E. 1995. Symplectic and generative impacts of new, technology-based firms in innovation networks: An international comparative study. Doctoral dissertation, Helsinki University of Technology, Finland.
16
Table 1: Technological opportunities
Author Contribution
Schumpeter67 The notion of a set of investment opportunities vanishing over time can be discarded because of ever-changing capital-consuming technology
Penrose68 Technology and industrial research and development are one of several important sources of new opportunities for product diversification
Scherer69 Technological opportunity is the most important factor behind differences in innovativeness between different industries
Jaffe70 In attempting to quantify technological opportunities, research and development and technology must be looked upon as consisting of a number of distinct technological areas
Granstrand & Sjölander71
Multi-technology companies acquire and exploit a variety of technologies, and in combining them create new opportunities
The "technological area" or "technology domain" of a firm has been proposed to largely
determine the technological and market opportunities that the firm has 72 73 74. The
"technological trajectory" means the development path of a technological area; for
example, sometimes a technological area may develop in such a way that market
opportunities based on technology increase dramatically when applications of
technology, which become large markets, are invented.75
2.2 Concepts of the resource-based view
In this chapter, concepts of the resource-based view that are important in this
dissertation are defined. Some of these concepts have previously been defined in various
ways, giving rise to definitions by different authors that are not always easily
67 Schumpeter, J. A. 1976 (orig. publ. 1943). Capitalism, socialism and democracy, George Allen and
Unwin, London, UK. 68 Penrose, E. 1972 (orig. publ. 1959). The theory of the growth of the firm. Basil Blackwell and
Mott, Oxford, 5th edition. 69 Scherer, F. M. 1980. Industrial market structure and economic performance. 2nd edition.
Cambridge Massachusettes, USA. 70 Jaffe, A. 1989. Characterizing the technological position of firms, with application to quantifying
technological opportunity and research spillovers. Research Policy, Vol. 18, pp. 87-97. 71 Granstrand, O. & Sjölander, S. 1990. Managing inovation in multi-technology corporations.
Research Policy, Vol. 19, No. 1, pp. 35-60. 72 Jaffe, A. 1989. Characterizing the technological position of firms with application to quantifying
technological opportunity and research spillovers. Research Policy, Vol. 18, pp. 87-97. 73 Rosenberg, N. 1984. Science, invention and economic growth, Economic Journal. 74 Scherer, F. M. 1980. Industrial market structure and economic performance. 2nd edition.
Cambridge, Massachusettes. 75 Jaffe, A. 1989. Characterizing the technological position of firms, with application to quantifying
technological opportunity and research spillovers. Research Policy, Vol. 18, pp. 87-97.

17
comparable. However, the main concepts have already been defined in ways approved
by several of the key scholars in the field. The concepts discussed are productive
opportunity, resources, competence, and capabilities.
Productive opportunity
The growth of a firm is limited by its productive opportunity and also by the productive
objective subjectively defined by entrepreneurs. Productive opportunity consists of all
productive possibilities that entrepreneurs see and are able and willing to take advantage
of. Thus not seeing the opportunities, and being unable or unwilling to respond to them,
restricts firm growth. 76
Resources
According to the resource-based view, a firm is a collection of resources and a set of
functions to convert resources into competitive advantage77. While Penrose referred to
resources as tangible and human78, Wernerfelt meant anything that could be a strength or
weakness of a firm, that is, tangible or intangible assets tied semi-permanently to the
firm. Within Wernerfelt's definition, the intangible assets would also include, for
example, the organization’s values79. Barney reduced the definition to exclude the
weaknesses of a firm; in his definition, resources are all those assets controlled by a firm
that enable it to improve efficiency and effectiveness80. Sanchez et al. define resources
in a similar way, as assets that are available and useful in detecting and responding to
market opportunities and threats, but they refine the definition somewhat to further
clarify the point that it includes capabilities as well as other forms of useful and
available assets81.
76 Penrose, E. 1972 (orig. publ. 1959). The theory of the growth of the firm. Basil Blackwell and
Mott, Oxford, 5th edition. 77 Barney, J. 1991. Firm resources and sustained competitive advantage. Journal of Management,
Vol. 17, No. 1, pp. 99-120. 78 Penrose, E. 1972 (orig. publ. 1959). The theory of the growth of the firm. Basil Blackwell and
Mott, Oxford, 5th edition. 79 Wernerfelt, B. A. 1984. Resource-based view of the firm. Strategic Management Journal, Vol. 5,
pp. 171-180. 80 Barney, J. 1991. Firm resources and sustained competitive advantage. Journal of Management,
Vol. 17, No. 1, pp. 99-120. 81 Sanchez, R., Heene, A. & Thomas, H. 1997. Introduction: towards the theory and practice of
competence-based competition. In:Dynamics of competence-based competition. Pergamon, UK.

18
Amit and Schoemaker refrain from attempting to identify which resources are actually
useful and which not. According to them, resources can be defined as stocks of available
factors that are owned or controlled by the firm82. In addition, these stocks or factors
− can be converted into final products by using a wide range of other firm assets
and bonding mechanisms such as technology, management information systems,
incentive systems, trust between management and labor, and others
− consist of, for example, knowledge that can be traded, such as patents and
licenses, as well as financial and physical assets, such as property, plant,
equipment, human capital, and so on
− are externally available and transferable, owned or controlled by the firm, and
convertible.
This is in line with the systems view set out in competence literature, according to
which the strategic usefulness of a resource depends on the way it is combined,
coordinated, and deployed with other firm-specific and firm-addressable resources83.
The above definition of Amit and Schoemaker is used in this dissertation as the
definition of resources. The “stocks of factors” mentioned in the definition are here also
defined to include all knowledge, and therefore tacit knowledge in addition to tradable
knowledge. Penrose defines "resource" as a bundle of possible services. According to
Penrose, resources that are not fully utilized in current operations, or that could be more
profitably exploited through expansion, represent “unused productive services”. Unused
productive services provide an incentive to grow, and the existing resources often set the
direction of growth. 84
82 Amit, R. & Schoemaker, P. J. H. 1993. Strategic assets and organizational rent. Strategic
Management Journal, Vol. 14, pp. 33-46. 83 Sanchez, R. & Heene, A. 1997. Competence-based strategic management: Concepts and issues for
theory, research, and practice. In: Sanchez, R. & Heene, A. Competence-based strategic management. John Wiley & Sons, UK.
84 Penrose, E. 1972 (orig. publ. 1959). The theory of the growth of the firm. Basil Blackwell and Mott, Oxford, 5th edition.

19
Competence
According to Teece, a competence is an integrated set of technological skills,
complementary assets, and organizational routines and capacities that provide the basis
for a firm’s competitive advantage in one or more businesses85. To be a competence, an
activity must meet three criteria: organization, intention and goal attainment.86
Competencies that can be called core competencies should, according to Hamel and
Prahalad, be identified according to their extendability. They provide a basis for new
business development and should give a company some long run competitive advantage
by making significant contributions to the perceived customer benefits of end products.
Core competencies should be difficult for competitors to imitate.87
Durand88 classifies competencies into five categories. The classification is close to the
classification of Sanchez, Heene and Thomas89. Both are shown in the table below.
These five categories of competence include culture, organizational processes, structure,
cognitive capabilities, and stand-alone assets.
85 Teece, D. 1988. Technological change and the nature of the firm. In: Dosi, G., Freeman, C.,
Nelson, R., Silverberg, G., & Soete, L. (Eds.) Technological change and economic theory. Pinter. 86 Sanchez, R., Heene, A. & Thomas, H. 1997. Introduction: towards the theory and practice of
competence-based competition. In:Dynamics of competence-based competition. Pergamon, UK. 87 Prahalad, C. K. & Hamel, G. 1996. The core competence of the corporation. In: Burgelman, R. A.,
Maidique, M. A. & Wheelwright, S.C. 1996. Strategic management of technology and innovation. Times Mirror Higher Education Group, USA.
88 Durand, T. 1997. Strategizing for innovation: Competence analysis in assessing strategic change. In: Competence-based strategic management. Heene, A. & Sanchez, R. (Eds.) John Wiley & Sons. UK.
89 Sanzhez, R., Heene, A. & Thomas, H. (Eds.) 1996. Dynamics of competence-based competition: Theory and practice in the new strategic management. Elsevier, Oxford, UK.

20
Table 2: Components of competence90 Durand’s interpretation of Sanchez, Heene and Thomas’ categories
Durand’s categories Culture Organizational processes
Coo
rdin
ated
de
ploy
men
t
Management processes
Organization and processes for coordinated deployment of assets
Efficient processes
Structure
Explicit / Tacit Knowledge Individual/ collective Capabilities Skills
Cognitive capabilities
Brand names Intangible
Software Products Equipment
Res
ourc
es
Assets
Tangible Buildings
Stand-alone assets
Capabilities
Capabilities are a special category of intangible assets that impact the use of other
assets, tangible and intangible91. Amit and Schoemaker define capabilities as a firm’s
capacity to deploy resources to reach a certain goal, usually in combinations and through
organizational processes92. The goal can be, for example, to create, produce, and offer
products to a market. According to Sanchez et al., capabilities are repeatable patterns of
action in the use of assets93. Skill is defined as a special form of capability, usually
specialized in, and related to, the use of a specific asset94.
In this dissertation technological competence and the capability to execute chosen
strategies are treated as two separate resources. The latter is called operational
capability, and it consists of various capabilities complementing technological
competence. The operational capability in this dissertation is defined as a firm’s
capability to deploy its technological competence to gain competitive advantage through
marketable products in a specific product market. The operational capability can consist
90 Durand, T. 1997. Strategizing for innovation: Competence analysis in assessing strategic change.
In: Competence-based strategic management. Heene, A. & Sanchez, R. (Eds.) John Wiley & Sons. UK.
91 Sanchez, R., Heene, A. & Thomas, H. 1997. Introduction: towards the theory and practice of competence-based competition. In:Dynamics of competence-based competition. Pergamon, UK.
92 Amit, R. & Schoemaker, P. J. H. 1993. Strategic assets and organizational rent. Strategic Management Journal, Vol. 14, pp. 33-46.
93 Sanchez, R., Heene, A. & Thomas, H. 1997. Introduction: towards the theory and practice of competence-based competition. In:Dynamics of competence-based competition. Pergamon, UK.

21
of, for example, production, distribution, purchasing, marketing and sales and is often
product-market-specific. If a firm attempting to leverage its technologies in new
product-markets lacks the of applicable operational capability, it may be possible for the
firm to either build or acquire this capability or outsource certain activities, which will
often mean that parts of the operational capability are outsourced in some way.
2.3 Technology-based product market entries
According to the resource-based view, competence building is a process by which the
firm achieves qualitative changes in its existing stocks of assets or capabilities.
Maintaining a competence requires continuous adaptation to maintain an effective
coordinated deployment of assets under changing conditions. Competence leveraging,
on the other hand, means the application of existing competencies to current or new
markets in ways that do not require qualitative changes in firm’s assets and capabilities.
It may happen using the existing stocks of assets or by making quantitative changes in
stocks of like-kind assets. Competence leveraging means the exercise of one or more of
a firm’s existing options for action created by its prior competence building.95 In
practice, competence leveraging often also requires building of some new competencies.
In technology creating industries, inventions within generic technologies are leveraged.
According to Giget96, these are often inventions that can be patented. In technology
integrating industries, the capability to integrate certain kinds of technologies is
leveraged.97 98
This research uses the term “leveraging technology”. This term may be slightly
confusing as it may be read as suggesting that the technology would be under-utilized or
that the firm would be over-investing in research and development. This is, however,
not how leveraging technology is understood and used in this dissertation; here, when
94 Sanchez, R., Heene, A. & Thomas, H. 1997. Introduction: towards the theory and practice of
competence-based competition. In:Dynamics of competence-based competition. Pergamon, UK. 95 Sanchez, R., Heene, A. & Thomas, H. 1997. Introduction: towards the theory and practice of
competence-based competition. In:Dynamics of competence-based competition. Pergamon, UK. 96 Giget, M. 1997. Technology, innovation and strategy: recent developments. International Journal
of Technology Management, Vol. 14, Nos. 6/7/8, pp. 613-634. 97 Giget, M. 1997. Technology, innovation and strategy: recent developments. International Journal
of Technology Management, Vol. 14, Nos. 6/7/8, pp. 613-634.

22
used, the term leveraging technology merely means the same as “technology-based
growth”. Thus, in this dissertation, “leveraging technology” does not imply that firms
would be under-utilizing their technological competencies, or over-investing in research
and development.
Ford and Ryan have studied exploitation of technological assets99 100. They have
classified “marketing of technology” into three categories101: the use of technology in the
manufacture or design of a physical product, the marketing of a service such as design
or testing based on technology, and the sale of technology incorporated in licenses,
patents or, for example, a department. They believe that technological competence is
relatively under-exploited from the company and societal point of view and that
companies should have an explicit strategy for marketing their technologies. This
strategy should make use of all three types of technology marketing.102 Later, they103
have elaborated the idea of improving the rate of return to companies on their
technology investments by using the technology life cycle to illustrate marketing
technology as completely as possible during all stages of its life cycle. They promote the
use of highly specialized staff to plan a company’s technology marketing.
Roberts and Berry have written on market entries104, classifying market entries according
to how new and familiar the market is to the firm, and how new and familiar technology
is. They define newness of technology as the degree to which that technology has not
formerly been embodied within the products of the company. Newness of a market is
defined as the degree to which the products of the company have not previously been
targeted at that particular market. Familiarity with a technology is defined as the degree
98 Abetti, P. A. Convergent and divergent technological and market strategies for global leadership.
International Journal of Technology Management, Vol. 14, No. 6/7/8, pp. 635-657. 99 Ford, D. & Ryan, C. 1976. The marketing of technology. European Journal of Marketing, Vol. 11,
No. 6, pp. 369-382. 100 Ford, D. & Ryan, C. 1981. Taking technology to market. Harvard Business Review, March-April,
pp. 117-126. 101 Ford, D. & Ryan, C. 1976. The marketing of technology. European Journal of Marketing, Vol. 11,
No. 6, pp. 369-382. 102 Ford, D. & Ryan, C. 1976. The marketing of technology. European Journal of Marketing, Vol. 11,
No. 6, pp. 369-382. 103 Ford, D. & Ryan, C. 1981. Taking technology to market. Harvard Business Review, March-April,
pp. 117-126. 104 Roberts, E. B. & Berry, C. A. 1985. Entering new businesses: Selecting strategies for success.
Sloan Management Review, Spring, pp. 3-17.

23
to which knowledge of the technology exists within the company, but is not necessarily
embodied in the products. Familiarity with a market is defined as the degree to which
the characteristics and business patterns of the market are understood within the
company, but not necessarily as a result of participation in the market. The following
table shows the questions Roberts and Berry suggest for assessing the technological and
market familiarities.
Table 3: Roberts' and Berry's assessment of technological and market familiarity Tests of technological familiarity Tests of market familiarity
More familiar Is the technological capability used within the corporation without being embodied in products, for example required for component manufacture (incorporated in processes rather than products)?
Do the main features of the market relate to or overlap existing product markets, for example base and new products are both consumer products?
Do the main features of the new technology related to or overlap with existing corporate technological skills or knowledge, for example coating of optical lenses and aluminizing semiconductor substrates?
Does the company presently participate in the market as a buyer (relevant to backward integration strategies)?
Do technological skills or knowledge exist within the corporation without being embodied in products or processes, for example at a central R&D facility?
Has the market been monitored systematically from within the corporation with a view to future entry?
Has the technology been systematically monitored from within the corporation in anticipation of future utilization, for example by a technology assessment group?
Does knowledge of the market exist within the corporation without direct participation in the market, for example as a result of previous experience of credible staff?
Is relevant and reliable advice available from external consultants?
Is relevant and reliable advice available from external consultants?
Less familiar
Roberts and Berry then discuss alternative strategies of entry to markets with different
degrees of technology and market familiarity. The alternative entry strategies they
discuss are internal developments, acquisitions, licensing, internal ventures, joint
ventures or alliances, venture capital and nurturing, and educational acquisitions. With
regard to internal developments, Roberts and Berry state as its major advantage the use
of existing resources. Its major disadvantages, according to them, are the long time lag
in breaking even, as well as the potential errors due to unfamiliarity with new markets.
The time lag to break even has been found to be longer for internal corporate

24
developments than comparable businesses newly started by individuals105. Roberts and
Berry’s explanation of this is that the overhead allocation charges of large companies,
their attempts at large-scale entry, or objectives that preclude early profitability may
explain the delayed profitability of the ventures. Further to the potential problems in
internal development, it has also been suggested that forcing established attitudes and
procedures upon a new business might severely handicap it106. According to Roberts and
Berry, acquisitions offer a rapid market entry, but may lead to the new business area
being unfamiliar to the parent.
In addition to entering a new product market with a vertically integrated business model,
technology-based product market entries can also happen through, for example,
licensing the technology to other firms, or entering the new market with a business
model that makes extensive use of outsourcing. The sale of technology for example in
the form of patents can sometimes be an attractive way to leverage it, if licensing or
entry is not attractive. In addition, in some cases, joint ventures, spin-offs and
divestments of entire business units incorporating a certain technology can be attractive
ways of leveraging technology in certain areas.
105 Weiss, L. A. 1981. Start-up businesses: a comparison of performances. Sloan Management
Review, Fall, pp. 37-53. 106 Miller, S. S. 1963. The management problems of diversification. New York, John Wiley & Sons.

25
3 PREVIOUS RESEARCH ON TECHNOLOGY-BASED PRODUCT MARKET
ENTRIES
An important type of technology-based growth is technology-based diversification. The
earlier research conducted on technology-based diversification is a base for this study.
Other streams of research have studied technology-based product market entries from
different points of view. The research discussing new product development and
effectiveness of research and development investments are presented in this chapter.
3.1 Diversification research
In this chapter, diversification research is presented at three levels that are especially
relevant for the topic of the study. The first of these is general diversification research,
which builds up the basis and concepts of diversification research. The second is the
research on related diversification, which is closely linked to the resource-based view.
The third is technology diversification research, a part of which is especially relevant for
the current topic.
3.1.1 General diversification research
The pioneering works by Ansoff107, Penrose108, Gort109, Chandler110 and Rumelt111 on
corporate diversification mainly focused on product diversification and
internationalization. Diversity was defined as the extent to which firms were
simultaneously active in many distinctive areas, diversification thereby meaning the
process of increasing diversity.112
107 Ansoff, H. I. 1957. Strategies for diversification, Harvard Business Review, Volume 35, No. 5, pp.
113-124. 108 Penrose, E. 1959. The theory of the growth of the firm. Wiley & Sons, New York, USA. 109 Gort, M. 1962. Diversification and integration in the American industry. Princeton University
Press, Princeton, New Jersey, USA. 110 Chandler, A. D. 1962. Strategy and structure: Chapters in the history of the American industrial
enterprise. MIT Press, Cambridge, Massachusettes, USA. 111 Rumelt, R. P. 1974. Strategy, structure and economic performance. Harvard University Press,
Cambridge, Massachusettes, USA. 112 Ramanujan, V. & Varadarajan, P. 1989. Research on corporate diversification: A synthesis.
Strateic Management Journal, Vol. 10, pp. 523-552.

26
Product diversification means increasing the number of product-markets in which the
firm is active113 114 115. Market diversification means increasing the number of
geographical markets in which the firm is active116 117 118. A positive relationship has been
found between international market diversification, commonly measured in terms of
internationalization of market operations, and growth and profitability 119 120 121 122 123 124 125.
Internationalization offers additional demand often with no substantial requirements for
product alteration. Scale effects help increase profitability.
3.1.2 Related diversification research
Related diversification has been defined as diversification based on existing resources.
Judging industry relatedness by, for example, the commonly used industry
classifications can cause industries to be grouped as related that, in fact, have very few
shared resources.126 There is evidence that related diversification in many situations
113 Ansoff, H. I. 1957. Strategies for diversification, Harvard Business Review, Volume 35, No. 5, pp.
113-124. 114 Gort, M. 1962. Diversification and integration in the American industry. Princeton University
Press, Princeton, New Jersey, USA. 115 Berry, C. H. 1975. Corporate growth and diversification. Princeton University Press, Princeton,
New Jersey. 116 Ansoff, H. I. 1957. Strategies for diversification, Harvard Business Review, Volume 35, No. 5, pp.
113-124. 117 Gort, M. 1962. Diversification and integration in the American industry. Princeton University
Press, Princeton, New Jersey, USA. 118 Berry, C. H. 1975. Corporate growth and diversification. Princeton University Press, Princeton,
New Jersey. 119 Geringer, M. J., Beaish, B. W. & daCosta, R. C. 1989. Diversification strategy and
internationalization: implications for MNE performance. Strategic Management Journal, Vol. 10, pp. 110-119.
120 Granstrand, O. & Sjölander, S. 1992. Internationalization and diversification of multi-technology corporations. In: Granstrand, O., Håkansson, L. & Sjölander, S. (Eds). Technology management and international business. Wiley, London, UK.
121 Severn, A. K. & Laurence, M. M. 1974. Direct investment, research intensity, and profitability. Journal of Financial and Quantitative Analysis, Vol. 29, pp. 181-190.
122 Leftwich, R. B. 1974. U.S. multinational companies: profitability, financial leverage and effective income tax rates. U.S. Survey of Current Business, Vol. 54, May, pp. 27-36.
123 Wolf, B. M. 1977. Industrial diversification and industrialization: some empirical evidence. Journal of Industrial Economics, Vol. 26, pp. 177-191.
124 Rugman, A. M. 1979. International diversification and the multinational enterprise. Lexington Books, Lexington, Massachusettes, USA.
125 Caves, R. E. 1974. International trade, international investments and imperfect markets. Special Papers in International Economics, No. 10, Department of Economics, Princeton University.
126 Grant, R. M. & Jammine, A. P. 1988. Performance Differences Between The Wrigley / Rumelt Strategies. Strategic Management Journal, Chichester, Jul/Aug, Vol. 9, No. 4, pp. 333-347.

27
succeeds better than unrelated diversification127 128 129 130 131 132 133. To be able to
conclusively verify this, however, the choice of criteria for relatedness is crucial. This
choice has not always been made optimally. On the business unit level, market
relatedness seems to have a positive relationship with sales growth, while production
relatedness has been found related to high profitability.134 This is logical, as market
relatedness helps especially in the initial sales efficiency. Production relatedness brings
about scale effects, which helps reduce relative costs. The research on related
diversification strategies shares much with the resource-based view. Specifically, the
resource-based view has contributed significantly to theory building on related
diversification by providing theoretical explanations for the findings on the limitations
of diversified growth, motives for diversification, direction of diversification, and
performance of diversification.135 However, here the basic problem of resource-based
view of defining which resources are valuable limits the conclusiveness.
The explanation as to why related diversification tends to succeed better than unrelated
is that the wider the diversification, the more the resources not specific to the company
that can be expected to be employed. These resources earn lower returns than more
company-specific resources. A resource is suggested to loose more value when
transferred to markets that are less similar to the markets where the resource
originated.136 Related diversification should enhance performance especially when it
allows a business to obtain preferential access to strategic assets. It may be possible for a
127 Rumelt, R. P. 1974. Strategy, structure, and economic performance. Harvard University Press,
Cambridge, Massachusettes, USA. 128 Montgomery, C. A. 1979. Diversification, market structure, and performance: an extension of
Rumelt’s work. Doctoral dissertation, Purdue University. 129 Palepu, K. 1985. Diversification strategy, profit performance, and the entrophy measure. Strategic
Management Journal, Vol. 6, pp. 239-255. 130 Simmonds, P. G. 1990. The combined diversification breadth and mode dimensions and the
performance of large firms. Strategic Management Journal, Vol. 11, pp. 399-410. 131 Chatterjee, S. & Wernerfelt, B. 1991. The link between resources and the type of diversification –
theory and evidence. Strategic Management Journal, Vol. 12, pp. 33-48. 132 Singh, H. & Montgomery, C. 1987. Corporate acquisition strategies and economic performance.
Strategic Management Journal, Vol. 8, No. 4, pp. 377-386. 133 Bettis, R. 1991. Performance differences in related and unrelated diversified firms. Strategic
Management Journal, Vol. 2, No. 4, pp. 379-394. 134 Davis, P., Robinson, R., Pearce, J. & Park, S. 1992. Business unit relatedness and performance: a
look at the pulp and paper industry. Strategic Management Journal, Vol. 13, pp. 349-361. 135 Mahoney, J. T. & Panadian, J. R. 1992. The resource-based view within the conversation of
strategic management. Strategic Management Journal, Vol. 13, pp. 363-380.

28
diversified firm to use the experience it has accumulated in operating one of its
businesses to reduce the friction it would otherwise face in building new strategic assets
in other businesses.137 Findings on the relationship between related diversification and
performance have remained inconclusive138. The inconclusiveness of the empirical
findings has been explained from a theoretical perspective139 140 141 as well as on the basis
of measures used to define and measure relatedness in diversification142 143.
Firms diversify in part to utilize excess resources. Excess resources are not at the time
fully deployed in ongoing business. Physical resources, most knowledge-based
resources, and external financial resources seem to be associated with more related
diversification. Internal financial resources, on the other hand, are seen to be associated
with more unrelated diversification. An association has been suggested to exist between
intangible assets and related diversification.144 According to Peteraf145, high specificity of
expertise constrains firms from diversifying on the basis of this expertise far from their
original business. If they find new applications for their expertise, they are likely to get
high rents. In the same vein, she suggests that firms with less specific expertise may
have more diversification opportunities, but can be expected to get lower rents since the
136 Mahoney, J. T. & Panadian, J. R. 1992. The resource-based view within the conversation of
strategic management. Strategic Management Journal, Vol. 13, pp. 363-380. 137 Markides, C. C. & Williamson, P. J. 1996. Academy of Management Journal, Mississippi State,
April, pp. 340-. 138 Hoskisson, R. E. & Hitt, M. A. 1990. Antecedents and performance outcomes of diversification:
Review and critique of theoretical perspectives. Journal of Management, Vol. 16, pp. 461-509. 139 Christensen, H. K. & Montgomery, C. A. 1981. Corporate economic performance: Diversification
strategy versus market structure. Strategic Management Journal, Vol. 2, No. 4, pp. 327-343. 140 Prahalad, C. K. & Bettis, R. A. 1986. The dominant logic: A new linkage between diversity and
performance. Strategic Management Journal, Vol. 7, No. 6, pp. 485-501. 141 Jones, G. R. & Hill, C. W. L. 1988. Transaction-cost analysis of strategy- structure choice.
Strategic Management Journal, Vol. 9, No. 2, pp. 159-172. 142 Hoskisson, R. E. & Hitt, M. A. 1990. Antecedents and performance outcomes of diversification:
Review and critique of theoretical perspectives. Journal of Management, Vol. 16, pp. 461-509. 143 Nayyar, P. R. 1992. On the measurement of corporate diversification strategy: Evidence from large
U.S. service firms. Strategic Management Journal, Vol. 13, No. 3, pp. 219-235. 144 Chatterjee, S. & Wernerfelt, B. 1991. The Link Between Resources and Type of Diversification:
Theory and Evidence. Strategic Management Journal, Chichester, Jan, pp. 33-48. 145 Peteraf, M. 1993. The cornerstones of competitive advantage: A resource-based view. Strategic
Management Journal, Vol. 14, pp. 179-191.

29
resource is more abundant.146 Four ways in which the firm’s assets or strategic assets
can be further utilized through related diversification are listed:147
− “Amortization advantage”: related diversifiers can amortize the cost of an existing
asset by using it to serve multiple markets
− A strategic asset itself cannot be shared or transferred between two strategic
business units because it is market specific, but the competence gained in the
process of building and sustaining an existing strategic asset in one strategic
business unit can be used to improve the quality of an existing strategic asset at
another strategic business unit
− A core competence developed through the experience of building strategic assets in
existing business can be utilized to create a new strategic asset in a new business
faster or at a lower cost
− In the process of creating a new strategic asset required to support diversification
into a new business, the corporation learns new competencies that can be used to
enhance its existing strategic business units
In practice, a reason why it may be difficult to leverage technological innovations or
other competencies through other organizations is that the transaction costs related to
sales of technological competencies are high. This is due to, for example, uncertainty
about the performance of the technology, and the limited number of suppliers and
users.148
Measuring the relatedness of two markets
Relatedness of two markets has been measured in, amongst others, the following ways:
− Standard industry classification codes149
− Research and development intensity or advertising intensity, or others, as proxies for
underlying resources150
146 Peteraf, M. 1993. The cornerstones of competitive advantage: A resource-based view. Strategic
Management Journal, Vol. 14, pp. 179-191. 147 Markides, C. C. & Williamson, P. J. 1994. Related diversification, core competencies and
corporate performance. Strategic Management Journal, Vol. 15, pp. 149-165. 148 Bidault, F. & Fisher, W. A. 1994. Technology transactions: Networks over markets. R&D
Management, Vol. 24, No. 4, pp. 373-386. 149 Montgomery, C. A. & Wernerfelt, B. 1988. Diversification, Ricardian rents and Tobins q. Rand
Journal of Economics, Vol. 19, pp. 623-632.

30
− Types and proportions of human expertise151
− Technology inflow-outflow matrix: industry relatedness is the degree to which two
industries rely on the same inflows of technology152
− “The relative distance between the knowledge needed to operate in the new domain
and the degree of knowledge available in the current domain”153
Corporate coherence means the extent that a firm’s constituent businesses are related to
each other. An interesting finding by Teece et alii154 related to corporate coherence is
that as American manufacturing firms grow more diverse, they maintain a constant level
of coherence between neighboring activities. Firms with many activities are not
necessarily unrelated or incoherent. The boundaries of the corporation can be
understood in terms of learning, path dependencies, technological opportunities, the
selection environment, and the firm’s position in complementary assets.155
Measuring relatedness with the help of standard industry classification may exclude
cases where two businesses are strategically related. For example, many conglomerates
that are classified as having diversified into unrelated areas may exhibit a degree of
strategic similarity across their business units that relates them in a cognitive sense.156 157
A similar “dominant logic” may make the management of strategically similar
businesses within a firm easier than the management of strategically less similar
businesses. Dominant logic means the logic according to which managers conceptualize
their business and make critical resource allocation decisions. Essentially dominant
150 Montgomery, C. A. & Hariharan, S. 1991. Diversified expansion by large established firms.
Journal of Economic Behavior and Organization, Vol. 15, pp. 71-89. 151 Farjoun, M. 1994. Beyond industry boundaries: Human expertise, diversification and resource-
related industry groups. Organization Science, Vol. 5, No. 2, pp. 185-199. 152 Robins, J. & Wiersema, M. 1995. A resource-based approach to the multi-business firm: Empirical
analysis of portfolio inter-relationships and corporate financial performance. Strategic Management Journal, Vol. 16, No. 4, pp. 277-299.
153 Kazanjian, R. K. & Drazin, R. 1987. Implementing internal diversification: Contingency factors for organization design choices. Academy of Management Review, Vol. 12, No. 2, pp. 342-354.
154 Teece, D. J., Rumelt, R., Dosi, G. & Winter, S. 1994. Understanding corporate coherence: Theory and evidence. Journal of Economic Behavior and Organization, Vol. 23, pp. 1-30.
155 Teece, D. J., Rumelt, R., Dosi, G. & Winter, S. 1994. Understanding corporate coherence: Theory and evidence. Journal of Economic Behavior and Organization, Vol. 23, pp. 1-30.
156 Markides, C. C. & Williamson, P. J. 1996. Corporate diversification and organizational structure: a resource-based view. Academy of Management Journal, Vol. 39, pp. 340-367.
157 Prahalad, C. K. & Bettis, R. A. 1986. The dominant logic: a new linkage between diversity and performance. Strategic Management Journal, Vol. /, No, 6, pp. 485-501.

31
logic is a management mindset; when managers of different units have a similar mindset
that emphasizes similar strategic assets, the two units are “strategically related”. 158
Strategic relatedness has been in previous research operationalized based on categories
of strategic assets and then comparing different businesses’ perceptions of the
importance of these categories of assets. The categories used were customer assets such
as brand recognition and customer loyalty, and channel assets such as channel access
and pipeline stock. Further categories include input assets such as quality of suppliers
and financial capacity, process assets such as proprietary technology, and market
knowledge such as accumulated information on demand or market responses.159 160 161
Traditional measures of business relatedness are not helpful when searching for cases
where the strategic assets that offer important sources of long-run competitive advantage
are common across two businesses.162 Traditionally, relatedness of businesses is
analyzed in terms of similarities in products, markets, and technologies. Alternative –
and, for the purposes of diversification research, possibly more relevant –
conceptualizations of relatedness are presented in the following list, which includes the
most important criteria used by a sample of nearly 200 managers.163
158 Prahalad, C. K. & Bettis, R. A. 1986. The dominant logic: a new linkage between diversity and
performance. Strategic Management Journal, Vol. /, No, 6, pp. 485-501. 159 Verdin, P. J. & Williamson, P. J. 1994. Core competence, competitive advantage and market
analysis: forging the links. In: Hamel, G. & Heene, A. (Eds.) Competence-Based Competition. Wiley, New York, USA.
160 Markides, C. C. & Williamson, P. J. 1996. Corporate diversification and organizational structure: a resource-based view. Academy of Management Journal, Vol. 39, pp. 340-367.
161 Tsai, W. 2000. Social capital, strategic relatedness and the formation of interorganizational linkages. Strategic Management Journal, Vol. 21, pp. 925-939.
162 Markides, C. C. & Williamson, P. J. 1996. Academy of Management Journal, Mississippi State, April, pp. 340-.
163 Stimpert, J. L. & Duhaime, I. M. 1997. In the eyes of the beholder: conceptualizations of relatedness held by the managers of large diversified firms. Strategic Management Journal, Vol. 18:2, pp. 111-125.

32
Table 4: Different conceptualizations of relatedness
Businesses share customers
Businesses require same raw materials
Businesses share manufacturing processes Product-market relatedness
Businesses share distribution network
Businesses have strong brand names
Businesses emphasize new product development
Businesses emphasize product design Differentiation relatedness
Businesses emphasize research and development
Furthermore, relatedness of two businesses can be assessed by evaluating the relatedness
of the strategic assets in each. Some possible types of relatedness for strategic assets are
listed in the following: 164
1 Customer assets: The nature of interactions with customers is an important
determinant of the types of assets necessary to effectively serve a market, and can be
measured, for example, in terms of media expenditures and frequency of purchase.
2 Channel assets: Imperfectly tradable assets that provide a basis for competitive
advantage by improving the flow of physical product, service, and marketing
information through the channels between manufacturers and users. These include
relationships with networks of third-party distributors as well as marketing
infrastructures through which manufacturers can communicate directly with users.
Channel assets can be measured through for example channel dependence and
amount of push marketing.
3 Process experience assets: Superior process capabilities can open the way for a
company to go beyond a basic, standard product to offer high-quality, differentiated
specifications or to respond to the particular needs of individual customers. These
process capabilities range from research and development and design skills to
competencies in flexible manufacturing, and can be measured at industry skill level.
164 Markides, C. C. & Williamson, P. J. 1996. Academy of Management Journal, Mississippi State,
April, pp. 340-.

33
3.1.3 Technology diversification research
Kodama165, Pavitt et al.166, and Granstrand & Sjölander167 set the basis for the
conceptualization and operationalization of technology-based diversification.
Granstrand168 formulates, in his words, a first draft of a theory of a technology-based
firm. He attempts to explain strategies and growth paths of technology-intensive firms
better than previous explanations have managed to do. He especially attempts to clarify
the role of technology and the role of management169. The main idea of Granstrand’s
theory is that the high investments required to develop new technological competencies
create an incentive to leverage these competencies as widely as possible, or to find ways
to reduce investments. Reducing the investments is possible through research and
development rationalization and technology-related partnering, among others. These
writings create a good foundation for understanding technology-based diversification. In
this chapter, first the concept of technological opportunity set and its impact on
diversification is reviewed. Then, three studies explaining the success of product
diversification on the basis of an existing technology base are discussed.
Technological opportunity set and diversification
Progress of science and technology has been claimed to expand the set of technological
opportunities170 171. Relatively recent examples of such progress are the rapid
development of information technology, biotechnology, automation technology, and
new materials. Furthermore, the possibilities for combining these technologies give rise
to an expanding set of new opportunities. On the firm level, exploiting these new
165 Kodama, F. 1986. Technological diversification of Japanese industry. Science, July, pp. 291-296. 166 Pavitt, K., Robson, M. & Townsend, J. 1989. Technological accumulation, diversification and
organization in UK companies 1945-1983. Management Science, Jan. 167 Granstrand, O. & Sjölander, S. 1990. Managing innovation in multi-technology corporations.
Research Policy, Feb. 168 Granstrand, O. 1998. Towards a theory of the technology-based firm. Research Policy, Sep, pp.
465-489. 169 For typical representations of technology and management in theories of the firm, see Granstrand,
O. 1998. Towards a theory of the technology-based firm. Research Policy, Sep, pp. 465-489. 170 Coombs, R., Saviotti, P. & Walsh, W. 1987. Economics and technological change. MacMillian
Education, London, UK. 171 Jaffe, A. B. 1989. Characterizing the “Technological position” of firms, with application to
quantifying technological opportunity and research spillovers”. Research Policy, Vol. 18, pp. 87-97.

34
opportunities often requires widening a firm's technology base.172 One of the
fundamental reasons for technology diversification is the expanding technological
opportunity set. It has been proposed that technological and market opportunities may
vary systematically according to technological area173 174 175.
According to Granstrand, increased technological opportunities can lead to sales growth
through at least three different ways as listed below176. This can be compared to the
previously discussed growth strategies pointed out by the research on related
diversification, which focus on utilizing the existing opportunities.
− Static economies of scale, that is, using the same technology in different products
with minor adaptation costs. Static economies of scale are significant when a
technology has a wide applicability to many different areas in a corporation, for
example, in the case of generic technologies.
− Dynamic economies of scale achieved through improving knowledge through
multiple applications
− Cross-fertilization of technologies yielding new inventions, new functionalities, as
well as increased product performance and better processes
Product diversification to utilize existing technology base
In an attempt to justify the high costs of research and development, firms have sought
different means of leveraging research and development investments more extensively.
Product diversification has been suggested to pose the highest requirements for
managerial resources177. Reasons for this may be the requirements of product
diversification for new market knowledge as well as new applications of technology.
172 Oskarsson, C. 1993. Technology diversification: The phenomenon, its causes and effects.
Chalmers University of Technology, Göteborg, Sweden. 173 Jaffe, A. 1989. Characterizing the technological position of firms with application to quantifying
technological opportunity and research spillovers. Research Policy, Vol. 18, pp. 87-97. 174 Rosenberg, N. 1984. Science, invention and economic growth, Economic Journal. 175 Scherer, F. M. 1980. Industrial market structure and economic performance. 2nd edition.
Cambridge, Massachusettes. 176 Granstrand, O. 1998. Towards a theory of the technology-based firm. Research Policy, Sep, pp.
465-489. 177 Granstrand, O. 1998. Towards a theory of the technology-based firm. Research Policy, Sep, pp.
465-489.

35
The causal relationship between diversification and growth has been researched. The
results indicate that technology-based diversifying firms grow more than other
diversifying firms do178. Different types of diversifying firms were classified the
following way:179
− Firms diversifying their business based on their technology base: technology
diversification is followed by product diversification and internationalization
− “Stick to the knitting”: technology diversification followed by internationalization or
product diversification, or internationalization followed by product specialization
− Market specializers: increased technology diversification followed by product
diversification, and then followed by market specialization
− Defenders: specialize both product-wise and market-wise, and sometimes even
technology-wise
Technology diversification may lead to product diversification. Oskarsson found
product diversification to be probably the most important driver of above average
growth. Initial technology diversification may open up possibilities for product
diversification in areas not initially targeted. Realizing these opportunities may require
additional technology diversification, which can lead to additional opportunities.
Increased technology diversification can thus cause increased research and development
expenditures, which can be a reason for increased product diversification.180 181 Overall,
according to over 20 case studies of European, American and Japanese firms, the fastest
growth seemed to be created by first diversifying the technology base, and subsequently
entering new product markets and internationalizing.182
178 Sjölander, S. & Oskarsson, C. 1995. Diversification: exploiting the flow of technology. A Swedish
comparison. International journal of technology management, Vol. 10, no. 1., pp. 21-30. 179 Sjölander, S. & Oskarsson, C. 1995. Diversification: exploiting the flow of technology. A Swedish
comparison. International journal of technology management, Vol. 10, no. 1., pp. 21-30. 180 Oskarsson, C. 1993. Diversification and growth in US, Japanese and European multi-technology
corporations. Department of Industrial Management and Economics, Chalmers University of Technology, Göteborg.
181 Granstrand, O. 1998. Towards a theory of the technology-based firm. Research Policy, Sep, pp. 465-489.
182 Oskarsson, C. 1993. Technology diversification: The phenomenon, its causes and effects. Chalmers University of Technology, Göteborg, Sweden.

36
Silverman183 has studied product diversification from the viewpoint that firms diversify
to exploit their existing resource base. The hypotheses were tested on a sample of
several hundreds of companies in the USA. The aim was to clarify reasons for
diversifying. One factor used to explain diversification was the absolute and relative
technological resource applicability. This factor influenced which markets the firms
entered and the order in which they entered them. Technological resources were
operationalized at a more detailed level than in prior studies, and it could be shown that
the predictive power of the resource-based view of the firm can be greatly improved
when resources are measured at a finer level. Another factor used to explain
diversification was the contractual hazards. They were found to influence the choices
between a hierarchical or market mode of entry. Principles from transaction cost
economics were integrated into resource-based predictions concerning diversification to
test the common assumption that rent-generating resources are too asset-specific to
allow contracting. As a result, Silverman identified circumstances where resources can
be, and are, exploited through contracting, rather than through diversification. Similar
research regarding resource exploitation through diversification would be needed.
3.2 Research on new product development
Research on new product development is relevant to understanding technology-based
product-market entries because these entries often require the development of a new
product. A reason for the need for a new product is that a firm’s existing products are
often not suited for serving the needs of the new markets, which it wants to enter.
Following Krishnan and Ulrich184, new product development is here defined as a
transformation of a market opportunity into a product available for sale. New product
development has been widely discussed in fields as varied as marketing, organizations,
operations management, and engineering design.
183 Silverman, B. S. 1999. Technological resources and the direction of corporate diversification:
toward an integration of the resource-based view and transaction cost economies. Management Science, pp. 1109-1124.
184 Krishnan, V. & Ulrich, K. T. 2001. Product development decisions: A review of literature. Management Science, January, Vol. 47, No. 1, pp. 1-21.

37
According to a meta-analysis of previous empirical research on new product
performance185, a wide range of antecedent factors can influence the outcomes of new
product development activity. The meta-analysis reveals a wide variety of study designs
and methodological approaches. A wide variation in results was also found. Although
some consistency as to which factors are considered by researchers was revealed, the
range of factors considered in each study was found to be narrow.
An approach that seems fruitful for integrating the antecedent factors that seem to
influence new product development outcomes is conceptualizing new product
development as a decision-making process, as opposed to concentrating on
environmental and contextual decisions186. This “decision perspective” on new product
development describes product development in a way that is both comprehensive and
parsimonious because it cuts across the functional perspectives without getting involved
in the mechanics of how decisions are made187. An assumption underlying this
perspective is that an organization manages uncertainty through information
processing188 189.
Product development decisions can be organized into two broad categories190: decisions
made within the context of a single project in actually developing the product and
decisions in establishing an organizational context and in planning development
projects. In their literature review, Krishnan and Ulrich191 have used this categorization
as the basic framework to further classify previous empirical research in order to
provide an overview of what is known about new product development. They classify
the previous research under decisions that need to be made in different phases of new
185 Montoya-Weiss, M. M. & Calantone, R. 1994. Determinants of new product performance: A
review and meta-analysis. The Journal of Product Innovation Management, Nov, Vol. 11, No. 5, pp. 397-417.
186 Krishnan, V. & Ulrich, K. T. 2001. Product development decisions: A review of literature. Management Science, January, Vol. 47, No. 1, pp. 1-21.
187 Whetten, D. A. 1993. What constitutes a theoretical contribution. Academy of Management Journal, No. 14, No. 4, pp. 490-495.
188 Thompson, J. D. 1967. Organizations in Action. McGraw Hill, New York, USA. 189 Galbraith, J. R. 1977. Organization Design. Addison-Welsley Publishing Company, Reading, MA,
USA. 190 Hultink, E. J., Griffin, A., Hart, S. & Robben, H. S. J. 1997. Industrial new product launch
strategies and product development performance. Journal of Product Innovation Management, June, Vol. 14, pp. 243-257.
191 Krishnan, V. & Ulrich, K. T. 2001. Product development decisions: A review of literature. Management Science, January, Vol. 47, No. 1, pp. 1-21.

38
product development. Decisions within a project as categorized by Krishnan and Ulrich
in their literature review are listed in Appendix 1. This is an exhaustive summary of the
previous research and points out that new product decisions have not previously been
studied from the managerial perspective of this dissertation.
Of the phases of decision-making in new product development, the previous research on
concept development is most relevant for the present research. Concept development is
addressed by research on attribute-based assessing of customer needs192, which suggests,
for example, conjoint analysis as a structured approach to optimally determine the target
values of product attributes. Here, it is to be kept in mind that the embodiment of
attributes into a technological approach must also be addressed in concept design193.
Decisions in setting up a project as categorized by Krishnan and Ulrich in their literature
review are also listed in Appendix 1. High-level product strategy and planning are
important decisions influencing setting up a new product development project. A firm’s
target market, product mix, project prioritization, resource allocation, and technology
selection have a significant influence on the probability of economic success194. In
deciding which product opportunities to pursue, a possible mistake is to focus on only
the markets where the company is already present: data from the disk drive industry has
been used to show that previously successful firms often fail to recognize technological
or market shifts, because product planning is biased toward existing markets195.
The results of an empirical study of 120 completed development projects for assembled
goods by Tatikonda and Montoya-Weiss196 show that organizational process factors are
associated with achievement of operational outcome targets for product quality, unit
cost, and time-to-market. The organizational process factors measured in the study were
process concurrency, process formality, and process adaptability. Process concurrency
192 Griffin, A. & Hauser, J. R. 1993. The voice of the customer, Marketing Science, Winter, Vol. 12,
pp. 1-27. 193 Krishnan, V. & Ulrich, K. T. 2001. Product development decisions: A review of literature.
Management Science, January, Vol. 47, No. 1, pp. 1-21. 194 Mansfield, M. V. & Wagner, K. 1975. Organizational and strategic factors associated with
probabilities of success in industrial R&D. Journal of Business, Vol. 48, pp. 179-198. 195 Christensen, C. M. & Bower, J. L. 1996. Customer power, strategic investment, and the failure of
leading firms. Strategic Management Journal, March, Vol. 17, pp. 197-218.

39
refers to the degree of simultaneity in the design engineering and manufacturing
engineering efforts. Process formality refers to existence of an overall organizational
process and structure of the project. Process adaptability refers to flexibility during the
project to meet emerging circumstances, and represents discretion available to the
project management. Operational outcomes that were measured were product quality,
unit cost, and time-to-market. Achievement of operational outcomes was found to aid
achievement of market outcomes. Measured market outcomes were customer
satisfaction and relative sales. The findings were robust under conditions of
technological, market and environmental uncertainty. 197
It was also hypothesized that technology novelty would moderate the relationship
between all three process factors and operational outcomes. These hypotheses did not
however receive support. It was not considered that technology novelty could also
impact market outcomes directly through new product features, customers’ perceptions
of functional and feature quality, and marketing and sales personnel’s lack of knowledge
of the new technology and its features. Measures of operational outcomes such as
product quality, unit cost, and time-to-market do not measure the success of the product
in the market. Technology novelty can impact market outcomes as well. The
relationship of technology novelty and market outcomes was not tested. Market newness
was not found to moderate the relationship between operational outcomes and market
outcomes.198
The relationship of research and development investments to firm performance has been
the subject of much research. It seems to have been confirmed that research and
development investments, with some time lag, increase performance199 200: specifically
196 Tatikonda, M. V. & Montoya-Weiss, M. M. 2001. Integrating operational and marketing
perspectives of product innovation: The influence of organizational process factors and capabilities on development performance. Management Science, January, Vol. 47, No. 1, pp. 151-172.
197 Tatikonda, M. V. & Montoya-Weiss, M. M. 2001. Integrating operational and marketing perspectives of product innovation: The influence of organizational process factors and capabilities on development performance. Management Science, January, Vol. 47, No. 1, pp. 151-172.
198 Tatikonda, M. V. & Montoya-Weiss, M. M. 2001. Integrating operational and marketing perspectives of product innovation: The influence of organizational process factors and capabilities on development performance. Management Science, January, Vol. 47, No. 1, pp. 151-172.
199 Ettlie, J. E. 1998. R&D and global manufacturing performance. Management Science, Jan, pp. 1-11.
200 Lichtenberg, F. R. & Siegel, D. 1991. The impact of R&D investment on productivity – new evidence. Economic Inquiry, Long Beach, Apr, pp. 203-230.

40
growth201 202 as well as likelihood of maintaining market share203. However, also
disconfirming results exist204 205.
Many researchers have investigated which factors moderate the relationship of research
and development investments and growth. Factors that have been confirmed to have
such a moderating impact are whether and how the firm is diversified206 207 208 209 210, and
what its technology strategy is like. In these studies, technology strategy has been
defined merely as the targeting of research and development investments and
management of research and development, not taking into consideration strategies for
commercializing technological competence211 212 213. More specifically, technology
strategy has been defined as matching research and development to market needs,
decreasing time to market for new products, and the management of research and
development with constrained resources. Indeed, it has been pointed out that research
and development strategy should be linked to overall corporate strategy, but no concepts
201 Morbey, G. K. & Reither, R. M. 1990. How R&D affects sales growth, productivity, and
profitability. Research Technology Management, Washington, May / Jun, pp. 11-15. 202 Bean, A. S. 1995. Why some R&D organizations are more productive than others. Research
Technology Management, Washington, Jan / Feb, pp. 25-37. 203 Franko, L. G. 1989. Global corporate competition: Who’s winning, who’s losing. Strategic
Management Journal, Chichester, Sep / Oct, pp. 449-475. 204 Morbey, G. K. 1988. R&D: Its relationship to company performance. The Journal of Product
Innovation Management, New York, Sep, pp. 191-209. 205 Morbey, G. K. 1989. R&D expenditures and profit growth. Research Technology Management,
Washington, May / Jun, pp. 20-24. 206 Hoskisson, R., Hitt, E. & Michael, A. 1988. Strategic control systems and relative R&D investment
in large multidivisional companies. Strategic Management Journal, Chichester, Nov / Dec, pp. 605- 207 Baysinger, B. & Hoskisson, R. 1989. Diversification strategy and R&D intensity in multiproduct
firms. Academy of Management Journal, Mississippi State, June, pp. 310-332. 208 Meyer, M. H. & Roberts, E. B. 1988. Focusing product technology for corporate growth. Sloan
Management Review, Cambridge, Summer, pp. 7-10. 209 Meyer, M. H. & Roberts, E. B. 1986. New product strategy in small technology-based firms: A
pilot study. Management Science, Providence, July, pp. 806-822. 210 Hitt, M. A., Hoskisson, R. E. & Hicheon, K. 1997. International diversification: Effects on
innovation and firm performance in product-diversified firms. Academy of Management Journal, Mississippi State, August, pp. 767-798.
211 Bean, A. S. 1995. Why some R&D organizations are more productive than others. Research Technology Management, Washington, Jan/Feb, pp. 25-37.
212 Bean, A. S., Einolf, K. & Russo, M. J. 1999. Benchmarking your R&D: Results from IRI/CIMS annual R&D survey for FY ’97. Research Technology Management, Washington, Jan/Feb, pp. 24-34.
213 Bean, A. S., Russo, M. J. & Whiteley, R. L. 2000. Benchmarking your R&D: Results from IRI/CIMS annual R&D survey for FY ’98. Research Technology Management, Washington, Jan/Feb, pp. 16-24.

41
have been presented as to how this can be achieved. 214 A construct named the “overall
R&D managerial capability” has been shown to be related to sales growth. This
capability was defined as research and development meeting its project-level objectives
and schedule, technical performance and budgeted cost. It has been pointed out that in
order to uncover relationships between technology measures and profitability, the
intervening variables at the level of strategy development and implementation should be
taken into account.215 The impact of organizational form as well as control and incentive
systems on research and development investments and innovation has also been
researched. 216 217 218
Based on their extensive literature review, Krishnan and Ulrich219 suggest several topics
for further research within new product development. In their view, product planning
decisions and development metrics seem particularly ad hoc in industrial practice. Only
a few research results seem to provide answers to the question of how to integrate the
efficiency issues associated with the use of product platforms with the market benefits
of high product variety. They see an opportunity to bring together market, product and
process considerations on the decision of what products to develop, when and with what
level of sharing resources. Product definition, development, launch and management are
highly contingent on market uncertainty and other environmental characteristics220.
Tatikonda and Montoya-Weiss221 identify fruitful future areas for research on new
product development. According to them, future research is needed to incorporate other
214 Roberts, E. B. 1995. Benchmarking the strategic management of technology – I. Research
Technology management, Washington, Jan / Feb, pp. 44-. 215 Roberts, E. B. 1995. Benchmarking the strategic management of technology – II. Research
Technology management, Washington, Mar / Apr, pp. 18-. 216 Hoskisson, R. E. & Hitt, M. A. 1988. Strategic control systems and relative R&D investment in
large multiproduct firms. Strategic Management Journal, Vol. 9, pp. 605-621. 217 Hitt, M. A., Hoskisson, R. E., Johnson, R. A. & Moesel, D. D. 1996. The market for corporate
control and firm innovation. Academy of Management Journal, Mississippi State, October, pp. 1084-1119.
218 Hoskisson, R. E., Hitt, M. A. & Hill, C. W. L. 1993. Managerial incentives and investment in R&D in large multiproduct firms, Organization Science, May, pp. 325-342.
219 Krishnan, V. & Ulrich, K. T. 2001. Product development decisions: A review of literature. Management Science, January, Vol. 47, No. 1, pp. 1-21.
220 Brown, S. L. & Eisenhardt, K. M. 1995. Product development: Past research, present findings, and future directions. Academy of Management Review, April, Vol. 20, pp. 343-378.
221 Tatikonda, M. V. & Montoya-Weiss, M. M. 2001. Integrating operational and marketing perspectives of product innovation: The influence of organizational process factors and capabilities on development performance. Management Science, January, Vol. 47, No. 1, pp. 151-172.

42
important antecedents to development performance, such as product portfolio
composition, project leader characteristics, project task characteristics such as project
complexity, competitive market intelligence, market orientation, market attractiveness,
resource uncertainty, and competitive intensity. In addition, Tatikonda and Montoya-
Weiss suggest that the uncertainty variables of their research should be examined in
greater detail. They suggest that the focus of future research should be re-directed
towards project planning. They emphasize the importance of project planning because
this is when organizational process factors and operational outcome targets are set,
technology alternatives are investigated, and important product market choices are
made. The variety and magnitude of uncertainties a development project faces in its
execution are a function of choices made in project planning. The organizational process
factors and the desired target levels of development outcomes are key managerial
decision variables. Therefore, according to Tatikonda and Montoya-Weiss, future
research is needed to investigate who in the organization makes these decisions, and the
nature of their influence on the decision-making process.
3.3 Summary of previous research on technology-based product market entries
Technology-based product market entries have been previously researched from several
perspectives. Diversification research has attempted to identify successful growth paths
through leveraging technology in new product and geographical markets. An important
notion that has been established in the resource-based research on related diversification
is that the relatedness of two markets is more accurately defined by the relatedness of
the resources employed in the industries than by the commonly used industry
classification-based measures. This is an important finding, the application of which has
the potential of enhancing the conclusiveness of the findings of future diversification
research, as well as of the present research, as market relatedness is one of the most
important concepts of diversification research. New product development research has
discovered many antecedents to outcomes of product development, thereby supporting
the research of technology-based product market entries, as technology-based product
market entries are in many cases achieved through development of new products.
These streams of research have clarified many aspects of technology-based product
market entries, yet they leave important questions unanswered. Until now,

43
diversification research has concentrated mainly on trying to explain companies’ growth
paths as can be seen in their presence in industry classification code groups, which may
ignore very closely related diversification or technology leveraging222. In addition, even
diversification research with a resource-based perspective has mainly concentrated on
topics that can be researched with the help of large, existing databases223. For this
reason, internal company management, competence, and organizational factors as
antecedents to diversification choices and success have not yet received as much
attention as they would deserve.
222 Silverman, B. S. 1999. Technological resources and the direction of corporate diversification:
toward an integration of the resource-based view and transaction cost economies. Management Science, pp. 1109-1124.
223 Silverman, B. S. 1999. Technological resources and the direction of corporate diversification: toward an integration of the resource-based view and transaction cost economies. Management Science, pp. 1109-1124.

44
4 RESEARCH APPROACHES
Two research approaches, the resource-based view and decision-making research, will
be discussed in this chapter as a basis for understanding factors affecting leveraging of
technology in new product markets. Some of the main theoretical arguments of the
resource-based view highlight the importance of managerial resources for achieving
growth. Other factors proposed by the resource-based view as important determinants of
growth are knowledge concerning growth opportunities and risk and uncertainty related
to individual growth projects. The success of individual projects is important, not only
for the sake of growth from an individual project, but also for decreasing the perceived
risk and uncertainty and thus encouraging managers to undertake more of such projects.
Furthermore, often the growth projects form a basis for further growth projects. The
importance of these factors is closely linked to the importance of managerial resources.
The way that managerial resources concretely impact is through decision-making;
strategic decision-making processes are incorporations of managerial services. Decision-
making researchers have modeled strategic decision-making processes and their impact
on outcomes of projects. In Sections 1 and 2 the theoretical arguments based on the
resource-based view and decision-making research leading to the hypotheses are
presented. In Section 3, the hypotheses are summarized and a model of factors affecting
technology-based product market entries in new markets is presented.
4.1 Resource-based view
The traditional industrial organization approach to strategy research has as its basic
assumption that the industry requirements determine which resources are needed to
compete. In contrast, the resource-based view takes the resources of a firm as the
starting point and attempts to identify the most attractive industries for their
deployment. Resources are considered more difficult and time-consuming to develop
and imitate than market-specific knowledge. Especially with regard to unstable
environments, proponents of the resource-based view argue that firm-specific resources

45
and capabilities provide a more durable basis for strategy formulation than product-
market positioning224. Furthermore, a central difference in comparison to the industrial
organization approach is that within the resource-based view it is seen that an
entrepreneur has the possibility of altering the environmental conditions into his or her
favor225. The main explanation for performance differences between firms is that
competitive advantage arises from the fact that resources are heterogeneously distributed
among firms and resources differ in their potential to generate rents for the firm226.
Imperfect transplantability of resources has been proposed to constrain their leveraging.
This means that it may not always be possible to utilize a resource in a new market. The
imperfect transplantability may be due to a characteristic of a resource that ties it to the
original use. Another reason may be extensive investments required for applying a
resource to another use. These investments may take the form of building extensive new
operational capabilities, for example. Transplantability is also weakened by the
managerial inability to perceive opportunities for wider utilization of the resource. 227
Edith Penrose228, to whom the birth of the resource-based view is attributed, described
many of the central ideas. Her main propositions were that a firm is a collection of
material and human productive resources and administrative tasks, and firm growth is a
process of using these resources to exploit the “productive opportunity”, and to increase
the resource base. The existing resource base and the availability of managerial and
entrepreneurial capacity limit growth. Specialization is necessary for the process of
growth, and causes a need for even further growth and diversification to fully utilize the
unused production capacity.
224 Grant, R. 1991. The resource-based theory of competitive advantage: Implications for strategy
formulation. California Management Review, Vol. 33, No. 3, pp. 114-135. 225 Penrose, E. 1972 (orig. publ. 1959). The theory of the growth of the firm. Basil Blackwell and
Mott, Oxford, 5th edition. 226 Peteraf, M. 1993. The cornerstones of competitive advantage: A resource-based view. Strategic
Management Journal, Vol. 14, No. 3, pp. 179-191. 227 Penrose, E. 1972 (orig. publ. 1959). The theory of the growth of the firm. Basil Blackwell and
Mott, Oxford, 5th edition. 228 Penrose, E. 1972 (orig. publ. 1959). The theory of the growth of the firm. Basil Blackwell and
Mott, Oxford, 5th edition.

46
Wernerfelt229 and Rumelt230 re-surfaced the view of firms as collections of resources
rather than sets of product-market positions, and launched the term “resource-based”.
Wernerfelt described the firm’s operations in terms of resource-position barriers and
resource-product matrices. Rumelt studied unique resources and management’s
criticality. Within the evolutionary economics research stream, Nelson and Winter
clarified the context for the resource-based view by describing the evolutionary
processes through which resources are born231. Barney232 coined some of the assumptions
of the resource-based view that became fundamental for much of the research to follow.
These include the arguments that resources can produce a competitive advantage if they
are rare and valuable, and that this competitive advantage can be sustained if the
resources are inimitable, non-substitutable, and imperfectly transferable. A newer
research stream has focused on the interdependencies between competencies instead of
single resources or capabilities233 234 235.
Despite its wide acceptance among strategy researchers, the resource-based view has
recently been criticized for a lack of rigorous theory-building236 and tautological
definitions237. The most severe problem seems to be defining a resource without
referring to performance, which causes the accusations of tautology. Some researchers
have attempted to clarify the core concepts by applying definitions and drawing parallels
from other, more established theories. An example of such an attempt is Williamson’s
comparison of “governance and competence perspectives”238. He uses the bounded
229 Wernerfelt, B. A. 1984. Resource-based view of the firm. Strategic Management Journal, Vol. 5,
pp. 171-180. 230 Rumelt, R. P. 1984. Toward a strategic theory of the firm. In: Lamb, R. B. (Ed.) Competitive
strategic management. Prentice-Hall, Englewood Cliffs, NJ, USA. 231 Nelson, R. & Winter, S. 1982. An evolutionary theory of economic change. The Belknap Press of
Harvard University Press, Cambridge, Massachusettes, USA. 232 Barney, J. 1991. Firm resources and sustained competitive advantage. Journal of Management,
Vol. 17, No. 1, pp. 99-120. 233 Heene, A. & Sanchez, R. (Eds.) Competence-based strategic management. Chichester, Wiley. 234 Sanchez, R. & Heene, A. (Eds.) Strategic learning and knowledge management. Chichester, Wiley. 235 Sanchez, R., Heene, A. & Thomas, H. (Eds.) 1996. Dynamics of competence-based competition.
Oxford, Elsevier Science. 236 Priem, R. L. & Butler, J. E. 2001. Is the resource-based “view” a useful perspective for strategic
management research? Academy of Management Review, January, Vol. 26, No. 1, pp. 57-66. 237 Priem, R. L. & Butler, J. E. 2001. Tautology in the resource-based view and the implications of
externally determined resource-value: Further comments. Academy of Management Review, January, Vol. 26, No. 1, pp. 22-40.
238 Williamson, O. E. 1999. Strategy research: Governance and competence perspectives. Strategic Management Journal, Vol. 20, pp. 1087-1108.

47
rationality concept from behavioral theory of the firm to characterize the human actors
of the resource-based view, and, as the unit of analysis, he compares the concept of
routines from evolutionary theory with the resources of the resource-based view.
According to Williamson, the resource-based view “rejects the idea of the firm as a
production function and emphasizes management and organization features instead”.
4.1.1 Firm level constraints to growth
Penrose has in her classic book “The theory of the growth of the firm” taken a holistic
look at the firm level constraints to growth. She states the following as the main
constraints: a firm’s productive opportunity, managerial resources, risk and uncertainty,
and complex impacts of firm size and previous firm growth. According to Penrose,
managerial services are the most important determinant of firm growth. Management
chooses, plans, implements and controls the opportunities that lead to the growth of the
firm. With managerial resources is here meant the number of managers, whereas
managerial services means the services the managers are able to provide for the firm,
which is a function of both the number and knowledgeability of the managers. Penrose
points out that managerial services available for growth are the total managerial services
available to a firm minus the managerial services required for operating the firm in
existing circumstances. In large firms, the total planning task is so extensive that
specialized personnel can be continuously occupied with planning.239 Managerial
services available for growth set a limit to how much growth can be planned because all
growth plans absorb some of the managerial services available. The amount of growth
limits the amount of new personnel that can be profitably absorbed during the next
period. 240
Growth of managerial services determines the fastest possible pace of growth of a firm.
The reason for this is that essentially all other resources can be increased at a faster
pace. Managerial services can be increased only at a restricted pace because the
“managerial resource” providing the services is not just a sum of individual managers,
239 Penrose, E. 1972 (orig. publ. 1959). The theory of the growth of the firm. Basil Blackwell and
Mott, Oxford, 5th edition. 240 Penrose, E. 1972 (orig. publ. 1959). The theory of the growth of the firm. Basil Blackwell and
Mott, Oxford, 5th edition.

48
but a team. The members of this team must be able to trust each other and coordinate
activities efficiently with each other. New managers cannot successfully be hired at just
any targeted fast growth rate, but limits of learning and integration are even more
important than for other resource acquisitions.241
Within the resource-based view, several empirical studies have touched upon issues and
phenomena closely related to technology-based product market entries. These have most
often been studies within research on related diversification. The operationalization of
the resource-based view of diversification has been limited to broad categorizations of
resources and the industries in which they might be applicable, while the management
or processes of diversification lack research242. Therefore, the resource-based view of
diversification could be enhanced with a better understanding of the role of managerial
resources in the process of growth.
Finding growth opportunities that are large relative to firm size would seem likely to get
more difficult as the firm grows. Large firms are likely to have a wider range of
complementary capabilities to support the implementation of the projects, and may
therefore succeed better in implementing them. Firms with a high growth orientation in
terms of high past growth and high growth aspiration are likely to set the growth
expectations regarding the leveraging projects on a high level. Research and
development intensive firms seem likely to get involved in large-scale projects where
fundamentally different products are created. Less R&D intensive firms seem more
likely to get involved in smaller-scale improvement projects. Firms with extensive
managerial resources available for growth are likely to be actively looking for growth
opportunities and creating conditions where starting even experimental, uncertain
projects on a small scale is possible. The first hypothesis concerns the impact of firm
level constraints on technology leveraging projects.
H1: Firm level factors related to technology leveraging influence the goal
setting in technology leveraging projects and success of the projects.
241 Penrose, E. 1972 (orig. publ. 1959). The theory of the growth of the firm. Basil Blackwell and
Mott, Oxford, 5th edition. 242 Silverman, B. S. 1999. Technological resources and the direction of corporate diversification:
toward an integration of the resource-based view and transaction cost economies. Management Science, pp. 1109-1124.

49
H1a: Large firm size reduces growth expectations from a leveraging project in
relation to firm size.
H1b: Large firm size reduces deviation from expectations in a leveraging
project.
H1c: High growth orientation increases growth expectations from a leveraging
project
H1d: Research and development intensity of the firms increases growth
expectations from a project in relation to firm size.
H1e: Managerial resources available for growth support involvement in many
small-scale leveraging projects.
Several more recent streams of research within the resource-based view shed light on
some aspects of managerial resources. Strategic planning243 244, administrative skills245
and management skills246 have been researched as resources potentially giving a single
firm sustainable competitive advantage. These studies, however, have addressed
managerial resources from a functional or a skill viewpoint. The issue of whether the
investments of scarce managerial resources in generating growth instead of only
operatively managing existing business are justified has not been researched at the level
of detail of the number of managers available for growth.
A related research stream also emphasizing the importance of managerial resources
concentrates on dynamic capabilities247 248. Eisenhardt defines dynamic capabilities as
specific and identifiable processes such as product development, strategic decision-
243 Michalisin, M. D., Smith, R. D. & Kline, D. M. 1997. In search of strategic assets. International
Journal of Organizational Analysis, Vol. 5, pp. 360-387. 244 Powell, T. C. 1992. Strategic planning as competitive advantage. Strategic Management Journal,
Vol. 13, No. 7, pp. 551-559. 245 Powell, T. C. 1993. Administrative skills as competitive advantage – Extending Porter’s analytical
framework. Revue Canadienne des Sciences de l’Administration, Vol. 10, No. 2, pp. 141-155. 246 Castanias, R. P. & Helfat, C. E. 1991. Managerial resources and rents. Journal of Management,
Vol. 17, pp. 155-171. 247 Grant, R. M. 1996. Prospering in dynamically-competitive environments: Organizational capability
as knowledge integration. Organization Science, Vol. 7, No. 4, pp. 375-387. 248 Eisenhardt, K. M. & Martin, J. A. 2000. Dynamic capabilities: What are they? Strategic
Management Journal, Vol. 21, pp. 1105-1121.

50
making and alliancing. According to her, they are not themselves sources of long-term
competitive advantage, as they are not necessarily rare, inimitable or non-substitutable.
However, long-term competitive advantage can be gained by firms that use dynamic
capabilities “sooner, more astutely, or more fortuitously” 249 than the competition to
create resource re-combinations with long-term competitive advantage. Such advantage
is seldom achieved in dynamic markets. Therefore, especially in dynamic markets,
dynamic capabilities can be important, as firms may be able to compete by creating a
series of temporary competitive advantages.250
In relation to dynamic capabilities Powell251 discusses “strategic planning” from a
resource-perspective. He also comes to the conclusion that strategic planning does not
satisfy the criteria for sustainable advantage. This is because strategic planning is easily
imitated and may be substitutable. Strategic planning and financial performance were
mostly not related in his study. They were, however, positively related when an industry
was found to have strategic factor market imperfections. It should be noted that Powell’s
research was limited to formal planning. According to Powell’s more recent study252,
administrative skills provide an important source of competitive advantage. He names,
in particular, skills such as aligning an organization’s structure, strategy making, and the
environment as such skills. According to his study, administrative skills account for a
significant proportion of profitability variance, explaining more than industry or
strategic group membership.
Also research on corporate entrepreneurship highlights the importance of availability of
managerial services for growth253 254 255 256. Within this research stream, it has been
249 Eisenhardt, K. M. & Martin, J. A. 2000. Dynamic capabilities: What are they? Strategic
Management Journal, Vol. 21, pp. 1105-1121. 250 Eisenhardt, K. M. & Martin, J. A. 2000. Dynamic capabilities: What are they? Strategic
Management Journal, Vol. 21, pp. 1105-1121. 251 Powell, T. C. 1992. Strategic planning as competitive advantage. Strategic Management Journal,
Vol. 13, No. 7, pp. 551-559. 252 Powell, T. C. 1993. Administrative skills as competitive advantage – Extending Porter’s analytical
framework. Revue Canadienne des Sciences de l’Administration, Vol. 10, No. 2, pp. 141-155. 253 Zahra, S. A. & Covin, J. 1995. Contextual influences on the corporate entrepreneurship: company
performance relationship in established firms: A longitudinal analysis. Journal of Business Venturing, Vol. 10, pp. 43-58.
254 Block, Z. & MacMillan, I. 1993. Corporate venturing. Harvard Business School Press, Cambridge, USA.
255 Stopford, J. M. & Baden-Fuller, C. 1994. Creating corporate entrepreneurship, Strategic Management Journal, Vol. 15, pp. 521-536.

51
proposed that despite potential contributions of entrepreneurial activities to shareholder
value creation, executives may not support them due to risk aversion257 258. Zahra and
Covin have empirically researched financial consequences of corporate
entrepreneurship259. The results suggest that corporate entrepreneurship may provide an
effective means for improving long-term company financial performance.
The importance of the managerial component to firm performance has also been studied
in research examining the effectiveness of research and development investments.
Researchers have investigated which factors moderate the relationship of research and
development investments and growth. Such factors relating to the managerial
component are technology strategy as matching research and development to market
needs 260 261 262 263, management of R&D, and organizational form as well as control and
incentive systems with regard to R&D264 265 266. These factors, however, concentrate
mainly on how research and development investments should be allocated to produce
optimal returns on these investments, not on the role of the managerial component in
finding and exploiting business opportunities based on technological competencies
produced through the investments. Hitt and Lee suggest that studying the impact of
256 Franko, L. G. 1989. Global corporate competition: Who’s winning, who’s losing, and the R&D
factor as one reason why. Strategic Management Journal, Vol. 37, pp. 1079-1108. 257 Franko, L. G. 1989. Global corporate competition: Who’s winning, who’s losing, and the R&D
factor as one reason why. Strategic Management Journal, Vol. 37, pp. 1079-1108. 258 Hoskisson, R. E. & Hitt, M. A. 1994. Downscoping: How to tame the diversified firm, Oxford
University press, NY, USA. 259 Zahra, S. A. & Covin, J. G. 1995. Contextual influences on the corporate entrepreneurship-
performance relationship: A longitudinal analysis. Journal of Business Venturing, Vol. 10, No. 1, pp. 43-16.
260 Bean, A. S. 1995. Why some R&D organizations are more productive than others. Research Technology Management, Washington, Jan/Feb, pp. 25-.
261 Bean, A. S., Einolf, K. & Russo, M. J. 1999. Benchmarking your R&D: Results from IRI/CIMS annual R&D survey for FY ’97. Research Technology Management, Washington, Jan/Feb, pp. 24-34.
262 Bean, A. S., Russo, M. J. & Whiteley, R. L. 2000. Benchmarking your R&D: Results from IRI/CIMS annual R&D survey for FY ’98. Research Technology Management, Washington, Jan/Feb, pp. 16-24.
263 Roberts, E. B. 1995. Benchmarking the strategic management of technology – I. Research Technology management, Washington, Jan / Feb, pp. 44-.
264 Hoskisson, R. E. & Hitt, M. A. 1988. Strategic control systems and relative R&D investment in large multiproduct firms. Strategic Management Journal, Vol. 9, pp. 605-621.
265 Hitt, M. A., Hoskisson, R. E., Johnson, R. A. & Moesel, D. D. 1996. The market for corporate control and firm innovation. Academy of Management Journal, Mississippi State, October, pp. 1084-1119.
266 Hoskisson, R. E., Hitt, M. A. & Hill, C. W. L. 1993. Managerial incentives and investment in R&D in large multiproduct firms, Organization Science, May, pp. 325-342.

52
technological learning and management of knowledge on growth is important for
clarifying the relationship of research and development investments, technological
competence and firm growth267. According to them, this relationship has been
theoretically explored, but no cohesive empirical evidence seems yet to exist268.
Finally, it has been suggested that firms may be able to circumvent managerial limits to
growth by using contractual organizational forms such as franchising. New and growing
firms have a disproportionate preference for contractual organizational forms269. One
reason for this is that contractual organizational forms allow resource-constrained firms
to gain control over co-specialized assets270, and seem to allow firms to grow faster by
overcoming managerial limits to growth271.
Knowledge concerning growth
The services that managers are able to provide to the firm depend on the number of
managers as well as their knowledge concerning growth. Knowledge development is a
path-dependent process272. New knowledge can more easily be built on, and related to,
existing knowledge of the organization than on completely new areas. The search for
new knowledge is often local in that it is close to current knowledge273 274; firms develop
knowledge through a problem solving process that explores alternatives in the
neighborhood of existing knowledge. Thus the existing knowledge base of a firm
267 Hitt, M. A., Ireland, R. D. & Lee, H. 2000. Technological learning, knowledge management, firm
growth and performance: An introductory essay. Journal of Engineering and Technology Management, Amsterdam, Sep-Dec, pp. 231-246.
268 Hitt, M. A., Ireland, R. D. & Lee, H. 2000. Technological learning, knowledge management, firm growth and performance: An introductory essay. Journal of Engineering and Technology Management, Amsterdam, Sep-Dec, pp. 231-246.
269 Larson, A. 1992. Network dyads in entrepreneurial settings: A study of governance exchange relationships. Administrative Science Quarterly, Vol. 37, pp. 76-104.
270 Teece, D. 1986. Profiting from technological innovation: Implications for integration, collaboration, licensing and public policy. Research Policy, Vol. 15, pp. 285-305.
271 Norton, S. W. 1988. An empirical look at franchising as an organizational form. Journal of Business, Vol. 61, pp. 197-218.
272 Rasche, C. 1994. Wettbewerbsvorteile durch Kernkompetenzen: Ein resourcenorientierter Ansatz. Wiesbaden: Deutscher Universitäts Verlag.
273 Cyert, R. & March, J. G. 1992. A behavioral theory of the firm. Prentice Hall, New Jersey, USA. 274 Nelson, R. R. & Winter, S. G. 1982. An evolutionary theory of economic change. The Belknap
Press of Harvard University Press, Cambridge, Massachusettes, USA.

53
defines a space in which the firm will search for problem solutions275. The cumulative
nature of knowledge and the local search leads to a firm’s knowledge developing
according to a knowledge trajectory276.
Firms may need to acquire knowledge outside their existing knowledge trajectory to
change their capability base277. This may be difficult because of a potential need to
unlearn some of the existing knowledge278, and because of not recognizing information
and knowledge as valuable when judging it against the existing knowledge279. Failing to
recognize the value of information when judging it against the existing knowledge can
arise for two reasons: the existing knowledge functions as a filter admitting only
information and knowledge that fits into the existing mental models280 281 and the firm
actively suppresses information or knowledge that contradicts the knowledge base282 283.
Even a high level of knowledge concerning growth opportunities cannot assure that all
productive opportunities are detected. Knowledge is, however, likely to increase the
number of opportunities detected 284.
The nature of technology has been proposed to set boundaries to the number of
opportunities it can be expected to entail 285 286 287. Technological opportunities can be
275 Keil, T. 2000. External Corporate Venturing: Cognition, speed, and capability development.
Doctoral dissertation, Helsinki University of Technology Institute of Strategy and International Business, Finland.
276 Dosi, G, Technological paradigms and technological trajectories, Research Policy, 1982, Vol. 11, pp. 147-162
277 Keil, T. 2000. External Corporate Venturing: Cognition, speed, and capability development. Doctoral dissertation, Helsinki University of Technology Institute of Strategy and International Business, Finland.
278 Hedberg, B. 1981. How organizations learn and unlearn. In: Nyström, P. C. & Starbuck, W. H. (Eds.) Handbook of organizational design: Adapting organizations to their environments. Oxford, UK.
279 Cohen, W. M. & Levinthal, D. A. 1990. Absorptive capacity: A new perspective on learning and innovation. Administrative Science Quarterly, Vol. 35, No. 1, pp. 128-152.
280 Bettis, R. A. & Prahalad, C. K. 1995. The dominant logic: Retrospective and extension. Strategic Management Journal, Vol. 16, pp. 3-14.
281 Levinthal, D. A. & March, J. G. 1993. The myopia of learning. Strategic Management Journal, Vol. 14, pp. 95-112.
282 Argyris, C. & Schön, D. A. 1978. Organizational learning: A theory of action perspective. Addison-Wesley, Reading, Massachusettes, USA.
283 Leonard-Barton, D. 1995. Wellsprings of knowledge: Building and sustaining the source of innovation. Harvard Business School Press, Boston, Massachusettes, USA.
284 Penrose, E. 1972 (orig. publ. 1959). The theory of the growth of the firm. Basil Blackwell and Mott, Oxford, 5th edition.
285 Jaffe, A. 1989. Characterizing the technological position of firms with application to quantifying technological opportunity and research spillovers. Research Policy, Vol. 18, pp. 87-97.

54
defined as executives’ perceptions of the ability to support and generate growth
opportunities through product and process innovations. These have been claimed to vary
considerably industry by industry288. Industries with high levels of perceived
technological opportunities are characterized as having rapid and frequent product and
process technology introductions, and high levels of research and development spending
and patenting. To succeed in these kinds of industries, managers need large amounts of
information on competition, markets, and customers289.
Factors such as uncertainty, complexity and inter-organizational conflicts affect
managerial decisions concerning resources290. In addition, behavior with respect to the
utilization of firm resources becomes routinized over time. Knowledge-enhancing
activities such as corporate venturing can offer a mechanism for breaking out of the
routines and gaining access to new resources and information.291 The literature on the
application of options theory in strategy conceptualizes finding, choosing and
concretizing a firm’s growth opportunities. Central to this view is the point that
opportunities for strategic action can be realized when decision-makers recognize them.
The option bundle can contain several options awaiting recognition. Recognition of an
option on a particular investment opportunity makes it more likely that a strategy to
capture that opportunity will emerge.292 However, opportunities do not always need to be
recognized early and captured through a conscious strategy; they can also become
captured gradually as by-products of implementing other strategies.
Complementing the contributions of the psychological and behavioral views of firms, an
options perspective can make economical modeling of organizational intuition more
possible, help make organizational intuition more explicit, and create an economic logic
286 Rosenberg, N. 1984. Science, invention and economic growth, Economic Journal. 287 Scherer, F. M. 1980. Industrial market structure and economic performance. 2nd edition.
Cambridge, Massachusettes. 288 Geroski, P. 1990. Innovation, technological opportunity, and market structure. Oxford Economic
Papers, Vol. 42, pp. 586-602. 289 Galbraith, J. 1973. Designing complex organizations. Addison-Wesley, Reading, Massachusettes. 290 Amit, R. & Schoemaker, P. J. H. 1993. Strategic assets and organizational rent. Strategic
Management Journal, Vol. 14, pp. 33-46. 291 McGrath, R. G., Venkataraman, S. & MacMillan, I. C. 1994. The advantage chain: Antecedents to
rents from internal corporate ventures. Journal of Business Venturing, Vol. 9, pp. 351-369. 292 Bowman, E. H. & Hurry, D. 1993. Strategy through the option lens. The Academy of Management
Review, Mississippi State, Oct, pp. 760-.

55
for the behavioral process of incremental resource investment. 293 294 295 296 Especially in
uncertain conditions, application of options theory to strategy seems to have advantages 297 298 299.
Incorporating evaluation of opportunities into management processes throughout the
organization may sensitize the organization to opportunities that have not been utilized.
According to the application of options theory in strategy, opportunity recognition can
be facilitated with organizational processes300 301 302 303. Opportunities are often evaluated
through a qualitative and unstructured assessment on top of the firm’s normal
assessment, which uses investment criteria based on the cash flow-based calculations.
The former is unlikely to incorporate as much of the information concerning the value
of the opportunities existing in the organization as would be possible with a more
structured and comprehensive approach. Establishing explicit ways of evaluating the
opportunity value of technology as a part of the management system of the company
could help in identifying opportunities. Explicit valuation of opportunities that
technologies entail would seem likely to increase discussion within the firm about these
opportunities. Such discussion could increase understanding of the opportunities. This
“explicit valuation” can be compared with “implicit valuation”. In “implicit valuation”
technologies are expected to entail some opportunities. Individual employees have
perhaps even explicitly evaluated the expected opportunities, but such statements have
293 Bowman, E. H. & Hurry, D. 1993. Strategy through the option lens. The Academy of Management
Review, Mississippi State, Oct, pp. 760-. 294 Bowman, E. H. & Hurry, D. 1987. Strategic options. Working Paper 87-20, Reginald Jones Center,
the Wharton School, University of Pennsylvania, Philadelphia, USA. 295 Hurry, D. 1993. Restructuring in the global economy: The consequences of strategic linkages
between Japanese and U.S. firms. Strategic Management Journal, 14, pp. 69-82. 296 Dixit, A. 1992. Investment and hysteresis. Journal of Economic Perspectives, 6(1), pp. 107-132. 297 Dixit, A. & Pindyck, R. 1994. Investment under uncertainty. Princeton, Princeton University Press,
USA. 298 Hurry, D., Miller, A. T. & Bowman, E. H. 1992. Calls on high technology: Japanese exploration of
venture capital investments in the United States. Strategic Management Journal, 13. 299 Kogut, B. & Kulatilaka, N. 1994. Operating flexibility, global manufacturing, and the option value
of a multinational network. Management Science, 40, pp. 123-139. 300 Bowman, E. H. & Hurry, D. 1987. Strategic options. Working Paper 87-20, Reginald Jones Center,
The Wharton School, University of Pennsylvania, Philadelphia, USA. 301 Bowman, E. H. & Hurry, D. 1993. Strategy through the option lens. The Academy of Management
Review, Mississippi State, Oct, pp. 760-. 302 Luehrman T. A. 1998. Strategy as a portfolio of real options. Harvard Business Review, Boston,
Sep/Oct, pp. 89-99. 303 Kogut, B. & Kulatilaka, N. 1994. Options thinking and platform investments: Investing in
opportunity. California Management Review, Berkeley, Winter, pp. 52-.

56
not been commonly made throughout the organization. Through uncovering at least
some of the option value, “explicit valuation” of opportunities that technologies entail
may help discover the attractiveness of long-term investments into more generic
capability platforms based on the firm’s technologies. A possible way of more explicitly
evaluating the opportunities is to conceptualize them as options. Managers already
intuitively use many of the concepts of the options theory304. Making these concepts
explicit could enhance the quality of decision-making related to uncertain projects.
4.1.2 Risk and uncertainty related to individual technology-leveraging projects
Risk and uncertainty related to individual growth projects may restrict the expansion
plans of the firm305. More information and better planning can reduce the uncertainty.
Information gathering and planning require managerial resources. Some uncertainty will
always remain. Usually, the limit for an acceptable risk level is set by firm-specific
traditions. The more risky a project, the greater the need for managerial services to deal
with uncertainty. Perceived risk and uncertainty of growth projects lead to a need for
managerial resources for planning, analysis, and implementation. In addition, perceived
risk and uncertainty can render managers more hesitant in becoming involved in growth
projects. The more unfamiliar the new market, and the greater the need for more
investments, the higher the perceived risk and uncertainty that can be assumed.
As growth proceeds into increasingly unknown areas, the new activities become less
familiar and more effort is required of the management306. Applicability of existing
operational capabilities in the newly entered markets would seem to reduce the need for
managerial capacity for two reasons. First, the applicability of existing operational
capabilities in the entered market is a measure of how familiar the market is; if the
market is very dissimilar to the firm’s previous markets, the operational capabilities are
less likely to be applicable. Entering a more similar market is likely to require less
managerial capacity for planning the entry, as more assumptions about the market can
304 Busby, J. S. & Pitts, C. G. C. 1997. Real options and capital investment decisions. Management
Accounting, London, Vol. 75, No. 10, Nov, pp. 38-. 305 Penrose, E. 1972 (orig. publ. 1959). The theory of the growth of the firm. Basil Blackwell and
Mott, Oxford, 5th edition. 306 Penrose, E. 1972 (orig. publ. 1959). The theory of the growth of the firm. Basil Blackwell and
Mott, Oxford, 5th edition.

57
be made without an extensive information search. New knowledge is easier to
understand in a familiar area than in an unfamiliar area307. Second, applicability of
existing capabilities in the new market reduces the managerial capacity needed for
acquiring or building the necessary operational capabilities.
From resource based view’s foundation-laying writings, the research stream has
developed to explain how firm-specific skills, competencies, and other tangible or
intangible resources can be viewed as the basis for a firm’s competitive advantage308 309
310. The match between resources and strategies is seen as related to firm performance311.
Resource complementarities have a role in this relationship. Resource complementarity
means that performing one activity increases the returns on performing another312. The
value of a resource may depend on the availability of other resources313. Resource
complementarities can be, for example, technical, political, economic, and cognitive314.
Importance of complementary resources has also been emphasized in resource-based
research on the antecedents to diversification315.
In addition to enabling growth, existing resources316 317 318 or the firm’s previous
activities319 can also restrictively determine the direction of growth. An additional
307 Inkpen, A. C. 1998. Learning and knowledge creation through international strategic alliances.
Academy of Management Executive, Vol. 12, No. 4, pp. 69-80. 308 Barney, J. 1991. Firm resources and sustained competitive advantage. Journal of Management,
Vol. 17, No. 1, pp. 99-120. 309 Peteraf, M. 1993. The cornerstones of competitive advantage: A resource-based view. Strategic
Management Journal, Vol. 14, No. 3, pp. 179-191. 310 Prahalad, C. K. & Hamel, G. 1996. The core competence of the corporation. In: Burgelman, R. A.,
Maidique, M. A. & Wheelwright, S.C. 1996. Strategic management of technology and innovation. Times Mirror Higher Education Group, USA.
311 Chandler, G. N. & Hanks, S. H. 1993. Measuring the performance of emerging businesses: a validation study. Journal of Business Venturing, Vol. 8, No. 5, pp. 391-408.
312 Milgrom, P. & Roberts, P. 1995. Complementarities and fit: Strategy, structure, and organizational change in manufacturing. Journal of Accounting and Economics, Vol. 19, pp. 179-208.
313 Dierickx, I. & Cool, K. 1989. Asset stock accumulation and sustainability of competitive advantage. Management Science, Vol. 35, pp. 1504-1511.
314 Stein, J. 1997. On building and leveraging competencies across organizational borders: A socio-cognitive framework. In. Heene, A. & Sanchez, R. Competence-based strategic management. John Wiley & Sons.
315 Hoskisson, R. E. & Hitt, M. A. 1990. Antecedents and performance outcomes of diversification: A reviwe and critique of theoretical perspectives. Journal of Management, Vol. 16, pp. 461-509.
316 Penrose, E. 1972 (orig. publ. 1959). The theory of the growth of the firm. Basil Blackwell and Mott, Oxford, 5th edition.
317 Nelson, R. & Winter, S. 1982. An evolutionary theory of economic change. The Belknap Press of Harvard University Press, Cambridge, Massachusettes, USA.

58
possible restriction to growth is that established routines, existing dominant logic320 321 322, knowledge biases and structural inertia may prevent the adoption of new
perspectives, routines and new priorities required by a new business venture323. They
may prevent a firm from recognizing an opportunity at all324. Changes in intangible
assets may be more difficult to implement than changes in tangible assets325 326. One
reason to this is that the culture and strategy of an organization need to be adapted to its
current environment, but in a way that does not harm the company’s ability to adjust to
radical changes in that environment.327
Technology leveraging projects involve lots of learning. Learning is a dynamic process,
which cannot be planned very well. Therefore, the successful project teams are likely to
be small and empowered. Such teams are only viable if the project is in the beginning
scoped as relatively small. Other reasons for better success of smaller projects may be
their easier management due to their lower complexity, and the pressure to succeed due
to limited funds. This is in line with the propositions of corporate venturing literature
that tight financing328 and staged structure329 make the likelihood of success higher.
Additionally, literature on application of options theory to strategy suggests a similar
318 Leonard-Barton, D. 1992. Core Capabilities and Core Rigidities: A Paradox in Managing New
Product Development. Strategic Management Journal, Chichester, Vol. 13, Summer, pp. 111-125. 319 Conner, K. & Prahalad, C. 1996. A resource-based theory of the firm. Organization Science, Vol.
7, No. 5, pp. 477-501. 320 Bettis, R. A. & Prahalad, C. K. 1995. The dominant logic: Retrospective and extension. Strategic
Management Journal, Chichester, Vol. 16, No. 1, Jan, pp. 5-15. 321 Grant, R. M. 1988. On 'Dominant Logic', Relatedness And The Link Between Diversification.
Strategic Management Journal, Chichester, Vol. 9, No. 6, Nov/Dec, pp. 639-643. 322 Prahalad, C. K. & Bettis, R. A. 1986. The Dominant Logic: A New Linkage Between Diversity and
Performance. Strategic Management Journal, Chichester, Vol. 7, No. 6, Nov/Dec, pp. 485-502. 323 Parhankangas, A. 1999. Disintegration of technological competencies: An empirical study of
divestments through spin-off arrangements. Doctoral dissertation, Helsinki University of Technology, Finland.
324 Keil, T. 2000. External Corporate Venturing: Cognition, speed, and capability development. Doctoral dissertation, Helsinki University of Technology Institute of Strategy and International Business, Finland.
325 Durand, T. 1997. Strategizing for innovation: Competence analysis in assessing strategic change. In: Competence-based strategic management. Heene, A. & Sanchez, R. (Eds.) John Wiley & Sons. UK.
326 Sanchez, R. & Heene, A. 1996. A systems view of the firm in competence-based competition. In: Sanchez, R., Heene, A. & Thomas, H. Dynamics of competence-based competition. Elsevier, UK.
327 Tushman, M. L. O. & Reilly, C. A. III. 1996. Ambidextrous organizations: Managing evolutionary and revolutionary change. California Management Review, Berkeley, Vol. 38, No. 4, Summer, pp. 8-30.
328 Clayton, J., Gambill, B. & Harned, D. 1999. The curse of too much capital: Building new businesses in large corporations. McKinsey Quarterly, Vol. 3, pp. 49-59.

59
logic330 331 332 333 334 335 336, albeit with even further developed implications. Projects with
high growth expectations may reach their goals less often than those with low growth
expectations for one of two basic reasons: First, the expectations may be set at too
optimistic a level. Second, even if the expectations are set at a "correct” level, the
project can still be large or small. Large projects can be more difficult to implement
because of more complexity, even if they would receive more management attention.
H2: Smaller project size reduces deviation from expectations.
According to the resource-based view, applicability of existing operational capabilities
in a new market reduces the risk and uncertainty of the entry 337 338 339 340. Examining the
risk and uncertainty directly is difficult for two reasons. First, it is difficult to find direct,
objective measures of the risk and uncertainty of individual growth projects. Second,
assessments concerning risk and uncertainty provided in surveys by personnel involved
in growth projects are subject to a significant post rationalization bias. Therefore, the
dependent variable chosen for studying factors affecting the level of risk and uncertainty
in technology leveraging projects is deviation of the projects’ results from the results
expected. The third hypothesis concerns the impact of the applicability of existing
operational capabilities in the market entered on the deviation from expectations. Also
329 Hamel, G. 1999. Bringing Silicon Valley Inside. Harvard Business Review, pp. 71-84. 330 Kogut, B. & Kulatilaka, N. 1994. Options thinking and platform investments: Investing in
opportunity. California Management Review, Berkeley, Winter, pp. 52-. 331 Majd, S. & Pindyck, R. S. 1987. Time to build: option value and investment decisions. Journal of
Financial Economics, Vol. 18, pp. 7-27. 332 McDonald, R. & Seigel, D. 1985. Investment and the valuation of firms when there is an option to
shut down. International Economic Review, Vol. 26, pp. 331-349. 333 McDonald, R. & Seigel, D. 1986. The value of waiting to invest. Quarterly Journal of Economics,
Vol. 101, pp. 707-727. 334 Paddock, J. L., Seigel, D. R. & Smith, J. L. 1983. Option valuation of claims on physical assets:
The case of offshore petroleum leases. Working Paper, MIT Energy Laboratory, USA. 335 Trigeorgis, L. & Mason, S. P. 1987. Valuing managerial flexibility. Midland Corporate Finance
Journal, Vol. 3, No. 1, pp. 14-21. 336 See also explanation of "optimal inertia" in investment decisions: Dixit, A. 1992. Investment and
hysteris. Journal of Economic Perspectives, Vol. 6, No. 1, pp. 107-132. 337 Milgrom, P. & Roberts, P. 1995. Complementarities and fit: Strategy, structure, and organizational
change in manufacturing. Journal of Accounting and Economics, Vol. 19, pp. 179-208. 338 Dierickx, I. & Cool, K. 1989. Asset stock accumulation and sustainability of competitive
advantage. Management Science, Vol. 35, pp. 1504-1511. 339 Stein, J. 1997. On building and leveraging competencies across organizational borders: A socio-
cognitive framework. In. Heene, A. & Sanchez, R. Competence-based strategic management. John Wiley & Sons.
340 Chandler, G. N. & Hanks, S. H. 1993. Measuring the performance of emerging businesses: a validation study. Journal of Business Venturing, Vol. 8, No. 5, pp. 391-408.

60
investments in technology and marketing and sales are measured as an aspect of
applicability of existing operational capabilities in the entered market.
H3a: Applicability of the existing operational capabilities in the entered market
reduces deviation from expectations of an individual technology-leveraging
project.
H3b: In technology-leveraging projects, applicability of technology is the most
critical, thereafter applicability of marketing and sales, and last applicability of
operations.
In technology-leveraging projects, technology is the core capability. Therefore the
strength of this competence in the new market seems like the most important of the
three types of operational capabilities. Strength of marketing and sales capabilities is
important in a market entry. Therefore this is on second place. Operations comes last as
it does not seem to have a similar critical position as the two other capabilities.
Operations can often be outsourced.
The impact of the applicability of existing operational capabilities in the new market has
been empirically tested with varying results. It has been proposed that entrants are likely
to perform well in the newly entered industry when their respective parent firms possess
the skills and resources critical for competitiveness compared to the incumbents of the
industry entered 341 342 343. On the other hand, an entering firm may be able to gain
competitive advantage over incumbents by leveraging key skills that are not widespread
in the industry344. Focus should be on the potential to exploit economies of scale and
scope between related businesses345 346. Empirical research which has been
341 Montgomery, C. A. & Hariharan, S. 1991. Diversified expansion by large established firms.
Journal of Economic Behavior and Organization, Vol. 15, pp. 71-89. 342 Wernerfelt, B. A. 1984. Resource-based view of the firm. Strategic Management Journal, Vol. 5,
pp. 171-180. 343 Rumelt, R. P. 1986. Strategy, structure, and economic performance (revised edition). Boston, MA,
USA. 344 Sharma, A. & Kesner, I. 1996. Diversifying entry: Some ex ante explanations for postentry survival
and growth. Academy of Management Journal, Mississippi State, June, Vol. 39, No, 3, pp. 635-. 345 Panzar, J, C, Willig, R, D, Economies of scope, AEA Papers and Proceedings, 1981, Vol, 71, pp.
268-272 346 Teece, D, J, Towards and economic theory of the multiproduct firm, Journal of Economics and
Organization, 1980, Vol. 3, pp. 39-63

61
operationalized unsuitably for revealing resource relatedness has failed to find support
for the proposition that familiarity increases the likelihood of success in product market
entries347. In the research in question348, resource relatedness was operationalized
according to a functional emphasis. Relatedness of the original and entered industries
was measured according to standard industry classification codes. These measures are
poorly suited to revealing resource relatedness.
Using a resource-based approach to modeling interrelationships among businesses has
received empirical support when applied to the analysis of financial performance of
large manufacturing firms on the corporate level349. Good results have also been
received from looking at human expertise similarity to reveal and explain patterns in
diversification350. Furthermore, in a study combining the skill and physical bases of
relatedness a positive effect on most indicators of performance was empirically
confirmed351. The resource perspective has been confirmed as a relevant approach to
modeling interrelationships among businesses.
It might be argued that the complementary capabilities required for leveraging
technology can be acquired, learned or built quickly, and with little risk. In that case,
whether or not the existing marketing and operational capabilities fit in the new market
would not greatly impact the deviation from expectations of leveraging projects.
Therefore, it is important to investigate Hypothesis 3.
To summarize this chapter: the figure below presents the main contributions of the
resource-based view to the understanding of related diversification and leveraging of
technology. From the viewpoint of the resource-based view, two questions would seem
to be important for a better understanding of leveraging of technology. The first one of
these is: What is the impact of the availability of managerial services for growth on firm
347 Sharma, A. & Kesner, I. 1996. Diversifying entry: Some ex ante explanations for postentry survival
and growth. Academy of Management Journal, Mississippi State, June, Vol. 39, No, 3, pp. 635-. 348 Sharma, A. & Kesner, I. 1996. Diversifying entry: Some ex ante explanations for postentry survival
and growth. Academy of Management Journal, Mississippi State, June, Vol. 39, No, 3, pp. 635-. 349 Robins, J. & Wiersema, M. F. 1995. A resource-based approach to the multibusiness firm:
Empirical analysis of portfolio interrelationships and corporate financial performance. Strategic Management Journal, May, Vol. 16, No. 4, pp. 277-300.
350 Farjoun, M. 1994. Beyond industry boundaries: Human expertise, diversification and resource-related industry groups. Organization Science, May, Vol. 5, No. 2, pp. 185-200.

62
growth? The second is: What is the impact of the applicability of existing operational
capabilities in the new market on the success of leveraging projects?
Sequential entry strategy: It is often better todevelop the resource in one market and thenenter other markets from a strong resourceposition
Application-specificity of resources leads tohigh rents and imperfect transplantability
Related diversification supports moreextensive exploitation of application-specificresources than unrelated diversification
Resource-based view:leveraging of technology
Important to assess the impact ofapplicability of existing operationalcapabilities in the new market on successof technology leveraging projects
Important to model managerial competencein choosing from the “productiveopportunities”
Missing pieces concerningleveraging of technology
Resources are the starting point, the mostattractive industries for their deploymentshould be identified
− Development of resources moredifficult than learning the industryspecificities needed for theirdeployment
− Especially in unstableenvironments the firm-specificresources and capabilities providea more durable basis for strategyformulation than product-marketpositioning
Resource complementarity means thatdoing one activity increases the returns todoing another
“Productive opportunities” are unlimited,and thus all of them cannot be exploited.Therefore, managerial competence is animportant determinant of firm performance
Resource-based view:main ideas
Figure 1: Summary: Resource-based view on related diversification
4.2 Decision-making research
One of the most important ways that managerial resources concretely impact is through
decision-making; strategic decision-making processes are the incorporations of
managerial services, as decision-making incorporates the results of important
managerial services such as analysis, preparation, thinking, intuition and motivation. In
this chapter, streams of research within the decision-making research discussing factors
affecting the success of growth projects are discussed.
Strategy can be seen as a pattern in a stream of decisions352. The way decisions are made,
or the structure of the decision process itself, may mould decision outcomes and
strategies that organizations follow353. Although strategic decision-making research has
351 Farjoun, M. 1998. The independent and joint effects of the skill and physical bases of relatedness
in diversification. Strategic Management Journal, Vol. 19, pp. 611-630. 352 Mintzberg, H. & Waters, J. A. 1982. Tracking strategy in an entrepreneurial firm. Academy of
Management Journal, Vol. 25, pp. 465-499. 353 Cray, D., Butler, R. J., Hickson, D. J., Mallory, G. R. & Wilson, D. C. 1986. Proactive and
reactive decision making. In: Subramaniam, V. (Ed.) Problem recognition in public policy and business management. Delhi, Ashish.

63
benefited from behavioral decision theory and transaction cost economies, it has
recently gained also its own momentum354.
Three paradigms dominate strategic decision-making literature: the rationality and
bounded rationality paradigm, the politics and power paradigm, and the garbage can
paradigm. Eisenhardt and Zbaracki355 have synthesized the empirical findings from these
and found that describing organizations as political systems in which strategic decision
makers have partially conflicting objectives and limited cognitive capability has been
proven a fruitful approach. According to their review, both boundedly rational and
political approaches best describe strategic decision-making. Further, the garbage can
model seems less relevant because it has received less empirical support than the other
approaches. However, it can function as a concept helping managers take into account
the importance of chance. An extensive, empirically supported literature on ways of
improving decision-making through enhancing decision-quality and improving
commitment to the decisions made also exists.
Four common perspectives of studying decision-making are the "individual decision
perspective", "strategic or management choice", "environmental determinism", and the
"firm characteristics and resource availability perspective"356. According to the decision
perspective, the nature of the decision itself may be important. The way managers
categorize and label a decision in the early stages of the decision-making process
strongly influences the organization's subsequent responses357 358 359. Decisions
interpreted as threats, as opposed to opportunities, are treated with a more
comprehensive decision-making process360. The strategic or management choice
354 Schwenk, C. R. 1995. Strategic decision making. Journal of Management, Vol. 21, No.3, pp. 471-
493. 355 Eisenhardt, K. M. & Zbaracki, J. M. 1992. Strategic decision making. Strategic Management
Journal, Winter, Vol. 13, pp. 17-38. 356 Papadakis, V. M., Lioukas, S. & Chambers, D. 1998. Strategic decision-making process: the role
of management and context. Strategic Management Journal, Vol. 19, pp. 115-147. 357 Dutton, J. E. 1993. Interpretations on automatic: A different view on strategic issue diagnosis.
Journal of Management Studies, Vol. 30, No. 3, pp. 339-357. 358 Fredrickson, J. W. 1985. Effects of decision motive and organizational performance level on
strategic decision processes. Academy of Management Journal, Vol. 28, No. 4, pp. 821-843. 359 Mintzberg, H., Raisinghani, D. & Theoret, A. 1976. The structure of the "unstructured" decision
processes. Administrative Science Quarterly, Vol. 21, pp. 246-275. 360 Fredrickson, J. W. 1985. Effects of decision motive and organizational performance level on
strategic decision processes. Academy of Management Journal, Vol. 28, No. 4, pp. 821-843.

64
perspective emphasizes the role of decision-makers. Strategic choices have an
endogenous behavioral component and partly reflect the idiosyncrasies of decision-
makers361 362. According to the environmental determinism perspective, strategic
decisions and processes express adaptation to opportunities, threats, constraints, and
other characteristics of the environment, and the role of top managers is minimized to a
facilitation of this adaptation. Comprehensive processes lead to better performance in
rapidly changing environments363. The firm characteristics and resource availability
perspectives emphasize internal factors such as internal systems, company performance,
size, or corporate control. They can be linked to the "inertial" perspective proposed by
Romanelli and Tushman364. According to this “inertial” perspective existing
organizational arrangements, structures, systems, processes, and resources constrain
future strategic decision-making.
4.2.1 Strategic decision-making processes
Strategic decision-making process has been described as a sequence of steps, phases or
routes by several authors365 366, or as dimensions of the process367 368 369 370 371. The most
common dimensions of strategic decision-making processes found in the literature are
described in the following table.
361 Child, J. Organizational structure, environment and performance: The role of strategic choice.
Sociology, Vol. 6, pp. 1-22. 362 Cyert, R. M. & March, J. G. 1963. A behavioral theory of the firm. Prentice-Hall, Englewood
Cliffs, New Jersey, USA. 363 Priem, R. L., Rasheed, A. M. A. & Kotulic, A. G. 1995. Rationality in strategic decision processes,
environmental dynamism and firm performance. Journal of Management, Vol. 21, pp. 913-929. 364 Romanelli, E. & Tushman, L. 1986. Inertia, environments and strategic choice: A quasi-
experimental design for comparative-longitudinal research. Management Science, Vol. 32, pp. 608-621.
365 Fredrickson, J. W. 1984. The comprehensiveness of strategic decision processes: Extension, observations, future directions. Academy of Management Journal, Vol. 28, No. 4, pp. 445-466.
366 Mintzberg, H., Raisinghani, D. & Theoret, A. 1976. The structure of the “unstructured” decision processes. Administrative Science Quarterly, Vol. 21, pp. 246-275.
367 Bourgeois, L. J. III & Eisenhardt, K. M. 1988. Strategic decision processes in high velocity environments: Four cases in the microcomputer industry. Management Science, Vol. 34, No. 7, pp. 816-835.
368 Hickson, D. J., Wilson, D. C., Cray, D., Mallory, G. R. & Butler, R. J. 1986. Top decisions: Strategic decision-making in organizations. Jossey-Bass, San Francisco, USA.
369 Lyles, M. A. 1987. Defining strategic problems: Subjective criteria of executives. Organizational Studies, Vol. 8, No. 3, pp. 263-280.
370 Miller, D. 1987. The structural and environmental correlates of business strategy. Strategic Management Journal, Vol. 8, No. 1, pp. 55-76.
371 Stein, J. 1980. Contextual influence on strategic decision methods. Ph.D. dissertation, University of Pennsylvania, USA.

65
Table 5: Dimensions of strategic decision-making processes
Comprehensiveness and rationality dimension
Elements of rationality can also be found in studies on complexity of methodology, degree of inquiry and scrutiny
Dean & Sharfman, 1993a, b; Lyles & Mitroff, 1980; Miller, 1987
Langley, 1990; Lyles, 1987; Cray et alii, 1988
Centralization Cray et alii 1988; Lyles 1987; Miller 1987
Formalization and standardization of the process Stein 1980
Conflict and problem solving dissension consisting of politicality and negotiation as well as bargaining
Lyles, 1987; Hickson et alii, 1987; Dean & Sharfman, 1993b; Pfeffer & Salanick, 1974; Cray et alii, 1988; Hickson et alii, 1986; Pettigrew, 1973
Forces that set in motion a strategic decision-making process have been researched in a
study of 352 strategic decisions372. It was discovered that, in most cases, decision-
making was initiated by claims from stakeholders that pointed out important concerns.
In these claims, directions were given that guided the search for ways to respond.
Decision-making success was higher when the claims were performance-based and
when the search for alternatives was directed by agreed-upon performance expectations.
Decision-making success was lower when the claims and directions limited the search
for alternatives or framed the strategic choice as a certain action to be taken.
Janis and Mann373 have listed steps in rational decision processes from studying all
stakeholders' objectives, through generating and analyzing alternatives, to evaluating the
consequences of the chosen alternative and developing implementation plans, control
systems and contingency plans. As this rational decision-making approach has its main
emphasis on comprehensiveness, Fredrickson and Mitchell374 divided
comprehensiveness into two components: analytic and integrative. Analytic
comprehensiveness refers to those decision processes designed to produce a complete
set of goals and strategic alternatives. Integrative comprehensiveness refers to the
logical consistency among the decision components that comprise and support strategy.
Three main obstacles to adopting comprehensive strategic decision processes have been
identified. The first one is lacking the required resources to perform the relevant
372 Nutt, P. C. 1998. Framing strategic decisions. Organization Science, Providence, Mar/Apr, Vol. 9,
No. 2, pp. 195-216. 373 Janis, I. L. & Mann, L. 1977. Decision making: A psychological analysis of conflict, choice and
commitment. The Free Press, New York, USA.

66
strategic information search375 376. The second is that individuals responsible for
decisions may have limited cognitive capabilities377. The third is that the decision-
makers may not want to conflict with an organization's political structure and deal with
the consequences of the conflict378.
Making a decision can be seen to involve two fundamental problems: a technical
problem of trying to calculate the best solution, and a political problem of resolving
divergent interests379. With regard to the technical problem, under conditions of
uncertainty, managers sacrifice meaning, accept an incomplete search, and use post-
rationalization380. Some decision rules that an individual may employ in responding to
an organization's political structure have been identified381. An example of these is the
avoidance of punishment by finding out and supporting the strategic position favored by
those holding the most power. Another example is power enhancement, that is,
supporting the strategic options that will maximize one’s own coalition's power gain or
minimize its power loss. Other examples are "rigging", that is, selectively disseminating
information to build consensus for the favored strategic option, and building group
harmony by choosing the strategic option that minimizes internal disruptions in the
strategic group.
4.2.2 Impact of decision-making context and process on results
In an exploratory study, where case descriptions of 68 major projects were analyzed,
interesting findings related to the impact of context and process on the success of major
projects were made382. A number of contextual variables were found to influence the
project planning and implementation process, and then indirectly influence project
374 Fredrickson, J. W. & Mitchell, T. R. 1984. Strategic decision processes: Comprehensiveness and
performance in an industry with unstable environment. Academy of Management Journal, Vol. 27, pp. 399-423.
375 Braybrooke, L. J. & Lindblom, C. E. 1963. Strategy of decision, The Free Press, New York, USA. 376 Quinn, J. B. 1980. Strategies for change: Logical incrementalism. Irwin, Homewood, USA. 377 Janis, I. L. 1989. Crucial decisions. The Free Press, New York, USA. 378 Janis, I. L. 1989. Crucial decisions. The Free Press, New York, USA. 379 Hickson, D. J., Butler, R. J., Cray, D., Mallory, G. R. & Wilson, D. C. 1986. Top decisions:
Strategic decision-making in organizations. Blackwell, Oxford. 380 Simon, H. A. 1960. The new science of management decision. Harper & Row, NY, USA. 381 Janis, I. L. 1989. Crucial decisions. The Free Press, New York, USA. 382 Bryson, J. M. & Bromiley, P. 1993. Critical factors affecting the planning and implementation of
major projects. Strategic Management Journal, Vol. 14, pp. 319-337.

67
outcomes through the planning and implementation process. In addition, both process
and contextual variables have been found to affect outcomes directly. The following
table lists what the study in question383 meant by contextual variables, process variables
and project outcome variables.
Table 6: Contextual variables, process variables, and project outcome variables in project related decision-making processes
Contextual variables
− Involvement of the organization − Adequacy and skill of planning staff − Technological competence − Time available for the project
Project planning and implementation process − Amount of communication − Extent of forcing decisions and delay − Use of compromise as a resolution strategy
Project outcomes − Success − Learning
Research on corporate planning system effectiveness supports a contingency view:
characteristics of effective planning systems appear to vary by size of company and
industry384. In his study of strategy-making processes in 10 large American firms, Quinn
concluded that formal planning provided a network of information and forced managers
to think about the future. In addition, it encouraged rigorous communications about
strategic issues, and made managers feel more comfortable about decisions. However, it
was only one building block in the overall process of strategy formation385. Planning
systems contribute more to decisions considered important and risky than to those
global in nature or related to divestments386.
Participation in decision-making should increase commitment to implementing plans387.
Consideration of member input and members’ influence on a decision affect their
perceptions of fairness of a decision-making process and their commitment to the
383 Bryson, J. M. & Bromiley, P. 1993. Critical factors affecting the planning and implementation of
major projects. Strategic Management Journal, Vol. 14, pp. 319-337. 384 Bryson, J. M. & Bromiley, P. 1993. Critical factors affecting the planning and implementation of
major projects. Strategic Management Journal, Vol. 14, pp. 319-337. 385 Quinn, J. B. 1980. Strategies for change: logical incrementalism. Irwin-Dorsey, Georgetown,
Canada. 386 Sinha, D. K. 1990. The contribution of formal planning to decisions. Strategic Management
Journal, Vol. 11, pp. 479-492. 387 Child, J. 1976. Participation, organization, and social cohesion. Human Relations, May, Vol. 29,
No. 5, pp. 429-.

68
decision, attachment to the group and trust in its leader388. The normative rational model
of strategic decision-making has focused on high-quality decisions as a means of
enhancing organization performance389 390. The value of decisions depends to an extent
on the willingness of managers to cooperate in implementing those decisions391 392 393. It
would seem important that the persons operatively responsible for implementing the
projects participate in the decision-making process, as their commitment to
implementation is important. Such operatively responsible persons that should be
included in the decision-making process are most likely to be part of the middle and
junior management of the firm. Including even the lower organizational levels may be
difficult due to the larger numbers of people involved. Individuals' commitment to a
strategic decision ensures that the choices necessary for coordinated, cooperative effort
will be made394, whereas a lack of commitment places a major constraint on the range of
options the team-leader can consider395. The extent to which team members agree and
cooperate with a decision can significantly affect the leader's ability to implement it396.
The members of a team can delay or sabotage the implementation of initiatives397. Even
slight delays can prove critical in highly competitive and dynamic environments398.
In addition to increasing their commitment to the decisions, another reason why the
persons that will be operatively responsible for implementing the decisions should be
involved in the decision-making process is that they are likely to have valuable
information concerning the decisions. They should have an incentive to assure that all
388 Korsgaard, M. A., Schweiger, D. M. & Sapienza, H. J. 1995. Building commitment, attachment,
and trust in strategic decisions. Academy of Management Journal, Feb, Vol. 38, No. 1, pp. 60-. 389 Hitt, M. A. & Tyler, B. B. 1991. Strategic decision models: Integrating different perspectives.
Strategic Management Journal, Vol. 12, pp. 327-351. 390 Porter, M. A. 1980. Competitive strategy. Free press, New York, USA. 391 Guth, W. D. & MacMillan, I. C. 1986. Strategy implementation versus middle management self-
interest. Strategic Management Journal, Vol. 7, pp. 313-327. 392 Maier, N. R. F. 1970. Problem solving and creativity in individuals and groups. Brooks / Cole,
Belmont, Canada. 393 Woolridge, S. W. & Floyd. B. 1990. The strategy process, middle management involvement, and
organizational performance. Strategic Management Journal, Vol. 11, pp. 231-241. 394 Deutsch, M. 1957. Trust and suspicion. Conflict Resolution, Vol. 2, pp. 265-279. 395 Guth, W. D. & MacMillan, I. C. 1986. Strategy implementation versus middle management self-
interest. Strategic Management Journal, Vol. 7, pp. 313-327. 396 Hitt, M. A. & Tyler, B. B. 1991. Strategic decision models: Integrating different perspectives.
Strategic Management Journal, Vol. 12, pp. 327-351. 397 Guth, W. D. & MacMillan, I. C. 1986. Strategy implementation versus middle management self-
interest. Strategic Management Journal, Vol. 7, pp. 313-327.

69
relevant information that helps in correctly setting the targets for which they will be
responsible is taken into consideration.
Decision-making research proposes that in the planning of projects the involvement of
the organization, adequacy and skill of planning staff and the amount of communication
are important factors impacting success of growth projects399. Thus, it would seem that
the quality of plans for growth projects could be increased by wide participation of the
personnel knowledgeable of, and responsible for, implementing them 400 401 402 403, and that
this quality would impact the success of the projects positively. The fourth hypothesis
concerns the impact of wide participation in the decision-making process on risk and
uncertainty of individual technology-leveraging projects, and reflects the managerial
services at the level of an individual growth project. The deviation of the project's
achieved results from the results expected is used as a proxy for realized risk and
uncertainty.
H4: Extensive managerial participation in the decision-making process reduces
deviation from expectations of an individual technology-leveraging project.
H4a: Participation of CEO and top management reduces deviation from
expectations.
H4b: Participation of middle management reduces deviation from expectations.
H4c: Participation of junior management reduces deviation from expectations.
Managerial resources are one of the most severe constraints to growth. Therefore their
availability in a specific growth project should promote success of the project.
398 Eisenhardt, K. M. 1989. Making fast decisions in high-velocity environments. Academy of
Management Journal, Vol. 32, pp. 543-576. 399 Bryson, J. M. & Bromiley, P. 1993. Critical factors affecting the planning and implementation of
major projects. Strategic Management Journal, Vol. 14, pp. 319-337. 400 Dean, J. W. Jr. & Sharfman, M. P. 1993. Procedural rationality in the strategic decision making
process. Journal of Management Studies, Vol. 30, No. 3, pp. 587-610. 401 Dean, J. W. Jr. & Sharfman, M. P. 1993. The relationship between procedural rationality and
political behaviour in strategic decision making. Decision Sciences, Vol. 24, No. 6, pp. 1069-1083. 402 Lyles, M. A. & Mitroff, J. I. 1980. Organizational problem formulation: An empirical study.
Administrative Science Quarterly, Vol. 25, pp. 102-119. 403 Miller, D. 1987. The structural and environmental correlates of business strategy. Strategic
Management Journal, Vol. 8, No. 1, pp. 55-76.

70
Commitment of CEO and top management is important for securing resources for the
project. Participation of middle management is important for structuring and managing
the project. Participation of junior management is important for commitment to
implementation success.
Using information to support decision-making should enhance the quality of
decisions404. In addition to assuring the availability of information, wide participation
also brings into the decision-making process conflicting views of the right decision to
take. It induces an information search as different parties attempt to find support to their
preferred alternative, which also increases decision quality.405 406 The decision-quality
enhancing impacts of information intensity and conflict are discussed below.
An organization's ability to adapt to changing environmental contingencies partly
depends on the organization's perceptual and information-processing capacities407.
Controversy surrounds the appropriateness of adopting a comprehensive decision
making mode when the external environment is complex and dynamic. Several studies
support the positive relationship of decision comprehensiveness and organizational
performance408 409. This holds both among entrepreneurs of small firms and professional
managers of larger firms410.
According to previous research, the impact of using a formalized process for decision-
making in unclear. On the one hand, it may help assure that all important factors and
information are taken into consideration. On the other hand, when too rigid, it may
404 Eisenhardt, K. M. 1989. Making fast decisions in high-velocity environments. Academy of
Management Journal, Vol. 32, pp. 543-576. 405 Dooley, R. S. & Fryxell, G. E. 1999. Attaining decision quality and commitment from dissent: the
moderating effects of loyalty and competence in strategic decision-making teams. Academy of Management Journal, Vol. 42, No. 4, pp. 389-402.
406 Amason, A. C. 1996. Distinguishing the effects of functional and dysfunctional conflict on strategic decision-making: Resolving a paradox for top management teams. Academy of Management Journal, Vol. 39, No. 1, pp. 123-148.
407 Terreberry, S. 1968. The evaluation of organizational environments. Administrative Science Quarterly, Vol. 12, pp. 590-613.
408 Jones, R. E., Jacobs, L. W. & Spijker, W. 1992. Strategic decision processes in international firms. Management International Review, Vol. 32, No. 3, pp. 219-236.
409 Fredrickson, J. W. & Mitchell, T. R. 1984. Strategic decision processes: comprehensiveness and performance in an unstable industry. Academy of Management Journal, Vol. 27, No. 2, pp. 399-423.

71
alienate the participants from their responsibility for the decision outcome and its
implementation. Procedural rationality can be defined as an attempt to collect the
information necessary to form expectations about alternatives and the use of this
information in the final decision. It has been empirically operationalized as a degree of
information focus, search and analysis, and the extent to which quantitative measures
are used.411 A positive relationship between procedural rationality and performance has
been found for firms facing dynamic environments. At least three studies lend empirical
support to this relationship: Priem et alii conducted a survey of 101 middle-sized and
large firms412. Miller and Friesen studied changes in environmental dynamism and
process rationality, and their impact on firm performance for a sample of large Canadian
and American firms413. Eisenhardt analyzed decision-making in eight firms in the
microcomputer industry414. No relationship between procedural rationality and
performance has been found for firms in stable environments415. Even contrary results
have been found416: Fredrickson operationalized rationality as comprehensiveness of the
planning process. He found a negative relationship between comprehensiveness and
performance in unstable environments, and a positive relationship in stable
environments. An interesting remark on rationality is that procedural rationality and
political behavior are independent dimensions of the strategic decision-making
process417.
410 Smith, K. G., Gannon, M. J., Grimm, C. & Mitchell, T. R. 1988. Decision making behavior in
smaller entrepreneurial and larger professionally managed firms. Journal of Business Venturing, Vol. 3, pp. 223-232.
411 Dean, J. W. Jr. & Sharfman, M. P. The relationship between procedural rationality and political behavior in strategic decision making. Decision Sciences, Vol. 24, No. 6, pp. 1069-1083.
412 For a more complete review on literature on rationality, performance and environment, see: Priem, R. L., Rasheed, A. M. A. & Kotulic, A. G. 1995. Rationality in strategic decision processes, environmental dynamism and firm performance. Journal of Management, Vol. 21, no. 5, pp. 913-929.
413 Miller, D. & Friesen, P. H. 1983. Strategy making and environment: the third link. Strategic Management Journal, Vol. 4, pp. 221-235.
414 Eisenhardt, K. M. 1989. Making fast strategic decisions in high-velocity environments. Academy of Management Journal, Vol. 32, pp. 543-576.
415 Priem, R. L., Rasheed, A. M. A. & Kotulic, A. G. 1995. Rationality in strategic decision processes, environmental dynamism and firm performance. Journal of Management, Vol. 21, no. 5, pp. 913-929.
416 Fredrickson, J. W. & Mitchell, T. R. 1984. Strategic decision processes: comprehensiveness and performance in an unstable industry. Academy of Management Journal, Vol. 27, No. 2, pp. 399-423.
417 Dean, J. W. Jr. & Sharfman, M. P. The relationship between procedural rationality and political behavior in strategic decision making. Decision Sciences, Vol. 24, No. 6, pp. 1069-1083.

72
Conflict in decision-making has a potentially complex impact on decision quality and
commitment to implementing a decision. On the one hand, conflict improves decision
quality, but on the other, it may weaken the ability of the group to work together418.
Perceptions of loyalty within teams strengthen the positive relationship between conflict
and decision quality, whereas perceptions of within-team competence strengthen the
positive relationship between conflict and decision commitment419.
When conflict is functional, it is generally task oriented and focused on judgmental
differences about how to best achieve common objectives420. This type of conflict is
called cognitive conflict421. Cognitive conflict is inevitable in top management teams
because different positions see different environments422. This perceptual diversity leads
to conflict over how best to accomplish an organization's objectives423 424. A reason why
cognitive conflict in some situations contributes to decision quality is that the synthesis
that emerges from the diverse perspectives is generally superior to the individual
perspectives themselves 425 426 427 428.
418 Schweiger, D. M., Sandberg, W. R. & Ragan, J. W. 1986. Group Approaches for Improving
Strategic Decision Making: A Comparative Analysis of Dialectical Inquiry, Devil's Advocacy, and Consensus, Academy of Management Journal, March, Vol. 29, No. 1, pp. 51-21.
419 Dooley, R. S. & Fryxell, G. E. 1999. Attaining decision quality and commitment from dissent: The moderating effects of loyalty and competence in strategic decision-making teams. Academy of Management Journal, Aug, Vol. 42, No. 4, pp. 389-402.
420 Priem, R. L. & Price, K. H. 1991. Process and outcome expectations for the dialectical inquiry, devil's advocacy, and consensus techniques of strategic decision making. Group and Organization Studies, Vol. 16, pp. 206-225.
421 Amason, A. C. & Schweiger, D. M. 1994. Resolving the paradox of conflict, strategic decision making and organizational performance. International Journal of Conflict Management, Vol. 5, pp. 239-253.
422 Mitroff, I. I. 1982. Talking past one's colleagues in matters of policy. Strategic Management Journal, Vol. 3, pp. 374-375.
423 Astley, G. W., Axelsson, R., Butler, J., Hickson, D. J. & Wilson, D. C. 1982. Complexity and cleavage: Dual explanations of strategic decision making. Journal of Management Studies, Vol. 19, pp. 357-375.
424 Wiersema, M. F. & Bantel, K. A. 1993. Top management team turnover as an adaptation mechanism: The role of the environment. Strategic Management Journal, Vol. 14, pp. 485-504.
425 Mason, R. O. & Mitroff, I. I. 1981. Challenging strategic planning assumptions. Wiley, New York, USA.
426 Schweiger, D. M., Sandberg, W. R. & Ragan, J. W. 1986. Group Approaches for Improving Strategic Decision Making: A Comparative Analysis of Dialectical Inquiry, Devil's Advocacy, and Consensus. Academy of Management Journal, March, Vol. 29, No. 1, pp. 51-71.
427 Schweiger, D. M. & Sandberg, W. R. 1989. The utilization of individual capabilities in group approaches to strategic decision-making. Strategic Management Journal, Vol. 10, pp. 31-43.
428 Schwenk, C. R. 1990. Conflict in organizational decision making: An exploratory study of its effects in for-profit and not-for-profit organizations. Management Science, Vol. 36. pp. 436-448.

73
Although the role of cognitive conflict in enhancing the quality of decisions and
assumptions has received strong support, it may also have negative effects on decision-
making. Two possible negative effects have been identified. First, cognitive conflict can
reduce decision-makers’ general satisfaction. According to a study carried out as a
laboratory-experiment, satisfaction within groups of decision-makers, acceptance of
decisions, and willingness to continue working with the group was highest for groups
using the consensus approach, as compared to groups using different types of cognitive
conflict approaches429. Second, cognitive conflict, when misunderstood, can cause
affective conflict, which is detrimental to decision commitment.
According to several other studies, cognitive conflict should not affect consensus and
affective acceptance adversely. Cognitive conflict should enhance understanding
through encouraging the evaluation of an alternative's underlying assumptions.
Cognitive conflict should also enhance commitment: as decision-makers debate their
perspectives, they have a chance to get their views heard in the decision process430. As a
result, they should become more committed to the decision431 432. For similar reasons,
cognitive conflict should also enhance affective acceptance. In a study of top
management teams, Korsgaard, Schweiger, and Sapienza433 found that positive affection
within teams was produced when sincere consideration was given to the input of team
members.
429 Schweiger, D. M., Sandberg, W. R. & Ragan, J. W. 1986. Group Approaches for Improving
Strategic Decision Making: A Comparative Analysis of Dialectical Inquiry, Devil's Advocacy, and Consensus. Academy of Management Journal, March, Vol. 29, No. 1, pp. 51-71.
430 Folger, R. 1977. Distributive and procedural justice: Combined impact of "voice" and improvement of experienced inequality. Journal of Personality and Social Psychology, Vol. 35, pp. 108-119.
431 Erez, M., Earley, P. C. & Hulin, C. L. 1985. The impact of participation on goal acceptance and performance: A two-step model. Academy of Management Journal, Vol. 28, pp. 50-66.
432 Folger, R. 1977. Distributive and procedural justice: Combined impact of “voice” and improvement of experienced inequality. Journal of Personality and Social Psychology, Vol. 35, pp. 108-119.
433 Korsgaard, M. A., Schweiger, D. M. & Sapienza, H. J. 1995. Building commitment, attachment, and trust in top management teams: The role of procedural justice. Academy of Management Journal, Vol. 38, pp. 60-84.

74
When conflict is dysfunctional, it is usually emotional and focused on personal
incompatibilities or disputes434. This type of conflict is called affective conflict435.
Affective conflict emerges when cognitive disagreement is perceived as personal
criticism. Brehmer argues that such misinterpretation can cause purely cognitive
disagreement to turn into emotional conflict436. For instance, it is likely that the criticism
and debate necessary for cognitive conflict could be interpreted as political playing,
where one team member tries to gain influence at the expense of another437 438. As
decision-makers engage in cognitive conflict, they may accidentally trigger affective
conflict439.
Politics, not as conflict, but as coalition formation, has also been researched. Results
indicate that politics arises from power centralization. It was found that autocratic chief
executive officers participate in politics and create political behavior among
subordinates. It also was found that politics is not organized into temporary and shifting
alliances founded on issues; instead, it is organized into stable coalitions founded on
demographic characteristics, such as office location and age. Politics within top
management teams was found to be associated with poor firm performance.440
Summarizing the above, according to decision-making research, the quality of plans for
growth projects can be increased by increasing the level of rationality in the decision-
making process, and by increasing the comprehensiveness of information utilized441 442
434 Priem, R. L. & Price, K. H. 1991. Process and outcome expectations for the dialectical inquiry,
devil's advocacy, and consensus techniques of strategic decision making. Group and Organization Studies, Vol. 16, pp. 206-225.
435 Amason, A. C. & Schweiger, D. M. 1994. Resolving the paradox of conflict, strategic decision making and organizational performance. International Journal of Conflict Management, Vol. 5, pp. 239-253.
436 Brehmer, B. 1976. Social judgment theory and the analysis of interpersonal conflict. Psychological Bulletin, Vol. 83, pp. 985-1003.
437 Eisenhardt, K. M. & Bourgeois, L. J. III. 1988. Politics Of Strategic Decision Making In High-Velocity Environments. Academy of Management Journal, Dec, Vol. 31, No. 4, pp. 737-770.
438 Finkelstein, S. 1992. Power in top management teams: Dimensions, measurement, and validation. Academy of Management Journal, Vol. 35, pp. 505-538.
439 Deutsch, M. 1969. Conflicts: Productive and destructive. Journal of Social Issues, Vol. 25, pp. 7-41.
440 Eisenhardt, K. M. & Bourgeois, L. J. III. 1988. Politics Of Strategic Decision Making In High-Velocity Environments. Academy of Management Journal, Dec, Vol. 31, No. 4, pp. 737-770.
441 Lyles, M. A. & Mitroff, J. I. 1980. Organizational problem formulation: An empirical study. Administrative Science Quarterly, Vol. 25, pp. 102-119.
442 Langley, A. 1990. Patterns I the use of formal analysis in strategic decisions. Organization Studies, Vol. 11, No. 1, pp. 17-45.

75
443 444 445 446 447 448 449 450 451 452 453 454. The fifth hypothesis concerns the impact of the
analytical quality in the decision-making process, and reflects the managerial services at
the level of an individual growth project. The deviation of the project's achieved results
from the results expected is used as a proxy for realized risk and uncertainty.
H5: High analytical quality of the decision-making process reduces deviation
from expectations related to an individual technology-leveraging project.
In this research, high analytical quality of the decision-making process refers to a
process characterized by certain qualitative characteristics. It does not as such mean that
the quality of a certain decision-making process would be better than the quality of
another one. Effectiveness of decision-making processes depends on the context.
4.3 Model of factors affecting technology-based product market entries
Based on the discussed theories and streams of research, it is hypothesized that the
boundaries to the extent of technology-based product market entries are set by the nature
of technology in question and a firm's operational capabilities for executing the entries.
Further, boundaries are set by the management’s understanding of opportunities for
443 Cray, D., Mallory, G. R., Butler, R. J., Hickson, D. J. & Wilson, D. C. 1988. Sporadic, fluid, and
constricted processes: three types of strategic decision-making in organizations. Journal of Management Studies, Vol. 25, no. 1, pp. 11-39.
444 Lyles, M. A. 1987. Defining strategic problems: Subjective criteria of executives. Organizational Studies, Vol. 8, No. 3, pp. 263-280.
445 Miller, D. 1987. The structural and environmental correlates of business strategy. Strategic Management Journal, Vol. 8, No. 1, pp. 55-76.
446 Stein, J. 1980. Contextual influence on strategic decision methods. Ph.D. dissertation, University of Pennsylvania, USA.
447 Dean, J. W. Jr. & Sharfman, M. P. 1993. The relationship between procedural rationality and political behaviour in strategic decision making. Decision Sciences, Vol. 24, No. 6, pp. 1069-1083.
448 Pfeffer, J. & Salanick, G. R. 1974. Organizational decision-making as a political process: The case of a university budget. Administrative Science Quarterly, Vol. 19, pp. 135-151.
449 Hickson, D. J., Wilson, D. C., Cray, D., Mallory, G. R. & Butler, R. J. 1986. Top decisions: Strategic decision-making in organizations. Jossey-Bass, San Francisco, USA.
450 Pettigrew, A. M. 1973. The politics of organizational decision-making. Tavistock, London, UK. 451 Mintzberg, H., Raisinghani, D. & Theoret, A. 1976. The structure of the “unstructured” decision
processes. Administrative Science Quarterly, Vol. 21, pp. 246-275. 452 Bryson, J. M. & Bromiley, P. 1993. Critical factors affecting the planning and implementation of
major projects. Strategic Management Journal, Vol. 14, pp. 319-337. 453 Hickson, D. J., Wilson, D. C., Cray, D., Mallory, G. R. & Butler, R. J. 1986. Top decisions:
Strategic decision-making in organizations. Jossey-Bass, San Francisco, USA. 454 Wally, S. & Baum, R. J. 1994. Personal and structural determinants of the pace of strategic
decision making. Academy of Management Journal, Vol. 37, No. 4, pp. 932-956.
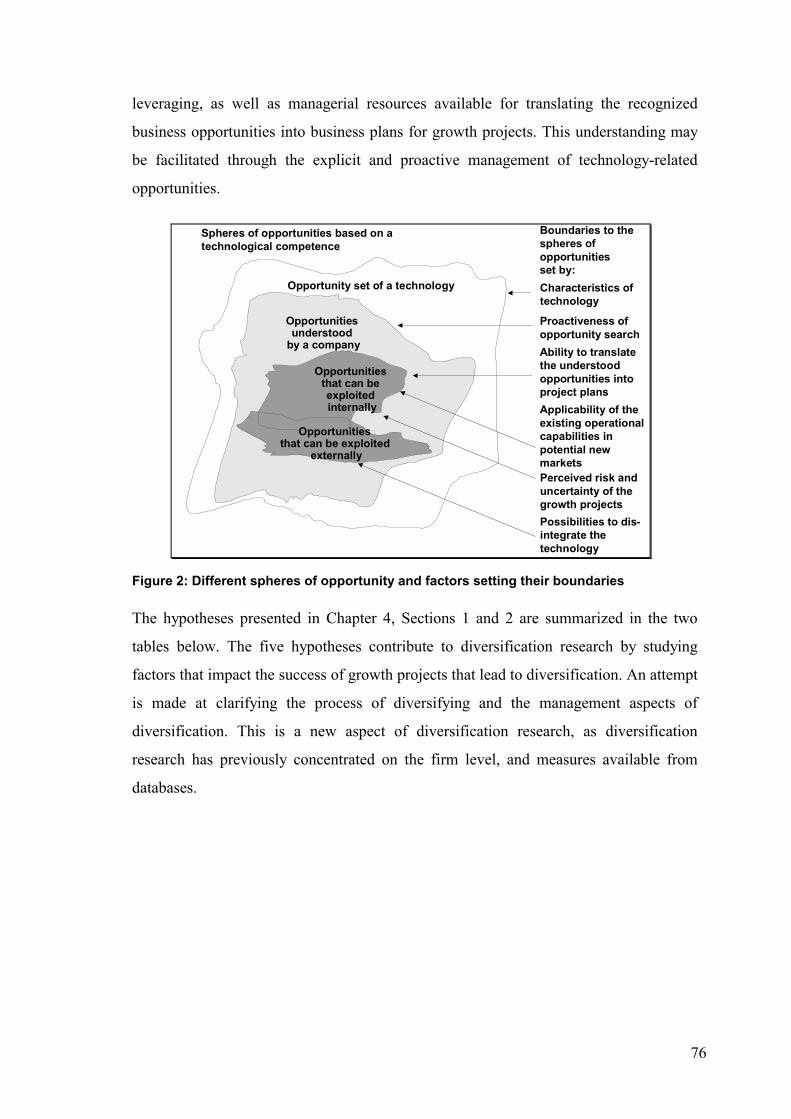
76
leveraging, as well as managerial resources available for translating the recognized
business opportunities into business plans for growth projects. This understanding may
be facilitated through the explicit and proactive management of technology-related
opportunities.
Spheres of opportunities based on a technological competence
Boundaries to the spheres of opportunities set by:Characteristics of technology
Proactiveness of opportunity search
Possibilities to dis-integrate the technology
Ability to translate the understood opportunities into project plansApplicability of the existing operational capabilities in potential new marketsPerceived risk and uncertainty of the growth projects
Opportunity set of a technology
Opportunities understood
by a company
Opportunities that can be exploited internally
Opportunities that can be exploited
externally
Figure 2: Different spheres of opportunity and factors setting their boundaries
The hypotheses presented in Chapter 4, Sections 1 and 2 are summarized in the two
tables below. The five hypotheses contribute to diversification research by studying
factors that impact the success of growth projects that lead to diversification. An attempt
is made at clarifying the process of diversifying and the management aspects of
diversification. This is a new aspect of diversification research, as diversification
research has previously concentrated on the firm level, and measures available from
databases.

77
Table 7: Summary of hypotheses based on resource-based view Research
stream Main ideas of the research stream Hypotheses
Firm level factors exist, which limit firm growth. The most important one of these factors is managerial services available for growth. Other factors are investments in growth in the form of research and development, firm size, past firm growth, and growth aspiration.
H1 H1a H1b H1c H1d H1e
Firm level factors related to technology leveraging influence the goal setting in technology leveraging projects and success of the projects. Large firm size reduces growth expectations from a leveraging project in relation to firm size. Large firm size reduces deviation from expectations in a leveraging project. High growth orientation increases growth expectations from a leveraging project. Research and development intensity of the firms increases growth expectations from a leveraging project in relation to firm size.Managerial resources available for growth support involvement in many small-scale leveraging projects.
Complexity of projects consumes managerial resources
H2 Smaller project size reduces deviation from expectations.
Resource-
based view
Risk and uncertainty of growth projects is an important constraint to firm growth, as they increase the need for the limited managerial services in planning the projects, and make managers hesitant to undertake growth projects. Applicability of existing operational capabilities in the new markets reduces risk and uncertainty of the entry, as less new kinds of capabilities need to be acquired
H3a H3b
Applicability of the existing operational capabilities in the entered market reduces deviation from expectations of an individual technology-leveraging project. In technology-leveraging projects, applicability of technology is the most critical, thereafter applicability of marketing and sales, and last applicability of operations.
The proposed contribution of Hypothesis 1 to the resource-based view is the
clarification of the role of managerial services and other potential firm level constraints
in resource-based growth. Hypothesis 2 further explores the role of managerial services
in resource-based growth through investigating whether growth projects, which are less
complex succeed better due to a lower requirement for managerial resources. The
proposed contribution of Hypothesis 3 to resource-based view is studying the positive
impact of the applicability of existing capabilities in new markets on the success of
technology-based product-market entries. Support to such a positive impact would
strengthen the preference for resource-based growth as a growth strategy455 456. A new
455 Dosi, G., Teece, D. J. & Winter, S. 1992. Toward a theory of corporate coherence: Preliminary
remarks. In: Dosi, G., Giannetti, R. & Toninelli, P. A. (Eds.) 1992. Technology and enterprise in a historical perspective. Clarendon Press, Oxford.

78
aspect is the decomposition of the different sources of uncertainty resulting from weakly
related entry markets. These different sources of uncertainty are uncertainty from having
to learn new capabilities and uncertainty of investments.
Table 8: Summary of hypotheses based on decision-making research Research
stream Main ideas of the research stream Hypotheses
Careful planning of the projects and assuring the commitment of key people to the plans can reduce risk and uncertainty in growth projects. This assures that they release the needed resources during the implementation and are committed to implement.
H4 H4a H4b H4c
Extensive managerial participation in the decision-making process reduces deviation from expectations of an individual technology-leveraging project. Participation of CEO and top management reduces deviation from expectations. Participation of middle management reduces deviation from expectations. Participation of junior management reduces deviation from expectations.
Decision-making research Quality of plans can be increased
by increasing the level of rationality and comprehensiveness of information utilized, by making use of financial analyses, and by formalizing organizational rules related to decision-making processes.
H5
High analytical quality of the decision-making process reduces deviation from expectations of an individual technology-leveraging project.
Hypotheses 4 and 5 contribute to the resource-based view by clarifying the possibilities
of reducing risk and uncertainty related to individual growth projects through
managerial action. Hypotheses 4 and 5 also contribute to research on new product
development by increasing an understanding of the process and by bringing in a general
management and project a planning perspective. These have been suggested as the next
important areas to be studied with regard to new product development457.
The factors hypothesized to affect leveraging of technology in new product-markets are
summarized in the model below. According to resource-based view, the main factors
affecting resource-based growth are the managerial services available for growth as well
as risk and uncertainty of growth projects. The first part of the model explains
leveraging of technology on a firm level, showing how the managerial services available
for growth an other firm level constraints affect firm growth. The second part of the
model explains the success of individual technology-leveraging projects, focusing on
456 Teece, D. J. & Pisano, G. 1994. The dynamic capabilities of firms: An introduction. Industrial and
corporate change, Vol. 3, No. 3, pp. 537-556.

79
factors hypothesized to reduce deviation from expectations in individual projects.
Deviation from expectations was researched only in the context of individual projects.
Deviation from expectations is at least partly specific to individual technology-
leveraging projects. It can be assumed that it is possible to identify also firm-specific
factors reducing the deviation. However, it is difficult at this point to determine a
specific capability distinguishing different firms on the grounds of their ability to
manage deviation from expectations: this would require a representative sample of
several projects from each firm.
H3 + H4 + H5 +
Firm growth
Percent of expected results reached in a leveraging project
Applic-ability of excistingoperat-ional cap-abilities
Wide participat-ion in decision-making process
Qualitative aspects of decision-making process
+
Project size
H1 – H2 –
Measured relationships
Not measured relationships
– Firm level growth const-raints
Figure 3: Model of the relationships between the theoretical constructs
Technology-based growth is studied on the project level because risk and uncertainty of
growth projects are important constraints to firm growth458. The risk and uncertainty
involved with individual growth projects, or their aggregated risk and uncertainty, is
difficult to measure. Therefore, Penrose’s459 theoretical proposition of the negative
impact of risk and uncertainty of individual growth projects to firm growth will not be
457 Tatikonda, M. V. & Montoya-Weiss, M. M. 2001. Integrating operational and marketing
perspectives of product innovation: The influence of organizational process factors and capabilities on development performance. Management Science, January, Vol. 47, No. 1, pp. 151-172.
458 Penrose, E. 1972 (orig. publ. 1959). The theory of the growth of the firm. Basil Blackwell and Mott, Oxford, 5th edition.
459 Penrose, E. 1972 (orig. publ. 1959). The theory of the growth of the firm. Basil Blackwell and Mott, Oxford, 5th edition.

80
tested empirically. Risk and uncertainty related to growth projects will be studied on the
level of individual growth projects indirectly through the deviation of reached results
from expectations set for the project.
Another factor impacting deviation from expectations in addition to the inherent risk
and uncertainty of projects is how well the project is planned and implemented. This
raises the question of what part of risk and uncertainty can be regarded controllable
through good planning and implementation, and what part is an inherent characteristic
of specific growth projects. The distinction between controllable and inherent risk and
uncertainty is not clear because most risk and uncertainty may be controllable with
enormous time investments in implementation and planning. On the other hand, it may
be, in practice, that the investments for controlling risk and uncertainty in some cases
would be so large that it would clearly not be economic for a firm to do so.

81
5 METHODOLOGY
In this chapter, the methodology of the study is presented. First, the population is
defined and sample selection is described. Next, the statistical methods used to verify
the reliability and validity of the operationalizations are presented; the methods used to
test the hypotheses are discussed in more detail in Chapter 6. Finally, the
operationalizations of the variables are presented.
5.1 Population, sample and response patterns
The target population of this dissertation comprises established Finnish and Swedish
technology-based firms engaged in technology-based diversification. Firms less than
five years old were excluded to ensure that the firms had stabilized their core operations.
The primary industry sectors included in the sample were industrial goods, electronics,
chemicals, pharmaceuticals, specialty materials, cable, software, and metal sectors.
Firms in the target population were contacted in order to find out whether they had
entered new product-markets on the basis of technological competencies that they
possessed prior to entry.
The initial screening process yielded a total of 93 companies each promising to return a
survey questionnaire. 63 companies actually returned it, which is a very high response
rate. The person who responded to the questions in most cases had been the leader of the
project, the chief of the leader, or the present manager of a business that had been
created through the project. The main reasons for not agreeing to participate in the study
were, in order of importance, not knowing the case well enough or not having the time
to participate.
The survey respondents were asked questions concerning past events. This leads to a
possible post rationalization bias, which is always present when researching past events
on the basis of data that has not been documented. Relying on documented data only
would result in a loss of richness in research settings. Post rationalization bias has been
diminished through formulating the questions to concern objective matters, not personal

82
opinions. The respondents were not asked to provide any reasoning but merely
seemingly rather unrelated facts.
Other possible problems of a survey are a typically low response rate and a possible
non-response bias resulting from this. Further problems are the difficulty of
operationalizing the theories and the possible risk that the respondent might
misunderstand some questions as a result of this difficulty. Typical cures to these
problems are the use of previously tested operationalizations that have been found to
function well, as well as a pre-testing of the questionnaire.
The questionnaire was carefully tested prior to the survey with representative technology
leveraging projects chosen from the sample. Operationalizations were adopted from
previous studies as far as possible. Where no previously used operationalizations were
available, new ones were constructed on the basis of interviews with nine companies.
All statement items were measured on a seven-point Likert-scale. The items can be
found in Appendix 2. Confirmatory factor analysis was used for assessing the reliability
and validity of the constructs. In addition, five deepening case analyses were also
conducted after the survey. These technology diversification projects were chosen from
among the 63 projects. A cluster analysis was conducted of the 63 projects to identify
clusters that would be internally as similar as possible, but, respective to each other, as
dissimilar as possible. Altogether three clusters were formed.
5.2 Statistical methods
This chapter briefly describes the statistical methods used in the analyses from a
theoretical and technical viewpoint. Confirmatory factor analysis is used for assessing
the reliability and validity of the operationalizations. Multiple linear regression analysis
is used for testing the hypotheses, and structural equation analysis for highlighting the
factors underlying the results confirmed by the regressions.
5.2.1 Testing reliability and validity of the constructs - confirmatory factor analysis
Because no external information is available on most of the variables of interest in this
study, relying on self-reported data by the relevant managers was inevitable. This is also
an advantage, as information included in databases is insufficient for studying many

83
aspects of strategy. The advantage of primary data is that it can be tailored to the exact
needs of the research and the researcher is not at the mercy of the data. However, when
using cross-sectional questionnaire data, it is important to ascertain that common
method variance is not the factor that actually causes the relationships between the
variables460 461. To diminish this problem, earlier validated constructs were used as far as
possible462. Harman’s single factor test463 was conducted to detect possible common
method bias: all variables were entered in a factor analysis. Common method variance is
present if one factor accounts for a large part of the covariance in the variables. This was
not the case: five factors with eigenvalues over 1 were extracted, while the strongest
explained only 38% of the covariance. Thus, the common method bias does not seem to
be a problem.
Confirmatory factor analysis is used for assessing the reliability and validity464 of the
operationalizations. Five types of validity have been defined. These are content validity,
criterion and nomological validity, as well as convergent and discriminant validity.
Content validity has been defined as whether “the domain of a concept is made clear and
the analyst judges whether the measures fully represent the domain”465. A theoretical
definition for the concept is necessary to accomplish content validity. Criterion validity,
also known as predictive validity or concurrent validity, has been defined as “the degree
of correspondence between a measure and a criterion variable, usually measured by their
correlation” 466. Nomological validity or construct validity467 has been defined as “the
degree to which predictions from a formed theoretical network containing the concept
460 Avolio, B. J., Yammarino, F. J. & Bass, B. M. 1991. Identifying common methods variance with
data collected from a single source: An unresolved sticky issue. Journal of Management, Vol. 17, pp. 571-587.
461 Podsakoff, P. M. & Organ, D. W. 1986. Self-reports in organizational research: Problems and prospects. Journal of Management, Vol. 12, pp. 531-544.
462 Spector, P. E. 1987. Method Variance As An Artifact In Self-Reported Affect. Journal of Applied Psychology, Washington, August, Vol. 72, No. 3, pp. 438- 444.
463 Podsakoff, P. M. & Organ, D. W. 1986. Self-reports in organizational research: Problems and prospects. Journal of Management, Vol. 12, pp. 531-544.
464 McKinnon, J. Reliability and validity in field research: Some strategies and tactics. School of Economic and Financial Studies, Macquarie University.
465 Bollen, K. A. 1989. Structural equations with latent variables. John Wiley & Sons, Chapel Hill, USA.
466 Bollen, K. A. 1989. Structural equations with latent variables. John Wiley & Sons, Chapel Hill, USA.
467 Bollen, K. A. 1989. Structural equations with latent variables. John Wiley & Sons, Chapel Hill, USA.

84
under scrutiny are confirmed”468. Both criterion and nomological validity are especially
relevant in business research, which seeks normative prescription.
Confirmatory factor analysis tests the reliability of a measurement instrument, or
operationalization, in that it confirms that a set of observed variables define a latent,
theoretical construct469. A minimum coefficient value of 0,40 for indicating that an item
can be considered a part of the construct for social sciences has been suggested470. As a
complementary measure, Cronbach’s alpha coefficients are used for assessing the
internal consistency of the measures. A common rule of thumb is that an acceptable
level of Cronbach’s alpha is at least 0,70.
Confirmatory factor analysis can also test the validity of a measurement instrument
through assessing its convergent and discriminant validity. Convergent validity is
achieved if measures of constructs that theoretically should be related to each other are
observed to be related to each other in fact. Discriminant validity is achieved if
measures of constructs that theoretically should not be related to each other are observed
not to be related to each other in fact.471 This kind of a test can be performed with
confirmatory factor analysis by factor analyzing several variables in one batch. The fact
that the individual measurement items load on the factors that, according to theory, they
should be loading on, and not on other factors, indicates the fulfillment of both
discriminant and convergent validity. The common rule of thumb of acceptable levels of
factor loadings of at least 0,60 on the primary dimension, and not more than 0,40 on any
other dimension, is used in this study.
The method of factor extraction used in this study is the maximum likelihood method.
This is because the more commonly used principal components model was actually
designed for the use in natural sciences and is unsuitable for the scales used in most
strategy research. The rotation method used is Varimax, which is the most common
468 Bagozzi, R. P., Yi, Y. & Phillips, L. W. 1991. Assessing construct validity in organizational
research. Administrative Science Quarterly, Vol. 36, pp. 421-458. 469 Bollen, K. A. 1989. Structural equations with latent variables. John Wiley & Sons, Chapel Hill,
USA. 470 Ford, J. K., MacCallum, R. C. & Tait, M. 1986. The application of exploratory factor analysis in
applied psychology: A critical review and analysis. Personnel Psychology, Vol. 39, pp. 219-314. 471 Ford, J. K., MacCallum, R. C. & Tait, M. 1986. The application of exploratory factor analysis in
applied psychology: A critical review and analysis. Personnel Psychology, Vol. 39, pp. 219-314.
85
rotation method. Varimax is an orthogonal rotation algorithm, which means that it does
not allow the factors to correlate with each other. It thereby finds a solution where each
measurement item loads as much as possible on one factor, and as little as possible on
the others.472
5.2.2 Testing the hypotheses - multiple linear regression analysis
Multiple linear regression analysis aims at explaining the variation of one dependent
variable by estimating the influence of several independent variables on the dependent
variable. The predictive power of the regression relationship is analyzed with several
measures. R² or adjusted R² measures the proportion of variance of the dependent
variable that is explained by the independent variables. Adjusted R² takes into account
the number of independent variables included in the regression and the sample size. The
significance of the overall model is measured with the F ratio. F ratio with p<0,05
indicates that the overall model is significant. The t-test indicates the significance of
coefficients of each independent variable. A t-value with p<0,05 means that a
coefficient is significant in explaining the variance of the dependent variable.
Standardized beta coefficients can be compared with each other directly.
When investigating moderating relationships with the help of regression analysis, the
regressions are carried out in two phases. First, the direct effects of the two independent
variables, the moderation effect of which is hypothesized, on the dependent variable are
tested. Then the interaction term, which is the product of the two independent variables,
is added into the analysis and another regression is performed. If the interaction term is
significant without the separate independent variables being significant, and if the
interaction term improves the regression, a moderating effect is shown to exist.
Collinearity of the independent variables can distort the results of the regression
analysis. The tests used for controlling whether there is risk of collinearity distorting the
results are VIF-values, which should be below 5 to be free from the possibility of
collinearity, and tolerance values, which should be above 0,10. 473
472 Heck, R. H. 1998. Factor analysis: Exploratory and confirmatory approaches. In: Marcoulides, G.
(Ed.) Modern Methods for Business Research, Lawrence Elbaum Associates. 473 Hair, J. F. Jr. 1995. Multivariate data analysis. Prentice-Hall, USA.

86
5.2.3 Further clarifying the causalities - structural equation modeling
The goal of structural equation models is to understand the structure among several
variables.474 They allow the examination of a series of dependence relationships
simultaneously, whereas with multiple regression analysis these would have to be
conducted separately, one after each other. In using structural equation modeling, it is
especially important to base the tested model strictly on theory. Therefore, the use of
structural equation modeling in a confirmatory way is recommended, especially if the
purpose is to find support for the hypotheses proposed.
The goodness-of-fit of the model should be assessed using several criteria. The absolute
fit indices, such as the chi-square, do not use an alternative model as a base for
comparison. They are derived from the fit of the obtained and implied covariance
matrices and the maximum likelihood minimization function. They are not very good
measures of fit because they are affected by sample size, model size, and, in the case of
chi-square, distribution of variables. Some lack of fit is always present because of
omitted variables – no model takes into account all that affects the phenomenon.475
Of the second category of fit indices, the relative fit indices, the NFI or, in other words,
the Bentler-Bonnett Nonnormed Fit Index will be used here. While before the minimum
value for these measures was suggested to be 0,9, now it is suggested that it should be at
least 0,95. These indices compare chi-square of the tested model to an index one of a so-
called null model, which is also called the baseline model or independence model.
These relative fit indices are computed using ratios of the chi-squares and degrees of
freedom. The values always range approximately, or for some of the indices exactly,
between 0 and 1. 476
The third category of fit indices is the noncentrality-based category, of which the
RMSEA or Root Mean Square Error of Approximation and the CFI or Bentler’s
Comparative Fit Index will be used here. The idea of the noncentrality-based indices is
that perfect fit is unlikely, even in the population, because some variables are inevitably
474 Snow, C. C. & Hrebiniak, L. G. 1980. Strategy, distinctive competence, and organizational
performance. Administrative Science Quarterly, Vol. 25, no. 2, pp. 317-336. 475 Structural equation modeling discussion group newsletter, Winter 2001. 476 Structural equation modeling discussion group newsletter, Winter 2001.

87
left out of the model, so variance cannot be perfectly explained. Therefore, the model
chi-square should be tested against a noncentral chi-square rather than zero. The
RMSEA value is almost acceptable, when it is between 0,08 and 0,1, and it is good
when it is less than 0,05.477 The CFI is good when it is very close to one478.
The fourth category of fit indices is the parsimonious fit category, which includes
indices such as PNFI based on NFI and PCFI based on CFI. These indices are adjusted
to penalize models that are less parsimonious and thus favor simpler models.
5.3 Operationalization of the constructs
In this chapter, the variables used to test the hypotheses as well as the
operationalizations of these variables are presented. Operationalizations have been
adopted from previous studies as far as possible. Where no previously used
operationalizations were available, new ones have been constructed on the basis of
interviews with nine companies with regard to their technology leveraging. All
statement items were measured on a seven-point Likert-scale, where the choices were
labeled as –3 = strongly disagree to 3 = strongly agree. The results of factor analyses to
test the reliability and validity of the operationalizations are included in Appendix 2,
while the exact questions are included in Appendix 3.
The firm level factors explaining project success are managerial resources available for
growth, the firms’ growth aspiration, past growth, size, and research and development
intensity. The decision-making process characteristics hypothesized to impact success of
the individual technology leveraging projects are: participation of different levels of
management in the decision-making process, participation of different functions in the
process, information intensity of the process, existence of formalized rules and process
for decision-making, use of a business plan and financial analysis to support the process,
and the degree of conflict experienced in the process. The variables related to the
applicability of existing operational capabilities in the new market are fit of marketing,
477 Browne, M. W. & Cudeck, R. 1993. Alternative ways of assessing model fit. In: Bollen, K. A. &
Long, J. S. (Eds.) Testing structural equation models. Sage Publications, Newbury Park, California, USA.

88
operational and technological competencies and capabilities, and investments in
marketing and technology, as well as technological learning.
The dependent variables are sales expectations and achieved sales in the project
compared to firm sales unrelated to the project. The firms’ industry sector and country
were included as control variables. Additional control variables are knowledge on
growth opportunities and level of technological competence.
5.3.1 Firm level constraints to growth
Managerial resources available for growth, as the most important firm level constraint to
growth, is measured with a variable representing the quantity of knowledgeable
managerial resources available for growth. The impact of management resources on
growth is difficult to measure. Attempts have been made by addressing managerial
resources from a functional or skill viewpoint, measuring formal strategic planning479 480,
administrative skills481, and management skills482. Research examining the effectiveness
of research and development investments has studied the impact of technology strategy 483 484 485 486, “overall R&D managerial capability” 487, and organizational form, as well as
control and incentive systems488 489 490 on the relationship between research and
478 Bentler, P. M. & Bonett, D. G. 1980. Significance test and goodness of fit in the analysis of
covariance structures. Psychological Bulletin, Vol. 88, pp. 588-606. 479 Michalisin, M. D., Smith, R. D. & Kline, D. M. 1997. In search of strategic assets. International
Journal of Organizational Analysis, Vol. 5, pp. 360-387. 480 Powell, T. C. 1992. Strategic planning as competitive advantage. Strategic Management Journal,
Vol. 13, No. 7, pp. 551-559. 481 Powell, T. C. 1993. Administrative skills as competitive advantage – Extending Porter’s analytical
framework. Revue Canadienne des Sciences de l’Administration, Vol. 10, No. 2, pp. 141-155. 482 Castanias, R. P. & Helfat, C. E. 1991. Managerial resources and rents. Journal of Management,
Vol. 17, pp. 155-171. 483 Bean, A. S. 1995. Why some R&D organizations are more productive than others. Research
Technology Management, Washington, Jan/Feb, pp. 25-. 484 Bean, A. S., Einolf, K. & Russo, M. J. 1999. Benchmarking your R&D: Results from IRI/CIMS
annual R&D survey for FY ’97. Research Technology Management, Washington, Jan/Feb, pp. 24-34.
485 Bean, A. S., Russo, M. J. & Whiteley, R. L. 2000. Benchmarking your R&D: Results from IRI/CIMS annual R&D survey for FY ’98. Research Technology Management, Washington, Jan/Feb, pp. 16-24.
486 Roberts, E. B. 1995. Benchmarking the strategic management of technology – I. Research Technology management, Washington, Jan / Feb, pp. 44-.
487 Roberts, E. B. 1995. Benchmanrking the strategic management of technology – II. Research Technology management, Washington, Mar / Apr, pp. 18-.
488 Hoskisson, R. E. & Hitt, M. A. 1988. Strategic control systems and relative R&D investment in large multiproduct firms. Strategic Management Journal, Vol. 9, pp. 605-621.

89
development investments and financial performance. These studies show that
managerial resources play a role, but leave unclear the justification of investing scarce
managerial resources in the generation of growth, instead of only in managing the
existing business operatively.
The extent of managerial activity targeted at firm growth could be measured by
measuring how much time the managers of a firm use for such activity. Another way
would be to look at such indicators as the number of growth projects discussed, the
number of projects that enter the first feasibility review stage, and so on. The latter way,
however, is tautological, as it measures some of the early outputs of the managerial
resources, not only the input. The first measurement, that is, the time managers of a firm
use for activities directly targeted at firm growth, measures the input of managerial
resources. In practice, there are some complications in measuring this. Such data is not
gathered or registered in the firms or by any institution, and must therefore be requested
from a representative of the company who is capable of estimating it. Such estimations
have errors because the estimators seldom know the exact nature of the work of every
person in the company. Here, it can help ask the respondent to estimate the effort
separately for each organizational level. Also, asking the respondent to make the
estimation for managers involved part-time in the activities targeted at firm growth
separately from managers who are involved as their main task can help make the
estimation more accurate. Furthermore, choosing respondents who are involved with
growth projects helps assure they know this part of the organization well.
In technology-intensive firms, an important part of productive opportunities is based on
technological competencies. The measurement of how much time the management uses
for activities targeted at firm growth can further be narrowed to managerial resources
committed to detecting and exploiting the productive opportunities based on
technological competencies. This includes taking part in developing business
opportunities based on technological competencies, as well as monitoring different
489 Hitt, M. A., Hoskisson, R. E., Johnson, R. A. & Moesel, D. D. 1996. The market for corporate
control and firm innovation. Academy of Management Journal, Mississippi State, October, pp. 1084-1119.
490 Hoskisson, R. E., Hitt, M. A. & Hill, C. W. L. 1993. Managerial incentives and investment in R&D in large multiproduct firms, Organization Science, May, pp. 325-342.

90
technologies and the strategic implications of their development. Further narrowing
down the definition in such a way should make it easier for the respondents to be
accurate in their assessments. The amount of managerial resources available for growth
was operationalized as the number of top, middle and junior managers committed full
time for the above-mentioned tasks. This variable is used as an absolute number. Using
the variable relative to, for example, all management resources in the firm, or to all
personnel in the firm, would be wrong. These merely indicate the size of the firm’s
current operations, which does not necessarily have much to do with targeted growth.
Size of the firms is controlled for separately. Full time resources are important, as part-
time resources are likely to get too tied up with daily business. Full time resources have
pressure to start projects, as this is their only measurable output. Full time resources can
establish conditions in which even uncertain and explorative projects can be started on a
small scale.
The other firm level constraints to growth, which are productive opportunity, firm size
and previous firm growth, were measured as follows. Research and development
investments as percent of sales 1997-1999 and 1985-1987 is used as a proxy for the
productive opportunity. Firm size is measured in sales. The firms’ sales growth is
measured as the compound annual growth rate during the period 1994-1999. The unit of
analysis was chosen according to what was relevant from the perspective of technology
competence and technology management variables. Thus, in case of conglomerates that
operate as financial holdings, the growth was measured only from the company that
implemented the case. The growth figures were obtained from public sources.
To strengthen the analysis of the impact of previous firm growth, the growth aspiration
of the firms was also included. The items asked from the respondents were “We wanted
to grow the company as fast as we could”, “We were prepared to sacrifice the
profitability of the company for some years if that way we could get the company to
grow fast.”, “We wanted to keep the company's operations on the same level as they
were.”, “Trying to make the company grow fast was pointless.”, “We wanted to keep the
company small.”. In addition, the respondents were asked to report what the annual
targeted growth rate of their company was at the time of starting the growth project.

91
5.3.2 Applicability of existing operational capabilities in the new market
In order to leverage its technological competence – be it in the original market or a new
one – a firm needs basic operational capabilities, such as purchasing, production, sales,
marketing, distribution, and others. These operational capabilities vary by market in
their scope, nature and relative importance. The operational capabilities deployed in the
original market can sometimes also serve as the basis for entry into new markets if the
original and new markets are closely related.
Firms that are the first to commercialize a product may fail to extract economic value
from the innovation despite the fact that the product is successful. This situation can
occur if an innovator fails to build or access competitive capacity in activities
complementary to the innovation491. Possible factors causing failure to extract economic
value from an innovation are wrong strategy, decisions of integration and collaboration,
ease of imitation, market failure, wrong positioning, and losing the profits to the owners
of the complementary assets 492 493. Some basic principles of profiting from technological
innovation as listed by Teece are as follows: 494
− Regimes of appropriability: environmental factors that govern an innovator’s ability
to capture the profits generated by an innovation, excluding firm and market
structure. Important ones are the effectiveness of legal mechanisms of protection
such as patents, copyrights, and trade secrets, as well as the nature of the technology,
meaning whether it is a product or a process technology, and tacit or codified.
− The dominant design paradigm: When imitation is possible and occurs coupled with
design modification before the emergence of a dominant design, followers have a
higher chance of having their modified product become the industry standard
491 Teece, D. J. 1988. Interfaces, Providence, May/Jun, pp. 46-62. 492 Teece, D. J. 1996. Profiting from technological innovation: Implications for integration,
collaboration, licensing, and public policy. In: Burgelman, R. A., Modesto A. M. & Wheelwright S. C. Strategic management of technology and innovation. Times Mirror Higher Education Group, USA.
493 Teece, D. J. 1997. In: Shinoya, Y. & Perlmann, M. (eds.) Innovation in technology, industries and institutions. The University of Michigan Press, USA.
494 Teece, D. J. 1996. Profiting from technological innovation: Implications for integration, collaboration, licensing, and public policy. In: Burgelman, R. A., Modesto A. M. & Wheelwright S. C. Strategic management of technology and innovation. Times Mirror Higher Education Group, USA

92
− Complementary assets needed to commercialize an innovation: competitive
manufacturing, distribution, service, complementary technologies, and other.
Complementary assets can be generic, specialized, or co-specialized. Specialized
complementary assets are such where there is a unilateral dependence of the asset on
the innovation or a unilateral dependence of the innovation on the asset. Co-
specialized complementary assets are such where there is a bilateral dependence.
When leveraging technological competencies, operational capabilities usually consist of
some combination of inbound and outbound logistics and operations such as production,
marketing, sales, and services. Operational capability is operationalized in this study by
asking the respondents first to what extent the leveraging project in question was able to
use the existing operational functions and competencies or knowledge within its first
year of operation. This is measured with variables named “marketing and sales fit”,
“technology fit”, and “operations fit”. Second, the respondents were asked, whether
significant investments were made within the first year of operation. This is measured
with variables named “marketing and sales investments” and “technology investments”.
Marketing and sales fit was assessed by asking to what extent the project was able to use
the existing sales and marketing department, distribution and after-sales networks,
knowledge of customer groups, and knowledge of sales methods. Technology fit was
assessed by asking to what extent the project was able to use the existing research and
development department and the technological competencies. Operations fit was
assessed by asking to what extent the project was able to use the existing production
plants, purchasing or sourcing department, knowledge of production technology, and
knowledge of purchasing or sourcing. Marketing and sales investments were assessed by
asking how large investments were made in sales and marketing department and in
distribution and after-sales networks. Technology investments were assessed by asking
how large investments were made in research and development department and in
technological competencies acquired from outside the company.

93
Operational capabilities have been measured with measurements similar to this study by
Teece495 496 497 498, as well as Steensma499, Davis et alii500, Woo et alii501, Sorrentino and
Williams 502, who researched production complementarities. Marketing and distribution
complementarities have been researched with measurements similar to this study by
Davis et alii 503, Woo et alii504 and Sorrentino and Williams505.
A further variable relating to technological learning during the project was used to
improve the measurement of the applicability of the technological capabilities. This
variable was assessed with the statements “New technological fields were learned from
the project”, “Learning related to technological fields caused changes in the
implementation plan of the project”, “New patents or licenses were bought in order to
implement the growth plan”, and “In the project new technological inventions were
made internally and patented”.
495 Teece, D. J. 1998. Capturing value from knowledge assets: The new economy, markets for know-
how, and intangible assets. California Management Review, Berkeley, Spring, Vol. 40, No. 3, pp. 55-79.
496 Teece, D. J. 1988. Capturing Value from Technological Innovation: Integration, Strategic Partnering, and Licensing Decisions. Interfaces, Providence, May/Jun, Vol. 18, No. 3, pp. 46-62.
497 Teece, D. J. 1986. Profiting from Technological Innovation: Implications for Integration, Collaboration, Licensing and Public Policy. Research Policy, Dec, Vol. 15, No. 6, pp. 285-305.
498 Teece, D. J. 1980. Economics of scope and the scope of the enterprise. Journal of Economic Behavior and Organization, Vol. 1, pp. 223-247.
499 Steensma, H. K. 1996. Acquiring technological competencies through inter-organization collaboration: An organizational learning perspective. Journal of Engineering and Technology Management, Jan, Vol. 12, No. 4, pp. 267-286.
500 Davis, P. S., Robinson, R. B. Jr., Pearce, J. A. II & Park, S. H. 1992. Business Unit Relatedness and Performance: A Look at the Pulp and Paper Industry. Strategic Management Journal, Chichester, June, Vol. 13, No. 5, pp. 349- 362.
501 Woo, C. Y., Willard, G. E. & Daellenbach, U. S. 1992. Spin-Off Performance: A Case of Overstated Expectations? Strategic Management Journal, Chichester, Sep, Vol. 13, No. 6, pp. 433-448.
502 Sorrentino, M. & Williams, M. 1995. Relatedness and corporate venturing: Does it really matter? Journal of Business Venturing, Jan, Vol. 10, No. 1, pp. 59-74.
503 Davis, P. S., Robinson, R. B. Jr., Pearce, J. A. II & Park, S. H. 1992. Business Unit Relatedness and Performance: A Look at the Pulp and Paper Industry, Strategic Management Journal, Chichester, June, Vol. 13, No. 5, pp. 349- 362.
504 Woo, C. Y., Willard, G. E. & Daellenbach, U. S. 1992. Spin-Off Performance: A Case of Overstated Expectations? Strategic Management Journal, Sep, Vol. 13, No. 6, pp. 433-448.
505 Sorrentino, M. & Williams, M. 1995. Relatedness and corporate venturing: Does it really matter? Journal of Business Venturing, Jan, Vol. 10, No. 1, pp. 59-74.

94
5.3.3 Characteristics of the decision-making process
Papadakis et alii506 have studied the decision-making processes in 78 corporate
investment decisions a few years after they were made. The operationalizations used by
them rely on an extensive literature search in which previously used operationalizations
were gathered together and the best of them merged into exhaustive measurement
instruments, which Papadakis et alii tested on the sample of investment decisions. With
minor modifications to make the wording of the questions more clearly applicable to
technology leveraging projects, the operationalization of the decision-making process
characteristics in this study is based on the measurement items of Papadakis et alii.
Wide participation in the decision-making process
In order to measure the extent of participation in the decision-making process, the
respondents were asked the following question: In each of the five phases of the
decision-making process, how much did CEO and top management, middle
management, as well as junior management, group leader and those at expert level
participate in the decision-making process concerning whether to commit to the growth
project? The decision-making process was divided into five phases, and the participants
were asked separately for each phase. The five phases were
- Generating growth ideas based on technological competence
- Screening out technologically realistic ideas and ones realistic with regard to
market potential
- Evaluating and comparing the ideas
- Making the final decision to enter the new market
- Choosing people responsible for implementation
The junior management, group leader and expert level participants from here on will be
referred to as “junior management”.
506 Papadakis, V. M., Lioukas, S. & Chambers, D. 1998. Strategic decision-making process: the role
of management and context. Strategic Management Journal, Vol. 19, pp. 115-147.

95
Analytical quality of the decision-making process
The analytical quality of the decision-making process can be measured by
comprehensiveness and rationality of information usage, that is, how much information
related to the decision was gathered, how much it was analyzed, and how systematically
this was done.507 Analytical quality of the decision-making process was measured with
the help of six variables that capture the most important aspects of analytical quality of a
decision-making process. The first two of these six variables are “wide functional
participation”, measuring how widely different functional departments participated in
the decision-making process, and “information intensity” of the process, measuring how
much information was used and discussed in each phase of the process. The three items
measuring information intensity, “There were many meetings in this phase”,
“Information was actively collected from different sources in this phase”, and “External
sources of information were used systematically in this phase” were measured for each
of the five phases of the decision-making process.
The next three of the six variables used to measure the analytical quality of the decision-
making are the existence of a pre-defined process for such a decision-making situation,
the requirements for a business plan, and the financial analysis done in the process. The
existence of a pre-defined process was measured with three items, which were “A
written guideline existed for this kind of a process”, “A set of criteria defining
strategically fitting growth projects existed”, and “There was a certain process for the
continuous screening for growth ideas”. The requirements for a business plan were
measured with the statements “In order to approve a decision like this, a business plan is
always required” and “In our company a business plan must always include certain
parts”. Financial analysis was measured with “Income statement or balance sheet
estimates of the project had an important role”, “Detailed cost estimates concerning the
project had an important role”, and “A plan on sources of financing had an important
role”.
The sixth of the six variables used to measure the analytical quality of the decision-
making is the amount of conflict encountered in the decision-making process. As

96
discussed earlier508, conflict can increase the quality of decision-making in two ways:
First, conflict can increase the quality of decision-making by assuring that more
information is considered and it is thoroughly discussed. Second, in the end, it can be
beneficial by causing participants in the decision-making process to be more committed
to implementing the decisions agreed upon, as they have had a chance to participate and
understand the solution better. The items measuring the degree of conflict in decision-
making processes are “During the process coalitions with different objectives were
formed within the company”, “The central persons in the process went through many
long negotiations”, “There was a lot of disagreement regarding the objectives of the
decision”, “There was a lot of disagreement concerning what would be the correct
procedure to follow in the process”, “There was a lot of disagreement regarding the
correctness of the conclusions”.
5.3.4 Level of technological competence
In the analysis of firm-level growth the level of the firm’s technological competence is
included as a control variable. Technological competencies have many different
dimensions that are difficult to measure. Measurements that would seem objective, such
as research and development spending, or the number of patents, may contain severe
distortions. One way of measuring technological competence is by asking employees’
perceptions of their firm’s technological activities and abilities. Based on Sharif and
Ramanathan’s509, Autio and Laamanen’s510, and several other scholars’ research, Lin511
has constructed a questionnaire to measure the technology capability of individual firms
as perceived by employees of the firm. Comparing experts’ rankings with the
questionnaire survey results has provided some empirical validation for the plausibility
of assessing the level of technological competence by means of such a questionnaire.
However, it is also often argued that one’s own perception of capability is imprecise.
507 Papadakis, V. M., Lioukas, S. & Chambers, D. 1998. Strategic decision-making process: the role
of management and context. Strategic Management Journal, Vol. 19, pp. 115-147. 508 See Chapter 4.2.2 509 Sharif, N. & Ramanathan, K. 1987. A framework for technology-based national planning.
Technological forecasting and social change, Vol. 32. 510 Autio, E. & Laamanen, T. Measurement and evaluation of technology transfer: review of
technology transfer mechanisms and indicators. International Journal of Technology Management, Vol. 10, Nos 7/8, pp. 643-664.

97
Depth and distinctiveness are two different dimensions of technological competence.
This distinction is important when measuring the perceived level of technological
competence. In the table below some of the essential characteristics of depth and
distinctiveness of technological capability are summarized.
Table 9: Depth and distinctiveness of technological capability Aspect of technological capability
Description
Depth of capability
− How well the company masters a certain technology − Not necessarily distinctive − Tested questionnaires for measuring exist
Distinctiveness of capability
− How much better than everyone else the company masters a certain technology
− Tested questionnaires for measuring exist
It has been found that patent data yields approximately the same assessments as peer
review judgments of the level of technological competence of firms512. The bias caused
by different propensities of firms to patent can be omitted by using citation intensity as
the measure. Citation intensity indicates the extent to which a firm’s patents have been
cited. The fundamental idea behind using citation intensity as a measure of
technological competence is that a large number of forward citations indicate that the
patent is an important invention that has lead to numerous technological improvements.
Therefore, companies whose patents are frequently cited will tend to be more successful
innovators than companies whose patents are less frequently cited.513 Empirical research
examining the use of citation intensity as a measure of the level of technological
competence has found that citation intensity is positively related to social gains from the
patents514 515 and staff perception of patent value516. Evidence has also been found that
citation intensity is positively related to litigation of the patents and, thus, possibly to
patent value, as litigation can be an indication of whether a patent right is seen to be
511 Lin, M. J. 1997. The research on the measurement of corporate technology capability. International
Journal of Technology Management, Vol. 13, issue 2, pp. 133-139. 512 Narin, F., Noma, E. & Perry, R. 1987. Patents as indicators of corporate technological strength.
Research Policy, Vol. 16, pp. 143-155. 513 Deng, Z., Lev, B. & Narin, F. 1999. Science and technology as predictors of stock performance.
Financial Analysts Journal, May / June. 514 Trajtenberg, M. 1989. The welfare analysis of product innovations with an application to computed
tomography scanners. Journal of Political Economy, Vol. 97, pp. 445-479. 515 Trajtenberg, M.1990. A penny for your quotes: patent citations and the value of innovations. Rand
Journal of Economics, Vol.21, pp.172-187. 516 Albert, M., Avery, D., Narin, F. & McAllister, P. 1991. Direct validation of citation counts as
indicators of industrially important patents. Research Policy, Vol. 20, pp. 251-259.

98
worth defending517. The citation counts used in this study have been obtained from the
American patent database. As the aim was to obtain a measure of a long-term
inheritance of technological competence, the citations were counted for the relatively
long period of 1976 to 1995, that is, until the start of the period during which the firm
growth was measured. Consistent with the approach adopted by Deng et alii518, a
measure of citation intensity, that is, citations per patent, was used here instead of the
total number of citations as the measure of the level of technological competence.
5.3.5 Dependent and control variables
The dependent variables in the model are the realized growth from the new markets that
were entered on the basis of an existing technology, the growth expectations from the
new markets at the time of entry, and reached growth as percent of growth expectations.
To measure expectations with respect to the turnover of the project, the respondents
were asked to evaluate the percentage of the whole company's turnover that the project
was expected to generate by the end of its fifth year of operation. The first year of
operation was defined to be the first year that the project had sales. To measure the
results of the project, the respondents were asked to evaluate how large a percentage of
the whole company's turnover the project actually generated by the end of the fifth year
of operation.
Reliable measurement of growth expectations from several years back in time is not
easy. Distortions in answers may be due to remembering expectations inexactly or to
purposefully misreporting them. However, this problem is not expected to be severe, as,
because of their scope, the projects in question were important projects for the firm. Due
to the importance of the projects it can be assumed that the growth expectations have
been thoroughly researched, widely discussed and documented, and that the likelihood
of expectations being remembered incorrectly or purposely misreported is consequently
low.
517 Lanjouw, J. & Schankerman, M. 1997. Stylized facts on patent litigation: value, scope and
ownership. Working Paper No. 6297, National Bureau of Economic Research, USA. 518 Deng, Z., Lev, B. & Narin, F. 1999. Science and technology as predictors of stock performance.
Financial Analysts Journal, May / June.

99
In order to be able to control the quality of the answers concerning the growth
expectations, some qualitative control questions were asked using the –3 to +3 Likert-
scale. These control questions concerned how important the project was for the firm as a
source of growth. The table below shows the correlations of the answers to these control
questions with the question concerning growth expectations as percent of original sales.
This question appears in the table that has “1” as the first column, and was formulated in
the following way: What percentage of the whole company's turnover was the project
expected to bring by the end of its fifth year of operation?
Table 10: Pearson's correlation coefficients between quantitative and qualitative assessments of growth expectations 1 2 3 4 5 6
2 A significant amount of new turnover was expected from the project 0,29*
3 The project was expected to be the most important source of growth for the company in the following years
0,44*** 0,56***
4 The project was expected to create the base for the transition of the whole company to a new market 0,30* 0,24* 0,30*
5 New technological fields were expected to be learned from the project 0,31* 0,12 0,34** 0,14
6 New contacts were expected to be gained from the project 0,24* 0,23* 0,23* 0,20 0,12
7 It was expected that a certain rising cycle could be exploited through the growth project 0,32* 0,31** 0,33** 0,36** 0,20 0,17
1 - What percentage of the whole company's turnover was the project expected to bring in the end of its fifth year of operation? *** p < .001, ** p < .01, * p < .05, + p < .1; one-tailed tests. N=63. Missing values replaced with means.
The table shows that all control questions were positively and significantly correlated
with the question regarding the growth expectations as percent of original sales. The
respondents reporting higher numeric growth goals also tend to report higher growth
expectations when responding to the qualitative questions. Most of the control questions
were also positively and statistically significantly correlated with each other.
Growth expectations and growth reached were used to calculate a dependent variable
reflecting the actual variable of interest, percent of expectations reached. This dependent
variable shows how correct the expectations were and it reflects the quality of decision-
making related to the project. It also reflects factors affecting commitment to the
implementation of the project.

100
Several control variables are necessary in order to control for factors that may have an
impact on the values of the dependent variables. Capon et alii519 provide a list of the
most prevalent causal control variables in studies of performance. This list includes
industry concentration, firm growth rate, firm size, capital intensity, research and
development intensity, advertising intensity, and market share. With regard to
explaining the performance of technology-based product market entries it was not
considered critical to control for capital intensity, advertising intensity, and market
share. The operationalizations of the variables are listed in the table below.
Table 11: Operationalization of the control variables
Variables Source
Firm size External data
Project size Asked in the questionnaire
Research and development intensity
Research and development investments as percent of sales 1997-1999 and 1985-1987, asked in the questionnaire
Main industry of the firm External data
Home country of the firm External data
The final control variable was the amount of analysis the firm had conducted concerning
its technology-based growth opportunities. This was included as a control variable to
account for any such analysis potentially done outside the group of junior, middle, or top
management. For measurement purposes, knowledge concerning growth opportunities
was detailed and narrowed down to a measure relevant for the sample firms. This
measure identified the ways in which the firms had analyzed their technological
competence to detect growth opportunities based on it. The respondents were asked
whether there had been an attempt in their company to estimate the technology-based
growth opportunities. The following statements were used to measure the variable
analyzing technological competence to detect growth opportunities
− In our company, we have a commonly known list or description of the most important areas of technological competence
− In our company, we have a list or description of all documentable technological assets, such as patents, licenses, etc.
− Documentable technological assets have been grouped into different areas of strength in technological competence
519 Capon, N., Farley, J. U. & Hoenig, S. 1990. Determinants of financial performance: a meta-
analysis. Management Science, Vol. 36, pp. 1143-1159.

101
− In our company, we have a list or description of "soft" technological assets, such as different persons' areas of specialization
− "Soft" technological assets have been grouped into different areas of strength in technological competence
− In our company, we have evaluated the competitive advantage in each area of technological competence

102
6 SURVEY RESULTS
The empirical analysis is broken into two levels: firm level, which explains how the
firm level growth constraints impact firm growth in the firms of the sample, and project
level examining the success of individual technology leveraging projects. The inclusion
of both firm and project levels is important because both opportunity detection and
successful project implementation are essential components of technology-based growth
and detail the impact of managerial resources on different levels. The firm level context
can impact the project. The firm and project levels can be linked at this stage by
studying the impact of the firm level growth constraints on the projects. Additionally the
importance of that part of the firms’ growth that the projects have brought about in the
years subsequent to their start is examined.
6.1 Descriptive data analysis
The following table shows the variables describing the types of firms and projects that
were part of the study. The Likert-scale values of –3 to 3 were transformed to a scale of
1 to 6, 1 corresponding to –3 and 6 corresponding to 3. Zero was transformed to a
missing answer.
Table 12: Descriptive statistics of variables related to types of firms and types of projects
Firm size,
sales MFIM 1999
Annualized firm growth 1995-99,
%
Research and
develop-ment
invest-ments, % of sales
Growth aspiration, percent per
year, %
Growth expectat-ions from project, % of original
sales
Reached growth through
project, % of original
sales
Percent of growth
expectat-ions
reached in the project
N 63 63 63 53 56 52 52 Mean 5482 27 16 34 38 34 105 Median 1055 12 6 15 23 20 96 Std. Deviation 14466 37 36 48 47 33 85 Skewness 5 2,8 5,5 3,7 3,4 0,9 1,6 Kurtosis 22 9,6 34,3 17,8 17,2 -0,6 3,3 Minimum 24 -12 0,8 0 1 1 0 Maximum 78377 207 256 300 300 100 400
In the table below, the firm size and research and development intensity are shown in
more detail. The most numerous classes of firms in terms of size are firms with sales
below half a billion FIM and those with sales between one and ten billion FIM. The

103
most numerous class of firms with regard to research and development intensity is the
one that has research and development investments of, as percentage of sales, between
one and five percent; this class contains 25 firms. However, most firms had higher
research and development intensity: sixteen firms had invested six to ten percent of their
sales in research and development, ten firms 11 to 20 percent, and eleven firms more
than twenty percent.
Table 13: Firm size and research and development intensity
Firm size, sales MFIM 1999 Research and development investments, % of sales
Class, MFIM Number of firms Class, % of sales Number of firms 24 to 99 4 0 1 100 to 499 19 1 to 5 25 500 to 999 8 6 to 10 16 1000 to 9999 24 11 to 20 10 10000 to 49999 7 21 to 30 4 Over 50000 1 31 to 40 2
Over 50 5
With regard to yearly sales growth, the largest class of firms is the one with yearly
growth from one to five percent. However, most firms had grown faster: 18 firms had
grown at rates between 6 and 20 percent, while 26 firms had grown each year at rates
faster than 20 percent. The firms reported having had even higher growth aspirations
during the same period. It must be noted that this was a period of strong economic
growth in Finland and Sweden.
Table 14: Firm growth and growth aspiration Annualized firm growth 1995-99 Growth aspiration, percent per year Class, percent growth per year Number of firms % of answers Number of firms % of answers
-12 to 0 3 5 1 2 1 to 5 16 25 7 13 6 to 10 7 11 10 19 11 to 15 8 13 9 17 16 to 20 3 5 3 6 21 to 30 9 14 10 19 31 to 40 6 10 1 2 41 to 50 5 8 2 4 Over 50 6 10 10 19 Total 63 100 53 100
The most common industry of the participating firms is “industrial goods”. This is
representative of the Finnish and Swedish industrial structures. The second most
common industry is the electronics industry. Because of the higher willingness of
Finnish firms to participate in a Finnish study, the sample includes more Finnish firms

104
than Swedish ones. There were, however, no significant differences in the regression
results when analyzed separately for the Finnish and the Swedish sample. The home
country of the firm was included as a control variable.
Table 15: Industries and countries Number of firms % of firms Electronics 15 24 Industrial goods 22 35 Chemicals 4 6 Pharmaceuticals 6 10 Specialty materials 2 3 Building materials 5 8 Cable 4 6 Software 4 6 Metal 1 2 Finland 49 78 Sweden 14 22 Total 63 100
In general, most of the projects that were part of the study can be considered important
projects for the participating firms, as most of the projects brought more than ten
percent of the revenues of the firms at the end of the fifth year of the project. Most of
the projects were also relatively successful in reaching more than 80 percent of their
sales target. This, however, cannot be regarded as a statement about the success of
technology leveraging projects in general, as it is possible that firms were willing to
participate in the study only with respect to successful cases, even if participation with
respect to unsuccessful cases was actively solicited. With this in mind, it is actually
interesting that as many as 21 of the 63 cases were so unsuccessful as to reach less than
80 percent of their goals. The projects took place in the later part of 1990’s, except for
three of them, which took place in the 1980’s and one, where that idea originated from
1979.

105
Table 16: Growth reached through project as percent of original sales and as percent of expectations
Reached growth through project, percent of original sales Percent of growth expectations
reached in the project
Class, new sales as percent of original sales
Number of firms
Class, percent of growth expectations reached
Number of firms
1 to 10 17 0 to 50 12 11 to 20 10 51 to 80 9 21 to 50 11 81 to 100 14 51 to 100 14 101 to 150 9
151 to 200 3 Over 200 5
Asking the respondents to indicate in how many years after the first year in which the
project had sales was the project expected to become profitable was used to control for
the profitability of the projects. At the end of the questionnaire, respondents were asked
in how many years the project actually did become profitable. The results are shown in
the table below. In general, projects reached profitability in three to four years.
According to the reported numbers, most projects seemed to reach profitability on
schedule, as can be seen in the following table. In all cases where no answer for
reaching profitability was provided the date when profitability should have been reached
had not passed yet. Thus reaching profitability by the due date was still possible.
Table 17: Profitability of the projects
Expected year of reaching profitability
Year of reaching profitability
How much before expected date profitability was
reached N 61 39 39 Mean 4 4 0 Median 3 3 0 Std. Deviation 2 3 3 Skewness 2 2 0 Kurtosis 6 6 8 Minimum 1 1 -10 Maximum 15 15 9
Resources available for identifying and planning technology-based growth projects
varied considerably between firms in amount and consistence as shown in the table
below. Most firms reported the managing director using at least five percent of his or
her time in these activities. One firm even reported identifying and planning growth
projects as the main task of the managing director. More people were in general
committed to the task on a part time basis than full time, suggesting that a structure with
a small full time core group, and a larger part time extended group, would be common.

106
In general, in both part and full time groups, more resources from lower management
levels were committed to the task than from higher levels, as can be seen in the
following table.
Table 18: Amount and consistence of managerial resources available for growth
Man
agin
g di
rect
or,
part
time
Top
man
agem
ent,
part
time
Mid
dle
man
agem
ent,
part
time
Juni
or m
anag
er /
grou
p le
ader
/ ex
pert
leve
l, pa
rt tim
e
Oth
er e
mpl
oyee
s,
part
time
Man
agin
g di
rect
or,
full
time
Top
man
agem
ent,
full
time
Mid
dle
man
agem
ent,
full
time
Juni
or m
anag
er /
grou
p le
ader
/ ex
pert
leve
l, fu
ll tim
e
Oth
er e
mpl
oyee
s,
full
time
N 57 57 57 57 57 57 57 57 57 57 Mean 1 3 6 10 14 0 2 3 6 5 Median 1 2 4 2 0 0 1 1 2 0 Std. Deviation 0,9 2,8 6,5 17,0 49,1 0,3 3,6 4,9 12,2 16,1 Skewness 3,0 1,6 1,5 2,3 6,1 3,0 5,6 3,3 4,7 4,4 Kurtosis 12,7 4,5 1,7 5,4 40,9 7,0 34,5 12,2 26,2 22,7 Minimum 0 0 0 0 0 0 0 0 0 0 Maximum 5 15 25 80 350 1 25 25 80 100
In most firms at least one person from top, middle and junior management is committed
full time to identifying and planning technology-related growth projects. In general, the
number of people committed increases towards lower levels of management. In 21
firms, more than three junior managers were committed full time to growth projects.
Table 19: Amount and consistence of full time managerial resources available for growth Number of firms per class Full time Class, number of people Top management Middle management Junior management 0 22 25 23 1 19 5 4 2 12 11 5 3 2 4 3 Over 3 2 12 21
The table below presents figures describing the two variables: technology evaluation
and patent citation intensity. The latter was used to show the level of technological
competence. The answers concerning technology evaluation ranged from the lowest 1 to
the highest 6, both mean and median lying at 4. The source for the patent citation data
was the US patent database.

107
Table 20: Technology evaluation and patent citation intensity Technology evaluation Patent citation intensity
N 62 63 Mean 4 1 Median 4 1 Std. Deviation 1,2 0,9 Skewness -0,7 2,4 Kurtosis 0,2 6,4 Minimum 1 0 Maximum 6 4
The descriptive statistics concerning the variables related to the success of individual
technology leveraging projects are shown in the table below. The answers in almost all
questions ranged between the highest and lowest possible evaluations. Only for the
variable “existing process” was the highest answer five, while, for “operations fit” and
“technology fit”, the lowest scores were 2. Means and medians were for most variables
in the range of four to five, indicating a rather positive assessment of decision-making
characteristics and fit of operational capabilities. The means and medians were on the
negative side only for the two decision-making variables: existing process and degree of
conflict. The mean and median were similarly low also for marketing and sales
investments.
Table 21: Decision-making process characteristics and applicability of existing operational capabilities in the new market
Juni
or
man
agem
ent
parti
cipa
tion
Mid
dle
man
agem
ent
parti
cipa
tion
Info
rmat
ion
inte
nsity
Exis
ting
proc
ess
Con
flict
Ope
ratio
ns fi
t
Mar
ketin
g an
d sa
les
fit
Mar
ketin
g an
d sa
les
inve
stm
ents
Tech
nolo
gy fi
t
Tech
nolo
gy
inve
stm
ents
N 53 54 63 60 60 62 62 60 62 62 Mean 5 4 4 3 3 5 4 3 5 4 Median 5 5 4 3 3 5 4 3 5 4 Std. Deviation 1,3 1,3 1,0 1,3 1,3 1,2 1,2 1,4 0,9 1,2
Skewness -1,0 -0,9 -0,4 0,0 0,3 -0,5 -0,4 0,1 -1,1 -0,4 Kurtosis 0,6 0,3 0,4 -1,0 -0,8 -0,7 0,0 -0,9 1,6 0,2 Minimum 1 1 1 1 1 2 1 1 2 1 Maximum 6 6 6 5 6 6 6 6 6 6
Most variables were usable for maximum likelihood and regression analyses in their raw
form, as they had a relatively normal distribution. All significant skewness in the
variables was positive; therefore, for the sake of the variables that were not normally
distributed, a logarithmic transformation was performed in order to assure normality.

108
6.2 Firm level context for the technology-based product market entries
This chapter investigates the firm level context for the technology-based product market
entries, focusing on the impact of managerial services available for growth on firm
growth in technology-intensive firms, and the other firm level constraints to growth
discussed in Chapter 4, Section 1. The factors impacting growth of technology intensive
firms that were included in addition to managerial resources are the firm’s growth
aspiration, size, level of technological competence, conducted technology evaluation,
the level of R&D investments, the industry the firm is active in, and its home country.
The correlations between the variables of the firm level context are presented in the
table below. The correlation of the dependent variable, firm growth, with all
independent and control variables are shown in the first column, followed by the
independent variable in column two, and control variables in rows three to fifteen. The
independent variable correlates statistically significantly and positively with firm
growth. The most interesting control variables are the research and development
investments, growth aspiration, and the electronics industry. Research and development
investments are positively correlated with firm growth and growth aspiration. The
negative correlation of research and development investments with firm size results
from the fact that research and development investments were measured as percent of
sales. Growth aspiration and electronics industry are positively correlated with each
other and with firm growth.
The positive correlation between the level of technological competence – measured as
patent citation intensity over a period of 20 years – with firm size points to a stronger
base of technological competencies in the larger firms. It tells us that, on average, the
patents of larger firms have been more frequently cited than the patents of smaller firms.
This could be due to larger firms being able to invest in absolute terms more in research
and development work. It seems plausible that, on average, larger investments yield the
more significant innovations.
The positive correlation of electronics industry with growth aspiration and research and
development investments reflects the growth of the electronics industry in Finland and
Sweden during the nineties. The emergence of new opportunities in new applications
especially in the field of communication explains the firms’ high growth aspirations and

109
high investments in research and development. The negative correlation between
Sweden as the country and firm size is caused by the generally higher willingness of the
large Finnish firms to participate when compared to large Swedish firms.
Table 22: Pearson's correlation coefficients between the independent, dependent and control variables of the technology leveraging model on firm level
Firm
gro
wth
Man
ager
ial r
esou
rces
av
aila
ble
for g
row
th
Tech
nolo
gy e
valu
atio
n
Leve
l of t
echn
olog
ical
co
mpe
tenc
e
Gro
wth
asp
iratio
n
Firm
siz
e
Res
earc
h an
d de
velo
pmen
t int
ensi
ty
1 2 3 4 5 6 7 2 Managerial resources available for growth 0,374**
3 Technology evaluation 0,058 0,049
4 Level of technological competence 0,121 0,002 0,183+
5 Growth aspiration 0,297* 0,011 -0,201+ -0,106
6 Firm size -0,016 0,125 0,186+ 0,536*** -0,181+
7 Research and development intensity 0,437*** 0,037 0,064 0,002 0,293* -0,231*
8 Electronics 0,243* -0,147 -0,119 0,261* 0,460*** -0,098 0,483***
9 Chemicals -0,159 0,119 0,124 -0,021 -0,249* 0,178+ -0,197+
10 Pharmaceuticals 0,058 -0,077 -0,029 -0,089 -0,232* -0,157 0,297*
11 Specialty materials 0,090 0,004 -0,062 0,144 -0,036 0,181+ 0,030
12 Cable -0,129 0,030 0,096 -0,206+ -0,067 -0,023 -0,035
13 Software 0,059 -0,031 0,140 -0,143 0,067 -0,246* 0,141
14 Metal 0,000 -0,015 0,072 0,000 -0,041 0,133 -0,021
15 Country: Sweden 0,200+ 0,005 -0,195+ -0,076 0,262* -0,435*** 0,163
*** p < .001, ** p < .01, * p < .05, + p < .1; one-tailed tests. N=59. Missing values replaced with means.
Regression analyses were carried out in order to test the impact of the aspects of firm
level context on firm growth. A model where all variables were entered is shown in all
the following tables presenting results of regression analyses as the “Base” model. In the
next step, the variables that were insignificant were eliminated (Backward Elimination).

110
In order to detect possible multicollinearity, the tolerance and VIF values were
examined. All tolerance values were above 0,10, and all VIF values below 5. Therefore,
multicollinearity should not cause erroneous results.
Table 23: Regression analysis results: Firm level context Dependent variable: Firm growth Base B.E. Managerial resources available for growth 0,365** 0,359** Control variables: Technology evaluation 0,091 Level of technological competence 0,076 Research and development intensity 0,324+ 0,424*** Growth aspiration 0,180 Firm size 0,042 Electronics 0,001 Chemicals -0,095 Pharmaceuticals 0,033 Specialty materials 0,076 Cable -0,092 Software -0,033 Metal 0,012 Sweden 0,134 Model: R² 0,406 0,320 Adjusted R² 0,217 0,295 F 2,150* 13,16*** *** p < .001, ** p < .01, * p < .05, + p < .1 Coefficients are standardized beta weights. Missing values replaced with means. N=59 Dependent variable is firm growth
Amount of managerial resources available for growth seems to be positively related to
growth. The only other variable having a significant impact in the regression model is
research and development intensity, which is positively related to growth.
The evidence as to the positive impact of managerial resources available for growth on
growth has to be considered as only tentative at this point. Although the relationship
receives support from the empirical data, two factors weaken the power of this evidence.
First, the direction of causality between managerial services available for growth and
firm growth cannot be known for certain. The causality that was assumed is that the
amount of managerial resources available for growth would increase firm growth. It
may, however, also be that firm growth increases the amount of managerial resources
invested in growth. The assumed direction of causality is to some extent supported by
four factors. First, the amount of managerial resources for growth was measured
concerning a period before the period from which firm growth was measured. Here the
problem may be that the respondents do not remember correctly what the situation was

111
five years ago, and respond rather according to today’s situation. Second, firm size was
controlled, which should control for the effect that as firms grow larger, their functions
become more specialized, and only because of this evolution there may be more
managerial resources available for growth. Firm size in the sample did not correlate with
managerial resources available for growth or with firm growth. This points to the
differences in the amounts of resources firms have decided to invest in growth. Third, a
theoretical argument exists for the causal relationship from managerial resources
available for growth520 to firm growth. Fourth, research on organizational structures has
proposed that the number of individuals in specialized supportive tasks or functions are
associated also with variables other than organizational size in complex ways521.
Therefore, it would seem too simplified to assume that the size of managerial resources
invested for identifying and planning growth projects would directly depend on growth.
The second factor that may be weakening the power of the evidence in favor of the
proposed relationship is that many other factors affect growth on the firm level as well.
It may be that the empirical support found for the relationship is only due to covariation
of the variable “managerial resources available for growth” with some other factors, and
that these other factors are actually the ones impacting firm growth. This problem exists
always when firm growth is the dependent variable, as controlling all factors possibly
affecting growth is virtually impossible.
6.3 Model of technology-based product market entries
The project level model of technology-based product market entries explains the impact
of the hypothesized factors on the deviation of the reached growth from the expectations
in implementing technology-leveraging projects. The hypothesized factors are firm level
factors, characteristics of the decision-making process concerning the project,
applicability of existing operational capabilities in the new market, and size of the
project.
520 Penrose, E. 1972 (orig. publ. 1959). The theory of the growth of the firm. Basil Blackwell and
Mott, Oxford, 5th edition. 521 Child, J. 1973. Parkinson’s progress – accounting for the number of specialists in organizations.
Administrative Science Quarterly, Sept, Vol. 18, No. 3, pp. 328-.

112
H3 + H4 + H5 +
Percent of expected results reached in a leveraging project
Applic-ability of excistingoperat-ional cap-abilities:
Techno-logy
Marketing and sales
Operations
Wide participat-ion in decision-making process:
CEO and Top mgmt.
Middle mgmt.
Junior mgmt.
Qualitative aspects of decision-making process:
InformationFunctional participationFinancial analysisBusiness planExisting processPoliticization
Growth orientation
R&D intensity
Managerial resources
Project size relative to firm size
H1 + H2 –
H1 –Firm level growth const-raints:
Firm size
H1 +
H1 +
H1 –
Figure 4: Model of technology-based product market entries
6.3.1 Correlations between the dependent variables
The success of the projects is measured with three dependent variables. The first
dependent variable is the deviation of reached results from expected results of the
project, as a percentage of the expectations reached. This dependent variable shows how
successful the implementation of the project was. In addition to this dependent variable,
also expected and reached growth from the project are used as dependent variables to
highlight the mechanisms through which the independent variables affect deviation from
expectations. The dependent variables have significant correlations with each other.
These are important to understand in order to be able to interpret the results correctly.
The correlations of the three dependent variables measuring the success of individual
projects together with firm growth as an indication of the ultimate success of a firm’s
growth strategy are shown in the Table below. Table 24: Pearson's correlation coefficients between dependent variables
1 2 3 2 Percent reached -0,221* 3 Growth reached 0,750*** 0,408***
4 Firm growth 0,254* -0,176+ 0,152 1 – Growth expectations *** p < .001, ** p < .01, * p < .05, + p < .1; one-tailed tests. N=63. Missing values replaced with means.

113
The statistically significant positive correlations are the following
• Growth expectations regarding the project and growth reached in the project.
This strong correlation indicates that the projects reached the expectations
relatively closely. It remains unclear, whether the expectations were “correct”:
they may have been set too low, for example, and have guided the project to
reach only so much growth.
• Firm growth and growth expectations. This is an interesting correlation
suggesting that fast-growth firms engage in larger growth projects. This may be
caused by a tendency to overstate the growth expectations in the plans due to
being used to talking about large growth numbers in the fast-growth
environment.
• Percent of growth expectations reached and growth reached. This is not
surprising, as the first is calculated with the help of the second.
The statistically significant negative correlations are the following
• Percent of growth expectations reached and growth expectations. This suggests
that small projects reach their goal more often.
• Percent of growth expectations reached and firm growth. This suggests that
faster-growth firms fail more often in reaching the goals of their growth projects.
This can be caused by engaging in larger projects.
6.3.2 Correlations between the model variables
The correlations between the variables of the model are presented in the table below.
The correlations of the dependent variables, that is, percent reached, expected growth
and reached growth, with each other are shown in the first three columns. As discussed
in the previous chapter, these three dependent variables are all significantly correlated
with each other. Projects with higher growth expectations tend to reach a lesser
percentage of these expectations.

114
With regard to the firm level variables, research and development intensity of the firm is
positively correlated with growth expectations and reached growth from the project. It is
negatively correlated with functional participation and conflict in the project, as well as
with the fit of the existing marketing and sales capabilities in the entered market. It is
positively correlated with CEO and top management participation, financial analysis,
technology investments made in the project, and technological learning in the project.
Furthermore, research and development intensity is positively correlated with growth
aspiration.
Growth aspiration is positively correlated with growth expectations and growth reached
through the project. It is negatively correlated with junior management participation,
information intensity, functional participation, existing process, and business plan. Firm
growth is positively correlated with growth expectations and operations fit. Managerial
resources available for growth is positively correlated with junior management,
information intensity, functional participation, firm size, and firm growth. It is
negatively correlated with growth expectations, growth reached from project, and
technological learning.
Interestingly, firm size is significantly correlated with most project level variables,
suggesting that the size of a firm may impact the way decisions in leveraging projects
are made. Firm size is positively correlated with participation of junior management in
the decision-making process, with information intensity of the process, functional
participation, the extent to which a pre-defined process exists for such a decision, how
important a role a business plan had in the decision-making process, the degree of
conflict, and operations fit. Firm size is negatively correlated with technology fit and
technology investments. This suggests that in larger firms the decision-making
processes of technology leveraging projects would be more participative and structured,
and also characterized by more conflict. Firm size is negatively correlated with expected
and reached growth from the project: small firms had implemented projects that brought
more sales relative to the original sales. This is not surprising, as it would seem more
difficult for a large firm than for a small firm to find a growth project that would, for
example, double its size. Furthermore, firm size is negatively correlated with growth
aspiration and research and development intensity. Smaller technology intensive firms
seem to have bolder growth aspirations than the larger ones.

115
Project level variables positively correlated with percentage reached include
participation of junior management in the decision-making process and technology fit.
Marketing and sales investments are negatively correlated with the percentage reached.
Expected growth is positively correlated with CEO and top management participation,
financial analysis and technology investments. Expected growth is negatively correlated
with conflict, technology fit and marketing and sales fit. Reached growth from the
project is positively correlated with CEO and top management participation, financial
analysis and technological learning. Reached growth is negatively correlated with
functional participation, conflict and marketing and sales fit.

116
Table 25: Pearson's correlation coefficients between the dependent, project level and
firm level variables of the m
odel of technology-based product market entries – part 1
Growth expectations
Percentage reached
Growth from project CEO & top management Middle management
Junior management
Information intensity Functional participation Financial analysis
Existing process
Business plan
Conflict
Operations fit
Marketing and sales fit Marketing and sales investments Technology fit Technology investments Technological learning
Firm size
Growth aspiration
R&D intensity Firm growth
Percentage reached
-0,221*
Grow
th from
project
0,750***
0,408***
CEO
& top m
anagement
0,351**
0,043
0,355**
Middle
managem
ent
0,197
-0,102
0,140
0,276*
Junior m
anagement
-0,075
0,242*
0,137
-0,003
0,304**
Information
intensity
0,131
0,013
0,170
0,082
0,452***
0,594***
Functional participation
-0,126
-0,186 -0,295** 0,206
0,140
0,204
0,144
Financial analysis
0,299**
0,100
0,385***
0,082
0,229*
0,244*
0,487***
-0,131
Existing process
0,081
-0,114
-0,006
0,081
0,191
0,192
0,378**
0,296**
0,121
Business plan
0,122
-0,034
0,149
0,211*
0,228*
0,204
0,448***
-0,012
0,329**
0,438***
Conflict
-0,229*
-0,059
-0,254*
0,028
0,083
-0,179
0,002
0,041
0,005
0,059
0,049
*** p < .001, ** p < .01, * p < .05, + p < .1; one-tailed tests. N=63. M
issing values replaced w
ith mean.

117
Table 26: Pearson's correlation coefficients between the dependent, project level and
firm level variables of the m
odel of technology-based product market entries – part 2
Growth expectations
Percentage reached
Growth from project CEO & top management Middle management
Junior management
Information intensity Functional participation Financial analysis
Existing process
Business plan
Conflict
Operations fit
Marketing and sales fit Marketing and sales investments Technology fit Technology investments Technological learning
Firm size
Growth aspiration
R&D intensity Firm growth
Operations fit
-0,056
-0,084
-0,129
0,028
0,257*
0,065
0,247*
0,196
0,024
0,268*
0,336**
0,029
Marketing and
sales fit
-0,241*
-0,101
-0,220*
-0,031
0,126
-0,080
0,083
-0,040
-0,053
0,113
0,046
0,256*
0,131
Marketing and
sales investm
ents
0,046
-0,244*
-0,091
-0,048
0,103
-0,164
-0,075
-0,113
0,051
0,010
-0,010
0,129
0,214*
0,360**
Technology fit
-0,211*
0,241*
-0,017
-0,050
0,108
0,002
-0,003
-0,106
-0,047
-0,055
-0,070
-0,194
0,152
0,091
0,105
Technology investm
ents
0,270*
-0,237*
0,122
0,214*
0,251*
-0,046
0,062
0,006
-0,016
-0,062
-0,066
-0,028
0,092
0,074
0,154
0,091
Technological learning
0,177
0,056
0,237*
0,079
-0,008
0,036
0,198
-0,111
0,007
0,058
0,098
0,000
0,163
-0,065
0,071
-0,144
0,432***
Firm size
-0,248*
-0,075 -0,326** -0,077
0,196
0,263*
0,307**
0,274*
0,178
0,259*
0,320**
0,338**
0,221*
0,080
-0,141
-0,276*
-0,281*
-0,028
Grow
th aspiration
0,251*
0,040
0,254*
-0,002
-0,105 -0,391*** -0,313** -0,247*
0,005 -0,387*** -0,245*
-0,124
-0,130
0,032
0,128
0,065
0,085
-0,053 -0,356**
R&D
intensity
0,472***
0,023
0,522***
0,266*
-0,048
-0,104
0,038
-0,230*
0,265*
-0,150
0,003
-0,284*
-0,148
-0,272*
0,012
0,207
0,354**
0,276* -0,494*** 0,312**
Firm grow
th
0,254*
-0,176
0,152
0,184
0,169
0,011
0,068
0,073
-0,011
0,101
0,165
-0,022
0,300**
0,087
0,035
0,014
-0,002
-0,159
0,094
0,190
0,199
Managerial
resources
-0,196+
-0,05
-0,178+
0,077
0,106
0,294**
0,254*
0,293**
0,146
0,109
0,116
0,042
0,124
0,058
-0,12
0,001
-0,140
-0,276*
0,239*
-0,090
-0,120
0,305**
*** p < .001, ** p < .01, * p < .05, + p < .1; one-tailed tests. N=63. M
issing values replaced w
ith mean.

118
6.3.3 Regression analysis results of the model of technology-based product market
entries
The regressions were carried out in three steps in order to first study the impacts of
different groups of factors on the leveraging projects before putting them together in one
model. First, only the impact of firm level factors on the goals, implementation and the
results of the projects were studied. These were firm size, two variables measuring the
firms’ growth orientation (annual firm growth during the past five years and growth
aspiration), managerial resources available for growth, and the research and
development intensity of the firms. These correspond to the first hypothesis. The results
are presented in the following Table. All tolerance values were clearly above 0,1 and all
VIF values clearly below 5. Multicollinearity should not cause problems in the
regression.
Table 27: Regression analysis – Hypothesis 1: Firm level factors Dependent variables: Growth expectations Percent reached Reached growth Base B.E. Base B.E. Base B.E. Hypothesis 1: Firm size -0,011 -0,023 -0,066 Growth aspiration 0,066 0,061 0,064 Firm growth 0,234+ 0,243* -0,199 0,101 R&D intensity 0,374** 0,397** 0,035 0,433** 0,522*** Managerial resources -0,214+ -0,223+ 0,023 -0,135 Model: R² 0,297 0,293 0,039 0,303 0,273 Adjusted R² 0,235 0,257 -0,045 0,242 0,261 F 4,82*** 8,14*** 0,46 4,96*** 22,86*** *** p < .001, ** p < .01, * p < .05, + p < .1; one-tailed tests. Coefficients are standardized beta coefficients. Missing values replaced with means. N=63
The main results from the analysis of the firm level factors corresponding to the
Hypothesis 1 are as follows:
Growth expectations reflecting the goals of the project is
• positively influenced by research and development intensity and firm growth.
This implies that high-growth firms, which also invest heavily in creating
opportunities for growth in the form of research and development, either tend to
set the expectations for the growth projects higher, or engage in larger projects.
This supports Hypothesis 1d concerning the positive impact of research and
development investments on growth expectations. It provides partial evidence to

119
Hypothesis 1c concerning the positive impact of high growth orientation on
growth expectations from a certain project.
• negatively influenced by managerial resources available for growth. This implies
that firms that invest in leveraging growth opportunities either tend to set the
expectations for the growth projects lower or engage in smaller projects. From
analyzing the impact of the factors related to technology leveraging on the firm
level, we know that the amount of managerial resources available for growth is
positively associated with overall firm growth. Therefore, it seems that firms,
which invest in managerial resources available for growth, grow faster than other
firms through implementing smaller but a larger number of growth projects. This
supports Hypothesis 1e concerning the impact of managerial resources available
for growth on growth expectations from a certain leveraging project.
Percent of growth expectations reached in the project, which reflects the implementation
success of the project, is not statistically significantly influenced by any firm level
factors. This is interesting as it suggests that a firm of any size, growth orientation, and
research and development intensity can conduct technology leveraging projects equally
successfully provided it adopts successful practices of conducting such projects. Thus,
Hypothesis 1b does not receive support: the wider range of complementary capabilities
available to large firms does not seem to significantly support reaching the project goals,
or this factor is overpowered by the negative characteristics of large firms. Furthermore,
the other hypothesis regarding firm size – H1a – remained without support, as firm size
had no impact on growth expectations.
The measure of the results of the project, growth reached through the project as percent
of original firm sales, is positively influenced by research and development intensity.
This means the research and development intensity is the only one of the firm-level
factors impacting the growth reached in the projects even after accounting for the impact
of the implementation success.
The results of the regression analyses testing Hypotheses 2, 3, 4 and 5 concerning the
impact of the project level factors are presented in the following table. All tolerance
values were clearly above 0,1 and all VIF values clearly below 5. Multicollinearity
should not cause problems in the regression. Hypothesis 2 concerns the impact of

120
project size on reaching the set targets. Hypothesis 3 concerns the impact of market
familiarity on reaching the project targets. Hypotheses 4 and 5 concern how
characteristics of the decision-making process impact the success of individual projects.
Table 28: Regression analysis – Hypotheses 2, 3, 4 and 5: Project level factors Dependent variables: Growth expectations Percent reached Reached growth Base B.E. Base B.E. Base B.E. Hypothesis 2: Expected growth -0,196 0,739*** 0,708*** Hypothesis 3: Technology fit -0,281* -0,264* 0,292* 0,305* 0,200* -0,165* Marketing and sales fit -0,247* 0,006 0,072 Operations fit -0,056 0,017 -0,050 Technology investments 0,197 0,223* -0,309* -0,313* -0,180* -0,127+ Marketing and sales investments 0,119 -0,229+ -0,230* -0,138+ -0,165* Technological learning -0,031 0,278+ 0,222+ 0,226* 0,206* Hypothesis 4: CEO and top management 0,282* 0,273* 0,250+ 0,172* 0,176* Junior management -0,263+ -0,198+ 0,351* 0,222+ 0,277** 0,268** Middle management 0,143 -0,058 -0,020 Hypothesis 5: Information intensity 0,148 -0,228 -0,174 -0,185+ Functional participation -0,200 -0,229 -0,198+ -0,190* -0,219** Financial analysis 0,189 0,318** 0,207 0,169+ 0,165+ Existing process 0,151 -0,018 -0,033 Business plan -0,071 -0,119 -0,003 Conflict -0,294* -0,319** 0,048 0,005 Model: R² 0,494 0,395 0,442 0,307 0,772 0,765 Adjusted R² 0,332 0,330 0,220 0,233 0,693 0,720 F 3,06** 6,09*** 2,10* 4,13** 9,73*** 16,92*** *** p < .001, ** p < .01, * p < .05, + p < .1; one-tailed tests. Coefficients are standardized beta coefficients. Missing values replaced with means. N=63 The main results from the analysis of the project level factors corresponding to the
Hypotheses 2, 3, 4 and 5 are as follows:
• Growth expectations is
- positively influenced by technology investments, participation of the
CEO and top management and financial analysis
- negatively influenced by technology fit, participation of junior
management, and conflict.
• Percent of growth expectations reached in the project is

121
- positively influenced by technology fit and technological learning (H3),
as well as participation of junior management (H4)
- negatively influenced by technology investments and marketing and
sales investments (H3), as well as functional participation. The latter
supports the opposite of Hypothesis 5.
• Growth reached through the project as percent of original firm sales is
- positively influenced by technological learning, participation of the CEO
and top management, participation of junior management, financial
analysis, and growth expectations
- negatively influenced by technology fit, technology investments,
marketing and sales investments, information intensity, and functional
participation.

122
As the third step, firm level as well as project level factors were combined into one
model. The results are shown in the Table below.
Table 29: Regression analysis – Hypotheses 1, 2, 3, 4 and 5: Final model Dependent variables: Growth expectations Percent reached Reached growth Base B.E. Base B.E. Base B.E. Hypothesis 1: Firm size -0,166 -0,316** -0,202 -0,232* -0,262*** Growth aspiration 0,120 0,211 0,214+ 0,109 Firm growth 0,277* 0,352*** -0,027 0,039 R&D intensity 0,046 -0,140 -0,008 Managerial resources -0,220+ -0,288** -0,139 -0,057 Hypothesis 2: Expected growth -0,278 -0,263* 0,635*** 0,592*** Hypothesis 3: Technology fit -0,295* -0,258* 0,264+ 0,244* 0,136 Marketing and sales fit -0,224+ -0,180+ -0,034 0,060 Operations fit -0,089 0,047 -0,030 Technology investments 0,125 -0,316* -0,312* -0,224* -0,190* Marketing and sales investments 0,069 -0,267+ -0,222* -0,174* -0,126+ Technological learning -0,010 0,271+ 0,243+ 0,241* 0,171* Hypothesis 4: CEO and top management 0,199+ 0,236* 0,280+ 0,236+ 0,153+ 0,177* Junior management -0,141 0,432* 0,297* 0,332** 0,216** Middle management 0,133 -0,063 0,017 Hypothesis 5: Information intensity 0,161 -0,174 -0,158 Functional participation -0,080 -0,176 -0,246* -0,135 -0,201** Financial analysis 0,219 0,360*** 0,258 0,208* 0,163* Existing process 0,163 0,029 0,002 Business plan -0,038 -0,068 0,042 Conflict -0,180 0,104 0,068 Model: R² 0,616 0,513 0,485 0,395 0,810 0,773 Adjusted R² 0,433 0,451 0,221 0,292 0,712 0,735 F 3,36*** 8,28*** 1,84*** 3,85*** 8,31*** 20,09*** *** p < .001, ** p < .01, * p < .05, + p < .1; one-tailed tests. Coefficients are standardized beta coefficients. Missing values replaced with means. N=63
The main results from the combined analysis of the firm level and the project level
factors corresponding to the Hypotheses 1, 2, 3, 4 and 5 are as follows
• Growth expectations is
- positively influenced by firm growth, participation of the CEO and top
management, and financial analysis
- negatively influenced by firm size, managerial resources available for
growth, technology fit, and marketing and sales fit

123
• Percent of growth expectations reached in the project is
- positively influenced by growth aspiration, technology fit, participation
of CEO and top management, participation of junior management, and
technological learning
- negatively influenced by technology investments, marketing and sales
investments, functional participation, and growth expectations
• Growth reached through the project as percent of original firm sales is
- positively influenced by participation of the CEO and top management,
participation of junior management, financial analysis, technological
learning, and growth expectations
- negatively influenced by firm size, technology investments, marketing
and sales investments, and functional participation
The firm level hypotheses receive some support. H1a is supported: large firm size
reduces growth expectations in relation to firm size. H1b regarding the impact of the
firm size on the percent of results reached does not receive support. H1c partially
receives support, as firm growth increases the expectations. Growth aspiration had no
statistically significant impact on growth expectations. H1d concerning the impact of
research and development intensity received no support. H1e is supported as managerial
resources reduce growth expectations from a single project. Hypothesis 2 concerning the
positive impact of small project size on reaching the goals received support.
The applicability of the existing operational capabilities in the entered market was
hypothesized to reduce deviation from expectations set to a technology-leveraging
project. This was confirmed for the part of the technological competence, but not for
marketing and sales, and operations. Investments in technology, marketing, and sales
increased deviation from expectations related to an individual technology-leveraging
project, further confirming Hypothesis 3. Applicability of the existing operational
capabilities in the entered market decreased the level to which the growth expectations

124
were set in the projects. This may be due to the closeness and familiarity of the entered
market. This finding applies in particular to the technological competence.
Wide participation in the decision-making process of key personnel was hypothesized to
reduce deviation from expectations related to an individual technology-leveraging
project. This hypothesis was confirmed for CEO, top management, and junior
management participation, but not for middle management participation. The
participation of the CEO and top management increased growth expectations. In the
model with the project level variables only the opposite seems to be the case with regard
to junior management, which points to a more conservative approach of junior
management in setting the targets for a project.
High analytical quality of the decision-making process was hypothesized to reduce
deviation from expectations. This hypothesis was not confirmed with regard to any of
the six variables used to measure different aspects of analytical quality. In fact, the
opposite was confirmed with regard to functional participation. With regard to analytical
quality and growth expectations, two of the six variables had statistically significant
relationships. In the model with the project level variables only, high level of conflict
reduced growth expectations, presumably because of restricting over-optimism in the
planning. High level of financial analysis increased growth expectations, which is likely
to point towards a practice of doing more financial analysis in larger projects.
6.3.4 Structural equation model of the project level variables
From the above regression analysis, it is not quite clear how the decision-making
process characteristics and the applicability of existing capabilities in the entered market
are related to the success of the projects. It may be that some of the variables impact the
deviation from expectations only by influencing the level at which growth expectations
are set. It is interesting to examine more in-depth through which mechanisms the
variables are related to project success. A structural equation model is constructed
where growth expectations mediate the impact of decision-making process
characteristics and the applicability of operational capabilities on the percentage of
growth expectations reached. The model is presented in the figure below.

125
CEO & top management
Junior management
Functional participation
Marketing andsales investments
Technology fit
Percent reachedGrowth expectations-0,30*
Technology investments
0,34 0,47
0,22
-0,20+
0,02
-0,28**
-0,03
0,42***
0,17
0,26*
0,37*
-0,40**
-0,18+
-0,25+
Figure 5: Structural equation model of the project level of technology-based product market entries *** p < .001, ** p < .01, * p < .05, + p < .1 The numbers on the arrows represent the maximum likelihood coefficients of the relationships. The two numbers in the boxes “growth expectations” and “percent reached” indicate the R² of these variables. Error terms are omitted from the picture.
The goodness of fit statistics of the structural equation regression indicate that the model
has a good fit. The NFI (0.985) and CFI (0.999) indicators of fit show acceptable levels,
i.e. levels very close to 1522. The RMSEA (0.0358) value is good as it is less than 0,05523.
The Chi-square statistic for the regression is 16.37. The maximum likelihood
coefficients of the model are presented in the Table below. First, the coefficients of the
impacts of the six variables on growth expectations are shown, and then the impacts of
the six variables on the percentage of growth expectations reached are shown. In the last
row, the direct impact of growth expectations on percentage reached is shown.
522 Bentler, P. M. & Bonett, D. G. 1980. Significance test and goodness of fit in the analysis of
covariance structures. Psychological Bulletin, Vol. 88, pp. 588-606. 523 Browne, M. W. & Cudeck, R. 1993. Alternative ways of assessing model fit. In: Bollen, K. A. &
Long, J. S. (Eds.) Testing structural equation models. Sage Publications, Newbury Park, California, USA.

126
Table 30: Maximum likelihood coefficients of the variables in the structural equation model Dependent variables Growth expectations Percent reached CEO & top management 0,420*** 0,366* Junior management -0,032 0,263* Functional participation -0,281** -0,397** Marketing and sales investments 0,019 -0,180+ Technology fit -0,197+ 0,167 Technology investments 0,220 -0,247+ Growth expectations -0,298* *** p < .001, ** p < .01, * p < .05, + p < .1 Coefficients are maximum likelihood coefficients. Missing values estimated. N=63
The coefficients of the impact of the CEO and top management participation on both
growth expectations, and percentage reached, are significant and positive. The
participation of the CEO and top management seems to cause setting the growth
expectations high as well as reaching the set expectations. The impact of the
participation of junior management on percentage reached is statistically significant and
positive, but the impact on growth expectations is not significant. It seems that the
participation of junior management affects the success of leveraging projects by
increasing the likelihood of reaching the set goals. Functional participation impacts
significantly and negatively both growth expectations and the percentage reached. The
impact of marketing and sales as well as technology investments on the percentage
reached is negative and almost significant, and the impact on growth expectations is
insignificant. It may be that large marketing, sales, and technology investments
contribute to the uncertainty of reaching the goals of the project.

127
6.3.5 Impact of growth projects on firm growth
The following table shows regressions demonstrating the impact that the individual,
studied growth projects have had on firm growth. The variable “growth reached” in the
projects has been added to the firm level model as an independent variable.
Table 31: Regression analysis results, firm growth as dependent variable: Firm level factors and growth reached in the studied leveraging project Dependent variable: Firm growth Base B.E. Managerial resources available for growth 0,405** 0,393*** Impact of growth from studied projects: Growth reached in the studied leveraging project 0,247+ 0,194+ Control variables: Technology evaluation 0,026 Level of technological competence 0,026 Research and development intensity 0,254 0,358** Growth aspiration 0,158 Firm size 0,111 Electronics -0,006 Chemicals -0,102 Pharmaceuticals 0,067 Specialty materials 0,045 Cable -0,068 Software -0,029 Metal -0,026 Sweden 0,158 Model: R² 0,447 0,352 Adjusted R² 0,253 0,317 F 2,312* 9,956*** *** p < .001, ** p < .01, * p < .05, + p < .1 Coefficients are standardized beta weights. Missing values replaced with means. N=59
The results show that, in general, the relationship is not statistically significant. A likely
reason to this is that some firms in the sample, which reported large growth projects as
compared to firm size, had not been growing much on the firm level due to divestment
of other business lines. This result also points out how difficult it is to draw conclusions
about the firm level growth on the basis of a single project. Projects are scoped
differently, and a firm can grow fast either by doing many small projects or few large
ones.

128
6.3.6 Interpretation of the results of the statistical analysis
What determines whether the set growth goals are reached?
According to the results from the regression analysis, projects seem to have a tendency
to reach their goals when growth expectations as percentage of total sales are set low,
when functional participation in the decision-making process is low, when marketing
and sales investments are low, and when investments in technology are low. Projects
also seem to have a tendency to reach their goals when CEO and top management
participation is high, when junior management participation is high, when technology fit
is high, when there is technological learning in the project, and when the firm has a high
growth aspiration.
Large investments in marketing, sales, and technology reduce the certainty of reaching
the goals. There are two possible reasons for this. First, investments often have some
uncertainty as to whether they will succeed in terms of delivering the expected benefits.
Second, large investments in marketing and sales as well as in technology indicate that
the project is proceeding into unfamiliar areas with regard to these aspects. The
unfamiliarity makes the success more difficult to achieve. Large growth expectations
appear to make reaching the goals more difficult. A reason for better success of smaller
projects may be easier management due to lower complexity.
The optimal project team being rather small and tightly knit can cause projects with
wide functional participation to be less likely to reach their goals. A small team assures
a sense of responsibility and commitment. A too-wide formal involvement of many
functions may lead to a loss of a sense of responsibility. Active CEO and top
management participation is a sign of their commitment and support for the project.
This commitment and support seems to be very important, especially in phases where a
project faces severe setbacks and where the project team’s faith is on trial. Participation
of junior management in decision-making assures that they are committed to the goals,
and that the goals are set realistically.
Learning new technological fields, and changes in the implementation plan caused by
them, point to technological uncertainty in the project. At the same time, however, the
variable "technological learning” points to success in the development of new

129
technological competencies. This is likely to have impacted positively reaching the
growth expectations. The positive impact of firm growth aspiration on reaching the
growth expectations is likely to be caused by the generally growth oriented culture of
the firms with high growth aspirations. Firms like this are likely to have also
implemented growth projects before, and therefore have experience of how to take them
through successfully.
It is interesting that information intensity does not impact reaching the goals. This
indicates that information gathering and analysis add no value that could be detected in
the present research setting. The level of information usage seems to depend more on
the nature of project, which determines how much information is available. Financial
analysis, existence of a formalized process, and requirement for a business plan have no
impact. The reason to this would seem to lie in the explorative role of the projects. Such
dynamic learning processes cannot profit from such structured project management
methods. They must be carried through even tough times by the project team
commitment and top management vision.
What determines how high the growth expectations are set?
One reason for unrealistically high growth expectations may be that it has been
necessary to actively sell the project to top management in order to receive the needed
financing. When growth expectations are set at a low level, the reason may be that the
decision on going ahead with the project is taken on the basis of the initial growth only.
Many projects yield many further phases of growth, but the initial phase, as such, can
already justify the initial investments. The size of growth expectations may also be
restricted by the project’s intrinsic size: some projects are likely to simply have less
growth potential than others.
Growth expectations are set on a high level, or projects are commonly large relative to
firm size when the CEO and top management are involved, when a lot of financial
analysis is carried out, and when the firm has grown fast. The role of the CEO and top
management is setting numerical targets and delivering results such as increased growth.
They are more likely to get involved in large projects relative to firm size than small
ones.

130
Junior management may prefer to set the growth expectations on a low level as they
have to implement the plans. Conflict can inflate the set expectations, as more doubts
are outed and uncertainties discussed. High marketing and technology fit indicate a
relatively familiar market. For larger growth opportunities, more unfamiliarity may have
to be accepted. Managerial resources available for growth can create munificient
conditions for starting small projects.
An interesting finding is that the firm growth aspiration does not impact growth
expectations from the project. This indicates that fast growth is not sought through only
large projects, but may also be sought through several smaller ones. Such conclusion
receives further support from the negative impact of managerial resources available for
growth on growth expectations. These managerial resources are positively related to
overall firm growth.
Interpretation of the results in light of the literature review
Firms differ in their ability to manage risks related to technology-based diversification
processes. At the outset, it was hypothesized that certain decision-making process
characteristics would reduce the deviation between growth expectations and eventually
reached growth. These characteristics were divided into two broad categories: personnel
who participated in the decision-making process and how analytical, rational,
comprehensive and full of conflict the process was. Hypothesis 4, concerning the
participation in the process, was supported; participation of top and junior management
was positively related to reaching the results expected from the project. Hypothesis 5,
concerning the analytical quality of the process, was not supported; to the contrary,
functional participation seemed to increase the deviation. It was also hypothesized that
the applicability of existing operational capabilities in the new market would reduce
deviation from expectations. This hypothesis was supported for the applicability of the
marketing and sales capabilities and technological competencies, but not for the
applicability of operative capabilities.
Based on previous research it would seem likely that the lower the person in an
organization’s managerial hierarchy, the more concrete his or her involvement in the
implementation of the decision and, thus, the greater the importance of commitment
would be. The analyses confirmed the negative impact of junior management

131
participation on the deviation from expectations. In addition, participation of junior
management was positively associated with reached growth. Managers operatively
responsible for implementing projects have an incentive to assure all relevant
information is taken into consideration. Managers at higher organizational levels, who
are not directly responsible for implementing technology-based diversification projects,
may be more prone to setting unrealistically high targets. The analyses revealed a
positive impact of top management participation on expectations, and a negative impact
of junior management participation. It may be the case that top management are more
prone to exaggerating the goals for a certain growth project in order to be able to present
good future scenarios. In addition to having an incentive to ensure the prognoses are not
overly optimistic, junior management is also likely to have more detailed practical
information critical for defining a technology-based diversification project correctly.
The impact of the applicability of existing operational capabilities on the deviation from
expectations in individual leveraging projects was discussed in light of previous
literature. It was concluded that applicability of existing operational capabilities seems
to have a threefold impact on individual leveraging projects: First, applicability of
existing operational capabilities in the new market is an indication of similarity of the
markets, which, as such, reduces the uncertainty of the entry. Second, applicability of
existing operational capabilities in the new market reduces the managerial capacity
needed for planning the entry, as more assumptions about the market can be made
without extensive information search. Third, applicability of existing operational
capabilities in the new market reduces the managerial capacity needed for acquiring or
building the necessary operational capabilities. All these three impacts should reduce the
deviation from expectations in individual leveraging projects. The results of the
empirical analysis provide a partial confirmation to the earlier research by showing that
managers can make the success of leveraging projects more likely by choosing the
projects so that the technology and marketing and sales components are as familiar as
possible.
The role of information intensity in decision-making processes has been discussed in
previous research from two perspectives. On the one hand, it seems plausible to assume
that extensive information usage would improve the quality of the plans, while, on the
other, it can make the process heavy and lost in details. In this study, the data does not

132
support the view that information intensity as such would actually be beneficial to the
decision-making process in contributing to the accuracy of plans. A reason for this may
be the overruling importance of a committed and empowered operative project team in
assuring that all relevant information is considered, irrespective of formal information
channels and processes. Other aspects of analytical quality may fail to support the
projects for similar reasons: so much learning is necessary in the projects that planning
and structuring are useless.
A further interesting finding from the survey is that technology-leveraging projects that
are small relative to firm size seem to reach more of the expected results than larger
projects. In new product development research, an important question is the impact of
project complexity on the success of new product development projects524. Project
complexity may be smaller in smaller scale projects, and therefore, it could be that
smaller scale projects would succeed better. In the case of technology-based product-
market entries, this would imply that committing resources to the project gradually
might be the optimal investment policy. After reaching certain milestones, more
resources would be committed for the next stages if the results of the first stages were
favorable.
524 Tatikonda, M. V. & Montoya-Weiss, M. M. 2001. Integrating operational and marketing
perspectives of product innovation: The influence of organizational process factors and capabilities on development performance. Management Science, January, Vol. 47, No. 1, pp. 151-172.

133
6.4 Summary of the survey results
The table below summarizes the results of the regression analyses. Hypothesis 1, 3 and
4 were partially supported. Hypothesis 2 was supported. Hypothesis 5 was not
supported.
Table 32: Summary of hypotheses based on resource-based view Hypotheses Variables Support
H1 H1a H1b H1c H1d H1e
Firm level factors related to technology leveraging influence the goal setting in technology leveraging projects and success of the projects. Large firm size reduces growth expectations from a leveraging project in relation to firm size.Large firm size reduces deviation from expectations in a leveraging project. High growth orientation increases growth expectations from a leveraging project. Research and development intensity of the firms increases growth expectations from a leveraging project in relation to firm size. Managerial resources available for growth support involvement in many small-scale leveraging projects.
Firm size Firm size Firm growth Growth aspiration R&D intensity Managerial resources
Yes Yes No Yes No No Yes
H2 Smaller project size reduces deviation from expectations.
Project size relative to firm size
Yes
H3a H3b
Applicability of the existing operational capabilities in the entered market reduces deviation from expectations of an individual technology-leveraging project. In technology-leveraging projects, applicability of technology is the most critical, thereafter applicability of marketing and sales, and last applicability of operations
Operations fit Marketing and sales fit Technology fit Marketing and sales investments Technology investments
No No Yes Yes Yes Yes
Table 33: Summary of hypotheses based on decision-making research Hypotheses Variables Support
H4 H4a H4b H4c
Extensive managerial participation in the decision-making process reduces deviation from expectations of an individual technology-leveraging project. Participation of CEO and top management reduces deviation from expectations. Participation of middle management reduces deviation from expectations. Participation of junior management reduces deviation from expectations.
CEO and top management Middle management Junior management
Yes No Yes
H5
High analytical quality of the decision-making process reduces deviation from expectations of an individual technology-leveraging project.
Functional participation Information intensity Existing process Basic financial analysis Business plan Conflict
Opposite No No No No No

134
7 CASE ANALYSIS
In order to be able to explain the results and the conclusions more fully, five deepening
case analyses were conducted. The growth projects for the case analyses were chosen
from the 63 projects of the survey. A cluster analysis was conducted of the 63 projects
to identify clusters that were internally as similar as possible, but, respective to each
other, as dissimilar as possible. As variables of comparison, the independent variables
that were significant in the regression analysis were chosen, as they reflected the project
characteristics that seemed to be relevant for project success. The cluster analysis was
conducted using the Ward method and squared Euclidean distances. In the cluster
analysis, three clusters were identified. The Dendrogram is attached in Appendix 4. The
first cluster had 19 cases, the second 35, and the third 9. In the figure below, the
differences between the means of the clustering variables for each cluster are shown.
0
1
2
3
4
5
6Technology fit
Technology investments
Technological learning
Marketing and sales fit
Marketing and sales investments
CEO and top management participationJunior management participation
Middle management participation
Functional participation
Financial analysis
ConflictCluster 1Cluster 2Cluster 3
Figure 6: Cluster profiles

135
In terms of technology fit, technological learning, and functional participation the
clusters are relatively similar. In each of these three variables, Cluster 1 has the highest
values, Cluster 2 the second highest and the Cluster 3 the lowest, but, as stated before,
the differences are very small. Clusters 1 and 2 are similar along four dimensions. They
are close together, but further from Cluster 3 in technology investments, marketing and
sales fit, junior management participation, and middle management participation.
Clusters 1 and 3 are close together, but further from Cluster 2 in three dimensions:
marketing and sales investments, financial analysis, and conflict. Clusters 2 and 3 have
the fewest similarities.
Cluster 1 differs from the other two clusters by clearly having the highest mean values
for the CEO and top management participation, as well as for junior management
participation. Cluster 1 also has the highest values for middle management participation
and technology investments, but, in these variables, Cluster 2 has mean values that are
almost as high. Therefore, Cluster 1 is characterized by a high participation of the
essential groups.
Cluster 2 differs from the other two clusters by having clearly the highest values for
marketing and sales investments, financial analysis, and conflict. Therefore, Cluster 2
seems to be a cluster of marketing, rather than technology, driven cases, as compared to
the cases of the other clusters.
Cluster 3 differs from the other two clusters by having clearly the lowest values for
technology investments, CEO and top management participation, junior management
participation, and middle management participation. Furthermore, cluster three also has
the lowest value for marketing and sales fit. Cluster 3 is thus characterized by low
participation of the essential groups.
The five cases were chosen so that there would be at least one case from each cluster. A
further criterion was that and that the cases would represent all types of cases projects
with regard to how much growth was reached through the project and the percentage of
growth expectations reached in the project. The figure below shows all cases according
to growth reached, and percentage of growth expectations reached. The form of the
marker indicates cluster membership.

136
Reached growth through project, percent of original sales
200100504030201054321
Percent ofgrowth
expectationsreached in the
project
500
400
300
200
100
90
80
70
60
50
40
Clusters
3
2
1
Case BCluster 2
Case ACluster 1
Case CCluster 3
Case DCluster 1
Case ECluster 3
Figure 7: Cases according to expectations reached and growth as percentage of original sales
Project A belongs to Cluster 1. It is a small project with regard to reached growth as a
percentage of original sales. It is, however, a successful project with regard to
percentage of growth expectations reached. Almost twice as much growth was reached
as was expected. Project D also belongs to Cluster 1. It is a large project that increased
the firm’s sales by 33 percent of the original sales, and a successful project with regard
to reached expectations, as expectations were exceeded by 30 percent. Project B belongs
to Cluster 2 and is a relatively large project that increased the firm’s sales by 20 percent.
This project is an example of growth expectations that were clearly set clearly too low:
the project brought four times as much turnover as was expected. Project C belongs to
Cluster 3, and is a relatively large project that increased the firm’s sales by 20 percent.
The growth expectations were exceeded by 33 percent. Project E also belongs to Cluster
3. This is a large project that generated 35 percent growth, but still only 58 percent of
the growth expectations were reached. This project highlights the importance of
understanding both the factors influencing success with regard to reaching expectations,
and success with regard to reached growth. Project E performed worst of the five
projects with regard to reaching expectations, yet it brought the most growth, relative to

137
original sales. The figure below shows how closely each case follows the mean of its
cluster in each variable, which indicates how well the case represents its group.
Technology f it
Technology investments
Technological learning
Marketing and sales fit
Marketing and sales invest.
CEO and top managementparticipation
Junior managementparticipation
Middle mgmt. particip.
Functional partic ip.
Financial analysis
Conflic tCluster 1Case DCase A
Technology fit
Technology investments
Technological learning
Marketing and sales fit
Marketing and sales invest.
CEO and top managementparticipation
Junior managementparticipation
Middle mgmt. particip.
Functional particip.
Financial analysis
Conflict
Cluster 2Case B
Technology fit
Technology investments
Technological learning
Marketing and sales fit
Marketing and sales invest.
CEO and top management participationJunior management participation
Middle mgmt. particip.
Functional particip.
Financ ial analysis
Conflict
Cluster 3
Case C
Case E
Figure 8: The five cases compared to their cluster profiles
Data for the case analysis was collected by interviewing three persons from each of the
case companies. One of the interviewed persons was the survey respondent, and the
other ones were other managers who had been closely involved in the project. In one of
the firms, (Project D) it was not possible to identify a third person anymore due to
personnel changes. Here, the survey respondent was interviewed twice. In addition to
interviews, the case analysis is built on the survey responses as well as other quantitative
data. The five cases, their characteristics with regard to the variables used for explaining
the success of the projects, and the reasons that, according to the firms, lead to successes
and failures in the projects, are discussed below.

138
7.1 Descriptions of each of the five cases
7.1.1 Project A
The opportunity for Project A was discovered through a slow process over several years.
The market, which was close to the main markets of the division, seemed attractive
because of greater possibilities for differentiation and higher profitability. Later, a
technological solution matured that could possibly give the firm a competitive
advantage in the market. The technological solution developed gradually through the
development of one of its components and trials with another.
”The technological innovation for entering market X consisted of combining two already known technologies. One of them was a very standard technology that had been used in the whole industry for a long time. The other one had been already built by the firm to a factory in country Z. In order to be able to combine the two technologies the most difficult technological development was done in a specific technological field K, where the firm had previous experience through a development project that had not succeeded.”
Through this learning process, more and more people in the firm became convinced that
the technological solution was possible. A strong champion of this point of view who
was a part of the top management of the parent firm strengthened the belief in the idea,
both among the top management, as well as in the division. Further, the fact that the
new product market was well known in the firm and that it was an established market
with a foreseeable demand strengthened the belief in the idea. The idea faced opposition
from an acquired factory abroad and the employees who originated from it. They
claimed that another, less advanced, technology would bring the same advantages as the
new one. Overall, in discovering the opportunity, technology, as well as marketing and
sales fit, played a role; the opportunity was revealed through the knowledge of both the
markets and technology. The responses reported in the questionnaire for Project A were
4,5 for technology fit and 5 for marketing and sales fit, both relatively strong statements
for the fit. This familiarity helped plan and implement the project successfully and
without major surprises. A further factor important for the discovery of the opportunity
and, perhaps, for the existence of the champion was the firm’s aggressive growth search
at that time. It should also be noted that the firm was capital-rich and in a business
sector where very large investments were routinely made.
“Both the market and the technological fields were familiar, so actually the project could not have failed, and there were no major surprises in executing it."

139
"The technology was just combining two old things. Therefore, there weren’t many surprises in the project, because all components were familiar.”
”Yet another strength of the project was that there were not so many new aspects. The business logic was well known: we knew exactly to which markets and segments we would be targeting the products."
”The project was perceived very low risk, because the market already existed based on the older technologies, and had high margins. The new technology would bring competitive advantages in variety of different types of products that could be manufactured in the same plant, and in being able to satisfy the increasingly demanding standards of some segments."
"We had the people to operate the factory, they had a lot of experience in manufacturing products of this type." "We had already been building factories so we knew how the process of the project proceeds. We had the right people and resources in place."
”The firm had an aggressive growth strategy in the eighties. Especially the division had outrageous growth goals in the beginning of the nineties.”
The CEO and top management had an important role in strongly supporting the project
because of its strategic importance in enabling further growth projects based on this one.
Because of this strong support, there was no need to sell the project to the management,
and therefore the growth expectations could be set at a moderate level. The middle
management had an important role in structuring the project and managing it according
to the project plans. This was the only case of the five where the middle management
had such a role. At the same time, this was the most clearly foreseeable of the projects,
and this kind of an important middle management role seems natural. The responses
reported in the questionnaire for Project A were 5,5 for CEO and top management
participation, 5,6 for middle management participation and 3,4 for junior management
participation. Of these, the two first are relatively strong statements about CEO, top
management and middle management participation in the decision-making process,
whereas the last one indicates low junior management participation. In other, more
uncertain projects, junior management participation in decision-making was important
for project success because the projects proceeded in an explorative manner and
therefore the executors were in a leading position. In Project A, due to the high
familiarity of all factors, proceeding in a structured, well-planned manner was possible.
An additional distinctive factor in Project A was that large capital investments were
made, which can and need to be planned carefully. In the other projects, the investments
were mainly in R&D, and thereby the domain of the executing R&D management.
Despite the greater involvement of middle-management, also in this case the atmosphere
was entrepreneurial.

140
"Top management was very committed because of the strong champion. They were also very interested in monitoring the process. The champion was able to secure the necessary resources for the whole four year development period, even if one year was the worst in the firm's history."
"The champion concentrated on this project and neglected all other work. He had the experience to recognize that this was a golden egg."
"Management set the sales goals."
"Middle management participated a lot in the project decision-making. The manager level people [middle management] had a greater role in making the final decisions on the goals, but this was preceded by discussion."
”R&D engineers participated in making the plans. The participation was important for commitment and creating a good spirit. The plans were fairly good, but of course some surprises occurred as well. For example, the development in the technological field K did not proceed exactly according to plans. The R&D engineers decided on goals within smaller parts of the project.”
"The titles were not important, what was important was that it was challenging and fun."
"We just had the right group of people, I don’t know why you just don’t always get the same feeling. They were very committed, young but experienced."
The responses reported in the questionnaire for Project A concerning the analytical
quality of the decision-making process were quite low, around three, as was typical for
all answers across the different cases. This generally low level indicates that, in this
type of innovative project, structured methods for enhancing the analytical quality of
decision-making do not seem to be generally appreciated by companies. The responses
were 2,6 for wide functional participation, 3 for financial analysis, and 3,6 for conflict.
Of these, conflict is slightly higher than in the other cases because of the higher
politicization around this project than encountered in the other ones; here, there were
more conflicting goals driving the people’s agendas than in the other four cases, which
were driven by an entrepreneurial spirit. These conflicts reduced the enthusiasm for the
project somewhat and complicated the implementation. Participation on parties not
directly responsible for the project was seen as detrimental for project results. The
means of financial analysis were seen as incapable of accounting for the upside potential
of such a strategically important project, and were therefore deemed as not very helpful
due to their pessimism.
”At that time, the finance guys of the firm did not have so much say, it was pretty much an engineer firm.”
"Probably the finance guys made some [financial analyses]."
"Projects are easily killed with too much analysis and payback schedules.”
”The finance director was always pessimistic, as usual.”
”In –91 an extensive feasibility study of the project was made. It focused on what was the market for the products, what were the needed investments and costs, and the development costs. Significant financial reserves were built for the factory, but they were

141
never needed. Therefore, the building of the factory was a bit cheaper than was expected. The feasibility study also included an analysis of the competitive situation in the market X and making the own goals based on this.”
"Market studies were made. We had to keep a low profile to keep the project secret from competitors.”
”There was no burden of bureaucracy with reporting or strict rules, because everyone was satisfied with how things were going.”
”A system of monthly project reporting was used. The project was below the planned costs all the time. In the meetings of the project management group the business management, the local [plant] management and the business development manager were present.”
”Another important success factor was the fact that the project was a clear project with a project organization, people committed to it and knowing that the project was their first priority and also showing the rest of the organization that the project had a high priority. Furthermore, the project had a concrete goal which was a factory catering the needs of market X with a competitive advantage due to the new technology. This concrete goal was clear although it was not clear at all that the technological solution would be found. Also, the project-character assured clear responsibilities. All this created a good spirit among the team. In –91, all components of the project were begun: process development, product development, investment analyses, and logistics development. About 50 people worked for the project in R&D, ten to twenty in making the investment analyses and hundreds building and operating the factory. This kind of a clear project launch and organization was unusual in Finland at that time.”
”A person important in the concept development of the project was [a person with a cultural background very different from the Finnish], called B. B was the trusted man of [the champion], and worked as the R&D director of the business unit. The different style due to the cultural background caused some irritation.”
“In the beginning of the project some Swedes tried to get support to their idea of using a technology developed by a prominent player in the industry instead of developing the new technology. The old technology proposed by the Swedes had been used in their factory, and it was simpler than the new technology to be developed. This conflict lived in the R&D department for a long time and caused even some proactive disturbing of the development work.”
“Another conflict was, when the factory management identified an interesting product niche, and the center of excellence said they should not pursue this niche, because the market did not exist. The factory management went on with the product anyway and it became a success.”
”All in all, there could be no serious conflict that could have harmed the project, because [the champion] advocated the project in the top management of the firm, and therefore the top management followed the project with great interest. It was well known to all that the project had the support of the top management.”
The response reported in the questionnaire for Project A was 2 percent for growth
expectations. Further growth projects based on this project were expected and partly
already planned. Licensing the technology was planned from the start; accordingly, the
technological solution was patented as it was developed. One reason for setting the
immediate growth expectations on a moderate level was the unquestioned strategic
importance of the project – no matter how much growth would be reached within the
first years, it was seen that the project was necessary for the future. Another reason was
the low risk, which allowed low return expectations. Even if the technological solution

142
had not been found, the investments in the plant could have been recouped in the
traditional markets.
"We never had to sell the product to the management, because we had a very strong champion in the top management. In addition, although large investments were made, they were not so big when compared to other investments in the group. Furthermore, the investments were recoverable in any case, because if we hadn't succeeded in combining the two technologies, we could anyway have used them separately in the factory.”
"The reporting and goals were set so that we had a little bit of pressure to get things out and ready.”
"A lot was expected of this project, because a search for a foreign partner was started early, telling the candidates about the new, good technology, even if the technology was not ready yet. However, the immediate sales goals were not stretched too much, [the champion] probably just pushed the project through in the top management.”
"Even in the case of not succeeding with the technological solution, the firm could have used the two technologies separately as before, so the only loss would have been the R&D investment. The investments in the physical plants would have been recovered. The R&D investment was not perceived high, as so many people worked in R&D anyway, and it was only good that they were kept busy by a concrete project. Only the existing R&D personnel was utilized, so this wasn’t seen as a real extra investment.”
Due to the familiarity of all components related to the project, be it market or
technology related, the implementation of the project proceeded nearly exactly
according to plans. The project spent all along somewhat less money than had been
budgeted and was on time in all phases. This was due to the goals having been set with
quite a lot of buffer. The most important negative surprise was some delay in the
development of an important technological solution. The most important positive
surprise was the good development of the licensing business. The responses reported in
the questionnaire for project A were 3,5 for technology investments, 1 for marketing and
sales investments, and 3,3 for technological learning.
”The project was a large and important project for the firm with investments of about half a billion FIM, of which a bit more than 100 MFIM in development, and most of the rest in the plant. On the other hand, at the same time the firm was making other, even much larger investments and even the new head office cost 300 MFIM. So compared to these, maybe it wasn’t so big in the end.”
All the goals of the project were reached on schedule during the project, and at the end.
The project exceeded the expected sales goals by 100 percent. According to the
interviewees, there were several reasons to this: First, top management was highly
supportive even during turbulent times in the parent during the project. Second,
surprise-free implementation followed from a familiarity with all components. It also
was a result of having set moderate sales goals. There was no pressure to set them
higher.

143
Implementation
No surprises
Decision-making process
Foreseeableproject: strongmiddle mgmt.participation
Top management:strong support due
to strategicimportance
Expectations
Moderate:no need to sell
Further projectswere expected
Idea
High technologyand marketing fit
Growth investmentsactively searched
Results
Further projectsundertaken
200% of expectedsales goal reached
Technologylicensed
Champion in topmanagement
Process in allphases as
expected orbetter
Figure 9: Project A
7.1.2 Project B
The opportunity for Growth Project B was discovered by following the emergence of a
new, large market, and realizing that the firm already had a technology that could meet
some of this market's urgent needs. The technological fit was thereby perfect; the old
technology was applied, while only a few interface technologies had to be learned. The
marketing fit was weaker, as the market was at such an early stage that no one knew
how it would develop and what the exact needs were. Further, the market required a
new sales and marketing approach. However, this lack of sales and marketing fit was
compensated through good contacts to the parent firm, which was one of the pioneers of
the market. This helped by giving confidence to those concerned with developing the
opportunity. The idea also faced opposition, mainly because of the newness of the
market. This made it difficult for some employees to believe that the emerging market
would ever reach volumes sufficient to make it a serious business. Until then the
company had been a large volume commodity producer. It can be said that technology
fit was important for the discovery of the opportunity, and lack of marketing fit was
compensated through a good partner. The responses reported in the questionnaire for
Project B were 6 for technology fit, and 2,5 for marketing and sales fit. The marketing
and sales fit response is low. This lack of familiarity led to setting the goals markedly

144
too low, which caused some bottlenecks over the course of the project. Had these
bottlenecks been even more severe, the firm would not have been able to grow as fast as
the market. This could have cost the firm the position as one of the world leaders.
”The product consisted in addition to the basic product also of some interface products that attached the product to a system – so we went more to a systems business. These interface products were developed with the help of some partners. The partners were found with the help of the parent firm’s contacts. We also had a good partner for materials development.”
”We had a long term tradition of own [technological] competence, and the right development people. We also had the right partners, although they could have been some other firms as well. We managed to keep the scope of the project right, so we had no financing or credibility problems. We managed to keep going with the project so long that even the top management acknowledged the results.”
"Of course there was some work in developing the business model, but there we had analogies from our old businesses as well. Selling was very similar as in old markets, but demands were higher and the business model was more one of selling solutions including installation etc."
”Nobody had any experience of the market X. There was especially one employee at the parent firm, who developed the technology, had the right vision, and believed in it. Many others started believing in it because of him. Despite being so visionary, he had the other foot on the ground.”
”We had a very munificient environment because were able to exploit the network of the parent.”
The participation of top management seems important in a project like this where the
results cannot be foreseen and uncertainty is very high. Yet, despite the active
participation of CEO and top management, there was still some doubt in the project.
Growth expectations were set as high as was possible without losing credibility, but still
this was only a quarter of what was reached. Such an estimation error can have serious
implications for implementation if, for example, resources are insufficient to satisfy the
demand. The project did indeed face some problems of too fast a growth in the
implementation phase. However, Project B did have sufficient top management support
for guaranteeing most of the necessary resources for the implementation. The responses
reported in the questionnaire for Project B were a relatively high: 5,2 for CEO and top
management participation, and 4 for middle management participation. The
participation of junior management could not be estimated separately because the roles
of junior and middle management were very close to each other in the firm. Again, in
this case factors very important for the success of the project were giving the decision-
making power to ones concretely responsible for achieving the results, and the existence
of a tightly knit, extremely committed team believing in the idea.

145
”The goals and plans were pretty much set by the market X business unit directors, about six persons. From higher at the top there were no other persons involved, because this was a high enough group. The parent just sometimes commented on things like what the capital utilization should be or things like that.”
”All organizational levels were very involved in making the plans and setting the goals, every level for their own areas of responsibility.”
”The R&D engineers participated very much in the decision-making process all along, a couple of the were really the inventors of the most critical, patented technological innovations.”
“It is essential that the ones responsible for implementing each part of the plans are also making the plans and decisions. They really know the resource, time and other requirements, and they must be committed to the plans so they can’t blame anyone else for having made bad plans.”
”Culture of entrepreneurship was important: courage, responsibility, understanding that small failures are a normal part of all development. But if you try out ten ideas, and two fail, you’ll still have eight that succeeded. Too much caution is not good.”
”You have to have both visionaries and realistic people: the visionaries never get anything done, and the realists try to slow everything down, but together in the right mix they work well. With this regard we had the right mix for this project to succeed.”
”We already at that time had certain people in the firm and the parent firm with a strong vision of the market X. The top management wasn’t really that visionary, they were at one point even going to sell the division away.”
The responses reported in the questionnaire for the analytical quality of the decision-
making process for Project B were at a level normal for all responses: 3 for wide
functional participation, 2,7 for financial analysis, and 2,6 for conflict. Extensive
planning and analysis was considered of limited use, as the market was so new that all
prognoses were bound to be significantly off. However, all information that was
available was carefully considered. The project group had direct access to the partners,
which were a good source of information, and the best overall data. Therefore,
information flow was informal. Conflict was seen as enhancing the quality of the plans
in this situation that was very difficult to assess.
”We had the best possible information in the leadership group of the X business unit. All who were responsible for the implementation were in the group. That group had in it all the knowledge of the market X that there was in the whole firm. There were also technical people in the group.”
“It was helpful that we had the contacts to the machinery manufacturer within the group. From within the group we got profitability information and production information from the machinery manufacturers.”
”The functional departments participating in the decision-making process were sales, R&D and production, but not finance, as there were no individual large investments.”
”We did not make a business plan of the project. It was such a new market and there was no historical data or market reports, no references. The market did not exist, it is now three or four times of what it was.”
”We did use all possible available market forecasts, and, of course, the parent firm was a very important source of information. But the market was so new that nobody knew how it would develop, so the information was not so useful.”

146
”Developing the business case and the product both proceeded well, and their development was summarized once a year.”
”Of course there was normal disagreement and arguing, but it was mainly only fruitful. You have to have different forces pulling in different directions in order to discover all aspects of the issues. Discussion must be allowed even if it sometimes seems to go wrong. But this way you arrive at more accurate results, nobody is so smart that he would know everything, so its good to combine the viewpoints.”
”Mostly the arguments were not personal, but of course some people always take it personally and don’t want to understand others.”
”In the end we were able to show that the project was worth continuing and the parent should not sell the division yet. In order to do this we had to come up with really convincing arguments, which was fruitful for sharpening the focus of the project even more.”
The response reported in the questionnaire for Project B was 5 percent for growth
expectations. This was a grave underestimation caused by the unfamiliarity of the
market. The dynamics are highlighted by the quotes below.
”We budgeted enormous growth figures, as much as we thought we could without seeming ridiculous. This was in the budgets and long range planning of –93. In the industry annual growth figures were 3 to 5 percent, we budgeted in the range of ten percent. This was considered too aggressive, although it turned out that the market grew even many times so much. All in all, the goals were set really high, but we reached even much more.”
”The goals were based very much on the parent firm’s predictions of the development of market X. Then we planned what would be a realistic market share to reach. We had a goal of being the third largest globally in market X and technologically always at least as good as the best. Both goals have been reached, and now we want to become second largest.”
”Growth was limited by limits of organic growth: a global goal needs to be broken down, and tackled step-by-step. For example, we had one really good year and neglected to expand the organization during that year because we were getting the sales so easily. This caused a setback the next year. Its important to grow the organization continuously because you can’t speed up suddenly.”
”The product has also all kinds of other applications in addition to the market X, so we weren’t so dependent on how market X would develop.”
Investments were needed in the form of increased size of the sales force, managerial
time, and developing a new sales approach. This project required a more system-
oriented sales approach than the traditional sales of the commodity products. The
responses reported in the questionnaire for Project B were 4 for technology investments,
5 for marketing and sales investments, and 4,8 for technological learning. The sales
goals of the project were exceeded by 300 percent. According to the interviewees, this
resulted from good implementation by the informal, un-hierarchical and empowered
project team and by the dramatic market growth that could not have been foreseen as the
market was only just emerging.

147
”The investments were mainly in developing new machines and building new production lines. We were able to use the existing buildings.”
”All in all this was considered a very safe project because we did not invest in any new types of skills or capacity.”
”The direction set ten years ago is still valid, actually everything has proceeded according to plan, we have been doing just the kinds of things we planned in the action plans at that time. No major changes in direction have been made. This was despite the fact that the market was completely new.”
”Good partners are important for growing and developing towards excellence. Outside our group, we had partners in interface technologies. We were actively searching for partners, through our own external network and through the parent’s network.”
Implementation
Decision-making process
Strong top and middle mgmt.
participation and support
Also doubts as to the size of the
opportunity
ExpectationsIdea
High technology fit
Entered market was emerging
Results
At this moment the firm has no clear
further growth strategy
400% of expected sales goal reached
Parent pioneer in entered market
Informal andunhierarchical,
empowered project team
"Set as high as possible without
sounding ridiculous"
Expectations were set clearly too low
Problems of too fast growth
Figure 10: Project B
7.1.3 Project C
In Project C, marketing fit was essential for discovering the opportunity. The firm had
exceptionally close ties to several layers of customers, which was essential for
discovering the need for the product and for having faith in the existence of the demand
for it.
"The impulse from the clientele was completely clear: there was a market for the new product. We definitely wanted to participate in it."
The management of the company had very close relationship to the client industries of the end users, and to all other stakeholders in the industry, this is how they got their development visions."
"Good contacts to all stakeholders enabled monitoring of the development of the segment. We were wise to wait until we saw which solution would become the dominant one, because we were still able to develop a product that was so much better than those of the competitors, that we got a significant market share. We almost started to make a product with another solution, it was really good that we in the end decided not to do it."

148
"Electronic measurement instruments, and measuring as such were new in the industry. Being the first ones in this with a good product, we were able to steer the development. We had good contacts to the customers of the end users [end users are suppliers to them], and they told clearly about their needs. They told us in which direction we should develop the product so that it would be easier for them to utilize the produce of the end users. In addition, cooperation with the end users was important."
“Even the owner was familiar with the usage of our products, even he had the end user perspective."
Technology fit helped in discovering the technological solution for this new product.
The firm had already experience in some of the technologies that were essential for the
new solution. The responses reported in the questionnaire for Project A were relatively
high: 5 for technology fit and 4 for marketing and sales fit. This high degree of
familiarity was essential for discovering the idea, for developing the technological
solution and for being able to fine-tune the product functionality to please the
customers. Moreover, in this relatively ambitious development project requiring a high
degree of innovativeness, the familiarity helped overcome some challenging situations,
and was thus essential for reaching the results.
"In Finland we were in close cooperation with the customers. Internationally we then started to offer the same solution that we had developed in cooperation with the Finnish customers."
"We had the channels and the customers, we did not have to invest in developing them."
"The project was pretty low risk, because we were so sure about the need for the product. We did not need a large market to justify the development and entry costs, actually we designed the production for small quantities. We proceeded with the feet on the ground, and the risk never grew large. We were so deeply rooted in the industry that we never doubted that we could develop the product so that it would become good. The industry is a very secure one; we could count on it that the products of this industry will sell around the world. In this industry it is safe to be a part of the chain.”
"We already had competence in hydraulics and mechanics, and in the beginning we made the new products only based on these. Then, once we had entered the market and gone further in the development with the end users, we started developing competencies in automatics and measurement technology, and added product functionalities based on these. What we were able to offer in the beginning was a new technique using stronger materials, extra strong metals. What the customers needed was a strong but light tool. Before, we had already had competence in aluminum and extra strong steel, so we were well positioned to develop the product. Developing the measurement instrument and programs was quite difficult."
"Critical was that we started the development of the electronics early enough, in this we cooperated with a university and a government organization for technological development."
"The measurement development was speeded up by the development by one of the customer industries of the end users: this customer industry was developing optimization of production and our measurement systems were an essential link in this optimization. This optimization was important for the Finnish firm of the client industry to stay internationally competitive. One person in our firm was especially important in seeing the importance of this optimization and therefore our measurement systems."
"In the implementation it was important to decidedly take the project further, have good relationships outside the firm, and let customers test the product. If there were any

149
problems they were fixed, and then it was important to have courage to enter into the test period. We did not have the testing resources ourselves."
Project C demonstrates the importance of junior management when developing a truly
new offering with significant innovation. Junior management had close contacts to
customers, which supported them in innovatively discovering the unmet needs. This,
together with their hands-on experience with technological development and
independence in the development work, yielded a munificent environment for the
success of the development work. Despite granting this independence, CEO and top
management were also involved in a supportive role. Middle management had a less
important role because structured, project-type, management in such an explorative
venture seems, in general, to be difficult. The strong involvement of junior management
had two impacts: the goals were set moderately, and the implementation was successful.
On the other hand, the CEO’s and top management’s understanding of the importance of
the opportunity led to planning several successive phases, the implementation of which
depended on the success of the previous phases. In this way, it was possible to target
large growth without at any time taking much risk. Furthermore, whilst targeting large
growth, the sequences were manageable in scope, and the empowerment of junior
management was possible. The whole company was involved in the project; the CEO
and top management succeeded in making all employees excited about it. The responses
reported in the questionnaire for Project C were relatively high 4,7 for the CEO and top
management participation, low 1,6 for middle management participation and very high
5,7 for junior management participation.
"The management was monitoring the project all the time, it was considered very important. They were involved in the daily work, everyone was doing everything."
"Top management was very committed, and achieved the commitment of everyone else."
"It was clear to everyone that there was nothing that was more important. This project was always a priority at every level."
"The management was setting goals and making decisions together with the stakeholder groups: the end users, their customers, and development institutes of the industry.”
"The engineers were very involved in the decision making. Internally, the craftsmen with hands on experience had the say. The sales brought in feedback from the field and competitor comparisons.”
"The company was small, everyone did everything, everyone was involved."
"The atmosphere was good, everyone was developing the product, gave their input, and we also needed all ideas."

150
"We did also have difficult phases, for example, the first prototype did not work at all. Then the question was whether to forget about it or start from the beginning. We wondered what was causing the problems, and we fixed them. Here management support was very important, they always encouraged us to try once more."
"In some difficult phases we worked night and day, when we had to do an improvement to a customer, and it caused that we had to change the entire system. Then we incorporated this change in the next batch of machines."
"We made many mistakes along the way, but we persistently strove for our goal. The product became ready only with a lot of work. We had gathered our experts and learned our competencies before and along the way, and with intensive labor we got the development work ready."
The technologically oriented personnel, more than anyone else, drove both market and
technological innovation. Participation of other functional groups was limited. The
project was driven by a discovered demand, which could be easily verified because the
main customers were well known. No large initial investments were needed, because the
project was implemented stage-wise, each stage being independently profitable. For
these reasons, no extensive financial analysis was conducted. The responses reported in
the questionnaire for Project C were 3 for wide functional participation, 1 for financial
analysis, and 2,8 for conflict. An entrepreneurial spirit as well as direct and informal
communication enabled through tightly knit teams was considered very important for
the success of the project. Formal analysis or formalized information flows as well as
formalized participation in the decision-making process were considered useless. Such
factors were even considered potentially harmful for the project in restraining the
entrepreneurial spirit through bureaucracy.
"Everyone met daily, discussed, information was flowing well."
"Production, after-sales, marketing, everyone was very committed to develop the business."
"Inside the company the culture and communication is very open, we have absolutely no hierarchy. We try to really utilize 200-300 brains instead of only a few."
"We also had very many external channels for information."
"The finance department made profitability calculations."
"Tekes was in the background, not in the daily work. They did help but also caused bureaucracy in order to find out the impact."
"The work was not systematic, but followed more a blurred logic. We gathered enormous amounts of material [information and experiences] and then got a feeling of what is the right way. There were so many different inputs that it was impossible to somehow systematically handle them. The certainty came bit by bit when we saw what worked."
"We did not have a business plan, we worked very much on intuition." "For Tekes we had to do project plans." "In the beginning we made extensive competitor analyses."
"In the beginning we had a schedule for the pre-design and prototype. After that, we had setbacks. Thereafter, we proceeded one day at a time, making rough plans on the level of half a year."

151
"We did not experience big conflicts, just some technical details, big picture was pretty clear. When something was decided, everyone committed themselves." "Any problems were discussed, and changes were decided upon, then it was not discussed or thought about any longer. We tried to learn from any mistakes."
"Of course there were some conflicts and differences in opinion, but often we were able to make a common decision on the direction to take. We did not have conflict with regard to major questions or directions, more about details.”
The response reported in the questionnaire for Project A was 15 percent for growth
expectations.
"The management was confident that we should go ahead with the development, so we did not need to sell the project to anyone. With regard to the sales expectations, we were confident that this is a product of the future and we want to be in the market early. The goal was to make a better product than what was available in the market at that time. The products of the competitors were inadequate in quality and function."
"We didn't know what to expect of the market, the market size could not be foreseen. It was generally expected that these kinds of products would come, but they didn't really take off. Then suddenly the market really started to grow, and has grown fast all the time. Then the growth was unexpectedly high. Now in Finland 90% of the end users are using this new technology, but abroad as little as 10%, so there we have still a lot of potential."
"Even the owner was involved in setting the goals for the project."
"The goals were set in terms of product quality, utility and usability characteristics."
Implementation of the project proceeded in an explorative manner. There were some
negative surprises, such as the first prototype of the product not functioning at all. Such
problems were resolved thanks to the commitment of the research and development
engineers and good relationships with the first customers who were willing to act as the
test market. Investments were made gradually as, for example, more space for
production was needed. The responses reported in the questionnaire for Project C were
3,5 for technology investments, 3 for marketing and sales investments, and 4,3 for
technological learning.
"The only upfront investments were the R&D investments, the production capacity was increased gradually.”
"We enlarged the production capacity bit by bit. We enlarged the production hall, and increased the number of welding places."
"In the beginning we had problems with the mechanical prototype. We started the serial production too early and then had to still make quite a few changes.”
The project exceeded the expected sales goals by 33 percent. According to the
interviewees, setting the growth expectations moderately for each phase and, in general,
having a conservative approach, caused this. Eventually the company grew because of
this project to a completely new size class. The company-wide commitment was key to
success all along.

152
"It was good that the really fast growth only began a bit later when the development was completed. When we saw that the products began to sell, we thought that we might make them in serial production and even to abroad. We started to enlarge the production capacity, produce more, export. It was good to proceed with the feet on the ground: first develop the product ready, then the manufacturing process so that volume could be increased, then export."
Implementation
Explorativeprocess
Decision-making process Expectations
Several phaseswere planned
Moderate foreach phase
Idea
Results
Further projectsundertaken
Firm grew to a total-ly new size class
133% of expect-ations reached
Company-widemotivation helped
to overcomedifficulties
Marketing fit: co-development with
customers
Technology fithelped to find the
solution
Top management:supporting role
Middle manage-ment: no role
Junior managementon the driver's seat
Figure 11: Project C
7.1.4 Project D
Project D is an example of a systematic search for growth opportunities, where the
existing technological and market competencies could be utilized and where a newly
developed technological field, electronics, would be employed.
“We had begun to systematically search for a related growth area. At that time, the fast technological development of microprocessors and sensors had taken off in general. Because of this general development, we thought that the growth project should in some way apply electronics. It was clear that we would apply electronics into something."
The customers of the entered product market had previously been a minor customer
group of the firm, and therefore a basic understanding of the needs of these customers
existed within the firm. More specifically, it was seen that the introduction of a
physically small, electronic product would be the next major development in this
product market. Furthermore, the firm’s main international distributor was one of the
most important distributors for the new product market, which gave the firm further
confidence that the discovered opportunity was a real one. The firm also had some of
the central technological competencies needed, which was important for making the

153
project seem realistically achievable, as significant development resources were needed
for the development of electronics competence. The responses reported in the
questionnaire for Project A were a high 5 for technology fit and a moderate 3,7 for
marketing and sales fit. The technological development was very demanding, as this
was a new technological innovation. It was important that the firm’s existing
technological capabilities were largely applicable. The lower marketing and sales fit was
compensated for through active utilization of a distributor’s knowledge of the markets.
"First we started to make a mechanical version of the new product and I came to the company to build up the product line. Then we got to know that someone had brought into the market a computer-based version of the product. This was about the size of a brick and we thought that it would be better if it would be about the size of a cigarette box. So we started developing such an instrument. The fact that we were able to succeed in this development also depended much on the fact that microprocessors had developed to an adequate level, and there were suitable sensors available, both for a price that they could be built in a consumer product."
"We had to build the electronics competence from the beginning, because we knew it was the only way to grow. On the other hand, what we already knew were all the other, very demanding technologies that the product required."
"It is important to have the basic building blocks in place and they must be certain enough. A lot of technology can also be bought, already incorporated into components.”
"The end user market for the new product was already familiar because we had been making our core product also for these end users since the sixties, and had a very strong position in it. In the eighties there was a general willingness to make acquisitions so we acquired an American firm that manufactured one product for this new end user group and distributed all possible products for them. Through this acquisition we got even more information about the market, and became interested in it."
"We went very deep in the study of the end user needs to really understand what the function of the instrument is and make sure the usability is good."
"We did have a part of the distribution channels in place, but also new ones were born, especially through the contacts of our American daughter. In addition, we had experience of export, we had already until then been exporting 80% of our products."
"The distribution was built bit by bit, first we had to look for distributors, then when we had become a brand, they started contacting us and we had to choose from them."
"In the beginning the competitors were controlling the distribution better than we. They grew fast by producing to OEMs. We produced less and stuck to keeping our name and making our name a brand. We did not do marketing directly to consumers, but concentrated on distributors and product education. The distribution and brand have then been built bit by bit. "
"We did not have money for mass marketing. Our life insurance has been our good products. When the products have come to the market, the customers have started to ask for them. For the distributors it’s not enough that we offer what competitors offer, we have to offer something more, more value added. This way we have become a leader of the industry."
"We invested much more in the visual design of the products than the competitors. In the beginning it was outsourced but now we have an own department for it."
"The network of contacts was very important in order to assure we don't do anything silly."

154
"In the production we only do the final assembly, and that was similar for this product as for the previous ones. Testing and calibration were some new things we did ourselves."
"In the beginning we outsourced even more of the production than otherwise. We outsourced also for example electronics design in order not to make mistakes in the beginning. Nowadays we have the competence for this ourselves.”
As in Project C, junior management had a vital role in the decision-making process.
However, in Project D the middle management also had an important role. In Project D
the idea was found through a systematic search for a growth area and decision-making
proceeded in a more structured manner. It was managed as a project. Top management
had a role in setting the expectations and monitoring the results, assuring a high
ambition level. The responses reported in the questionnaire for Project D were high for
the participation of all three groups: 4,9 for the CEO and top management participation,
4,4 for middle management participation and 5 for junior management participation.
"The first vision and push came from the CEO, and the project was started. Then for a long time the project just lived its own life."
"Now the management is just receiving the results and getting puzzled about any difficulties. The group level is very far."
"We never had to sell the project to the owners, they thought at that time that the company would earn its money just on stock trading anyway."
"The board has been alternatingly interested, now, for example, even a bit too much."
"In R&D and production there were especially motivated people who took responsibility even beyond their own tasks. With a nine-to five mentality we would not have got the product out."
"The experts and junior managers are often over conservative in setting their goals; they want to play it safe.”
"In marketing 2-3 people were very committed. They were partly middle management, partly experts".
The responses concerning analytical quality of the decision-making process reported in
the questionnaire for Project D were 3,3 for wide functional participation, 1,5 for
financial analysis, and 2,3 for conflict. Here, especially the financial analysis was low,
which did impact the implementation phase: as the firm encountered quality problems,
its whole existence was at stake. A situation as dangerous as this might have been
avoided through a better financial planning of the project. The possibility of such a
financial bottleneck should have been predicted and prepared for. Because of the
importance of the marketing fit in identifying the opportunity, the project was not as
engineer-driven as Project C, but also marketing personnel had an important role.
"The distributors and end users have been an invaluable source of information."
"Now we use even Internet discussion groups for finding out needs and ideas of consumers."

155
"There were just 4-5 of us in the beginning, so we did not do many calculations. Now there is some internal competition for the same resources, so we need to analyze which projects to invest in more carefully than before."
"We did not have long-term budgets for the project."
"We had no resources for market research.”
“In difficult situations, everybody pulled together. Otherwise top management was a bit detached, and caused conflicts with demands and reactions that were detached from the business.”
"The lack of hierarchy is a richness when managed right, because it assures a multitude of viewpoints.”
The response reported in the questionnaire for Project D was 25 percent for growth
expectations.
"The market grew when the mechanic instruments were overtaken by the electronic ones."
"The goals were not very clear, we just thought we would take what we can get and see what the competitors are doing. At some point in the nineties we got the idea that we want to be the biggest."
"It is important to be able to set a relevant goal for yourself and for others without knowing all the details that will be needed along the way yet. This should, however, be based on things that do already exist. The longer the time period for the goals the better."
"The goals were on the level of when do we want to get the new product out, we were almost always late of this goal, and that caused a huge panic."
"Of course we also had traditional budget goals."
"We did not have long term plans, just everyone had their own scenarios of life cycles and volumes etc."
"Also the market grew because of our segmentation strategy."
"It is also important that R&D does not have too much time for their projects. If they have too much slack they get unproductive."
The responses reported in the questionnaire for Project D were 5 for technology
investments, 1,5 for marketing and sales investments, and 4,3 for technological learning.
The most demanding effort was, indeed, the technological development.
"The R&D investments were the largest ones, there were no investments in production capacity as we used subcontractors like we had been doing before. One type of investment was inventory. At that time the firm was much smaller than now, so the investments could have been classified as significant, it was in the range of 2-3Mfim.”
The project exceeded the expected sales goals by 32 percent. According to the
interviewees, this was caused by the ambitious but realistic goals set by junior, middle
and top management, and by the high commitment of some individuals that carried a
disproportionately large responsibility during some critical times. The cooperation of
marketing and engineers was a prerequisite for a competitive advantage of the firm in

156
being one of the first in the market to combine top technology with top design. This
position spun further projects.
Implementation
Decision-making process ExpectationsIdea
Results
First to combine technology&design
World leader, 132 % of goal reached
Further projects undertaken
Active search for growth
opportunities
Market with largest potential chosen:
market fit helped to identify
Scarce financial analysis
Motivated individuals
Some highly critical situations
Ambitious but realistic:
pioneering a market required
technological and market learning
Top management monitored results
Junior and middle management driven
Marketing & engin-eers cooperated
Figure 12: Project D
7.1.5 Project E
In Project E, the discovery of the opportunity was promoted by knowledge of the
disadvantages of the existing technologies, and by a basic knowledge of the new
technology, which suggested that this kind of solution might be possible. Where
technology knowledge was missing, external partners were actively used to consult and
to co-develop.
"We had an American consulting firm to make a study about whether the technology theoretically had anything to give. The result was positive but they said it would be a long way."
"The idea originally came from one guy in the company. He knew the technology and had the vision. I had also become familiar with the technology during my studies. We thought that it would be worth a try."
"At that time we had just finished a very large, many year project for a customer, which was the end of that business. We were wondering what to do next and a few ideas came about. A small, tight group of people was unanimous that this is what we should do and so we started pushing the idea forward."
Lack of marketing fit hindered the customers’ acceptance of the new solution. The
market was so new that hardly anyone believed in the advantages of the new solution,
and it took a long time to mould these attitudes more positively. Here, a more

157
munificent and visionary parent firm, such as in Project B, could have helped by
standing behind the innovation and marketing it to the whole value chain. The responses
reported in the questionnaire for Project E were a relatively low 4 for technology fit and
a low 1,5 for marketing and sales fit. This low degree of familiarity caused two things:
First, the project was not considered a core growth project of the firm and did not get the
appropriate management and financial resources, because it was such an uncertain
“invention“-type of a project. Second, the technological as well as marketing and sales
development proceeded slowly, and was possible at all only with the benefit of a good
partner network.
"We had to train the people. First, we searched through all Finnish universities and finally found a professor and his group of researchers who were willing to cooperate.”
"Half of all dissertations made on this field of technology in Finland since the nineties has been made for us.”
"We had to do a lot of marketing of just the methodology. This happened e.g. through national development projects."
"Calculated with normal investment formulas the payback periods were so unbelievably short that it was difficult for us to convince the customers that the calculations were right. This is typical with innovation."
"We had some first customers inside the group. This was of course an advantage as we received information on, for example, real lifetime costs, which we would not otherwise have received. On the other hand, family is sometimes worst. Often we found more excitement for the products outside the group."
"The customers had to be carefully chosen according to profitability."
Again, junior management had an important role in this very innovative project. The
generally low responses for participation in the decision-making process can here be
explained by the small size of the project team. The team consisted of five members
who involved top management only when more investments from the parent were
needed. It could have been beneficial from the perspective of reaching more growth
faster if more parties had been involved in the decision-making process, because this
could have assured larger efforts for the project, which could have helped in marketing
the solution in the whole value chain with faster results. The responses reported in the
questionnaire for Project A were 2,9 for CEO and top management participation, 2 for
middle management participation and 3,8 for junior management participation.
"The CEO of the group said that the boys are being silly."
"We were at that time a tightly knit group of inventors, there were no managers really."
The responses reported in the questionnaire for Project E were 1,2 for wide functional
participation, 3,7 for financial analysis, and 2,7 for conflict. The response for financial

158
analysis is relatively high. This is because the project team had to proactively sell the
idea both internally as well as externally in order to receive funds.
"We were always trying to figure out how we can best sell the benefits of the future."
"We were always anxious whether we had now shown enough future benefits and that the development had proceeded, whether they would now believe us."
"We were always on minus as much as was tolerated."
"We did not waste so much money, thanks to the networked business concept."
"In the beginning we did all kinds of studies, but they were not so useful, pretty superficial. Then, we analyzed through the whole value chain, and were convinced that we were going in the right direction. We checked all kinds of opportunities and iterated between them, narrowing down the scenarios."
"In the beginning we made very detailed competitor analyses and got their products in our hands."
"There were two strong personalities in the leadership of the project and the discussion sometimes got loud. This was good, because it cleaned the air. Everyone should be let to do things in their own way."
"In the beginning we were sometimes focusing on the wrong things. Now we are pretty much doing the things we then discussed."
The response reported in the questionnaire for Project E was 60 percent for growth
expectations. As said, growth expectations were set as optimistically as possible in order
to receive financing.
"We had to be optimistic because we had to promise a lot from the project in order to get the investment money, and then we had to try to believe we could fulfill those promises."
"They never expected us to really generate growth. The parent had a principle at that time to be only in businesses with at least half a billion FIM sales and that were worldwide among the top three, so we weren't core."
"The potential could be seen, but it was hard to prove."
"We were too optimistic about the length and speed of the commercialization period. We thought that it couldn't be so difficult."
"The basic research lasted longer than we had expected and the commercialization was slower than we had expected. "
Implementation of the project can be characterized by a small team fighting against
disbelief in the idea on the part of the parent, and against immaturity of the customer
markets, to change their processes to benefit from the new solution. Only small
investments were made, as not much money was available. All investments were made
in the development of the technology. Due to the lack of money, a lean business model
making extensive use of external partners was inevitable. Technological learning
happened on a societal level; several external research groups and a university were
involved in developing the technology. The responses reported in the questionnaire for

159
Project E were 4 for technology investments, 1 for marketing and sales investments, and
5 for technological learning.
"The parent firm gave us a certain amount of money, and told us not to come to ask for more."
"We were very thin on money for a long time. We got some financing from Tekes, and were always asking for more money."
"When we got further in the development, we just said, OK, kill us and then you won't get any of the benefits, or give us more money."
"Even if we had had more resources, we could not have proceeded faster, because the market was developing so slowly. We needed the whole value chain to develop."
"Our concept was new: we had no production, we were all networked. Also the R&D was partly made outside the house. We did not even have a finance director. We developed the best possible networks through trial and error, and have now been reducing the main partners. Now the cluster functions together like a company."
"As we had no factory, we had very little risk. We had a warning example from a competing company that invested very much in a factory in the same technology and then they were wondering what to do with it."
"The production partners were easy to scan, as there are not many possibilities in the world. Bit by bit we narrowed them to the right ones."
The results of the project remained, for the first five years, beneath the expected sales
goals. Only 58 percent of the sales goals was reached by that time. According to the
interviewees, this was caused by having had to set the expectations at a rather optimistic
level and by the slow development of the attitudes in the customer industries. The
success in the development was due to the staying power of the team and the
functioning business model based on the partner network.

160
Implementation
Decision-making process ExpectationsIdea
Results
Value chain now starting to favor the
new way58% of stated
sales goal reached
World leader in the new technology
Small team fought against disbelief
and immaturity of market and technology
Knowledge of disadvantages of old technologies
Knowledge that the new solution might
be possible
Junior management driven
Generally low participation
Extensive financial analysis
Hard-selling to parent necessary to
receive funds
Parent did not expect much
growth
Partner network vital
Figure 13: Project E
7.2 Cross-case analyses
In this chapter, the cases are compared to each other along the studied variables
impacting the success of the leveraging cases. The variables are type of project, firm
characteristics, familiarity of the new market, and decision-making process
characteristics.
7.2.1 Firm level factors
In Project A, the firm had an aggressive growth strategy together with a policy of large
investments in growth in the form of research and development, new plants, and of
trying to foster an innovative environment. The firm was large and capital intensive;
making large-scale investments was an essential part of the business. Because of all of
these reasons, the project had ample resources and support.
”The firm was an excellent firm in the eighties. For example, there was an excellent internal innovation course, and a culture of innovation and visions, those were considered fine things. The personality of the group CEO probably had to do with this, he was a visionary guy, and then there was this studying mate of his in corporate development, who thought the same way. Additionally, there were these enormous growth goals, and one had to think of how to reach them.”
Project B benefited from the fact that the parent was one of the forerunners of the
entered market. Therefore, believing in this emerging market was easier than for many

161
competitors. In addition, being committed to finding growth opportunities, the firm had
ample development resources. Furthermore, the firm perceived itself as one of the
forerunners in technology in its traditional market, which gave the confidence that they
could be pioneers and achieve world market leadership in the new market.
”There was all the time enough money for development work, and it was our own money, so we didn’t need to explain to anyone what we were doing with it. We were able to finance the project staying within the normal development budgets. Nowadays we don’t have so much development resources anymore.”
”You should not have annual development budgets, but they should be ongoing, the development work is ongoing as well. Of course its good to have some milestones.”
”We had always been developing manufacturing processes ourselves, in addition to developing the product. So we had not been satisfied with just copying the manufacturing processes from others or with following some standards. It helped that also a division designing and manufacturing machinery we used was a part of the group. Through this development work a lot of competence had accumulated in the firm, as well as a certain way of thinking. That helped us to realize that we could reach the world leadership, so just go and do it.”
In Project C, the industry was mature and this was the only growth opportunity for years
to come. Therefore, there was no lack of certainty as to whether to seize the opportunity.
The firm was quite small and very entrepreneurial and un-hierarchical, which was
essential for the success of the development work. The small size of the firm in Project
D, led to the project growing so large for the firm that the firm’s existence came to
depend on it. In a few situations, problems that had occurred in the project had to be
solved, or the firm would have gone bankrupt. This sense of urgency would seem likely
to have helped in completing the project successfully.
"A couple of times the old product had become outdated and we had to bring the new one to the market a bit too early. We had quality problems in the beginning. Fixing these quality problems was so expensive that the whole firm could have gone down. We did not know if we would ever recover these costs. In these cases we thought that if we can get through this we will get through anything."
"E.g. with the very new type of product we saw immediately that the potential was enormous. The potential did not materialize immediately. We improved the product in several ways and achieved better results. Now this is our fastest growing segment."
"The more product areas you have, the more you need to commit people to just thinking of the daily business. They must be able to see also broadly."
In Project E, the varying management philosophies of a conglomerate had an impact.
The case was started at a time when there was belief in developing technological
competencies in general, and in investing in growth. This time was followed by a period
of investment draught caused by the belief that the conglomerate should operate as a
mere financial holding.

162
"You cannot invent growth ideas all of a sudden. Ideas are flowing all the time, you have to store them for when they are needed."
"At that time we had a unit of about 50 people, half of them PhDs, whose job was to find future growth areas for the group. Afterwards, the development investments decreased because the group was developed more in the direction of a financial holding. For a while, we had for example no technology strategies."
"Its important to keep working on innovations long enough for luck to have the time to impact: for opportunities to meet. A success feeds another success and people start to see the benefits."
"When deciding about this project in the beginning of the nineties, the CEO said that the group was such a big company that we had to be able to afford technological frivolousness."
"The unit had another field of high technology where the development was much further, they were already generating cash, and all R&D investments went to them."
“The management was thinking, that as we did not consume so much money, they might as well let us continue, because it might turn out to be something."
"Only now they see in the top management what a critical role we play in many products, that there is really growth potential."
"After the period of draught we now have a different situation at the group level again: the group has different principles, they want to invest in technological competence."
To summarize, Projects A and B benefited from the large size of the firms in the form of
ample resources and a helpful network. Projects C and D, on the other hand, can be said
to have benefited from the small size of the firms due to extreme entrepreneurialism and
lack of hierarchy, as well as from the relative decisive importance of the projects.
Project E benefited somewhat from internal customers of a large corporation. This
benefit may have been decisive, although the case had also external co-development
customers. The parent’s changing management philosophies, which may be
characteristic of large conglomerates, may have disturbed the project through a lack of
consistency from management, which is important for long-term development.
It seems that corporate level managerial resources available for growth do not impact
the success of the individual growth projects measured as percent of expectations
reached because these corporate level resources are not in any way involved with the
implementation of the projects. The responsibility for the success of the projects is
transferred fully to the project team as soon as the team is founded. In the five cases,
these project teams were founded at very early stages and they had a significant role in
conceptualizing the projects. The role of the corporate level managerial resources
available for growth was, firstly, in maintaining a munificient environment for starting
such projects. This meant maintaining contacts to partners, which could provide
financial resources and knowledge for the project. These were universities, Finnish

163
technology development foundations such as Tekes and Sitra, and other companies
where development cooperation was maintained. Such a munificient environment
enabled starting projects where lots of learning was required and the results were very
uncertain on a small-scale. This small scale refers to low initial investments due to the
utilization of the partner networks, and a small project team. Both aspects of small scale
were seen as important factors promoting the project success, as is discussed below in
more detail. Secondly, the corporate level managerial resources made the first drafts for
investment plans that functioned as decision-making aids for the top management in
considering launching a project team to work on the topic.
“Without the aggressive growth goals that the corporate people were driving and their recognition of the strategic importance of this project, the project would never have been implemented. The investments were so big and the payback time so long“ Project A “Through our technology-development partnership we had an important contact which yielded the project its manager.” Project A
“After the project group was founded it was clear the corporate people had nothing to do with the project anymore, except maybe just curiosity on how things were going. The people in the project were that ones that had been developing the idea for years, so they were really owners of the project.” Project A
“The head of R&D had the vision and checked the feasibility through his contacts. His support for starting the project grew even stronger. This was essential in order for us to start preparing for mass production.” Project B
“The corporate level employees who were involved in business development had developed some very important prerequisites, like the good contacts to the university. Without these we could not have started the project as such a low risk experiment. I would have been a much bigger decision, whether to start it, and I think we would probably have thought that it’s all too uncertain.” Project C
“After the project group was appointed, no-one except they and the top management had anything to do with the project. The ones who had originally had the project idea were in the team, or part of top management. The corporate development guys had nothing to do with the project anymore, their job was done.” Project C
“One resource dedicated a whole year for finding a technologically viable business opportunity in this area. Of course, without this investment it would never have become anything.” Project D
“The corporate level business developers were very important in selling the project to the group management. We all knew that it would take very long before the project would generate any income, so this “preaching” for the project was essential. Without having had these guys put so much effort to convincing the management on the long-term advantages we could never have started.” Proejct E
“The consulting project ordered by the corporate level business developers to assess the viability of the technological solution was an important support in convincing everyone this was not just our crazy idea.” Proejct E
“The established relations to Sitra and the universities made the start at least a little less complicated. Additionally, of course, without their support we could not even have dreamt of the project. The company would never have given so much financing to such an uncertain project.” Proejct E

164
Table 34: Firm level factors Project A Project B Project C Project D Project E Firm growth aspiration ”The firm had an aggressive growth strategy in the eighties, and this division in the beginning of the nineties. Several international acquisitions were made. Then the money started to dry out.”
Parent had very high growth aspirations, but this daughter company rather low, as in a very mature business.
The industry was growing slow and did not offer many growth possibilities. “It was good to proceed with the feet on the ground: first develop the product, then the manufacturing process, then export.”
The firm was growth oriented, willing to look for growth opportunities outside the original market when that started to mature. Growth opportunities were searched from even unrelated areas.
The firm was a growth-oriented conglomerate, but has experienced strongly varying periods of leadership and direction. This project was considered too small and technical to be an important source of growth.
Investments in growth In the eighties the firm invested a lot in R&D in general, in laboratories and other research equipment as well as in researchers. Even test factories were built, which were large investments.
“There was all the time enough money for development work, and it was own money, we stayed within the normal development budgets. Nowadays we don’t have so much development resources anymore.”
The investment in growth was the strong commitment to the project, and the employees’ entrepreneurial commitment, as well as management’s time in maintaining relationships with stakeholders.
A few times correcting some quality problems was so expensive that if it had not succeeded the firm would have gone bankrupt. “The more product areas you have, the more you need to commit people to just thinking and out of the daily business.”
In the beginning of the project the firm had a unit of about 50 people whose job was to find future growth areas. Later, the development investments were reduced as the group was developed to a financial holding.
Firm innovativeness “The firm was very visionary and innovative in the eighties. This was due to the visionary CEO and a couple of other top managers, as well as to the aggressive growth goals.”
The parent was very innovative, and in general in the group an entrepreneurial spirit had always been fostered. The business unit had always been developing technology itself.
The firm was very entrepreneurial and thus willing to try out new ideas and well connected to all stakeholders of the industry and thus received a lot of ideas.
The visionaries of the firm were rather the middle and junior managers, the top management just set the goals such as growth.
“When deciding about this project in the beginning of the nineties, the group CEO said that the group was so big that we had to be able to afford technological frivolousness.”
Firm size Large. Deep pockets and generous investment policy.
Large. Good internal customer, but not restrictive. Very good source of information about industry development.
Small. Entrepreneurial, flexible, extremely unhierarchical, good flow of information.
Small. Entrepreneurial and informal.
Large. Investments in project relatively seen small. Internal customers not always cooperative but when willing to cooperate, supported in giving information about its real costs.
7.2.2 Type of project
Project A is an example of a project that required large investments in a factory. Yet, it
was easy to decide upon and implement as all components were well known or even
previously tested, and there was a strong champion in the top management.
Furthermore, the firm was a part of a large group, so the investments were not so large
in comparison to other investments, the group had a loose investment policy, and the
investments were recoverable. The main impulse for the project came from the
aggressive growth strategy of the group and from having successfully completed the
development of one technological solution that was the base of the solution enabling
this market entry. Project B is an example of being in the right place at the right time.

165
The firm had a technological competence and capital-intensive production facilities,
which were needed by an emerging market that turned out to grow very large. What was
needed was courage to believe in the market, but, even here, the firm was well
positioned due to the parent firm’s prominent position in developing the market.
"We had the machinery for production, if we had not discovered the market X we probably would have sold the machinery."
”The manufacturing process for the product had been developed step by step since the seventies. The quality reached a world-class level by the beginning of the nineties. At that time the market X started to take off. The commercialization proceeded fast once the product was ready. So we were really in the right place at the right time.”
”We had an insight that we have a technology that is needed in exactly this phase of development of market X. In large companies there are always various technologies ”sleeping”. The skill is to dig the right ideas out when a market is going in the right direction for commercialization of the technology. Then you have to have a strong belief that this is the right direction in order to be able to be fast enough to skim the cream and impact the direction of the market.”
”In general the idea for the project is more important than the implementation. A technological competence base is important for coming up with the ideas.”
”We have also seen many unsuccessful projects here. The persons responsible for those just didn’t pull them through. Not enough people were invested in these projects; it wasn’t really a question of money. It is really irritating if you’re sure that it could have worked out, but I guess that’s a normal part of business.”
”Systematic search for growth opportunities based on technological core competencies is a very important way of growing. But then of course you have to have the commercial skill as well for the markets you enter.”
In Project C, good contacts with all stakeholders in the industry assured the firm both of
the demand and that they would be able to develop the leading product, even if some
new technological fields had to be learned. In addition, the firm proceeded step-by-step,
making sure that the risk never grew too large. The idea came from customer demand,
and the firm waited until it was clear what the dominant solution in the emerging market
was going to be.
Project D is an example of a proactive search for a new growth area based on previous
technological competence. In addition, an important criterion in choosing which market
to enter was the ability to utilize the existing distribution channels, as, in this business,
they are time consuming to build. Moreover, the firm had decided it would grow into a
market in which it could apply electronics, as this was a technological field that had
matured to a point at which it was possible to utilize it in many more applications than
had been possible previously. The firm had no previous competencies in electronics, and
the electronics design was at the beginning partly outsourced. At that time even

166
unrelated diversification was not shunned, and therefore entering even unknown areas
was not considered impossible.
"At that time we had a need to grow: the markets we were active in at that time were not growing. So we thought we had to find growth opportunities in related fields, and there were a couple of alternatives. We chose this industry because we thought that we would face less competition there. In addition we seemed to have the basic requirements in place for this market.”
As they proceeded, Projects C and D grew larger in scope than was originally expected.
In Project C, the strategy was to proceed gradually; a large market was not needed to
justify the initial investments. However, in the end the project became the firm’s main
source of growth and enabled the firm to grow into a completely new size class. In
Project D, the project was meant to be a new growth area, but the development turned
out to be such an extensive task that it could have meant the end of the firm had it not
succeeded. Nowadays, this product is what the firm is known for, and is a basis for new
product types that together account for a larger part of the firm’s sales than the original
product. These projects took the firms into a completely new era, and therefore it was
probably not possible to imagine their scope at the beginning. Thus, the initially set
growth expectations were exceeded. In Project C, this was due to a consciously chosen
strategy of proceeding gradually, and, in Project D, it was due to a higher market
growth. In Project D, a new niche was created with the help of recently matured
technologies that gave new opportunities for functionality, and therefore it was probably
difficult to predict the growth.
Project E is an example of developing a completely new technology with limited
previous experience. The only assets the project could benefit from were as follows:
some partially reluctant internal customers who helped in studying the real benefits of
the technology in question, an idea of a totally new solution, a consulting study that
concluded the idea should work in theory, one employee who had experience with the
technology, a five-person team who believed in the idea, and minimal financing. The
team needed a lot of staying power in order to wait and relentlessly try to persuade to the
whole value chain that they should change to enable sales to take off. The benefits of the
technology had to be hard-sold to the management to keep the project alive, and
therefore the stated growth expectations were reached more slowly than expected.

167
Overall, growth expectations were strongly influenced by management commitment and
the strategic importance of the cases. In cases where the management was convinced of
the importance of the case, the goals were not set to overly demanding levels, because it
was clear that, for the sake of firm’s future, the project had to be undertaken. In such
cases, the project was the only source of growth for the firm for years. In addition,
investments perceived to be small allowed more modest growth goals. When it was
difficult to convince the management to finance the project, the goals were stated at an
optimistic level and reaching them was even more difficult. In Projects B and C, the
ideas for the projects were induced by the development of markets, while the firms
received the signals through good partner networks. In Projects A and D, the driving
force was a need to find new growth areas. In Project E, one man’s idea for a superior
technological solution was what set the project in motion. Small scale referring to low
initial investments due to the utilization of the partner networks, and a small project
team were considered important by the firms.
“This was a large project in terms of investments and participating people. In order to get the financing, the corporate business developers had to do extensive groundwork and plans. The plans did materialize quite well, because all components were very familiar. It was just an implementation question of putting it all together.” Project A
“Too many cooks spoil the soup [a Finnish saying]. If we had had more people in the project, nobody would have understood the big picture anymore. Too many compromises would have had to be made, as people see things differently. This would have lead to one big compromise and not a winning market entry.” Project B “One of the main success factors was that we were able to start the project in such a small scale. Had this not been possible we would not have started the project at all because the results were too un certain. Additionally, the small size allowed a small project team. For such a team it was possible to work in a very self-steered way. The small team was also very homogenic: everyone had the same vision and pulled in the same direction.” Project C
“A large group could not have worked in such a good way: its hard to organize the work really effectively, communication gets more formal, and all members in a large group cannot be 100% motivated, so you cant trust that everyone is really giving their best.” Project C
“In a large project scope you have to start to do too much guessing as you try to plan things you have no idea of how they will turn up.” Project C
“We could not have started the project on a larger scale because nobody was interested about it before we could prove that the idea works and the customers want it.” Project D
“Being able to start the project on a small scale was not self-evident. If we had not had the partner networks and the small group of people who were so convinced about the idea that they were willing to try it out even in uncertain conditions, starting the project this small would have lead nowhere. For starting the project in a larger scale we would never have received the financing.” Project E
“The group has to be homogenic, if there are too many differing perspectives, ways of thinking or ways of working the whole work becomes really ineffective.” Project E

168
Table 35: Type of project Project A Project B Project C Project D Project E Nature of project Entry into a product market with the help of a new technology, which was based on combining two existing technologies, and gave the firm a competitive advantage in the entered product market.
Adapting existing, expensive machinery from a product market that had begun to decline to a new, emerging market.
A new product to cater the needs of an emerging segment. The firm knew the customers well but learning two previously completely unfamiliar technological fields was needed.
The firm created a new market segment. Distribution channels and an initial customer contact were in place, as well as some of the needed technological competencies.
Developing technology that the main businesses could utilize to become more competitive. The application of the technology to this type of usage was very new worldwide.
Importance as source of growth The new market was seen as one of the main growth areas of the firm in the future. It was seen as very important to develop an own technological competence and a proprietary technology.
One of the very few growth opportunities in a mature market. Due to the newness of the market many managers did not believe in the opportunity but considered the niche too small to be worth an attempt.
This product line was what enabled the growth of the firm to a totally different size class. The market was growing very slowly, and this was one of the few growth opportunities for a long time.
The company was forced to find a new growth area, because the old market had come to maturity and there were no more growth opportunities. This seemed to be the only possible growth opportunity.
For the parent firm, the project was very unimportant and it was left alive only because it was not consuming much resources. The driving force was the enthusiasm of a five-person project team.
Birth of idea The idea had been about for a long time. Its competitive advantages were highlighted by a small, acquired business. The technological solution was conceived after experiences in the critical fields.
Insight that the firm had a technology that was needed in exactly the then current phase of development of market X was related to the parent firm being one of the first firms that discovered the growth market X.
The impulse from the clientele was very clear, telling that there is a market for the product. Good contacts to all stakeholders enabled monitoring of the development and needs of the segment.
In a systematic search for a related growth area the entry to several product markets was considered. Firm had decided that the growth project should apply electronics, a new field to the firm, to something.
One employee who knew the technology originally had the idea. There was a need for new business ideas. A specialized consulting firm made a study about whether the idea was viable in theory.
Growth expectations: how defined, why? There was no need to sell the product to the management, because it had a very strong champion in the top management.
Enormous growth figures were budgeted, as much as was possible in a mature industry without seeming ridiculous. The explosive growth of the market X took everyone by surprise.
The management was confident that the firm should go ahead with the development of the new product, so the team did not need to sell it to anyone. The market growth was unexpectedly high.
“The goals were on the level of when we do want to get the new product out, we were almost always late of this goal, and that caused a huge panic.” “Of course we also had traditional budget goals.”
“We had to promise a lot from the project in order to get the investment money.” “We were too optimistic about the length of the basic research and commercialization.”
7.2.3 Familiarity of the entered market: technology
In Project A, the innovation, which created the competitive advantage enabling the
entry, required the combination of two already familiar technologies that had been in use
in the firm. To combine these two main technologies, a technical solution was required
from a field that was also, to an extent, familiar to the firm due to a previous
unsuccessful project. Still, there were some difficulties in developing this combining
solution. Overall, it was perceived that the project had very little technological
uncertainty. In addition, in Project B, there was only little to learn technologically. In
addition to applying the familiar main technology, only some new interface products

169
were needed, and these were developed in cooperation with several partners. In Project
C, the firm already had competencies in hydraulics and mechanics, and in the usage of
aluminum and extra strong steel, which were central competencies in the emerging
market. Competencies in automatics and measurement technology had to be learned. For
this, existing development capacity was used, and, in addition, some development was
conducted together with partners. In Project D, the firm had competence in the special
structure of the products, in certain required measurement aspects and in fine
mechanics, which were essential for the development of the new product. The
electronics competence had to be built from the beginning. For this, some new
employees with a suitable background were hired. In addition, some of the electronics
design was outsourced in the beginning to avoid mistakes and learn. In Project E, the
engineers had to be trained in the new technology from the start. First, all Finnish
universities were scanned and finally a professor with a group of researchers was found
who was willing to cooperate. Research and development was partly outsourced, and,
through national development projects, research was initiated in a network of
institutions.
The cases vary greatly as to how much new technological competence had to be learned
and the extent to which the already familiar technologies could be used. Projects A and
B are at one extreme, where the technological uncertainty was very low as the entry was
directly based on familiar technologies and only very little needed to be adjusted and
learned. The companies perceived these cases very low in risk; the companies were
confident they would be able to develop the product. In this aspect, the projects also
proceeded very closely according to the plans set for them. An exception to this is that
in Project B, the market growth could not be predicted, as the market was very new.
Because Project A was perceived as having low risk, there was no need for extensive
selling of the idea of the project to management. The expectations were set on a
realistically reachable or even conservative level. In Project B, no investments outside
the regular research and development budget were needed, and there was no need to
overstate the expectations. In Projects C and D, demanding new fields of technology had
to be learned, but the entry was also very much based on the competencies in the firm’s
core technologies. This led to both projects facing some difficult times when the
continuation of the project was at stake. These difficulties were caused by an initial

170
failure to solve technological challenges. In both cases, the entrepreneurialism of the
project team was key to overcoming these difficulties. In Project C, top management
support, gave the necessary confidence to the project team to keep searching for the
solutions. The confidence in the idea was further strengthened by good contacts with all
industry stakeholders. Project E represents the other extreme. Very little was known of
the technology. The competence had to be built on a national level from almost nothing.
The uncertainty of succeeding in developing the technological solution, and the
uncertainty of whether the value chains would change so there would be a market made
it necessary to be optimistic towards the stated goals in order to receive any investment
funds at all. Additionally, there were setbacks in the basic research, which caused it to
take longer than anticipated. The commercialization period was longer than expected as
well. The following table summarizes the cases with regard to familiarity of the entered
market in terms of technology.
Table 36: Familiarity of the entered market: technology Project A Project B Project C Project D Project E Technology fit “The technology was just combining two old things. There weren’t many surprises in the project, because all components were familiar.”
In addition to the basic product based on the traditional technology also some interface products were needed that attached the product to a system, which were developed with the help of a few partner firms.
The firm already had competence in hydraulics and mechanics, and the usage of aluminum and extra strong steel. Competencies in automatics and measurement technology had to be learned.
The firm had competence in the special structure of the products, in certain required measurement aspects and in fine mechanics. The electronics competence had to be built from the beginning.
“We had to train the people from the start. First we searched through all Finnish universities and finally found a professor and his group of researchers who were willing to cooperate.”
Technology investments Only the existing R&D personnel were utilized, and this wasn’t seen as a real extra investment. About 50 people worked for the project in R&D.
”All in all this was considered a very safe project because we did not invest in any new types of skills or capacity.”
Only investments were the R&D investments, the existing development capacity was used and development was done together with partners.
The R&D investments were the largest ones, also new people with new skills were hired for R&D.
All investments were in R&D, because there was so little money that prioritization was necessary. Even the R&D was partly outsourced.
Technological learning “In developing the critical technological field X we should have more openly looked outside the firm for what has already been developed in this area. The team was too introverted.”
Through partners especially in the interface components.
Automatics and measurement were totally new technological fields and were developed in cooperation with a university and a government organization for technological development.
Electronics was a completely new field. The development was speeded up through hiring new people.
The technology itself needed to be learned and developed, and many people even outside the firm were involved. “Half of all dissertations made on this field in Finland since the nineties has been made for us.”

171
7.2.4 Familiarity of the entered market: marketing, sales and operations
In Project A, the business logic was well known: it was clear to which markets and
segments the products would be targeted. Previously, the firm had been producing other
products for the same customers. Ten to twenty people worked in making the
investment analyses. New salespeople were hired as the business grew. Some new
capabilities needed to be learned for licensing and the related training. The firm had
already built factories before, so the necessary project management capabilities were in
place. Therefore, Project A is an example of a project where the entered market was
familiar, and operational uncertainty was low. This helped in implementing the project
according to plan without major surprises. The perceived familiarity and certainty of all
the components of the project also helped in receiving the management commitment and
financing, even with modestly stated growth expectations, which were not impossible to
exceed. In Project B, the business logic was similar to the original market. Both the
customers and the product, however, were more demanding than before, and this caused
a need to develop more advanced selling methodologies. The size of the sales force had
to be increased significantly. Other investments were directed towards developing
improved production machinery and building more production lines. In comparison to
Project A, Project B required somewhat more development of new marketing and sales
competencies, especially as the market was only coming into being and therefore no one
had experience of it. The newness of the market also meant that there were many in the
firm who did not believe the project was worth the while, even if the downside was very
small. Therefore, the growth expectations were set as high as possible without sounding
ridiculous in a mature industry, but still the dramatic growth of the market took
everyone by surprise. Operationally, the project proceeded according to plan. In Project
C, the product was targeted to the existing customers using the existing channels and
sales force. The production capacity was increased gradually as demand grew. In the
marketing and operational aspects, the uncertainty was perceived very low, partly
because of the familiarity, and partly because of the strategy of gradual entry. The
strategy of gradual entry leads to perhaps slightly low growth expectations. In the
marketing and operational aspects, the project experienced no surprises. In Project D,
the end user market was familiar because the firm had been making their core product
for this market also. A part of the distribution channels was already in place, but also

172
new ones were created. Some significant operative and marketing investments were a
very deep study of the end user needs, more visual design than competitors, and
maintaining and developing the own brand at the cost of slower growth than some
competitors that followed an OEM strategy. Another significant investment was
inventory. The firm had traditionally been outsourcing production. At the beginning of
this project, even more was outsourced than usual. No new own production capacity was
needed. Testing and calibration were new production steps that the firm completed
internally. The existence of the distribution channels was seen as an important
prerequisite for starting the project. They were also a good source of information about
the end user needs and preferences. It seems likely that without having had the
distribution channels in place the firm would not have started the project. The
uncertainty would then have been too large. The familiarity of end users, distribution
channels and production aspects assured that there were no surprises from this side. In
Project E, only a few internal customers were familiar, otherwise all components were
unfamiliar. The new methodology had to be marketed in the whole value chain, which
was very slow and laborious. The project had no production, and not even a finance
director; as much as possible was outsourced to keep the costs variable. Screening all
potential partners, and gradually reducing the network to the best, created the network of
partners. The marketing-related uncertainties led to underestimating the length of the
commercialization period, and therefore to overstated growth expectations.
Projects A, C and D, the marketing and operational aspects were very familiar and
caused only positive surprises in the project implementation in that the demand was
higher, or realized faster, than expected. In Project A, even the building of the factory
was slightly cheaper than was expected. In Projects C and D, the market familiarity was
even a prerequisite for initiation and success of the projects. In cases B and E, the
markets were only just emerging, and no one knew accurately how they would develop.
In Project B, the market turned out to be much larger than expected, and in Project E,
the demand realized slower than expected. The following table summarizes the cases
with regard to familiarity of the entered market in terms of marketing, sales, and
operative aspects.

173
Table 37: Familiarity of the entered market: marketing, sales and operations Project A Project B Project C Project D Project E Marketing fit “The business logic was well known: we knew exactly to which markets and segments we would be targeting the products.”
“For the business model we had analogies from our old businesses. Selling was similar, but demands were higher and the business model was more one of selling solutions including installation etc.”
“We had already had the channels and the customers.” “We were so deeply rooted in the industry that we never doubted that we could develop the product so that it would become good.”
“The end user market was familiar: we had been making our core product also for them since the sixties.” “We had a part of the distribution channels already in place, but also new ones were born.”
Some advantage from internal customers. “We had to do a lot of marketing of just the methodology. This happened for example through national development projects.” “Business concepts are slow to change”
Marketing investments Ten to twenty people worked in making the investment analyses. New salespeople were hired as the business grew. Some new capabilities were needed for licensing and the related training.
“Sales channels and market logic were exactly same as before, but we had to make significant investments in increasing the size of the sales force.”
There were none. Inventories, very deep study of the end user needs, more visual design than competitors, brand at the cost of slower growth than some OEM competitors.
“Even if we had had more resources, we could not have proceeded faster, because the market was developing so slow. We needed the whole value chain to develop and only time helped in this.”
Operations fit “We had experienced people to operate the factory, hundreds were needed to build and operate it.” “We had already been building factories so we knew how the process of the project proceeds.”
“We had the machinery and buildings for production, but we also developed new machines and built new production lines.” “Investments in multiplying factories have some risk in whether the project is in schedule etc.”
“We increased the production capacity gradually as demand grew (production hall, number of welding places).” “We had problems with the mechanical prototype, we started the serial production too early.”
“We outsourced even more than otherwise in the beginning, such as electronics design. No new production capacity was needed. Testing and calibration were some new things we did ourselves.”
“We had no production, it was outsourced. We did not even have a finance director. We developed the best possible networks through trial and error, and have now been reducing the main partners.”
7.2.5 Decision-making process characteristics: participation
In case A, the top management was very committed and secured ample resources for the
whole four year development period due to the existence of a strong champion in the top
management. The management set the goals for the products. The research and
development engineers participated in planning, which was perceived as important for
their commitment to the implementation. They also decided on goals within their
specific parts of the project. The research and development engineers additionally
developed solutions and products on their own that were not a part of the plan. The
middle management participated in the project decision-making on the goals. This was
preceded by discussion with the research and development engineers. Within the project
team, the culture was un-hierarchical and open, which was perceived important for the
success of the development work. In Project B, the top management did not have a very
strong belief in the project. This did not cause much harm, as no large investments were
needed. Stronger top management support and vision of the growth of the market could

174
have helped the firm to prepare for the enormous growth better, but as it was, the firm’s
growth in this market was in some phases slowed down by limits of organic growth. It
was seen as important for the success of the project that those in charge of specific parts
also decided on the goals and plans in these areas. This was perceived important for
assuring commitment to the plans and goals and sense of responsibility for taking them
through, as well as for assuring that the best possible information was utilized. Six
directors of the business unit, who essentially formed the project team, set the overall
goals and plans. In Project C, the top management’s relentless belief in the project’s
success was essential, especially in difficult phases of the technological development,
as, for example, the first prototype of the product was a failure. The top management set
the goals and made decisions together with the stakeholders. The research and
development engineers, the shop floor workers and the salespeople were also very much
involved in the decision-making. As the firm was small, the management was also
involved in the day-to-day work.
In Project D, the management essentially controlled the project only to keep it on track,
but did not get involved in the details, nor did they exhibit support to the project. The
junior management and expert levels of research and development and production were
the driving force of the project; these also had a lot of freedom in setting the goals and
deciding upon the plans. This was considered important for their commitment. One
interviewee's experience was that research and development engineers might be overly
conservative in their goals and plans due to the very fact that they are responsible for
delivering the results. In Project E, the lack of management commitment, and the
resulting need to continuously prove the project’s benefits, may even have been
beneficial for clarifying the benefits to the project team itself, and therefore helping in
external marketing. As an interviewee said, it seems unlikely that the commercialization
would have proceeded faster, even with more resources, because whole value chains had
to develop in the right direction before sales took off. This would have taken a long time
in any case. The project team consisted of five persons, so roles were almost equal. The
larger project team included external partners also, and, with them, communication and
planning together were frequent, which assured being well informed about the state of
the art of the technology.

175
In general, the commitment of top management, as well as the participation of junior
management, was very important for the success of the projects. Top management belief
in the project may have induced an overall optimistic attitude towards the project, and a
tendency to set the growth expectations higher. According to one interviewee, junior
management may have a tendency to set the expectations lower, due to their concrete
responsibility for delivering the results. Middle management’s role was in structuring
the plans and goals. Different managerial levels had different roles over the course of
the project. Three different phases, in which these roles varied, were introduced by two
of the interviewed firms. The differing roles can be identified in the other firms as well.
1. In the phase before launching the project team, the corporate level managerial
resources available for growth were on the driver’s seat, gathering the
development ideas in the firm, assuring the munificient environment for starting
projects, and making the initial project concepts for he top management to
decide upon. Corporate level managerial resources available for growth as a
driving force in this phase seems logical, as these full-time resources have an
incentive to see to it that growth projects are started. This is the most concrete
result of the work of these resources.
2. The next phase, the development of the new solution to the new market, was
characterized by intense learning, as the projects required significant
technological development. Because of the deeply technical nature of this phase,
junior management consisting mainly of R&D engineers was the driving force of
this phase. Due to the explorative and dynamic nature of learning, it cannot be
very well planned for or structured. According to the firms, this was the reason
that middle management had hardly any role in this phase. Furthermore, the
aspects of “analytical quality of decision-making” would not have been fruitful
here, due to the dynamic nature of the learning process. Essential in this phase,
according to the firms, was a homogenic, small, and empowered project team.
As the projects were top priority in the firm, the top management was in directly
involved in the work of the junior management. Communication between these
two organizational levels was almost daily and on a very detailed level. Junior
management as a driving force in this development phase is logical, a their goals

176
are often set in the form of intermediate goals such as development of a
technically functioning solution and test customers’ satisfaction with it.
3. The third phase was the full-scale commercialization of the product in the new
market. The interviewees defined this phase to start at the point where the
product was already mature in terms of the technical and commercial solution,
and had even already proven itself at the marketplace. Here the middle
management role gained significantly in importance, because this was the time to
do more detailed plans on segments, channels, volumes and prices. Middle
management was in these firms the level with the business responsibility, such
as business heads. However, three of the companies (A, D, E) reckoned having
failed to involve middle-management in this phase as effectively as they should
have. At first, the middle management considered the new product somewhat
problematic, because pushing it to the market meant a lot of work and the returns
were uncertain. Additionally, it was felt that the communication between the
engineers (junior management) and the middle management was not very
effective, which harmed the handover. Because of this, the companies felt the
full-scale commercialization did not start quite optimally. For example, price
premiums were lost due to the fact that commercialization had been on a smaller
scale started already earlier, selling first prototypes to good customers as test
versions. Thereafter, taking the full price for the finalized product was difficult.
Middle-management is the logical driving force here, as they are measured
according to concrete business results and therefore only become interested as
the new solution has already shown its potential.
Top-management commitment was important all through the project: in the first phase
to commit the resources and set a vision, in the second phase to show long-term
commitment even through difficult times, and in the third time to set the goals high
enough to assure the potential in the new market is fully utilized and so the return on the
investments maximized. As to the interfaces between the three phases, the companies
did not have problems in transitioning from phase one to phase two. Two factors could
contribute to this: First, the roles were very clearly defined. It was in no way the task of
the corporate level managerial resources available for growth to get involved in the
implementation of the projects once the project team had been founded. Before

177
founding the project team, the people who had been developing the idea – and who then
mostly became the project team – were more than willing to help the corporate level
resources in making the first concept, as it was in their interests to start the project.
Second, the first conceptualization done in the phase one as a basis for deciding on
starting the project was not so detailed that it would have limited the actions in the
phase two too much. The three companies (A, D, E) considered the problems of
transitioning from the phase two to the phase three severe and harmful to the
maximization of return on investments.
“Top management vision was essential in the beginning, for getting the resources for such a big project, and later for the long term orientation of patenting the solution and starting the licensing business.” Project A
“Middle management felt uneasy about the new product, they did not see tha potential and felt it was just more work.” Project A
“We started to create a middle management as the sales started to take off. This middle management was the business management level, which meant a marketing and sales manager and later several of them and production manager.” Project B
“Management had overall only little impact on the decisions or the course of the project. They did not even have content knowledge to be able to comment on what we were doing, and it is anyway hard to start telling someone how he should be doing his job, when it’s a question of difficult problem solving and creating something new.” Project C
“Middle management had no impact whatsoever. Its involvement would just have meant steering the project as a line organization and that would have been way too slow moving bureaucratic.” Project C
“Top management support was important all the time: they had the vision that we should get into this business and as we had problems we thought we could not solve, they just told us to keep working on it. Afterwards, top management then set the direction for further projects based on this one. Only these follow-up projects made later the business grow so big.” Project C
“CEO’s support was essential all the time: he had the original vision and pushed us through tough times when we thought the firm would go bankrupt because of the project and all other departments hated us. Later, top management’s ambition was important to push us to create the next product generations. Business managers’ involvement would have been important when the market took up, but they were skeptical about the product in the beginning and did not see its potential. Here, we should somehow have involved them earlier to make sure they start the full-scale commercialization right from early on. Because we did this a bit unprofessionally and without a clear pricing etc. strategy, we probably lost some premiums.” Project D
“Middle management got a role then when the business was up and running and it became a question of optimizing the strategy and operations for a maximum return.” Project E

178
Table 38: Decision-making process characteristics: participation Project A Project B Project C Project D Project E Top management participation and commitment “Top management was very committed and secured ample resources for the whole four year development period because of the strong champion.” “Management set the goals for the products”
”The top management wasn’t visionary, they were even going to sell the division away.” ”The top management wasn’t always so involved, they were often slowing down and harming the development.”
“Top management was very committed, monitoring the project continuously, and achieved the commitment of everyone else.” “They set goals and made decisions together with the stakeholders.”
The management was not very interested. “The first vision to start the project came from the CEO. Then for a long time the project just lived its own life.” “The board has been alternatingly interested.”
The top management did not take the five-man development team seriously, hardly anyone believed they would reach something. “The CEO of the group said that the boys are being silly.”
Junior management participation and commitment ”R&D engineers participated in planning, which was important for commitment. They decided on goals within parts of the project.” “We had a lot of control and developed many things outside the plan.”
”For commitment, information, and responsibility, it was really important that the ones who implemented, The R&D engineers, decided on the goals and plans.” ”There also has to be room for experimenting.”
“The engineers were very involved in the decision making. Internally, the craftsmen with hands on experience had the say. The sales brought in feedback from the field and competitor comparisons.”
“In R&D and production there were motivated people who took broad responsibility. With a nine-to-five mentality the product would not have been born.” “Often the R&D engineers can be over conservative.”
“We were all at that time a tightly knit group of inventors, there were no managers really.”
Middle management role “Middle management participated a lot in the project decision-making. They had a greater role in making the final decisions on the goals, but this was preceded by discussion.” “The titles were not important.”
”The goals and plans were set by the business unit directors, about six persons. The parent just sometimes commented on things like what the capital utilization should be or things like that.”
A middle management is difficult to distinguish due to small firm size.
“In marketing 2-3 people have been very committed. They have been partly middle management, partly maybe junior management.”
There were no middle managers.
7.2.6 Decision-making process characteristics: quality
In case A, the firm was engineer-driven, but the marketing department also participated
in the decision-making. The finance department did not participate in the decision-
making. Financial analyses were made, but they do not seem to have impacted the
project plan. The progress of the project was reported monthly in a meeting where
project, business, and plant management together with the business development
manager were present. No bureaucracy related to strict rules or procedures was
experienced. An extensive feasibility study of the project was conducted at the outset. It
comprised a market research, an analysis of the competitive situation in the entered
market, and the investment case. Some negative conflict in the project was experienced.
The atmosphere, according to the interviewees, was also very open for conflicting
opinions. This may have contributed to the lower expectations, as employees
responsible for certain goals did not shun outing their opinions when wanting to set
goals on lower levels.

179
In Project B, the sales, research and development, and production departments
participated in the decision-making. Finance department did not participate, as no major
investments were made. Very few calculations were made, as the market was so new
that no data was available. Action plans were made, and they were quite accurately
followed. There was only little conflict, which may be due to the small and tightly knit
project team with a clear common goal. It was possible for the team to set the goals as
high as they considered would be credible to the top management. The small size of the
project team, and the fact that only departments with concrete responsibility in the
project implementation participated in the decision-making, seem to have contributed to
the successful implementation.
In Project C, the firm was so small that everyone who was needed to contribute
something to the project, or who could contribute, was involved in a natural way.
However, no departments without clear responsibility in the case were included in the
decision-making, so the power to decide remained with the employees responsible for
the implementation. This seems likely to have strengthened their commitment and
improved success of the project. Minimal plans were made to an outside financier,
which caused some experienced bureaucracy. Otherwise, the work proceeded day to day
without much planning. No significant conflict was experienced, and therefore the goals
were set in each phase as high as possible within the framework of the gradual strategy.
In Project D, many firm external parties were involved in discussions about the project,
but the decisions were made by only the parties with responsibility. Difficult situations
along the way just increased the project team cohesion. As there was very little conflict,
the goals were always set as high as possible. In Project E, everyone was involved very
naturally as the project team was so small. There was very little conflict and the growth
expectations were set as high as possible.
The active involvement of many functional departments in the decision-making seems
to threaten the feeling of ownership of the plans and the goals on the part of those
participating. It seems that only those parties that are responsible for the implementation
should actively participate in the decision-making. This has not generally jeopardized
the quality of the analyses or the information considered, because the ones responsible
do assure that all resources that can help in the project are utilized as needed. On the

180
other hand, in Project A there were indeed some signs that the project team was slightly
too closed:
”The biggest mistake in the project was made in the development of the critical technological field K: here, we should have more openly looked outside the firm for what has already been developed in this area. The reason for not doing this was that the team just was like that, they wanted to just work by themselves.”
All in all, the aspects of “analytical quality of decision-making process” were not
considered important for promoting the success of the projects. The companies did
consider such aspects useful in projects that are somewhat predictable, but these
leveraging projects involved very much learning. Even if the basis was leveraging the
firm’s existing technological competence in new product markets, so many enabling
technologies had to be learned and completely new solutions developed, that the
uncertainties even in developing the solution were large. Additionally, the product-
market was only being created by the firms, which made forecasting demand with any
accuracy virtually impossible.
“For the later involvement of the business managers [middle management] it would have been good if our approach had been more analytical. The business managers were alienated by our style of decision-making which was based on personal convictions and then decisive action based on that. ” Project A
“Even if the others [the organization outside the project team] was interested in reading reports and seeing plans, there was anyway nothing they could do about the project. We were the ones who had to get it done and get the problems solved as they surfaced. So these steering mechanisms had really no impact on the project, because nobody took any action based on them.” Project C
“Later, we noticed that it might have been good to involve other departments earlier on. The transition to full-scale production might have been more seamless. On the other hand, we did not have any really severe problems due to this.” Project D
“In the full-scale commercialization period it would have been good if the business management [middle management] would have taken a stronger lead of the process and employed more structured and analytical project management. They did not do this because they felt no ownership for the product.” Project D
“The project was so unconcrete that it was impossible to use any normal methods of project management. We just had solve problems as they came and believe we could do it. Otherwise, in our company, we usually employ very strict project management methods.” Project E
Conflict in the decision-making process seems to reduce growth expectations because
the more confrontatively the plans are discussed, the more inflated the expectations tend
to get. A tightly knit project management team with a common view seems to be able to
set the growth expectations on a higher level. The alternative explanation would be that
without conflict, the management that is not directly responsible for the implementation
sets the expectations unrealistically high. This does not seem to hold true in these cases,

181
because here the project team that set the expectations was indeed very directly
responsible for the implementation. Some differences in ways of thinking and goals
existed in the projects, but did not seem to have a dramatic impact on the success.
Reasons for these differences seem rather coincidential. It is difficult to think here of a
systematic pattern that would be causing these differences. Rather, it seems here to have
been a result of the specific environments of the firms.
“This was a business-need driven project, the new part of the technology was only developed because no solution was possible with the existing technology. The implementation of the project then became very technology driven. Here we lost the business management, it was all too abstract for hem, they had no vision of how to concretely market the new product.” Project A
“One driving force in the project was a guy from the university who was doing his PhD on this topic. He of course had to push the project further and make sure it was not terminated. Another impact of his involvement was that he wanted to make sure the solution could be patented. This lead us to do more fundamental development work, not just copy a product from the competitors.” Project C
“The project leader’s motivation was to stay in the budget and to build a business area of his own out of this project. The department head was pushing the fine-tuning of the product characteristics to make sure the sales would take off. The salesmen wanted the product ready fast because customers were already asking for it.” Project C
“One person at the subcontractor also became very involved in the project. His commitment was one of the important driving forces. He later made a great career based on the respect he got for this project.” Project D
“There were no differences at all in perspectives goals or so. Even our education was about exactly the same.” Project E

182
Table 39: Decision-making process characteristics: qualitative aspects Project A Project B Project C Project D Project E Functional participation in all phases ”At that time, the finance guys of the firm did not have so much say, it was pretty much an engineer firm.” Marketing did participate to an extent.
”The functional departments participating in the decision-making process were sales, R&D and production, but not finance, as there were no individual large investments.” Also outside partners were involved.
“Everyone met daily, information was flowing well.” “Production, after-sales, marketing, everyone was very committed to develop the business.” “We also had very many external channels for information.”
“The distributors have been an invaluable source of information, and also end users.” “Now we use even Internet discussion groups for finding out needs and ideas of consumers.”
There were only the five people and outside partners, who were also tightly involved in the process.
Financial analysis “Probably the finance guys made some” “Projects are easily killed with too much analysis and payback schedules.”
Very little; the market was so new that any calculations would have been very theoretical. ”A risk analysis of course always has to be made.”
“The finance department made profitability calculations.” “In addition we had to make minimal plans to an outside financer, as well as some reporting of proceeding.”
“There were just 4-5 of us in the beginning, so we did not do many calculations. Now there is some competition of the same resources, so we need to do more analyses of which ones to invest in.”
“We were always on minus as much as was tolerated.”
Existing process ”There was no bureaucracy, because everyone was satisfied with process.” “In monthly reporting the project, business, and local [plant] management and the business development manager were present.”
None. ”The decision-making process was a part of the annual strategic planning and an annual binding sales budget of every area. The sales budget was supported by a detailed sales plan and strategy.”
“The external financier caused bureaucracy.” “The work was not systematic, but followed more a blurred logic. We gathered enormous amounts of material and then got a feeling of what is the right way.”
None “We were always anxious whether we had now shown enough future benefits and that the development had proceeded, whether they would now believe us.”
Business plan An extensive feasibility study: what was the market for the products, the needed investments and costs, the development costs, an analysis of the competitive situation, and own goals based on these.
”We have been doing exactly what we planned in the action plans.” “We did not make a business plan of the project. Due to market newness there were no historical data or useful market reports.”
“We did not have a business plan.” “For the external financier we made project plans.” “We made extensive competitor analyses.” “At the start we had a schedule, but after setbacks we proceeded day by day.”
“We did not have long-term budgets for the project.” “We had no resources for market research.”
“We were always trying to figure out how we can best sell the benefits of the future.” “We made very detailed competitor analyses.” “We analyzed the whole value chain, which convinced us of the direction.”
Conflict “There was conflict due to the style of one central manager with a different cultural background.” “Some promoted the use of an old technology, which caused even proactive disturbing of the development work.”
“There was normal disagreement, but it was mainly only fruitful. Nobody knows everything, so its good to combine the viewpoints.” “Some people take it personally and don’t want to understand others.”
“We did not experience serious conflicts, just some technical details. Big picture was clear.” “Any problems were discussed, and changes were decided, then it was not discussed any longer.”
Difficult situations just increased the team cohesion. Top management had demands and reactions that were detached from the business. “The lack of hierarchy assures a multitude of viewpoints.”
“There were two strong personalities in the leadership of the project and the discussion sometimes got loud. This was good, because it cleaned the air. Everyone should be let to do things in their own way.”

183
7.3 Summary and interpretation of the case analysis
In the five cases, the following six aspects were especially important for success in the
implementation phase of the projects:
− Committed, homogenic team with power and responsibility, an un-hierarchical and
flexible style of operating and open communication
− Small project scope enabling small teams, less complexity and less uncertain
investments
− Availability of good partners in the critical parts of the value chain, especially where
important aspects were unfamiliar
− Results-oriented management of the project, both on the part of the firm
management and of the project team, and with no political or personal agendas
− Enthusiasm for the project on the part of the team, as well as a willingness to use all
means to achieve results
− Top management support for the project, especially in times of difficulty
− Familiarity with all aspects: technology, marketing and sales, as well as business
logic
The following seemed rather indifferent with regard to project success:
− Pre-determined rules and existing process
− Project controlling mechanisms. These may be important to management in
monitoring the progress of a project, but did not contribute to project success
− Strict rules for planning: committed and empowered teams assured that all relevant
information was used and plans were made in as far as they added value
Two aspects seemed detrimental to success in implementation. The first of these was
formalized, wide, functional participation, which may dilute the sense of responsibility.

184
Further, it does not seem to add value, as all parties that can contribute will be engaged
in the process by the committed project team in any case. The second was conflict,
which had the potential to inflate the important belief in the common vision.
The cases highlight some factors important for finding technology-based growth
projects and committing to a project. These are that the firm is “visionary” and has a
high growth aspiration, because the need to grow sensitizes to opportunities and induces
active search for them. Further important factors were partner networks for being well
informed of developments industry-wide, and corporate level slack in the form of
management time investments in growth.
To conclude, the case analysis supports the first hypothesis concerning the impact of the
firm level factors on the leveraging projects as firm investment in growth in the form of
management time for active search of growth opportunities was an important factor for
the projects to be conceived in Projects A, B, D and E. The cases also support the
project level hypotheses three and four in highlighting the importance of the
applicability of existing operational capabilities in the new market, and of top
management commitment and junior management responsibility. Hypothesis 5 was not
supported by the cases, just as it was not supported by the regression analyses. The cases
provide an explanation as to why the “analytical quality” of the decision-making process
does not seem to contribute to the success of the projects. The reason in the five cases
was that the project teams were so committed, and so empowered, that they made sure
that all possible relevant information was brought to the decision-making process and
utilized. The teams also felt a great responsibility for the success of the projects and had
high personal stakes in them, and therefore made sure that all analyses and viewpoints
that could make the plans more accurate were used. Because of these committed and
empowered teams, formal participation of many different functions in the process,
process formalization, information intensity, requirement for a business plan, or
financial analysis as such had no independent roles in the success of the projects. Too
much conflict might have weakened the team’s common vision, which was very
important for the staying power necessary for project success. Thus, the committed and
empowered teams assured that everything that the measured aspects of “analytical
quality” could have contributed was taken into account informally. In addition, the cases
also point out another explanation as to why the aspects of “analytical quality” had no

185
statistically significant impact on project success in the regression analyses. This is that
the contribution of the aspects of “analytical quality” is very dependent on the context of
the project. Projects B, C, D and E were targeted to markets that were unfamiliar to such
a degree that most analyses, as well as formal planning, information gathering and
functional participation would have been useless. Instead of planning and resorting to
formalized processes, the firms controlled the risks by proceeding in as small steps as
possible. In Project A, all the aspects were familiar, and a more formal approach was
used. This usage of formal approaches in predictable contexts, and informal in
unpredictable ones, brings further support to previous decision-making research
suggesting such a conclusion525.
The firms used various means to reduce risk in the projects, and seem to have proceeded
rather conservatively. Risks resulting from technological and market unfamiliarity were
reduced through active cooperation with partners along the whole value chain, through
staged investments and small investments in general, and through outsourcing the most
unfamiliar areas at least in the beginning. The firms were by no means unprepared when
they started the projects. In Projects B, C, D and E, the firms did not even attempt to
learn everything right at the start, or to do everything by themselves. This supports
further the finding from the project-level regression analysis suggesting that smaller
projects are better at reaching their goals.
525 See Chapter 4.2 Section 2

186
8 CONCLUSIONS
This research set out to contribute to the understanding of firm growth through
technology-based product market entries and to the understanding of the managerial
levers of exploiting this growth opportunity. The main contributions of this research are
improved understanding of management of diversification process and understanding of
technology-based product-market entries. Managerial levers that impact the success of
leveraging technology have been identified.
8.1 Theoretical and empirical contributions
The theoretical and empirical contributions are summarized in two sections. First, the
main three overall contributions are discussed. Then, contributions are reviewed one
hypothesis at the time. The conclusions from the statistical analysis and the case
analyses are presented in the figure below.
Searchfor leveraging projects
Implementationof a leveraging project
Operationof mature business
Managerial resources available for growthTop management: vision
Junior management
Top management: commitment
Middle management
Top management: ambition
Creating munificient environment for starting small projects
Empowered, homogenic team involved in a dynamic learning process
Structured management of ongoing business, fine-tuning of strategy
On the driver's seat
Important themes
Growth expectations
Percent reached
Reached growth
Managerial resources available for growth and familiarity of market create a munificient environment for starting small projects.
However, large projects get more of the important top management attention.
More financial analysis is done in large projects.
Top management and junior management participation, market familiarity, and technological learning promote reaching the goals.
Large project size and functional participation impede reaching the goals.
Analytical quality of the decision-making process is not a useful tool for promoting technology leveraging project success.
Top management and junior management participation, and technological learning promote overall reaching more growth through the projects.
Financial analysis is associated with more growth reached even when controlled for growth expectations. Therefore, it does not seem to be just a feature of large projects, but actually contribute to success of large projects.
Market familiarity impacts even the project results: less growth is reached.
Functional participation has a negative influence to growth reached through the projects.
Figure 14: Conclusions

187
Overall contributions
This dissertation has three main overall contributions that are related to diversification
research, technology-based product market entries and resource-based view as explained
below.
The main contribution of this dissertation to diversification research is examining the
process of diversification. The process of diversification is here explained from an
internal perspective, focusing on managerial processes. As a result, factors that are
under managerial control and that impact the success of growth through related
diversification are identified. Diversification researchers have mentioned the importance
of studying the “how?” question and the managerial process in future research526 527. The
setting of this research is important in examining the impacts of firm-internal factors
such as organizational dynamics and strategy on externally measurable factors such as
growth. This link has not been achieved by the majority of diversification research,
which has been conducted on the basis of information available from firm-external
databases. In addition to examining data available from internal sources only, this
dissertation takes externally available data into account as control variables.
Throughout this dissertation, a reoccurring theme is that two main factors influence the
success of a growth strategy building on technology-based product-market entries.
These are effective identification of growth opportunities and successful implementation
of market entry projects. The importance of these two factors is pointed out in the
literature search, in broad interviews of nine companies for creating the questionnaire, in
the survey results, and in the five cases. Furthermore, the case analyses revealed a third
important overall factor: the transferring of the project to a phase of ongoing business
and gaining the buy-in of the employees responsible for this.
The contribution of this research is in explaining technology-based product market
entries from the management perspective. The importance of investing some of the
526 Silverman, B. S. 1999. Technological resources and the direction of corporate diversification:
toward an integration of the resource-based view and transaction cost economies. Management Science, pp. 1109-1124.
527 Granstrand, O. 2001. The economics and management of evolutionary knowledge diversification. Working Paper, May, Chalmers University of Technology, Sweden.

188
scarce managerial resources in growth instead of tying all of them up in the operative
management of the existing, mature business is emphasized. The factors affecting the
success of individual leveraging projects are explained from a management perspective,
as these are factors consuming managerial resources available for growth. The
management of individual leveraging projects is looked at from three aspects. These are
the firm level growth constraints, the decision-making process, and closeness of the new
market to the original ones. Different management levels have different roles according
to the overall phase of project. High analytical quality of decision making does not seem
beneficial until in the third phase, when focus turns to a mature business based on the
project. Small project size can help implement the project successfully.
The contribution to the resource-based view is in this dissertation studying factors
influencing resource-based growth through exploring the role of managerial resources
for firm growth. The managerial process of resource-based growth is studied through the
decision-making process and the exploitation and acquisition of different
complementary resources. The research adds to the discussion on the resource-based
view concerning the characteristics and value of different resources. The results of this
study suggest that the technological and managerial resources are slow to build and
therefore critical. Operations are less critical. This division is supported by evidence
from performance of the projects. It relates to the discussion on the tautology problem in
defining resources. The definition can be made according to whether it is possible to
acquire the resource fast through investments or not. The importance of the managerial
resource has been previously in the resource-based view touched upon in many streams
of research528, but has not been as explicitly studied as would seem justified for such an
important factor impacting firm growth.
Overall, the technology leveraging projects seem to be characterized rather by gradual
development than structured implementation of a plan. In most cases, the studied
leveraging projects required considerable building of new technological and marketing
competence. Because of this, leveraging technology in new product markets seems to
involve very much uncertainty that can only be tackled by effective learning processes,
not by efficient project management.

189
Contributions by hypothesis
Hypothesis 1 contributes to diversification research by clarifying the importance of
managerial resources and other firm level growth constraints. The newness of this
contribution lies in the deconstruction of managerial resources to their measurable
impacts on technology-based growth, and in studying the impacts of firm level growth
constraints on leveraging project success. These impacts are studied at project level and
firm level. Analyzing the firms’ overall growth, it was found that investing management
resources in identifying and planning technology leveraging projects may be important
for growth. However, as explained in Chapter 6, this result must be considered tentative.
The quantitative analysis of the survey data provides an overview of the impacts of
different components of project characteristics, market familiarity and decision-making
process on project success. Hypotheses 2, 3, 4 and 5 clarify the growth project level,
process, and managerial components of diversification, which are novel aspects in
diversification research529. The impact of diversification on firm performance has
previously been studied with regard to technological diversification, product-market
diversification, and closeness of markets. The process of expanding a firm’s technology-
base and the set of product-markets where the technological competencies are deployed
captures the essence of growth strategy in technology-intensive firms. Several case
studies have described how this diversification process has led some of the most
successful companies of the world to the position they have today.530 This dissertation
contributes to diversification research with an internal perspective on the management
of the diversification process as finding growth opportunities, making growth plans, and
implementing growth projects successfully.
Hypothesis 2 contributes to the discussion in corporate venturing literature on reducing
project complexity. Resource based view also discusses this topic, as complexity of a
growth project consumes the scarce managerial resources. Furthermore, in researching
new product development, an important question is the impact of project complexity on
528 See Chapter 4.1, Section 1 529 See Chapter 4.1 530 See Appendix 2

190
success of new product development projects 531. Smaller scale projects may be less
complex and may therefore succeed better. A finding in the survey results supports this:
projects that were smaller relative to firm size reached their expectations better.
Therefore, it seems that it might, indeed, be beneficial to plan and implement growth
projects stepwise. Having a stepwise structure for growth projects could even lead to
firms becoming involved in more growth projects in total as the perceived risk and
uncertainty of starting a growth project would be lower. According to the five cases, the
growth expectations of a project do not seem to be set by an intrinsic size of an
opportunity alone, as projects can be formulated in very different ways.
The positive impact of the applicability of the existing capabilities in new markets on
success of technology-based product-market entries is partly supported. The sources of
uncertainty have been broken down into ones related to marketing and sales capabilities,
ones related to technological competencies, and ones related to operative capabilities.
The results verify especially the importance of the applicability of the technological
competence, as well as the significance of the uncertainty related to marketing, sales,
and technology investments. It is interesting that the applicability of the marketing and
sales, as well as operative capabilities, does not positively impact the leveraging
projects’ success. The finding that these capabilities are not critical to success of
technology-based growth projects suggests that firms may be able to build, acquire or
contract such capabilities with relatively little risk of failing. However, large marketing
and sales investments did reduce the percentage of expected growth reached. Thus,
when requiring large investments, building new marketing and sales capabilities does
increase the leveraging projects’ risk. The type of uncertainty most affecting projects’
deviations from expectations was poor applicability of the existing technological
competence in the entered market. This suggests that the technological competencies
required for a technology-based product market entry are the most uncertain ones to
learn when compared to marketing or operational capabilities. It must be kept in mind
that the empirical material here consists of technology-based entries, where technology
was the most important and complex resource.
531 Tatikonda, M. V. & Montoya-Weiss, M. M. 2001. Integrating operational and marketing
perspectives of product innovation: The influence of organizational process factors and capabilities on development performance. Management Science, January, Vol. 47, No. 1, pp. 151-172.

191
Hypotheses 4 and 5 explore the factors contributing to the deviation from expected
results of individual growth projects through managerial action. This is new because
managerial resources were deconstructed to their measurable impacts on technology-
based growth on project level. This was achieved by studying their participation in the
decision-making process and by studying the process characteristics. The support for
Hypothesis 4 would seem to indicate the possibility of management to promote the
success of technology leveraging projects by assuring involvement and commitment of
top and junior management in the decision-making process. The fact that Hypothesis 5
was not verified shows that the managerial levers of formalizing processes and
formulating rules had no impact on the success of technology leveraging projects. The
cases showed us that the reason for this may be the innovative and uncertain nature of
technology leveraging projects, and the unfamiliarity always encountered in new market
entries.
A contribution of this dissertation to research on new product development is increasing
the understanding of the organizational process and bringing in a management
perspective, which have been recently suggested as the next important areas to research
with regard to new product development532. This is accomplished through Hypotheses 4
and 5. The project planning perspective has been suggested to be important because the
variety and magnitude of uncertainties a development project faces in its execution are a
function of the choices made in project planning. Setting the organizational process
factors and the target levels of development outcomes are key managerial decisions.
Therefore, according to Tatikonda and Montoya-Weiss, research such as that reported in
this dissertation is needed to investigate who in the organization makes these decisions,
and the nature of their influence on the decision-making process. 533
The case analyses bring more depth to the explanation of the complex social phenomena
underlying the success of entry projects. Especially the importance of the project team
as a driving force is highlighted, as well as top management’s long-term commitment.
532 Tatikonda, M. V. & Montoya-Weiss, M. M. 2001. Integrating operational and marketing
perspectives of product innovation: The influence of organizational process factors and capabilities on development performance. Management Science, January, Vol. 47, No. 1, pp. 151-172.
533 Tatikonda, M. V. & Montoya-Weiss, M. M. 2001. Integrating operational and marketing perspectives of product innovation: The influence of organizational process factors and capabilities on development performance. Management Science, January, Vol. 47, No. 1, pp. 151-172.

192
The five cases reveal two further interesting aspects with regard to the uncertainty
related to applicability of existing capabilities in the entered markets. First, the firms
were rather conservative in their approaches: either all parts of the project were very
familiar or the investments were committed stage-wise to limit risk. Second, with regard
to the parts of the projects that were unfamiliar, the firms actively sought support from
partners who were experts in those parts. This support took the forms of product
development in close cooperation with customers, outsourcing components of the new
product that required technological competence not possessed by the firm, or
cooperating with universities, for example.
8.2 Managerial implications
The most important managerial implication of this research stems from the finding that
many firms have indeed successfully implemented technology-based product-market
entries as a growth strategy. The findings of the research can help understand the risk
and uncertainty related to individual leveraging projects.
According to the findings of the study, technology-based growth is promoted by the
availability of managerial resources for detecting and planning growth projects. Growth
may be promoted by full time assignment of top, middle and junior managers to
monitoring different technologies and the strategic implications of their development, as
well as to taking part in developing business opportunities based on technological
competencies.
The success of technology-based product-market entries is linked to a decision-making
process demonstrating active participation of especially the CEO and top management
as well as junior management, empowerment of the project team, and avoidance of
excessive formalization. Another factor linked to success of technology leveraging
projects is choosing projects from markets that are as familiar as possible. When
existing operational capabilities are not applicable in the new market, a wide range of
possibilities for outsourcing and cooperation exists. These include outsourcing parts of
research and development or, for example, manufacturing, and distribution. External
and firm group internal partners also seem to have an important role in idea generation
and maturation. Furthermore, having renowned partners seems to have decreased the

193
perceived risk and uncertainty of the projects. Finally, it seems beneficial to plan and
implement the projects in subsequent, manageable parts, as this may reduce complexity.
Contrary to contemporary practice, “technology strategy” should be determined in terms
of both the front and the back-end. Back-end means the tasks and decisions currently
often considered as technology strategy, such as targeting the research and development
and other technology acquisition investments correctly. Front-end, which should also be
included in formulating technology strategy, means planning leveraging of technological
competencies. The following Table summarizes the suggested managerial implications.
Table 40: Managerial implications
1. Evaluate the firm’s technological competence to detect growth opportunities
2. Create a munificient environment for starting small and uncertain growth projects
3. Be prepared that the above activities consume managerial resources
4. Put together a team to implement a certain growth project and give it the power and support it needs to succeed. Do not burden the team with too much bureaucracy
5. Be prepared to assure a long term commitment to achieving success
6. Gather partners to support wherever own competencies are thin
7. Plan and implement the project in small stages to increase manageability and achieve results early

194
8.3 Limitations of the research and suggestions for further research
The contributions of this study are limited by a causality problem and the limited
possibility of controlling potentially relevant variables of the firm level of the model, as
discussed earlier. With regard to the project level model, the contributions are limited by
possible inaccuracies in reporting growth expectations and the small number of failed
projects in the sample. Due to these limitations, and to the generally scarce research on
the specific themes of this study, further research is needed on a number of topics in
order to understand leveraging of technology even more deeply. Some of the topics have
been previously touched upon, but would each deserve a dedicated effort. The topics
listed below, as well as the main topic of this dissertation, could also benefit from a
different type of a research approach. For example, in-depth case analyses of one to
three companies could bring valuable understanding of the deeper complex social
phenomena underlying the factors discussed here.
− Impact of managerial services available for growth on firm growth: This research
has brought tentative evidence to support the positive relationship, but research
involving an even more thorough investigation with a larger sample, better
controllable time-lag, and inclusion of an even more exhaustive number of control
variables would be justified in order to examine this important relationship.
− Further clarification of the role of technology management in technology
acquisition, technology externalization, leveraging technology through spin-off
businesses, as well as further clarification of the internal role described here.
− Research on possible, employed, and effective measurements of the degree of
leveraging of technology. This means the extent to which firms have utilized the
opportunities available to them on the basis of a technological competence.
− Relationship between research and development investments and technological
competence.
− Applicability of findings of this study, when the competence to be leveraged is not
technology but, for example, a brand or a branding competence
195
− Outsourcing of operational capabilities when technology is leveraged internally:
How commonly is such a strategy employed? What are the necessary conditions?
What are the implications for the development of a firm’s competence base and for
its dependence on the provider of the operational competencies?
− Linking the firm level and project level of this study closer: studying project
structures and decision-making process characteristics in all projects of a firm for a
certain time period aggregated to a typical growth project management style for the
firm, and the impact of this style on overall firm growth.
− Studying whether firms follow distinct patterns of structuring their growth projects
with regard, for example, to staged investments. Does having a stepwise structure for
growth projects lead to firms becoming involved in a larger number of growth
projects due to a lower perceived risk and uncertainty over starting a growth project?

196
9 SUMMARY
The starting point for this dissertation was that entering new product markets on the
basis of an existing technological competence is for technology intensive companies an
important source of growth. From the literature review, it was concluded that more
research is needed into managerial and decision-making process factors impacting the
success of technology-based new product market entries.
A framework on the impact of managerial resources and decision-making process
characteristics on the success of new product market entries was developed. The
framework is based on hypotheses derived from the resource-based view and decision-
making research. The framework and the underlying hypotheses were verified with data
collected with a survey of 63 companies. The survey questionnaire was developed based
on interviews with nine companies as well as a literature review of previous empirical
research on diversification, and new product development. The empirical data support
the main arguments of the framework. In order to further deepen the conclusions of the
analysis, five of the survey respondent-companies were engaged in deepening case
studies.
Technology-based growth seems to be promoted by the availability of managerial
resources for detecting and planning growth projects. The success of technology-based
product market entries seems to be promoted by a decision-making process involving
active participation of, especially, the CEO and top management, as well as junior
management, empowerment of the project team, and avoidance of excessive structuring.
Another factor possibly promoting the success of technology leveraging projects is the
choice of projects from markets that are as familiar as possible. When existing
operational capabilities are not applicable in the new market, a wide range of
possibilities for outsourcing and cooperation exists. External and firm group internal
partners can also have an important role in idea generation, maturation and
implementation. Finally, it seems beneficial to reduce project complexity by planning
and implementing projects in sequential, manageable parts.

197
This dissertation contributes to diversification research by studying the growth project
level, as well as the process and managerial components of diversification. The main
contribution to the resource-based view is the clarification of the role, and verification
of the importance, of managerial services in resource-based growth. Additionally, the
impact of familiarity with the new product markets on success of the entry is supported.

198
REFERENCES
Abetti, P. A. Convergent and divergent technological and market strategies for global
leadership. International Journal of Technology Management, Vol. 14, No. 6/7/8, pp.
635-657.
Albert, M., Avery, D., Narin, F. & McAllister, P. 1991. Direct validation of citation
counts as indicators of industrially important patents. Research Policy, Vol. 20, pp. 251-
259.
Amason, A. C. & Schweiger, D. M. 1994. Resolving the paradox of conflict, strategic
decision making and organizational performance. International Journal of Conflict
Management, Vol. 5, pp. 239-253.
Amason, A. C. 1996. Distinguishing the effects of functional and dysfunctional conflict
on strategic decision-making: Resolving a paradox for top management teams. Academy
of Management Journal, Vol. 39, No. 1, pp. 123-148.
Amit, R. & Schoemaker, P. J. H. 1993. Strategic assets and organizational rent.
Strategic Management Journal, Vol. 14, pp. 33-46.
Ansoff, H. I. 1957. Strategies for diversification, Harvard Business Review, Volume 35,
No. 5, pp. 113-124.
Argyris, C. & Schön, D. A. 1978. Organizational learning: A theory of action
perspective. Addison-Wesley, Reading, Massachusettes, USA.
Aspesi, C. & Vardhan, D. 1999. Brilliant strategy, but can you execute? (study of 40
firms). McKinsey Quarterly, No. 1, pp. 88-99.
Astley, G. W., Axelsson, R., Butler, J., Hickson, D. J. & Wilson, D. C. 1982.
Complexity and cleavage: Dual explanations of strategic decision making. Journal of
Management Studies, Vol. 19, pp. 357-375.

199
Autio, E. & Laamanen, T. Measurement and evaluation of technology transfer: review
of technology transfer mechanisms and indicators. International Journal of Technology
Management, Vol. 10, Nos 7/8, pp. 643-664.
Autio, E. 1995. Symplectic and generative impacts of new, technology-based firms in
innovation networks: An international comparative study. Doctoral dissertation,
Helsinki University of Technology, Finland.
Autio, E. 1996. In: Kuusi, O. (Ed.) Innovation systems and competitiveness. Taloustieto
Oy, Helsinki, Finland
Avolio, B. J., Yammarino, F. J. & Bass, B. M. 1991. Identifying common methods
variance with data collected from a single source: An unresolved sticky issue. Journal of
Management, Vol. 17, pp. 571-587.
Bagozzi, R. P., Yi, Y. & Phillips, L. W. 1991. Assessing construct validity in
organizational research. Administrative Science Quarterly, Vol. 36, pp. 421-458.
Barney, J. 1991. Firm resources and sustained competitive advantage. Journal of
Management, Vol. 17, No. 1, pp. 99-120.
Barnholt, E. W. 1997. Research Technology Management, Washington, Mar/Apr.
Baysinger, B. & Hoskisson, R. 1989. Diversification strategy and R&D intensity in
multiproduct firms. Academy of Management Journal, Mississippi State, June, pp. 310-
332.
Bean, A. S. 1995. Why some R&D organizations are more productive than others.
Research Technology Management, Washington, Jan/Feb, pp. 25-.
Bean, A. S., Einolf, K. & Russo, M. J. 1999. Benchmarking your R&D: Results from
IRI/CIMS annual R&D survey for FY ’97. Research Technology Management,
Washington, Jan/Feb, pp. 24-34.
Bean, A. S., Russo, M. J. & Whiteley, R. L. 2000. Benchmarking your R&D: Results
from IRI/CIMS annual R&D survey for FY ’98. Research Technology Management,
Washington, Jan/Feb, pp. 16-24.

200
Bell, D. E., Raiffa, H. & Tversky, A. (Eds.) 1988. Decision making: Descriptive,
normative and perscriptive interactions. Cambridge University Press, Cambridge, USA.
Bentler, P. M. & Bonett, D. G. 1980. Significance test and goodness of fit in the analysis
of covariance structures. Psychological Bulletin, Vol. 88, pp. 588-606.
Berry, C. H. 1975. Corporate growth and diversification. Princeton University Press,
Princeton, New Jersey.
Bettis, R. 1991. Performance differences in related and unrelated diversified firms.
Strategic Management Journal, Vol. 2, No. 4, pp. 379-394.
Bettis, R. A. & Prahalad, C. K. 1995. The dominant logic: Retrospective and extension.
Strategic Management Journal, Vol. 16, pp. 3-14.
Bidault, F. & Fisher, W. A. 1994. Technology transactions: Networks over markets.
R&D Management, Vol. 24, No. 4, pp. 373-386.
Block, Z. & MacMillan, I. 1993. Corporate venturing. Harvard Business School Press,
Cambridge, USA.
Bollen, K. A. 1989. Structural equations with latent variables. John Wiley & Sons,
Chapel Hill, USA.
Bourgeois, L. J. III & Eisenhardt, K. M. 1988. Strategic decision processes in high
velocity environments: Four cases in the microcomputer industry. Management Science,
Vol. 34, No. 7, pp. 816-835.
Bowman, D. & Gatignon, H. 1995. Determinants of Competitor Response Time to a
New Product Introduction. Journal of Marketing Research, Vol. 32, February, pp. 30-41.
Bowman, E. H. & Hurry, D. 1987. Strategic options. Working Paper 87-20, Reginald
Jones Center, the Wharton School, University of Pennsylvania, Philadelphia, USA.
Bowman, E. H. & Hurry, D. 1993. Strategy through the option lens. The Academy of
Management Review, Mississippi State, Oct, pp. 760-.

201
Braybrooke, L. J. & Lindblom, C. E. 1963. Strategy of decision, The Free Press, New
York, USA.
Brehmer, B. 1976. Social judgment theory and the analysis of interpersonal conflict.
Psychological Bulletin, Vol. 83, pp. 985-1003.
Brown, S. L. & Eisenhardt, K. M. 1995. Product development: Past research, present
findings, and future directions. Academy of Management Review, April, Vol. 20, pp.
343-378.
Browne, M. W. & Cudeck, R. 1993. Alternative ways of assessing model fit. In: Bollen,
K. A. & Long, J. S. (Eds.) Testing structural equation models. Sage Publications,
Newbury Park, California, USA.
Bryson, J. M. & Bromiley, P. 1993. Critical factors affecting the planning and
implementation of major projects. Strategic Management Journal, Vol. 14, pp. 319-337.
Busby, J. S. & Pitts, C. G. C. 1997. Real options and capital investment decisions.
Management Accounting, London, Vol. 75, No. 10, Nov, pp. 38-.
Capon, N., Farley, J. U. & Hoenig, S. 1990. Determinants of financial performance: a
meta-analysis. Management Science, Vol. 36, pp. 1143-1159.
Castanias, R. P. & Helfat, C. E. 1991. Managerial resources and rents. Journal of
Management, Vol. 17, pp. 155-171.
Caves, R. E. 1974. International trade, international investments and imperfect markets.
Special Papers in International Economics, No. 10, Department of Economics, Princeton
University.
Chandler, A. D. 1962. Strategy and structure: Chapters in the history of the American
industrial enterprise. MIT Press, Cambridge, Massachusettes, USA.
Chandler, G. N. & Hanks, S. H. 1993. Measuring the performance of emerging
businesses: a validation study. Journal of Business Venturing, Vol. 8, No. 5, pp. 391-
408.

202
Chatterjee, S. & Wernerfelt, B. 1991. The link between resources and the type of
diversification – theory and evidence. Strategic Management Journal, Vol. 12, pp. 33-
48.
Chiesa, V. & Manzini, R. 1997. Competence-based diversification. Long range
planning, Vol. 30, no. 2, pp. 209-217.
Child, J. 1973. Parkinson’s progress – accounting for the number of specialists in
organizations. Administrative Science Quarterly, Sept, Vol. 18, No. 3, pp. 328-.
Child, J. 1976. Participation, organization, and social cohesion. Human Relations, May,
Vol. 29, No. 5, pp. 429-.
Child, J. Organizational structure, environment and performance: The role of strategic
choice. Sociology, Vol. 6, pp. 1-22.
Christensen, C. M. & Bower, J. L. 1996. Customer power, strategic investment, and the
failure of leading firms. Strategic Management Journal, March, Vol. 17, pp. 197-218.
Christensen, H. K. & Montgomery, C. A. 1981. Corporate economic performance:
Diversification strategy versus market structure. Strategic Management Journal, Vol. 2,
No. 4, pp. 327-343.
Clayton, J., Gambill, B. & Harned, D. 1999. The curse of too much capital: Building
new businesses in large corporations. McKinsey Quarterly, Vol. 3, pp. 49-59.
Coase, R. 1990. The firm, the market and the law. University of Chicago Press, USA.
Cohen, W. M. & Levinthal, D. A. 1990. Absorptive capacity: A new perspective on
learning and innovation. Administrative Science Quarterly, Vol. 35, No. 1, pp. 128-152.
Conner, K. & Prahalad, C. 1996. A resource-based theory of the firm. Organization
Science, Vol. 7, No. 5, pp. 477-501.
Conrad, G. R. 1997. Unexplored assets for diversification. In: Core-competency based
strategy. Campbell, A. & Sommers Luchs, K. Thomson Business Press, UK.

203
Coombs, R., Saviotti, P. & Walsh, W. 1987. Economics and technological change.
MacMillian Education, London, UK.
Copeland, T., Koller, T. & Murrin, J. 1994. Valuation: Measuring and managing the
value of companies. John Wiley & Sons, New York, USA.
Cray, D., Butler, R. J., Hickson, D. J., Mallory, G. R. & Wilson, D. C. 1986. Proactive
and reactive decision making. In: Subramaniam, V. (Ed.) Problem recognition in public
policy and business management. Delhi, Ashish.
Cray, D., Mallory, G. R., Butler, R. J., Hickson, D. J. & Wilson, D. C. 1988. Sporadic,
fluid, and constricted processes: three types of strategic decision-making in
organizations. Journal of Management Studies, Vol. 25, no. 1, pp. 11-39.
Cyert, R. & March, J. G. 1992. A behavioral theory of the firm. Prentice Hall, New
Jersey, USA.
Cyert, R. M. & March, J. G. 1963. A behavioral theory of the firm. Prentice-Hall,
Englewood Cliffs, New Jersey, USA.
Davis, P. S., Robinson, R. B. Jr., Pearce, J. A. II & Park, S. H. 1992. Business Unit
Relatedness and Performance: A Look at the Pulp and Paper Industry. Strategic
Management Journal, Chichester, June, Vol. 13, No. 5, pp. 349- 362.
Davis, P., Robinson, R., Pearce, J. & Park, S. 1992. Business unit relatedness and
performance: a look at the pulp and paper industry. Strategic Management Journal, Vol.
13, pp. 349-361.
Dean, J. W. Jr. & Sharfman, M. P. 1993. Procedural rationality in the strategic decision
making process. Journal of Management Studies, Vol. 30, No. 3, pp. 587-610.
Deng, Z., Lev, B. & Narin, F. 1999. Science and technology as predictors of stock
performance. Financial Analysts Journal, May / June.
Deutsch, M. 1957. Trust and suspicion. Conflict Resolution, Vol. 2, pp. 265-279.
Dierickx, I. & Cool, K. 1989. Asset stock accumulation and sustainability of
competitive advantage. Management Science, Vol. 35, pp. 1504-1511.

204
Dixit, A. & Pindyck, R. 1994. Investment under uncertainty. Princeton, Princeton
University Press, USA.
Dixit, A. 1992. Investment and hysteresis. Journal of Economic Perspectives, 6(1), pp.
107-132.
Dooley, R. S. & Fryxell, G. E. 1999. Attaining decision quality and commitment from
dissent: the moderating effects of loyalty and competence in strategic decision-making
teams. Academy of Management Journal, Vol. 42, No. 4, pp. 389-402.
Dosi, G, Technological paradigms and technological trajectories, Research Policy, 1982,
Vol. 11, pp. 147-162
Dosi, G., Teece, D. J. & Winter, S. 1992. Toward a theory of corporate coherence:
Preliminary remarks. In: Dosi, G., Giannetti, R. & Toninelli, P. A. (Eds.) 1992.
Technology and enterprise in a historical perspective. Clarendon Press, Oxford.
Duncan, R. 1972. Characteristics of organizational environments and perceived
organizational uncertainty. Administrative Science Quarterly, Vol. 17, pp. 313-327.
Durand, T. 1997. Strategizing for innovation: Competence analysis in assessing strategic
change. In: Competence-based strategic management. Heene, A. & Sanchez, R. (Eds.)
John Wiley & Sons. UK.
Dutton, J. E. 1993. Interpretations on automatic: A different view on strategic issue
diagnosis. Journal of Management Studies, Vol. 30, No. 3, pp. 339-357.
Eisenhardt, K. M. & Bourgeois, L. J. III. 1988. Politics Of Strategic Decision Making In
High-Velocity Environments. Academy of Management Journal, Dec, Vol. 31, No. 4,
pp. 737-770.
Eisenhardt, K. M. & Martin, J. A. 2000. Dynamic capabilities: What are they? Strategic
Management Journal, Vol. 21, pp. 1105-1121.
Eisenhardt, K. M. & Tabrizi, B. N. 1995. Accelerating adaptive processes: Product
innovation in the global computer industry. Administrative Science Quarterly, Vol. 40,
pp. 84-110.

205
Eisenhardt, K. M. & Zbaracki, J. M. 1992. Strategic decision making. Strategic
Management Journal, Winter, Vol. 13, pp. 17-38.
Eisenhardt, K. M. 1989. Making fast decisions in high-velocity environments. Academy
of Management Journal, Vol. 32, pp. 543-576.
Erez, M., Earley, P. C. & Hulin, C. L. 1985. The impact of participation on goal
acceptance and performance: A two-step model. Academy of Management Journal, Vol.
28, pp. 50-66.
Ettlie, J. E. 1998. R&D and global manufacturing performance. Management Science,
Jan, pp. 1-11.
Evans, P. & Wursterer, T. S. 1999. Blown to bits: How the new economics of
information transforms strategy. Harvard Business School Press, Massachusettes, USA.
Farjoun, M. 1994. Beyond industry boundaries: Human expertise, diversification and
resource-related industry groups. Organization Science, May, Vol. 5, No. 2, pp. 185-
200.
Farjoun, M. 1998. The independent and joint effects of the skill and physical bases of
relatedness in diversification. Strategic Management Journal, Vol. 19, pp. 611-630.
Finkelstein, S. 1992. Power in top management teams: Dimensions, measurement, and
validation. Academy of Management Journal, Vol. 35, pp. 505-538.
Folger, R. 1977. Distributive and procedural justice: Combined impact of "voice" and
improvement of experienced inequality. Journal of Personality and Social Psychology,
Vol. 35, pp. 108-119.
Ford, D. & Ryan, C. 1976. The marketing of technology. European Journal of
Marketing, Vol. 11, No. 6, pp. 369-382.
Ford, D. & Ryan, C. 1981. Taking technology to market. Harvard Business Review,
March-April, pp. 117-126.

206
Ford, J. K., MacCallum, R. C. & Tait, M. 1986. The application of exploratory factor
analysis in applied psychology: A critical review and analysis. Personnel Psychology,
Vol. 39, pp. 219-314.
Franko, L. G. 1989. Global corporate competition: Who’s winning, who’s losing, and
the R&D factor as one reason why. Strategic Management Journal, Vol. 37, pp. 1079-
1108.
Frantz, G. A. 1998. From risky business to big business. Research Technology
Management, Washington, Jul/Aug.
Fredrickson, J. W. & Mitchell, T. R. 1984. Strategic decision processes:
Comprehensiveness and performance in an industry with unstable environment.
Academy of Management Journal, Vol. 27, pp. 399-423.
Fredrickson, J. W. 1985. Effects of decision motive and organizational performance
level on strategic decision processes. Academy of Management Journal, Vol. 28, No. 4,
pp. 821-843.
Galbraith, J. 1973. Designing complex organizations. Addison-Wesley, Reading,
Massachusettes.
Galbraith, J. R. 1977. Organization Design. Addison-Welsley Publishing Company,
Reading, MA, USA.
Geringer, M. J., Beaish, B. W. & daCosta, R. C. 1989. Diversification strategy and
internationalization: implications for MNE performance. Strategic Management Journal,
Vol. 10, pp. 110-119.
Geroski, P. 1990. Innovation, technological opportunity, and market structure. Oxford
Economic Papers, Vol. 42, pp. 586-602.
Giget, M. 1997. Technology, innovation and strategy: recent developments.
International Journal of Technology Management, Vol. 14, Nos. 6/7/8, pp. 613-634.

207
Goold, M., Campbell, A. & Alexander, M. 1997. Leveraging competencies across
business. In: Core-competency based strategy. Campbell, A. & Sommers Luchs, K.
Thomson Business Press, UK.
Gort, M. 1962. Diversification and integration in the American industry. Princeton
University Press, Princeton, New Jersey, USA.
Granstrand, O. & Sjölander, S. 1990. Managing inovation in multi-technology
corporations. Research Policy, Vol. 19, No. 1, pp. 35-60.
Granstrand, O. & Sjölander, S. 1992. Internationalization and diversification of multi-
technology corporations. In: Granstrand, O., Håkansson, L. & Sjölander, S. (Eds) 1992.
Technology management and international business. Wiley, London, UK.
Granstrand, O. 1998. Towards a theory of the technology-based firm. Research Policy,
September, pp. 465-489.
Granstrand, O. 1999. Economics and management of technology: teaching material.
Chalmers University of Technology, Sweden.
Granstrand, O. 2001. The economics and management of evolutionary knowledge
diversification. Working Paper, May, Chalmers University of Technology, Sweden.
Grant, R. 1991. The resource-based theory of competitive advantage: Implications for
strategy formulation. California Management Review, Vol. 33, No. 3, pp. 114-135.
Grant, R. M. & Jammine, A. P. 1988. Performance Differences Between The Wrigley /
Rumelt Strategies. Strategic Management Journal, Chichester, Jul/Aug, Vol. 9, No. 4,
pp. 333-347.
Grant, R. M. 1988. On 'Dominant Logic', Relatedness And The Link Between
Diversification. Strategic Management Journal, Chichester, Vol. 9, No. 6, Nov/Dec, pp.
639-643.
Grant, R. M. 1996. Prospering in dynamically-competitive environments:
Organizational capability as knowledge integration. Organization Science, Vol. 7, No. 4,
pp. 375-387.

208
Griffin, A. & Hauser, J. R. 1993. The voice of the customer, Marketing Science, Winter,
Vol. 12, pp. 1-27.
Guth, W. D. & MacMillan, I. C. 1986. Strategy implementation versus middle
management self-interest. Strategic Management Journal, Vol. 7, pp. 313-327.
Hair, J. F. Jr. 1995. Multivariate data analysis. Prentice-Hall, USA.
Hall, B., Jaffe, A. & Trajtenberg, M. 1998. Market value and patent citations: a first
look. Working Paper, University of California at Berkeley, USA.
Hamel, G. & Prahalad, C. K. 1994. Competing for the future. Harvard Business School
Press, USA.
Hamel, G. 1994. The concept of core competence. In: Hamel, G. & Heene, A. (Eds.).
Competence-based competition. John Wiley & Sons, UK.
Hamel, G. 1999. Bringing Silicon Valley Inside. Harvard Business Review, pp. 71-84.
Hansen, G. S. & Wernerfelt, B. 1989. Determinants of Firm Performance. Strategic
Management Journal, Chichester, Sep/Oct, Vol. 10, No. 5, pp. 399-411.
Heck, R. H. 1998. Factor analysis: Exploratory and confirmatory approaches. In:
Marcoulides, G. (Ed.) Modern Methods for Business Research, Lawrence Elbaum
Associates.
Hedberg, B. 1981. How organizations learn and unlearn. In: Nyström, P. C. & Starbuck,
W. H. (Eds.) Handbook of organizational design: Adapting organizations to their
environments. Oxford, UK.
Heene, A. & Sanchez, R. (Eds.) Competence-based strategic management. Chichester,
Wiley.
Henderson, R. M. & Clark, K. B. 1990. Architectural innovation: The reconfiguration of
existing product technologies and the failure of established firms. Administrative
Science Quarterly, Vol. 35, No. 1, pp. 9-30.

209
Hickson, D. J., Butler, R. J., Cray, D., Mallory, G. R. & Wilson, D. C. 1986. Top
decisions: Strategic decision-making in organizations. Blackwell, Oxford.
Hitt, L. M. 1999. Information technology and firm boundaries: Evidence from panel
data. Information Systems Research, Providence, Vol. 10, No. 2, pp. 134-149
Hitt, M. A. & Tyler, B. B. 1991. Strategic decision models: Integrating different
perspectives. Strategic Management Journal, Vol. 12, pp. 327-351.
Hitt, M. A., Hoskisson, R. E. & Hicheon, K. 1997. International diversification: Effects
on innovation and firm performance in product-diversified firms. Academy of
Management Journal, Mississippi State, August, pp. 767-798.
Hitt, M. A., Hoskisson, R. E., Johnson, R. A. & Moesel, D. D. 1996. The market for
corporate control and firm innovation. Academy of Management Journal, Mississippi
State, October, pp. 1084-1119.
Hitt, M. A., Ireland, R. D. & Lee, H. 2000. Technological learning, knowledge
management, firm growth and performance: An introductory essay. Journal of
Engineering and Technology Management, Amsterdam, Sep-Dec, pp. 231-246.
Hoskisson, R. E. & Hitt, M. A. 1988. Strategic control systems and relative R&D
investment in large multiproduct firms. Strategic Management Journal, Vol. 9, pp. 605-
621.
Hoskisson, R. E. & Hitt, M. A. 1990. Antecedents and performance outcomes of
diversification: A reviwe and critique of theoretical perspectives. Journal of
Management, Vol. 16, pp. 461-509.
Hoskisson, R. E. & Hitt, M. A. 1994. Downscoping: How to tame the diversified firm,
Oxford University press, NY, USA.
Hoskisson, R. E., Hitt, M. A. & Hill, C. W. L. 1993. Managerial incentives and
investment in R&D in large multiproduct firms, Organization Science, May, pp. 325-
342.

210
Hoskisson, R., Hitt, E. & Michael, A. 1988. Strategic control systems and relative R&D
investment in large multidivisional companies. Strategic Management Journal,
Chichester, Nov / Dec, pp. 605-
Hultink, E. J., Griffin, A., Hart, S. & Robben, H. S. J. 1997. Industrial new product
launch strategies and product development performance. Journal of Product Innovation
Management, June, Vol. 14, pp. 243-257.
Hurry, D. 1993. Restructuring in the global economy: The consequences of strategic
linkages between Japanese and U.S. firms. Strategic Management Journal, 14, pp. 69-
82.
Hurry, D., Miller, A. T. & Bowman, E. H. 1992. Calls on high technology: Japanese
exploration of venture capital investments in the United States. Strategic Management
Journal, 13.
Inkpen, A. C. 1998. Learning and knowledge creation through international strategic
alliances. Academy of Management Executive, Vol. 12, No. 4, pp. 69-80.
Jaffe, A. 1989. Characterizing the technological position of firms with application to
quantifying technological opportunity and research spillovers. Research Policy, Vol. 18,
pp. 87-97.
Janis, I. L. & Mann, L. 1977. Decision making: A psychological analysis of conflict,
choice and commitment. The Free Press, New York, USA.
Janis, I. L. 1989. Crucial decisions. The Free Press, New York, USA.
Jaworski, B. J. & Kohli A. K. 1993. Market Orientation: Antecedents and
Consequences. Journal of Marketing, Vol. 57, July, pp. 53-71.
Jones, G. R. & Hill, C. W. L. 1988. Transaction-cost analysis of strategy- structure
choice. Strategic Management Journal, Vol. 9, No. 2, pp. 159-172.
Jones, R. E., Jacobs, L. W. & Spijker, W. 1992. Strategic decision processes in
international firms. Management International Review, Vol. 32, No. 3, pp. 219-236.

211
Kalyanaram, G., Robinson, W. T. & Urban, G. L. 1995. Order of Market Entry:
Established Empirical Generalizations, Emerging Empirical Generalizations, and Future
Research. Marketing Science, Vol. 14, Summer, pp. 212-221.
Kazanjian, R. K. & Drazin, R. 1987. Implementing internal diversification: Contingency
factors for organization design choices. Academy of Management Review, Vol. 12, No.
2, pp. 342-354.
Keil, T. 2000. External Corporate Venturing: Cognition, speed, and capability
development. Doctoral dissertation, Helsinki University of Technology Institute of
Strategy and International Business, Finland.
Kim, D-J. & Kogut, B. 1996. Technological platforms and diversification. Organization
Science, Vol. 7, No. 3, May-Jun, pp. 283-301.
Kodama, F. 1986. Technological diversification of Japanese industry. Science, July, pp.
291-296.
Kodama, F. 1992. Technology fusion and the new R&D. Harvard Business Review, Jul-
Aug, pp. 70-78.
Kogut, B. & Kulatilaka, N. 1994. Operating flexibility, global manufacturing, and the
option value of a multinational network. Management Science, 40, pp. 123-139.
Korsgaard, M. A., Schweiger, D. M. & Sapienza, H. J. 1995. Building commitment,
attachment, and trust in strategic decisions. Academy of Management Journal, Feb, Vol.
38, No. 1, pp. 60-.
Krishnan, V. & Ulrich, K. T. 2001. Product development decisions: A review of
literature. Management Science, January, Vol. 47, No. 1, pp. 1-21.
Langley, A. 1990. Patterns I the use of formal analysis in strategic decisions.
Organization Studies, Vol. 11, No. 1, pp. 17-45.
Langlois, R. N. & Robertson, P. L. 1992. Networks and innovation in a modular system:
Lessons from the microcomputer and stereo component industries. Research Policy,
Vol. 21, pp. 297-313.

212
Lanjouw, J. & Schankerman, M. 1997. Stylized facts on patent litigation: value, scope
and ownership. Working Paper No. 6297, National Bureau of Economic Research,
USA.
Larson, A. 1992. Network dyads in entrepreneurial settings: A study of governance
exchange relationships. Administrative Science Quarterly, Vol. 37, pp. 76-104.
Leftwich, R. B. 1974. U.S. multinational companies: profitability, financial leverage and
effective income tax rates. U.S. Survey of Current Business, Vol. 54, May, pp. 27-36.
Leonard-Barton, D. 1992. Core Capabilities and Core Rigidities: A Paradox in
Managing New Product Development. Strategic Management Journal, Chichester, Vol.
13, Summer, pp. 111-125.
Leonard-Barton, D. 1995. Wellsprings of knowledge: Building and sustaining the source
of innovation. Harvard Business School Press, Boston, Massachusettes, USA.
Levinthal, D. A. & March, J. G. 1993. The myopia of learning. Strategic Management
Journal, Vol. 14, pp. 95-112.
Lichtenberg, F. R. & Siegel, D. 1991. The impact of R&D investment on productivity –
new evidence. Economic Inquiry, Long Beach, Apr, pp. 203-230.
Lin, M. J. 1997. The research on the measurement of corporate technology capability.
International Journal of Technology Management, Vol. 13, issue 2, pp. 133-139.
Luehrman T. A. 1998. Strategy as a portfolio of real options. Harvard Business Review,
Boston, Sep/Oct, pp. 89-99.
Lyles, M. A. & Mitroff, J. I. 1980. Organizational problem formulation: An empirical
study. Administrative Science Quarterly, Vol. 25, pp. 102-119.
Lyles, M. A. 1987. Defining strategic problems: Subjective criteria of executives.
Organizational Studies, Vol. 8, No. 3, pp. 263-280.
Mahoney, J. T. & Panadian, J. R. 1992. The resource-based view within the
conversation of strategic management. Strategic Management Journal, Vol. 13, pp. 363-
380.

213
Mahoney, J. The choice of organizational form: vertical financial ownership versus
other methods of vertical integration. Strategic Management Journal, Vol. 13, pp. 559-
584.
Maier, N. R. F. 1970. Problem solving and creativity in individuals and groups. Brooks /
Cole, Belmont, Canada.
Majd, S. & Pindyck, R. S. 1987. Time to build: option value and investment decisions.
Journal of Financial Economics, Vol. 18, pp. 7-27.
Mansfield, M. V. & Wagner, K. 1975. Organizational and strategic factors associated
with probabilities of success in industrial R&D. Journal of Business, Vol. 48, pp. 179-
198.
Markides, C. C. & Williamson, P. J. 1994. Related diversification, core competencies
and corporate performance. Strategic Management Journal, Vol. 15, pp. 149-165.
Markides, C. C. & Williamson, P. J. 1996. Corporate diversification and organizational
structure: a resource-based view. Academy of Management Journal, Vol. 39, pp. 340-
367.
Mason, R. O. & Mitroff, I. I. 1981. Challenging strategic planning assumptions. Wiley,
New York, USA.
McDonald, R. & Seigel, D. 1985. Investment and the valuation of firms when there is an
option to shut down. International Economic Review, Vol. 26, pp. 331-349.
McDonald, R. & Seigel, D. 1986. The value of waiting to invest. Quarterly Journal of
Economics, Vol. 101, pp. 707-727.
McGrath, R. G., MacMillian, I. C. & Tushman, M. L. 1992. Strategic Management
Journal, Vol. 13, pp. 137-161.
McGrath, R. G., Venkataraman, S. & MacMillan, I. C. 1994. The advantage chain:
Antecedents to rents from internal corporate ventures. Journal of Business Venturing,
Vol. 9, pp. 351-369.

214
McKinnon, J. Reliability and validity in field research: Some strategies and tactics.
School of Economic and Financial Studies, Macquarie University.
Meyer, M. H. & Roberts, E. B. 1986. New product strategy in small technology-based
firms: A pilot study. Management Science, Providence, July, pp. 806-822.
Meyer, M. H. & Roberts, E. B. 1988. Focusing product technology for corporate growth.
Sloan Management Review, Cambridge, Summer, pp. 7-10.
Michalisin, M. D., Smith, R. D. & Kline, D. M. 1997. In search of strategic assets.
International Journal of Organizational Analysis, Vol. 5, pp. 360-387.
Milgrom, P. & Roberts, P. 1995. Complementarities and fit: Strategy, structure, and
organizational change in manufacturing. Journal of Accounting and Economics, Vol. 19,
pp. 179-208.
Miller, D. & Friesen, P. H. 1983. Strategy making and environment: the third link.
Strategic Management Journal, Vol. 4, pp. 221-235.
Miller, D. 1987. The structural and environmental correlates of business strategy.
Strategic Management Journal, Vol. 8, No. 1, pp. 55-76.
Miller, S. S. 1963. The management problems of diversification. New York, John Wiley
& Sons.
Mintzberg, H. & Waters, J. A. 1982. Tracking strategy in an entrepreneurial firm.
Academy of Management Journal, Vol. 25, pp. 465-499.
Mintzberg, H., Raisinghani, D. & Theoret, A. 1976. The structure of the "unstructured"
decision processes. Administrative Science Quarterly, Vol. 21, pp. 246-275.
Mitroff, I. I. 1982. Talking past one's colleagues in matters of policy. Strategic
Management Journal, Vol. 3, pp. 374-375.
Montgomery, C. A. & Hariharan, S. 1991. Diversified expansion by large established
firms. Journal of Economic Behavior and Organization, Vol. 15, pp. 71-89.

215
Montgomery, C. A. & Wernerfelt, B. 1988. Diversification, Ricardian rents and Tobins
q. Rand Journal of Economics, Vol. 19, pp. 623-632.
Montgomery, C. A. 1979. Diversification, market structure, and performance: an
extension of Rumelt’s work. Doctoral dissertation, Purdue University.
Montoya-Weiss, M. M. & Calantone, R. 1994. Determinants of new product
performance: A review and meta-analysis. The Journal of Product Innovation
Management, Nov, Vol. 11, No. 5, pp. 397-417.
Moorman, C. & Miner, A. S. 1997. The Role of Organizational Memory in New
Product Performance and Creativity. Journal of Marketing Research, Vol. 34, February,
pp. 91-106.
Moorman, C. & Slotegraaf, R. J. 1999. The contingency value of complementary
capabilities in product development. Journal of Marketing Research, Chicago, May, pp.
239-257.
Moorman, C. 1995. Organizational Market Information Processes: Cultural Antecedents
and New Product Outcomes. Journal of Marketing Research, Vol. 32, August, pp. 318-
35.
Morbey, G. K. & Reither, R. M. 1990. How R&D affects sales growth, productivity, and
profitability. Research Technology Management, Washington, May / Jun, pp. 11-15.
Morbey, G. K. 1988. R&D: Its relationship to company performance. The Journal of
Product Innovation Management, New York, Sep, pp. 191-209.
Morbey, G. K. 1989. R&D expenditures and profit growth. Research Technology
Management, Washington, May / Jun, pp. 20-24.
Narin, F., Noma, E. & Perry, R. 1987. Patents as indicators of corporate technological
strength. Research Policy, Vol. 16, pp. 143-155.
Narver, J. C. & Slater, S. F. 1990. The Effect of a Market Orientation on Business
Profitability. Journal of Marketing, Vol. 54, October, pp. 20-35.

216
Nayyar, P. R. 1992. On the measurement of corporate diversification strategy: Evidence
from large U.S. service firms. Strategic Management Journal, Vol. 13, No. 3, pp. 219-
235.
Nelson, R. & Winter, S. 1982. An evolutionary theory of economic change. The
Belknap Press of Harvard University Press, Cambridge, Massachusettes, USA.
Norton, S. W. 1988. An empirical look at franchising as an organizational form. Journal
of Business, Vol. 61, pp. 197-218.
Nutt, P. C. 1998. Framing strategic decisions. Organization Science, Providence,
Mar/Apr, Vol. 9, No. 2, pp. 195-216.
O’Brien, T. C. & Fadem, J. T. 1999. Identifying new business opportunities. Research
Technology Management, Washington, Sep/Oct, pp. 15-19.
Oskarsson, C. 1993. Diversification and growth in US, Japanese and European multi-
technology corporations. Department of Industrial Management and Economics,
Chalmers University of Technology, Göteborg.
Oskarsson, C. 1993. Technology diversification: The phenomenon, its causes and
effects. Chalmers University of Technology, Göteborg, Sweden.
Paddock, J. L. & Seigel, D. R. 1983. Smith, J, L, Option valuation of claims on physical
assets: The case of offshore petroleum leases. Working Paper, MIT Energy Laboratory.
Palepu, K. 1985. Diversification strategy, profit performance, and the entropy measure.
Strategic Management Journal, Vol. 6, No. 3, pp. 239-255.
Panzar, J, C, Willig, R, D, Economies of scope, AEA Papers and Proceedings, 1981,
Vol, 71, pp. 268-272
Papadakis, V. M., Lioukas, S. & Chambers, D. 1998. Strategic decision-making process:
the role of management and context. Strategic Management Journal, Vol. 19, pp. 115-
147.

217
Parhankangas, A. 1999. Disintegration of technological competencies: An empirical
study of divestments through spin-off arrangements. Doctoral dissertation, Helsinki
University of Technology, Finland.
Pavitt, K., Robson, M. & Townsend, J. 1989. Technological accumulation,
diversification and organization in UK companies 1945-1983. Management Science,
Jan.
Penrose, E. 1972 (orig. publ. 1959). The theory of the growth of the firm. Basil
Blackwell and Mott, Oxford, 5th edition.
Peteraf, M. 1993. The cornerstones of competitive advantage: A resource-based view.
Strategic Management Journal, Vol. 14, No. 3, pp. 179-191.
Pettigrew, A. M. 1973. The politics of organizational decision-making. Tavistock,
London, UK.
Pfeffer, J. & Salanick, G. R. 1974. Organizational decision-making as a political
process: The case of a university budget. Administrative Science Quarterly, Vol. 19, pp.
135-151.
Podsakoff, P. M. & Organ, D. W. 1986. Self-reports in organizational research:
Problems and prospects. Journal of Management, Vol. 12, pp. 531-544.
Porter, M. A. 1980. Competitive strategy. Free press, New York, USA.
Porter, M. E. 1985. Competitive Advantage: Creating and sustaining superior
performance. The Free Press, USA.
Powell, T. C. 1992. Strategic planning as competitive advantage. Strategic Management
Journal, Vol. 13, No. 7, pp. 551-559.
Powell, T. C. 1993. Administrative skills as competitive advantage – Extending Porter’s
analytical framework. Revue Canadienne des Sciences de l’Administration, Vol. 10, No.
2, pp. 141-155.

218
Prahalad, C. K. & Bettis, R. A. 1986. The Dominant Logic: A New Linkage Between
Diversity and Performance. Strategic Management Journal, Chichester, Vol. 7, No. 6,
Nov/Dec, pp. 485-502.
Prahalad, C. K. & Hamel, G. 1996. The core competence of the corporation. In:
Burgelman, R. A., Maidique, M. A. & Wheelwright, S.C. 1996. Strategic management
of technology and innovation. Times Mirror Higher Education Group, USA.
Priem, R. L. & Butler, J. E. 2001. Is the resource-based “view” a useful perspective for
strategic management research? Academy of Management Review, January, Vol. 26,
No. 1, pp. 57-66.
Priem, R. L. & Butler, J. E. 2001. Tautology in the resource-based view and the
implications of externally determined resource-value: Further comments. Academy of
Management Review, January, Vol. 26, No. 1, pp. 22-40.
Priem, R. L. & Price, K. H. 1991. Process and outcome expectations for the dialectical
inquiry, devil's advocacy, and consensus techniques of strategic decision making. Group
and Organization Studies, Vol. 16, pp. 206-225.
Priem, R. L., Rasheed, A. M. A. & Kotulic, A. G. 1995. Rationality in strategic decision
processes, environmental dynamism and firm performance. Journal of Management,
Vol. 21, no. 5, pp. 913-929.
Quinn, J. B. 1980. Strategies for change: logical incrementalism. Irwin-Dorsey,
Georgetown, Canada.
Ramanujan, V. & Varadarajan, P. 1989. Research on corporate diversification: A
synthesis. Strateic Management Journal, Vol. 10, pp. 523-552.
Rasche, C. 1994. Wettbewerbsvorteile durch Kernkompetenzen: Ein
resourcenorientierter Ansatz. Wiesbaden: Deutscher Universitäts Verlag.
Roberts, E. B. & Berry, C. A. 1985. Entering new businesses: Selecting strategies for
success. Sloan Management Review, Spring, pp. 3-17.

219
Roberts, E. B. 1995. Benchmarking the strategic management of technology – I.
Research Technology management, Washington, Jan / Feb, pp. 44-.
Roberts, E. B. 1995. Benchmarking the strategic management of technology – II.
Research Technology management, Washington, Mar / Apr, pp. 18-.
Robins, J. & Wiersema, M. 1995. A resource-based approach to the multi-business firm:
Empirical analysis of portfolio inter-relationships and corporate financial performance.
Strategic Management Journal, Vol. 16, No. 4, pp. 277-299.
Romanelli, E. & Tushman, L. 1986. Inertia, environments and strategic choice: A quasi-
experimental design for comparative-longitudinal research. Management Science, Vol.
32, pp. 608-621.
Rosenberg, N. 1984. Science, invention and economic growth, Economic Journal.
Rugman, A. M. 1979. International diversification and the multinational enterprise.
Lexington Books, Lexington, Massachusettes, USA.
Rumelt, R. P. 1974. Strategy, structure and economic performance. Harvard University
Press, Cambridge, Massachusettes, USA.
Rumelt, R. P. 1984. Toward a strategic theory of the firm. In: Lamb, R. B. (Ed.)
Competitive strategic management. Prentice-Hall, Englewood Cliffs, NJ, USA.
Rumelt, R. P. 1986. Strategy, structure, and economic performance (revised edition).
Boston, MA, USA.
Rumelt, R. P. 1991. How Much Does Industry Matter? Strategic Management Journal,
Chichester, March, Vol. 12, No. 3, 167-185.
Sampler, J. L. 1998. Redefining industry structure for the information age. Strategic
Management Journal, Chichester, Vol. 19, No. 4, pp. 343-355.
Sanchez, R. & Heene, A. (Eds.) Strategic learning and knowledge management.
Chichester, Wiley.

220
Sanchez, R. & Heene, A. 1996. A systems view of the firm in competence-based
competition. In: Sanchez, R., Heene, A. & Thomas, H. Dynamics of competence-based
competition. Elsevier, UK.
Sanchez, R. & Heene, A. 1997. Competence-based strategic management: Concepts and
issues for theory, research, and practice. In: Sanchez, R. & Heene, A. Competence-based
strategic management. John Wiley & Sons, UK.
Sanchez, R., Heene, A. & Thomas, H. (Eds.) 1996. Dynamics of competence-based
competition. Oxford, Elsevier Science.
Sanchez, R., Heene, A. & Thomas, H. 1997. Introduction: towards the theory and
practice of competence-based competition. In:Dynamics of competence-based
competition. Pergamon, UK.
Sanzhez, R., Heene, A. & Thomas, H. (Eds.) 1996. Dynamics of competence-based
competition: Theory and practice in the new strategic management. Elsevier, Oxford,
UK.
Scherer, F. M. 1980. Industrial market structure and economic performance. 2nd edition.
Cambridge, Massachusettes.
Schumpeter, J. A. 1976 (orig. publ. 1943). Capitalism, socialism and democracy,
George Allen and Unwin, London, UK.
Schweiger, D. M. & Sandberg, W. R. 1989. The utilization of individual capabilities in
group approaches to strategic decision-making. Strategic Management Journal, Vol. 10,
pp. 31-43.
Schweiger, D. M., Sandberg, W. R. & Ragan, J. W. 1986. Group Approaches for
Improving Strategic Decision Making: A Comparative Analysis of Dialectical Inquiry,
Devil's Advocacy, and Consensus, Academy of Management Journal, March, Vol. 29,
No. 1, pp. 51-21.
Schwenk, C. R. 1990. Conflict in organizational decision making: An exploratory study
of its effects in for-profit and not-for-profit organizations. Management Science, Vol.
36. pp. 436-448.

221
Schwenk, C. R. 1995. Strategic decision making. Journal of Management, Vol. 21,
No.3, pp. 471-493.
Severn, A. K. & Laurence, M. M. 1974. Direct investment, research intensity, and
profitability. Journal of Financial and Quantitative Analysis, Vol. 29, pp. 181-190.
Sharif, N. & Ramanathan, K. 1987. A framework for technology-based national
planning. Technological forecasting and social change, Vol. 32.
Sharma, A. & Kesner, I. 1996. Diversifying entry: Some ex ante explanations for
postentry survival and growth. Academy of Management Journal, Mississippi State,
June, Vol. 39, No, 3, pp. 635-.
Silverman, B. S. 1999. Technological resources and the direction of corporate
diversification: toward an integration of the resource-based view and transaction cost
economies. Management Science, pp. 1109-1124.
Simmonds, P. G. 1990. The combined diversification breadth and mode dimensions and
the performance of large firms. Strategic Management Journal, Vol. 11, pp. 399-410.
Simon, H. A. 1960. The new science of management decision. Harper & Row, NY,
USA.
Singh, H. & Montgomery, C. 1987. Corporate acquisition strategies and economic
performance. Strategic Management Journal, Vol. 8, No. 4, pp. 377-386.
Sinha, D. K. 1990. The contribution of formal planning to decisions. Strategic
Management Journal, Vol. 11, pp. 479-492.
Sjölander, S. & Oskarsson, C. 1995. Diversification: exploiting the flow of technology.
A Swedish comparison. International journal of technology management, Vol. 10, no.
1., pp. 21-30.
Smith, K. G., Gannon, M. J., Grimm, C. & Mitchell, T. R. 1988. Decision making
behavior in smaller entrepreneurial and larger professionally managed firms. Journal of
Business Venturing, Vol. 3, pp. 223-232.

222
Snow, C. C. & Hrebiniak, L. G. 1980. Strategy, distinctive competence, and
organizational performance. Administrative Science Quarterly, Vol. 25, no. 2, pp. 317-
336.
Song, Z. M. & Parry, M. E. 1997. The Determinants of Japanese New Product
Successes. Journal of Marketing Research, Vol. 34, February, pp. 64-76.
Sorrentino, M. & Williams, M. 1995. Relatedness and corporate venturing: Does it
really matter? Journal of Business Venturing, Jan, Vol. 10, No. 1, pp. 59-74.
Spector, P. E. 1987. Method Variance As An Artifact In Self-Reported Affect. Journal
of Applied Psychology, Washington, August, Vol. 72, No. 3, pp. 438- 444.
Stankiewicz, R. Basic technologies and the innovation process. In: Sigurdson, J. (Ed.).
Measuring the dynamics of technological change.
Steensma, H. K. 1996. Acquiring technological competencies through inter-organization
collaboration: An organizational learning perspective. Journal of Engineering and
Technology Management, Jan, Vol. 12, No. 4, pp. 267-286.
Stein, J. 1980. Contextual influence on strategic decision methods. Ph.D. dissertation,
University of Pennsylvania, USA.
Stein, J. 1997. On building and leveraging competencies across organizational borders:
A socio-cognitive framework. In. Heene, A. & Sanchez, R. Competence-based strategic
management. John Wiley & Sons.
Stimpert, J. L. & Duhaime, I. M. 1997. In the eyes of the beholder: conceptualizations of
relatedness held by the managers of large diversified firms. Strategic Management
Journal, Vol. 18:2, pp. 111-125.
Stopford, J. M. & Baden-Fuller, C. 1994. Creating corporate entrepreneurship, Strategic
Management Journal, Vol. 15, pp. 521-536.
Structural equation modeling discussion group newsletter, Winter 2001.
Tatikonda, M. V. & Montoya-Weiss, M. M. 2001. Integrating operational and marketing
perspectives of product innovation: The influence of organizational process factors and

223
capabilities on development performance. Management Science, January, Vol. 47, No.
1, pp. 151-172.
Teece, D, J, Towards and economic theory of the multiproduct firm, Journal of
Economics and Organization, 1980, Vol. 3, pp. 39-63
Teece, D. 1986. Profiting from technological innovation: Implications for integration,
collaboration, licensing and public policy. Research Policy, Vol. 15, pp. 285-305.
Teece, D. 1988. Technological change and the nature of the firm. In: Dosi, G., Freeman,
C., Nelson, R., Silverberg, G., & Soete, L. (Eds.) Technological change and economic
theory. Pinter.
Teece, D. J. & Pisano, G. 1994. The dynamic capabilities of firms: An introduction.
Industrial and corporate change, Vol. 3, No. 3, pp. 537-556.
Teece, D. J. 1980. Economics of scope and the scope of the enterprise. Journal of
Economic Behavior and Organization, Vol. 1, pp. 223-247.
Teece, D. J. 1982. Towards an economic theory of the multiproduct firm. Journal of
Economic Behavior and Organization, Vol. 3, pp. 39-63.
Teece, D. J. 1986. Profiting from Technological Innovation: Implications for
Integration, Collaboration, Licensing and Public Policy. Research Policy, Dec, Vol. 15,
No. 6, pp. 285-305.
Teece, D. J. 1988. Capturing Value from Technological Innovation: Integration,
Strategic Partnering, and Licensing Decisions. Interfaces, Providence, May/Jun, Vol. 18,
No. 3, pp. 46-62.
Teece, D. J. 1996. Profiting from technological innovation: Implications for integration,
collaboration, licensing, and public policy. In: Burgelman, R. A., Modesto A. M. &
Wheelwright S. C. Strategic management of technology and innovation. Times Mirror
Higher Education Group, USA.
Teece, D. J. 1997. In: Shinoya, Y. & Perlmann, M. (eds.) Innovation in technology,
industries and institutions. The University of Michigan Press, USA.

224
Teece, D. J. 1998. Capturing value from knowledge assets: The new economy, markets
for know-how, and intangible assets. California Management Review, Berkeley, Spring,
Vol. 40, No. 3, pp. 55-79.
Teece, D. J., Rumelt, R., Dosi, G. & Winter, S. 1994. Understanding corporate
coherence: Theory and evidence. Journal of Economic Behavior and Organization, Vol.
23, pp. 1-30.
Terreberry, S. 1968. The evaluation of organizational environments. Administrative
Science Quarterly, Vol. 12, pp. 590-613.
Thompson, J. D. 1967. Organizations in Action. McGraw Hill, New York, USA.
Trajtenberg, M. 1989. The welfare analysis of product innovations with an application
to computed tomography scanners. Journal of Political Economy, Vol. 97, pp. 445-479.
Trajtenberg, M.1990. A penny for your quotes: patent citations and the value of
innovations. Rand Journal of Economics, Vol.21, pp.172-187.
Trigeorgis, L. & Mason, S. P. 1987. Valuing managerial flexibility. Midland Corporate
Finance Journal, Vol. 3, No. 1, pp. 14-21.
Trigeorgis, L. 1996. Real options: Managerial flexibility and strategy in resource
allocation. The MIT Press, Cambridge, USA.
Tsai, W. 2000. Social capital, strategic relatedness and the formation of
interorganizational linkages. Strategic Management Journal, Vol. 21, pp. 925-939.
Tushman, M. L. O. & Reilly, C. A. III. 1996. Ambidextrous organizations: Managing
evolutionary and revolutionary change. California Management Review, Berkeley, Vol.
38, No. 4, Summer, pp. 8-30.
Ulrich, K. T. & Ellison, D. 1999. Holistic customer requirements and the design-select
decision. Management Science, Vol. 45, No. 5, pp. 641-658.
Verdin, P. J. & Williamson, P. J. 1994. Core competence, competitive advantage and
market analysis: forging the links. In: Hamel, G. & Heene, A. (Eds.) Competence-Based
Competition. Wiley, New York, USA.

225
Wally, S. & Baum, R. J. 1994. Personal and structural determinants of the pace of
strategic decision making. Academy of Management Journal, Vol. 37, No. 4, pp. 932-
956.
Weiss, L. A. 1981. Start-up businesses: a comparison of performances. Sloan
Management Review, Fall, pp. 37-53.
Wernerfelt, B. A. 1984. Resource-based view of the firm. Strategic Management
Journal, Vol. 5, pp. 171-180.
Whetten, D. A. 1993. What constitutes a theoretical contribution. Academy of
Management Journal, No. 14, No. 4, pp. 490-495.
Wiersema, M. F. & Bantel, K. A. 1993. Top management team turnover as an
adaptation mechanism: The role of the environment. Strategic Management Journal,
Vol. 14, pp. 485-504.
Williamson, O. 1983. Markets and hierarchies. Free Press, USA.
Williamson, O. E. 1999. Strategy research: Governance and competence perspectives.
Strategic Management Journal, Vol. 20, pp. 1087-1108.
Wolf, B. M. 1977. Industrial diversification and industrialization: some empirical
evidence. Journal of Industrial Economics, Vol. 26, pp. 177-191.
Woo, C. Y., Willard, G. E. & Daellenbach, U. S. 1992. Spin-Off Performance: A Case
of Overstated Expectations? Strategic Management Journal, Chichester, Sep, Vol. 13,
No. 6, pp. 433-448.
Woolridge, S. W. & Floyd. B. 1990. The strategy process, middle management
involvement, and organizational performance. Strategic Management Journal, Vol. 11,
pp. 231-241.
Zahra, S. A. & Covin, J. 1995. Contextual influences on the corporate entrepreneurship:
company performance relationship in established firms: A longitudinal analysis. Journal
of Business Venturing, Vol. 10, pp. 43-58.

226
Zirger, B. J. & Maidique, M. A. 1990. A model of new product development: An
empirical test. Management Science, Vol. 36, No. 7, pp. 867-883.

227
APPENDICES
Appendix 1: Summary of empirical research in new product development
Issues that have been researched with regard to decisions within a project534
Phase of new product development
Issues that have been researched
Concept development generally What are the target values of the product attributes, including price? What is the core product concept? What is the product architecture? What variants of the product will be offered? Which components will be shared across which variants of the product?
Concept development
What will be the overall physical form and industrial design of the product? Which components will be designed and which will be selected? Who will design the components? Who will produce the components and assemble the product? What is the configuration of the physical supply chain, including the location of the decouple point? What type of process will be used to assemble the product?
Supply-chain design
Who will develop and supply process technology and equipment? Product design generally. What are the values of the key design parameters? What is the configuration of the components and assembly precedence relations? Product design
What is the detailed design of the components, including material and process selection? What is the prototyping plan? Performance
testing and validation What technologies should be used for prototyping?
What is the plan for market testing and launch? Production ramp-up and launch What is the plan for production ramp-up?
534 Krishnan, V, Ulrich, K, T, Product development decisions: A review of literature, Management
Science, January 2001, Vol. 47, No. 1, pp. 1-21

228
Issues that have been researched with regard to decisions in setting up a project535
Phase of new product development
Issues that have been researched
Overall What is the market and product strategy to maximize probability of economic success? What portfolio of product opportunities will be pursued? What is the timing of product development projects? What, if any, assets such as platforms will be shared across which products?
Product strategy and planning
Which technologies will be employed in the products? Organization generally – Will a functional project, or matrix organization be used? How will the team be staffed? How will project performance be measured? What will be the physical arrangement and location of the team? What investments in infrastructure, tools and training should be made?
Product development organization
What type of development process will be employed (e.g. stage-gate)? What is the relative priority of development objectives? What is the planned timing and sequence of development activities? What are the major project milestones and planned prototypes? What will be the communication mechanisms among team members?
Project management
How will the project be monitored and controlled?
535 Krishnan, V, Ulrich, K, T, Product development decisions: A review of literature, Management
Science, January 2001, Vol. 47, No. 1, pp. 1-21

229
Appendix 2: Operationalizations of the variables Operationalization of extent of participation of different hierarchical levels in the decision-making process
Factor loadings Variable
Cron-bach alpha
Item 1 2 3
Generating growth ideas based on technological competence 0,619 0,046 -0,044
Screening out ideas realistic technologically and from market potential 0,648 0,092 -0,028
Evaluating and comparing the ideas 0,693 0,120 0,072Making the final decision to enter the new market 0,852 0,013 -0,025
CEO
Choosing people responsible for implementation 0,678 -0,178 -0,109
Generating growth ideas based on technological competence 0,830 0,190 0,005
Screening out ideas realistic technologically and from market potential 0,885 0,136 0,060
Evaluating and comparing the ideas 0,856 0,162 -0,081 Making the final decision to enter the new market 0,592 0,409 0,230
1 CEO and top management
0,936
Top mgmt.
Choosing people responsible for implementation 0,531 0,274 0,006
Generating growth ideas based on technological competence 0,253 0,881 0,182
Screening out ideas realistic technologically and from market potential 0,234 0,825 0,290
Evaluating and comparing the ideas 0,216 0,835 0,277 Making the final decision to enter the new market 0,012 0,625 0,086
2 Middle management
0,887
Choosing people responsible for implementation -0,003 0,442 0,007 Generating growth ideas based on technological competence 0,150 0,184 0,736
Screening out ideas realistic technologically and from market potential 0,092 0,213 0,883
Evaluating and comparing the ideas 0,096 0,197 0,929 Making the final decision to enter the new market -0,146 0,050 0,603
3 Junior management
0,858
Choosing people responsible for implementation -0,136 0,041 0,427

230
Operationalization of wide functional participation and information intensity of the decision-making process
Factor loading Variable
Cron-bach alpha
Item 1 2
Generating growth ideas based on technological competence 0,471 -0,063
Screening out ideas realistic technologically and from market potential 0,658 0,062
Evaluating and comparing the ideas 0,999 0,019 Making the final decision to enter the new market 0,671 0,058
1 Wide functional participation
0,820
People from many functional departments took part in this phase Choosing people responsible for
implementation 0,308 0,024
There were many meetings in this phase -0,060 0,483 Information was actively collected from different -0,008 0,561
Generating growth ideas External sources of information were used -0,092 0,760
0,081 0,721 -0,082 0,596 Screening out ideas realistic technologically and from
market potential -0,061 0,749 0,205 0,700 0,167 0,501 Evaluating and comparing the ideas 0,039 0,595 -0,058 0,530 0,165 0,368 Making the final decision to enter the new market 0,285 0,599 0,019 0,492 0,016 0,663
2 Information intensity
0,917
Choosing people responsible for implementation 0,018 0,605
Operationalization of existing process, usage of business plan and the financial reporting and analysis related to the process
Factor loadings Variable
Cron-bach alpha
Item 1 2 3
A written guideline existed for this kind of a process 0,727 0,110 -0,025
A set of criteria defining strategically fitting growth projects existed 0,768 0,061 0,079
1 Existing process
0,799
There was a certain process for the continuous screening for growth ideas 0,669 0,198 0,132
In order to approve a decision like this, a business plan is always required 0,159 0,967 0,199 2
Business plan 0,915 In our company a business plan must always include certain parts 0,264 0,745 0,260
Income statement or balance sheet estimates of the project had an important role -0,021 0,388 0,605
Detailed cost estimates concerning the project had an important role 0,076 0,185 0,536
3 Financial analysis
0,625
Plan on sources of financing had an important role 0,062 0,019 0,559

231
Operationalization of conflict
Variable Cron-bach alpha
Item Factor loading
During the process coalitions with different objectives were formed within the company 0,760
The central persons in the process went through many long negotiations 0,585
There was a lot of disagreement regarding the objectives of the decision 0,851
There was a lot of disagreement concerning what would be the correct procedure to follow in the process 0,723
Conflict 0,875
There was a lot of disagreement regarding the correctness of the conclusions 0,799
Operationalization of applicability of existing operational capabilities in the new market
Factor loadings Variable
Cron-bach alpha
Item 1 2 3 4 5
Sales and marketing department 0,557 0,126 0,155 -0,026 0,273
Distribution and after-sales networks 0,469 -0,276 0,001 -0,349 0,337
Knowledge of customer groups 0,856 0,127 0,040 0,261 -0,264
1 Marketing and sales fit
0,746
Knowledge of sales methods 0,807 0,083 0,170 0,026 -0,025
Research and development department 0,085 0,979 0,024 -0,105 0,1452 Technology fit 0,694
Technological competence 0,100 0,539 0,064 0,195 0,044Investments in sales and marketing department 0,184 0,198 0,960 0,017 0,0563 Marketing
and sales investments
0,820 Investments in distribution and after-sales networks 0,102 -
0,039 0,697 0,027 0,089
Investments in research and development department 0,054 0,166 0,011 0,478 0,0554
Technology investments
0,282 Investments in technological competencies acquired from outside the company 0,146 -
0,104 0,199 0,292 0,119
Production plants 0,123 0,095 0,133 -0,539 0,479
Purchasing or sourcing department 0,124 -0,052
-0,042
-0,136 0,890
Knowledge of production technology -0,080 0,091 0,223 0,009 0,474
5 Operations fit 0,788
Knowledge of purchasing / sourcing -0,002 0,177 0,031 0,289 0,879
As shown in the above Table, the variable “technology investments” has low factor loadings and a poor Cronbach alpha indicator. This is understandable, as the strength of factor loadings on one factor as well as the Cronbach alpha measure the convergent validity of the variable, that is to what extent do the questions measure the same issue. Here, the questions purposely do not measure exactly the same issue, but two aspects of one issue: the amount of investments in the own research and development department may even contradict investments in technological competencies acquired from outside the company. It is still, however, meaningful to measure how much the firm in general has invested in its technological competencies during the project. Therefore, on the basis of content validity, the variable “technological investments” will be used as the average of answers to these two questions. Furthermore, the factor analysis does verify the discriminant validity of the variable: the two questions do load much more on the factor “technology investments” than on any other factor.

232
Operationalization of technological learning
Variable Cron-bach alpha
Item Factor loading
New technological fields were learned from the project 0,123 Learning related to technological fields caused changes in the implementation plan of the project 0,123
New patents or licenses were bought in order to implement the growth plan 0,999
Technological learning
0,503
In the project new technological inventions were made internally, that were patented 0,498
The above Table shows a factor analysis for the variable “Technological learning”. Here, neither the results of factor analysis nor the Cronbach alpha confirm convergent validity. However, learning completely new technological fields, having to change the project plans due to such technological learning, buying new patents or licenses during the project and patenting own inventions resulting from the project are important aspects describing how much radically new technological learning happened in the project. They also reflect how much the firm’s technological competence base grew because of the project. It seems natural that the answers to these questions do not converge, as it is not to be expected that firms that for example learned new technological fields from the project always would have also bought new patents or licenses. Still, a firm that would have answered giving high scores to all of the four questions would be likely to have had a more intense learning experience in the project than a firm that would have given a high score only to one of the questions. Therefore, on the basis of content validity, the variable “technological learning” will be used as the average of answers to these four questions. Operationalization of growth aspiration
Variable Cron-bach alpha
Item Factor loading
We wanted to grow the company as fast as we could 0,524 We were prepared to sacrifice the profitability of the company for some years if that way we could get the company to grow fast
0,441
We wanted to keep the company's operations on the same level as they were 0,623
Trying to make the company grow fast was pointless 0,683
Growth aspiration 0,694
We wanted to keep the company small 0,562

233
Appendix 3: Questions from the questionnaire
Managerial services available for growth How many people at each of your company's hierarchical levels takes part in technology management part- or full-time (estimate!)? Technology management means here the monitoring of different technologies and the strategic implications of their development, as well as taking part in developing business opportunities based on technological competencies.
Organizational levels
Involved in technology-management part-time (at least ~5% of working time)
Involved in technology-management full time (main task)
Managing director Persons Persons
Top management Persons Persons
Middle management Persons Persons
Junior manager / group leader / expert level Persons Persons
Other employees Persons Persons
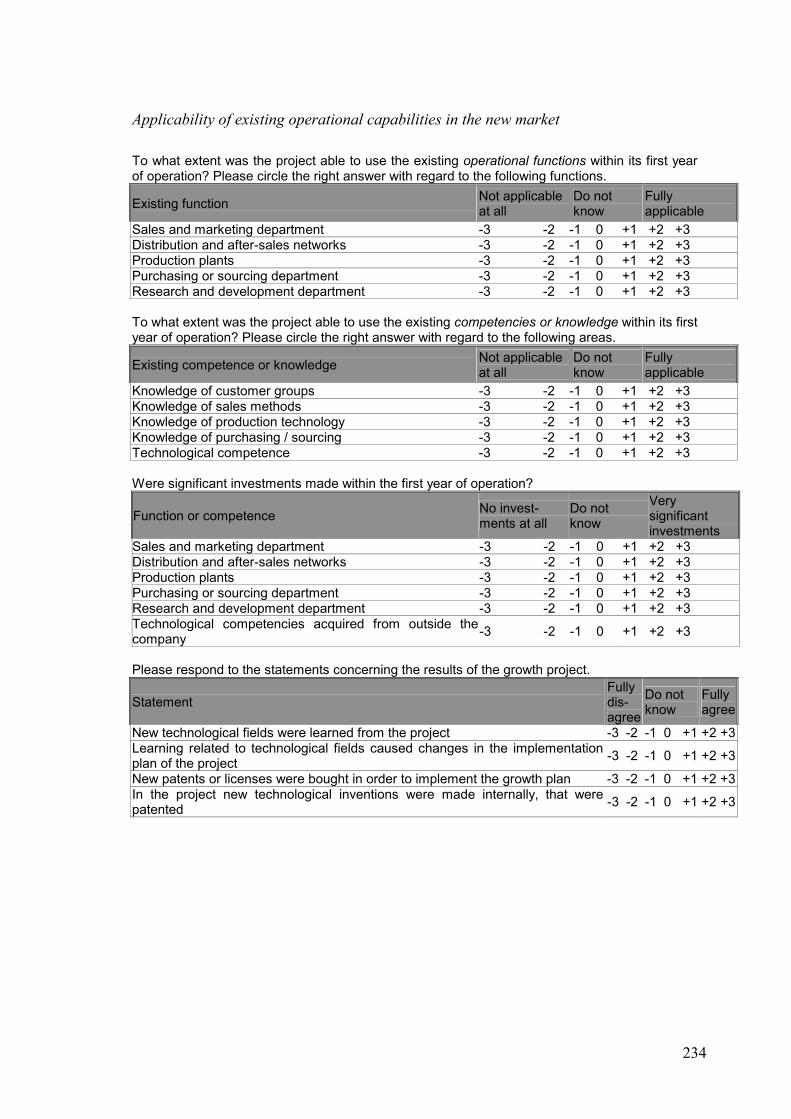
234
Applicability of existing operational capabilities in the new market To what extent was the project able to use the existing operational functions within its first year of operation? Please circle the right answer with regard to the following functions.
Existing function Not applicable at all
Do not know
Fully applicable
Sales and marketing department -3 -2 -1 0 +1 +2 +3 Distribution and after-sales networks -3 -2 -1 0 +1 +2 +3 Production plants -3 -2 -1 0 +1 +2 +3 Purchasing or sourcing department -3 -2 -1 0 +1 +2 +3 Research and development department -3 -2 -1 0 +1 +2 +3 To what extent was the project able to use the existing competencies or knowledge within its first year of operation? Please circle the right answer with regard to the following areas.
Existing competence or knowledge Not applicable at all
Do not know
Fully applicable
Knowledge of customer groups -3 -2 -1 0 +1 +2 +3 Knowledge of sales methods -3 -2 -1 0 +1 +2 +3 Knowledge of production technology -3 -2 -1 0 +1 +2 +3 Knowledge of purchasing / sourcing -3 -2 -1 0 +1 +2 +3 Technological competence -3 -2 -1 0 +1 +2 +3 Were significant investments made within the first year of operation?
Function or competence No invest-ments at all
Do not know
Very significant investments
Sales and marketing department -3 -2 -1 0 +1 +2 +3 Distribution and after-sales networks -3 -2 -1 0 +1 +2 +3 Production plants -3 -2 -1 0 +1 +2 +3 Purchasing or sourcing department -3 -2 -1 0 +1 +2 +3 Research and development department -3 -2 -1 0 +1 +2 +3 Technological competencies acquired from outside thecompany -3 -2 -1 0 +1 +2 +3
Please respond to the statements concerning the results of the growth project.
Statement Fully dis-agree
Do not know
Fully agree
New technological fields were learned from the project -3 -2 -1 0 +1 +2 +3Learning related to technological fields caused changes in the implementation plan of the project -3 -2 -1 0 +1 +2 +3
New patents or licenses were bought in order to implement the growth plan -3 -2 -1 0 +1 +2 +3In the project new technological inventions were made internally, that were patented -3 -2 -1 0 +1 +2 +3

235
Wide participation in the decision-making process In each of the five phases of the decision-making process, how much did each of the hierarchical levels participate in the decision-making process? Please circle the correct answer.
How active was the managing director?
Not involved in any way
Do not know
Very active and important role
Generating growth ideas based on technological competence -3 -2 -1 0 +1 +2 +3 Screening out ideas realistic technologically and from market potential -3 -2 -1 0 +1 +2 +3 Evaluating and comparing the ideas -3 -2 -1 0 +1 +2 +3 Making the final decision to enter the new market -3 -2 -1 0 +1 +2 +3 Choosing people responsible for implementation -3 -2 -1 0 +1 +2 +3
How active was the top management?
Not involved in any way
Do not know
Very active and important role
Generating growth ideas based on technological competence -3 -2 -1 0 +1 +2 +3 Screening out ideas realistic technologically and from market potential -3 -2 -1 0 +1 +2 +3 Evaluating and comparing the ideas -3 -2 -1 0 +1 +2 +3 Making the final decision to enter the new market -3 -2 -1 0 +1 +2 +3 Choosing people responsible for implementation -3 -2 -1 0 +1 +2 +3
How active was the middle management?
Not involved in any way
Do not know
Very active and important role
Generating growth ideas based on technological competence -3 -2 -1 0 +1 +2 +3 Screening out ideas realistic technologically and from market potential -3 -2 -1 0 +1 +2 +3 Evaluating and comparing the ideas -3 -2 -1 0 +1 +2 +3 Making the final decision to enter the new market -3 -2 -1 0 +1 +2 +3 Choosing people responsible for implementation -3 -2 -1 0 +1 +2 +3
How active was the junior manager / group leader / expert level?
Not involved in any way
Do not know
Very active and important role
Generating growth ideas based on technological competence -3 -2 -1 0 +1 +2 +3 Screening out ideas realistic technologically and from market potential -3 -2 -1 0 +1 +2 +3 Evaluating and comparing the ideas -3 -2 -1 0 +1 +2 +3 Making the final decision to enter the new market -3 -2 -1 0 +1 +2 +3 Choosing people responsible for implementation -3 -2 -1 0 +1 +2 +3

236
Wide functional participation and information intensity Please evaluate the following statements concerning each of the five phases of the decision-making process.
Phase of decision-making process: Generating growth ideas based on technological competence
Fully dis-agree
Do not know
Fully agree
There were many meetings in this phase -3 -2 -1 0 +1 +2 +3 Information was actively collected from different sources in this phase -3 -2 -1 0 +1 +2 +3 External sources of information were used systematically in this phase -3 -2 -1 0 +1 +2 +3 People from many functional departments took part in this phase -3 -2 -1 0 +1 +2 +3
Phase of decision-making process: Screening out ideas realistic technologically and from market potential
Fully dis-agree
Do not know
Fully agree
There were many meetings in this phase -3 -2 -1 0 +1 +2 +3 Information was actively collected from different sources in this phase -3 -2 -1 0 +1 +2 +3 External sources of information were used systematically in this phase -3 -2 -1 0 +1 +2 +3 People from many functional departments took part in this phase -3 -2 -1 0 +1 +2 +3
Phase of decision-making process: Evaluating and comparing the ideas
Fully disagree
Do not know
Fully agree
There were many meetings in this phase -3 -2 -1 0 +1 +2 +3 Information was actively collected from different sources in this phase -3 -2 -1 0 +1 +2 +3 External sources of information were used systematically in this phase -3 -2 -1 0 +1 +2 +3 People from many functional departments took part in this phase -3 -2 -1 0 +1 +2 +3
Phase of decision-making process: Making the final decision to enter the new market
Fully dis-agree
Do not know
Fully agree
There were many meetings in this phase -3 -2 -1 0 +1 +2 +3 Information was actively collected from different sources in this phase -3 -2 -1 0 +1 +2 +3 External sources of information were used systematically in this phase -3 -2 -1 0 +1 +2 +3 People from many functional departments took part in this phase -3 -2 -1 0 +1 +2 +3
Phase of decision-making process: Choosing people responsible for implementation
Fully dis-agree
Do not know
Fully agree
There were many meetings in this phase -3 -2 -1 0 +1 +2 +3 Information was actively collected from different sources in this phase -3 -2 -1 0 +1 +2 +3 External sources of information were used systematically in this phase -3 -2 -1 0 +1 +2 +3 People from many functional departments took part in this phase -3 -2 -1 0 +1 +2 +3

237
Existing process, usage of business plan and the financial reporting and analysis
related to the process Please evaluate the financial reporting related to the project based on the following statements.
Statement Fully dis-agree
Do not know
Fully agree
Income statement or balance sheet estimates of the project had an important role -3 -2 -1 0 +1 +2 +3
Detailed cost estimates concerning the project had an important role -3 -2 -1 0 +1 +2 +3 Plan on sources of financing had an important role -3 -2 -1 0 +1 +2 +3 Did exactly predefined guidelines for this kind of a decision-making process exist? Please evaluate on the basis of the following statements.
Statement Fully dis-agree
Do not know
Fully agree
A written guideline existed for this kind of a process -3 -2 -1 0 +1 +2 +3 A set of criteria defining strategically fitting growth projects existed -3 -2 -1 0 +1 +2 +3 There was a certain process for the continuous screening for growth ideas -3 -2 -1 0 +1 +2 +3
In order to approve a decision like this a business plan is always required -3 -2 -1 0 +1 +2 +3
In our company a business plan must always include certain parts -3 -2 -1 0 +1 +2 +3
Conflict How much disagreement caused by the differing objectives of different groups or individuals was there related to the decision-making process? Please estimate on the basis of the following statements.
Statement Fully dis-agree
Do not know
Fully agree
During the process coalitions with different objectives were formed within the company -3 -2 -1 0 +1 +2 +3
The central persons in the process went through many long negotiations -3 -2 -1 0 +1 +2 +3
There was a lot of disagreement regarding the objectives of the decision -3 -2 -1 0 +1 +2 +3
There was a lot of disagreement concerning what would be the correct procedure to follow in the process -3 -2 -1 0 +1 +2 +3
There was a lot of disagreement regarding the correctness of the conclusions -3 -2 -1 0 +1 +2 +3

238
Dependent and control variables What percentage of the whole company's turnover was the project expected to bring in the end of its fifth year of operation (estimate)? _______ % The first year of operation is defined to be the first year that the project had sales. After how many years of operation was the project expected to reach the profitability level (operating profit) that was expected from it (estimate)? After _______ years of operation. Please evaluate the following statements concerning the expectations from the project.
Statement Fully disagree
Do not know
Fully agree
A significant amount of new turnover was expected from the project -3 -2 -1 0 +1 +2 +3 The project was expected to be the most important source of growth for the company in the following years -3 -2 -1 0 +1 +2 +3
The project was expected to create the base for the transition of the whole company to a new market -3 -2 -1 0 +1 +2 +3
New technological fields were expected to be learned from the project -3 -2 -1 0 +1 +2 +3 New contacts were expected to be gained from the project -3 -2 -1 0 +1 +2 +3 It was expected that a certain rising cycle could be exploited through the growth project -3 -2 -1 0 +1 +2 +3
Estimate how large part of your company's turnover has been used for research and development during the last three years (1997-1999)? ________% And how large part of the turnover was used for research and development in the years 1985-1987? ________% To what extent do you agree with the following statements concerning the growth aspirations of your company at the time of starting the growth project?
Statement Fully dis-agree
Do not know
Fully agree
We wanted to grow the company as fast as we could -3 -2 -1 0 +1 +2 +3 We were prepared to sacrifice the profitability of the company for some years if that way we could get the company to grow fast -3 -2 -1 0 +1 +2 +3
We wanted to keep the company's operations on the same level as they were -3 -2 -1 0 +1 +2 +3
Trying to make the company grow fast was pointless -3 -2 -1 0 +1 +2 +3 We wanted to keep the company small -3 -2 -1 0 +1 +2 +3 What was the annual targeted growth rate of your company at the time of starting the growth project? ___________% per year. How large percent of the whole company's turnover did the project bring in the end of the fifth year of operating (estimate)? _______ % What about in the year 1999 (estimate)? _______ % After how many years of operation did the project reach the profitability level (operating profit) that was expected from it (estimate)? After_______ years of operation.

239
Has there been any attempt in your company to estimate the value of the whole company's technology competencies? Please respond to the following statements.
Statement Fully dis-agree
Do not know
Fully agree
In our company we have a commonly known list or description of the most important areas of technological competence -3 -2 -1 0 +1 +2 +3
In our company we have a list or description of all documentable technological assets, such as patents, licenses, etc. -3 -2 -1 0 +1 +2 +3
Documentable technological assets have been grouped into different areas of strength in technological competence -3 -2 -1 0 +1 +2 +3
In our company we have a list or description of "soft" technological assets, such as different persons' areas of specialization -3 -2 -1 0 +1 +2 +3
"Soft" technological assets have been grouped into different areas of strength in technological competence -3 -2 -1 0 +1 +2 +3
In our company we have evaluated the competitive advantage in each area of technological competence -3 -2 -1 0 +1 +2 +3

240
Appendix 4: Dendrogram of the cluster analysis