technology & licensing strategy in a … sabic presentation at mumbai grpc...technology &...
TRANSCRIPT

TECHNOLOGY & LICENSING STRATEGY IN A CHANGING ETHYLENE VALUE CHAIN LANDSCAPE
Global Refining & Petrochemicals CongressMumbai, 25-26 May 2017
Martijn Vogelzang & Guido Crevecoeur

No. 1Global Refining & Petrochemicals Congress, Mumbai, 25 May 2017
TECHNOLOGY & LICENSING STRATEGY IN A CHANGING ETHYLENE VALUE CHAIN LANDSCAPE
Main topics:1. Changes in the ethylene landscape Supply-demand Capacity Net trade
2. SABIC’s strategic response Investments in new capacity
3. SABIC’s Technology & Innovation strategy Process & product technology Licensing of proven technologies
No. 2Global Refining & Petrochemicals Congress, Mumbai, 25 May 2017
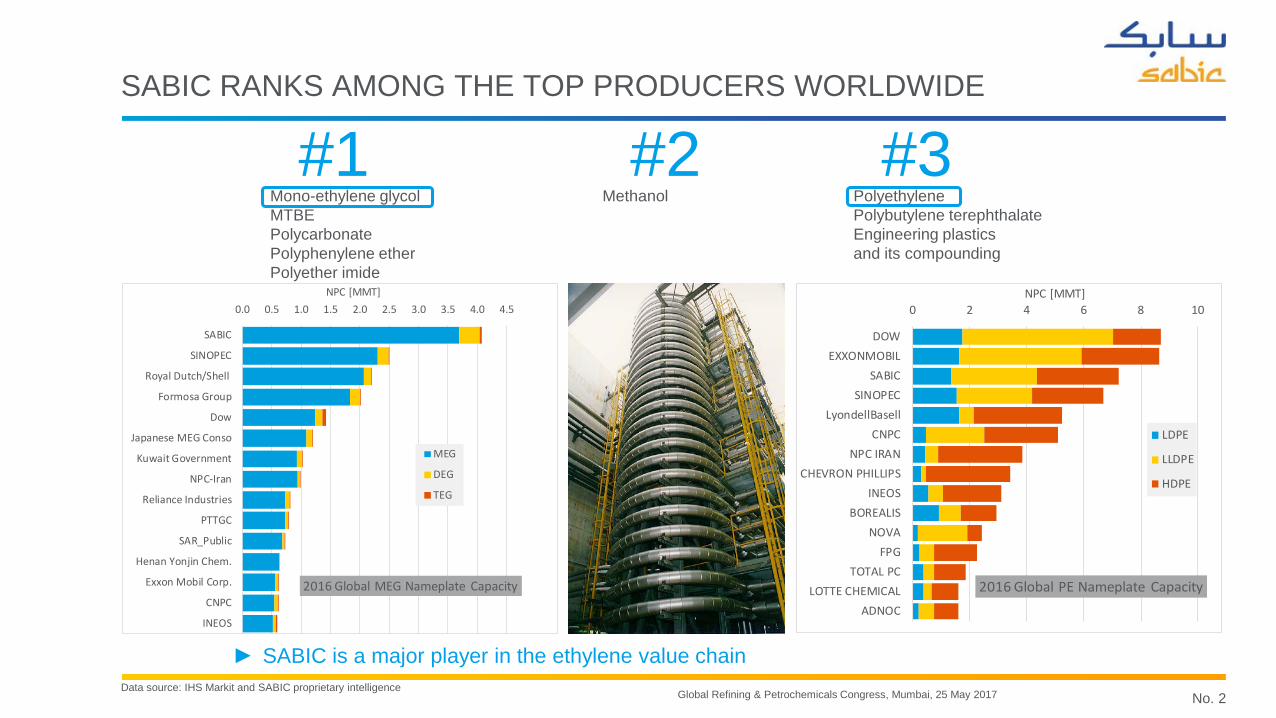
SABIC RANKS AMONG THE TOP PRODUCERS WORLDWIDE
#1 #2 #3Mono-ethylene glycolMTBEPolycarbonatePolyphenylene etherPolyether imide
Methanol PolyethylenePolybutylene terephthalateEngineering plastics and its compounding
Data source: IHS Markit and SABIC proprietary intelligence
► SABIC is a major player in the ethylene value chain
0 2 4 6 8 10
DOWEXXONMOBIL
SABICSINOPEC
LyondellBasellCNPC
NPC IRANCHEVRON PHILLIPS
INEOSBOREALIS
NOVAFPG
TOTAL PCLOTTE CHEMICAL
ADNOC
NPC [MMT]
2016 Global PE Nameplate Capacity
LDPE
LLDPE
HDPE
0.0 0.5 1.0 1.5 2.0 2.5 3.0 3.5 4.0 4.5
SABIC
SINOPEC
Royal Dutch/Shell
Formosa Group
Dow
Japanese MEG Conso
Kuwait Government
NPC-Iran
Reliance Industries
PTTGC
SAR_Public
Henan Yonjin Chem.
Exxon Mobil Corp.
CNPC
INEOS
NPC [MMT]
2016 Global MEG Nameplate Capacity
MEG
DEG
TEG

No. 3Global Refining & Petrochemicals Congress, Mumbai, 25 May 2017
CHANGED ETHYLENE LANDSCAPE
Ethane is the strongest growing feedstock:► Ethane growing strongly in NA (shale gas) and in ME► Naphtha shrinking in NA and EUR but still growing in Asia► MTO (methanol-to-olefin) and CTO (coal-to-olefin) growing in
China, but remain small compared to ethane and naphtha
-
5
10
15
20
25
30
35
40
45
50
2010
2016
2022
2010
2016
2022
2010
2016
2022
2010
2016
2022
2010
2016
2022
2010
2016
2022
2010
2016
2022
2010
2016
2022
2010
2016
2022
NA SA EUR CIS ME AFR INS NEA SEA
Ethy
lene
Pro
duct
ion
[MM
T]Ethylene Production by Source & Region
Naphtha Ethane Propane Butane Gas Oil MTO CTO Other MTP
Data source: IHS Markit
Region Period Naphtha Ethane Propane Butane Gas Oil MTO CTONA 2010-->16 -16% 4% -1% 14% -21%
2016-->22 -7% 7% 1% -6% 0%SA 2010-->16 -2% -1% 7% -100%
2016-->22 2% 2% -6%EUR 2010-->16 -3% 2% 13% 8% -2%
2016-->22 -1% 6% 0% -1% -3%CIS 2010-->16 0% 12% 13% 12% -2%
2016-->22 6% 7% 29% 24% 11%ME 2010-->16 6% 6% 4% 19%
2016-->22 0% 3% 1% 2% -100%AFR 2010-->16 -100% -4% 4% -4%
2016-->22 9% 5% -4%INS 2010-->16 8% 10% 12%
2016-->22 6% 9% 5% 18%NEA 2010-->16 1% 21% 4% 6% 76%
2016-->22 1% 7% 3% 2% 12% 25%SEA 2010-->16 4% 6% 2% 4% 13%
2016-->22 7% -3% 9% 10% 11%
Compounded Annual Growth Rate (CAGR)
No. 4Global Refining & Petrochemicals Congress, Mumbai, 25 May 2017
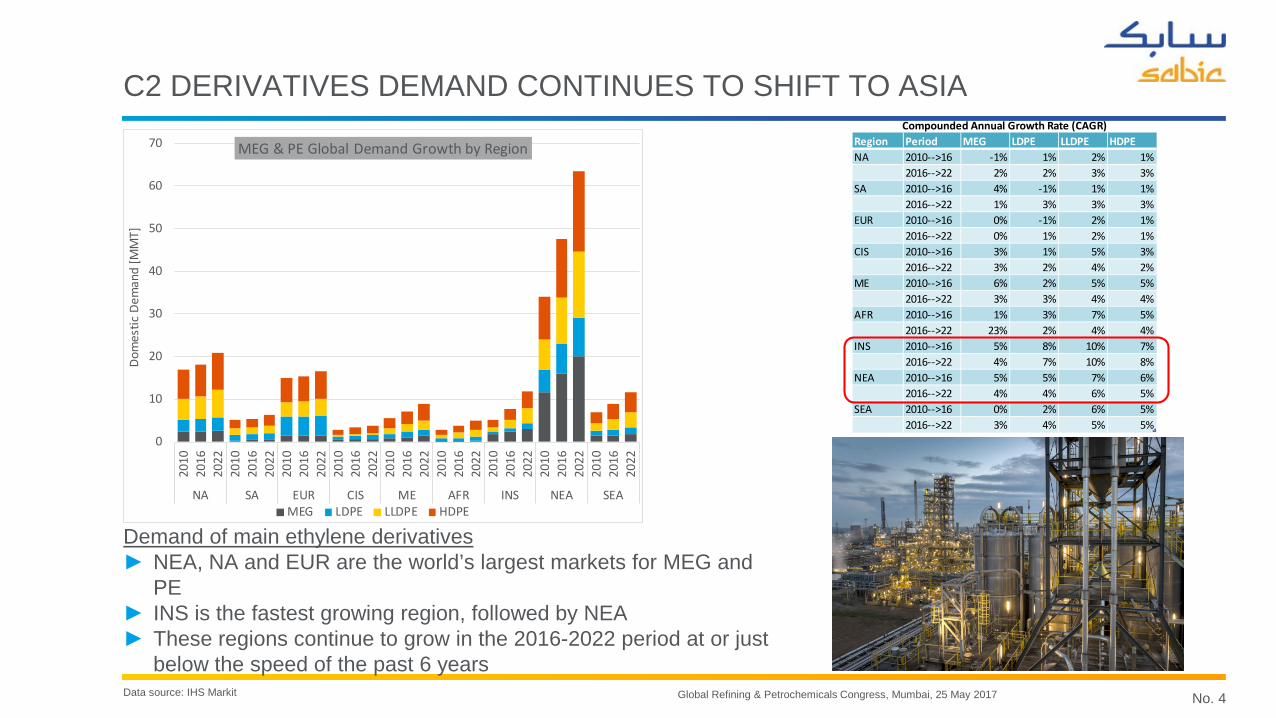
C2 DERIVATIVES DEMAND CONTINUES TO SHIFT TO ASIA
Demand of main ethylene derivatives► NEA, NA and EUR are the world’s largest markets for MEG and
PE► INS is the fastest growing region, followed by NEA► These regions continue to grow in the 2016-2022 period at or just
below the speed of the past 6 yearsData source: IHS Markit
0
10
20
30
40
50
60
70
2010
2016
2022
2010
2016
2022
2010
2016
2022
2010
2016
2022
2010
2016
2022
2010
2016
2022
2010
2016
2022
2010
2016
2022
2010
2016
2022
NA SA EUR CIS ME AFR INS NEA SEA
Dom
estic
Dem
and
[MM
T]MEG & PE Global Demand Growth by Region
MEG LDPE LLDPE HDPE
Region Period MEG LDPE LLDPE HDPENA 2010-->16 -1% 1% 2% 1%
2016-->22 2% 2% 3% 3%SA 2010-->16 4% -1% 1% 1%
2016-->22 1% 3% 3% 3%EUR 2010-->16 0% -1% 2% 1%
2016-->22 0% 1% 2% 1%CIS 2010-->16 3% 1% 5% 3%
2016-->22 3% 2% 4% 2%ME 2010-->16 6% 2% 5% 5%
2016-->22 3% 3% 4% 4%AFR 2010-->16 1% 3% 7% 5%
2016-->22 23% 2% 4% 4%INS 2010-->16 5% 8% 10% 7%
2016-->22 4% 7% 10% 8%NEA 2010-->16 5% 5% 7% 6%
2016-->22 4% 4% 6% 5%SEA 2010-->16 0% 2% 6% 5%
2016-->22 3% 4% 5% 5%
Compounded Annual Growth Rate (CAGR)
No. 5Global Refining & Petrochemicals Congress, Mumbai, 25 May 2017
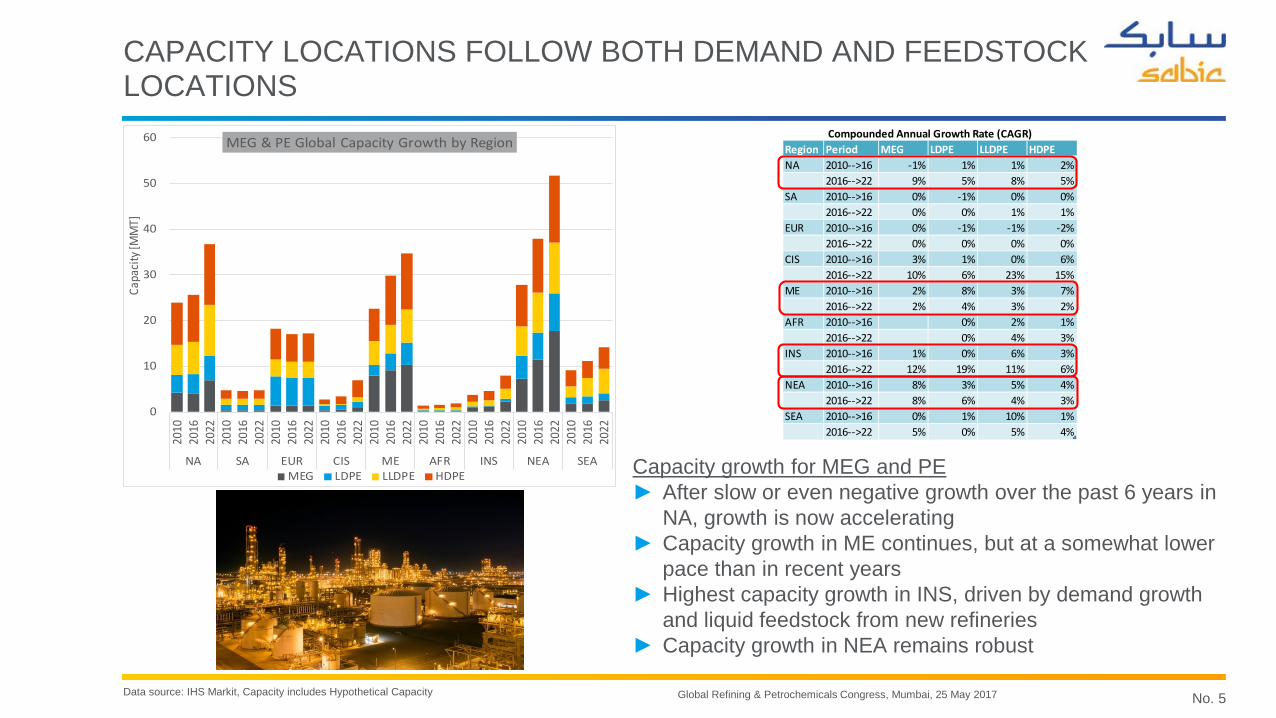
CAPACITY LOCATIONS FOLLOW BOTH DEMAND AND FEEDSTOCK LOCATIONS
Capacity growth for MEG and PE► After slow or even negative growth over the past 6 years in
NA, growth is now accelerating► Capacity growth in ME continues, but at a somewhat lower
pace than in recent years► Highest capacity growth in INS, driven by demand growth
and liquid feedstock from new refineries► Capacity growth in NEA remains robust
Data source: IHS Markit, Capacity includes Hypothetical Capacity
0
10
20
30
40
50
60
2010
2016
2022
2010
2016
2022
2010
2016
2022
2010
2016
2022
2010
2016
2022
2010
2016
2022
2010
2016
2022
2010
2016
2022
2010
2016
2022
NA SA EUR CIS ME AFR INS NEA SEA
Capa
city
[MM
T]MEG & PE Global Capacity Growth by Region
MEG LDPE LLDPE HDPE
Region Period MEG LDPE LLDPE HDPENA 2010-->16 -1% 1% 1% 2%
2016-->22 9% 5% 8% 5%SA 2010-->16 0% -1% 0% 0%
2016-->22 0% 0% 1% 1%EUR 2010-->16 0% -1% -1% -2%
2016-->22 0% 0% 0% 0%CIS 2010-->16 3% 1% 0% 6%
2016-->22 10% 6% 23% 15%ME 2010-->16 2% 8% 3% 7%
2016-->22 2% 4% 3% 2%AFR 2010-->16 0% 2% 1%
2016-->22 0% 4% 3%INS 2010-->16 1% 0% 6% 3%
2016-->22 12% 19% 11% 6%NEA 2010-->16 8% 3% 5% 4%
2016-->22 8% 6% 4% 3%SEA 2010-->16 0% 1% 10% 1%
2016-->22 5% 0% 5% 4%
Compounded Annual Growth Rate (CAGR)
No. 6Global Refining & Petrochemicals Congress, Mumbai, 25 May 2017
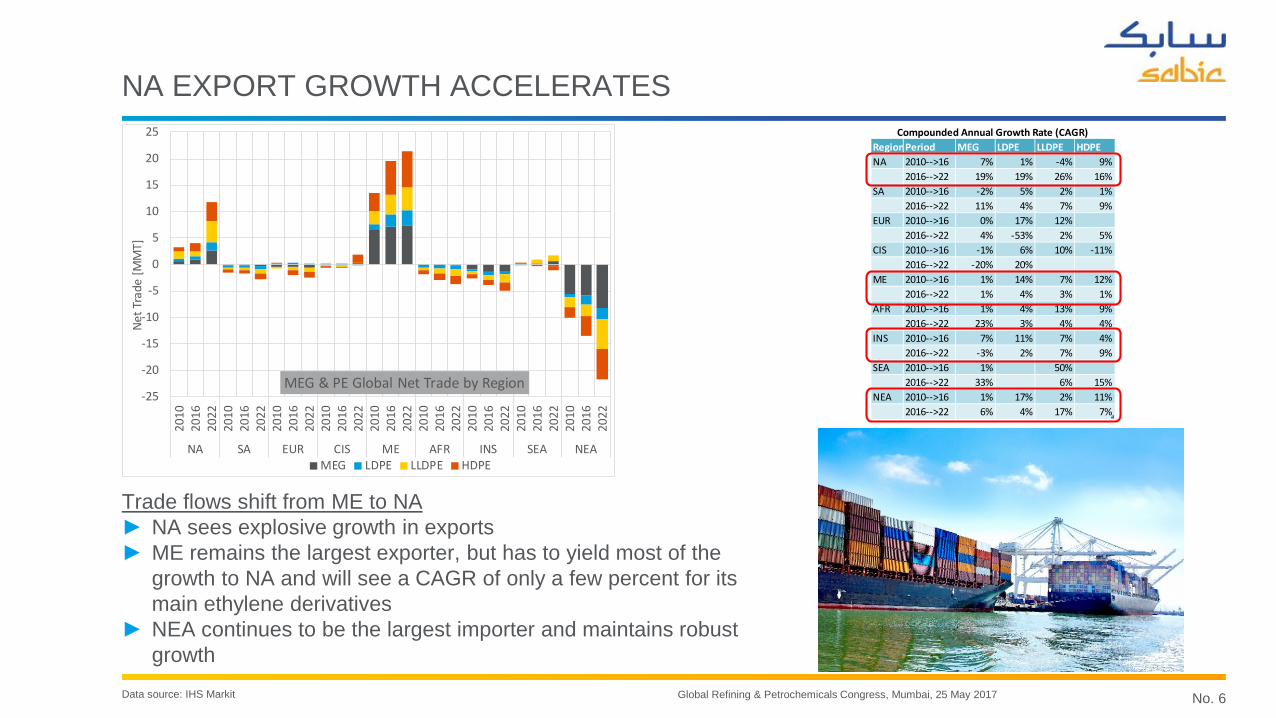
NA EXPORT GROWTH ACCELERATES
Trade flows shift from ME to NA► NA sees explosive growth in exports► ME remains the largest exporter, but has to yield most of the
growth to NA and will see a CAGR of only a few percent for its main ethylene derivatives
► NEA continues to be the largest importer and maintains robust growth
Data source: IHS Markit
-25
-20
-15
-10
-5
0
5
10
15
20
25
2010
2016
2022
2010
2016
2022
2010
2016
2022
2010
2016
2022
2010
2016
2022
2010
2016
2022
2010
2016
2022
2010
2016
2022
2010
2016
2022
NA SA EUR CIS ME AFR INS SEA NEA
Net T
rade
[MM
T]
MEG & PE Global Net Trade by Region
MEG LDPE LLDPE HDPE
RegionPeriod MEG LDPE LLDPE HDPENA 2010-->16 7% 1% -4% 9%
2016-->22 19% 19% 26% 16%SA 2010-->16 -2% 5% 2% 1%
2016-->22 11% 4% 7% 9%EUR 2010-->16 0% 17% 12%
2016-->22 4% -53% 2% 5%CIS 2010-->16 -1% 6% 10% -11%
2016-->22 -20% 20%ME 2010-->16 1% 14% 7% 12%
2016-->22 1% 4% 3% 1%AFR 2010-->16 1% 4% 13% 9%
2016-->22 23% 3% 4% 4%INS 2010-->16 7% 11% 7% 4%
2016-->22 -3% 2% 7% 9%SEA 2010-->16 1% 50%
2016-->22 33% 6% 15%NEA 2010-->16 1% 17% 2% 11%
2016-->22 6% 4% 17% 7%
Compounded Annual Growth Rate (CAGR)
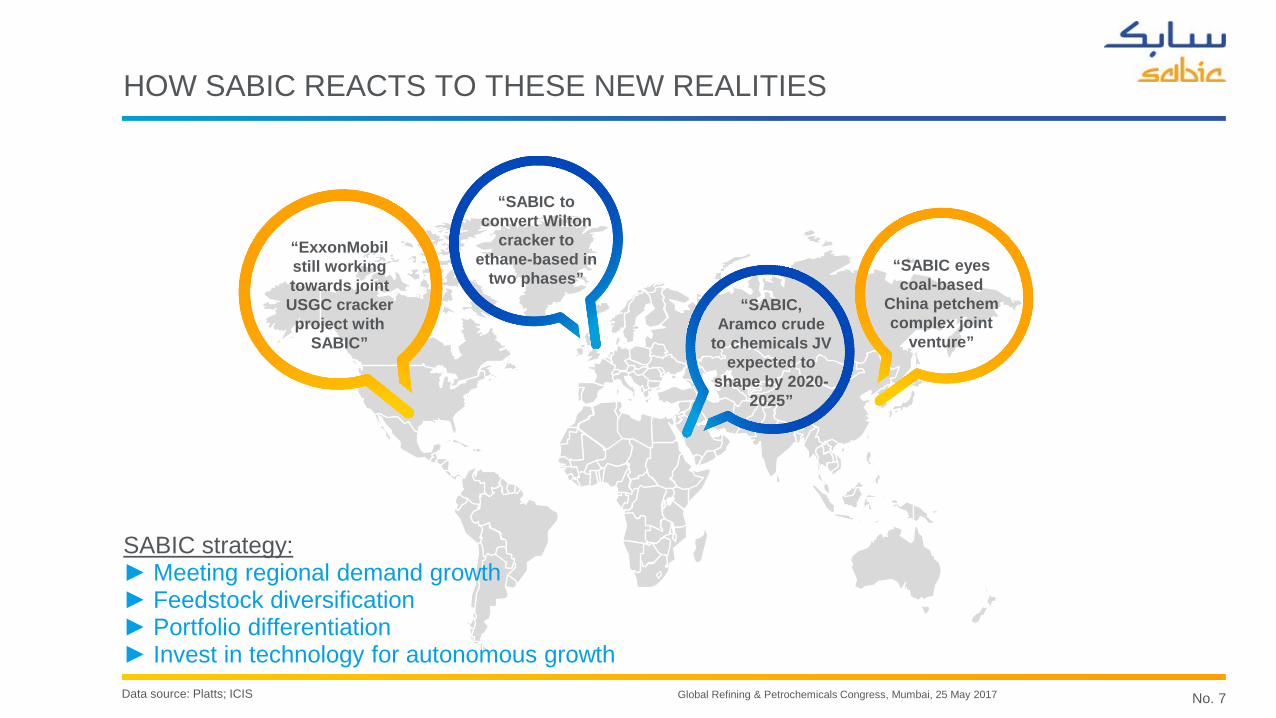
No. 7Global Refining & Petrochemicals Congress, Mumbai, 25 May 2017Data source: Platts; ICIS
“SABIC eyes coal-based
China petchemcomplex joint
venture”
“ExxonMobil still working towards joint USGC cracker project with
SABIC”
“SABIC to convert Wilton
cracker to ethane-based in
two phases” “SABIC,
Aramco crude to chemicals JV
expected to shape by 2020-
2025”
HOW SABIC REACTS TO THESE NEW REALITIES
SABIC strategy:► Meeting regional demand growth► Feedstock diversification► Portfolio differentiation► Invest in technology for autonomous growth
No. 8Global Refining & Petrochemicals Congress, Mumbai, 25 May 2017
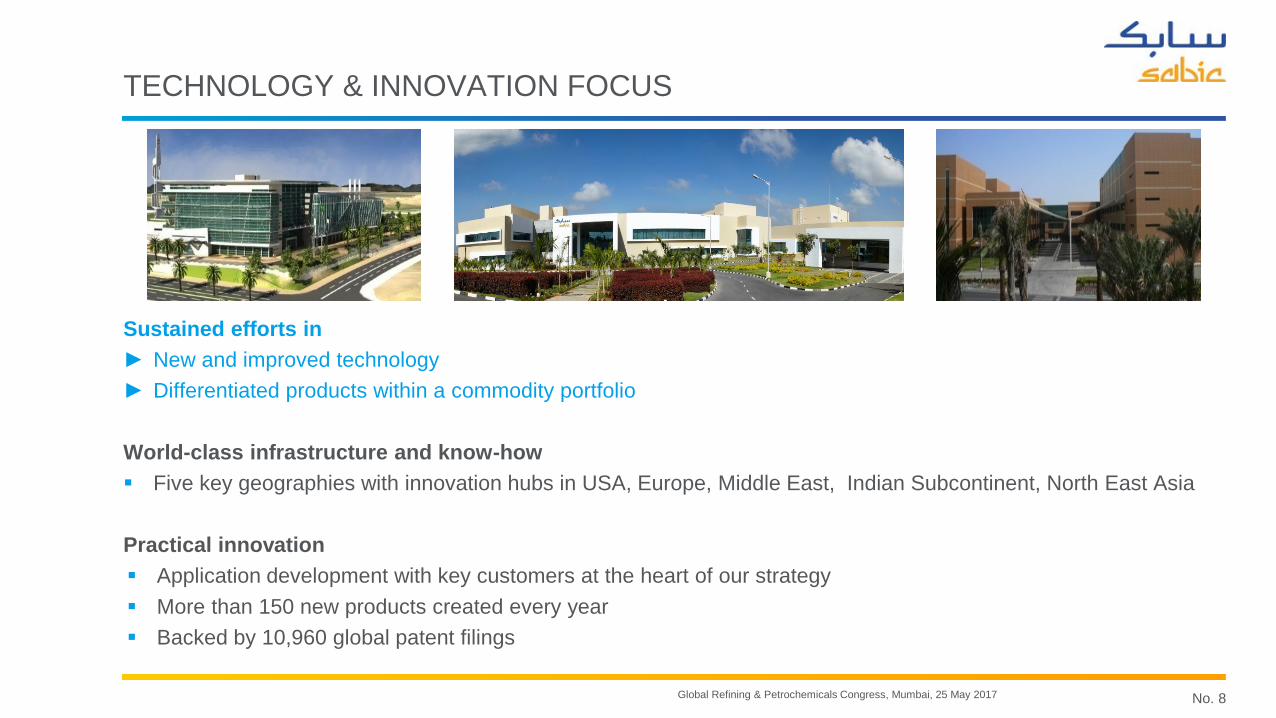
TECHNOLOGY & INNOVATION FOCUS
Sustained efforts in► New and improved technology► Differentiated products within a commodity portfolio
World-class infrastructure and know-how Five key geographies with innovation hubs in USA, Europe, Middle East, Indian Subcontinent, North East Asia
Practical innovation Application development with key customers at the heart of our strategy More than 150 new products created every year Backed by 10,960 global patent filings
No. 9Global Refining & Petrochemicals Congress, Mumbai, 25 May 2017
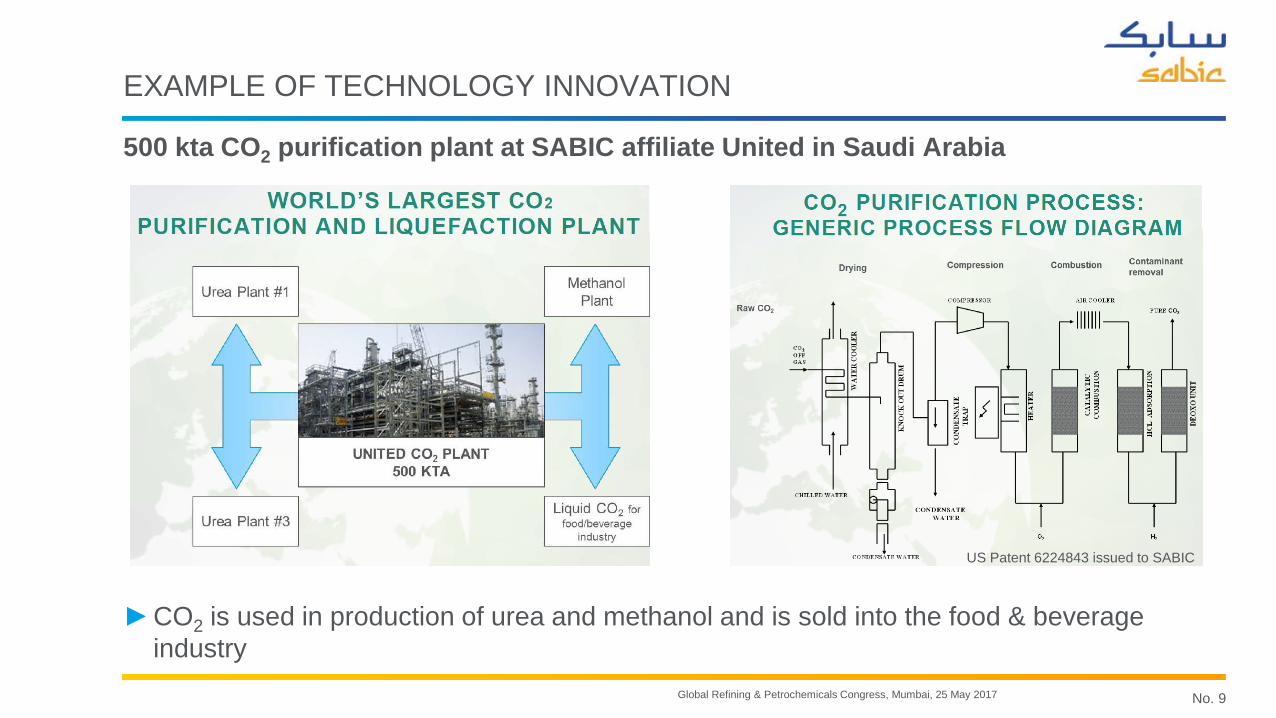
EXAMPLE OF TECHNOLOGY INNOVATION
►CO2 is used in production of urea and methanol and is sold into the food & beverage industry
500 kta CO2 purification plant at SABIC affiliate United in Saudi Arabia
US Patent 6224843 issued to SABIC
No. 10Global Refining & Petrochemicals Congress, Mumbai, 25 May 2017
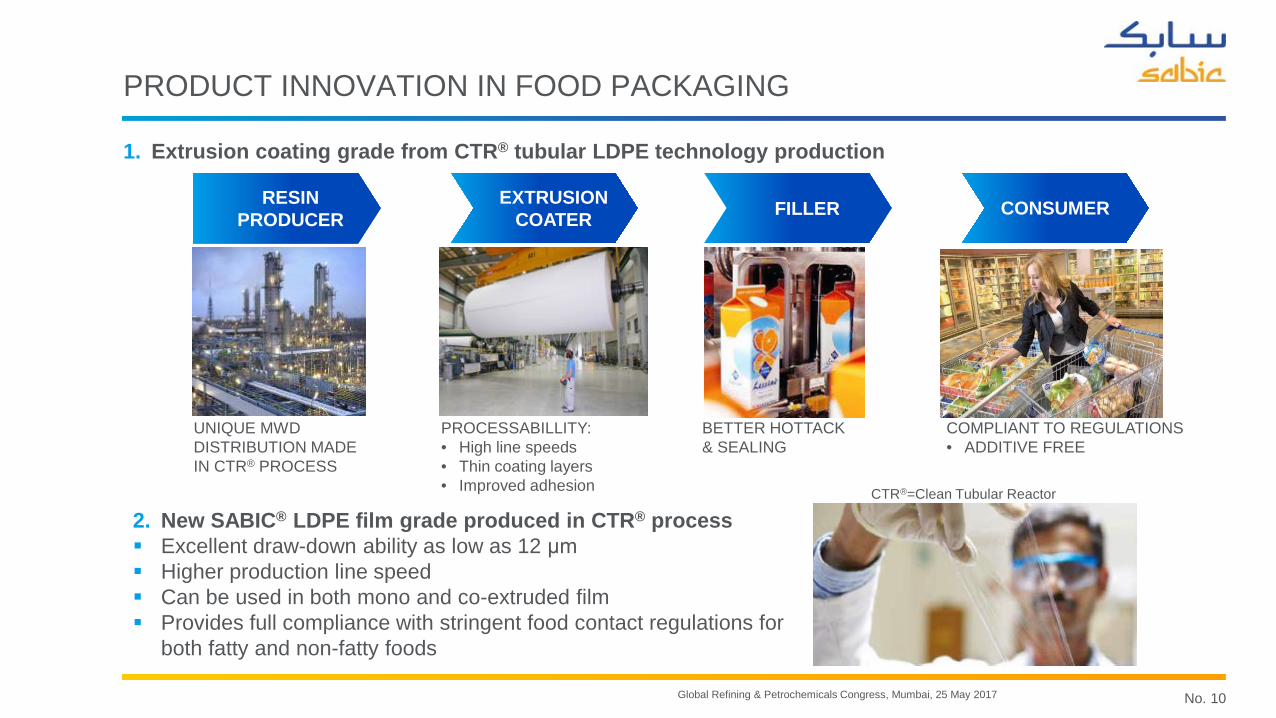
PRODUCT INNOVATION IN FOOD PACKAGING
2. New SABIC® LDPE film grade produced in CTR® process Excellent draw-down ability as low as 12 μm Higher production line speed Can be used in both mono and co-extruded film Provides full compliance with stringent food contact regulations for
both fatty and non-fatty foods
RESIN PRODUCER
EXTRUSIONCOATER FILLER CONSUMER
1. Extrusion coating grade from CTR® tubular LDPE technology production
UNIQUE MWD DISTRIBUTION MADEIN CTR® PROCESS
PROCESSABILLITY:• High line speeds• Thin coating layers• Improved adhesion
BETTER HOTTACK& SEALING
COMPLIANT TO REGULATIONS • ADDITIVE FREE
CTR®=Clean Tubular Reactor

No. 11Global Refining & Petrochemicals Congress, Mumbai, 25 May 2017
PROCESS & PRODUCT TECHNOLOGY STRATEGY IS KEY
SABIC is revisiting its technology strategy:
Main Drivers:1. Maximise use of proprietary technology in new projects, leveraging:
CAPEX/OPEX improvements for chemicals Enhanced product development on selected polymer technology platforms
2. Monetise SABIC’s proven technology portfolio, through: Active licensing of SABIC technology to 3rd parties, combined with: R&D efforts and Technical Service Sharing of Operational Excellence (where applicable) Catalyst sales
3. Explore opportunities to license non-proven technologies and patents
From traditionally licensing technologies from others SABIC is now moving towards proprietary developments and licensing technologies out to 3rd parties

No. 12Global Refining & Petrochemicals Congress, Mumbai, 25 May 2017
COMPREHENSIVE PORTFOLIO OF PROVEN TECHNOLOGIES
Jointly owned Others
Styrene
EO/EG
PET
PC
BPA
EPS
Phenol
CV
PTA
Cumene
CTR LDPE
Butadiene
Acetic Acid
HRG
Ethylene cracker
LAO 1-Butene1-Hexene
C8-C20
MMA
Ethane
Benzene
UHMWPE
LDPE
UHMWPE
LLDPE/HDPE
STARTEC Styrene
DMC DPCMethane Methanol
CO
O2
BPA
Paraxylene
Chlorine PhosgeneChlorine
Naphtha crackerNaphtha
Ethylene Production
Acetone
HDPE
LLDPE
PC
SAN
PBLABSAcrylonitrile
LLDPE
PS
ABS
1-butene
HDPE
LLDPE
Butane
PC
NaOH
Propylene
Vinyl AcetateAcetic Anhydride
PET Tape line
Technology owners
PET Tape
AA
EO/EG
SABICPolymer
PP PPCO2
SABICChemical

No. 13Global Refining & Petrochemicals Congress, Mumbai, 25 May 2017
A WIDE RANGE OF TECHNOLOGIES FOR 3rd PARTY LICENSING
Butadiene α-Sablin LAO1 EO/EG2
Butene-1 CO2 BPA
Phenol Acetic Acid
State of art technologies supported withworld class engineering and licensing partners
Polymers TechnologiesChemicals Technologies
CTR® LDPE LLDPE/HDPE UHMWPE*
PP ABS-Emulsion ABS-Mass
PC*
* Only captive licensing1 Technology jointly owned with Linde2 Marketed by Scientific Design, a SABIC/Clariant JV
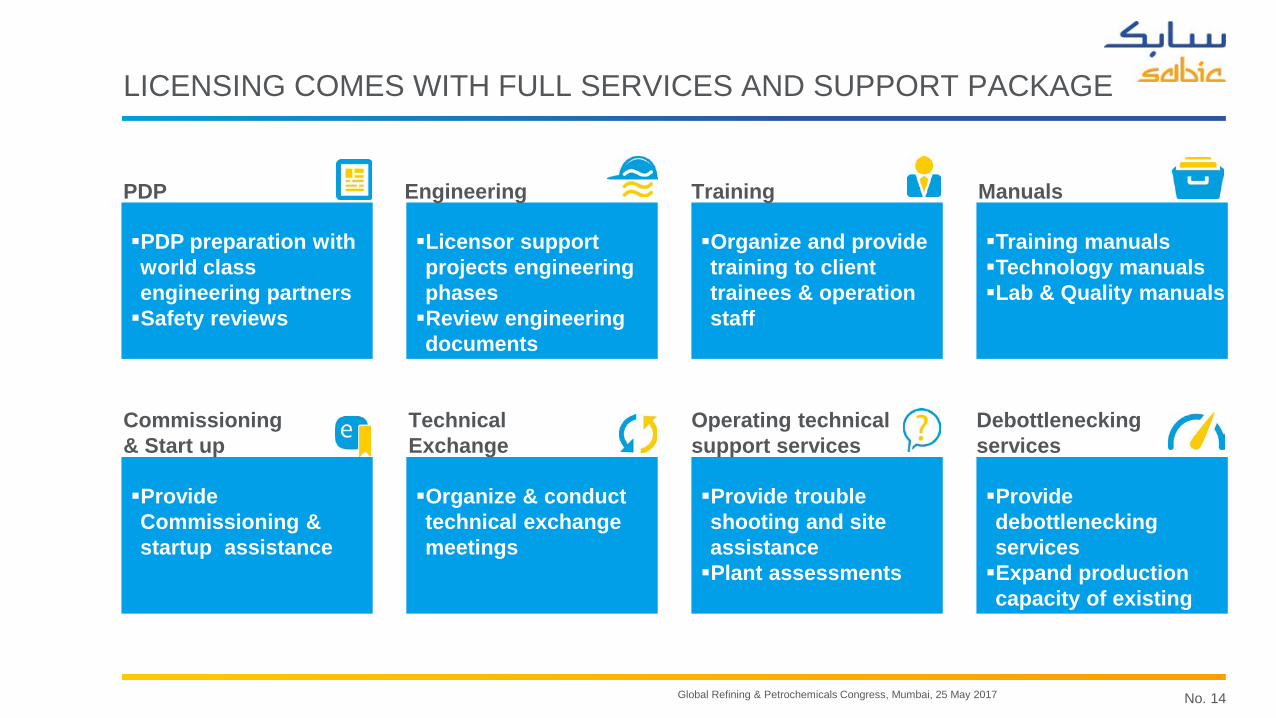
No. 14Global Refining & Petrochemicals Congress, Mumbai, 25 May 2017
PDP preparation with world class engineering partnersSafety reviews
Licensor support projects engineering phasesReview engineering documents
Organize and provide training to client trainees & operation staff
Training manualsTechnology manualsLab & Quality manuals
Provide Commissioning & startup assistance
Organize & conduct technical exchange meetings
Provide trouble shooting and site assistance Plant assessments
Provide debottlenecking servicesExpand production capacity of existing facilities
PDP Engineering Training Manuals
Commissioning & Start up
Technical Exchange
Operating technical support services
Debottleneckingservices
LICENSING COMES WITH FULL SERVICES AND SUPPORT PACKAGE

No. 15Global Refining & Petrochemicals Congress, Mumbai, 25 May 2017
SUMMARY
►Significant changes in ethylene value chain: demand, supply and trade flows
►In response, SABIC is globalising its asset footprint and investing in alternative feedstock for ethylene
►Increased focus on developing proprietary technologies
►Active marketing of SABIC’s proven technologies
Contact:Martijn VogelzangDirector [email protected]+31 6 3192 9952
Guido CrevecoeurLicensing Marketing [email protected]+31 6 4691 0261
No. 16Global Refining & Petrochemicals Congress, Mumbai, 25 May 2017

No. 17Global Refining & Petrochemicals Congress, Mumbai, 25 May 2017
DISCLAIMER
DISCLAIMER: THE MATERIALS, PRODUCTS AND SERVICES OF SAUDI BASIC INDUSTRIES CORPORATION (SABIC) OR ITS SUBSIDIARIES OR AFFILIATES (“SELLER”) ARE SOLD SUBJECT TO SELLER’S STANDARD CONDITIONS OF SALE, WHICH ARE AVAILABLE UPON REQUEST. INFORMATION AND RECOMMENDATIONS CONTAINED IN THIS DOCUMENT ARE GIVEN IN GOOD FAITH. HOWEVER, SELLER MAKES NO EXPRESS OR IMPLIED REPRESENTATION, WARRANTY OR GUARANTEE (i) THAT ANY RESULTS DESCRIBED IN THIS DOCUMENT WILL BE OBTAINED UNDER END-USE CONDITIONS, OR (ii) AS TO THE EFFECTIVENESS OR SAFETY OF ANY DESIGN OR APPLICATION INCORPORATING SELLER’S MATERIALS, PRODUCTS, SERVICES OR RECOMMENDATIONS. UNLESS OTHERWISE PROVIDED IN SELLER’S STANDARD CONDITIONS OF SALE, SELLER SHALL NOT BE RESPONSIBLE FOR ANY LOSS RESULTING FROM ANY USE OF ITS MATERIALS, PRODUCTS, SERVICES OR RECOMMENDATIONS DESCRIBED IN THIS DOCUMENT. Each user is responsible for making its own determination as to the suitability of Seller’s materials, products, services or recommendations for the user’s particular use through appropriate end-use and other testing and analysis. Nothing in any document or oral statement shall be deemed to alter or waive any provision of Seller’s Standard Conditions of Sale or this Disclaimer, unless it is specifically agreed to in a writing signed by Seller. Statements by Seller concerning a possible use of any material, product, service or design do not, are not intended to, and should not be construed to grant any license under any patent or other intellectual property right of Seller or as a recommendation for the use of any material, product, service or design in a manner that infringes any patent or other intellectual property right.
SABIC and brands marked with ™ are trademarks of SABIC or its subsidiaries or affiliates.© 2017 Saudi Basic Industries Corporation (SABIC). All Rights Reserved.
† Any brands, products or services of other companies referenced in this document are the trademarks, service marks and/or trade names of their respective holders.