technology services & cloud...
TRANSCRIPT
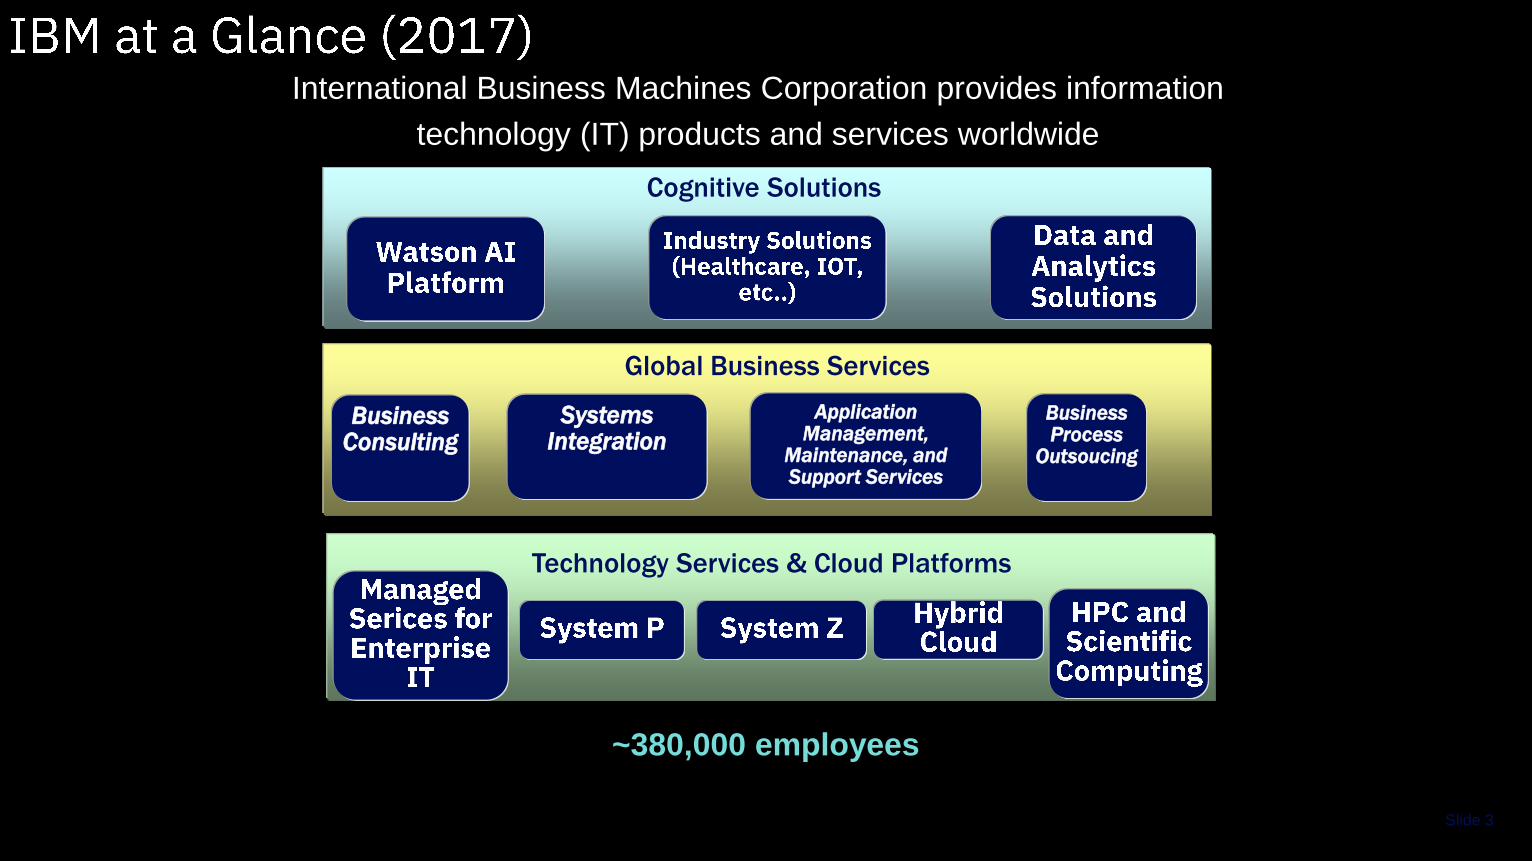
Slide 3
Technology Services & Cloud Platforms
Global Business Services
Business Consulting
Systems Integration
Business Process
Outsoucing
Application Management,
Maintenance, and Support Services
Cognitive Solutions
International Business Machines Corporation provides information
technology (IT) products and services worldwide
~380,000 employees

Defining andoptimizing blockchain
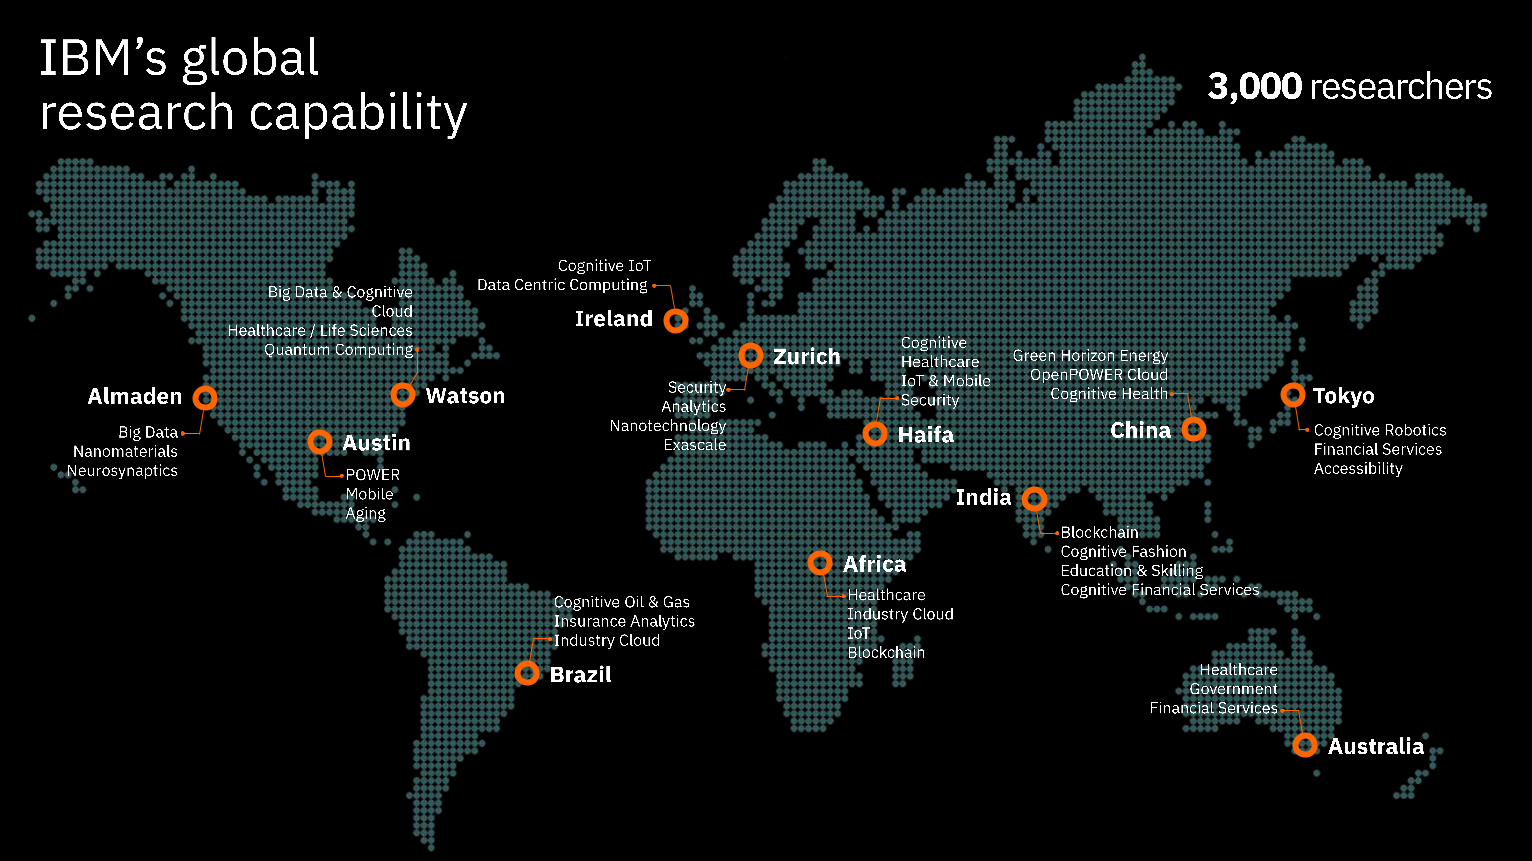
Transforming industries through science and AI
Developing core AIReimagining computing

7
Over 40 years of significant contributions to the field of mathematical sciences
Debt/Tax Collection Optimization
Passenger-Based Airline No-show Prediction
Customer Targeting and Sales Force Productivity
Revenue Forecasting
Traffic Prediction
Tool
Intelligent
Inventory
Management for
Retail
Production Planning
and Operations
Scheduling
Business Services Modeling and Simulation
Workforce Capacity Planning
Air Mail Optimizer
Demand
Conditioning
Pharmaceutical
Supply Chain
Risk
Integer
Programming
Fast Matrix
Multiplication
Fast Fourier TransformParallel
Computing
Fractals
Foundations of
Complexity
Combinatorial
Matrix Theory
Complexity of Reals
Lattice Based CryptographyAdversarial
Queueing
Algebraic Complexity
Over 100 top scientists solving the most challenging problems for IBM and its customers
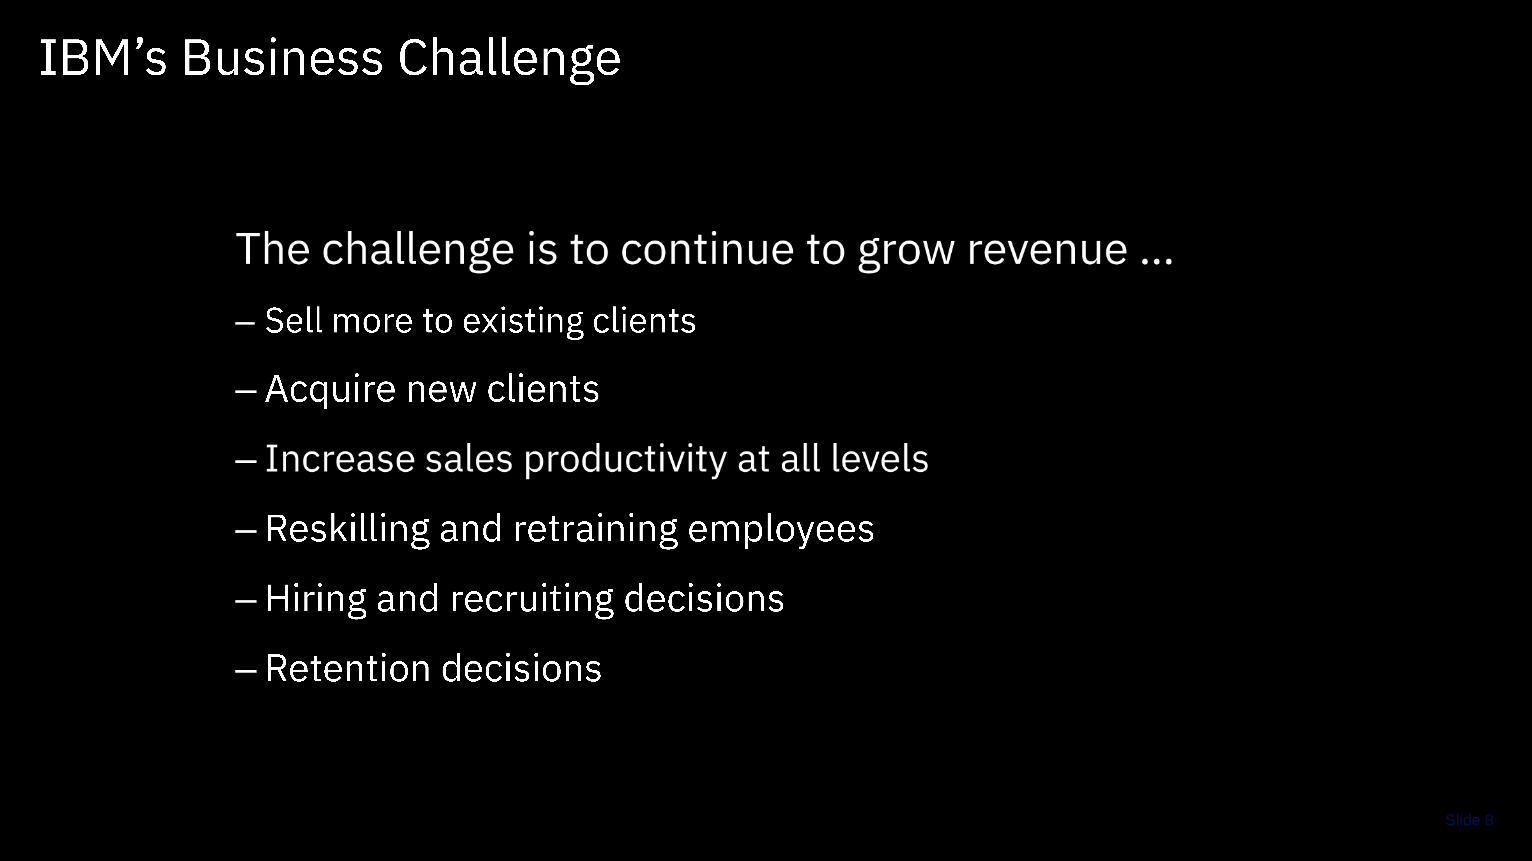
Slide 8
–
–
–
–
–
–

9
Workforce management transformation at IBM has been in place for over a decade.
Expertise Taxonomy
View of Supply
“Bills of Materials”
View of Demand
Optimizing Workforce Decisions
Job families, Job roles, Skill sets, skills…
PDTool, Professional Marketplace, CV Wizard…
Staffing templates
Demand Capture, PMP, Siebel, …
Demand Forecasting, Capacity Planning, Workforce & Talent Management, People/Job matching, Scheduling

10
At Research, cross-lab collaborative efforts in workforce management research
Active player in the internal IBM workforce transformation initiatives, projects and tooling
Several years of work in developing and internally deploying workforce analytics, solutions and tools…
Pioneering research in developing a number of unique methodologies
Machine Learning, Statistical
Sciences, and Mathematical
Optimization Under Uncertainty
Collaborative technologies
Software engineering
11
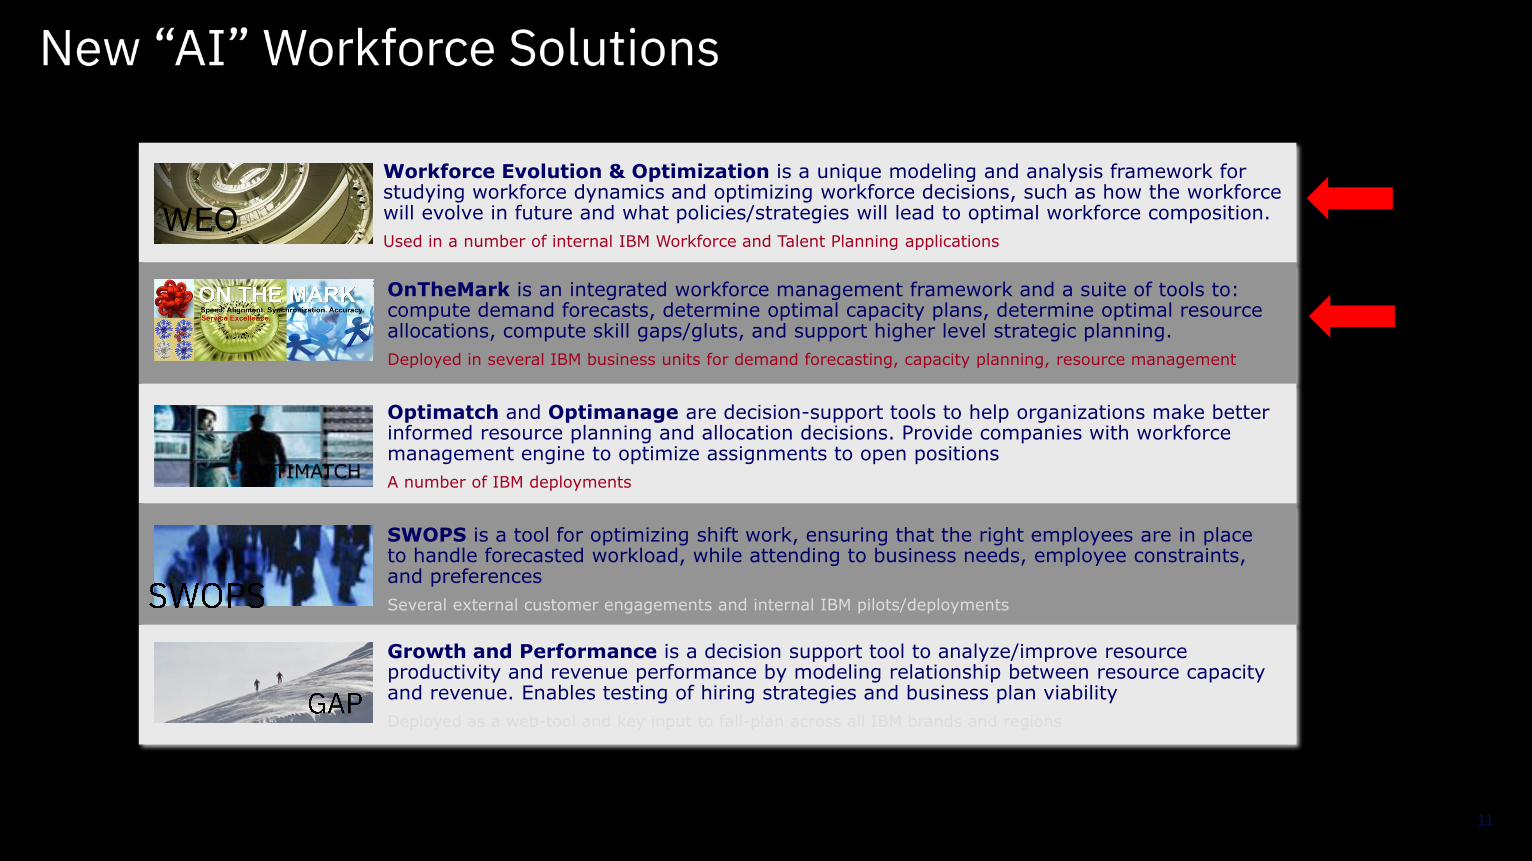
Workforce Evolution & Optimization is a unique modeling and analysis framework for studying workforce dynamics and optimizing workforce decisions, such as how the workforce will evolve in future and what policies/strategies will lead to optimal workforce composition.
Used in a number of internal IBM Workforce and Talent Planning applications
Optimatch and Optimanage are decision-support tools to help organizations make better informed resource planning and allocation decisions. Provide companies with workforce management engine to optimize assignments to open positions
A number of IBM deploymentsOPTIMATCH
WEO
SWOPS is a tool for optimizing shift work, ensuring that the right employees are in place to handle forecasted workload, while attending to business needs, employee constraints, and preferences
Several external customer engagements and internal IBM pilots/deployments
OnTheMark is an integrated workforce management framework and a suite of tools to: compute demand forecasts, determine optimal capacity plans, determine optimal resource allocations, compute skill gaps/gluts, and support higher level strategic planning.
Deployed in several IBM business units for demand forecasting, capacity planning, resource management
Growth and Performance is a decision support tool to analyze/improve resource productivity and revenue performance by modeling relationship between resource capacity and revenue. Enables testing of hiring strategies and business plan viability
Deployed as a web-tool and key input to fall-plan across all IBM brands and regions
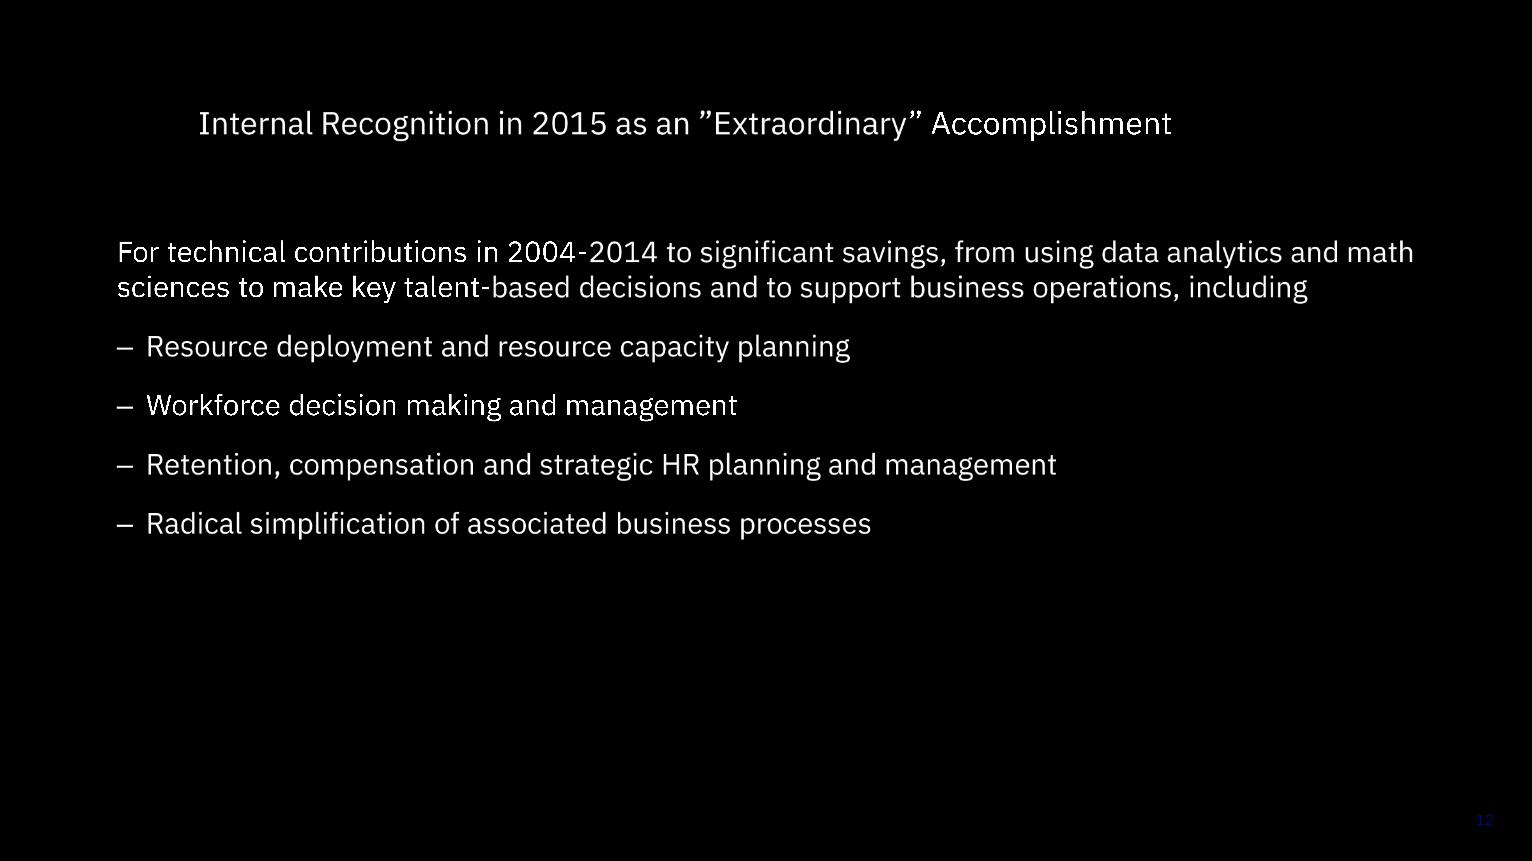
–
–
–
–
12


•
•
•
•
•
•
•
•
•
•
•
•
•
•
•
•
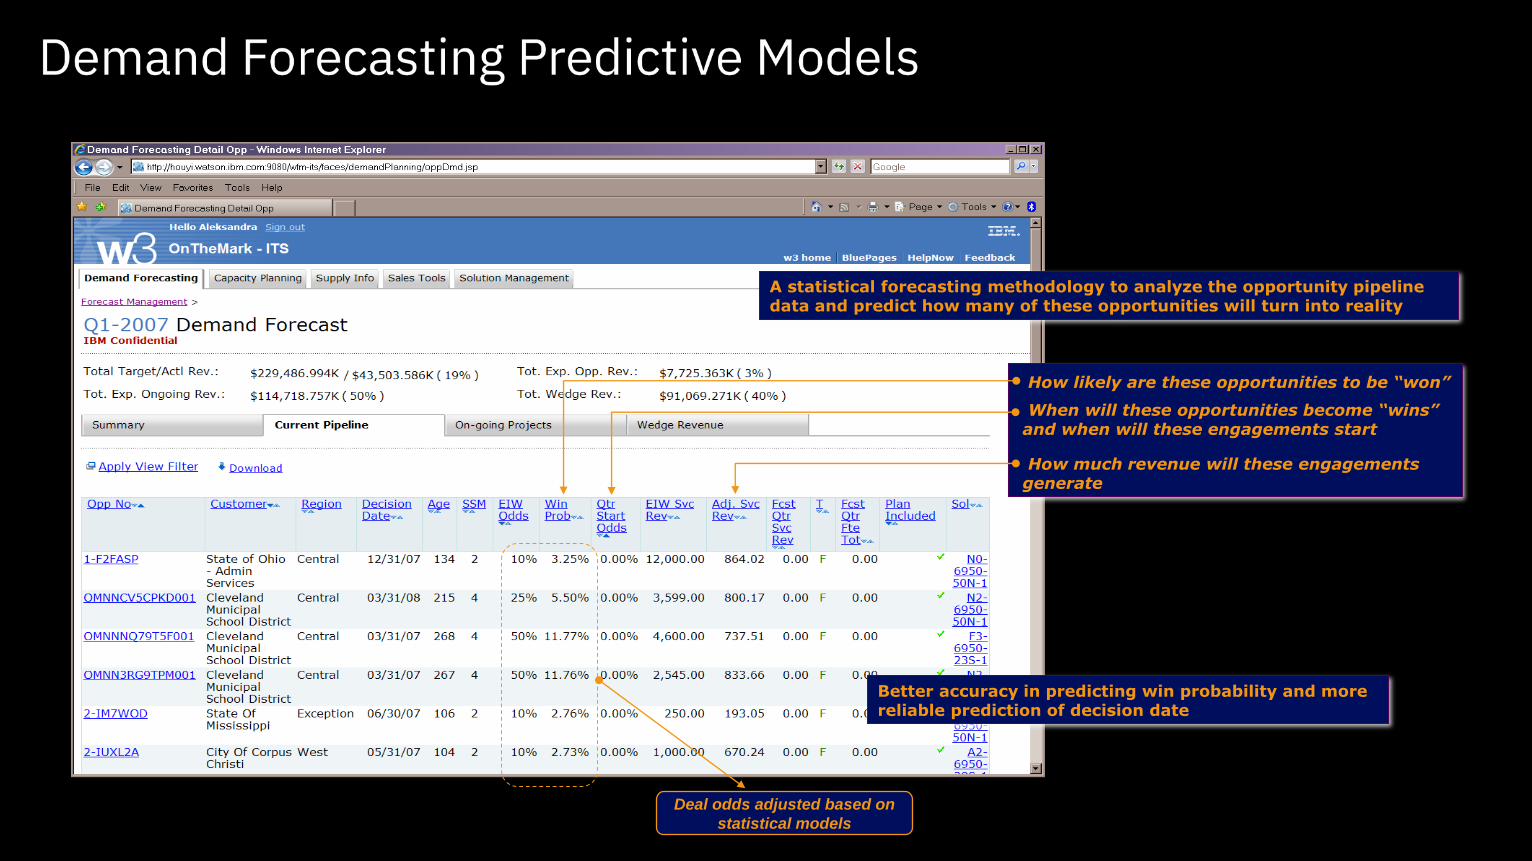
Deal odds adjusted based on
statistical models
A statistical forecasting methodology to analyze the opportunity pipeline data and predict how many of these opportunities will turn into reality
How likely are these opportunities to be “won”
When will these opportunities become “wins” and when will these engagements start
How much revenue will these engagements generate
Better accuracy in predicting win probability and more reliable prediction of decision date
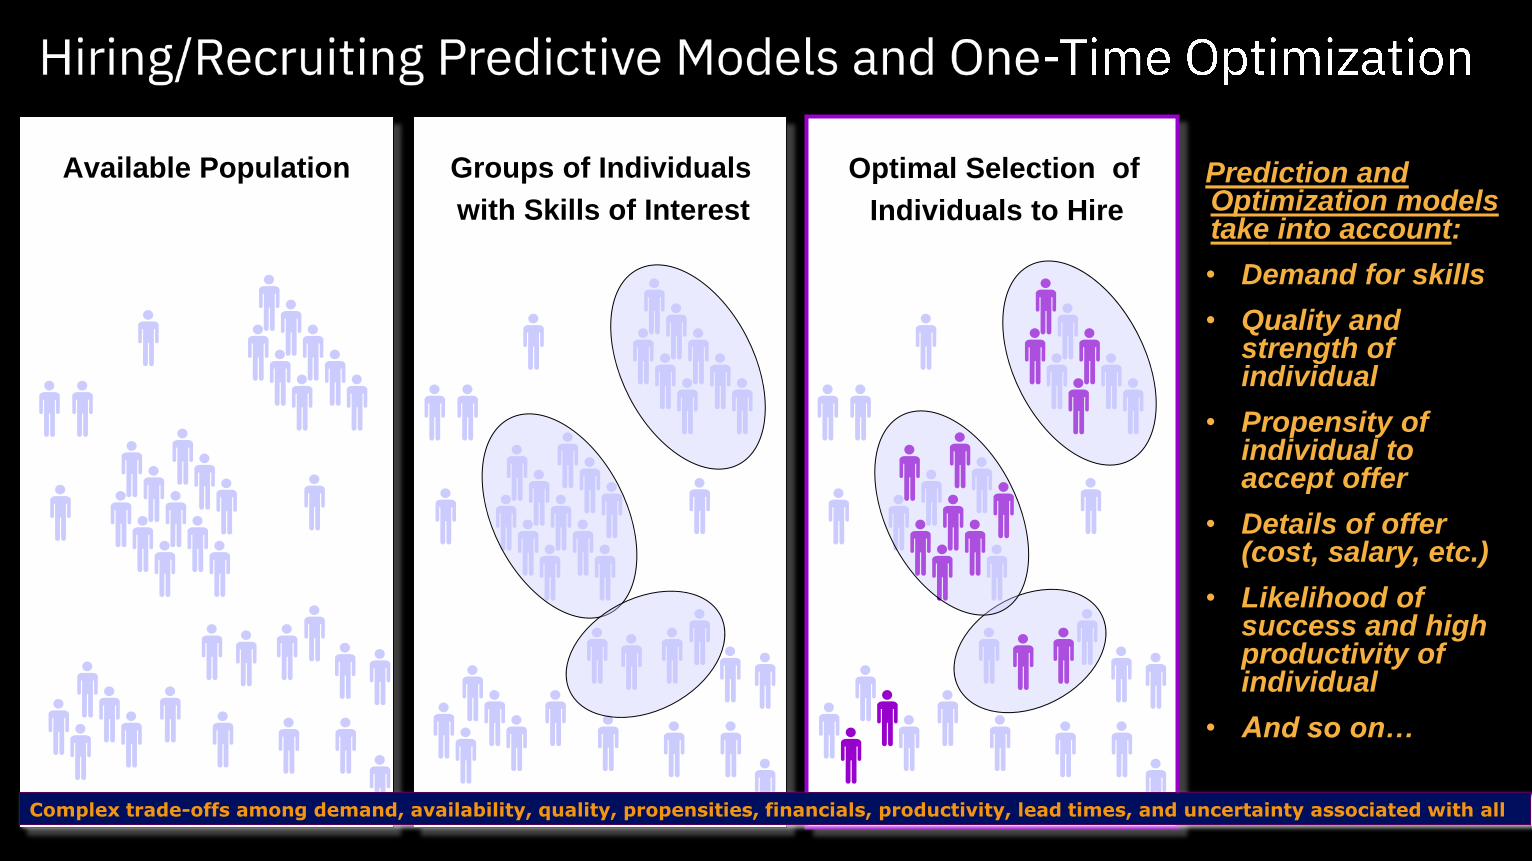
Available Population Groups of Individuals
with Skills of Interest
Optimal Selection of
Individuals to Hire
Prediction and Optimization models take into account:
• Demand for skills
• Quality and strength of individual
• Propensity of individual to accept offer
• Details of offer (cost, salary, etc.)
• Likelihood of success and high productivity of individual
• And so on…
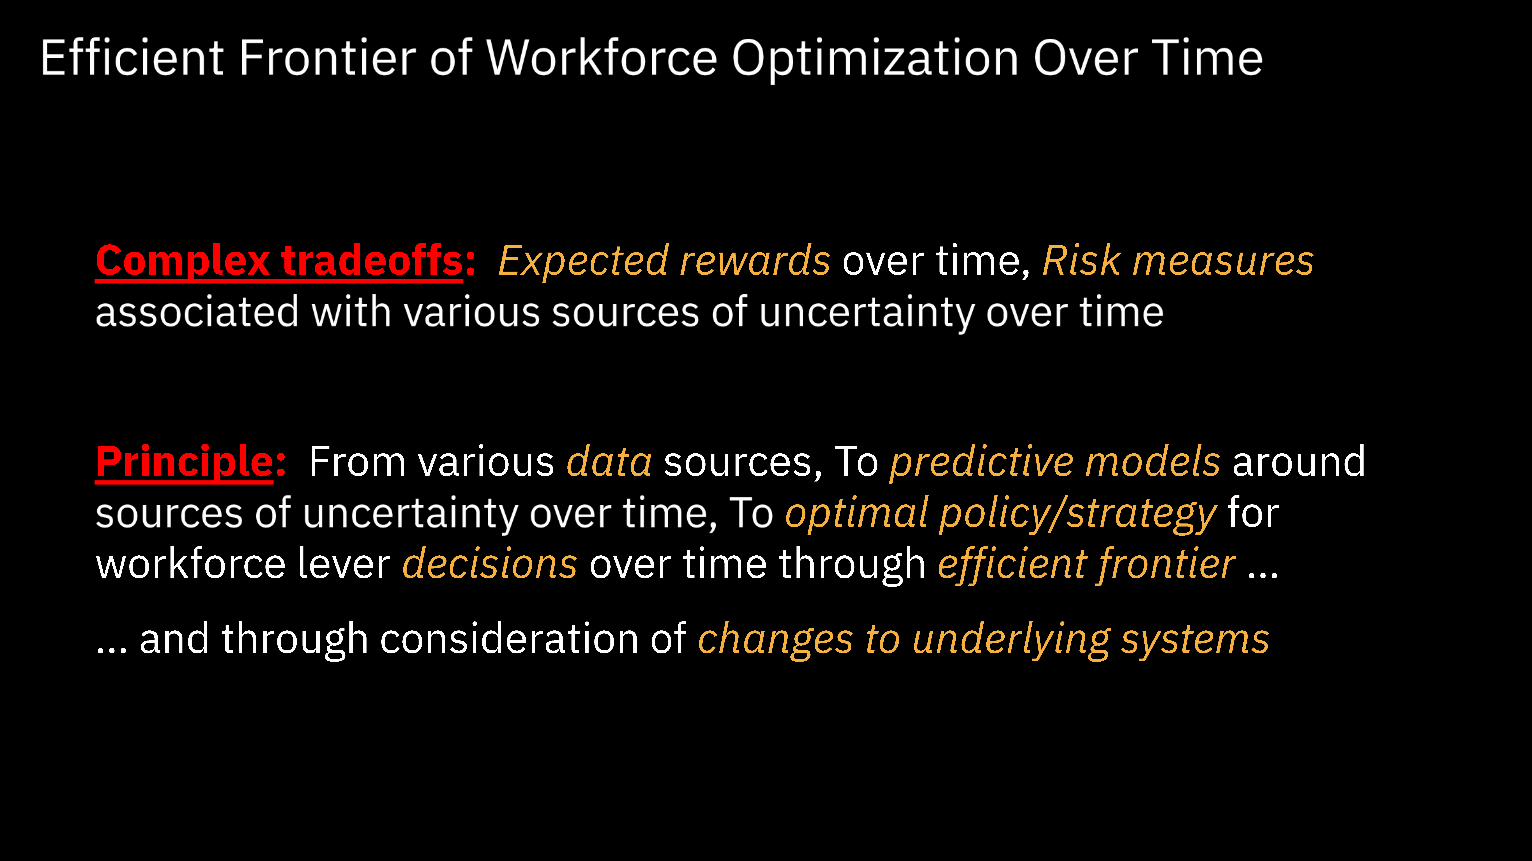
Complex trade-offs among demand, availability, quality, propensities, financials, productivity, lead times, and uncertainty associated with all
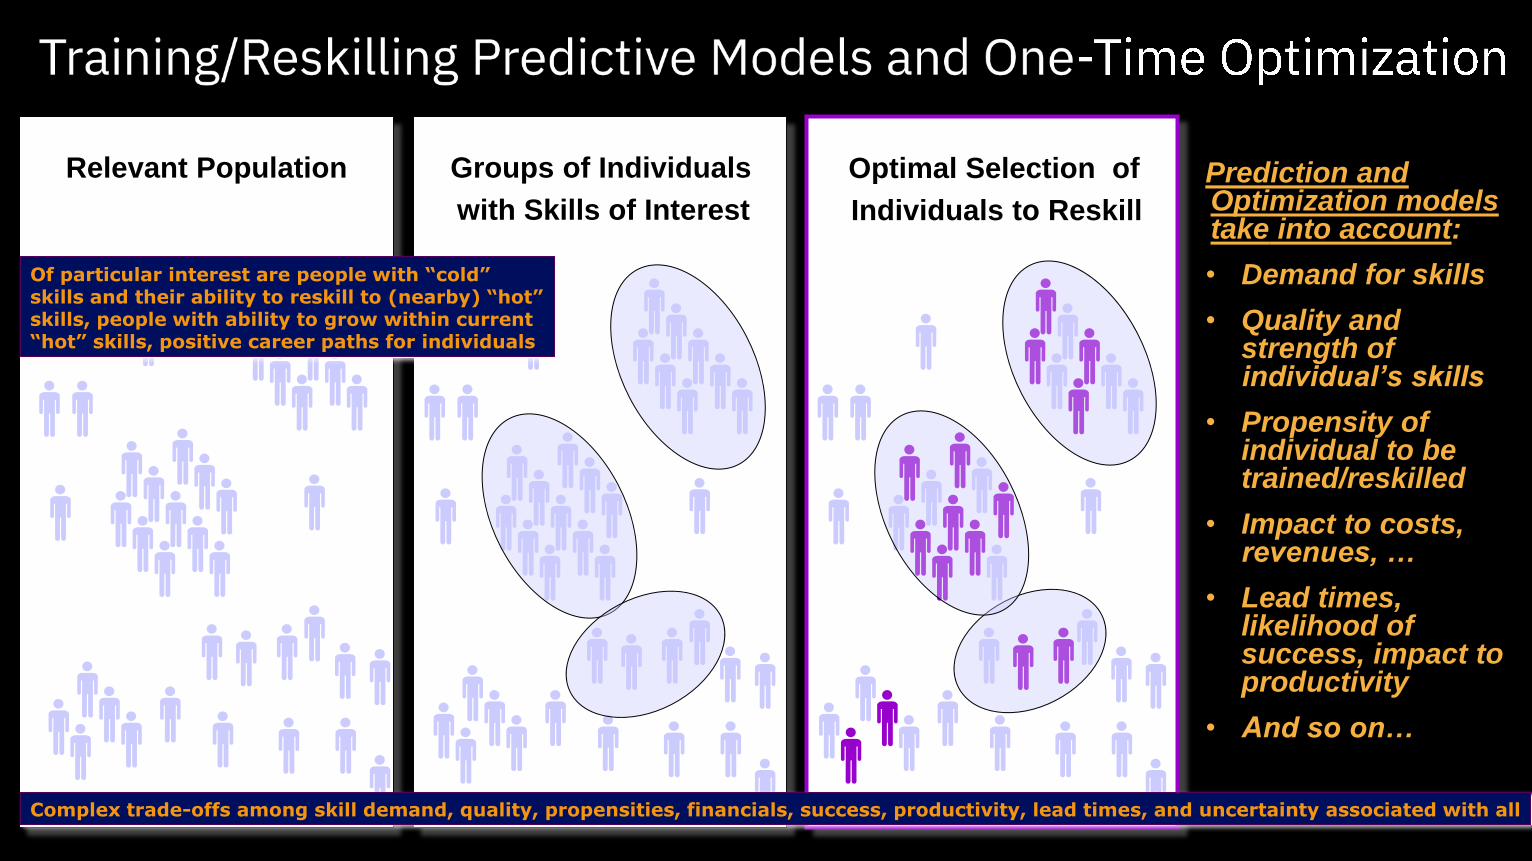
Relevant Population Groups of Individuals
with Skills of Interest
Optimal Selection of
Individuals to Reskill
Prediction and Optimization models take into account:
• Demand for skills
• Quality and strength of individual’s skills
• Propensity of individual to be trained/reskilled
• Impact to costs, revenues, …
• Lead times, likelihood of success, impact to productivity
• And so on…
Complex trade-offs among skill demand, quality, propensities, financials, success, productivity, lead times, and uncertainty associated with all
Of particular interest are people with “cold” skills and their ability to reskill to (nearby) “hot” skills, people with ability to grow within current “hot” skills, positive career paths for individuals

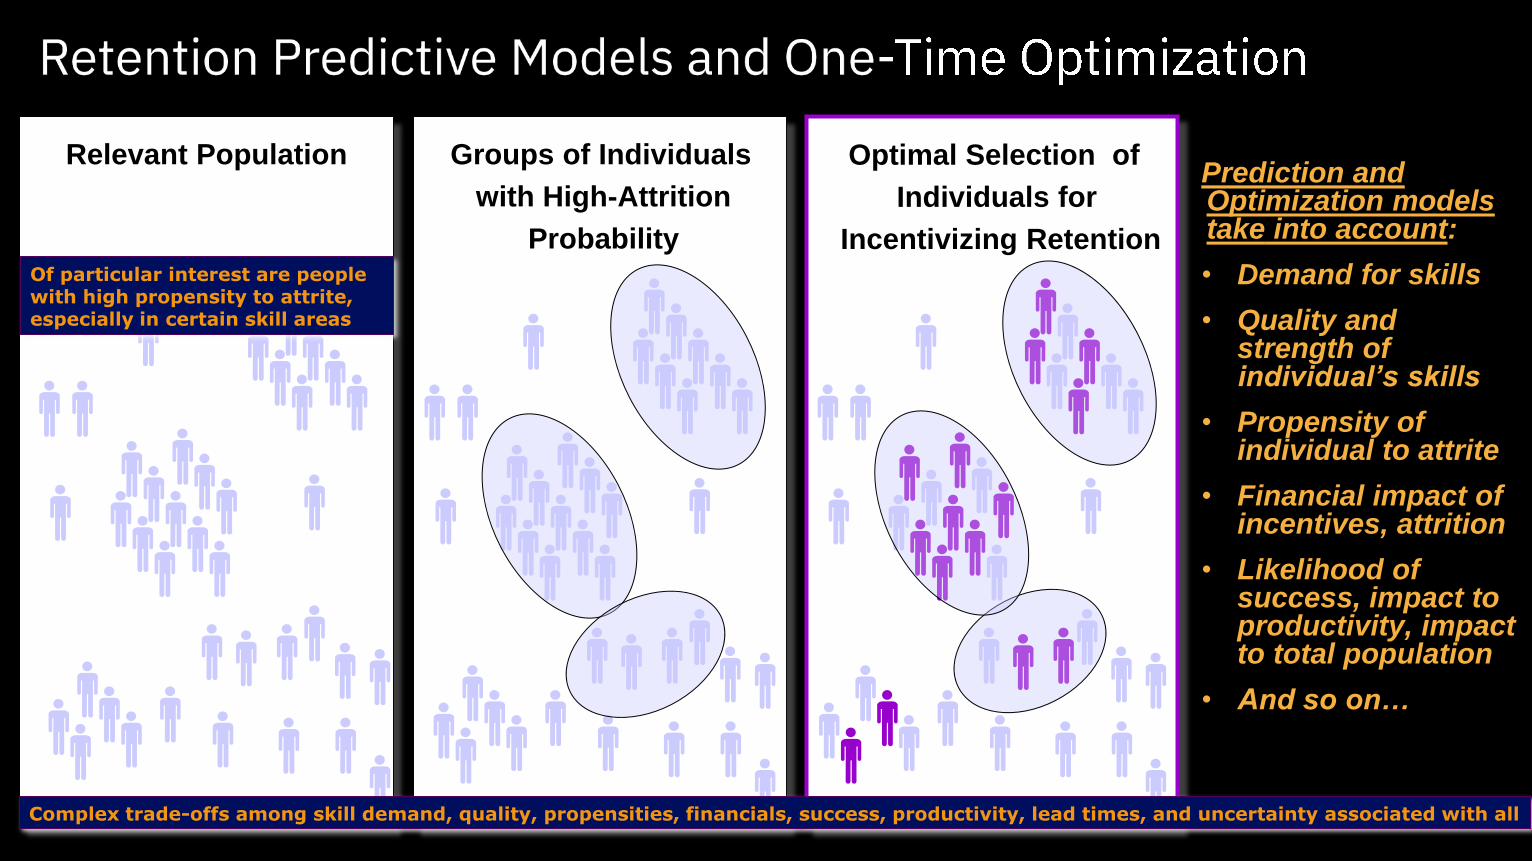
Groups of Individuals
with High-Attrition
Probability
Optimal Selection of
Individuals for
Incentivizing Retention
Prediction and Optimization models take into account:
• Demand for skills
• Quality and strength of individual’s skills
• Propensity of individual to attrite
• Financial impact of incentives, attrition
• Likelihood of success, impact to productivity, impact to total population
• And so on…
Relevant Population
Of particular interest are people with high propensity to attrite, especially in certain skill areas
Complex trade-offs among skill demand, quality, propensities, financials, success, productivity, lead times, and uncertainty associated with all


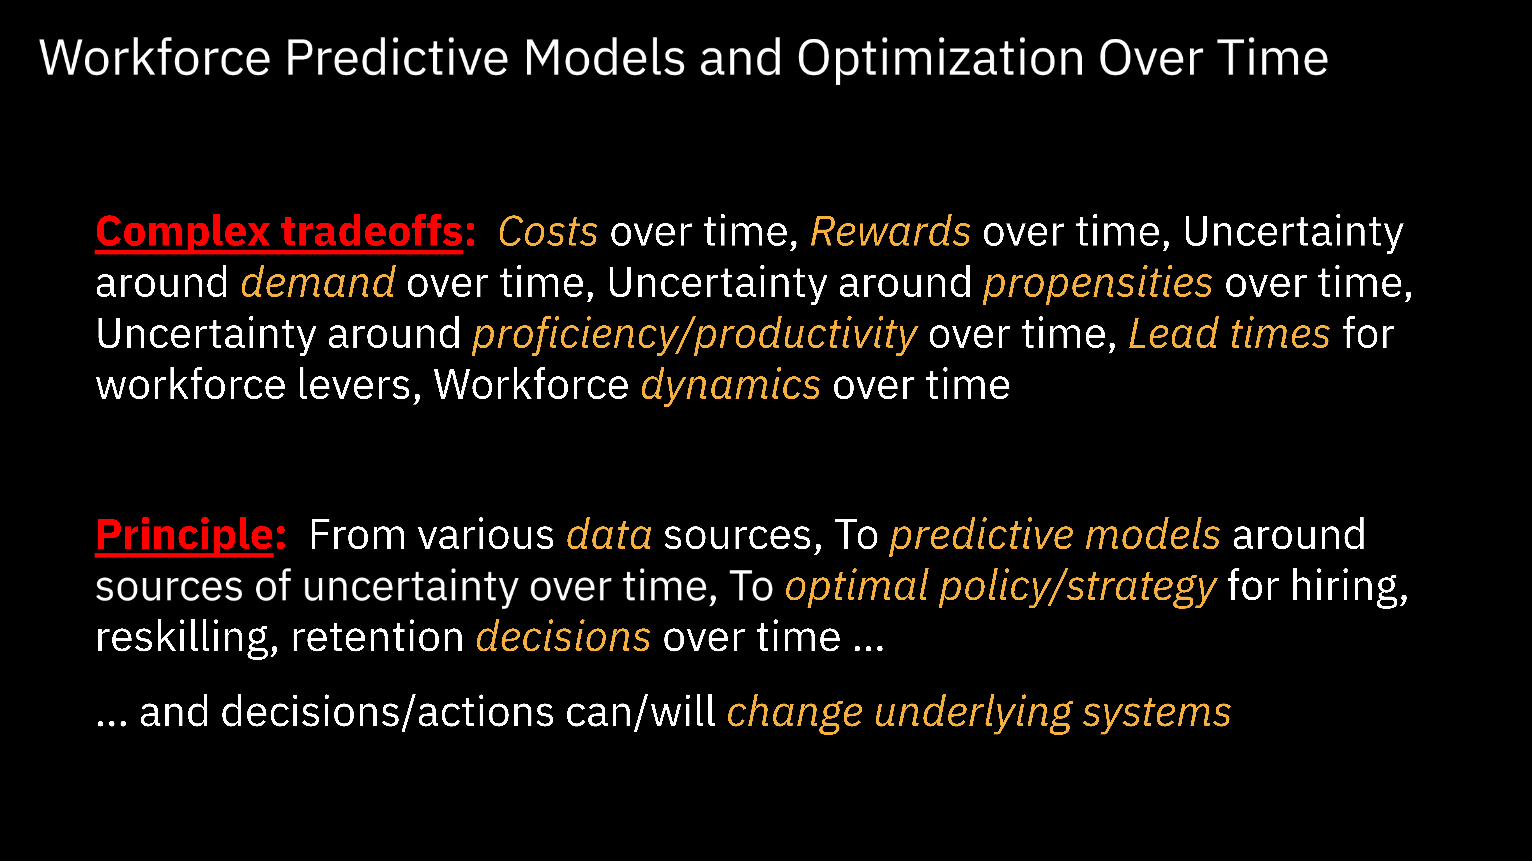
Prediction and Optimization models take into account:
• Demand over time
• Quality, strength, productivity of individuals
• Hiring, reskilling, attrition and associated policies
• Propensities of responses
• Cost, revenue, etc.
• Likelihood of success of policies and workforce decisions
• And so on…
Complex trade-offs over time among demand, quality, productivity, policies, lead times, propensities, financials, and uncertainty with all
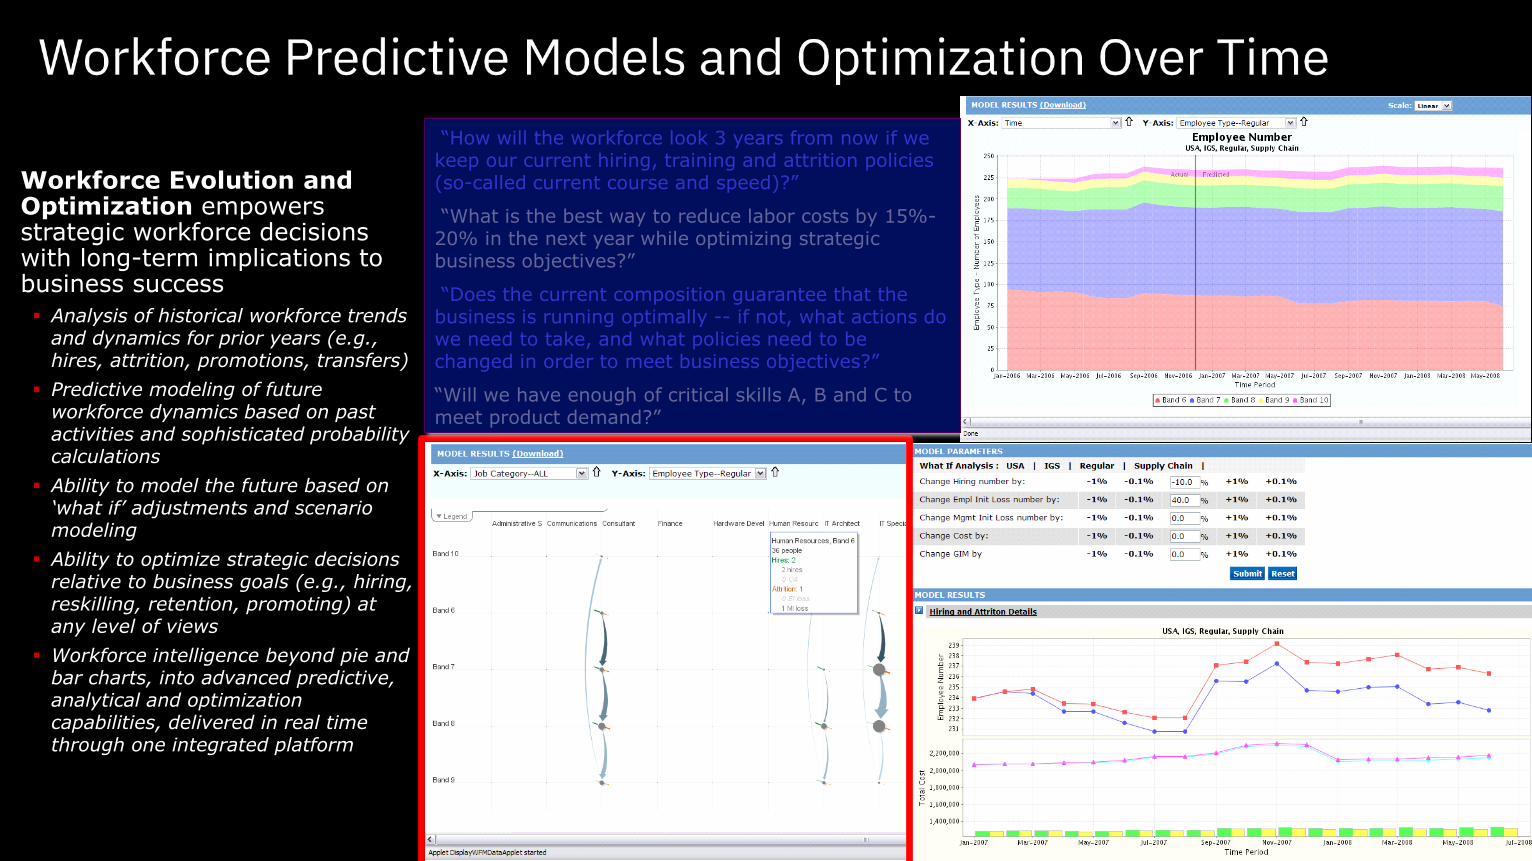
Workforce Evolution and Optimization empowers strategic workforce decisions with long-term implications to business success
▪ Analysis of historical workforce trends and dynamics for prior years (e.g., hires, attrition, promotions, transfers)
▪ Predictive modeling of future workforce dynamics based on past activities and sophisticated probability calculations
▪ Ability to model the future based on ‘what if’ adjustments and scenario modeling
▪ Ability to optimize strategic decisions relative to business goals (e.g., hiring, reskilling, retention, promoting) at any level of views
▪ Workforce intelligence beyond pie and bar charts, into advanced predictive, analytical and optimization capabilities, delivered in real time through one integrated platform
“How will the workforce look 3 years from now if we keep our current hiring, training and attrition policies (so-called current course and speed)?”
“What is the best way to reduce labor costs by 15%-20% in the next year while optimizing strategic business objectives?”
“Does the current composition guarantee that thebusiness is running optimally -- if not, what actions do we need to take, and what policies need to be changed in order to meet business objectives?”
“Will we have enough of critical skills A, B and C to meet product demand?”
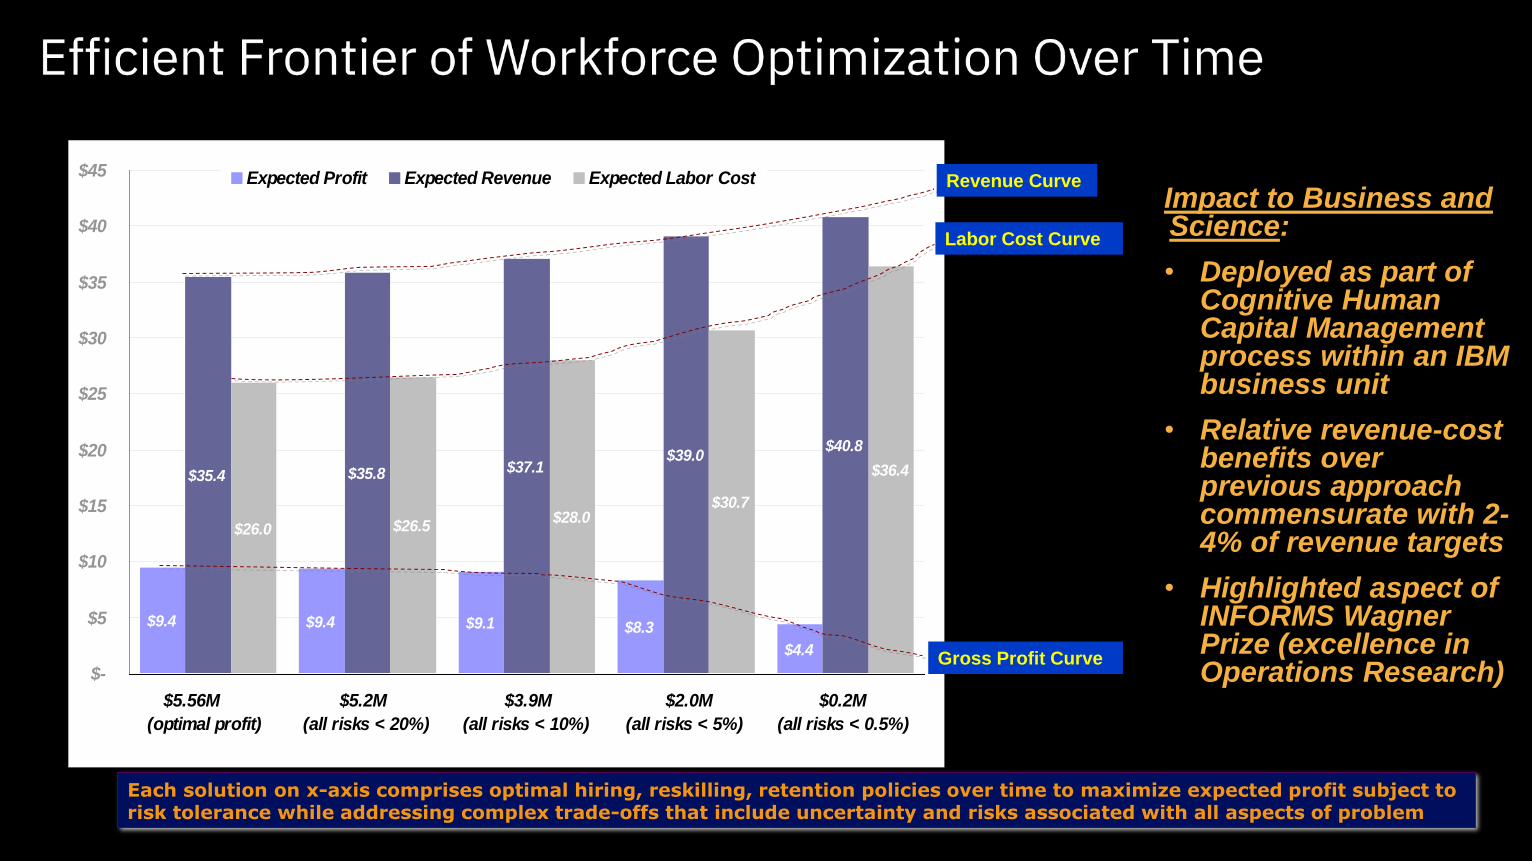
Impact to Business and Science:
• Deployed as part of Cognitive Human Capital Management process within an IBM business unit
• Relative revenue-cost benefits overprevious approach commensurate with 2-4% of revenue targets
• Highlighted aspect of INFORMS Wagner Prize (excellence inOperations Research)
Each solution on x-axis comprises optimal hiring, reskilling, retention policies over time to maximize expected profit subject to risk tolerance while addressing complex trade-offs that include uncertainty and risks associated with all aspects of problem
$9.4 $9.4 $9.1 $8.3
$4.4
$35.4 $35.8 $37.1$39.0
$40.8
$26.0 $26.5$28.0
$30.7
$36.4
$-
$5
$10
$15
$20
$25
$30
$35
$40
$45
$5.56M
(optimal profit)
$5.2M
(all risks < 20%)
$3.9M
(all risks < 10%)
$2.0M
(all risks < 5%)
$0.2M
(all risks < 0.5%)
Expected Profit Expected Revenue Expected Labor Cost Revenue Curve
Labor Cost Curve
Gross Profit Curve

t = Sept t = Oct t = Nov t = Dec t = Jan t = Feb t = Mar
150.98
.01
.03
.01
149.91
.05
.03
.04136
.86
.04
.03
.10
129.86
.04
.03
.10 .03
125.93
.04
.03
127.93
.04
.03
.03
Software
Architect
OTHER SKILLS
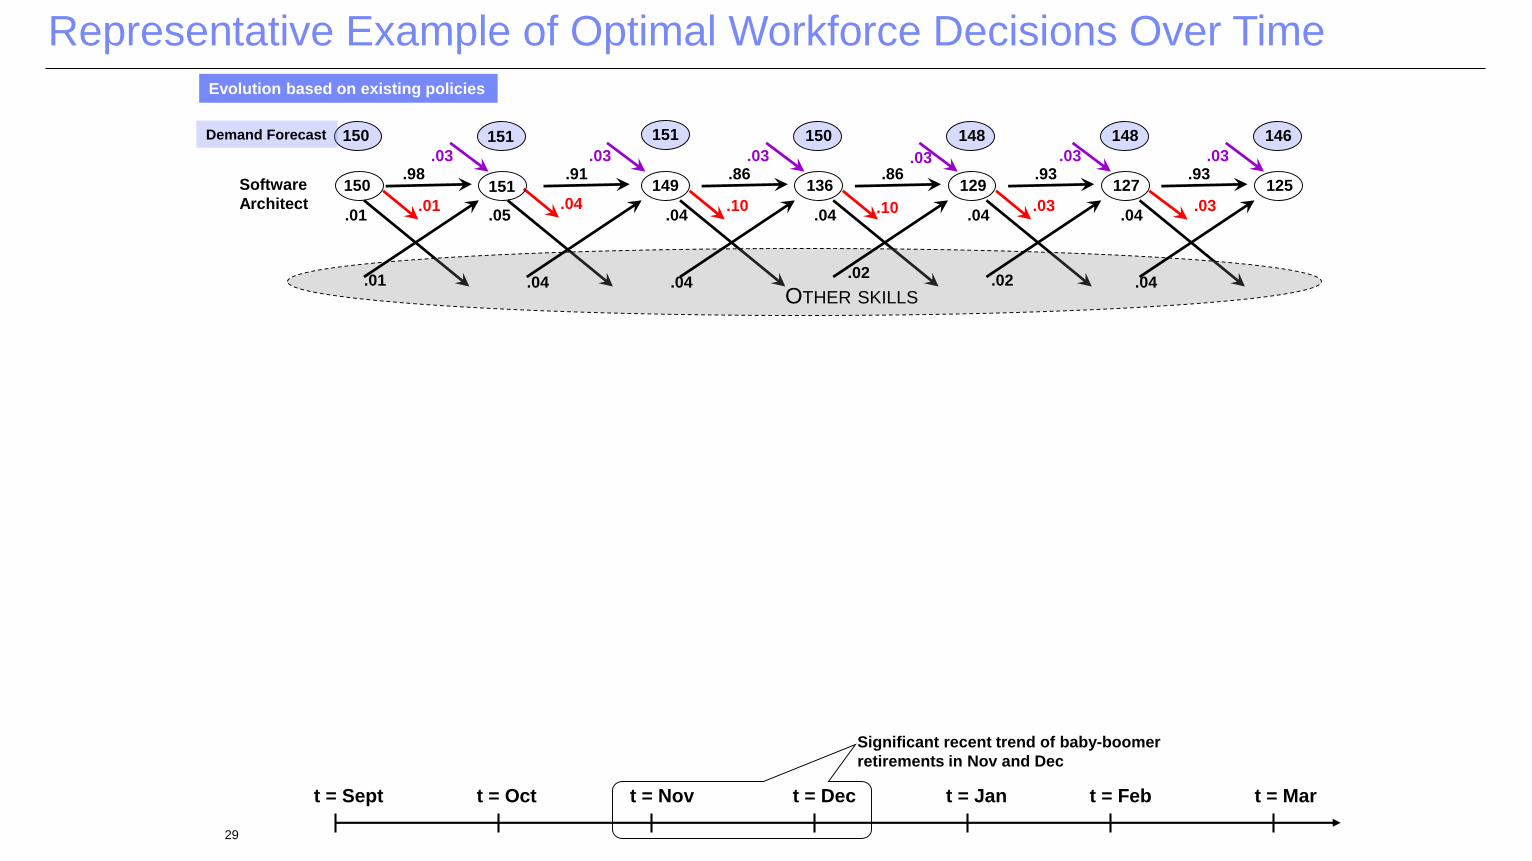
Evolution based on existing policies
Hired in Oct (arrive after lead time)
151
.01 .04 .04 .04.02
.02
Significant recent trend of baby-boomer
retirements in Nov and Dec
28
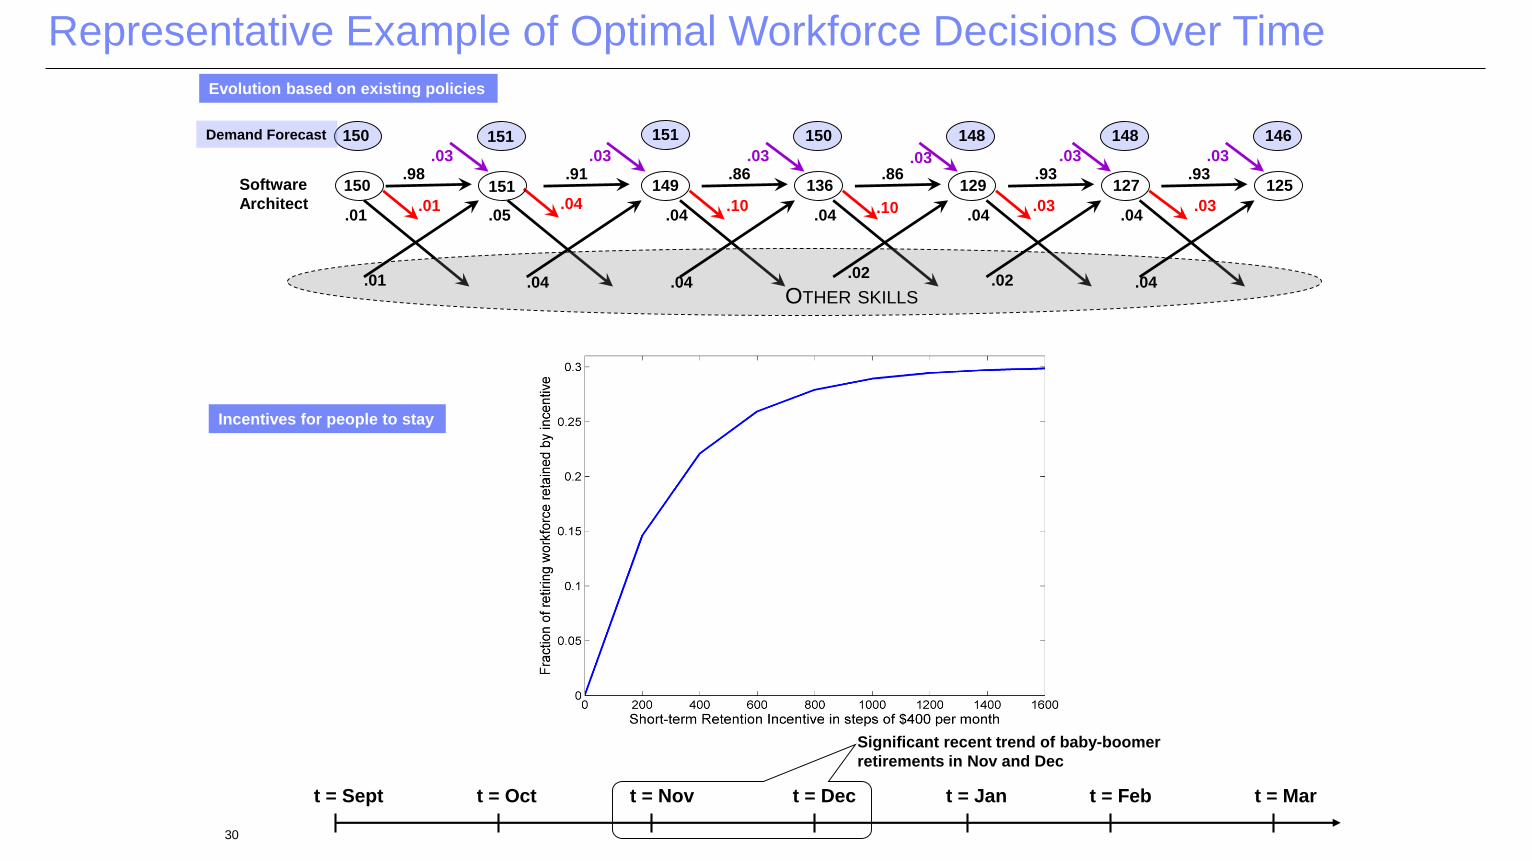
Representative Example of Optimal Workforce Decisions Over Time
t = Sept t = Oct t = Nov t = Dec t = Jan t = Feb t = Mar
150.98
.01
.03
.01
149.91
.05
.03
.04136
.86
.04
.03
.10
129.86
.04
.03
.10 .03
125.93
.04
.03
127.93
.04
.03
.03
Software
Architect
OTHER SKILLS
Evolution based on existing policies
151
150 151 150 148 146148151Demand Forecast
.01 .04 .04 .04.02
.02
Significant recent trend of baby-boomer
retirements in Nov and Dec
29
Representative Example of Optimal Workforce Decisions Over Time
t = Sept t = Oct t = Nov t = Dec t = Jan t = Feb t = Mar
150.98
.01
.03
.01
149.91
.05
.03
.04136
.86
.04
.03
.10
129.86
.04
.03
.10 .03
125.93
.04
.03
127.93
.04
.03
.03
Software
Architect
OTHER SKILLS
Evolution based on existing policies
151
150 151 150 148 146148151Demand Forecast
.01 .04 .04 .04.02
.02
Significant recent trend of baby-boomer
retirements in Nov and Dec
Incentives for people to stay
30
Representative Example of Optimal Workforce Decisions Over Time

Reduced shortage through
optimal retention incentive
t = Sept t = Oct t = Nov t = Dec t = Jan t = Feb t = Mar
150.98
.01
.03
.01
149.91
.05
.03
.04136
.86
.04
.03
.10
129.86
.04
.03
.10 .03
125.93
.04
.03
127.93
.04
.03
.03
Software
Architect
OTHER SKILLS
Evolution based on existing policies
151
150 151 150 148 146148151Demand Forecast
.01 .04 .04 .04.02
.02
Significant recent trend of baby-boomer
retirements in Nov and Dec
31
Representative Example of Optimal Workforce Decisions Over Time

Selection of Optimal Solution from Frontier:
• Examine optimal solution for each risk tolerance constraint
• Each optimal solution comprises optimal policies for workforce decisions over time
• Based on efficient frontier, select best solution that balances trade-offs among expected rewards and measure of risks
$9.4 $9.4 $9.1 $8.3
$4.4
$35.4 $35.8 $37.1$39.0
$40.8
$26.0 $26.5$28.0
$30.7
$36.4
$-
$5
$10
$15
$20
$25
$30
$35
$40
$45
$5.56M
(optimal profit)
$5.2M
(all risks < 20%)
$3.9M
(all risks < 10%)
$2.0M
(all risks < 5%)
$0.2M
(all risks < 0.5%)
Expected Profit Expected Revenue Expected Labor Cost Revenue Curve
Labor Cost Curve
Gross Profit Curve
Each solution on x-axis comprises optimal hiring, reskilling, retention policies over time to maximize expected profit subject to risk tolerance while addressing complex trade-offs that include uncertainty and risks associated with all aspects of problem