teck 2008 annual report
DESCRIPTION
Teck is a diversified resource company committed to responsible mining and mineral development with major business units focused on copper, metallurgical coal, zinc, gold and energy.TRANSCRIPT

2008 Annual Report

Teck is a diversified resource company committed to responsible mining and mineral
development with major business units focused on copper, metallurgical coal, zinc, gold
and energy.
Contents
Global Operations ..................................................................................... 1 2008 Highlights .......................................................................................... 2 Letter from our Chairman .......................................................................... 3 Letter from our CEO .................................................................................. 6 Management’s Discussion and Analysis ................................................. 10 Sustainability ........................................................................................... 48 People ..................................................................................................... 50 Consolidated Financial Statements ......................................................... 51 Directors and Officers ............................................................................ 117 Corporate Information ........................................................................... 118 Caution on Forward-Looking Information .............................................. 119
Annual and Special Meeting Our annual meeting of shareholders will be held at 11:00 a.m. on Wednesday April 22, 2009, in the Waterfront Ballroom C at the Fairmont Waterfront Hotel, 900 Canada Place Way, Vancouver, British Columbia.
Forward – Looking Statements This annual report contains forward-looking statements. Please refer to the caution on forward-looking information on page 119. All dollar amounts expressed throughout this report are in Canadian dollars unless otherwise noted.

Global Operations Mineral reserve and resource estimates for our properties are disclosed in our most recent Annual Information Form, which is available on our website at www.teck.com, or on the Canadian Securities Administrators website at www.sedar.com and on the EDGAR section of the SEC’s website at www.sec.gov.
Copper ■
2008 Production – 313,000 tonnes, increase of 24% from last year
Our copper business unit includes our interests in Highland Valley Copper in south central British Columbia, the Antamina mine in the north central Peruvian Andes, the Quebrada Blanca and Carmen de Andacollo mines in Chile and the Duck Pond copper-zinc mine in Newfoundland. Molybdenum and zinc are significant by-products produced at some of these mines.
Coal ♦
2008 Production – 14 million tonnes, increase of 29% from last year
Our coal business unit includes six metallurgical coal mines in British Columbia and Alberta and are the world’s second largest exporter of seaborne metallurgical hard coking coal.
Zinc ●
2008 Production – 663,000 tonnes of zinc in concentrate; 270,000 tonnes of refined zinc, a combined decrease of 6% from last year
Our zinc business unit includes our Trail refining and smelting complex in south central British Columbia, the Red Dog Operations in northwest Alaska and the Pend Oreille mine in Washington State. The major products produced at these operations are zinc and lead concentrates at our mines and refined zinc and lead at Trail. Trail Operations also produces various precious and specialty metals, fertilizers and chemicals and owns the Waneta dam, which produces electricity for the metallurgical facilities and for sale to third parties.
Gold ▲ 2008 Production – 279,000 ounces, decrease of 2% from last year
Our gold business unit includes our 40% interest in the Pogo mine located southeast of Fairbanks, Alaska, a 78.8% interest in the Morelos project in Mexico and several advanced gold exploration properties. In February 2009, we announced the sale of our 50% interest in the Hemlo Operations, located in northwestern Ontario.
Energy
1.7 billion barrels of recoverable bitumen
Our energy division includes our 20% interest in the Fort Hills oil sands project and our 50% interest in various oil sands leases that we jointly own with UTS Energy Corporation (“UTS”). All of these properties are located in the Athabasca region of Alberta, Canada.
COPPERCOALZINCGOLDENERGY
ANTAMINA
QUEBRADA BLANCA
ANDACOLLO
DUCK POND
FORT HILLS
TECK COALTRAILPEND OREILLE
HEMLO
HIGHLANDVALLEY
RED DOG
POGO

2
2008 Highlights
Net Earnings ($ in millions) Revenue ($ in millions)
Cash Flow ($ in millions)
2008 Operating Profit before Depreciation and Amortization
$617
$1,3
45
$2,4
31
$1,6
15
$659
2004 2005 2006 2007 2008
$3,4
28 $
4,4
15
$6,5
39
$6,3
71
$6,9
04
2004 2005 2006 2007 2008
$1,0
82 $1,6
26
$2,9
10
$1,7
61 $2,1
32
2004 2005 2006 2007 2008
Copper40%
Zinc15%
Coal42%
Gold3%

Teck 2008 Annual Report 3
Letter from our Chairman The year 2008 started out reasonably well for our businesses. The price of copper was a healthy US$3.02 a pound, similar to that of much of the preceding two years. The price of oil was US$100 a barrel, and would increase to over US$140 by mid-year. The benchmark price for the highest quality hard coking coal was in the process of being negotiated for the coming coal year, and most contracts would be settled at an historic high of US$300 a tonne. The strength of rising expectations of a better life for people in many emerging world markets and the limited capacity of the industry to respond quickly on the supply side led most observers to conclude that resource commodities would be “stronger for longer” and that, after a couple of decades of relative stagnation, we had entered a new “super-cycle”. Many friends and shareholders asked me at the time how long this would last, and my valid (but not particularly useful) response was usually: “There is no end in sight, but these things always do end, and generally for reasons that were not widely apparent”. There were some potential storm clouds on the horizon. The sub-prime mortgage loan crisis had surfaced with the first bank failures in Europe five months earlier, in August 2007, although the far-reaching consequences would not become apparent for some time. Early problems in the credit markets were appearing with the collapse of the asset-backed commercial paper market. A former banker, Charles R. Morris, published a perceptive book in January 2008 called “The Trillion Dollar Meltdown”, which in hindsight should have been required reading for any businessperson or shareholder interested in the subject. If anything he was too optimistic, and he has just published an update entitled “The Two Trillion Dollar Meltdown”. But the music played on. It is a fact of life, which can best be observed from a position of advancing age, that all trends tend to overshoot, both on the upside and on the downside. This applies to currencies, commodities and most other things including the madness of crowds. Having overshot, currencies and commodities often correct abruptly, catching unawares even the most admired prognosticators who had been following the preceding trend. Oil, for example, reached US$140 a barrel by mid-year, and more than one respected economist was heard to opine that oil would be US$200 a barrel by the end of 2008. On the mining side, consolidation had been the trend for several years. In 2007, Freeport had taken over Phelps Dodge after the latter’s failed attempt to acquire Inco, and Rio Tinto had taken over Alcan. As 2008 ended, Freeport wrote off US$13 billion as a result of weak global economic conditions and Rio Tinto is now having to struggle with US$40 billion of debt incurred to acquire Alcan. In early 2008, while prices were still high, Vale made overtures to acquire Xstrata, but they were unable to agree on terms. BHP continued to try to take over Rio Tinto but was rebuffed, before withdrawing after the economy collapsed in the fall. In such matters the winners and losers are never fully apparent until some time after the fact. And then, in October 2008, the music stopped abruptly. The rescue of Bear Stearns in the spring of 2008 had averted the looming crisis for a time, as did the bailouts of AIG and the early assistance to Citibank, but when Lehman Brothers was allowed to fail in September the reality finally struck home. The world, which had been “awash in liquidity” two years earlier, suddenly encountered a credit freeze unlike anything seen in living memory.

4
As we now know all too well, the impacts from this chain of events were not limited to the U.S. and Europe. Virtually every segment of the world’s economy has been hit and hit hard. The impacts on Teck have certainly been severe and remain a major, immediate challenge for the company. We had been in discussions with Fording Canadian Coal Trust periodically for more than a year to try to consolidate the Elk Valley Coal Partnership, which we managed as a 40% partner, into a single entity. Aside from potential operational efficiencies, the attraction of acquiring more of a very long-life resource that is the second-largest producer of seaborne metallurgical coal in the world was clear. Long-life, quality reserves are the lifeblood of any company in the mining industry, one of three keys to success in this business, along with people and financial strength, as we have written many times. By July we were finally able to reach agreement with the Trustees of Fording to support an offer, and to arrange US$9.8 billion in bridge and term financing packages with two multi-bank syndicates to finance the purchase. Subject to the approval of Fording unit holders, scheduled for September 30, and to the funds being provided by the banking syndicates, the purchase was scheduled to close on October 30. All approvals were obtained, the banks provided the funds, and the purchase closed on schedule - almost coincidentally with the financial meltdown. The value of Elk Valley Coal as a long term investment is not in doubt. Quality mines with a life expectancy of 30 years or more are rare and invaluable. It is said that in mining, for high quality, long life assets, “it is not so much what you pay for it; it is how you pay for it”. For many decades a fundamental principle of Teck has been to continuously upgrade the quality and longevity of its mine operating base without unduly stretching its balance sheet. In our case, the plan to accomplish this was two-fold. First, since diversification is another principle of Teck and the acquisition would weight our product mix more heavily than we prefer on any one commodity, we would accept a partner for some 20-25% of the coal mines upon completion. Several potential partners had expressed serious interest upon announcement of the transaction. Second, we would access the long term bond market immediately after closing, replacing part or all of the bridge financing with long term debt more appropriate to such a long life asset. As it happened, with the sudden credit freeze, our access to the bond market disappeared as we closed the acquisition, and of course most potential partners were by then encountering issues of their own, at least in the immediate aftermath of the credit crisis. While the coal operations involved are world class and will be important to the world steel industry and to Teck for decades to come, the timing of the purchase could not have been less propitious. Despite the aforementioned storm clouds on the horizon, we did not anticipate the severity or immediacy of the credit crisis nor, it might be said, did the banks which provided the bridge loan. But the situation “is what it is” and our job now is to work through it, in particular getting the short term debt burden down in the most prudent way possible. The details of this program are dealt with elsewhere in this annual report and in any case it is a moving target best dealt with by acts rather than promises. All of us are dedicated to achieving this as quickly and effectively as possible while maintaining our core assets and getting back into our historic mode of prudent growth. It is our view that the “super-cycle” of stronger resource markets (based on continuing pent-up demand from many aspiring people around the world, combined with limited near-term supply growth) is not over, but has merely paused. The stimulus programs announced around the world will have an impact on economic activity. How long it will take before we can see a resumption of economic growth is unclear, but it may be assumed it will happen. The future will belong to those resources companies, in mining and in oil, that are able to emerge from this financial abyss with their long life resources largely intact. As the largest diversified Canadian mining company, Teck is determined to be one of them.

Teck 2008 Annual Report 5
I’m sorry to say that Keith Steeves will not be standing for re-election at the upcoming Annual Meeting, having passed the mandatory retirement age for directors. Keith has been a valued member of the Teck team since 1981, another time when the economy was in one of its periodic severe downturns, and his role in management and later as a director has made a big contribution to the growth of the company. We wish Keith and his wife, Norma, a long and happy retirement. I’m pleased to be able to announce that Jack Cockwell has agreed to stand for election in Keith’s place. Jack has been involved in Canadian mining for many years and has one of the great financial minds in Canadian business. We look forward to his wise counsel and insights and to working with him as we move forward. On behalf of the Board,
Norman B. Keevil, Chairman March 4, 2009

6
Letter from our CEO There is no doubt that 2008 will be remembered as a year of unprecedented volatility for the world economy and for the mining sector. Commodity markets were affected dramatically by prices and demand that fell quickly and steeply in the latter part of the year. Mining companies around the world – including Teck – were forced to respond to this rapid collapse with swift and decisive action. As the severity of the new economic reality emerged last fall, we immediately initiated a multi-step program to position us for both short and long-term competitiveness. At the core of our ongoing response is a comprehensive plan to manage the debt we took on to complete the acquisition of Fording Canadian Coal Trust’s assets. The first steps in this plan were announced in November and included: Suspending our dividends to create an estimated annual savings of $487 million;
Reducing planned capital expenditures by $730 million for 2009;
Withdrawing from the Petaquilla copper project in Panama, thereby eliminating any funding obligations associated with the project;
Reducing refined zinc production by 20% at our Trail Operations, allowing us to increase power sales from our Waneta hydro facility;
Selling our interest in the Lobo-Marte gold property in Chile to Kinross Gold Corporation for a combination of US$40 million in cash and 5.6 million Kinross shares; and
Initiating other asset sale processes.
We followed the above actions with a decision in December to temporarily shut our Pend Oreille zinc mine. Also in December, we and our partners in the Fort Hills oil sands project decided to delay the final investment decision on the project and are undertaking a comprehensive review and update of all costs associated with developing only a bitumen production facility. As the year drew to a close, we set in motion a significant global workforce reduction, which was announced in early January 2009. The reduction affects 1,400 positions, or 13%, of our workforce. Of all the actions, this was by far the most difficult, and I thank each affected employee for his or her service and gratefully acknowledge their contributions to the company. These were all necessary decisions spurred by the collapse of financial and commodity markets that is historic in both its velocity and depth. While the economic crisis will undoubtedly cast a pall on how the world remembers 2008, the first eight months of the year were actually marked by robust demand and pricing for the commodities we produce, with copper topping US$4 per pound and annual metallurgical coal contracts settled at benchmark prices of more than US$300 per tonne. This economic strength was driven by long-term fundamentals that remain largely intact today, though clouded by the uncertainty of the immediate future. Despite the very real challenges before our company and the global economy today, billions of people in China, India and other developing countries remain determined to create a better life for themselves and generations to come. In the coming years and decades, new cities will be built, infrastructure will be advanced on an unprecedented scale, and urbanization will create millions of new consumers. Although volatility will likely persist in the near term, these fundamentals suggest that demand for steel-making coal and other commodities will continue to grow over the mid to long-term at a healthy rate. Coupled with the relative scarcity of hard coking coal, it was these fundamentals that drove our decision, after extensive analysis, to make the offer, announced on July 29, to acquire the assets of the Fording Canadian Coal Trust. While the timing of the transaction, which closed October 30, has created very significant short-term challenges, I remain confident that, over time, this acquisition will deliver significant value to shareholders. Managing the US$9.8 billion debt associated with the Fording transaction is our number one goal for 2009. Through the strength of our operating cash flow, anticipated asset sales, tax refunds generated by the structure of the Fording transaction, and major cuts in spending, including capital, we expect to significantly reduce debt this year. Our asset base

Teck 2008 Annual Report 7
is strong and we have a great deal of flexibility to address our short-term refinancing requirements. We have already made reasonable progress as a result of actions undertaken since last November and are in discussions with our lenders to negotiate amendments to the bridge facility that would provide us with additional time to generate cash and/or access appropriate sources of long-term financing to repay the bridge loan. By continuing this course of action, we believe we will manage the challenges before us.
Safety Safety is a core value and we believe “zero incidents” is possible in the workplace. We are saddened to report that we were unsuccessful in achieving this goal in 2008. A fatality occurred during a logging project in July at a coal exploration project in the Elk Valley of British Columbia. We wish to express our heartfelt condolences to the family, friends and co-workers of Dennis Michael Gravelle who worked for a contractor that provided logging services. Between 2007 and 2008, our employees and contractors combined achieved a 49% reduction in the Total Reportable Incident Frequency (TRIF), a comprehensive measure of safety performance. For 2009, we will look to achieve a further 25% improvement against this measure. An example of our collective commitment to safety in 2008 was the completion of a case study on the safety practices of best-performing companies. One of the study’s key strategic recommendations is the development of the Courageous Leadership program. To reinforce our commitment to safety as a core value, we will implement this program across the organization in 2009.
Sustainability Pursuing sustainability is an important part of what we do, and is a priority wherever we work. Our sustainability commitments to international initiatives, such as the United Nations Global Compact, the Millennium Development Goals and the International Council for Mining and Metals (ICMM) Sustainable Development Framework, reflect our commitment to upholding best practices and improving our performance in many facets of sustainability. Improving our energy efficiency at operations and responsibly managing associated greenhouse gas emissions are priorities. Our efforts and work in sustainability were recognized in 2008 when we were named to the Dow Jones Sustainability Index, North America. Our focus on developing capacity around community engagement, articulating strategic direction in biodiversity and our continued commitment to Environment, Health, Safety and Community disclosure helped us demonstrate our progress in sustainable development.
Business Units In October, we announced the launch of our simplified name and brand, Teck, and the formation of five business units specializing in copper, metallurgical coal, zinc, gold and energy. Seven years ago when the Teck Cominco merger was completed, two strong Canadian companies with a tradition of excellence in mining and metal refining were brought together. Since then, we have grown through the acquisition and development of a diversified range of commodities. Now, under one simplified name and a new business unit structure, we are striving to build on our strength as a diversified resource leader. The new structure is designed to improve competitiveness by focusing senior management resources on driving operating unit performance improvement and enhancing our ability to identify, analyze and act on available opportunities in each commodity segment. Each business unit is led by a senior executive with full responsibility for the unit’s performance including the identification and development of projects to improve and grow the business consistent with corporate objectives, the safe and sustainable operation of the unit’s assets, delivering dependable, quality products to customers, and overall business unit financial performance. The following sections provide a high-level summary of each business unit’s performance and activities for 2008.
Copper
We produced a total of 313,000 tonnes of copper in 2008, up from 252,000 tonnes in 2007. A large part of this increase was realized by the inclusion of a full year of results from the Quebrada Blanca, Carmen de Andacollo and Duck Pond mines, which were fully integrated following the acquisition of Aur Resources Inc. in August 2007. Operating profit for the copper business, before depreciation and amortization, was $1.1 billion, or 40% of the total, and 31% of revenue.

8
Quebrada Blanca recorded its highest production ever in 2008, while production at Carmen de Andacollo was 13% higher than in 2007. Both copper and zinc production at Antamina exceeded 2007 production. At Highland Valley, processing of softer, lower grade ores resulted in higher total mill throughput but lower copper production. The expansion project at Carmen de Andacollo was approximately 60% complete at year-end. Commissioning and start-up of the concentrator is scheduled for the fourth quarter of 2009, with commercial production in early 2010. Major drilling programs were completed at both Quebrada Blanca and Antamina to confirm resources to support growth projects, and preliminary engineering studies were undertaken for projects at both sites. We were particularly pleased to confirm a new resource, representing 11 billion pounds of contained copper and 450 million pounds of contained molybdenum, at Quebrada Blanca so soon after completing the acquisition of Aur Resources. Finally, the Relincho advanced exploration project in Chile was acquired from Global Copper Corp., and we have been particularly pleased with progress at the site since the acquisition.
Coal
Our coal business, which is the second largest supplier of steelmaking coal to the global steel industry and largest supplier in North America, gave a strong performance during most of 2008. It accounted for 35% of our revenue and 42% of our operating profit before depreciation and amortization, or approximately $1.2 billion. We met the lower end of our guidance range for coal sales in a year characterized by extreme volatility and uncertainty caused by the sudden impact of the financial crisis on the steel industry. Our average sales price of US$205 per tonne was the highest price ever received, doubling 2007 figures. Customers recognized and rewarded us for our focus on product quality improvements, allowing us to narrow the pricing gap with our competitors. In 2008, our highest value product reached parity pricing with the highest value products produced by our competitors in Australia.
Zinc
Operating profit for the zinc business was $439 million and accounted for 15% of operating profit before depreciation and amortization and 30% of revenue in 2008. Red Dog and Trail initiated projects to improve business performance by reducing costs and increasing revenues. All zinc operations adjusted to the changing economic climate by taking advantage of attrition to reduce employee numbers, tightly controlling costs and boosting production of valuable by-products. Unfortunately, these actions were not sufficient to maintain the viability of the Lennard Shelf and Pend Oreille mines. Lennard Shelf was permanently closed in August 2008 and Pend Oreille was closed and put on care and maintenance in February 2009.
Gold
Collectively, our Pogo and Hemlo operations produced approximately 269,000 ounces to our account in 2008. A 25% increase in US dollar gold prices combined with a depreciating Canadian dollar resulted in an operating profit before depreciation and amortization of $84 million compared to $35 million in 2007. A full year of production at Pogo following start-up offset declining production at Hemlo due to declining grades reflecting a mature underground operation. The Pogo operation was stabilized and work now focuses on optimization. Hemlo successfully transitioned the operation to match a lower production level. As previously mentioned, our interest in the Lobo-Marte property in Chile was sold to Kinross in January 2009 and in February 2009 we announced the sale of our interest in the Hemlo operations to an affiliate of Barrick Gold Corporation for US$65 million.
Energy
Our energy business increased its contingent bitumen resources to more than 1.7 billion barrels with the inclusion of our 50% interest in the Frontier Project’s best estimated 1.6 billion barrels of contingent resource. We assumed operatorship of our 50/50 joint venture with UTS in the Athabasca basin, with the Frontier and Equinox projects each advancing through engineering and regulatory stages.

Teck 2008 Annual Report 9
Preliminary capital cost estimates from the Fort Hills oil sands project front-end engineering design were significantly increased from the previous estimates. As noted above, the partnership has delayed the project sanction decision into 2009 as it assesses various options for project phasing and development, including delaying the upgrader portion of the project. A major review is underway with the objective of significantly reducing capital costs for the bitumen mine.
Management In November, we announced the departure of Executive Vice President and Chief Operating Officer, Peter Kukielski, who left Teck to pursue a new opportunity. Earlier in the year, we announced two new senior management positions to facilitate the creation of our new business unit structure. Roger Higgins was appointed Senior Vice President, Copper. In his previous role, Roger was Vice President and Chief Operating Officer Australia for BHP Billiton Base Metals. Ray Reipas was appointed to the newly-created position of Vice President, Energy and is responsible for the management of our interest in the Fort Hills, Equinox and Frontier oil sands development projects in Alberta. He joined us from a major oil and gas company, where he was Vice President, Mining. These senior executives join Mike Agg (Zinc), Boyd Payne (Coal) and Rob Scott (Gold) to head each of our respective business units.
Objectives for 2009 Amid a challenging and uncertain outlook for the global economy, we are resolute in our commitment to take the necessary measures in 2009 to assure both our short and long-term success. In the coming year, resources will be focused in three key areas. The first is maximizing cash flow to facilitate debt repayment. We will do this through redoubled efforts to reduce costs and expenditures and by pursuing asset sales. The second is reducing and refinancing the bridge loan associated with the Fording acquisition. We are in discussions with our lenders to extend the maturity of the bridge loan and, as market conditions allow, we plan to refinance the remaining portion of this loan over a sustainable term that better reflects the long life of these valuable coal assets. The third objective, within the context of restrained capital expenditures overall, is to complete a number of key projects, including the first phase of the Highland Valley Copper mine life extension and the Carmen de Andacollo expansion project that will create value for the company in the near term. As always, we will maintain our focus on enhancing our safety performance and striving for operational excellence across the company. The real measure of our success in 2009 will be our continued ability to respond rapidly and effectively to changing market conditions. Our hundred-year history is a testament to the capabilities and commitment of our employees and management teams, who have shown great ability in adapting to and leading change. Every day across the company individuals and teams rise to the challenge before us. I want to thank each employee for his or her continued efforts.
Donald R. Lindsay President and Chief Executive Officer March 4, 2009

10
Management’s Discussion and Analysis of Financial Position and Operating Results The management’s discussion and analysis of our results of operations is prepared as at March 4, 2009 and should be read in conjunction with our audited consolidated financial statements and the notes thereto as at and for the year ended December 31, 2008. Unless the context otherwise dictates, a reference to Teck, Teck Cominco, the Company, us, we or our, refers to Teck Cominco Limited and its subsidiaries including Teck Cominco Metals Ltd.; a reference to TCML refers to Teck Cominco Metals Ltd. and its subsidiaries; and a reference to Aur or Aur Resources refers to Aur Resources Inc. and its subsidiaries. All dollar amounts are in Canadian dollars, unless otherwise specified, and are based on our consolidated financial statements that are prepared in accordance with Canadian generally accepted accounting principles (GAAP). The effect of significant differences between Canadian and US GAAP are disclosed in note 24 to our consolidated financial statements. Certain comparative amounts have been reclassified to conform to the presentation adopted for 2008. In addition, in May 2007 our Class A common and Class B subordinate voting shares were split on a two-for-one basis. All comparative figures related to outstanding shares and per share amounts have been adjusted to reflect the share split. This management discussion and analysis contains certain forward-looking information and forward-looking statements. You should review the cautionary statement on forward-looking information under the caption "Caution on Forward-Looking Information". Additional information about us, including our most recent annual information form, is available free of charge on our website at www.teck.com, on the Canadian Securities Administrators’ website at www.sedar.com and on the EDGAR section of the United States Securities and Exchange Commission’s (SEC) website at www.sec.gov.
Business Unit Results The table below shows our share of production of our major commodities for the last five years and expected production for 2009.
Five-year production record and 2009 plan (our proportionate share)
Units (000’s) 2004 2005 2006 2007 2008
2009Plan
Principal Products
Copper contained in concentrate tonnes 248 263 254 215 206 230
Copper cathodes tonnes - - - 37 107 100
248 263 254 252 313 330
Metallurgical coal
Direct share tonnes 9,277 9,948 8,657 9,024 11,282 20,000
Indirect share tonnes 1,386 1,376 1,147 1,552 2,345 -
10,663 11,324 9,804 10,576 13,627 20,000
Refined zinc tonnes 413 223 296 292 270 270
Zinc contained in concentrate tonnes 619 657 627 699 663 690
Gold ounces 261 245 263 285 279 160
Major by-Products
Molybdenum contained in concentrate pounds 11,631 9,482 7,929 7,133 7,119 8,500
Refined lead tonnes 85 69 90 76 85 85
Lead contained in concentrate tonnes 119 110 129 146 133 125

Teck 2008 Annual Report 11
Notes to five-year production record and 2009 plan:
(1) In August 2007, we acquired the Quebrada Blanca, Andacollo and Duck Pond mines as a result of our acquisition of Aur Resources Inc. Quebrada Blanca and Andacollo produce cathode copper. Duck Pond produces copper and zinc concentrates. In March 2004, we increased our interest in the Highland Valley Copper mine from 63.9% to 97.5%. We report 100% of the production of Quebrada Blanca and Andacollo, even though we own 76.5% and 90%, respectively of these operations because we fully consolidate their results in our financial statements.
(2) The direct share of coal production includes our proportionate share of production from the Teck Coal Partnership (formerly Elk Valley Coal Partnership), which was 35% on February 28, 2003 and increased in various increments to 40% on April 1, 2006. Fording Canadian Coal Trust (Fording) owned the remaining interest in the Teck Coal Partnership. The indirect share of coal production was from our investment in units of Fording. We owned approximately 9% of Fording from February 28, 2003 to September 27, 2007 and on September 27, 2007 increased our interest in Fording to 19.95%. In October 2008, we acquired all of the assets of Fording, which consisted primarily of its 60% interest in the Teck Coal Partnership.
(3) In April 2007, our Lennard Shelf zinc mine and Pogo gold mine achieved commercial production. The Lennard Shelf zinc mine ceased production in August 2008.
(4) In 2005, refined zinc and lead production was affected by a three-month strike at our Trail metallurgical operation. In December 2004 we sold our Cajamarquilla zinc refinery.
(5) Gold production for 2009 assumes completion of the sale of our Hemlo mines that was announced in February, 2009.
(6) Asset sales and financing transactions may affect our 2009 production plans and all 2009 production estimates are subject to change based on market conditions.
Our business is the exploration for and development and production of natural resources. Through our interests in mining and processing operations in Canada, the United States and South America we are an important producer of copper and the world’s second largest zinc miner. We hold a 100% direct ownership in Teck Coal, the world’s second largest producer of seaborne high quality coking coal. Our principal products are copper, metallurgical coal, zinc and gold. Lead, molybdenum, various specialty and other metals, chemicals and fertilizers are by-products produced at our operations. We also sell electrical power that is surplus to the requirements of our Trail metallurgical operations and own a 20% interest in the Fort Hills oil sands project and a 50% interest in other oil sands leases in the Athabasca region of Alberta, Canada. We manage our activities along commodity lines and are organized into business units as follows: Copper Coal Zinc Gold Energy Corporate Our energy business unit consists of our investments in our oil sands projects, which are in various stages of exploration and development. We continue to regard the Fort Hills oil sands project as an attractive long-term asset. However, in light of the significant cost of participation in a near-term oil sands project at this stage of the business and commodity cycle, we are exploring strategic alternatives. Our corporate business unit includes all of our activities in other commodities, our corporate growth initiatives and groups that provide administrative, technical, financial and other support to all of our business units. Average commodity prices and exchange rates for the past three years, which are a key driver of our earnings, are summarized in the following table. US$ CDN$
2008 %
chg 2007 %
chg 2006 2008 %
chg 2007 %
chg 2006
Copper (LME Cash-$/pound) 3.17 -2% 3.23 +6% 3.05 3.37 -3% 3.46 - 3.45
Molybdenum (Platts*-$/pound) 29 -3% 30 +20% 25 31 -3% 32 +14% 28
Coal (realized-$/tonne) 205 +109% 98 -13% 113 220 +110% 105 -20% 131
Zinc (LME Cash-$/pound) 0.85 -42% 1.47 -1% 1.49 0.91 -42% 1.57 -7% 1.68
Lead (LME Cash-$/pound) 0.95 -19% 1.17 +98% 0.59 1.01 -19% 1.25 +87% 0.67
Gold (LME PM Fix-$/ounce) 872 +25% 697 +15% 604 931 +25% 746 +9% 683
Exchange rate (Bank of Canada)
US$1 = CDN$ 1.07 -% 1.07 -5% 1.13
CDN$1 = US$ 0.93 -% 0.93 +6% 0.88
* Published major supplier selling price in Platts Metals Week.

12
Our revenue and operating profit before depreciation and amortization by business unit is summarized in the following table.
RevenuesOperating Profit before Depreciation
and Amortization *($ in millions) 2008 2007 2006 2008 2007 2006
Copper $ 2,156 $ 2,186 $ 2,220 $ 1,146 $ 1,459 $ 1,697Coal 2,428 951 1,177 1,226 249 483Zinc 2,071 3,052 2,999 439 1,328 1,614Gold 249 182 143 84 35 31
Total $ 6,904 $ 6,371 $ 6,539 $ 2,895 $ 3,071 $ 3,825
* Operating profit before depreciation and amortization is a non-GAAP financial measure. See USE OF NON-GAAP FINANCIAL MEASURES section for further information.
Copper
2008 Production: 313,000 tonnes
In 2008, we produced copper concentrates at Highland Valley Copper, Duck Pond and at Antamina, in which we have a joint-venture interest. Our Quebrada Blanca and Carmen de Andacollo mines in Chile produce cathode copper. Significant by-product zinc was produced in concentrates at both Duck Pond and Antamina, and by-product molybdenum in concentrates at Highland Valley Copper and Antamina. During the year, we acquired the Relincho copper project in Chile through our acquisition of Global Copper Corp. We also advanced low-risk, high return capital projects that will increase production or mine life at Carmen de Andacollo and Highland Valley Copper, and completed an estimate of a significant inferred resource at Quebrada Blanca.
Copper Production (000 tonnes) Average Copper Price ($/lb) Operating Profit ($ in millions)*
In 2008, our copper operations accounted for 31% of our revenue and 40% of our operating profit before depreciation and amortization.
RevenuesOperating Profit Before Depreciation
and Amortization
($ in millions) 2008 2007 2006 2008 2007 2006
Highland Valley Copper $ 789 $ 1,115 $ 1,413 $ 426 $ 776 $ 1,065
Antamina 569 775 807 368 597 632
Quebrada Blanca 574 215 - 267 71 -
Andacollo 142 46 - 72 9 -
Duck Pond 82 35 - 13 6 -
Total $ 2,156 $ 2,186 $ 2,220 $ 1,146 $ 1,459 $ 1,697
0
100
200
300
400
2004 2005 2006 2007 2008Contained in concentrate Cathodes
$0.00
$1.00
$2.00
$3.00
$4.00
2004 2005 2006 2007 2008US Dollars Canadian Dollars
$0
$500
$1,000
$1,500
$2,000
2004 2005 2006 2007 2008
* Before depreciation and amortization

Teck 2008 Annual Report 13
Production Sales
(000’s tonnes) 2008 2007 2006 2008 2007 2006
Highland Valley Copper 116 136 167 119 137 180
Antamina 77 74 87 76 74 87
Quebrada Blanca 86 30 - 85 32 -
Andacollo 21 7 - 21 7 -
Duck Pond 13 5 - 13 5 -
Total 313 252 254 314 255 267
Markets
Copper While most base metal prices peaked in 2007 and have since been in decline, copper prices peaked in July 2008 at an all time high of US$4.07 per pound. However, during the last half of the year the price fell 69%, resulting in an average annual price of US$3.17 per pound in 2008. This was slightly off the 2007 average of US$3.23 per pound.
In China, apparent annual consumption, as reported by the International Copper Study Group (ICSG), was up 13%, lower than their 2007 growth of 26%. Weak demand early in 2008 in Europe, the United States and Japan accelerated as a lack of confidence in global financial markets caused a pull back in investment and spending around the world.
Copper mine supply was again affected by large unexpected mine production losses. In 2007, global copper mine production losses from plan totalled over 1.0 million tonnes of contained copper due to lower grade ores, labour and weather disruptions, and equipment problems. In 2008, we believe these disruptions totalled close to 1.3 million tonnes of contained copper. Announcements of economic and grade-related production cuts for 2009 are already more than 1.2 million tonnes of contained copper.
Copper stocks on the London Metals Exchange (LME) fell in the first half of 2008 by 40% to just over 100,000 tonnes. Since the middle of July 2008, LME stocks nearly tripled to 340,000 tonnes, the highest levels since early 2004. Copper stocks on Shanghai Futures Exchange increased early in the year, up over 180%, to a high of 68,000 tonnes, but by the end of the year, stood at only 18,000 tonnes. At the end of 2008, total global stocks were up 90,000 tonnes compared to 2007, year end. Total global stocks (producer, consumer, merchant and terminal stocks) stood at 30 days of global consumption while 25-year average levels are estimated at 32 days of global consumption.
Copper Price and LME Inventory Global Demand for Copper Reported Copper Stocks
Continued increases in China’s smelting capacity pushed the global copper concentrate market further into deficit. Although a surplus of copper metal is expected in the global marketplace in 2009, a continuation of mine production disruptions could again push the metal market into deficit.
Molybdenum Molybdenum prices averaged US$29 per pound in 2008, slightly lower than in 2007. Molybdenum prices started the year at US$32.50 per pound and remained between US$30 and US$33 per pound until the end of October when within a month they dropped by 70% to US$9 per pound.
0
100
200
300
400
$0.00
$1.00
$2.00
$3.00
$4.00
2004 2005 2006 2007 2008
Ton
ne
s (0
00
's)
US
$/lb
Tonnes (000's) US$/pound
0
5
10
15
20
1984 1988 1992 1996 2000 2004 2008
(ton
nes
in m
illio
ns)
Rest of the World China
0
5
10
15
20
25
30
35
2004 2005 2006 2007 20080
400
800
1200
1600
Da
ys o
f glo
ba
l co
nsu
mpt
ion
Ton
ne
s (0
00
's)
Tonnes Days

14
Chinese exports remained restricted as quotas were again reduced. Global mine production was estimated to be below demand in 2008, and proposed new projects were not due into the market until at least late 2009. Many of these projects have now been deferred or delayed. In late September, a global decline in the demand for steel resulted in a dramatic and swift series of production cuts designed to offset rising steel inventories. These production cuts resulted in the deferral and cancellation of many supply contracts to the steel industry. Although molybdenum was one of the last inputs affected, the rapid liquidation of high priced molybdenum inventories caused the most significant decline of any metal in 2008. With molybdenum prices trading below US$10 per pound going into 2009, several major projects have announced economic delays and deferrals. Junior and developing primary molybdenum miners are now finding it difficult to raise necessary financing. The lack of investment in new projects could have long-term effects on supply when demand recovers.
Operations
Highland Valley Copper Mine We have a 97.5% interest in Highland Valley Copper, located in south central British Columbia. Operating profit before depreciation and amortization was $426 million in 2008 compared with $776 million in 2007 and $1.1 billion in 2006. The reduction in Highland Valley’s 2008 operating profit was due mainly to a 13% decrease in copper sales volumes driven by the lower production levels and negative pricing adjustments of $185 million compared with positive pricing adjustments of $18 million in 2007. Highland Valley Copper is executing a two-phase mine life extension that requires push backs of the east and west walls of the Valley pit, which will facilitate mining until 2019. East wall stripping will be completed in 2009, enabling mining to 2013 with average production of 125,000 tonnes of copper per year. West wall stripping will start in late 2009, although the majority of west wall stripping originally planned for 2009 has been deferred to 2010. West wall stripping is scheduled for completion in 2013. Mining equipment, including two shovels, eight haul trucks, a production loader, and several large support equipment units were added to the mine’s fleet in 2008, properly positioning Highland Valley to execute the life of mine plan extension requirements. Highland Valley’s 2008 copper production was 119,300 tonnes, which was 14% lower than in 2007. The lower production was due to a higher proportion of material in the feed from the Lornex pit and the mill processed lower grade, softer ore in 2008 at lower recoveries. Molybdenum production was slightly higher than 2007 levels at 4.2 million pounds. During the first half of 2009, Highland Valley Copper will continue to draw a large proportion of clay-bearing ore from the Lornex pit and recoveries are expected to remain similar to 2008 levels. Recoveries are expected to improve to between 86% and 88% in the second half of the year, together with higher copper grades. Highland Valley’s production in 2009 is estimated at 130,000 tonnes of copper and 6.5 million pounds of molybdenum.
Antamina Mine We have a 22.5% interest in the Antamina mine, a large copper and zinc mine at high elevation in Peru. Our partners are BHP Billiton (33.75%), Xstrata plc (33.75%) and Mitsubishi Corporation (10%). Our share of operating profit before depreciation and amortization was $368 million in 2008 compared with $597 million in 2007 and $632 million in 2006. The reduction in Antamina’s 2008 operating profit compared with 2007 was due mainly to lower average realized metal prices, and higher operating and distribution costs. Antamina’s copper production in 2008 was 343,700 tonnes, or 4% higher than in 2007. Zinc production increased by 19% to 347,800 tonnes in 2008 as a result of higher ore grades and the processing of a greater amount of copper-zinc ores in the year. Molybdenum production totalled 13.4 million pounds, 5% lower than in 2007. Ore throughput was affected by a winding failure in the Semi Autogenous Grinding (SAG) mill motor in late 2007 and early in 2008, requiring mill down time and reduced milling rates throughout the year.

Teck 2008 Annual Report 15
Antamina engaged in several major projects during 2008, including further raising of the tailings dam, finalization and commissioning of a pebble crushing circuit, commencement of new camp facilities, and the pre-feasibility study of a significant expansion of milling and flotation capacity. Antamina’s production in 2009 is expected to be 335,000 tonnes of copper, 400,000 tonnes of zinc and 9 million pounds of molybdenum. Work will continue on a SAG mill by-pass that will allow continued operation of the ore processing circuit during repair and replacement of SAG mill motor components, and the potential expansion project will be progressed through further study and engineering design.
Quebrada Blanca Mine Quebrada Blanca is located in northern Chile, 240 kilometres southeast of the City of Iquique, at 4,400 metres elevation. We own 76.5% of Quebrada Blanca. Our partners are Inversiones Mineras S.A. (IMSA) 13.5% and Empresa Nacional de Minera (ENAMI) 10%. The operation mines ore from an open pit and leaches the ore to produce copper cathodes via a conventional solvent extraction and electro-winning processes (SX-EW). Plant capacity is 85,000 tonnes per year. Operating profit before depreciation and amortization was $267 million in 2008 compared with $71 million in 2007 when operating results reflected our ownership from late August 2007. In addition, we also recorded a $149 million impairment charge against the goodwill allocated to Quebrada Blanca as a result of the decline in copper prices. The Quebrada Blanca supergene ore body has a mine life to 2014 with cathode production continuing until 2016. Production from Quebrada Blanca in 2008 was 85,400 tonnes representing a new production record. Similar production is expected for 2009. Approximately 30,000 metres of in-fill drilling was completed to better define the hypogene resources below the existing supergene pit. In March 2008, we announced a new 1.03 billion tonne inferred resource grading 0.5% copper and 0.020% molybdenum, representing 11 billion pounds of contained copper and 450 million pounds of contained molybdenum. A scoping study was commenced to evaluate development alternatives for a future concentrator to exploit the hypogene resource. This work includes evaluating alternative plant site locations, water supply alternatives, power supply, concentrate pipeline routes and potential port sites. The scoping study is expected to be completed at the end of the first quarter of 2009. A limited program including additional drilling and metallurgical testing is planned for 2009. As part of our capital spending reductions for 2009, we have deferred further work on the study for the potential hypogene project.
Carmen de Andacollo Mine We have a 90% interest in Carmen de Andacollo mine in Chile, located 350 kilometres north of Santiago, with the remaining 10% owned by ENAMI. Operating profit before depreciation and amortization was $72 million in 2008 compared with $9 million in 2007 when operating results reflected our ownership from late August 2007. In addition, we also recorded a $186 million impairment charge against the goodwill allocated to Carmen de Andacollo as a result of the decline in copper prices. Carmen de Andacollo was awarded the John T. Ryan award in 2008 for safety performance in 2007. At the end of 2008, the mine had recorded three years without a lost-time accident. Carmen de Andacollo produced 21,100 tonnes of copper cathode in 2008, while sales volumes were similar at 20,900 tonnes. The mine’s cathode copper production for 2009 is estimated at 17,000 tonnes. The development of Carmen de Andacollo’s concentrate project is progressing according to plan. The development consists of the construction of a 55,000 tonne per day concentrator and tailings facility and is expected to produce 76,000 tonnes (168 million pounds) of copper and 53,000 ounces of gold in concentrate annually, on average, over the first 10 years of the project. The capital cost forecast for the project is US$410 million using US$1 = 535 Chilean pesos exchange rate, of which US$249 million has been spent from inception to December 31, 2008. The project is expected to be commissioned in the fourth quarter of 2009 and achieve commercial production in the first half of 2010.

16
Duck Pond Operations The Duck Pond copper-zinc operation is located in central Newfoundland and achieved commercial production in April 2007. Duck Pond’s operating profit before depreciation and amortization was $13 million in 2008 compared with $6 million in 2007 when operating results reflected our ownership from late August 2007. In addition, we also recorded an impairment charge of $116 million against Duck Pond and wrote off $10 million of goodwill as a result of the decline in copper and zinc prices and the mine’s short life. Copper production was 12,800 tonnes while zinc production was 19,000 tonnes. Mill throughput and recovery targets were not achieved due to lack of available ore feed from the underground workings. Production was also affected by lower than planned feed grades due to dilution. Development of the lower ore zones is expected to be complete by the end of the second quarter of 2009, which will allow access to new production areas. Duck Pond’s production in 2009 is estimated at 17,000 tonnes of copper and 25,000 tonnes of zinc in concentrate.
Technology
Cominco Engineering Services Ltd. (CESL) Our proprietary hydrometallurgical technology has been developed over many years by CESL to provide an environmentally superior method for treating copper, copper-gold and nickel-copper concentrates, particularly those that present challenges to conventional smelting due to their composition. Our efforts are focused on the final commissioning and start-up of the Vale 10,000 tonne per year copper plant in Carajas, Brazil, and the development and testing of an appropriate flow sheet to process a bulk copper-nickel concentrate from Mesaba in northern Minnesota. We continue to make process improvements, and to pursue internal and third party opportunities where the CESL process and the expertise of our staff can offer economic solutions for projects with challenging metallurgical issues or other logistical problems.
Exploration and Development Chile, Turkey, Canada, the United States, Mexico, Peru, Brazil, Argentina, Australia and Namibia were the main jurisdictions for porphyry copper, porphyry copper-gold, sediment hosted copper, and iron oxide copper-gold exploration in 2008. Approximately $78 million in project costs were incurred on our copper projects in 2008. Expenditures on copper exploration will be significantly reduced in 2009 with the main focus on Chile.
Galore Creek Project In August 2007, we formed a 50/50 partnership with NovaGold Resources Inc. to develop the Galore Creek copper-gold deposit in northwest British Columbia. After suspending construction activities in November 2007 due to escalating cost estimates and reduced operating margins, studies were initiated in 2008 aimed at re-evaluating and optimizing the project by defining a more realistic and lower risk development alternative. Alternative plant site and tailings locations were evaluated. In February 2009, we amended certain provisions of the partnership agreement relating to the Galore Creek Project. Under the amended agreement, our remaining committed funding on Galore Creek has been reduced to approximately $36 million, which must be contributed by December 31, 2012. While we are making these committed contributions, which will represent 100% of project funding, we will have a casting vote on the Galore Creek management committee with respect to the timing and nature of expenses to be funded. The new funding arrangements replace the arrangements agreed by to us and NovaGold in November 2007, pursuant to which we had committed to spend an additional $72 million on studies to reassess the Galore Creek Project, of which $15.8 million had been spent to December 31, 2008, in addition to our share of other project costs. The project remains on care and maintenance.

Teck 2008 Annual Report 17
Relincho Project The Relincho copper project, located in central Chile, was acquired from Global Copper Corp. in August 2008. A total of 49,100 metres of in-fill drilling was completed on the property in 2008. In the third quarter, a scoping study was initiated to investigate various development alternatives, to identify potential power and water sources, and to consider access and concentrate transport aspects. The scoping study is expected to be completed at the end of the first quarter of 2009.
Mesaba Project A variety of work was carried out on the Mesaba copper-nickel project in northern Minnesota in 2008. A total of 13,900 metres of resource definition drilling was completed in 2008. Drilling was also carried out to provide material for a bulk sample. This sample was treated at a research facility in Minnesota to produce nine tonnes of copper-nickel concentrate which was delivered to our CESL test facility. This sample is being processed through the hydrometallurgical pilot plant at CESL to assess the feasibility of treatment for the production of copper and nickel.
Carrapateena Project A preliminary scoping study was carried out to assess the potential development of an underground copper-gold mine at the Carrapateena property in South Australia. Drilling on the project was completed in February 2008. A resource update was completed in the fall. The mineralized zone occurs at depths from 500 to 1,000 metres which precludes open pit mining. Preliminary metallurgical test work, environmental baseline studies and capital and operating cost estimates were carried out as part of the study. We have the right to acquire 100% of the project by making a payment to the vendor equal to 66% of its fair market value with credit for our expenditures on the project to date. We are in discussions with the vendor regarding the exercise of our option.
Petaquilla In March 2008, we exercised our right to acquire a 26% interest in Minera Petaquilla S.A. (MPSA), the Panamanian company that holds the Petaquilla concession, by committing to participate in development work plans and budgets. We agreed with Inmet Mining Corporation (Inmet), which holds a 48% equity interest in MPSA, on an interim basis, that Inmet would act as the operator of the project and would fund project expenditures on our behalf. In 2008, Inmet acquired all of the outstanding common shares of Petaquilla Copper Ltd., which owns a 26% interest in MPSA. As part of our plan to reduce our debt, we withdrew from the Petaquilla project in accordance with the arrangements between us and Inmet and therefore have no further funding obligations in respect of this project. As a result, we recorded an impairment charge of $22 million in the fourth quarter of 2008.
Coal
2008 Production: 23 million tonnes (100% Basis)
Through October 29, 2008, our coal business included a 52% direct and indirect interest in the Teck Coal Partnership (formerly the Elk Valley Coal Partnership). We increased our ownership to 100%, effective October 30, 2008, with the purchase of the assets of Fording Canadian Coal Trust. Teck Coal operates five metallurgical coal mines in British Columbia and one in Alberta. Together, these mines represent the world’s second largest exporter of seaborne hard coking coal, substantially all of which is used in the production of steel.

18
In 2008, our coal operations accounted for 35% of revenue and 42% of operating profit before depreciation and amortization.
($ in millions) 2008 2007 2006
Revenues $ 2,428 $ 951 $ 1,177
Operating profit before depreciation and amortization $ 1,226 $ 249 $ 483
Capital expenditures $ 118 $ 35 $ 18
Production volumes-100% basis (000’s tonnes) 23,009 22,561 21,790
Sales volumes-100% basis (000’s tonnes) 22,978 22,677 22,614
Markets High quality hard coking coal was in strong demand from integrated steel mills at the beginning of 2008. High steel prices and production levels were driven largely by the construction boom in China and other developing nations, while the steel industry was running at full capacity in the mature economies of Western Europe and the United States. Concurrently, the supply of high quality hard coking coal, which had been failing to keep pace with demand by the second half of 2007 due to mine and infrastructure capacity constraints, was disrupted by severe flooding in Australia in January 2008. The confluence of strong demand and diminished supply resulted in the tripling of coal price settlements for the 2008 coal year, which runs April 1, 2008 through March 31, 2009. At the time coal settlements were completed, our average contracted US dollar coal price for the 2008 coal year was expected to be US$275 per tonne. During 2008, the financial crisis and resulting loss of consumer confidence worldwide affected the mainstream economy and caused a sudden reversal in the steel markets. By the end of 2008, most integrated steel mills were reducing their production levels and raw material consumption in response to fewer orders and lower steel prices. With the large Australian coal producers generally having recovered from the flooding early in the year, the seaborne metallurgical coal market ended 2008 in a state of oversupply. Recently announced production cuts by metallurgical coal producers are expected to bring production levels closer to demand in the near term. As steel production was curtailed and the steel mills were faced with excess raw material stockpiles, they began to defer coal shipments on short notice. We responded by replacing a portion of these sales through the sale of thermal coal under market tenders at then-prevailing spot prices. Accordingly, coal sales volume of 23 million tonnes was at the low end of our guidance range and our average selling price of US$205 per tonne for calendar year 2008 was at the top end of our guidance range. Our US dollar coal prices and volumes for the 2008 coal year remain fixed under contract through March 31, 2009. However, our customers largely determine the timing of deliveries and it is not uncommon for coal sales volumes to be carried over and delivered in the following coal year. A significant amount of carryover tonnage is anticipated at the end of the 2008 coal year due to the reduction in coal shipments in late 2008 and anticipated shipments through early 2009. Contract negotiations for the 2009 coal year, which may impact the pricing on the remaining 2008 coal year carryover tonnage, have not yet concluded. Current market sentiment indicates that US dollar prices will decrease substantially for the 2009 coal year. The tonnage levels contracted for 2009 will also be impacted by the expected lower steel production and the duration of the global economic downturn. It is anticipated that the global steel and metallurgical coal markets will continue to experience extreme volatility in the coming years. The rapid urbanization and industrialization of the developing nations is expected to continue, which should drive demand for steel and high quality hard coking coal once the current economic crisis passes. The development of new sources of high quality hard coking coal is expected to slow in the near term due to the lack of available investment capital and lower coal prices, which will likely contribute to imbalances in supply and demand in the future. Furthermore, metallurgical coal suppliers now appear to be responding more quickly to situations of oversupply with production cuts, which should result in shorter pricing downturns than were experienced in the past.

Teck 2008 Annual Report 19
Operations Coal sales volumes of 23 million tonnes increased marginally from 2007 as continuing strong demand and fewer weather-related disruptions during the first three quarters of 2008 were offset by a marked reduction in deliveries in late 2008 as our customers took less coal in response to lower steel production. Average US dollar coal prices for the 2008 calendar year doubled to US$205 per tonne due to the very high-price settlements for the 2008 coal year that began April 1, partially offset by the carry over of approximately 3 million tonnes of 2007 coal year business and some incremental thermal coal sales made at prevailing spot prices in late 2008. Average realized Canadian dollar coal prices also more than doubled to $220 per tonne in 2008 as the average US/Canadian dollar exchange rate was similar year-over-year. Teck Coal’s operating profit before depreciation and amortization was $1.2 billion in 2008, up significantly from $249 million in 2007 due to the substantial increase in the coal price and our acquisition of Fording’s 60% interest in Teck Coal in October 2008 that provided ten months of operating profit at the 40% ownership level and two months at 100% compared with 40% for all of 2007. This was partially offset by the effect of higher strip ratios, increases in labour, fuel and other input costs and higher port loading charges at Westshore Terminals, which are variable in part with average coal sales prices. In addition, contractual rail rates were higher for eastbound coal shipments, which represent approximately 10% of our sales volumes.
Zinc
2008 Production: 663,000 tonnes of zinc in concentrate 270,000 tonnes of refined zinc
Our zinc business unit includes our Trail refining and smelting complex, the Red Dog Operations and the Pend Oreille Operations. Our Lennard Shelf operation in Western Australia was permanently closed in August 2008, and Pend Oreille was placed on care and maintenance in February 2009.
Zinc Production (000 tones) Average Zinc Price ($/lb) Operating Profit ($ in millions)*
In 2008, our zinc operations accounted for 30% of revenue and 15% of operating profit before depreciation and amortization.
Revenues Operating Profit (Loss) Before Depreciation and Amortization
($ in millions) 2008 2007 2006 2008 2007 2006
Trail $ 1,442 $ 1,839 $ 1,802 $ 208 $ 396 $ 442
Red Dog 703 1,434 1,539 240 885 1,138
Pend Oreille 41 70 88 (15) 17 52
Lennard Shelf 26 47 - (18) 3 -
Other 50 49 38 7 11 7
Inter-Division Sales (191) (387) (468) 17 16 (25)
Total $ 2,071 $ 3,052 $ 2,999 $ 439 $ 1,328 $ 1,614
0
200
400
600
800
1000
1200
2004 2005 2006 2007 2008Refined Contained in concentrate Other divisions
$0.00
$0.50
$1.00
$1.50
$2.00
2004 2005 2006 2007 2008US Dollars Canadian Dollars
$0
$300
$600
$900
$1,200
$1,500
$1,800
2004 2005 2006 2007 2008
* Before depreciation and amortization

20
Production Sales
(000’s tonnes) 2008 2007 2006 2008 2007 2006
Refined zinc
Trail 270 292 296 266 292 290
Contained in concentrate
Red Dog 515 575 558 529 576 536
Pend Oreille 35 29 34 35 29 35
Lennard Shelf 16 21 - 18 18 -
Other business units 97 74 35 96 73 36
Total 663 699 627 678 696 607
Markets
Zinc Even with a global slowing in zinc consumption, growth estimates for zinc in 2008 are estimated at 1.5% according to the International Lead and Zinc Study Group (ILZSG). China accounted for all the growth, more than offsetting declines in the United States, Japan and Western Europe. London Metal Exchange (LME) stocks rose by 164,350 tonnes to 253,500 tonnes in 2008. Total reported refined inventories (LME, Shanghai Futures Exchange (SHFE), Producer, Consumer and Merchant) at year end were about 796,000 tonnes, or 25 days of global consumption, still well below the 25-year average of 39 days. Prices of US$1.08 per pound at the start of the year fell to US$0.51 per pound by year end. In 2008, zinc prices averaged US$0.85 per pound, a decline of 42% from the 2007 average of US$1.47 per pound. China imported 11% more zinc concentrates than in 2007 due to growth in refined production and capacity, while domestic mine production was reported to be flat versus 2007. In 2008, China was a net importer of 112,000 tonnes of refined zinc, versus net exports of 126,000 tonnes in 2007.
Zinc Price and LME Inventory Global Demand for Zinc Reported Zinc Stocks
The zinc concentrate market in 2008 was close to a balanced market. Smelters had sufficient concentrates to supply their needs but no significant stockpiles were built. The profitability of zinc mining came under pressure as the price of zinc fell steadily throughout the year. Closures of mines and production cutbacks began in July 2008. As the price declined through the balance of the year, mine closures accelerated, reducing production by an estimated 580,000 tonnes in 2008. The closures and cutbacks affected refined production, and we estimate close to 200,000 tonnes of refined zinc was cut from 2008 global planned production.
0
200
400
600
800
1000
$0.00
$0.50
$1.00
$1.50
$2.00
$2.50
2004 2005 2006 2007 2008
Ton
ne
s (0
00
,s)
US
$/lb
Tonnes (000's) US$/pound
0
2
4
6
8
10
12
1984 1988 1992 1996 2000 2004 2008
(tonn
es in
milli
ons)
Rest of World China
0
7
14
21
28
35
42
0
200
400
600
800
1000
1200
2004 2005 2006 2007 2008
Da
ys o
f glo
ba
l co
nsu
mpt
ion
Ton
ne
s (0
00
's)
Tonnes Days

Teck 2008 Annual Report 21
Lead
The global market for refined lead moved into surplus in 2008 after four consecutive years of deficits. As a result, lead prices fell throughout the year to US$0.43 per pound. The LME cash price average of US$0.95 per pound in 2008 was down from the 2007 average of US$1.17 per pound. LME stocks at the end of 2008 remained similar to 2007 levels at 45,200 tonnes.
Lead Price and LME Inventory Global Demand for Lead Reported Lead Stocks
For the seventh consecutive year, global refined lead consumption was above the 25-year trend growth of 1.6% per year. China’s growth was greater than the rest of the world combined, as China’s electric bike fleet increased the number of bikes sold by an estimated 10%. Electric bikes in China now account for 27% of China’s refined lead consumption. The export taxes instituted by China in 2007 continued to have an effect on lead exports from China. China exported on average 17,000 tonnes per month in 2007, while in the first six months of 2008 exports averaged 4,000 tonnes per month. In the second half of 2008, China turned from an exporter of refined lead to an importer.
Operations
Trail Operations Our Trail Operations, located in British Columbia, include one of the world’s largest fully-integrated zinc and lead smelting and refining complexes, and the Waneta hydroelectric dam and transmission system. The metallurgical operations at Trail produce refined zinc and lead, and a variety of precious and specialty metals, chemicals and fertilizer products. The Waneta dam provides power to the metallurgical operations. Surplus power is sold through the transmission system to customers in British Columbia and the United States. Trail metal operations contributed $146 million to operating profits before depreciation and amortization in 2008 compared with $336 million in 2007, with the reduction due primarily to lower prices for both lead and zinc and lower zinc sales. These lower zinc sales were partially offset by higher lead sales volumes and higher contribution margins from specialty metals and sulphur products. Refined zinc production of 270,000 tonnes was 22,000 tonnes lower than in 2007. A series of technical and operational problems in the leaching and purification areas, which were resolved early in the third quarter, affected production. Additionally, in response to changing market conditions we reduced refined zinc production by approximately 4,000 to 5,000 tonnes per month, commencing in November 2008. This 20% curtailment, which will remain in place until at least May 2009, leaves the operation with sufficient metal to meet customer needs. Refined lead production will not be affected. Power sales are expected to increase by approximately 15 gigawatt hours per month during the curtailment, improving profitability. Refined lead production of 85,000 tonnes exceeded 2007 levels by 8,600 tonnes, but was lower than plan due to operational issues in the drossing plant. We achieved a refined germanium production record through improved recovery initiatives. The Waneta dam is one of several hydroelectric generating plants in the region operated through contractual arrangements under which we currently receive approximately 2,750 gigawatt hours of energy entitlement per year, regardless of the water flow available for power generation. We sell energy surplus to our needs to third parties at market rates.
0
30
60
90
120
$0.00
$0.50
$1.00
$1.50
$2.00
2004 2005 2006 2007 2008
Ton
ne
s (0
00
's)
US
$/lb
Tonnes (000's) US$/lb
0
3
6
9
1984 1988 1992 1996 2000 2004 2008
(tonn
es in
milli
ons)
Rest of World China
0
5
10
15
20
0
80
160
240
320
2004 2005 2006 2007 2008
Da
ys o
f glo
ba
l co
nsu
mpt
ion
Ton
ne
s (0
00
's)
Tonnes Days

22
Higher average power prices boosted operating profit before depreciation and amortization from surplus power sales to $62 million in 2008 from $60 million the previous year. Sales volumes were down 11% as a result of generation reductions in the spring during off peak hours when prices were low. Capital expenditures for the year totalled $44 million. The most significant projects completed were the replacement of an acid storage tank and upgrades to the silver refinery ventilation and security controls. The remaining expenditures were directed to upgrade projects, each totalling less than $2 million. In addition, we completed upgrade work on the Waneta dam electrical infrastructure at a cost of $6 million. In 2009, we expect to produce 85,000 tonnes of refined lead and 17.6 million ounces of silver. We are curtailing refined zinc production by about 20% or about 4,000 to 5,000 tonnes per month until at least May, at which time production rates may be increased depending on market conditions. Our current forecast for refined zinc production is 270,000 tonnes.
Red Dog Operations Red Dog’s location in northwest Alaska exposes the operation to severe weather and winter ice conditions, which can significantly impact production and sales volumes and operating costs. In addition, the mine’s bulk supply deliveries and all concentrate shipments occur during a short ocean shipping window that normally runs from early July to late October. Because of this short ocean shipping window, Red Dog’s sales volumes are normally higher in the last six months of the year, which can result in significant volatility in its quarterly earnings, depending on metal prices. Zinc and lead production in 2008 declined by 10% due to lower mill availability. The availability was reduced by mechanical problems including the failure of a crusher shaft. Site operating costs increased 9% over 2007, resulting in a 20% increase in unit operating costs due to both higher fuel and supply costs, and lower concentrate production. Red Dog’s 2008 shipping season began on July 11 and was completed on October 27. Final tonnages shipped for 2008 were 916,000 tonnes of zinc concentrate and 245,000 tonnes of lead concentrate. Due to sea-ice and adverse weather conditions, the last vessel departed without a full shipment. Metal in concentrate available for sale from January 1, 2009 to the beginning of next year’s shipping season is 221,000 tonnes of zinc in concentrate. All off site lead inventories had been sold as at December 31, 2008. In accordance with the operating agreement governing Red Dog, the royalty to NANA Regional Corporation Inc. (NANA) is now at 25% of net proceeds of production. The NANA royalty charge in 2008 was US$92 million compared with US$190 million in 2007. The net proceeds royalty will increase by 5% every fifth year to a maximum of 50%. The increase to 30% of net proceeds of production will occur in 2012. NANA has advised us that it ultimately shares approximately 62% of the royalty with other Regional Alaskan Native Corporations pursuant to section 7(i) of the Alaskan Native Claims Settlement Act. Red Dog’s operating profit before depreciation and amortization declined significantly to $240 million in 2008 from $885 million in 2007 and $1.1 billion in 2006. The reduction in 2008 operating profit compared with 2007 was due mainly to the lower realized price of zinc and lead and a 9% reduction in zinc sales volumes reflecting the lower production levels. Capital spending in 2008 included US$15 million for tailings dams and US$26 million on other sustaining capital projects and US$4 million for drilling and other costs on the Aqqaluk deposit. We continue with the long-term dewatering of our nearby shallow shale-gas exploration wells. The five-hole system commissioned in the first half of 2008 is operated continuously throughout the year. Although additional drilling and capital expenditures are on hold, we will continue to operate the dewatering system in 2009 with gas flow tests conducted when the formation has been sufficiently dewatered. The flow tests will form the basis for decisions related to the economic feasibility of converting from diesel-fired power to natural gas obtained from the shale formations. We expect 2009 production to be approximately 570,000 tonnes of zinc in concentrate and 125,000 tonnes of lead in concentrate.
Teck 2008 Annual Report 23
Water Discharge and Aqqaluk Permitting
The approval process for the Aqqaluk Supplemental Environmental Impact Statement (SEIS) and the time-table for the issuance of the renewal of our operation’s water discharge permit remain largely on schedule. We anticipate that the renewed permit will be issued during the third quarter of 2009. The issuance of the permit is subject to approval by any party who has commented on the draft SEIS. The 2007 renewal of our water permit was appealed and the permit was subsequently withdrawn over procedural concerns. An appeal of the pending permit is also possible. This could result in a stay of the issuance of the permit and delay access to the Aqqaluk deposit. At current production rates, we estimate that the main pit will be exhausted by the end of the first quarter of 2011. If the permit is delayed beyond the first quarter of 2010, production at Red Dog could be limited or curtailed. The mine is operating under a consent decree as the existing permit contains end-of-pipe limitations on total dissolved solids (TDS) that the mine cannot meet on a sustained basis. TDS are non-toxic salts created because of the water treatment process to eliminate metals from the mine’s discharge water. The largest constituent of this TDS is gypsum, a common component in “hard” water. Pending approval of the SEIS and the issuance of the renewal permit, we will continue to operate under the existing water discharge permit. The mine’s discharge complies with the criteria in the consent decree and those anticipated in the renewed discharge permit, which the EPA has determined to be fully protective of the environment. However, there can be no assurance that the past and ongoing violations of the existing permit will not result in other civil claims. Appeals of the SEIS, renewed permit or other permits could delay the mining of Aqqaluk beyond 2010. In addition to treating mill effluent and runoff from areas disturbed by mining, we collect and treat run-off from areas where naturally occurring acidic drainage historically impacted water quality. As a result, water quality has improved and fish now spawn in areas where pre-mining conditions caused fish mortality.
Pend Oreille Operations Our Pend Oreille mine, located in north-eastern Washington State, produces zinc and lead concentrates, which are delivered to our Trail smelter 80 kilometres to the northwest, in British Columbia. Mine production in 2008 was 35,000 tonnes of zinc and 5,700 tonnes of lead compared with 28,800 tonnes of zinc and 4,200 tonnes of lead in 2007. Zinc production was 6,200 tonnes higher in 2008 than in 2007 as a result of increased throughput and higher-grade ore, coupled with better mill recoveries. The mine incurred a $15 million operating loss before depreciation and amortization in 2008 compared with a profit of $17 million in 2007 due to significantly lower zinc and lead prices. Due to reduced metal demand and persistent weakness in zinc prices, we also recorded a pre-tax impairment charge of $51 million and the mine was shut down in February 2009, affecting approximately 165 employees. We have transitioned the operation to care and maintenance with a view to a potential restart in the event of a significant market improvement.
Lennard Shelf Operations In August, 2008, together with our partner Xstrata Zinc, we permanently closed the Pillara mine at Lennard Shelf in Western Australia. Production from the Pillara mine was 30,800 tonnes of zinc and 9,000 tonnes of lead in concentrate in 2008 compared with 42,100 tonnes of zinc and 12,400 tonnes of lead in 2007. Our share of the operating loss in 2008, before depreciation and amortization, was $18 million compared with a profit of $3 million in 2007. We also recorded a pre-tax impairment charge of $12 million due to the closure.
Technology Marketing The Product Technology Centre (PTC) in Mississauga, Ontario, supports our zinc customers by developing and implementing technologies and alloys for continuous and general galvanizing. In addition, the group supports the zinc market in collaboration with the International Zinc Association by pursuing independent research and development related to zinc-based batteries.
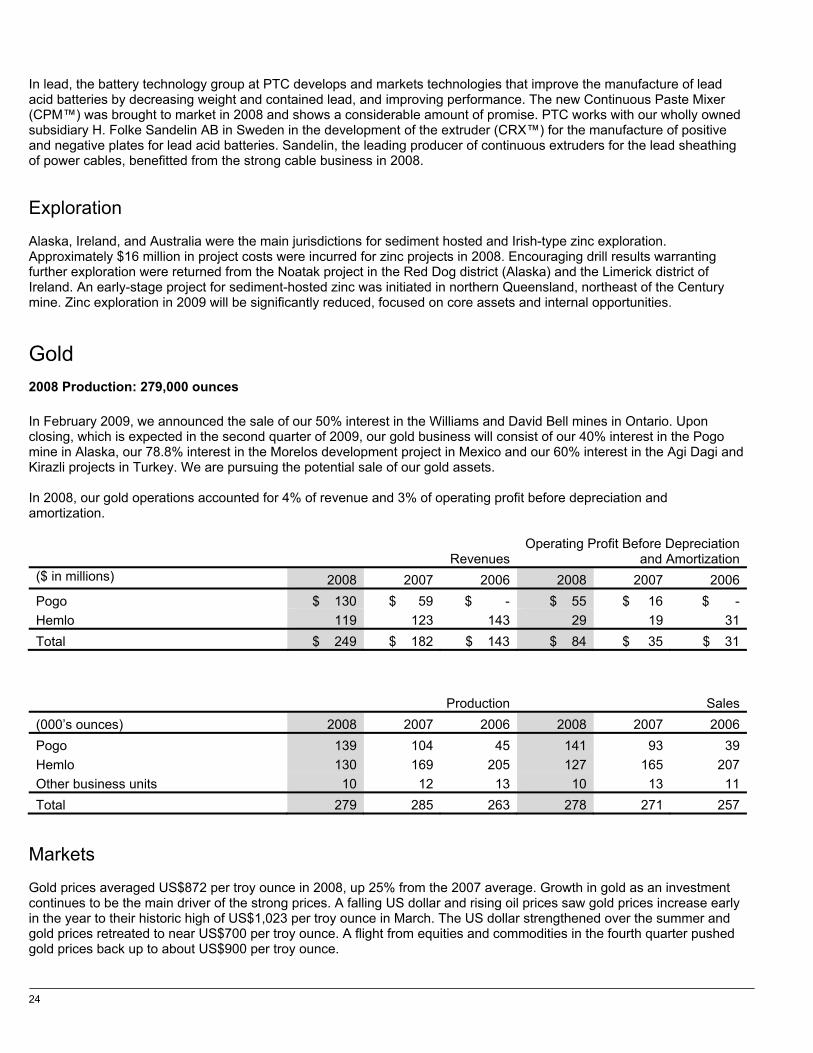
24
In lead, the battery technology group at PTC develops and markets technologies that improve the manufacture of lead acid batteries by decreasing weight and contained lead, and improving performance. The new Continuous Paste Mixer (CPM™) was brought to market in 2008 and shows a considerable amount of promise. PTC works with our wholly owned subsidiary H. Folke Sandelin AB in Sweden in the development of the extruder (CRX™) for the manufacture of positive and negative plates for lead acid batteries. Sandelin, the leading producer of continuous extruders for the lead sheathing of power cables, benefitted from the strong cable business in 2008.
Exploration Alaska, Ireland, and Australia were the main jurisdictions for sediment hosted and Irish-type zinc exploration. Approximately $16 million in project costs were incurred for zinc projects in 2008. Encouraging drill results warranting further exploration were returned from the Noatak project in the Red Dog district (Alaska) and the Limerick district of Ireland. An early-stage project for sediment-hosted zinc was initiated in northern Queensland, northeast of the Century mine. Zinc exploration in 2009 will be significantly reduced, focused on core assets and internal opportunities.
Gold
2008 Production: 279,000 ounces
In February 2009, we announced the sale of our 50% interest in the Williams and David Bell mines in Ontario. Upon closing, which is expected in the second quarter of 2009, our gold business will consist of our 40% interest in the Pogo mine in Alaska, our 78.8% interest in the Morelos development project in Mexico and our 60% interest in the Agi Dagi and Kirazli projects in Turkey. We are pursuing the potential sale of our gold assets. In 2008, our gold operations accounted for 4% of revenue and 3% of operating profit before depreciation and amortization.
RevenuesOperating Profit Before Depreciation
and Amortization($ in millions) 2008 2007 2006 2008 2007 2006
Pogo $ 130 $ 59 $ - $ 55 $ 16 $ -
Hemlo 119 123 143 29 19 31
Total $ 249 $ 182 $ 143 $ 84 $ 35 $ 31
Production Sales
(000’s ounces) 2008 2007 2006 2008 2007 2006
Pogo 139 104 45 141 93 39
Hemlo 130 169 205 127 165 207
Other business units 10 12 13 10 13 11
Total 279 285 263 278 271 257
Markets Gold prices averaged US$872 per troy ounce in 2008, up 25% from the 2007 average. Growth in gold as an investment continues to be the main driver of the strong prices. A falling US dollar and rising oil prices saw gold prices increase early in the year to their historic high of US$1,023 per troy ounce in March. The US dollar strengthened over the summer and gold prices retreated to near US$700 per troy ounce. A flight from equities and commodities in the fourth quarter pushed gold prices back up to about US$900 per troy ounce.

Teck 2008 Annual Report 25
Global mine production fell by 4% in 2008 to 2,385 tonnes while scrap supply rose 13% and net official sector sales fell by 43%. Overall supply fell 4% to 3,772 tonnes. Supply is expected to be marginally higher in 2009 with mine supply and scrap supply up marginally and net official sector sales likely to remain flat. Global fabrication demand declined by 8% in 2008 to 2,824 tonnes, with an 11% fall in jewellery demand accounting for most of the drop. Demand for jewellery in the US fell 25%, Europe fell 14% and the Indian Sub Continent fell 16% on a year-over-year basis. Expectations for 2009 are for continued weakness in fabrication demand. However, persistent global financial uncertainty may continue to provide support for gold as an investment vehicle.
Gold Production (000 ounces) Average Gold Price ($/oz) Operating Profit ($ in millions)*
Operations
Pogo Mine The Pogo gold mine is located 145 kilometres southeast of Fairbanks, Alaska. We hold a 40% interest and are the operator of the mine. Pogo is a joint venture with Sumitomo Metal Mining Co. Ltd. (51%) and Sumitomo Corporation (9%). The mine reached commercial production in April 2007. Pogo’s 2008 gold production was 347,000 ounces. This significant increase over 2007 production of 260,000 ounces was primarily due to successfully stabilizing operations following start up. Site operating costs increased by 31%, which were partly due to higher energy and mine consumable costs as well as increased mill throughput. Our share of the operating profit before depreciation and amortization was $55 million in 2008 compared to $16 million in 2007. A higher gold price largely contributed to the improved operating profit. Gold production in 2009 is expected to be 355,000 ounces with higher ore throughput being offset by lower grades. Capital expenditures are estimated at US$9 million primarily for the replacement of mine equipment and infrastructure. Current proven and probable reserves provide sufficient ore through to 2016. Exploration is currently focused on near mine targets to extend the life of the existing operation.
Hemlo Operations The Hemlo operations, which consist of the Williams and David Bell mines, are located approximately 350 kilometres east of Thunder Bay, Ontario. In February 2009, we announced the sale of our 50% interest in the Hemlo operations to our joint venture partner, Barrick Gold Corporation for US$65 million. We expect the transaction to close in the second quarter 2009, which will result in the recognition of approximately $60 million pre-tax gain on closing. Hemlo’s 2008 gold production was 260,000 ounces representing a 23% decrease from 2007. The decline in production was due primarily to lower ore grade and decreased throughput, reflective of a declining grade and production profile of a maturing operation. Our share of Hemlo’s operating profit before depreciation and amortization was $29 million in 2008 compared to $19 million in 2007 and a $31 million in 2006.
0
50
100
150
200
250
300
2004 2005 2006 2007 2008Gold Division Other Divisions
$0
$200
$400
$600
$800
$1,000
2004 2005 2006 2007 2008US Dollars Canadian Dollars
0
20
40
60
80
100
2004 2005 2006 2007 2008
* Before depreciation and amortization

26
Exploration and Development Turkey, Canada and Mexico were the main jurisdictions for gold exploration with expenditures totalling approximately $15 million. Progress on the Morelos project in Mexico was inhibited by road blockades raised by a minority group of local landholders. Feasibility level drilling was completed on the Guajes West zone, but completion of in-fill drilling on the El Limon zone was prevented by the blockades. Feasibility engineering was not started pending resolution of the community issues. Preliminary geological modelling work on the Agi Dagi - Kirazli project in Turkey was updated in 2008 to include results from an additional 81 drill holes. No engineering or mine planning work has yet been carried out for the project.
Energy Our energy business includes a 20% interest in the Fort Hills Energy Limited Partnership, which is developing the Fort Hills oil sands project located in Northern Alberta, and our 50% interest in various oil sand leases that we jointly own with UTS Energy Corporation (UTS). Our share of the estimated recoverable bitumen resources increased to approximately 1.7 billion barrels. Our oil sands projects are expected to be long-life assets with limited operating risks. These projects are based on substantial resources, will use conventional technology, build on our core skills of large-scale truck and shovel mining operations, include partners with synergistic skills and abilities, and are located in a politically stable jurisdiction.
Fort Hills Oil Sands Project The Fort Hills oil sands project includes approximately 24,720 contiguous hectares of oil sands leases located about 90 kilometres north of Fort McMurray in Northern Alberta. An upgrader that would be located in Sturgeon County, just north of Edmonton has been deferred by the partners. We hold a 20% interest in the Fort Hills Energy LP (the Fort Hills Partnership), which owns the Fort Hills project, with 20% being held by UTS and the remaining 60% held by the project operator, Petro-Canada Limited. In 2005, we acquired a 15% interest in the Fort Hills Partnership by agreeing to fund 34% of the first $2.5 billion of project expenditure, or $850 million, and our 15% pro-rata share thereafter. In 2007, Teck and Petro-Canada each subscribed for an additional 5% interest in the Fort Hills Partnership. We will earn our additional interest by funding a further $375 million of the Fort Hills Partnership expenses beyond the existing earn-in obligations. We will satisfy our $375 million commitment by contributing 27.5% of the Fort Hills Partnership expenses beyond the initial $2.5 billion and up to project spending of $7.5 billion. Thereafter we will fund our 20% pro rata share of project spending. Our 20% interest in Fort Hills represents 776 million barrels of recoverable bitumen based on Sproule Unconventional Limited’s (Sproule) December 31, 2008 best estimate of the contingent bitumen resource of 3.88 billion barrels of recoverable bitumen, with a low estimate of 2.10 billion barrels and a high estimate of 4.35 billion barrels, all on a 100% basis. In 2008, our spending on the Fort Hills Project was $434 million, bringing our cumulative spending to $667 million at the end of 2008. Activities planned for 2009 include engineering studies, specifically for the review and finalization of the FEED stage engineering, site preparation and early works. Our share of funding for the project in 2009, including our earn-in commitments, is expected to be approximately $330 million. In November 2008, together with our partners in the Fort Hills Project, we announced that we will defer the final investment decision for the mining portion of the project until a cost estimate consistent with the current market environment can be established. The partners now anticipate making a final investment decision in 2009. The upgrader portion of the project has been put on hold and a decision on whether to proceed with the upgrader will be made at a later date. As a result of the decision to defer the upgrader portion of the project, we recorded a $90 million after-tax impairment charge against our investment in Fort Hills.

Teck 2008 Annual Report 27
The partners remain committed to the retention of the oil sands leases and are holding discussions with the Government of Alberta on the current lease term. Proceeding with the project is also subject to certain regulatory approvals. In October 2008, the Alberta Energy Resources Conservation Board (the ERCB) released its decision regarding the proposed mine amendment requested by Petro-Canada on behalf of the Fort Hills Partnership. The decision, which is subject to Order in Council, provides for the required revision to the mine footprint to enable construction to proceed for the first phase of the mine and extraction portion of the Fort Hills project. The ERCB has requested a revised assessment of the cumulative effects and mine plan by December 31, 2009 to facilitate the request to increase the total recoverable resource. The regulatory hearing on the Sturgeon County upgrader was convened in the second half of 2008 and the ERCB decision report was released in January 2009. The decision, which is subject to Order in Council, found the upgrader to be in the public interest and approved the project subject to conditions and the commitments made by Petro-Canada. We remain committed to our diversification strategy including our development of oil sands as part of the formation of the Energy business unit. We continue to regard Fort Hills as an attractive, long-term asset. However, in light of the significant cost of participation in a near-term oil sands project at this stage of the business and commodity cycle, we are exploring strategic alternatives in connection with this asset.
Teck/UTS Joint Venture We have jointly acquired, with UTS, oil sands leases located east and north of the Fort Hills Project totalling approximately 124,000 hectares. To date, we have spent $348 million for our 50% share of the acquisition, exploration and engineering costs of these leases. We expect to spend approximately $24 million for our share of studies and exploration drilling planned for 2009. The planned 2008/2009 exploration program consists of approximately 60 strategically placed wells with a view to maximize the resource potential per well. In March 2008, a Public Disclosure Document was released describing preliminary development plans for two new oil sands mines. The Equinox oil sands project, which we formerly referred to as Lease 14, is located immediately west of the Fort Hills Project and the Frontier oil sands project, which includes Lease 311, is approximately 10 kilometres north of the Equinox Project. The filing of the Public Disclosure Document begins the formal regulatory process for the two projects.
Frontier and Equinox Projects The Equinox oil sands project consists of approximately 2,890 hectares of oil sands leases (Lease 14) and is immediately west of the Fort Hills Project. Our 50% interest in the Equinox Project represents 166 million barrels of recoverable bitumen based on a contingent resource estimate of 330 million barrels of recoverable bitumen defined by 124 core holes. The joint venture is proceeding with a Design Basis Memorandum (DBM) study to assess the feasibility of developing the Equinox Project as a stand-alone 50,000 barrel per day bitumen mining/extraction operation. The DBM study is expected to be completed in the first quarter of 2009 and will also provide a basis for assessing development of the larger Frontier Project. The Frontier oil sands project consists of approximately 26,410 hectares of oil sands leases, including Lease 311, and is located on the west side of the Athabasca River approximately 10 kilometres north of the Equinox Project. The joint venture completed 353 core holes in the first quarter of 2008, of which 325 core holes were located in the Frontier Project area. Full assay and test results have been completed on the cores from the 2007/2008 winter exploration program, the geological model has been updated and a contingent resource estimate has been prepared for the southern portion of the Frontier Project. For the year ended December 31, 2008, Sproule, as independent reserve evaluators, presented contingent resource estimates for the southern portion of the Frontier project. Our 50% interest in the Frontier Project represents 774 million barrels of recoverable bitumen based on Sproule’s Best Estimate of the contingent bitumen resource of 1.55 billion barrels of recoverable bitumen, with a low estimate of 980 million barrels and a high estimate of 2.55 billion barrels, on a 100% basis. Engineering studies are expected to start on the Frontier Project in the second quarter 2009 assessing various development options for a stand-alone mine/extraction operation in the range of 100,000 to 160,000 barrels of bitumen per day. The joint venture also holds additional oil sands leases both east of the Athabasca River (60,000 hectares) and west of the Athabasca River (34,700 hectares). Preliminary exploration drilling programs have been conducted on some of these leases. Further exploration core holes are planned during the 2008/2009 winter drilling program.

28
A bulk-sampling program completed during the first quarter of 2008, provided oil sands ore for extraction and froth treatment pilot testing started during the second half of 2008, to develop design parameters for both the Equinox and Frontier projects. The pilot testing and analysis are expected to be completed in 2009. In September we completed the transition to become operator of the joint venture, a responsibility that was previously undertaken by UTS. The joint venture continues to advance the project through the regulatory permitting process and has ongoing consultations with stakeholders including project update meetings with key stakeholder groups.
Contingent Resource Estimates Volumes of contingent bitumen resources are calculated at the outlet of the proposed extraction plant. There is no certainty that it will be commercially viable to produce any portion of the contingent bitumen resources. Contingent resources are defined in the Canadian Oil and Gas Evaluation Handbook as published by the Canadian Section of the Society of Petroleum Evaluation Engineers as those quantities of petroleum estimated, as of a given date, to be potentially recoverable from known accumulations using established technology or technology under development, but which are not currently considered to be commercially recoverable due to one or more contingencies. Contingencies may include factors such as economic, legal, environmental, political and regulatory matters or a lack of markets. It is also appropriate to classify as ''contingent resources'' the estimated discovered recoverable quantities associated with a project in the early project stage. There is no certainty that any of the Fort Hills Project, the Equinox Project or the Frontier Project will produce any portion of the volumes currently classified as "contingent resources". The primary contingencies which currently prevent the classification of the contingent resources disclosed above as reserves consist of: current uncertainties around the specific scope and timing of the development of each of the Fort Hills Project, the Equinox Project or the Frontier Project; lack of regulatory approvals for certain aspects of such projects; the uncertainty regarding marketing plans for production from the subject areas; improved estimation of project costs; commodity price fluctuations; in the case of the Fort Hills Project, the acceptance within the Fort Hills partnership of the updates to the Fort Hills Project scope, timing, costs estimates and final Board of Directors approval of each of the Fort Hills partnership general and limited partners; and those other risks and contingencies described below under “Cautionary Statement on Forward-Looking Information” and in the public filings described there. Contingent resources do not constitute, and should not be confused with, reserves. There is no certainty that it will be commercially viable to produce any portion of the contingent bitumen resources.
Regulatory Developments In January 2008, the Government of Alberta announced a plan to reduce carbon emissions intensity to 50% below 1990 levels by 2020. Major emitters (those over 100,000 tonnes per year) are required to reduce their emissions intensity by 12% as compared to their established baseline. For new construction projects, the plan is applicable three years after start up. We are reviewing the effect of this legislation on our oil sands projects.
Corporate
Other Exploration and Development Properties
Nickel Nickel laterite (Brazil) and sulphide (Canada) were the main targets in 2008. Approximately $7 million in project costs were incurred. The company will not be undertaking any significant nickel exploration in 2009. A limited amount of work was done on the Santa Fe and Ipora lateritic nickel project in Brazil in 2008. Mechanical and magnetic upgrading tests were completed on sample material from pits. Reclamation work on all pits, drill sites and drill access roads is in progress. Geological and resource reports were filed for each exploration permit to meet tenure requirements. Surface access contracts for exploration were renegotiated with land owners. A limited program of baseline environmental studies was ongoing in 2008. The three partners have elected to put the project on care and maintenance in 2009 and will undertake limited programs to maintain tenure and environmental licenses. As a result of the low nickel price, we recorded a $35 million impairment charge against the project.

Teck 2008 Annual Report 29
Diamonds Approximately $3 million was spent on diamond exploration in Canada, mainly on the Darby project in Nunavut. Three new zones of kimberlite occurrences were discovered. We will not be undertaking exploration for diamonds in 2009.
Seafloor Exploration Approximately $16 million was spent on seafloor exploration in territorial waters off Papua New Guinea and Tonga. The target was dormant or extinct “vents” on the seafloor that have deposited fields of high grade copper, zinc, gold, and silver mineralization. We operate the seaborne programs, and have been earning into a potential joint venture with Nautilus Minerals Inc. We discovered a total of 12 new sulphide occurrences, four in Tonga and eight in the Bismarck Sea off Papua New Guinea. Average metal grades from the Tongan discoveries were 16 grams per tonne of gold, 8% copper, 12% zinc, and 184 grams per tonne of silver. Average metal grades for 3 of the Bismarck Sea discoveries were 1 gram per tonne of gold, 1.8% copper, 15.5% zinc, and 198 grams per tonne of silver. In January 2009, we advised Nautilus that we would not continue with the option to earn into a joint venture on tenements in PNG and Tonga under the existing terms in the regional agreement. In doing so, we relinquished our rights to tenements in those countries but retained our option to participate in future seafloor exploration in Fiji, New Zealand, Japan, and the Northern Marianna Islands as defined in the regional agreement with Nautilus.
Applied Research and Technology (ART) Our Applied Research and Technology Group (ART) in Trail, British Columbia develops tests and implements technologies for new projects and operations. The group works closely with our operations to define best practices, provide technology transfer, and assist with continuous improvement, unit cost reduction and value creation. ART has expertise in applied mineralogy, mineral processing and environmental technology. In the growth area, these skills are used to characterize new ore bodies and verify existing ones, or provide alternative processing options. Currently much of this work is focused on our oil sands projects and the Aqqaluk ore body at Red Dog. Continuous improvement projects are developed in collaboration with operations where value is created through reduced costs, improved recovery, increased concentrate grade and other overall efficiencies. New technologies are applied to improve environmental performance at our operations and mitigate potential impacts. Much of the work focuses on issues related to water treatment, the potential for acid rock drainage and the safe stabilization of deleterious elements.

30
Financial Overview
Financial Summary
($ in millions, except per share data) 2008 2007 2006
Revenue and earnings
Revenues $ 6,904 $ 6,371 $ 6,539
Operating profit before depreciation and amortization $ 2,895 $ 3,071 $ 3,825
EBITDA $ 2,924 $ 2,615 $ 3,829
Net earnings from continuing operations $ 677 $ 1,661 $ 2,395
Net earnings $ 659 $ 1,615 $ 2,431
Cash Flow
Cash flow from operations $ 2,132 $ 1,761 $ 2,910
Capital expenditures $ 939 $ 571 $ 391
Investments $ 12,298 $ 3,911 $ 272
Balance Sheet
Cash and temporary investments $ 861 $ 1,408 $ 5,281
Total assets $ 31,533 $ 13,573 $ 11,447
Debt, including current portion $ 12,874 $ 1,523 $ 1,509
Per share amounts
Net earnings from continuing operations
Basic $ 1.50 $ 3.85 $ 5.68
Diluted $ 1.49 $ 3.83 $ 5.52
Net earnings
Basic $ 1.46 $ 3.74 $ 5.77
Diluted $ 1.45 $ 3.72 $ 5.60
Dividends declared per share $ 0.50 $ 1.00 $ 1.00
Our revenues and earnings depend on prices for the commodities we produce, sell and use in our production processes. Commodity prices are determined by the supply of and demand for raw materials, which are influenced by global economic growth. We normally sell the products that we produce at prevailing market prices or at prices negotiated on annual contracts, particularly metallurgical coal. Prices for these products, particularly for exchange-traded commodities, can fluctuate widely and that volatility can have a material effect on our financial results. We record our financial results using the Canadian dollar and accordingly, our operating results and cash flows are affected by changes in the Canadian dollar exchange rate relative to the currencies of other countries. Exchange rate movements, particularly as they affect the US dollar, can have a significant impact on our results as a significant portion of our operating costs are incurred in Canadian and other currencies and most of our debt and revenues are denominated in US dollars. Our net earnings for 2008, which included $856 million of after-tax asset impairment losses, were $659 million or $1.46 per share compared with $1.6 billion or $3.74 per share in 2007 and $2.4 billion or $5.77 per share in 2006. Our earnings in 2008 were negatively affected by non-cash after-tax asset and goodwill impairment charges totalling $856 million taken against (i) the goodwill related to the three copper mines we acquired from Aur in 2007 ($345 million), (ii) the deferral of the upgrader portion of our Fort Hills oil sands project ($90 million) (iii) our Lennard Shelf, Pend Oreille and Duck Pond mines ($116 million), (iv) our Petaquilla copper project in Panama, Santa Fe nickel project in Brazil and other exploration properties ($60 million) and (v) $245 million in respect of marketable securities that we own in various
Teck 2008 Annual Report 31
development stage companies, whose decline in value is considered other-than-temporary. The Lennard Shelf zinc mine was closed in August 2008 and the Pend Oreille zinc mine was put on care and maintenance in February 2009 due to low zinc prices. Prior to our acquisition of Fording’s coal assets, we owned a 52% effective interest in Teck Coal, comprised of a 40% direct interest in Teck Coal and a 19.6% interest in the outstanding units of Fording. These prior investments were acquired at a cost of approximately $1.3 billion. Upon acquisition of the additional 48%, we retained independent valuation experts from a large international accounting firm to assist us in the allocation of our investments to individual assets and liabilities. This allocation resulted in $883 million of goodwill. This goodwill arose primarily as a result of the accounting requirement to record the net future income and resource tax liabilities associated with the Fording purchase on an undiscounted basis as well as changes in expected future coal prices and US/Canadian dollar exchange rates between the date of the acquisition announcement in July 2008 and the closing of the acquisition on October 30, 2008. We subsequently tested goodwill relating to Teck Coal for impairment. This test compared the fair value of 100% of these operations to our carrying value as a whole and takes into account the lower cost base for our pre-existing interest. Based on expected future cash flows from 100% of the coal operations, the estimated fair value of the coal assets exceeds the carrying amount; therefore, we have determined that goodwill relating to Teck Coal is not impaired. In addition, 2008 earnings included $329 million of negative pricing adjustments brought about by the sharp decline in base metal prices, occurring mainly in the fourth quarter of the year. Our earnings in 2007 were affected by a $33 million equity loss ($50 million pre-tax) related to our investment in the Galore Creek project where mine construction was suspended due to escalating capital costs and a number of asset write downs totalling $51 million after taxes. The equity loss represents our after-tax share of the Galore Creek partnership’s estimated demobilization costs. The asset write downs relate to our investment in Tahera Diamond Corporation, which was written down due to the severe financial difficulties facing the company. Due to difficult mining conditions and low ore grades that impacted their ongoing profitability, we also wrote down the property, plant and equipment at our Pend Oreille and Lennard Shelf zinc mines. We also had a $59 million cumulative foreign exchange loss related to the repatriation of US dollars to Canada to provide funds for our acquisition of Aur. We also had a $46 million loss on our contingent receivable related to the sale of our Cajamarquilla refinery compared with a $36 million gain in 2006. In addition, we recorded after-tax negative pricing adjustments of $66 million during 2007 compared with $113 million of positive adjustments in 2006. An $80 million gain on the reduction of future tax liabilities due to the reduction in federal income tax rates in Canada and after-tax gains of $36 million on asset sales partially offset these effects. Our 2006 net earnings included after-tax gains of $126 million on the sale of investments, including $103 million on the sale of our investment in Inco.

32
The table below shows the impact of these items on our earnings.
2008 2007 2006
Net earnings as reported $ 659 $ 1,615 $ 2,431
Add (deduct) the after-tax effect of:
Derivative (gains) losses, including
discontinued operations (167) 32 (36)
Asset impairment and equity losses 266 84 -
Goodwill impairment 345 - -
Impairment of marketable securities 245 - -
Asset sales and other 73 (36) (126)
Realization of cumulative translation adjustment loss - 59 -
Tax items (50) (80) (26)
712 59 (188)
Adjusted net earnings * 1,371 1,674 2,243
Negative (positive) pricing adjustments 329 66 (113)
Comparative net earnings * $ 1,700 $ 1,740 $ 2,130
* Adjusted net earnings and comparative net earnings are non-GAAP financial measures. See Use of Non-GAAP Financial Measures section for further information.
Pricing adjustments generally increase earnings in a rising commodity price environment and decrease earnings in a declining price environment. They are a normal part of our business but we exclude them from comparative earnings in the table above to provide a better understanding of how our company performed. In the latter part of 2008 general conditions in credit markets deteriorated substantially, which had a serious impact on the global economy and contributed to a significant and rapid decline in the demand for and selling price of our products. Average base metal prices were down significantly in the fourth quarter of 2008, with two of our major products, copper and zinc, dropping significantly from prices at the end of September 2008, resulting in negative pricing adjustments of $474 million ($270 million after-tax) in the fourth quarter alone. Our earnings in 2008 before non-recurring items and pricing adjustments were $1.7 billion compared with $1.7 billion in 2007 and $2.1 billion in 2006. Net earnings for 2008 were $659 million compared with $1.6 billion in 2007 and $2.4 billion in 2006.
Earnings were lower in 2008 due mainly to lower earnings from our copper and zinc business units as a result of the lower average base metal prices, with a significant portion of the decline coming in the last half of the year and the asset impairment charges that we recorded in the fourth quarter of the year. This was partially offset by a substantial increase in operating profit from our coal business unit due to the significant increase in coal prices and our acquisition of Fording’s 60% interest in Teck Coal in October 2008. Cash flow from operations in 2008, before changes in non-cash working capital items, was $3.7 billion compared with $2.0 billion in 2007 and $2.6 billion in 2006. The changes in cash flow from operations are due mainly to the volatility in commodity prices and changes in the Canadian/US dollar exchange rate. In 2008, our earnings included a $1.5 billion non-cash future tax provision and $881 million of non-cash asset impairment charges and a provision against our marketable securities. The decrease in 2007 from 2006 was mainly due to lower zinc and coal prices and the strengthening of the Canadian dollar. Cash flow from operations, after changes in non-cash working capital items, less scheduled debt repayments, dividends and sustaining capital expenditures, was $1.3 billion in 2008 compared with $1.1 billion in 2007 and $2.1 billion in 2006. At December 31, 2008, our cash and temporary investments were $861 million. Total debt was $12.9 billion and our debt to debt-plus-equity ratio was 54% compared with 16% at December 31, 2007.

Teck 2008 Annual Report 33
Operating Profit Our operating profit is made up of our revenues less the operating, depreciation and amortization expenses at our producing operations. Income and expenses from our business activities that do not produce commodities for sale are included in our other income and expenses. Our principal commodities are copper, metallurgical coal, zinc and gold, which accounted for 27%, 35%, 15% and 5% of revenues respectively in 2008. Molybdenum is a significant by-product of our copper operations, and lead is a significant by-product of our zinc operations, respectively accounting for 3% and 5% of our 2008 revenues. In addition, our Antamina copper mine produces a significant volume of zinc concentrate. Other products produced at various operations include silver, various specialty metals, chemicals and fertilizers, and electricity, and in total accounted for 10% of our revenue in 2008. Our acquisitions of Aur in August 2007 and the Fording coal assets in October 2008 had a significant impact on our revenues, operating expenses and operating profits. In 2008, our results included a full year of results from the three mines we acquired from Aur compared with just over four months in 2007. In addition, our 2008 operating profit includes our 40% share of the results of Teck Coal until the end of October and 100% thereafter compared with only our 40% direct interest for all of 2007. Accordingly, these two acquisitions account for a portion of the increase in revenues, operating expenses, and depreciation and amortization. Our operating profit was negatively affected by the decline in base metal prices that occurred during 2008.
2008 Revenue by Division 2008 Revenue by Commodity 2008 Operating Profit by Division*
Our revenues are affected by sales volumes, which are determined by our production levels and demand for the commodities we produce, commodity prices and currency exchange rates. Our consolidated revenues were $6.9 billion in 2008 compared with $6.4 billion in 2007 and $6.5 billion in 2006. Our 2008 revenues increased by $502 million as a result of having a full year of revenue from the three mines acquired through our acquisition of Aur and the effect of significantly higher coal prices and 100% of the revenues of Teck Coal for the last two months of the year. This was partially offset by the decline in average base metal prices, particularly copper, zinc and lead in the fourth quarter of 2008 resulting in significant negative pricing adjustments and lower zinc sales volumes. At December 31, 2007, outstanding receivables included 180 million pounds of copper provisionally valued at an average of US$3.04 per pound, 296 million pounds of zinc valued at an average of US$1.05 per pound and 74 million pounds of lead provisionally valued at an average of US$1.15 per pound. During 2008, the copper receivables were settled at an average final price of US$3.55 per pound, zinc receivables were settled at an average final price of US$1.08 per pound and lead at US$1.25 per pound, resulting in positive after-tax final pricing adjustments of $57 million in the year compared with negative adjustments of $56 million in 2007. We also recorded negative pricing adjustments of $386 million for sales recorded during 2008, most of which occurred in the fourth quarter due to the significant decline in base metal prices. At December 31, 2008, outstanding receivables included 164 million pounds of copper provisionally valued at an average of US$1.40 per pound, 195 million pounds of zinc valued at an average of US$0.54 per pound and 45 million pounds of lead valued at an average of US$0.42 per pound.
Copper31%
Zinc30%
Coal35%
Gold4% Copper
27%
Moly3%
Zinc15%
Lead5%
Coal35%
Gold5%
Other10% Copper
40%
Zinc15%
Coal42%
Gold3%
* Before depreciation and amortization

34
Our operating costs include all of the expenses required to produce our products, such as labour, energy, operating supplies, concentrates purchased at our Trail refining and smelting operation, royalties, and marketing and distribution costs required to sell and transport our products to various delivery points. Due to the geographic locations of many of our operations, we are highly dependent on third parties for the provision of rail, port and other distribution services. In certain circumstances, we negotiate prices for the provision of these services where we may not have viable alternatives to using specific providers, or may not have access to regulated rate-setting mechanisms. Contractual disputes, demurrage charges, rail and port capacity issues, availability of vessels and railcars, weather problems and other factors can have a material effect on our ability to transport materials from our suppliers and to our customers in accordance with schedules and contractual commitments. The magnitude of our operating costs is dictated mainly by our production volumes, the costs of labour, operating supplies and concentrate purchases; by strip ratios, haul distances and ore grades; and by distribution costs, commodity prices and costs related to non-routine maintenance projects. Production volumes mainly affect our variable operating and our distribution costs. In addition, production may also affect our sales volumes and, when combined with commodity prices, affects profitability and ultimately our royalty expenses. Our operating expenses were $4.0 billion in 2008, compared with $3.3 billion in 2007 and $2.7 billion in 2006. Like many of our competitors, we have been facing rising costs for labour, fuel and energy, consumables and other operating supplies. In addition to general cost increases, significant increases in our 2008 operating expense include $236 million from having a full year of expenses from the three mines acquired from Aur in August 2007, and $173 million related to an extra two months of expenses for the additional 60% of Teck Coal that we acquired from Fording on October 30, 2008. We determine our depreciation and amortization expense using various methods. Plant and equipment are depreciated and amortized on a straight-line basis over their estimated useful lives at our refining and smelting operations in Trail. Plant and processing facilities at our mines are amortized on a units-of-production basis over the lesser of their useful lives or the estimated proven and probable ore reserves. Mobile equipment is depreciated and amortized using operating hours and buildings, and other site infrastructure over their estimated useful lives. Accordingly, our depreciation and amortization expense varies to some degree with our production volumes. In 2008 our depreciation expense was $513 million compared with $333 million in 2007 and $264 million in 2006. The main reasons for the increase were our acquisitions of Aur in August 2007 and the Fording assets in October 2008. These two acquisitions resulted in an additional $170 million of depreciation and amortization compared with 2007.
Other Expenses
($ in millions) 2008 2007 2006
General and administrative $ 89 $ 109 $ 96
Interest and financing 182 85 97
Exploration 135 105 72
Research and development 23 32 17
Asset impairment 589 69 -
Other expense (income) (31) (170) (316)
Provision for income and resource taxes 658 795 1,213
Non-controlling interests, net of tax 82 47 19
Equity loss (earnings), net of tax (22) 5 (32)
Loss (earnings) from discontinued operations, net of tax 18 46 (36) $ 1,723 $ 1,123 $ 1,130
General and administration expense was $89 million in 2008 compared with $109 million in 2007 and $96 million in 2006. The decrease is mainly due to a decline in our share price, which resulted in a reduction of our stock based compensation expense. The increase in 2007 over 2006 was due to an increase in general business activities. Our interest expense of $182 million in 2008 was significantly higher than the $85 million for 2007, due mainly to the additional debt we incurred to finance our acquisition of Fording's coal assets. Interest expense in 2007 was $12 million lower than 2006 due to our lower average debt levels, lower interest rates and the strengthening of the Canadian dollar.

Teck 2008 Annual Report 35
We must continually replace our reserves as they are depleted in order to maintain production levels over the long term. We endeavour to do this through our exploration and development program and through acquisition of interests in new properties or in companies that own such properties. Exploration for minerals and oil and gas is highly speculative and the projects involve many risks. The vast majority of exploration projects are unsuccessful and there are no assurances that current or future exploration programs will find deposits that are ultimately brought into production. Our main exploration efforts in 2008 were focused on copper in North America, South America, and Namibia and zinc in Alaska, Australia and Ireland. We also participated in several equity financings with junior companies exploring for the same commodities in favourable jurisdictions. Exploration expense was $135 million in 2008 compared with $105 million in 2007 and $72 million in 2006. Increased exploration activities and the increase in costs of contractors were the main reasons for the rising exploration expense in 2008 and 2007. The 2008 expenditures include development projects such as Quebrada Blanca, Relincho, Mesaba and Carrapateena (totalling approximately $44 million) and seafloor exploration ($16 million). Our research and development expenditures are focused on advancing our proprietary CESL hydrometallurgical technology, the development of internal and external growth opportunities, and the development and implementation of process and environmental technology improvements at operations. In 2008, our research and development expenditures were $23 million compared with $32 million in 2007 and $17 million in 2006. Asset impairment charges totalling $589 million before taxes included the following: $345 million of goodwill arising out of the acquisition of Aur Resources,
$179 million in respect of our Duck Pond, Lennard Shelf and Pend Oreille mines. The Lennard Shelf mine ceased operations in August 2008 and Pend Oreille was put on care and maintenance in February 2009, and
$22 million to write-off our investment in the Petaquilla copper project in Panama, $35 million on the Santa Fe nickel project in Brazil, and $8 million for other exploration properties.
The asset impairment charges in 2007 were taken against the Lennard Shelf and Pend Oreille zinc mines and our investment in Tahera Diamonds, which sought creditor protection in early 2008 and has been operating under Canada’s Companies' Creditors Arrangement Act since that time.
Other income, net of other expense was $31 million in 2008 compared with $170 million in 2007 and $316 million in 2006. Other income and expense in 2008 included $285 million of gains on our derivative contracts, mainly from copper and zinc contracts, $56 million of interest income and a $69 million foreign exchange translation gain. This was partially offset by $71 million of reclamation and environmental expenses and a $292 million write down of marketable securities that we own in various development stage companies, whose decline in value is considered other-than-temporary. These investments are marked to market each period through other comprehensive income and this charge represents a transfer from other comprehensive income to regular earnings and does not affect their carrying value or our shareholders’ equity. In 2007, interest income was $177 million and we had $55 million of gains from the sale of investments. With the decline in the zinc price in the latter part of 2007, our derivative liability on the Duck Pond zinc positions was reduced by $53 million. Offsetting this other income was a $59 million cumulative foreign exchange loss related to the repatriation of US dollars to Canada to provide funds for the acquisition of Aur, $26 million of reclamation at our closed operations and $25 million on non-hedge derivative losses mainly on our gold positions. Income and resource taxes were $658 million in 2008, or 47% of pre-tax earnings. This is substantially higher than the Canadian statutory tax rate of 31% as there is no tax recovery for our write downs related to goodwill and the write downs of our investments are taxed at lower capital gains rates. Offsetting these items were net tax items of $50 million related to the resolution of previously uncertain tax provisions and income tax rate reductions. Our non-controlling interest expense relates to the ownership interests in our Highland Valley, Quebrada Blanca, Carmen de Andacollo and Elkview mines that are held by third parties. The $35 million increase in 2008 was due mainly to our partners sharing in a full year of earnings from the Quebrada Blanca and Carmen de Andacollo mines compared with just over three months in 2007 as we acquired those mines from Aur in late August 2007. The minority partners in the Elkview mine also benefitted from the higher 2008 coal year prices.

36
We account for our investments in Fording (until October 30, 2008), Fort Hills Limited Partnership and the Galore Creek Partnership using the equity method. In September 2007, we increased our interest in Fording to 19.95% by purchasing an additional 16.65 million units for $599 million. Our equity earnings from Fording were $89 million in 2008, $28 million in 2007 and $32 million in 2006. 2008 includes our share of earnings until we acquired Fording’s assets on October 30, 2008. The increase over 2007 was due to our higher ownership interest for the entire year and the substantial increase in coal prices. This increase was partially offset by foreign exchange losses. Our 2008 equity earnings from the Galore Creek Partnership was $18 million compared with a $33 million equity loss in 2007 related to our share of demobilization costs resulting from the decision to suspend construction of the Galore Creek project. Demobilization activities have gone better than expected in 2008 resulting in a reduction of the provision for these costs, which is the main reason for the equity earnings in 2008. The equity earnings from Fording and Galore were offset by an $85 million equity loss from our investment in Fort Hills. The equity loss from Fort Hills related to asset impairment charges as a result of the deferral of the upgrader portion of the project and contract termination charges. Our earnings from discontinued operations relate to a price participation provision in a 2004 agreement to sell our Cajamarquilla zinc refinery. We are entitled to additional consideration of US$365,000 for each US$0.01 by which the average annual price of zinc exceeds US$0.454 per pound. This zinc price participation expires at the end of 2009. The changes between 2006 and 2008 relate primarily to changes in the zinc price and new accounting rules implemented in 2007. In 2006, we accrued $36 million, net of taxes, for the additional consideration based on the average annual zinc price for the year. Effective January 1, 2007, upon adoption of the new accounting standard for financial instruments, we recorded an asset of $139 million by increasing our retained earnings in respect of the contingent receivable, which was valued based on the zinc price forward curve at December 31, 2006. The new standard for financial instruments required us to mark this receivable to market at the end of each quarter. With the decline in the zinc price that occurred during 2007 from historical highs in late 2006, the mark-to-market adjustment in 2007 resulted in a $46 million after-tax reduction in the receivable and with the continuing decline in the zinc price, the mark-to-market adjustment in 2008 was $18 million. In January 2007, we received approximately US$36 million for the 2006 price participation payment and in January 2008 we received approximately US$38 million for the 2007 payment. The amount due for 2008 is US$14 million.
Financial Position and Liquidity Our primary sources of liquidity and capital resources are our cash and temporary investments, cash flow provided from operations, including expected tax refunds, and the proceeds of potential asset sales, which must be used to pay down our bridge facility. Our cash position decreased during the year by $558 million to $850 million at December 31, 2008. During 2008, funds on hand and funds generated from operations were reinvested in capital equipment, investments and our oil sands projects in the amount of $1.6 billion. We also paid down debt of approximately $1.2 billion, including $374 million assumed as part of the Fording transaction. The cash portion of the Fording transaction was fully funded by the new bridge and term facilities. Total debt balances were $12.9 billion at December 31, 2008, of which $11.2 billion (US$9.3 billion) relates to the financing incurred to acquire the Fording assets, $7.8 billion of the debt is due in 2009. We also had bank credit facilities aggregating $1.3 billion, 97% of which mature in 2012 and beyond. Our unused credit lines under these facilities after drawn letters of credit amounted to $1.1 billion. Our senior unsecured debt is currently rated Ba3 by Moody’s Investor Services, BBB- by Standard and Poor’s and BBB by Dominion Bond Rating Service, all with negative outlooks.
Operating Cash Flow Cash flow from operations was $2.1 billion in 2008 compared with $1.8 billion in 2007 and $2.9 billion in 2006. Factors which affected cash flow included the effect of sharp declines in commodity prices, which led to pricing adjustments on our receivables of $255 million from September to December, inclusive. The acquisition of Fording’s assets also added directly to our cash flows in November and December 2008. Operating profits from the acquired assets were $186 million in the year, which included a non-cash charge against income of $188 million related to acquisition accounting for inventories. These valuation adjustments reduced our recorded earnings from sales of acquired inventories, but not our cash flow. In addition, as part of the acquisition of the Fording assets, we assumed US$1.4 billion of US dollar forward sales contracts with an average exchange rate of C$1.01 per US$1.00. Settlement of these contracts used $123 million of cash in the fourth quarter of 2008.

Teck 2008 Annual Report 37
Investing Activities Capital expenditures were $939 million in 2008 and included $394 million on sustaining capital, $358 million on development projects, $137 million for the acquisition of the Relincho copper project (plus 6.9 million Class B subordinate voting shares valued at $287 million) and $50 million on our non-Fort Hills oil sands properties. The largest components of sustaining expenditures were $118 million at Teck Coal, $50 million at Antamina, $48 million at Red Dog and $44 million at Trail. Development expenditures included $170 million for preparatory stripping and capital equipment for Highland Valley Copper’s mine life extension project and $178 million on the development of the hypogene deposit at Carmen de Andacollo. Investments in 2008 totalled $12.3 billion, of which $11.6 billion was for the acquisition of the Fording assets and $505 million was our share of costs for our investments in Fort Hills and the Galore Creek project.
Financing Activities The major financing activity in 2008 was the debt incurred to partially finance our acquisition of Fording’s assets in October 2008. The acquisition financing included a US$5.8 billion 364-day bridge facility due October 29, 2009 and a US$4 billion three year amortizing term loan facility repayable in 11 equal quarterly instalments starting in April 2009. During the last two months of 2008, we repaid US$460 million ($573 million) on the bridge facility and we paid US$150 million ($183 million) to retire the revolving credit facility that we assumed upon our acquisition of Aur Resources in 2007. The repayment of the Aur revolving credit facility in the third quarter, released US$153 million ($187 million) of cash collateral that was held as security for that facility, which we previously included in other assets on our balance sheet as this cash was not available for general corporate purposes. In addition, we also repaid US$305 million ($374 million) of long-term debt we assumed on the acquisition of Fording and $98 million of the 6.75% debentures we assumed on our acquisition of Aur.
Liquidity Risk On September 30, 2008, we entered into definitive financing agreements related to bridge and term loan facilities and the conditions precedent to our purchase of the assets of the Fording Canadian Coal Trust (“Fording”) and our lenders’ funding obligations were substantially satisfied. Our original plan for the acquisition was to refinance a substantial portion of the acquisition facilities prior to or shortly after closing of the transaction with various types of long-term debt and to repay the balance with cash flow from operating activities prior to the maturity of the term facility. In the fourth quarter of 2008 and prior to the closing of the transaction, conditions in the credit markets deteriorated substantially, effectively closing the credit markets to us. These credit market conditions had a serious impact on the global economy, which has contributed to a significant and rapid decline in the demand for and selling price of the base metal products we produce. As a result of these conditions, which have continued into 2009, our credit ratings were lowered and our share price has declined substantially. Current weak global economic conditions and the downgrade in our credit ratings make access to the credit and capital markets difficult for us, which may compromise our ability to repay or refinance all or a portion of the acquisition loans as they become due. We are currently in compliance with the financial covenants under our credit agreements, which establish a maximum debt to total capitalization ratio of 60% at the end of each calendar quarter until it declines to 50% at September 30, 2009. At December 31, 2008, our debt to total capitalization ratio was 54%. To maintain our current production forecasts for 2009, we expect capital spending of approximately $500 million in 2009 and with the re-scaling of that project, our contributions to the Fort Hills Energy Limited Partnership are expected to decline to $330 million for our share of the remaining costs necessary to get to a sanctioning decision. Based on expected free cash flow we will not generate sufficient funds from operations to repay the entire obligation on the bridge facility that is due on October 29, 2009, and will need to generate funds from other sources to do so, or will need an extension or refinancing of the bridge loan. As at December 31, 2008, US$5.3 billion of the bridge facility and US$4 billion of the term facility were outstanding. All of the bridge facility and US$1.1 billion of the term facility is due on or before October 29, 2009. To address our near-term liquidity requirements, we have begun discussions with our lenders to negotiate amendments to the bridge facility to provide us with additional time to generate cash and/or access appropriate sources of long-term financing to repay the bridge facility. There can be no assurance that these negotiations will be successful. We have also taken a number of other steps to assist us in meeting our repayment obligations, including suspending the dividends on

38
our Class A common and Class B subordinate voting shares, reducing capital and discretionary spending, expediting tax refunds of $1.1 billion, closing unprofitable operations and reducing the size of our global workforce by approximately 13%. To date we have sold our interest in the Lobo-Marte gold property for US$40 million and 5.6 million Kinross shares, and have announced the sale of our interest in the Hemlo mines for US$65 million and our indirect interest in a Peruvian company, Sociedad Minera El Brocal S.A.A., for US$35 million. We are also pursuing other potential asset sales. There can be no assurance that we will be able to complete further sufficient asset sales on a timely basis. Our ability to repay or refinance the bridge facility prior to its maturity and make the quarterly instalment payments on the term facility depends on a number of factors, some of which are beyond our control. These include general global economic, credit and capital market conditions, and the demand for and selling price of our products, in particular metallurgical coal. There can be no assurance that our credit ratings will not be downgraded further, which would further increase our costs of borrowing and further limit our ability to refinance our existing debt. There is no assurance that the expected cash flows from operations in combination with asset sales and other steps being taken will allow us to meet these obligations as they become due, that we will continue to meet the financial covenants under our various lending agreements, or that we will be successful in renegotiating or refinancing the bridge facility. Accordingly, it is possible that we could be in default of our various lending agreements prior to the end of 2009, which could result in outstanding obligations becoming immediately due and payable unless we can obtain waivers from the lenders. Although we have approximately $1.1 billion in unused credit lines under various bank credit facilities, there can be no assurance, given our current financial condition, that these credit lines will be available to us if we should need to draw on them, or that our maturing credit lines of US$50 million and miscellaneous letters of credit totalling $258 million will be renewed in the ordinary course. Our existing debt obligations will constrain our capital spending and that may have an adverse effect on our operations. Our debt levels will also limit our ability to expand our operations or make other investments that would enhance our competitiveness. In a cyclical industry such as ours, history has shown that periodic spikes in commodity prices can result in substantial increases in our company’s cash flow. Many of our major operations are long-life assets with significant reserves and resources and have lives exceeding 20 years based on current production levels. If we are to realize the benefit of the economic recovery when it occurs, we must more closely match the term of our debt structure to the life of our assets. We believe that our access to financial resources through capital markets transactions has been limited mainly due to the effective closure of the capital markets brought about by the significant deterioration in the financial markets in the latter half of 2008, which we believe has also contributed to the significant decline in the demand for and selling price of our products. Accordingly, there is some risk that the steps described above will not be successful in allowing us to meet our obligations, which may require us to sell core assets or raise debt or equity capital, which management believes would enable us to satisfy our obligations as they fall due. However, these actions may have a material adverse effect on our business and on the market prices of our equity and debt securities.
Quarterly Earnings and Cash Flow
(in millions except for per share data) 2008 2007
Q4 Q3 Q2 Q1 Q4 Q3 Q2 Q1
Revenues $ 1,663 $ 1,800 $ 1,870 $ 1,571 $ 1,538 $ 1,932 $ 1,561 $ 1,340Operating profit before
depreciation and amortization 372 817 984 722 568 987 832 684
Net earnings (loss) (607) 424 497 345 280 490 485 360
Earnings (loss) per share (1.28) 0.95 1.12 0.78 0.64 1.15 1.14 0.83
Cash flow from operations 598 873 500 161 602 814 193 152 In the fourth quarter of 2008 general conditions in credit markets deteriorated substantially, which had a serious impact on the global economy and contributed to a significant and rapid decline in the demand for and selling price of our products. Average base metal prices were down significantly from average prices in the fourth quarter of 2007, with two of our major products, copper and zinc, down 45% and 55% respectively. The decline in prices was most pronounced in the fourth quarter, and resulted in negative pricing adjustments of $474 million ($270 million after-tax).

Teck 2008 Annual Report 39
Revenues from operations were $1.7 billion in the fourth quarter of 2008, $125 million higher than the comparable period in 2007. Revenues from coal operations increased by $845 million, with $561 million attributable to our increased ownership interest in Teck Coal and the balance due to significantly higher coal prices compared with a year ago. This was offset by significantly lower copper and zinc prices and negative pricing adjustments of $474 million (before $38 million of royalty charge recoveries) recorded by our copper and zinc operations. Despite the challenging global economic conditions, we generated $598 million of cash from operating activities. Fourth quarter earnings were negatively affected by after-tax, non-cash asset and goodwill impairment charges of $844 million and negative pricing adjustments of $270 million brought about by the sharp decline in commodity prices. The net loss for the quarter was $607 million, or $1.28 loss per share. Our copper business unit generated an operating profit before depreciation and negative pricing adjustments of $205 million in the fourth quarter compared with $367 million in 2007. Copper prices declined sharply by approximately 50% since the end of the third quarter, resulting in $335 million (2007 - $90 million) of negative copper pricing adjustments. After depreciation and negative pricing adjustments, the copper business unit incurred an operating loss of $214 million compared with a $235 million operating profit in the fourth quarter of 2007. This does not include gains totalling $199 million on our copper derivative contracts, which are included in other income and expenses. Operating profit from our coal business unit was $516 million before depreciation in the fourth quarter, which included one month of earnings reflecting our 40% interest in Teck Coal and two months reflecting our 100% interest starting from October 30, 2008, our acquisition date of the Fording assets. Deducted from operating profits in the fourth quarter was $188 million as a one-time fair value adjustment made to coal inventories on the acquisition of Fording. The revaluation established a higher value for coal inventories, based on current contract prices at the date of acquisition. The adjustment did not affect cash flows. On a 100% basis, coal sales volumes were 4.7 million tonnes in the fourth quarter representing a 22% decline from the same period a year ago, as our customers significantly reduced their coal deliveries in late 2008 in response to lower steel production. Coal prices averaged US$247 per tonne which was significantly higher than US$93 per tonne realized in the fourth quarter of 2007, but lower than our settled 2008 coal year average price of US$275 per tonne. This resulted from the sale of approximately 500,000 tonnes of lower priced thermal and residual 2007 coal year tonnages sold in the quarter at lower prices. The operating profit before depreciation and pricing adjustments from our zinc business unit was $62 million in the quarter compared with $283 million in the fourth quarter of 2007, mainly as a result of significantly lower zinc and lead prices and lower zinc sales volumes. Our $82 million operating loss in the fourth quarter included $101 million of negative pricing adjustments compared with $52 million in the fourth quarter of 2007. The Trail metallurgical complex reduced its refined zinc production by approximately 4,000 to 5,000 tonnes per month effective in late November in response to poor market conditions. The duration of this curtailment will depend on market conditions, but will likely continue for at least six months. In addition, we announced in mid-December that due to reduced metal demand and persistent weakness in zinc prices, the Pend Oreille mine will be placed on care and maintenance by the end of February, 2009. Gains totalling $45 million on our zinc derivative contracts are included in other income and expense. Our gold business unit performed well in the fourth quarter and provided an operating profit of $12 million in the quarter compared with $8 million in the same period a year ago. The increase in operating profit was due to higher realized gold prices.
Outlook The information below is in addition to the disclosure concerning specific operations included above in the Operations and Corporate Development sections of this document and in addition to the discussion of our ongoing efforts to refinance the debt incurred on the acquisition of Fording’s assets described above under the heading “Financial Position and Liquidity”.
General Economic Conditions Current problems in credit markets and deteriorating global economic conditions have led to a significant weakening of exchange traded commodity prices in recent months, including base metal prices. Volatility in these markets has also been unusually high. It is difficult in these conditions to forecast commodity prices or customer demand for our products. Credit market conditions have also increased the cost of obtaining capital and limited the availability of funds. Accordingly, management is reviewing the effects of the current conditions on our business.

40
Commodity Prices and 2009 Production Commodity prices are a key driver of our earnings and despite the sharp decline in metal and commodity prices that occurred in the second half of 2008, current prices are still above historic averages. On the supply side, the depleting nature of ore reserves, difficulties in finding new ore bodies, progressing through the permitting process, finding skilled resources to develop projects, infrastructure constraints and significant cost inflation may continue to have a moderating impact on the growth in future production. Although we are concerned about current global economic conditions, particularly in the United States, we believe that, over the longer term, as China and India continue to industrialize, those two economies will continue to be major positive factors in the future demand for commodities. We believe that the long-term price environment for the products that we produce and sell remains favourable. Based on our expected 2009 production and prices prevailing at December 31, the sensitivity of our annual earnings to a 1% change in commodity prices before pricing adjustments is as follows:
2009 Production Plan
Effect of 1% change on Annual After-Tax
Earnings
Coal (tonnes) 20,000,000 $ 21 million
Copper (tonnes) 330,000 $ 6 million
Zinc (tonnes) 960,000 $ 4 million
Lead (tonnes) 210,000 $ 1 million
Gold (ounces) 160,000 $ 1 million
Molybdenum (pounds) 8,500,000 $ 1 million Notes:
(1) The effect on our earnings of commodity price and exchange rate movements will vary from quarter to quarter depending on sales volumes.
(2) Zinc includes 270,000 tonnes of refined zinc and 690,000 tonnes of zinc contained in concentrates.
(3) Lead includes 85,000 tonnes of refined lead and 125,000 tonnes of lead contained in concentrates.
(4) Asset sales and financing transactions may affect our 2009 production plans and earnings sensitivities. Gold production for 2009 assumes completion of the sale of our Hemlo mines that was announced in February, 2009.
(5) All production estimates are subject to change based on market conditions.
In addition, as a result of the Fording transaction our earnings will be more sensitive to changes in the Canadian/US dollar exchange rate. Based on prices and the exchange rate prevailing at December 31, 2008, our current rates of production and designation of approximately one-half of our US dollar debt as a hedge of our US dollar denominated foreign operations, post-Fording acquisition, a 1% weakening of the Canadian dollar against the US dollar would decrease 2009 earnings by approximately $50 million, after taking into account our US dollar forward sales contracts. At December 31, 2008, outstanding receivables included 164 million pounds of copper provisionally valued at an average of US$1.40 per pound, 195 million pounds of zinc valued at an average of US$0.54 per pound and 45 million pounds of lead provisionally valued at an average of US$0.42 per pound. Final price adjustments on these outstanding receivables will increase or decrease our revenue in 2009 depending on metal prices at the time of settlement. Copper and zinc prices are currently trading approximately 50% and 40% lower than 2008 average prices, respectively. Molybdenum prices are approximately 65% lower than 2008 average prices and lead prices are trading 50% lower than 2008 averages. Gold prices are approximately 10% higher than the 2008 average prices. Partly offsetting the lower commodity prices is a weaker Canadian dollar, which is currently trading at an exchange rate of $1.25 against the US dollar compared with US$1 averaging C$1.07 in 2008. Our copper production for 2009 is expected to increase by 5% from 2008 levels to 330,000 tonnes. Highland Valley’s copper production is expected to increase by approximately 10,000 tonnes from 2008, as grades and recoveries at the mine are expected to improve during 2009.

Teck 2008 Annual Report 41
Our zinc contained in concentrate production in 2009 is expected to be 27,000 tonnes higher than in 2008. Red Dog is expected to increase production by 58,000 tonnes as a result of higher ore grades, while our share of zinc production from Antamina and Duck Pond will increase by 19,000 tonnes due to ore body sequencing. These production increases will be partly offset as a result of the closure of Lennard Shelf and Pend Oreille mines in 2008 which result in production losses of 50,000 tonnes. Due to sea ice conditions, Red Dog has a shipping window that normally starts in early July and ends in late October. If ice or other weather conditions are such that the shipping season is delayed, our quarterly sales patterns can vary substantially. Sales and profits of the Red Dog mine follow a seasonal pattern, with higher sales volumes of zinc and most of the lead sales occurring in the last five months of the year following the commencement of the shipping season in July. Refined zinc production from our Trail metallurgical complex is expected to remain similar in 2009 at 270,000 tonnes despite implementing production curtailments in late 2008 in response to changing market conditions. Current premiums for zinc metal and customer deliveries suggest ongoing weakness in the zinc metal markets. Coal marketing discussions are beginning for the 2009 coal year that commences April 1, 2009. Integrated steel mills have curtailed production significantly, reducing demand for raw material inputs including metallurgical coal. Current market sentiment is that US dollar coal prices will decrease substantially from the 2008 coal year. Our coal sales volumes are currently estimated at 20 million tonnes in 2009. Coal sales volumes and price guidance for 2009 will be confirmed after contracts for the 2009 coal year have been settled. Coal prices in the first quarter of 2009 are expected to decline from the fourth quarter average price of US$247 per tonne to approximately US$190 per tonne due to a higher percentage of sales of lower priced thermal coal. At December 31, 2008 there was approximately 500,000 tonnes of carryover remaining under lower priced 2007 coal year contracts, substantially all of which is expected to be delivered in the first quarter of 2009. Further, the winter months typically present challenging shipping conditions for Teck Coal that could potentially impact first quarter results and further increase the amount of carryover. Our westbound rail contract with CP Rail for the movement of coal to the ports in greater Vancouver expires at the end of March 2009. Our share of gold production is expected to be 160,000 ounces in 2009, comprised of approximately 140,000 ounces from our 40% interest in Pogo and 20,000 ounces of by-product production from our other mining operations. We are also pursuing the potential sale of our gold assets.
Capital Expenditures Our 2009 capital expenditures, excluding the Fort Hills oil sands project, are expected to be approximately $500 million, including $250 million of sustaining capital expenditures and $250 million on development projects. Our development expenditures estimate of $250 million includes $190 million for Carmen de Andacollo’s hypogene project and $30 million for Highland Valley’s mine expansion. We also expect to spend approximately $330 million on our share of costs for the Fort Hills oil sands project. We are reviewing our discretionary capital spending in light of current market conditions and our debt reduction targets.
Asset Sales In January 2009, we sold our 60% interest in the Lobo-Marte gold project in Chile to Kinross Gold Corporation (Kinross) for US$40 million in cash and approximately 5.6 million Kinross common shares. We will also receive a 1.75% net smelter return royalty, which shall not exceed US$40 million, in respect of 60% of production from Lobo-Marte, payable when gold prices exceed US$760 per ounce. We expect to record a pre-tax gain in the first quarter of 2009 of approximately CDN$160 million on the transaction. In February, 2009 we announced the sale of our interest in the Hemlo gold mines for US$65 million. The transaction is subject to customary conditions and regulatory approvals and is expected to close in the second quarter of 2009, but will have an effective date of January 1, 2009. We expect to recognize a pre-tax gain of approximately CDN$60 million on closing. We also announced in February 2009 the sale of our indirect interest in Sociedad Minera El Brocal S.A.A. for US$35 million. Closing, which is expected in the first quarter of 2009, is also subject to customary conditions and we expect to recognize a pre-tax gain of CDN$42 million upon closing. We are pursuing other asset sale initiatives with a view toward further reducing our outstanding debt.

42
Financing and Exchange Rates In order to finance the Fording transaction we arranged debt financing of US$9.8 billion, of which US$9.3 billion is outstanding. Interest charges on these facilities are based on LIBOR or US prime rates and our credit rating. The additional debt will result in a substantial increase to our existing interest expense. To the extent that we refinance or otherwise amend these facilities, we expect our interest expense to increase further. Our US dollar denominated debt will be subject to revaluation based on changes in the Canadian/US dollar exchange rate. We have designated approximately one-half of our US dollar denominated debt as a hedge against our US dollar denominated foreign operations. As a result, approximately 50% of any foreign exchange gains or losses arising on our debt will be recorded in net earnings with the remainder in other comprehensive income. The earnings impact of these revaluations will be reduced as we pay down the debt, although exchange rate fluctuations will also affect our debt to equity ratio and our interest expense.
Other Information The government of British Columbia introduced legislation to implement a carbon tax on virtually all fossil fuels effective July 1, 2008. The tax is imposed on fossil fuels used in BC and is based on a $10 per tonne of CO2-emmission equivalent, increasing by $5 per tonne each year until it reaches $30 per tonne in 2012. Based on our recent historical fuel use figures, we expect to pay carbon tax of approximately $5 million for 2008, increasing to approximately $26 million per year by 2012. Our expected carbon tax cost is primarily the result of our use of coal, diesel fuel and natural gas. The BC government has also expressed its intention to implement a cap and trade mechanism to further reduce greenhouse gas emissions. However, it has indicated that the carbon tax and the cap and trade system will be integrated to avoid double taxation. We will monitor this issue as legislation is developed.
Financial Instruments and Derivatives We hold a number of financial instruments and derivatives, the most significant of which are marketable securities, foreign exchange forward sales contracts, fixed price forward metal sales contracts, settlements receivable and price participation payments on the sale of the Cajamarquilla zinc refinery. The Cajamarquilla price participation payments are economically similar to a fixed price forward purchase of zinc. The financial instruments and derivatives are all recorded at fair values on our balance sheet with gains and losses in each period included in other comprehensive income, net earnings from continuing operations and net earnings from discontinued operations as appropriate. Some of our gains and losses on metal-related financial instruments are affected by smelter price participation and are taken into account in determining royalties and other expenses. All are subject to varying rates of taxation depending on their nature and jurisdiction. The after-tax effect of financial instruments on our net earnings for the following periods is set out in the table below:
($ in millions) 2008 2007 2006
Positive (negative) price adjustments
On prior year’s sales $ 57 $ (56) $ 42
On current year’s sales (386) (10) 71
(329) (66) 113
Other financial instruments
Derivative gains 185 14 -
Cajamarquilla sale price participation
(discontinued operations) (18) (46) 36
167 (32) 36
Total $ (162) $ (98) $ 149

Teck 2008 Annual Report 43
Critical Accounting Estimates In preparing financial statements, management has to make estimates and assumptions that affect the reported amounts of assets, liabilities, revenues and expenses. Based on historical experience, current conditions and expert advice, management makes assumptions that are believed to be reasonable under the circumstances. These estimates and assumptions form the basis for judgments about the carrying value of assets and liabilities and reported amounts for revenues and expenses. Different assumptions would result in different estimates, and actual results may differ from results based on these estimates. These estimates and assumptions are also affected by management’s application of accounting policies. Critical accounting estimates are those that affect the consolidated financial statements materially and involve a significant level of judgment by management. Management’s critical accounting estimates apply to the assessment for the impairment of property, plant and equipment and the valuation of other assets and liabilities such as inventory, plant and equipment, goodwill, investments, restoration and post-closure costs, accounting for income and resource taxes, mineral reserves, contingencies and pension and other post-retirement benefits.
Property, Plant and Equipment We capitalize development costs of mining projects when resources as defined under National Instrument 43-101 are present and it is expected that the expenditure can be recovered by future exploitation or sale. Once available for use, these costs are amortized over the proven and probable reserves to which they relate, calculated on a units of production basis. The estimation of the extent of reserves is a complex task in which a number of estimates and assumptions are made. These involve the use of geological sampling and models as well as estimates of future costs. New knowledge derived from further exploration and development of the ore body may affect reserve estimates. In addition, the estimation of economic reserves depends on assumptions regarding long-term commodity prices and in some cases exchange rates, which may prove to be incorrect. Where impairment conditions may exist, the expected undiscounted future cash flows from an asset are compared with its carrying value. These future cash flows are developed using assumptions that reflect the long-term operating plans for an asset, given management’s best estimate of the most probable set of economic conditions. Commodity prices used reflect market conditions and expectations with respect to future prices at the time the model is developed. These models are updated from time to time, and lower prices are used should market conditions deteriorate. Inherent in these assumptions are significant risks and uncertainties. In management’s view, based on assumptions which management believes to be reasonable, a reduction in the carrying value of property, plant and equipment was required at December 31, 2008 for our Duck Pond, Pend Oreille and Lennard Shelf zinc mines as described on previous pages. In addition, we also recorded impairment charges for our Petaquilla copper project, the Santa Fe nickel property and certain other exploration projects. Changes in market conditions, reserve estimates and other assumptions used in these estimates may result in future write downs.
Goodwill We allocate goodwill arising from business combinations to the reporting units acquired based on estimates of the fair value of the reporting unit. When performing goodwill impairment tests, we are also required to estimate the fair value of each reporting unit and, in some circumstances, the fair value of all identifiable assets and liabilities in a reporting unit. The fair values are estimated using a model of discounted cash flows based on proven and probable reserves and value beyond proven and probable reserves. Other major assumptions used include commodity prices, operating costs, foreign exchange rates and discount rates. In 2008 we used a long-term copper price of US$1.85 per pound in these estimations. A long-term copper price of US$1.75 per pound would have resulted in an additional $150 million in impairment charges. A long-term copper price of US$1.90 per pound would have resulted in no impairment except for $10 million at Duck Pond. We used an after-tax discount rate of 9% for reserves and higher rates for resources and exploration potential. No impairment would have been indicated at an 8% discount rate and all goodwill associated with our copper operations would have been impaired at a 10% discount rate. The fair value of our copper assets will continue to be affected by changes in long-term commodity prices, discount rates, operating and capital costs, changes in mineral reserves and the advancement of projects to the operating stage.

44
Goodwill associated with our coal assets arose primarily on our recent acquisition of the net assets of Fording. The primary assets of Fording were an interest in Teck Coal. We previously owned a 52% direct and indirect interest in Teck Coal and the underlying business units to which the goodwill is associated. As we acquired the first 52% of the underlying business units at a much lower cost base, a significant valuation buffer existed at the time of the Fording transaction. We subsequently tested the goodwill using lower coal prices with no impairment of goodwill with long-term coal prices above US$100 per tonne. Fair value estimation and impairment charges are based on management estimates and assumptions. Significant judgment is applied and actual results could differ from our estimates.
Income and Resource Taxes The determination of our tax expense for the year and its future tax liabilities and assets involves significant management estimation and judgment involving a number of assumptions. In determining these amounts, management interprets tax legislation in a variety of jurisdictions and makes estimates of the expected timing of the reversal of future tax assets and liabilities. Management also makes estimates of the future earnings, which affects the extent to which potential future tax benefits may be used. We are subject to assessments by various taxation authorities who may interpret tax legislation differently. These differences may affect the final amount or the timing of the payment of taxes. We provide for these differences, where known, based on management’s best estimate of the probable outcome of these matters.
Pension and Other Post-Retirement Benefits The cost of providing benefits through defined benefit pension plans and post-retirement benefit plans is actuarially determined. Cost and obligation estimates depend on management’s assumptions about future events, which are used by the actuaries in calculating such amounts. These include assumptions with respect to discount rates, the expected plan investment performance, future compensation increases, health care cost trends and retirement dates of employees. In addition, actuarial consultants utilize subjective assumptions regarding matters such as withdrawal and mortality rates. Actual results may differ materially from those estimates based on these assumptions.
Asset Retirement Obligations The amounts recorded for asset retirement costs are based on estimates included in closure and remediation plans. These estimates are based on engineering studies of the work that is required by environmental laws or public statements by management that results in an obligation. These estimates are based on assumptions as to the timing of remediation work and the rate at which costs may inflate in future periods. Actual costs and the timing of expenditures could differ from these estimates.
Recognition of Contingencies We are subject to a number of lawsuits and threatened lawsuits. A provision is made for amounts claimed through these lawsuits when management believes that it is more likely than not that the plaintiffs will be awarded damages or a monetary settlement will be made. Management seeks the advice of outside counsel in making such judgments when the amounts involved are material.
Adoption of New Accounting Standards and Accounting Developments
Inventories, Section 3031 In June 2007, the CICA issued Section 3031 “Inventories” to replace Section 3030. The new section, which was effective on January 1, 2008, establishes standards for the measurement and disclosure of inventories. Retrospective application of this standard did not have an impact on our financial statements.

Teck 2008 Annual Report 45
Goodwill and Intangible Assets In February 2008, the CICA issued Section 3064, “Goodwill and Intangible Assets,” which replaces Section 3062, “Goodwill and Other Intangible Assets.” This new standard provides guidance on the recognition, measurement, presentation and disclosure of goodwill and intangible assets. Concurrent with the adoption of this standard, CICA Emerging Issues Committee Abstract 27, “Revenues and Expenditures in the Pre-operating Period,” (“EIC-27”) was withdrawn. This standard is effective for our fiscal year beginning January 1, 2009 with retrospective application. Deferred start-up costs of $19 million, net of tax of $10 million, at December 31, 2008 will be written-off.
Business Combinations and Related Sections In January 2009, the CICA issued Section 1582 “Business Combinations” to replace Section 1581. Prospective application of the standard is effective January 1, 2011, with early adoption permitted. This new standard effectively harmonizes the business combinations standard under Canadian GAAP with International Financial Reporting Standards (“IFRS”). The new standard revises guidance on the determination of the carrying amount of the assets acquired and liabilities assumed, goodwill and accounting for non-controlling interests at the time of a business combination. The CICA concurrently issued Section 1601 “Consolidated Financial Statements” and Section 1602 “Non-Controlling Interests,” which replace Section 1600 “Consolidated Financial Statements.” Section 1601 provides revised guidance on the preparation of consolidated financial statements and Section 1602 addresses accounting for non-controlling interests in consolidated financial statements subsequent to a business combination. These standards are effective January 1, 2011, unless they are early adopted at the same time as Section 1582 “Business Combinations.”
International Financial Reporting Standards (IFRS) Changeover Plan Canadian GAAP for publicly listed entities will convert to International Financial Reporting Standards (IFRS) on January 1, 2011. We have completed a high-level preliminary assessment and identification of the standards that affect our financial statements, business and system processes, and we are advancing through the detailed analysis of the higher and medium priority areas. These detailed assessments are designed to determine the effect on business activities including information technology and data systems, internal controls over financial reporting and, finally, disclosure controls and procedures. We are maintaining our financial reporting expertise and ensuring our team has sufficient IFRS competencies, by addressing training requirements through ongoing sessions provided by external advisors. The education sessions are targeted to various levels of the organization. We anticipate that there will be changes in accounting policies and these changes may materially affect our financial statements.
Other Information
Outstanding Share Data As at March 4, 2009, there were 477,513,286 Class B subordinate voting shares and 9,353,470 Class A common shares outstanding. In addition, there were 6,639,280 director and employee stock options outstanding with exercise prices ranging between $4.15 and $49.17 per share. More information on these instruments and the terms of their conversion are set out in note 15 to our 2008 consolidated financial statements.

46
Contractual and Other Obligations
($ in millions) Less than
1 Year2 – 3
Years4 – 5
Years More than
5 Years Total Debt $7,845 $3,548 $357 $1,218 $12,968Operating leases 38 56 22 39 155Capital Leases 63 61 29 - 153Road and port lease at Red Dog (Note 1) 22 44 44 630 740Minimum purchase obligations (Note 2) Concentrate, supply and other purchases 186 19 8 7 220 Shipping and distribution 29 20 9 7 65Pension funding (Note 3) 62 - - - 62Other non-pension post-retirement benefits (Note 4) 11 23 26 188 248Asset retirement obligations (Note 5) 16 53 13 587 669Other long-term liabilities (Note 6) 81 35 15 51 182Contributions to the Fort Hills oil sands project (Note 7) 330 1,265 - - 1,595Contributions to Galore Creek (Note 8) 16 20 - - 36 $8,699 $5,144 $523 $2,727 $17,093 Notes:
(1) We lease road and port facilities from the Alaska Industrial Development and Export Authority through which we ship metal concentrates produced at the Red Dog mine. Minimum lease payments are US$18 million per annum and are subject to deferral and abatement for force majeure events.
(2) The majority of our minimum purchase obligations are subject to continuing operations and force majeure provisions.
(3) As at December 31, 2008 the company had a net pension deficit of $11 million based on actuarial estimates prepared on a going concern basis. The amount of minimum funding for 2009 in respect of defined benefit pension plans is $62 million. The timing and amount of additional funding after 2009 is dependent upon future returns on plan assets, discount rates, and other actuarial assumptions.
(4) We had a discounted, actuarially determined liability of $248 million in respect of other non-pension post-retirement benefits as at December 31, 2008. Amounts shown are estimated expenditures in the indicated years.
(5) We accrue environmental and reclamation obligations over the life of our mining operations and amounts shown are estimated expenditures in the indicated years at fair value, assuming credit-adjusted risk-free discount rates between 5.75% and 16.5%, and inflation factors between 2.00% and 2.75%. The liability on an undiscounted basis before inflation is estimated to be approximately $1,833 million.
(6) Other long-term liabilities include amounts for post-closure, environmental costs and other items.
(7) In November 2005, we acquired a 15% interest in the Fort Hills Energy Limited Partnership (FHELP), which is developing the Fort Hills oil sands project in Alberta, Canada. In September 2007, we acquired an additional 5% interest, bringing our total interest to 20%. To earn our additional 5% interest, we are required to contribute 27.5% of project expenditures after project spending reaches $2.5 billion and before project spending reaches $7.5 billion. We have ongoing commitments to fund FHELP during this earn-in phase totalling $1.6 billion thereafter we are responsible for our 20% share of development costs. As the project is currently on hold pending cost re-evaluation, no additional commitments are presently shown.
(8) In February 2009, we amended certain provisions of the partnership agreement relating to the Galore Creek project. Under the amended agreement, our committed funding on Galore Creek has been reduced from $72 million to $60 million including $15.8 million contributed by us on account of studies prior to December 31, 2008 and $8.6 million contributed by us on account of the November and December cash calls. Our net remaining committed funding is $36 million, which we expect to pay in 2009 and 2010.
Disclosure Controls and Internal Control over Financial Reporting
Disclosure Controls and Procedures Disclosure controls and procedures are designed to provide reasonable assurance that material information is gathered and reported to senior management, including the Chief Executive Officer and Chief Financial Officer, as appropriate to permit timely decisions regarding public disclosure. Management, including the Chief Executive Officer and Chief Financial Officer, has evaluated the effectiveness of the design and operation of our disclosure controls and procedures, as defined in the rules of the US Securities and Exchange Commission and Canadian Securities Administration, as at December 31, 2008. Based on this evaluation, the Chief Executive Officer and Chief Financial Officer have concluded that our disclosure controls and procedures were effective to ensure that information required to be disclosed in reports filed or submitted by us under United States and Canadian securities legislation is recorded, processed, summarized and reported within the time periods specified in those rules.

Teck 2008 Annual Report 47
Management’s Report on Internal Control over Financial Reporting Our management is responsible for establishing and maintaining adequate internal control over financial reporting. Any system of internal control over financial reporting, no matter how well designed, has inherent limitations. Therefore, even those systems determined to be effective can provide only reasonable assurance with respect to financial statement preparation and presentation. Management has used the Committee of Sponsoring Organizations of the Treadway Commission (COSO) framework to evaluate the effectiveness of our internal control over financial reporting. Based on this assessment, management has concluded that as at December 31, 2008, our internal control over financial reporting was effective. The effectiveness of our internal controls over financial reporting has been audited by PricewaterhouseCoopers LLP, an independent registered public accounting firm, who have expressed their opinion in their report included with our annual consolidated financial statements.
Changes in Internal Control over Financial Reporting On October 30, 2008, we completed our acquisition of Fording Canadian Coal Trust (“Fording”), which primarily consisted of Fording’s 60% interest in the Elk Valley Coal Partnership. We consider the acquisition of Fording material to our results of operations, financial position and cash flows from the date of acquisition through December 31, 2008, and believe that the internal controls and procedures at Fording have a material effect on our internal control over financial reporting. Prior to the completion of this acquisition, we included Elk Valley Coal Partnership in our evaluation of the effectiveness of our internal control over financial reporting, due to our 40% interest in the assets. We have, therefore, included Fording in our annual assessment of internal control over financial reporting for the year ended December 31, 2008. Although we have generally maintained our internal controls over financial reporting that were in effect prior to the acquisition of Fording, subsequent to the acquisition we have performed additional controls relating to the consolidation of financial information used in the preparation of the consolidated financial statements. We believe that these changes have not negatively affected our internal control over financial reporting during the year ended December 31, 2008.
Use of Non-GAAP Financial Measures Our financial statements are prepared in accordance with accounting principles generally accepted in Canada (GAAP). This annual report refers to adjusted net earnings, comparative net earnings, operating profit and operating profit before depreciation and pricing adjustments, which are not measures recognized under GAAP in Canada or the United States and do not have a standardized meaning prescribed by GAAP. For adjusted net earnings and comparative net earnings, we adjust net earnings as reported to remove the effect of unusual and/or non-recurring transactions in these measures. Operating profit is revenues less operating expenses and depreciation and amortization. Operating profit before depreciation and pricing adjustments is operating profit with depreciation, amortization and pricing adjustments added or deducted as appropriate. Pricing adjustments are described under the heading “Average Commodity Prices and Exchange Rates”. These measures may differ from those used by, and may not be comparable to such measures as reported by, other issuers. We disclose these measures, which have been derived from our financial statements and applied on a consistent basis, because we believe they are of assistance in understanding the results of our operations and financial position and are meant to provide further information about our financial results to shareholders.

48
Sustainability
Environment, Health and Safety Performance Safety is a core value. We believe that all incidents that cause harm to people, the environment and property are avoidable. Working together with our employees and contractors, our goal is “Zero Incidents” in the workplace. We are saddened to report that in 2008 a fatality occurred in July at a coal exploration project in the Elk Valley of British Columbia. We wish to express our heartfelt condolences to the family, friends and co-workers of Dennis Michael Gravelle, who worked for a contractor that provided logging services.
To renew our commitment to Zero Incidents, we completed a case study on safety practices of best-performing companies. A key strategic recommendation was to develop a Courageous Leadership program. Implementation will take place across the organization in 2009.
Total Reportable Incident Frequency (TRIF) is a comprehensive measure of safety performance. By this measure, our employees and contractors combined attained a 49% reduction in the TRIF and a 59% reduction in the lost-time injury frequency between 2007 and 2008.
Health and Safety Statistics
2008 2007 2006
Total reportable incident frequency(1) 1.32 2.58(2) 2.88
Fatalities 1 1 6
Lost-time injuries (LTI) 88 158(2) 117
LTI frequency(1) 0.40 0.97(2) 0.90
LTI severity(1) 39.28 59.86(2) 208.10
(1) Frequencies and severities are based on incidents per 200,000 hours. (2) These statistics are slightly different from those reported in our 2007 Annual Report due to injury upgrading/downgrading, claim denial by
medical professionals, or investigative results.
Our assurance program emphasizes the importance of compliance and effective environmental protection. In 2008, we completed an auditing program including three formal audits, a management standards review, and two mid-term audit reviews. As part of our sustainability initiatives, we are committed to the efficient use of energy and responsible management of associated greenhouse gas (GHG) emissions. Our long-term goal is to reduce emissions through energy efficiency improvements, the increased use of renewable energy, and, if necessary, through the use of credits and offsets. Our immediate goals include: establishing operation-specific targets and further improving processes for monitoring and reporting energy use and GHG emissions; enhancing our efforts to identify, assess and implement opportunities to improve energy efficiency; and advancing the application of our products, particularly metals, in areas that support an overall reduction in society’s carbon footprint. Sustainability is central to the core values that drive our approach to business and responsible mining. We are committed to establishing healthy communities and safe environments for our workers. Over our long history, we have worked to build relationships with people, communities and society based on mutual respect and cooperation. Communities have a voice in and should benefit from our business activities. Whether we are working directly within a community or in a remote location, we are typically operating in an area utilized by a Community of Interest (COI). Acknowledging and minimizing potential impacts on COIs prior to mining, during operation and after mine closure is critical to the success of our business.

Teck 2008 Annual Report 49
Engaging with stakeholders in meaningful dialogue, exchanging information, and creating consultative decision-making processes leads to innovative and broadly supported solutions to business development challenges. In 2008, we focused on building capacity in our community engagement program. Practitioners and community relations employees from across the company participated in community engagement and dialogue training and continue to meet in a community of practice forum, sharing, learning and developing tools and practices that will foster a more robust engagement program. We produced our third Global Reporting Initiative (GRI)-based sustainability report, for which we received a GRI A+ Application Level rating. We made several changes to the report format including a shortened printed report with more information on our website (www.teck.com), the addition of six operations new to reporting to GRI, and a new section titled “Your Concerns Our Response”, which responds to specific stakeholder concerns. Also new this year, a third party assurance review of our reporting and an independent stakeholder panel review were carried out. Teck received recognition for its sustainability performance by being named to the Dow Jones Sustainability Index (DJSI) North America in 2008. The DJSI is the first global index tracking the financial performance of the leading sustainability-driven companies worldwide.

50
People The employees of the Teck family are critical to our success. It is important that we attract talented people, ensure all employees have the necessary knowledge, skills, and abilities to perform their jobs well, and are engaged and committed to lead Teck forward. As of year-end, there were 9,000 regular, full-time employees working at Teck-operated mining and metallurgical operations and offices. In early 2009, we announced a global workforce reduction which will reduce our employment by approximately 1,000 regular, full-time and temporary positions, as well as 400 contractor jobs. Most of these reductions will occur in the first quarter of 2009, but other reductions will occur through retirement and attrition throughout 2009. These actions are always difficult, and we would like to thank each affected employee for his or her service and gratefully acknowledge their contributions to the company. Employee development continues to be a priority for us with a focus in three key skills areas: technical, operational, business and leadership. All new graduate engineers complete a four-year engineer development program. Currently over 100 engineers are participating in this program. As more employees become eligible for retirement, attracting graduating engineers and offering them comprehensive development programs becomes increasingly important. We also have well-developed apprenticeship programs for employees pursuing trades certification. About 400 employees are currently working towards completion of their apprenticeships. We continue to offer graduate level business courses through our Business Education Program in partnership with Simon Fraser University. Since 1997, 228 employees have completed at least one course through Teck’s Graduate Diploma in Business Administration program. In September 2008, we launched our first MBA program, with the first group of 25 employees working towards completing their MBA’s while continuing to work full-time. In 2008, the first group of 13 employees completed our new Emerging Leader program. This program focuses on developing future leaders for key senior positions in the company. The second group, comprising 16 employees, began in 2008 and is scheduled to complete the program in the summer of 2009. The implementation of Building Strength with People, the company’s performance management program, continued in its second year across most sites. The program encourages discussion between employees and supervisors about performance, development, and career planning. In 2008, we introduced a new online documentation program at select sites with continued expansion planned for 2009. Through our Olympic partnership, three innovative programs that focused on increasing employee engagement were launched in 2008. These programs foster personal and professional growth and seek to reward productivity improvements and innovation at work. In 2008, new long-term labour contracts were settled at three of our operations. In February 2008, four-year contracts were signed at both Carmen de Andacollo and Quebrada Blanca, and a four-year agreement was reached at Trail, in May 2008. In 2009, the only contract expiring is at Line Creek Coal Operation, near Sparwood B.C.

Teck 2008 Annual Report 51
Consolidated Financial Statements Management’s Responsibility for Financial Reporting Management is responsible for the integrity and fair presentation of the financial information contained in this annual report. Where appropriate, the financial information, including financial statements, reflects amounts based on the best estimates and judgments of management. The financial statements have been prepared in accordance with accounting principles generally accepted in Canada. Financial information presented elsewhere in the annual report is consistent with that disclosed in the financial statements. Management is responsible for establishing and maintaining adequate internal control over financial reporting. Any system of internal control over financial reporting, no matter how well designed, has inherent limitations. Therefore, even those systems determined to be effective can provide only reasonable assurance with respect to financial statement preparation and presentation. The system of controls is also supported by a professional staff of internal auditors who conduct periodic audits of many aspects of our operations and report their findings to management and the Audit Committee. Management has a process in place to evaluate internal control over financial reporting based on the criteria established by the Committee of Sponsoring Organizations of the Treadway Commission (COSO) in Internal Control-Integrated Framework. The Board of Directors oversees management’s responsibility for financial reporting and internal control systems through an Audit Committee, which is composed entirely of independent directors. The Audit Committee meets periodically with management, our internal auditors and independent auditors to review the scope and results of the annual audit and to review the financial statements and related financial reporting and internal control matters before the financial statements are approved by the Board of Directors and submitted to the shareholders. PricewaterhouseCoopers LLP, an independent registered public accounting firm, appointed by the shareholders, have audited our financial statements in accordance with Canadian generally accepted auditing standards and have expressed their opinion in the auditors’ report.
Donald R. Lindsay Ronald A. Millos President and Chief Executive Officer Senior Vice President, Finance and Chief Financial Officer
March 4, 2009

52
Independent Auditors’ Report To the Shareholders of Teck Cominco Limited We have completed integrated audits of Teck Cominco Limited’s 2008, 2007 and 2006 consolidated financial statements and of its internal control over financial reporting as at December 31, 2008. Our opinions, based on our audits, are presented below. Consolidated Financial statements We have audited the accompanying consolidated balance sheets of Teck Cominco Limited as at December 31, 2008 and December 31, 2007, and the related consolidated statements of earnings, comprehensive income, shareholders’ equity and cash flows for each of the years in the three year period ended December 31, 2008. These financial statements are the responsibility of the Company’s management. Our responsibility is to express an opinion on these financial statements based on our audits. We conducted our audits of the Company’s financial statements as at December 31, 2008 and for each of the years in the three year period then ended in accordance with Canadian generally accepted auditing standards and the standards of the Public Company Accounting Oversight Board (United States). Those standards require that we plan and perform an audit to obtain reasonable assurance about whether the financial statements are free of material misstatement. An audit of financial statements includes examining, on a test basis, evidence supporting the amounts and disclosures in the financial statements. A financial statement audit also includes assessing the accounting principles used and significant estimates made by management, and evaluating the overall financial statement presentation. We believe that our audits provide a reasonable basis for our opinion. In our opinion, the consolidated financial statements referred to above present fairly, in all material respects, the financial position of the Company as at December 31, 2008 and December 31, 2007 and the results of its operations and its cash flows for each of the years in the three year period ended December 31, 2008 in accordance with Canadian generally accepted accounting principles. Internal control over financial reporting We have also audited Teck Cominco Limited’s internal control over financial reporting as at December 31, 2008, based on criteria established in Internal Control - Integrated Framework issued by the Committee of Sponsoring Organizations of the Treadway Commission (COSO). The Company’s management is responsible for maintaining effective internal control over financial reporting and for its assessment of the effectiveness of internal control over financial reporting, included in the accompanying Management’s Report on Internal Control Over Financial Reporting. Our responsibility is to express an opinion on the Company’s internal control over financial reporting based on our audit. We conducted our audit of internal control over financial reporting in accordance with the standards of the Public Company Accounting Oversight Board (United States). Those standards require that we plan and perform the audit to obtain reasonable assurance about whether effective internal control over financial reporting was maintained in all material respects. An audit of internal control over financial reporting includes obtaining an understanding of internal control over financial reporting, assessing the risk that a material weakness exists, testing and evaluating the design and operating effectiveness of internal control based on the assessed risk, and performing such other procedures as we consider necessary in the circumstances. We believe that our audit provides a reasonable basis for our opinion.

Teck 2008 Annual Report 53
A company’s internal control over financial reporting is a process designed to provide reasonable assurance regarding the reliability of financial reporting and the preparation of financial statements for external purposes in accordance with generally accepted accounting principles. A company’s internal control over financial reporting includes those policies and procedures that (i) pertain to the maintenance of records that, in reasonable detail, accurately and fairly reflect the transactions and dispositions of the assets of the company; (ii) provide reasonable assurance that transactions are recorded as necessary to permit preparation of financial statements in accordance with generally accepted accounting principles, and that receipts and expenditures of the company are being made only in accordance with authorizations of management and directors of the company; and (iii) provide reasonable assurance regarding prevention or timely detection of unauthorized acquisition, use, or disposition of the company’s assets that could have a material effect on the financial statements. Because of its inherent limitations, internal control over financial reporting may not prevent or detect misstatements. Also, projections of any evaluation of effectiveness to future periods are subject to the risk that controls may become inadequate because of changes in conditions, or that the degree of compliance with the policies or procedures may deteriorate. In our opinion, the Company maintained, in all material respects, effective internal control over financial reporting as at December 31, 2008 based on criteria established in Internal Control — Integrated Framework issued by the COSO.
Chartered Accountants Vancouver BC March 4, 2009

54
Consolidated Statements of Earnings Years ended December 31 (Cdn$ in millions, except per share data) 2008 2007 2006
Revenues $ 6,904 $ 6,371 $ 6,539
Operating expenses (4,009) (3,300) (2,714)
2,895 3,071 3,825
Depreciation and amortization (513) (333) (264)
Operating profit 2,382 2,738 3,561
Other expenses General and administration (89) (109) (96) Interest and financing (Note 11(h)) (182) (85) (97) Exploration (135) (105) (72) Research and development (23) (32) (17) Asset impairment (Note 16) (589) (69) -
Other income (expense) (Note 17) 31 170 316
Earnings before the undernoted items 1,395 2,508 3,595
Provision for income and resource taxes (Note 13) (658) (795) (1,213) Non-controlling interests (82) (47) (19) Equity earnings (loss) (Note 6(c)) 22 (5) 32
Net earnings from continuing operations 677 1,661 2,395
Net earnings (loss) from discontinued operations (Note 21(b)) (18) (46) 36
Net earnings $ 659 $ 1,615 $ 2,431
Earnings per share (Note 15(h))
Basic $ 1.46 $ 3.74 $ 5.77
Basic from continuing operations $ 1.50 $ 3.85 $ 5.68
Diluted $ 1.45 $ 3.72 $ 5.60
Diluted from continuing operations $ 1.49 $ 3.83 $ 5.52
Weighted average shares outstanding (millions) 452.1 432.2 421.9
Shares outstanding at end of year (millions) 486.9 442.7 432.4
The accompanying notes are an integral part of these financial statements.

Teck 2008 Annual Report 55
Consolidated Statements of Cash Flows Years ended December 31
(Cdn$ in millions) 2008 2007 2006
Operating activities Net earnings from continuing operations $ 677 $ 1,661 $ 2,395 Items not affecting cash
Depreciation and amortization 513 333 264 Provision (recovery) for future income and resource taxes 1,488 (97) 59 Equity (earnings) loss (22) 5 (32) Non-controlling interests 82 47 19 Asset impairment 589 69 - Provision for marketable securities 292 - - Gain on sale of investments and assets (16) (55) (201) Other 28 55 70
Distributions received from equity accounted investments 65 25 37 Net change in non-cash working capital items (Note 19(b)) (1,564) (282) 299
2,132 1,761 2,910 Investing activities
Property, plant and equipment (939) (571) (391) Investments and other assets (659) (724) (272) Acquisition of Fording Canadian Coal Trust (Note 4(a)) (11,639) (599) - Acquisition of Aur Resources Inc. (Note 4(d)) - (2,588) - Proceeds from sale of investments and assets 29 194 885 Proceeds from other assets 187 - - Decrease (increase) in temporary investments (11) 194 759 Decrease (increase) in cash held in trust - 105 (105)
(13,032) (3,989) 876 Financing activities
Issuance of debt 11,842 14 123 Repayment of debt (Note 11(i)) (1,228) - (333) Issuance of Class B subordinate voting shares 6 13 16 Purchase and cancellation of Class B subordinate voting shares - (577) - Dividends paid (442) (426) (296) Distributions to non-controlling interests (102) (42) (5) Redemption of exchangeable debentures - (105) (340) Other (13) - (5)
10,063 (1,123) (840) Effect of exchange rate changes on cash and cash equivalents held in U.S. dollars 241 (335) 10
Increase (decrease) in cash and cash equivalents from continuing operations (596) (3,686) 2,956
Cash received from discontinued operations (Note 21(b)) 38 40 -
Increase (decrease) in cash and cash equivalents (558) (3,646) 2,956
Cash and cash equivalents at beginning of year 1,408 5,054 2,098
Cash and cash equivalents at end of year $ 850 $ 1,408 $ 5,054 The accompanying notes are an integral part of these financial statements.

56
Consolidated Balance Sheets As at December 31
2008 2007
ASSETS
Current assets Cash and cash equivalents $ 850 $ 1,408 Temporary investments 11 - Income taxes receivable 1,130 33 Accounts and settlements receivable 769 560
Inventories (Note 5) 1,339 1,004
4,099 3,005
Investments (Note 6) 948 1,506
Property, plant and equipment (Note 7) 23,909 7,807
Other assets (Note 8) 853 592
Goodwill (Note 9) 1,724 663
$ 31,533 $ 13,573
LIABILITIES AND SHAREHOLDERS’ EQUITY
Current liabilities Accounts payable and accrued liabilities (Note 10) $ 1,506 $ 1,238 Current portion of long-term debt (Note 11) 1,336 31
Short-term debt (Note 11) 6,436 -
9,278 1,269
Long-term debt (Note 11) 5,102 1,492
Other liabilities (Note 12) 1,184 994
Future income and resource taxes (Note 13(c)) 4,965 2,007
Non-controlling interests (Note 14) 104 92
Shareholders' equity (Note 15) 10,900 7,719
$ 31,533 $ 13,573
Liquidity risk (Note 2) Commitments and contingencies (Note 20) Subsequent events (Note 4(e), 6(a) and 20(a))
Approved on behalf of the Board of Directors
HUGH J. BOLTON KEITH E. STEEVES Chairman of the Audit Committee Director
The accompanying notes are an integral part of these financial statements.

Teck 2008 Annual Report 57
Consolidated Statements of Shareholders’ Equity Years ended December 31 (Cdn$ in millions) 2008 2007 2006
Class A common shares (Note 15)
Balance - beginning of year $ 7 $ 7 $ 7 Balance - end of year 7 7 7
Class B subordinate voting shares Balance - beginning of year 3,274 2,398 2,148 Issued on exercise of options (Note 15(e)) 7 16 20 Issued on settlement of exchangeable debentures - - 230 Issued on business acquisitions (Note 4(a) and 4(d)) 1,504 952 - Issued on asset acquisition (Note 4(b)) 287 - - Purchased through share repurchase program (Note 15(j)) - (92) - Balance - end of year 5,072 3,274 2,398
Retained earnings Balance - beginning of year as previously reported 5,038 4,225 2,228 Adoption of financial instruments standards - 112 - Net earnings 659 1,615 2,431 Dividends declared (221) (431) (431) Class B subordinate voting shares repurchased (Note 15(j)) - (483) - Interest on exchangeable debentures, net of taxes (Note 15(d)) - - (3) Balance - end of year 5,476 5,038 4,225
Contributed surplus Balance - beginning of year 71 64 61 Stock-based compensation expense (Note 15(e)) 13 11 7 Transfer to Class B subordinate voting shares on exercise of options (2) (2) (4) Share repurchase program (Note 15(j)) - (2) - Balance - end of year 82 71 64
Accumulated other comprehensive income (loss) (Note 15(g)) 263 (671) (145)
Total shareholders' equity $ 10,900 $ 7,719 $ 6,549
Consolidated Statements of Comprehensive Income
Years ended December 31
(Cdn$ in millions) 2008 2007 2006
Net earnings $ 659 $ 1,615 $ 2,431
Other comprehensive income (loss) in the year Changes in foreign currency translation adjustments 1,003 (550) 23 Changes in unrealized gains and losses of available-for-sale instruments (48) (36) -
Changes in unrealized gains and losses of derivatives designated as cash flow hedges (21) 10 -
Total other comprehensive income (loss) (Note 15(g)) 934 (576) 23
Comprehensive income $ 1,593 $ 1,039 $ 2,454 The accompanying notes are an integral part of these financial statements.

58
Notes to Consolidated Financial Statements Years ended December 31, 2008, 2007 and 2006 1. Nature of Operations
Teck Cominco Limited and its subsidiaries (“we,” “us,” or “our”) are engaged in mining and related activities including exploration, development, processing, smelting and refining. Our major products are copper, metallurgical coal and zinc. We also produce precious metals, lead, molybdenum, electrical power, fertilizers and various specialty metals. Metal products are sold as refined metals or concentrates. We also own an interest in certain oil sands leases and have a partnership interest in an oil sands development project.
2. Liquidity Risk
Our consolidated financial statements have been prepared on a going concern basis, which contemplates the realization of assets and the settlement of liabilities in the normal course of business. Liquidity risk is the risk that we will not be able to meet our financial obligations as they become due. On September 30, 2008, we entered into definitive financing agreements related to bridge and term loan facilities and the conditions precedent to our purchase of the assets of the Fording Canadian Coal Trust (“Fording”) and our lenders’ funding obligations were substantially satisfied. Our original plan for the acquisition was to refinance a substantial portion of the acquisition facilities prior to or shortly after closing of the transaction with various types of long-term debt and to repay the balance with cash flow from operating activities prior to the maturity of the term facility. In the fourth quarter of 2008 and prior to the closing of the transaction, conditions in the credit markets deteriorated substantially, effectively closing the credit markets to us. These credit market conditions had a serious impact on the global economy, which has contributed to a significant and rapid decline in the demand for and selling price of the base metal products we produce. As a result of these conditions, which have continued into 2009, our credit ratings were lowered and our share price has declined substantially. Current weak global economic conditions and the downgrade in our credit ratings make access to the credit and capital markets difficult for us, which may compromise our ability to repay or refinance all or a portion of the acquisition loans as they become due. We are currently in compliance with the financial covenants under our credit agreements, which establish a maximum debt to total capitalization ratio of 60% at the end of each calendar quarter until it declines to 50% at September 30, 2009. At December 31, 2008, our debt to total capitalization ratio was 54%. To maintain our current production forecasts for 2009, we expect capital spending of approximately $500 million in 2009 and with the re-scaling of that project, our contributions to the Fort Hills Energy Limited Partnership (“FHELP”) are expected to decline to $330 million for our share of the remaining costs necessary to get to a sanctioning decision. Based on expected free cash flow we will not generate sufficient funds from operations to repay the entire obligation on the bridge facility that is due on October 29, 2009, and will need to generate funds from other sources to do so, or will need an extension or refinancing of the bridge loan. As at December 31, 2008, US$5.3 billion of the bridge facility and US$4 billion of the term facility were outstanding. All of the bridge facility and US$1.1 billion of the term facility is due on or before October 29, 2009. To address our near-term liquidity requirements, we have begun discussions with our lenders to negotiate amendments to the bridge facility to provide us with additional time to generate cash and/or access appropriate sources of long-term financing to repay the bridge facility. There can be no assurance that these negotiations will be successful. We have also taken a number of other steps to assist us in meeting our repayment obligations, including suspending the dividends on our Class A common and Class B subordinate voting shares, reducing capital and discretionary spending, expediting tax refunds of $1.1 billion, closing unprofitable operations and reducing the size of our global workforce by approximately 13%. To date we have sold our interest in the Lobo-Marte gold property for US$40 million, and 5.6 million Kinross shares, and have announced the sale of our interest in the Hemlo mines for US$65 million, and our indirect interest in a Peruvian company, Sociedad Minera El Brocal S.A.A., for US$35 million. We are also pursuing other potential asset sales. There can be no assurance that we will be able to complete further sufficient asset sales on a timely basis.

Teck 2008 Annual Report 59
2. Liquidity Risk, continued Our ability to repay or refinance the bridge facility prior to its maturity and make the quarterly instalment payments on the term facility depends on a number of factors, some of which are beyond our control. These include general global economic, credit and capital market conditions, and the demand for and selling price of our products, in particular, metallurgical coal. There can be no assurance that our credit ratings will not be downgraded further, which would further increase our costs of borrowing and further limit our ability to refinance our existing debt. There is no assurance that the expected cash flows from operations in combination with asset sales and other steps being taken will allow us to meet these obligations as they become due, that we will continue to meet the financial covenants under our various lending agreements, or that we will be successful in renegotiating or refinancing the bridge facility. Accordingly, it is possible that we could be in default of our various lending agreements prior to the end of 2009, which could result in outstanding obligations becoming immediately due and payable unless we can obtain waivers from the lenders. Although we have approximately $1.1 billion in unused credit lines under various bank credit facilities, there can be no assurance, given our current financial condition, that these credit lines will be available to us if we should need to draw on them, or that our maturing credit lines of US$50 million and miscellaneous letters of credit totalling $258 million will be renewed in the ordinary course. Our existing debt obligations will constrain our capital spending and that may have an adverse effect on our operations. Our debt levels will also limit our ability to expand our operations or make other investments that would enhance our competitiveness. In a cyclical industry such as ours, history has shown that periodic spikes in commodity prices can result in substantial increases in our company’s cash flow. Many of our major operations are long-life assets with significant reserves and resources and have lives exceeding 20 years based on current production levels. If we are to realize the benefit of the economic recovery when in occurs, we must more closely match the term of our debt structure to the life of our assets. We believe that our access to financial resources through capital markets transactions has been limited mainly due to the effective closure of the capital markets brought about by the significant deterioration in the financial markets in the latter half of 2008, which we believe has also contributed to the significant decline in the demand for and selling price of our products. Accordingly, there is some risk that the steps described above will not be successful in allowing us to meet our obligations, which may require us to sell core assets or raise debt or equity capital, which management believes would enable us to satisfy our obligations as they fall due. However, these actions may have a material adverse effect on our business and on the market prices of our equity and debt securities.
3. Significant Accounting Policies a) Basis of Presentation, Accounting Principles and Adoption of New Accounting Standards
Generally Accepted Accounting Principles Our consolidated financial statements are prepared using Canadian Generally Accepted Accounting Principles (“Canadian GAAP”). Note 24 reconciles the consolidated financial statements prepared in accordance with Canadian GAAP to financial statements prepared in accordance with United States Generally Accepted Accounting Principles (“US GAAP”). Basis of Presentation Our consolidated financial statements include the accounts of Teck Cominco Limited and all of its subsidiaries. Our significant operating subsidiaries include Teck Cominco Metals Ltd. (“TCML”), Teck Cominco American Inc. (“TCAI”), Teck Cominco Alaska Inc. (“TCAK”), Highland Valley Copper Partnership (“Highland Valley Copper”), Teck Coal Partnership (“Teck Coal,” previously known as Elk Valley Coal Partnership), Compañia Minera Quebrada Blanca S.A. (“Quebrada Blanca”) and Compañia Minera Carmen de Andacollo (“Andacollo”).

60
3. Significant Accounting Policies, continued
Many of our mining activities are conducted through interests in entities where we share joint control including Compañia Minera Antamina (“Antamina”) and Pogo Joint Venture (“Pogo”). These entities are accounted for using the proportionate consolidation method. We shared joint control of Teck Coal prior to our acquisition of Fording’s 60% interest in Teck Coal in October 2008 (Note 4(a)). We also consolidate entities that are variable interest entities where we are the primary beneficiary. Certain comparative figures have been reclassified to conform to the presentation adopted for the current period. All dollar amounts are in Canadian dollars unless otherwise specified. Inventories In June 2007, the Canadian Institute of Chartered Accountants (“CICA”) issued Section 3031 “Inventories” to replace Section 3030. The new section, which was effective on January 1, 2008, establishes standards for the measurement and disclosure of inventories. Retrospective application of this standard did not have an effect on our financial statements.
b) Significant Accounting Policies
Use of Estimates The preparation of our financial statements in conformity with GAAP requires estimates and assumptions that affect the amounts reported in the consolidated financial statements. Significant areas where judgment is applied include asset and investment valuations, ore reserve estimation, finished and in-process inventory quantities, plant and equipment lives, goodwill, contingent liabilities including matters in litigation, variable interest entities, tax rates, provisions and future tax balances including valuation allowances in respect of future tax balances, asset retirement obligations, other environmental liabilities, pension and other post-retirement benefits and other accrued liabilities.
As at December 31, 2008, global market conditions were unsettled and volatile. In these circumstances, assumptions for value of non-exchange traded assets and business units are even more subject to variability. These valuations are the basis of impairment testing, particularly in respect of goodwill. Actual results could differ from our estimates.
Translation of Foreign Currencies The functional currency of Teck Cominco Limited, the parent entity, is the Canadian dollar. For our integrated foreign operations, monetary assets and liabilities are translated at year end exchange rates and other assets and liabilities are translated at historical rates. Revenues, expenses and cash flows are translated at monthly average exchange rates. Gains and losses on translation of monetary assets and monetary liabilities are charged to earnings.
The accounts of our self-sustaining foreign operations are translated at year end exchange rates, and revenues and expenses are translated at monthly average exchange rates. Differences arising from these foreign currency translations are recorded in other comprehensive income until they are realized by a reduction in the investment. Financial Instruments We recognize financial assets and liabilities on the balance sheet when we become a party to the contractual provisions of the instrument.
Cash and cash equivalents
Cash and cash equivalents include cash on account, demand deposits and money market investments with maturities from the date of acquisition of three months or less, which are readily convertible to known amounts of cash and are subject to insignificant changes in value.

Teck 2008 Annual Report 61
3. Significant Accounting Policies, continued
Temporary investments Temporary investments are designated as available-for-sale. These investments include money market instruments with maturities of greater than three months from the date of acquisition. Trade receivables and payables Trade receivables and payables are non-interest bearing and are stated at carrying values, which approximate fair values due to the short terms to maturity. Where necessary, trade receivables are net of allowances for uncollectable amounts.
Investments in marketable securities Investments in marketable securities are designated as available-for-sale and recorded at fair value. Fair values are determined by reference to quoted market prices at the balance sheet date. Unrealized gains and losses on available-for-sale investments are recognized in other comprehensive income until investments are disposed of or when an other-than-temporary decline in value occurs. Investment transactions are recognized on the trade date with transaction costs included in the underlying balance. At each balance sheet date, we assess for any impairment in value that is considered to be other than temporary, and record such impairments in net earnings for the period. Short-term debt and long-term debt
Short-term debt and long-term debt are initially recorded at total proceeds received less direct issuance costs. Debt is subsequently measured at amortized cost, calculated using the effective interest rate method.
Derivative instruments
Derivative instruments, including embedded derivatives, are recorded on the balance sheet at fair value. Unrealized gains and losses on derivatives held for trading are recorded as part of other income (expense) in net earnings. Fair values for derivative instruments held for trading are determined using valuation techniques. These valuations use assumptions based on market conditions existing at the balance sheet date. Derivatives embedded in non-derivative contracts are recognized separately unless they are closely related to the host contract.
Hedging Certain derivative investments may qualify for hedge accounting. For fair value hedges, any gains or losses on the hedging instrument relating to both the effective and ineffective portion of the hedge are recognized in net earnings, which offsets the fair value changes in the hedged item. For cash flow hedges, any unrealized gains and losses on the hedging instrument relating to the effective portion of the hedge are initially recorded in other comprehensive income. Gains and losses are recognized in net earnings upon settlement of the hedging instrument, when the hedged item ceases to exist, or when the hedge is determined to be ineffective.
For hedges of net investments in self-sustaining operations, any foreign exchange gains or losses on the hedging instrument relating to the effective portion of the hedge are initially recorded in other comprehensive income. Gains and losses are recognized in net earnings on the ineffective portion of the hedge, or when there is a reduction in the net investment in the self-sustaining operation being hedged.

62
3. Significant Accounting Policies, continued
Inventories Finished products, work in process and raw material inventories are valued at the lower of cost and net realizable value. Raw materials include concentrates for use at smelting and refining operations. Work in process inventory includes inventory in the milling, smelting or refining process and stockpiled ore at mining operations.
For work in process and finished product inventories, cost includes all direct costs incurred in production including direct labour and materials, freight, depreciation and amortization and directly attributable overhead costs. Waste rock stripping costs related to mine production are included in the cost of inventories as incurred. When inventories have been written down to net realizable value, we make a new assessment of net realizable value in each subsequent period. If the circumstances that caused the write-down no longer exist, the amount of the write-down is reversed.
We use both joint-product and by-product costing for work in process and finished product inventories. Joint costing is applied to primary products at the Red Dog, Antamina, Duck Pond and Pend Oreille mines and the Trail operations, where the profitability of the operation is dependent upon the production of a number of primary products. Joint costing allocates total production costs based on the relative values of the products. Where by-product costing is used, by-products are allocated the incremental costs of processes that are specific to the production of that product. Supplies inventory is valued at the lower of average cost and net realizable value. Cost includes acquisition, freight and other directly attributable costs. Investments Subject to Significant Influence
Investments over which we exercise significant influence are accounted for using the equity method. We also equity account for variable interest entities of which we are not the primary beneficiary. At each balance sheet date, we assess the value of these investments for impairment. Property, Plant and Equipment
Plant and equipment
Plant and equipment are recorded at cost. The cost of buildings, plant and processing equipment at our mining operations is amortized on a units-of-production basis over the lesser of the estimated useful life of the asset and the estimated proven and probable ore reserves. Amortization of plant and equipment at our smelting operations is calculated on a straight-line basis over the estimated useful life of the asset. Mobile equipment is depreciated over the estimated equipment operating hours. Buildings are amortized on a straight-line basis over their estimated useful life, not exceeding the estimated life of the mine.
When we incur debt directly related to the construction of a new operation or major expansion, the interest and financing costs associated with such debt are capitalized during the construction period. Mineral properties and mine development costs The cost of acquiring and developing mineral properties or property rights, including costs incurred during production to increase future output by providing access to additional sources of reserves, are deferred. Once available for use, mineral properties and mine development costs are amortized on a units-of-production basis over the proven and probable reserves to which they relate.

Teck 2008 Annual Report 63
3. Significant Accounting Policies, continued Underground mine development costs are amortized using the block amortization method. Development costs associated with each distinct section of the mine are amortized over the reserves to which they relate.
Exploration and evaluation costs are charged to earnings in the year in which they are incurred, except where these costs relate to specific properties for which resources, as defined under National Instrument 43-101, exist and it is expected that the expenditure can be recovered by future exploitation or sale, in which case they are deferred. Development costs of oil sands properties
The costs of acquiring, exploring, evaluating and developing oil sands properties are deferred when it is expected that these costs will be recovered through future exploitation or sale of the property. Asset impairment We perform impairment tests on our property, plant and equipment when events or changes in circumstances occur that indicate the carrying value of an asset may not be recoverable. Estimated future cash flows are calculated using estimated future prices, mineral resources, operating and capital costs on an undiscounted basis. When the carrying value of the mine or development project exceeds estimated undiscounted future cash flows, the asset is impaired. Write-downs are recorded to the extent the carrying value exceeds the discounted value of the estimated future cash flows. Repairs and maintenance Repairs and maintenance costs, including shutdown maintenance costs, are charged to expense as incurred, except when these repairs significantly extend the life of an asset or result in an operating improvement. In these instances the portion of these repairs relating to the betterment is capitalized as part of plant and equipment.
Goodwill We allocate goodwill arising from business combinations to the reporting units acquired based on estimates of the fair value of the reporting unit. Any excess of the fair value of a reporting unit over the fair value of the sum of its individual assets and liabilities is considered goodwill for that reporting unit. We perform goodwill impairment tests annually and when there are impairment indicators. This impairment assessment involves estimating the fair value of each reporting unit that has been assigned goodwill. We compare the fair value to the total carrying amount of each reporting unit, including goodwill. If the carrying amount exceeds fair value, then we estimate the fair values of all identifiable assets and liabilities in the reporting unit, and compare this net fair value of assets less liabilities to the estimated fair value of the entire reporting unit. The difference represents the fair value of goodwill. If the carrying amount of goodwill exceeds this amount, we reduce goodwill by a charge to earnings in the amount of the excess.
The fair value of assets and liabilities are estimated using a model of discounted cash flows based on proven and probable reserves and value beyond proven and probable reserves. Other major assumptions include commodity prices, operating costs, foreign exchange rates and discount rates. Circumstances which result in an impairment and write-down of goodwill could arise through a variety of factors including a reduction in the reserve or resource base of the mineral property, a reduction in expected future prices for the commodities produced, or other factors, including changes in the timing of project development, host country tax regime and external economic factors. In addition, general economic and capital market conditions at the balance sheet date could result in a diminution of fair value that would result in an impairment of goodwill.

64
3. Significant Accounting Policies, continued Revenue Recognition Sales are recognized when title transfers, the rights and obligations of ownership pass to the customer and the price is reasonably determinable. The majority of our metal concentrates are sold under pricing arrangements where final prices are determined by quoted market prices in a period subsequent to the date of sale. In these circumstances, revenues are recorded at the time of sale based on forward prices for the expected date of the final settlement. As a result, the value of our concentrate receivables change as the underlying commodity market prices vary. This component of the contract is an embedded derivative, which is recorded at fair value with changes in fair value recorded in revenues.
Income and Resource Taxes
Current income taxes are recorded based on the estimated income and resource taxes receivable or payable on taxable income for the current year. Future income tax assets and liabilities are recognized based on the difference between the tax and accounting values of assets and liabilities and are calculated using substantively enacted tax rates for the periods in which the differences are expected to reverse. Tax rate changes are recognized in earnings in the period of substantive enactment. Future tax assets are recognized to the extent that they are considered more likely than not to be realized.
We are subject to assessments by various taxation authorities which may interpret tax legislation differently. The final amount of taxes to be paid depends on a number of factors including outcomes of audits, appeals, disputes, negotiations and litigation. We provide for such differences based on our best estimate of the probable outcome of these matters. Pension and Other Employee Future Benefits Defined benefit pension plans Defined benefit pension plan obligations are based on actuarial determinations. The projected benefit method prorated on services is used to determine the accrued benefit obligation. Actuarial assumptions used in the determination of defined benefit pension plan liabilities and non-pension post-retirement benefits are based upon our best estimates, including discount rate, expected plan performance, salary escalation, expected health care costs and retirement dates of employees. The expected return on plan assets is estimated based on the fair value of plan assets, asset allocation and expected long-term rates of return.
Past service costs and transitional assets or liabilities are amortized on a straight-line basis over the expected average remaining service period of active employees expected to receive benefits under the plan up to the full eligibility date.
Differences between the actuarial liabilities and the amounts recorded in the financial statements will arise from changes in plan assumptions, changes in benefits, or through experience as results differ from actuarial assumptions. Cumulative differences which are greater than 10% of either the fair value of the plan assets or the accrued benefit obligation, whichever is greater, are amortized over the average remaining service life of the related employees. Defined contribution pension plans The cost of providing benefits through defined contribution plans is charged to earnings as the obligation to contribute is incurred.

Teck 2008 Annual Report 65
3. Significant Accounting Policies, continued Non-pension post-retirement plans
We provide certain health care benefits for certain employees when they retire. The cost of these benefits is expensed over the period in which the employees render services. These non-pension post-retirement benefits are funded by us as they become due.
Stock-Based Compensation The fair value method of accounting is used for stock-based compensation awards. Under this method, the cost of options and other stock-based compensation arrangements is recorded based on the estimated fair values at the grant date and charged to earnings over the vesting period. For employees eligible for normal retirement prior to vesting, the expense is charged to earnings over the period from the grant date to the date they are eligible for retirement.
Stock-based compensation expense relating to deferred and restricted share units is accrued over the vesting period of the units based on the quoted market value of Class B subordinate voting shares. As these awards will be settled in cash, the expense and liability are adjusted each reporting period for changes in the underlying share price. Research and Development Research costs are expensed as incurred. Development costs are only deferred when the product or process is clearly defined, the technical feasibility has been established, the future market for the product or process is clearly defined and we are committed to, and have the resources to, complete the project.
Asset Retirement Obligations
Future obligations to retire an asset including dismantling, remediation and ongoing treatment and monitoring of the site are initially recognized and recorded as a liability at fair value, based on estimated future cash flows, our current credit adjusted risk-free discount rate and an estimated inflation factor. The liability is adjusted for changes in the expected amounts and timing of cash flows required to discharge the liability and accreted to full value over time through periodic charges to earnings. For operating properties, the amount of the asset retirement liability initially recognized and any subsequent adjustments are capitalized as part of the asset’s carrying value and amortized over the asset’s estimated useful life. For closed properties, any adjustments to the liability are charged to other income (expense). Asset retirement obligations are only recorded when the timing or amount of remediation costs can be reasonably estimated. Earnings per Share Earnings per share are calculated based on the weighted average number of shares outstanding during the year. We follow the treasury stock method for the calculation of diluted earnings per share. Under this method, dilution is calculated based upon the net number of common shares issued should “in-the-money” options and warrants be exercised and the proceeds be used to repurchase common shares at the average market price in the year. Dilution from convertible securities is calculated based on the number of shares to be issued after taking into account the reduction of the related after-tax interest expense.

66
3. Significant Accounting Policies, continued
c) New Canadian Accounting Pronouncements
Goodwill and intangible assets
In February 2008, the CICA issued Section 3064, “Goodwill and Intangible Assets,” which replaces Section 3062, “Goodwill and Other Intangible Assets.” This new standard provides guidance on the recognition, measurement, presentation and disclosure of goodwill and intangible assets. Concurrent with the adoption of this standard, CICA Emerging Issues Committee Abstract 27, “Revenues and Expenditures in the Pre-operating Period,” (“EIC-27”) was withdrawn.
This standard is effective for our fiscal year beginning January 1, 2009 with retrospective application. Deferred start-up costs of $19 million, net of tax of $10 million, at December 31, 2008 will be written-off. Business combinations and related sections In January 2009, the CICA issued Section 1582 “Business Combinations” to replace Section 1581. Prospective application of the standard is effective January 1, 2011, with early adoption permitted. This new standard effectively harmonizes the business combinations standard under Canadian GAAP with International Financial Reporting Standards (“IFRS”). The new standard revises guidance on the determination of the carrying amount of the assets acquired and liabilities assumed, goodwill and accounting for non-controlling interests at the time of a business combination. The CICA concurrently issued Section 1601 “Consolidated Financial Statements” and Section 1602 “Non-Controlling Interests,” which replace Section 1600 “Consolidated Financial Statements.” Section 1601 provides revised guidance on the preparation of consolidated financial statements and Section 1602 addresses accounting for non-controlling interests in consolidated financial statements subsequent to a business combination. These standards are effective January 1, 2011, unless they are early adopted at the same time as Section 1582 “Business Combinations.”
4. Acquisitions and Dispositions
a) Acquisition of Fording Canadian Coal Trust In October 2008, we acquired all of the assets of Fording, which consisted primarily of a royalty interest in respect of Fording’s 60% non-operating interest in Teck Coal, previously known as Elk Valley Coal Partnership (“EVCP”). Teck Coal operates six metallurgical coal mines located in south eastern British Columbia and west central Alberta. Prior to the acquisition we were the managing partner of Teck Coal and owned a 52% effective interest in the partnership. This was comprised of a 40% direct interest in Teck Coal and a 19.6% interest in the outstanding units of Fording. We acquired an 8.7% interest in Fording in 2003 for $150 million and a further 11.2% interest in 2007 for $599 million. Our 19.6% interest in Fording, represented by 29.5 million Fording units, was an effective 11.8% interest in Teck Coal and we accounted for this interest using the equity method. We recorded equity earnings from Fording until October 30, 2008. As part of the plan of arrangement to acquire the assets of Fording, we sold our Fording units. The net proceeds of approximately $2.9 billion were used to partially fund the acquisition of Fording’s assets. The net proceeds from the disposition of the units have been offset against the purchase price of Fording’s assets. These transactions resulted in the acquisition of an 80.4% interest in the assets and liabilities of Fording.

Teck 2008 Annual Report 67
4. Acquisitions and Dispositions, continued The separate acquisitions have been accounted for using the purchase method. Accordingly, the values assigned to assets acquired and liabilities assumed from Fording reflect the nature of a step-by-step purchase with the assets and liabilities measured at their estimated individual fair values on each respective date of acquisition. Our consolidated earnings and cash flows include 100% of Fording’s results of operations from October 30, 2008. The purchase cost of $13,644 million was funded with a combination of cash and Class B subordinate voting shares as follows:
(Cdn $ in millions)
Cash $ 14,635 Issuance of 36,828,787 Class B subordinate voting shares 1,504 Proceeds on disposal of Fording units (2,870) Transaction costs, including taxes 375
Total purchase price $ 13,644 Each Class B subordinate voting share was valued at $42.98, being the average closing price on the Toronto Stock Exchange for two trading days before and one trading day after the announcement of our offer for Fording, less deemed issuance costs. Our allocation of the purchase cost to the assets acquired and liabilities assumed is based upon estimated fair values at the time of acquisition. We have substantially completed the process of determining fair values for assets acquired and liabilities assumed. Matters still under review principally relate to income and resource taxes and could affect values assigned to future tax liabilities and goodwill. As a result, the purchase price allocation is subject to change in 2009 as the valuation process is completed.

68
4. Acquisitions and Dispositions, continued Our current allocation of the purchase price to the estimated fair value of the assets and liabilities of Fording from the various steps is as follows:
(Cdn $ in millions) 2003 and 2007 2008 Total
Cash $ 25 $ 101 $ 126 Accounts receivable 45 187 232 Inventory 33 327 360 Property, plant and equipment 849 13,438 14,287 Goodwill 308 883 1,191 Future income and resource tax assets - 1,400 1,400 Other 5 15 20
Total assets acquired 1,265 16,351 17,616
Current liabilities (50) (292) (342) Derivative instrument liability (58) (239) (297) Long-term debt (8) (281) (289) Long-term liabilities (36) (147) (183) Future income and resource tax liabilities (273) (1,735) (2,008) Non-controlling interests (1) (13) (14)
Total liabilities assumed (426) (2,707) (3,133)
Net assets acquired $ 839 $ 13,644 $ 14,483 The goodwill balances arising from the Fording acquisitions are in part due to the accounting requirement to recognize a future tax liability but also reflect, for the 2008 purchase, changes in expected future coal prices and US/Canadian dollar exchange rates between the date of the acquisition announcement in July 2008 and the closing of the acquisition on October 30, 2008.
The net cash cost of the acquisition was as follows:
(Cdn $ in millions) 2008
Cash paid to Fording unit holders $ 14,635 Less cash proceeds on disposal of Fording units (2,870) Less Fording’s cash balance on acquisition date (126)
$ 11,639 b) Acquisition of Relincho Copper Project
In August 2008, we completed the acquisition of the Relincho copper project in Chile by way of a plan of arrangement involving Global Copper Corp., the owner of the project. The purchase price was $424 million, being $136 million paid in cash, the issuance of 6.9 million Class B subordinate voting shares valued at $287 million, less $1 million of transaction costs. We accounted for this transaction as an asset acquisition and recorded a future income tax liability based upon the difference between the accounting and tax basis of the assets acquired. The purchase price has been allocated as follows: $681 million to mineral properties, $252 million to future income tax liability and $5 million to net liabilities assumed.

Teck 2008 Annual Report 69
4. Acquisitions and Dispositions, continued
c) Disposition of Minera Petaquilla
In March 2008, we satisfied contractual requirements to earn a 26% equity interest in Minera Petaquilla S.A. (“MPSA”), the Panamanian company that holds the Petaquilla concession. We also entered into an agreement with Inmet Mining Corporation (“Inmet”), whereby Inmet would provide our share of the required project funding on an interim basis, and act as operators of the project on our behalf. In November 2008, we elected to withdraw from the Petaquilla project and our 26% interest in MPSA was assigned to Inmet. We have no further funding obligations for this project.
Our withdrawal from the project resulted in a pre-tax, non-cash charge of $22 million, which is included in the asset impairment charges disclosed in Note 16.
d) Acquisition of Aur Resources Inc.
In August 2007, we acquired 100% of the outstanding common shares of Aur Resources Inc. (“Aur”) for $4,054 million. Aur owned interests in the Quebrada Blanca (76.5%) and Andacollo (90%) copper mines located in Chile and the Duck Pond (100%) copper-zinc mine located in Newfoundland, Canada. We accounted for the acquisition of Aur using the purchase method. Aur’s results of operations are included in our consolidated financial statements from August 22, 2007. The purchase cost of $4,054 million was funded with a combination of cash and Class B subordinate voting shares as follows:
(Cdn $ in millions)
Cash $ 3,089 Issuance of 21,971,906 Class B subordinate voting shares 952 Transaction costs 13
Total purchase price $ 4,054
Each Class B subordinate voting share was valued at $43.33, being the average closing price on the Toronto Stock Exchange for two trading days before and one day after the announcement of our offer for Aur, less deemed issuance costs.
In 2008 we completed the process of determining fair values for the assets and liabilities acquired from Aur. The significant changes from the preliminary allocation at December 31, 2007 include an increase to goodwill of $44 million, a $15 million increase to other assets, an increase to the future income tax liability of $62 million and a $3 million adjustment to other accounts.

70
4. Acquisitions and Dispositions, continued
Our final allocation of the purchase price to the estimated fair value of the assets and liabilities of Aur is as follows:
(Cdn $ in millions)
Cash $ 501 Inventory 267 Property, plant and equipment 4,135 Goodwill 750 Other 345
Total assets acquired 5,998
Current liabilities (197) Long-term liabilities (393) Future income tax liability (1,325) Non-controlling interests (29)
Total liabilities assumed (1,944)
Net assets acquired $ 4,054 The net cash cost of the acquisition was as follows:
(Cdn $ in millions)
Cash paid to Aur shareholders $ 3,089 Less Aur’s cash balance on acquisition date (501)
$ 2,588 The goodwill balance arising from the Aur acquisition is a result of the accounting requirement to recognize a future tax liability calculated as the difference between the fair values of the assets and liabilities and the tax bases on an undiscounted basis. As a result of the decline in commodity prices in the fourth quarter of 2008, a goodwill impairment test was performed for Aur which indicated that a write-down of the goodwill arising in the acquisition was required (Note 16(b)).
e) Dispositions Subsequent to December 31, 2008
In January 2009, we sold our 60% interest in the Lobo-Marte gold project in Chile to Kinross Gold Corporation (“Kinross”) for US$40 million in cash and approximately 5.6 million Kinross common shares valued at US$97 million at the date of the sale. We also received a 1.75% net smelter return royalty, which shall not exceed US$40 million, in respect of 60% of the gold produced from Lobo-Marte payable when gold prices on the London Metal Exchange exceed US$760 per ounce. An estimated pre-tax gain of $160 million will be recognized in the first quarter of 2009.
The Kinross shares received as consideration are subject to a four month restriction on resale that expires on May 6, 2009. We can enter into a transaction that has the economic effect of a sale of the Kinross shares with the consent of Kinross, which cannot be unreasonably withheld.

Teck 2008 Annual Report 71
4. Acquisitions and Dispositions, continued
In February 2009, we announced the sale of our interest in the Williams and David Bell (“Hemlo”) mines for US$65 million to an affiliate of Barrick Gold Corporation. The transaction will have an effective date of January 1, 2009. Closing is subject to customary conditions, including receipt of regulatory approvals and is expected to occur in the second quarter. An estimated pre-tax gain of $60 million will be recognized upon closing. Also in February 2009, we announced the sale of our indirect interest in Sociedad Minera El Brocal S.A.A. for US$35 million. Closing is subject to customary conditions and is expected to occur in the first quarter of 2009. An estimated pre-tax gain of $42 million will be recognized upon closing.
5. Inventories
(Cdn$ in millions) 2008 2007
Finished product $ 534 $ 312 Work in process 371 350 Raw materials 91 153 Supplies 343 189
$ 1,339 $ 1,004
Operating expenses include $300 million (2007 – $(2) million, 2006 – $(59) million) of costs of inventories. As at December 31, 2008 we recorded a write-down of $24 million (2007 – nil) on a portion of our product inventory to its net realizable value of $116 million.
6. Investments
(Cdn$ in millions) 2008 2007
Carrying Fair Carrying Fair value value value value
Available-for-sale investments Marketable securities $ 104 $ 104 $ 308 $ 308
Held for trading investments Warrants - - 1 1
104 $ 104 309 $ 309 Investments accounted for under the equity method Fording Canadian Coal Trust (Note 4(a)) - 750 Galore Creek Partnership (50% interest) (a) 299 214 Fort Hills Energy Limited Partnership (20% interest) (b) 545 233
$ 948 $ 1,506

72
6. Investments, continued
a) Galore Creek Partnership
In August 2007, we formed a 50/50 partnership with NovaGold Resources Inc. (“NovaGold”) to develop the Galore Creek copper-gold deposit in northwest British Columbia. In November 2007, construction activities at the project were suspended as a result of our review of the first season of construction, and a more extensive engineering study that anticipated substantially higher capital costs and a longer construction schedule. The funding agreement was amended with NovaGold at the time of the suspension in November 2007. Our funding obligation for project costs incurred after August 1, 2007 was reduced from the original $528 million to $403 million. Of this total, $264 million had been spent by us as of the suspension date. In addition, of the next $100 million of project costs, we were to fund two-thirds and NovaGold would fund one-third. Thereafter, each partner would fund its pro rata share of partnership costs. In addition, we were committed to spend an additional $72 million on studies to reassess the Galore Creek Project by December 31, 2012. During the fourth quarter of 2008 the optimization study for the Galore Creek project was completed. Due to the present economic situation the decision was made not to proceed with updating the final feasibility based upon the results of the optimization study, but rather place the Galore Creek site on care and maintenance. During 2008 the Galore Creek Partnership incurred $15 million of care and maintenance costs, which were expensed as incurred. In February 2009, we further amended certain provisions of the partnership agreement relating to the Galore Creek project. Under the amended agreement, our committed funding on Galore Creek has been reduced from $72 million to $60 million including $15.8 million contributed by us on account of studies prior to December 31, 2008 and $8.6 million contributed by us on account of the November and December 2008 cash calls. While we are making these committed contributions, which will represent 100% of project funding, we will have a casting vote on the Galore Creek management committee with respect to the timing and nature of expenses to be funded. The Galore Creek partnership is a variable interest entity (“VIE”). NovaGold is determined to be the primary beneficiary. Accordingly we account for our interest in the partnership using the equity method. In 2008, we recorded equity earnings of $18 million, which primarily represents a recovery of previously accrued costs.
b) Fort Hills Energy Limited Partnership
In November 2005, we acquired a 15% interest in the Fort Hills Energy Limited Partnership, which is developing the Fort Hills oil sands project in Alberta, Canada. As consideration for our initial 15% interest, we are required to contribute 34% of the first $2.5 billion of project expenditures. In September 2007, we acquired an additional 5% interest, bringing our interest to 20%. To earn our additional 5% interest, we are required to contribute 27.5% of project expenditures after project spending reaches $2.5 billion and before project spending reaches $7.5 billion. Thereafter, we are responsible for funding our 20% share of development costs. In the event that the project is abandoned, all limited partners are required to make additional contributions such that the aggregate contributions of all partners equal $7.5 billion and any unexpended amount will be distributed to the partners according to their partnership interest. Project spending totalled $1.9 billion as of December 31, 2008. Our interest in FHELP is recorded as an investment using the equity method of accounting. In November 2008, FHELP announced that it will defer the final investment decision on the mining and extraction portion of the Fort Hills oil sands project until a cost estimate consistent with the current market environment can be established. The partnership now anticipates making a final investment decision in 2009. The upgrader portion of the project, located in Sturgeon County, has been put on hold and a decision whether to proceed with the upgrader will be made at a later date. As a result of this deferral, we recorded an equity loss of $85 million relating to costs associated with the upgrader.
We have ongoing commitments to fund FHELP which we expect to total $330 million in 2009 and $1,265 million thereafter.

Teck 2008 Annual Report 73
6. Investments, continued
c) Equity earnings (loss) is as follows:
(Cdn$ in millions) 2008 2007 2006
Fording Canadian Coal Trust (Note 4(a)) $ 89 $ 28 $ 32Galore Creek Partnership (a) 18 (33) -Fort Hills Energy Limited Partnership (b) (85) - -
$ 22 $ (5) $ 32
7. Property, Plant and Equipment
(Cdn$ in millions) 2008 2007
Operating
Mines and mining facilities $ 25,241 $ 9,013
Accumulated depreciation and amortization (3,502) (2,695)
21,739 6,318
Smelter and refineries 1,818 1,778
Accumulated depreciation and amortization (764) (717)
1,054 1,061
Other Resource Properties
Mineral properties 768 132
Oil sands leases 348 296
$ 23,909 $ 7,807
During 2008, we capitalized $90 million (2007 - $44 million) of waste rock stripping costs associated with mine expansion at Highland Valley Copper and as at December 31, 2008, we have cumulative capitalized waste rock stripping costs of $158 million (2007 - $68 million), all of which represents the capitalized expansion costs at Highland Valley Copper. In addition, we have $35 million (2007 - $41 million) of remaining unamortized capitalized stripping costs related to the transitional balance on adoption of EIC-160 in 2006.

74
8. Other Assets
(Cdn$ in millions) 2008 2007
Future income and resource tax assets (net of current portion of $nil (2007 - $3 million)) (Note 13(c)) $ 357 $ 70 Pension assets (Note 12(b)) 241 210 Long-term receivables 120 51 Long-term deposits 25 20 Derivative assets (net of current portion of $174 million (2007 - $nil)) (Note 21(c)) 21 - Cajamarquilla contingent receivable (net of current portion of $17 million (2007 - $37 million)) (Note 21(b)) 3 42 Restricted cash pledged as security (Note 11(c)) - 151 Other 86 48
$ 853 $ 592
9. Goodwill
(Cdn$ in millions)
Balance at beginning of year $ 663
Finalization of Aur purchase price (Note 4(d)) 44
Foreign exchange translation 171
Impairment (Note 16(b)) (345)
533 Fording – previously equity accounted (Note 4(a)) 308
Fording – arising in current year acquisition (Note 4(a)) 883
Balance at end of year $1,724
10. Accounts Payable and Accrued Liabilities
(Cdn$ in millions) 2008 2007
Trade payables $670 $506 Current derivative liabilities 252 21 Payroll related liabilities 176 93 Capital project accruals 82 25 Commercial and government royalties 78 251 Resource taxes payable 69 - Accrued interest 68 22 Current portion of asset retirement obligations (Note 12(a)) 16 28 Dividends payable - 221 Other 95 71
$ 1,506 $ 1,238

Teck 2008 Annual Report 75
11. Debt
(Cdn$ in millions) 2008 2007
Carrying Fair Carrying Fair value value value value
Bridge facility (US$ 5.35 billion) (a) $ 6,436 $ 6,378 $ - $ - Term facility (US$4.0 billion) (a) 4,794 4,714 - - 6.125% debentures due October 2035 (US$700 million) (b) 835 408 675 637 5.375% debentures due October 2015 (US$300 million) (b) 363 194 293 287 7.0% debentures due September 2012 (US$200 million) (b) 242 164 196 212 6.75% debentures due March 2010 (US$94 million) (c) - - 94 96 Revolving credit facility (c) - - 148 148 Antamina senior revolving credit facility due August 2012 (d) 113 113 92 92 Other 91 91 25 25
12,874 12,062 1,523 1,497
Less short-term debt and current portion of long-term debt (7,772) (7,700) (31) (31)
$ 5,102 $ 4,362 $ 1,492 $ 1,466
The fair values of debt are determined using market values where available and discounted cash flows based on our expected cost of borrowing on other items.
a) The bridge facility and the term facility are unsecured and rank pari passu with our other senior unsecured debt. The
bridge facility is due on October 29, 2009 and the term facility is repayable in 11 equal quarterly instalments commencing April 30, 2009. Both facilities are guaranteed by our wholly owned subsidiary, TCML and bear interest at LIBOR, US Prime Rate or US Base Rate, plus a margin that varies based on our credit rating.
b) The 6.125%, 5.375% and 7.0% debentures are unsecured and can be called at any time by repaying the greater of
the principal amount plus accrued interest and the present value of the principal and interest amounts discounted at a comparable treasury yield plus a stipulated spread.
c) Upon our acquisition of Aur in 2007, we assumed $94 million of 6.75% debentures due in March 2010 and a revolving credit facility permitting borrowings of up to US$150 million. The terms of the revolving credit facility required a subsidiary to provide cash collateral to the lender equal to any amount outstanding under the facility plus US$3 million. The outstanding amounts under both facilities were repaid in 2008 and the cash collateral held as security for the revolving credit facility was released.
d) The Antamina senior revolving credit facility is our proportionate share of a syndicated five-year revolving term bank facility with a bullet repayment due at maturity and is the obligation of Compañia Minera Antamina (Note 3(a)). The facility is non-recourse to Teck and the other Antamina project sponsors and may be renewed and extended annually with the concurrence of the participating banks. The outstanding amount under the facility bears interest at LIBOR plus a margin.
e) At December 31, 2008, we had revolving credit facilities aggregating $1.3 billion, of which $1.2 billion is available until 2013. Net of $191 million of letters of credit the unused portion of the credit facilities is $1,120 million as at December 31, 2008. In addition, we have issued stand alone letters of credit for $258 million in respect of environmental bonding requirements.
f) Our bank credit facilities require the maintenance of a defined debt to capitalization ratio (Note 22). As at December 31, 2008, we are in compliance with all debt covenants and default provisions.

76
11. Debt, continued g) Excluding financing fees and discounts, we have scheduled principal repayments on our debt of $7,845 million due in
2009, $1,772 million in 2010, $1,776 million in 2011, $357 million in 2012, nil in 2013 and $1,218 million thereafter.
h) We incurred interest expense and financing fees on short-term debt and long-term debt as follows:
(Cdn$ in millions) 2008 2007 2006
Interest expense on short-term debt $ 58 $ - $ - Interest expense on long-term debt 118 95 102 Total interest expense 176 95 102 Amortization of financing fees 20 - - Less amounts capitalized (14) (10) (5)
$ 182 $ 85 $ 97
i) Debt payments made during the year:
(Cdn$ in millions) 2008 2007 2006
Bridge facility $ 573 $ - $ - Fording revolving bank credit facility 307 - - 6.75% debentures 98 - - Revolving credit facility 183 - 141 6.875% debentures - - 172 Teck Coal facility 67 - 20
$ 1,228 $ - $ 333
12. Other Liabilities
(Cdn$ in millions) 2008 2007
Asset retirement obligations (a) $ 653 $ 492 Other environmental and post-closure costs 108 88 Pension and other employee future benefits (b)
Defined benefit pension plans 51 35 Non-pension post-retirement benefits 254 209
Long-term contractual obligations 76 - Derivative liabilities (net of current portion of $252 million (2007 - $37 million)) (Note 21(c)) - 78 Other 42 92
$ 1,184 $ 994
a) Asset Retirement Obligations
We have recorded an asset retirement obligation for each of our operating mines and closed properties. Our Trail refining and smelting facilities are considered to be indefinite life operations and neither the amounts that may be required to retire these facilities nor the timing of required expenditures can be reasonably estimated at this time. For the Trail operation, our recorded liability is limited to components of the facility where costs and expected dates of existing retirement and remediation requirements can be estimated.

Teck 2008 Annual Report 77
12. Other Liabilities, continued The following table summarizes the movements in the asset retirement obligation for the years ended December 31, 2008 and 2007:
(Cdn$ in millions) 2008 2007
At January 1 $ 520 $ 449 Changes in cash flow estimates
Operating mines (1) 42 Closed properties 17 22
Expenditures and settlements (25) (20) Accretion expense 34 26 Obligations assumed on acquisition (Note 4(a) and (d)) 76 36 Foreign currency translation adjustments 48 (35)
At December 31 669 520
Less current portion (16) (28)
$ 653 $ 492 Asset retirement obligations are initially recorded as a liability at fair value, assuming credit adjusted risk-free discount rates between 5.75% and 16.50%, and inflation factors between 2.00% and 2.75%. The liability on an undiscounted basis before inflation is estimated to be approximately $1,833 million.
The change in cash flow estimates and accretion relating to asset retirement obligations at closed properties are recognized in other income (expense) (Note 17). Our operations are affected by federal, provincial, state and local laws and regulations concerning environmental protection. Provisions for future reclamation and site restoration are based on known requirements. It is not possible to estimate the effect on operating results, if any, of future legislative or regulatory developments.
b) Pension and Other Employee Future Benefits Defined Contribution Plans
We have defined contribution pension plans for certain groups of employees. Our share of contributions to these plans is expensed in the year it is earned by the employee.
Defined Benefit Plans and Non-Pension Post-Retirement Benefits
We have various defined benefit pension plans that provide benefits based principally on employees’ years of service. These plans are only available to certain qualifying employees. The plans are “flat-benefit” or “final-pay” plans which are not indexed. Annual contributions to these plans are actuarially determined and made at or in excess of minimum requirements prescribed by legislation. All of our defined benefit pension plans are actuarially evaluated for funding purposes on a three-year cycle. The most significant plan, which accounts for 49% of our accrued benefit obligation at December 31, 2008, was last actuarially evaluated on December 31, 2007. The measurement date used to determine all of the accrued benefit obligation and plan assets for accounting information was December 31, 2008. We also have several post-retirement plans, which provide post-retirement medical and life insurance benefits to certain qualifying employees.

78
12. Other Liabilities, continued
i. Actuarial Valuation of Plans:
(Cdn$ in millions) 2008 2007
Defined Non-pension Defined Non-pension benefit post- benefit post-
pension retirement pension retirement plans benefit plans plans benefit plans
Accrued benefit obligation Balance at beginning of year $ 1,260 $ 272 $ 1,270 $ 316 Current service cost 26 8 25 6 Benefits paid (85) (10) (77) (8) Interest cost 69 15 63 16 Actuarial revaluation 11 (3) (2) (46) Past service costs arising from plan improvements 33 - 7 - Foreign currency exchange rate changes 18 8 (13) (7) Changes in methodology and assumptions 9 6 4 3 Assumed on acquisitions 140 17 14 - Effect of new discount rate at year end (257) (65) (36) (9) Other - - 5 1
Balance at end of year 1,224 248 1,260 272
Plan assets Fair value at beginning of year 1,257 - 1,275 - Actual return on plan assets (153) - 21 - Benefits paid (85) (10) (77) (8) Foreign currency exchange rate changes 15 - (10) - Contributions 48 10 32 8 Assumed on acquisitions 131 - 17 - Other - - (1) -
Fair value at end of year 1,213 - 1,257 -
Funding surplus (deficit) (11) (248) (3) (272)
Unamortized actuarial costs 108 (28) 110 33 Unamortized past service costs 93 22 68 30
Net accrued benefit asset (liability) $ 190 $ (254) $ 175 $ (209)
Represented by Pension assets (Note 8) $ 241 $ - $ 210 $ - Accrued benefit liability (a) (51) (254) (35) (209)
Net accrued benefit asset (liability) $ 190 $ (254) $ 175 $ (209)

Teck 2008 Annual Report 79
12. Other Liabilities, continued
ii. Funded Status
The funded status of our defined benefit pension plans is as follows:
(Cdn$ in millions) 2008 2007
Plans where Plans where Plans where Plans whereassets
exceedbenefit
obligationsassets
exceed benefit
obligationsbenefit
obligationsexceed assets Total
benefit obligations
exceed assets Total
Plan assets $ 746 $ 467 $ 1,213 $ 1,007 $ 250 $1,257 Benefit obligations (658) (566) (1,224) (928) (332) (1,260)
Excess (deficit) of plan assets over benefit obligations $ 88 $ (99) $ (11) $ 79 $ (82) $ (3)
Our total cash payments for pension and other employee future benefits for 2008, including cash contributed to defined benefit and defined contribution pension plans and cash payments made directly to beneficiaries, were $71 million (2007 - $52 million). We expect to contribute $78 million to our defined contribution and defined benefit pension plans in 2009 based on minimum funding requirements.
The estimated future benefit payments to pensioners for the next five years and the five years thereafter are as follows:
(Cdn$ in millions) 2009 2010 2011 2012 2013 2014 - 2018
$ 92 $ 97 $ 101 $ 107 $ 114 $ 665

80
12. Other Liabilities, continued iii. Significant Assumptions The assumptions used to calculate annual expenses are those used to calculate the accrued benefit obligation at the end of the previous year. Weighted average assumptions used to calculate the accrued benefit obligation at the end of each year are as follows:
2008 2007 2006
Non-pension
Non-pension
Non-pension
Defined post- Defined post- Defined post-benefit retirement benefit retirement benefit retirement
pension benefit pension benefit pension benefit plans plans plans plans plans plans
Discount rate 7.22% 7.09% 5.27% 5.36% 5.02% 5.13%Assumed long-term rate of return on assets 7% - 7% - 7% -Rate of increase in future compensation 4% 4% 4% 4% 4% 4%Initial medical trend rate - 8% - 9% - 10%Ultimate medical trend rate - 5% - 5% - 5%Years to reach ultimate medical trend rate - 7 - 4 - 5 Dental trend rates - 5% - 5% - 5%
The expected long-term rate of return on plan assets is developed based on the historical and projected returns for each asset class, as well as the target asset allocation for the pension portfolio. Projected rates of return for fixed income securities and equities are developed using a model that factors in long-term government debt rates, real bond yield trend, inflation and equity premiums, based on a combination of historical experience and future long-term expectations. The discount rate used to determine the accrued benefit obligation is determined by reference to the market interest rates of high quality debt instruments at the measurement date.

Teck 2008 Annual Report 81
12. Other Liabilities, continued
iv. Employee Future Benefits Expense:
(Cdn$ in millions) 2008 2007 2006
Non-pension
Non-pension
Non-pension
Defined post- Defined post- Defined post-benefit retirement benefit retirement benefit retirement
pension benefit pension benefit pension benefit plans plans plans plans plans plans
Current service cost $ 26 $ 8 $ 25 $ 6 $ 25 $ 5Interest cost 69 15 63 16 62 15Expected gain on assets (87) - (86) - (77) -Actuarial loss recognized 7 3 3 7 10 7Past service cost recognized 17 6 14 6 9 1Other - - 7 - 3 -
$ 32 $ 32 $ 26 $ 35 $ 32 $ 28 The defined contribution expense for 2008 was $12 million (2007 - $11 million; 2006 - $8 million). Certain employee future benefit costs incurred in the year and the actual return on plan assets in excess of or short of the actuarially assumed return are not taken into income in the year but are amortized over the expected average remaining service life of employees. Employee future benefit expenses recognized in the year are reconciled to employee future benefit costs incurred as follows:
(Cdn$ in millions) 2008 2007 2006
Non-pension
Non-pension
Non-pension
Defined post- Defined post- Defined post-benefit retirement benefit retirement benefit retirement
pension benefit pension benefit pension benefit plans plans plans plans plans plans
Expense recognized $ 32 $ 32 $ 26 $ 35 $ 32 $ 28Difference between expected and actual return on plan assets 240 - 66 - (66) -Difference between actuarial losses (gains) amortized and actuarial losses (gains) arising (264) (59) (36) (59) 1 1Difference between past service costs amortized and past service costs arising 16 (6) (7) (6) 34 21Other - - (4) - (3) -
$ 24 $ (33) $ 45 $ (30) $ (2) $ 50

82
12. Other Liabilities, continued
v. Health Care Sensitivity
A one percent change in the initial and ultimate medical trend rates assumptions would have the following effect on our post-retirement health care obligations and expense:
Increase (decrease) in service and Increase (decrease)
(Cdn$ in millions) interest cost in obligation
Effect of 1% increase in medical trend rate $ 3 $ 29 Effect of 1% decrease in medical trend rate (3) (24)
vi. Investment of Plan Assets
The assets of our defined benefit pension plans are managed by pension asset fund managers under the oversight of the Teck Cominco Limited Executive Pension committee. Our pension plan investment strategies support the objectives of each defined benefit plan and are related to the plan demographics and timing of expected benefit payments to plan members. The objective for the plan asset portfolios is to achieve an annual portfolio return over a four-year period equal to at least the annual percentage change in the Consumer Price Index plus 4%. To achieve this objective, a strategic asset allocation policy has been developed for each defined benefit plan. The asset allocation is monitored quarterly and rebalanced if the funds in an asset class exceed their allowable allocation ranges. We review the investment guidelines for each plan at least annually and the portfolio and investment managers’ performance is monitored quarterly.
The composition of the defined benefit pension plan assets at December 31, 2008 and 2007, and the target composition for 2009 are as follows:
2009 target 2008 actual 2007 actual
Equity securities 50% 43% 55%Debt securities 40% 44% 36%Real estate and other 10% 13% 9%
100% 100% 100%

Teck 2008 Annual Report 83
13. Income and Resource Taxes
a) Provision for Income and Resource Taxes from Continuing Operations:
(Cdn$ in millions) 2008 2007 2006
Current Canadian income tax $ (1,235) $ 388 $ 483 Foreign income and resource tax 220 398 499
Canadian resource tax 185 106 172
(830) 892 1,154 Future
Canadian income tax 1,483 (101) 34 Foreign income and resource tax (25) (12) 19
Canadian resource tax 30 16 6
1,488 (97) 59
$ 658 $ 795 $ 1,213
b) Reconciliation of income and resource taxes calculated at the statutory rates to the actual tax provision:
(Cdn$ in millions) 2008 2007 2006
Tax expense at the statutory income tax rate of 31.2% $ 435 $ 857 $ 1,244 (2007 - 34.1%; 2006 - 34.6%)
Tax effect of Resource taxes, net of resource and depletion allowances 130 (18) (7)Non-temporary differences, including one-half of capital gains and losses and goodwill impairment 185 (19) (41)Benefit of current tax losses not recognized (recognition of previously unrecognized losses) (2) 21 14 Benefit of tax rate reduction (38) (81) (21)Difference in tax rates in foreign jurisdictions (4) (13) 32
Other (48) 48 (8)
$ 658 $ 795 $ 1,213

84
13. Income and Resource Taxes, continued
c) Temporary differences giving rise to future income and resource tax assets and liabilities:
(Cdn$ in millions) 2008 2007
Future income and resource tax assets Net operating loss carry forwards $ 310 $ 111 Property, plant and equipment 459 (98)Asset retirement obligations 49 57 Amounts relating to partnership year ends (347) - Other 14 80
Valuation allowance (128) (77) $ 357 $ 73
Future income and resource tax liabilities Property, plant and equipment $ 5,051 $ 1,895 Asset retirement obligations (170) (132)Amounts relating to partnership year ends 94 305
Other (10) (61)
$ 4,965 $ 2,007
d) Earnings by Jurisdiction
Our earnings before income and resource taxes, non-controlling interests and equity earnings (losses) from continuing operations are earned in the following tax jurisdictions:
(Cdn$ in millions) 2008 2007 2006
Canada $ 1,192 $ 1,181 $ 1,404 Foreign 203 1,327 2,191
$ 1,395 $ 2,508 $ 3,595
e) Non-Resident Subsidiaries
We have non-resident subsidiaries that have undistributed earnings. For certain non-resident subsidiaries, undistributed earnings are not expected to be repatriated in the foreseeable future and therefore, taxes have not been provided.
f) Loss Carry Forwards
At December 31, 2008, we had $579 million of Canadian federal net operating loss carry forwards. These loss carry forwards expire at various dates between 2010 and 2028. At December 31, 2008, we had United States federal net operating loss carry forwards of $95 million (2007 - $103 million). These loss carry forwards expire at various dates between 2009 and 2027.

Teck 2008 Annual Report 85
13. Income and Resource Taxes, continued
g) Valuation Allowance
We have provided a valuation allowance of $128 million (2007 - $77 million) relating to tax assets in jurisdictions that do not have established sources of taxable income.
h) Taxation Assessments
In the normal course of business, we are subject to audit by taxation authorities. These audits may alter the timing or amount of taxable income or deductions. The amount ultimately reassessed upon resolution of issues raised may differ from the amounts accrued.
For our primary Canadian entities, audits by various Canadian taxation authorities for years after 2002 have not been completed. For US federal, state and local tax purposes, our principal US entities are subject to examination by US tax authorities for the years 1991 to the present. We are subject to audit by Peruvian taxation authorities for the years 2006 to the present. For Chilean tax purposes, we are subject to examination by tax authorities for years 2006 to the present.
14. Non-Controlling Interests
(Cdn$ in millions) 2008 2007
Highland Valley Copper (3%) $ 10 $ 56 Carmen de Andacollo (10%) 34 21 Quebrada Blanca (23.5%) 41 10 Elkview Mine Partnership (5%) 19 5
$ 104 $ 92
15. Shareholders’ Equity
a) Authorized Share Capital
Our authorized share capital consists of an unlimited number of Class A common shares without par value, an unlimited number of Class B subordinate voting shares without par value and an unlimited number of preferred shares without par value issuable in series.
Class A common shares carry the right to 100 votes per share. Class B subordinate voting shares carry the right to one vote per share. Each Class A common share is convertible, at the option of the holder, into one Class B subordinate voting share. In all other respects, the Class A common shares and Class B subordinate voting shares rank equally. The attributes of the Class B subordinate voting shares contain so called “coattail provisions,” which provide that, in the event that an offer (an “Exclusionary Offer”) to purchase Class A common shares, which is required to be made to all or substantially all holders thereof, is not made concurrently with an offer to purchase Class B subordinate voting shares on identical terms, then each Class B subordinate voting share will be convertible into one Class A common share.

86
15. Shareholders’ Equity, continued
The Class B subordinate voting shares will not be convertible in the event that an Exclusionary Offer is not accepted by holders of a majority of the Class A common shares (excluding those shares held by the person making the Exclusionary Offer). If an offer to purchase Class A common shares does not, under applicable securities legislation or the requirements of any stock exchange having jurisdiction, constitute a “take-over bid,” or is otherwise exempt from any requirement that such offer be made to all or substantively all holders of Class A common shares, the coattail provisions do not apply.
b) Class A Common Shares and Class B Subordinate Voting Shares:
Class A Class B subordinateShares (in 000’s) common shares voting shares
At December 31, 2005 4,674 199,127
Options exercised (e) - 907 Issued in settlement of exchangeable debentures due 2024 (d) - 11,489
At December 31, 2006 4,674 211,523
Share split (c) 4,674 211,523 Issued on acquisition of Aur (Note 4(d)) - 21,972 Options exercised (e) - 1,373 Share repurchase program (j) - (13,100) Other 5 7
At December 31, 2007 9,353 433,298
Issued for business acquisitions (Note 4(a)) - 36,829 Issued for asset acquisition (Note 4(b)) - 6,918 Options exercised (e) - 578 Other - (111)
At December 31, 2008 9,353 477,512
c) Share Split
On April 25, 2007, shareholders approved a two-for-one share split of our Class A common shares and Class B subordinate voting shares effective as of the close of business on May 7, 2007. All share, per share, share option and DSU and RSU information included in the consolidated financial statements and accompanying notes (other than information in Note 15(b)) for the period prior to the share spilt has been adjusted to reflect this share split for all periods presented.
d) Exchangeable Debentures Due 2024
On June 1, 2006, we completed a series of transactions culminating in the redemption of our exchangeable debentures issued in 1999. In the course of these transactions, all outstanding debentures were exchanged and we issued 11.5 million Class B subordinate voting shares. By virtue of our option to deliver a fixed number of Class B subordinate voting shares to satisfy the principal payments, the debentures net of issue costs and taxes were classified as a component of shareholders’ equity and the interest, net of taxes, was charged directly to retained earnings. This interest, net of taxes, totalled $3 million in 2006.The exchange was a non-monetary transaction and did not affect our cash flow or earnings. In 2006, current tax benefits of $124 million on these transactions were recorded directly to shareholders’ equity.

Teck 2008 Annual Report 87
15. Shareholders’ Equity, continued
e) Share Options
Under our share option plan, 6 million Class B subordinate voting shares have been set aside for the grant of share options to full-time employees and directors. The exercise price for each option is the closing price for our Class B subordinate voting shares on the last trading day before the date of grant. We issue new shares upon exercise of share options.
During the year ended December 31, 2008, we granted 1,655,000 Class B subordinate voting share options at market price to employees. These share options have a weighted average exercise price of $34.43, vest in equal amounts over three years and have a term of 8 years.
The weighted average fair value of Class B subordinate voting share options granted in the year was estimated at $10 per option (2007 - $16; 2006 - $12) at the grant date based on the Black-Scholes option-pricing model using the following assumptions:
2008 2007 2006
Dividend yield 2.94% 0.95% 1.04%Risk free interest rate 6.35% 5.15% 4.11%Expected life 4.2 years 4.2 years 5.0 yearsExpected volatility 31% 35% 35%
Outstanding share options:
2008 2007
Weighted Weightedaverage average
Shares
(in 000’s) exercise
price Shares
(in 000’s)exercise
price
Outstanding at beginning of year 3,670 $ 22.86 4,274 $ 14.40 Granted 1,655 34.43 839 43.74 Exercised (578) 9.39 (1,373) 9.44 Forfeited (215) 33.86 (70) 19.52 Expired - - - -
Outstanding at end of year 4,532 $ 28.28 3,670 $ 22.86
Vested and exercisable at end of year 2,265 $ 20.09 2,141 $ 12.58

88
15. Shareholders’ Equity, continued
Information relating to share options outstanding at December 31, 2008:
Outstanding share options
(in 000’s)
Vested share options
(in 000’s) Price range
Weighted average exercise price on
outstanding options
Weighted average exercise price on
vested options
Weighted average remaining life of
outstanding options (months)
658 658 $ 4.48 - $10.10 $ 5.54 $ 5.54 8 438 438 $10.11 - $15.16 12.55 12.55 14
490 490 $15.17 - $22.75 22.64 22.64 26 2,120 421 $22.76 - $34.14 33.73 33.20 78 826 258 $34.15 - $49.17 44.07 43.74 75
4,532 2,265 $ 28.28 $ 20.09 55 The weighted average remaining life of vested options at December 31, 2008 was 30 months. The intrinsic value of a share option is the difference between the current market price for our Class B subordinate voting share and the exercise price of the option. At December 31, 2008, the aggregate intrinsic value of vested and unvested options, based on the December 31, 2008 closing price of $6.02 for the Class B subordinate voting shares, was nominal for outstanding and vested options.
Further information about our share options:
(Cdn$ in millions) 2008 2007 2006
Total compensation cost recognized $ 13 $ 11 $ 7 Total fair value of share options vested 9 8 5 Total intrinsic value of share options exercised 19 46 54
The unrecognized compensation cost for non-vested share options at December 31, 2008 was $9 million. The weighted average period over which it is expected to be recognized is 1.5 years.
f) Deferred Share Units and Restricted Share Units
Under our Deferred Share Unit (“DSU”) or Restricted Share Unit (“RSU”) plan, directors and employees may receive either DSUs or RSUs, each of which entitle the holder to a cash payment equal to the market value of one Class B subordinate voting share at the time they are redeemed for employees. These units vest immediately for directors and after three years for employees. Upon normal retirement the units vest immediately and when early retirement occurs, units vest on a pro-rata basis. Should employees be terminated without cause, units vest on a pro-rata basis. Should employees resign or be terminated with cause, units are forfeited. DSUs may only be redeemed within twelve months from the date a holder ceases to be an employee or director while RSUs must be redeemed at the end of a three-year period measured from the end of the year immediately preceding the grant. Additional units are issued to holders of DSU’s and RSU’s to reflect dividends paid on Class B subordinate voting shares and other adjustments to Class B subordinate voting shares.

Teck 2008 Annual Report 89
15. Shareholders’ Equity, continued At December 31, 2008, 1,101,200 DSUs and RSUs were outstanding (2007 – 1,044,198). Non-vested DSU and RSU activity:
2008 2007
DSUs and RSUs
(in 000’s)
Weighted average
grant date fair value
Weighted average
grant date fair value
DSUs and RSUs (in 000’s)
Non-vested at beginning of year 692 $ 39.06 718 $ 29.36 Granted 495 35.66 359 42.98 Forfeited (244) 38.33 (19) 26.00 Vested (290) 35.28 (366) 24.58
Non-vested at end of year 653 $ 38.24 692 $ 39.06 Further information about our DSUs and RSUs:
(Cdn$ in millions, except weighted average) 2008 2007 2006
Weighted average grant date fair value of the units granted $ 35.74 $ 44.02 $ 35.63 Total fair value of units vested 4 13 8 Total compensation cost recognized (19) 10 17 Tax benefits realized - 4 2 Cash used to settle DSUs and RSUs 1 12 6
The unrecognized compensation cost for non-vested DSUs and RSUs at December 31, 2008 was $14 million. The weighted average period over which it is expected to be recognized is 1.7 years.

90
15. Shareholders’ Equity, continued
g) Accumulated Comprehensive Income:
(Cdn$ in millions) 2008 2007 2006
Accumulated other comprehensive loss – beginning of year $ (671) $ (145) $ (168)Adoption of new accounting standards - 50 -
(671) (95) (168)
Other comprehensive income (loss) in the year
Currency translation adjustment
Unrealized gains (losses) 1,260 (665) 20 Foreign exchange differences on debt designated as a hedge of self-sustaining foreign subsidiaries (257) 56 1 Losses reclassified to net earnings on realization - 59 2
1,003 (550) 23 Available-for-sale instruments Unrealized losses (net of tax of $48 for 2008 and $9 for 2007) (298) (47) - Losses reclassified to net earnings (net of tax of $40 for 2008 and $2 for 2007) 250 11 -
(48) (36) - Derivatives designated as cash flow hedges Unrealized losses (net of taxes of $47 for 2008 and nil for 2007) (72) - - Losses reclassified to net earnings on realization (net of tax of $33 for 2008 and $7 for 2007) 51 10 -
(21) 10 -
Total other comprehensive income (loss) 934 (576) 23
Accumulated other comprehensive income (loss) – end of year 263 (671) (145)
Retained earnings – end of year 5,476 5,038 4,225
Accumulated comprehensive income $ 5,739 $ 4,367 $ 4,080
The components of accumulated other comprehensive income (loss) are:
(Cdn$ in millions) 2008 2007
Currency translation adjustment $ 308 $ (695)Unrealized gains (losses) on investments (net of tax of ($1) in 2008 and ($9) in 2007) (6) 42 Unrealized losses on cash flow hedges (net of tax of $28 in 2008 and $14 in 2007) (39) (18)
Accumulated other comprehensive income (loss) $ 263 $ (671)

Teck 2008 Annual Report 91
15. Shareholders’ Equity, continued
h) Earnings Per Share
The following table reconciles our basic and diluted earnings per share:
(Cdn$ in millions, except per share data) 2008 2007 2006
Basic earnings Earnings from continuing operations $ 677 $ 1,661 $ 2,395
Less interest on exchangeable debentures, net of taxes - - (3)
Earnings from continuing operations, less interest on exchangeable debentures, net of taxes 677 1,661 2,392
Earnings (loss) from discontinued operations (18) (46) 36
Net earnings available to common shareholders $ 659 $ 1,615 $ 2,428
Diluted earnings Earnings from continuing operations $ 677 $ 1,661 $ 2,395
Earnings (loss) from discontinued operations (18) (46) 36
Net diluted earnings available to common shareholders $ 659 $ 1,615 $ 2,431
Weighted average shares outstanding (000’s) 452,124 432,236 421,902 Effect of dilutive securities
Incremental shares from share options 1,119 2,229 3,318 Shares issuable on conversion of exchangeable debentures - - 9,574
Weighted average diluted shares outstanding 453,243 434,465 434,794
Basic earnings per share $ 1.46 $ 3.74 $ 5.77 Basic earnings per share from continuing operations $ 1.50 $ 3.85 $ 5.68 Diluted earnings per share $ 1.45 $ 3.72 $ 5.60 Diluted earnings per share from continuing operations $ 1.49 $ 3.83 $ 5.52
At December 31, 2008 there were 2,295,933 (2007 – 828,000, 2006 – nil) potentially dilutive shares that have not been included in the diluted earnings per share calculation for the periods presented because their effect is anti-dilutive.

92
15. Shareholders’ Equity, continued
i) Dividends Dividends declared in 2008, 2007 and 2006 totalled $0.50 per share, $1.00 per share, and $1.00 per share respectively. Dividends paid on or after January 1, 2007 are eligible for the enhanced federal and provincial dividend tax credits.
j) Share Purchase Program
We have a share purchase program that allows us to purchase up to 40 million of our outstanding Class B subordinate voting shares by way of a normal course issuer bid until March 10, 2009. Purchases, if any, are made at the prevailing market price of the Class B subordinate voting shares as traded on the Toronto Stock Exchange and any shares purchased are cancelled. We have not purchased any Class B subordinate voting shares under this program during 2008. During 2007, we purchased 13.1 million Class B subordinate voting shares at a cost of $577 million pursuant to a normal course issuer bid that expired on February 21, 2008.
16. Asset Impairment Charges
(Cdn$ in millions) 2008 2007 2006
Property, plant and equipment (a) $ 179 $ 43 $ -Goodwill (b) (Note 9) 345 - -Exploration and development properties and other (c) 65 26 - $ 589 $ 69 $ -
a) We review the carrying value of our property, plant and equipment whenever events or changes in circumstances
indicate that the carrying amounts of the related assets or groups of assets may not be recoverable. When we no longer expect to recover the full carrying value of a mine or property over its expected life, we write down its carrying value to its fair value based on internal estimates of discounted future cash flows or our estimate of its salvage values. During 2008, we recorded an impairment charge of $116 million against our Duck Pond copper-zinc mine, an additional impairment charge of $51 million (2007 - $31 million) against our Pend Oreille zinc mine and an asset impairment charge of $12 million (2007 - $12 million) against our Lennard Shelf zinc mine in Western Australia. These impairment charges were taken as a result of low commodity prices, short mine lives and operating losses. Lennard Shelf was closed in August 2008 and Pend Oreille was placed on care and maintenance in February 2009.
b) The carrying value of goodwill is reviewed at least annually and when impairment indicators exist. Asset valuations
and impairment charges are based on management estimates and assumptions. During the fourth quarter of 2008, we evaluated the carrying amount of goodwill assigned to reporting units for potential impairment. This assessment involves estimating the fair value of each reporting unit that has been assigned goodwill.

Teck 2008 Annual Report 93
16. Asset Impairment Charges, continued As a result of our goodwill impairment testing, we recorded total goodwill impairment charges of $345 million, representing impairment charges of $10 million at our Duck Pond mine, $149 million at our Quebrada Blanca copper mine and $186 million at our Carmen de Andacollo copper mine. The goodwill balance of $10 million for Duck Pond was written off primarily a result of lower commodity prices and the short remaining life of the mine. The goodwill impairment charges for Quebrada Blanca and Carmen de Andacollo were due to declines in near term commodity prices and unfavourable capital market conditions that reduced the fair value of these operations at year end. Also contributing to this was an increase in the estimated future capital for development of the hypogene resource for Quebrada Blanca. The extent of these write-downs was mitigated by the program of mine expansion at Carmen de Andacollo and the establishment of significant additional reserves at Quebrada Blanca.
c) During 2008, we elected to withdraw from the Petaquilla copper project in Panama and therefore, have recorded an
impairment charge of $22 million on our investment in Minera Petaquilla S.A. During 2008, we also recorded an impairment charge of $35 million for capitalized exploration costs relating to a nickel property in Brazil and $8 million in respect of other exploration properties as these costs are no longer expected to be recoverable.
During 2007, we recorded an impairment charge of $26 million on our investment in Tahera Diamond Corporation (“Tahera”). Tahera announced the suspension of operations at its primary asset, the Jericho mine, and subsequently filed for creditor protection, indicating an other-than-temporary decline in market value.
17. Other Income (Expense)
(Cdn$ in millions) 2008 2007 2006
Interest income $ 56 $ 177 $ 186 Derivative gains on forward copper and zinc sales 291 53 - Other derivative losses (6) (25) - Foreign exchange gains (loss) 69 6 (7)Gain on sale of investments and assets, net of losses (a) 16 55 201 Realization of cumulative translation losses - (59) - Reclamation expense for closed properties (22) (26) (17)Provision for marketable securities (b) (292) - - Other (81) (11) (47)
$ 31 $ 170 $ 316
a) The gain on sale of investments and assets in 2006 included $120 million from the sale of Inco shares and redemption of Inco exchange debentures. In 2006, we sold our common shares of Inco Limited (“Inco”), some of which were pledged as security for $248 million of debentures we issued in 1996. The debentures were exchangeable at the option of the holder for common shares of Inco, subject to adjustment in certain circumstances.
b) At December 31, 2008, we determined that the mark-to-market loss on our available-for-sale marketable securities recorded through other comprehensive income was an other-than-temporary decline and transferred the loss to other income (expense).

94
18. Partnerships And Joint Ventures
Our operations that are accounted for using the proportionate consolidation method are the Antamina, Pogo, Hemlo and Lennard Shelf mines. The Lennard Shelf mine was permanently closed in August of 2008. We proportionately consolidated our 40% interest in Teck Coal, prior to the acquisition of Fording’s assets on October 30, 2008 (Note 4(a)). Our share of the assets and liabilities, revenues and expenses and cash flows of these operations is as follows:
(Cdn$ in millions) 2008 2007 2006
Assets Cash and cash equivalents $ 113 $ 108 $ 88 Other current assets 142 316 347
Mineral properties, plant and equipment 741 1,101 1,252
$ 996 $ 1,525 $ 1,687
Liabilities and equity Current liabilities $ 103 $ 194 $ 274 Long-term debt 113 114 123 Other long-term liabilities 134 278 245
Equity 646 939 1,045
$ 996 $ 1,525 $ 1,687
Earnings Revenues $ 2,410 $ 1,955 $ 2,127 Operating and other expenses (1,289) (1,232) (1,077)
Provision for income and resource taxes (124) (205) (222)
Net earnings $ 997 $ 518 $ 828
Cash flow Operating activities $ 1,107 $ 652 $ 981 Financing activities 40 11 (38)Investing activities (183) (71) (76)Distributions (979) (559) (945)
Effect of exchange rates on cash 20 (13) -
Increase (decrease) in cash $ 5 $ 20 $ (78) Income and resource taxes relate only to incorporated joint ventures. The liability for income taxes for partnerships and unincorporated joint ventures rests at the parent entity level and is not included in this table.

Teck 2008 Annual Report 95
19. Supplemental Cash Flow Information
(Cdn$ in millions) 2008 2007 2006
(a) Cash and cash equivalents Cash $ 294 $ 695 $ 156 Money market investments with maturities from the date of
acquisition of 3 months or less 556 713 4,898
$ 850 $ 1,408 $ 5,054
(b) Net change in non-cash working capital items Accounts and settlements receivable $ 118 $ 178 $ (192)Inventories 113 (94) (118)Accounts payable and accrued liabilities (276) 99 321
Current income and resource taxes payable (1,519) (465) 288
$ (1,564) $ (282) $ 299
(c) Interest and taxes paid Interest paid $ 135 $ 90 $ 111 Income and resource taxes paid $ 645 $ 1,283 $ 846
(d) Non-cash financing transaction Shares issued on conversion of debt (Note 15(d)) $ - $ - $ 107
Shares issued for acquisitions (Note 4) $ 1,791 $ 952 $ -
20. Commitments and Contingencies
We consider provisions for all our outstanding and pending legal claims to be adequate. The final outcome with respect to actions outstanding or pending as at December 31, 2008, or with respect to future claims, cannot be predicted with certainty. Significant commitments and contingencies not disclosed elsewhere in the notes to our financial statements are as follows:
a) Restructuring
On January 8, 2009 we announced a workforce reduction of approximately 1,400 positions as part of our broader strategy to reduce costs. In total, about 1,000 employee and 400 contractor positions will be eliminated by the end of 2009, with the majority of the reductions to be completed in the first quarter. Severance and other related costs associated with this reduction will be charged to net earnings in the first quarter of 2009.
b) Upper Columbia River Basin (Lake Roosevelt)
Prior to our acquisition in 2000 of a majority interest in Cominco Ltd. (“TCML”), the Trail smelter discharged smelter slag into the Columbia River. These discharges commenced prior to TCML’s acquisition of the Trail smelter in 1906 and continued until 1996. Slag was discharged pursuant to permits issued in British Columbia subsequent to the enactment of relevant environmental legislation in 1967. Slag and other non-slag materials released from the Trail smelter in British Columbia have travelled down river, as have substances discharged from many other smelting and industrial facilities located along the length of the Upper Columbia River system in Canada and the United States.

96
20. Commitments and Contingencies, continued Slag is a glass-like compound consisting primarily of silica, calcium and iron, which contains small amounts of base metals including zinc, lead, copper and cadmium. It is sufficiently inert that it is not characterized as a hazardous waste under applicable Canadian or US regulations and is sold to the cement industry. While slag has been deposited into the river, further study is required to assess what effect the presence of slag in the river has had and whether it poses an unacceptable risk to human health or the environment. A large number of studies regarding slag deposition and its effects have been conducted by various governmental agencies on both sides of the border. The historical studies of which we are aware have not identified unacceptable risks resulting from the presence of slag in the river. In June 2006, TCML and its affiliate, TCAI, entered into a Settlement Agreement (the “EPA Agreement”) with the US Environmental Protection Agency (“EPA”) and the United States under which TCAI is paying for and conducting a remedial investigation and feasibility study (“RI/FS”) of contamination in the Upper Columbia River (the “Studies”) under the oversight of the EPA. This multi-year study will use the latest science developed by the EPA and other researchers to determine the true risks in the reservoir system. The RI/FS is scheduled for completion in 2011 and is being prepared by independent consultants approved by the EPA and retained by TCAI. TCAI is paying the EPA’s oversight costs and providing funding for the participation of other governmental parties, the State of Washington and two native tribes, the Confederated Tribes of the Colville Nation (the “Colville Tribe”) and the Spokane Tribe. TCML has guaranteed TCAI’s performance of the Agreement. TCAI has also placed US$20 million in escrow as financial assurance of its obligations under the Agreement and we have accrued our estimate of the costs of the Studies. Contemporaneously with the execution of the Agreement, the EPA withdrew a unilateral administrative order (“UAO”) purporting to compel TCML to conduct the Studies. The RI/FS process requires TCAI to submit a work plan for the assessment of site conditions to the EPA which, when approved, will lead to the development of a set of sampling and other plans and actual field work. Data from field work will be used to determine whether further studies are required. When sufficient data have been compiled to adequately assess risk, a baseline human health and environmental risk assessment (“RA”) will be produced to identify risks, if any, that may exist to humans and to various environmental receptors. The RA will form the basis for the RI/FS. The remedial investigation will identify potential remedial options available to mitigate any unacceptable risks; the feasibility study will consider engineering, procedural and practical constraints to these remedial options. Based on the RI/FS, the EPA will determine whether and what remedial actions are appropriate in accordance with criteria that take into account, among other factors, technical feasibility, effectiveness, cost, effects on the environment resulting from the remediation action, and acceptability of the relevant remedial option to the community. Each work product and plan in this process is subject to EPA approval. Internal consultation processes of the EPA will include consultation with state and other federal agencies and the two Indian Tribes bordering the site. While the UAO was outstanding, two citizens of Washington State and members of the Colville Tribe commenced an enforcement proceeding under Section 310(a)(i) of the Comprehensive Environmental Response, Compensation and Liability Act (“CERCLA”) to enforce the UAO and to seek fines and penalties against TCML for non-compliance. TCML sought to have all claims dismissed on the basis that the court lacked jurisdiction because the CERCLA statute, in TCML’s view was not intended to govern the discharges of a facility occurring in another country. That case proceeded through US Federal District Court and the Federal Court of Appeals for the 9th Circuit. The 9th Circuit affirmed the District Court decision denying TCML’s motion to dismiss the case on jurisdictional grounds and found that CERCLA could be applied to TCML’s disposal practices in British Columbia because they may have had an effect in Washington State. The 9th Circuit issued a stay of its decision pending the resolution of a further appeal by TCML to the US Supreme Court.

Teck 2008 Annual Report 97
20. Commitments and Contingencies, continued In February 2007, TCML filed a petition for review and reversal with the US Supreme Court. TCML’s petition was supported by amicus briefs filed by Canada, the Province of British Columbia, the Mining Association of Canada, the US National Mining Association, the US Association of Manufacturers, the Canadian and US Chambers of Commerce and the Consumer Electronics Association. In January 2008, the US Supreme Court denied TCML’s petition for a review of the 9th Circuit decision. The denial of review is not a decision on the merits of TCML’s defence, but rather reflects the US Supreme Court’s decision not to take up the case at this particular time. Following the denial of our petition for review by the U.S. Supreme Court in January 2008, the Lake Roosevelt litigation reverted to the Federal District Court for Eastern Washington. Judgment on the first phase of the litigation dealing with issues associated with an EPA order issued in December, 2003 and withdrawn in June 2008 was delivered on September 19, 2008. All of the claims associated with the order were dismissed including the plaintiffs’ claims for costs and attorneys’ fees. On October 3, 2008, the plaintiffs filed a joint motion for partial reconsideration of the decision and asked that it be entered as a final judgment. In November, 2008, TCML filed a motion to stay the plaintiffs’ CERCLA cost recovery declaratory relief claim. On December 30, 2008, the Court denied the motion and discovery and briefing of the liability phase of the litigation will occur in 2009. The hearing of the plaintiffs’ claims for natural resource damages and costs has been deferred until the remedial investigation and feasibility study being conducted by TCML’s affiliate Teck Cominco American Incorporated under the EPA Agreement have been substantially advanced or completed. Natural resource damages (“NRD”) are assessed for injury to, destruction of, or loss of natural resources including the reasonable cost of a damage assessment. Teck American commissioned a study by recognized experts in NRD assessment in 2008. Based on the assessment performed, Teck Cominco estimates that the compensable value of such damage will not be material. TCAI will continue to fulfill its obligations under the settlement agreement reached with the United States and the EPA in June 2006 and complete the RI/FS mentioned above. The settlement agreement is not affected by the litigation. There can be no assurance that TCML will ultimately be successful in its defence of the litigation or that TCML or its affiliates will not be faced with further liability in relation to this matter. Until the studies contemplated by the Agreement and additional damage assessments are completed, it is not possible to estimate the extent and cost, if any, of remediation or restoration that may be required or to assess the company’s potential liability for damages. The studies may conclude, on the basis of risk, cost, technical feasibility or other grounds, that no remediation should be undertaken. If remediation is required and damage to resources found, the cost of remediation and/or the damage assessment may be material.
c) Red Dog Commitments In 2008, Teck Alaska (Red Dog) entered into a settlement with plaintiffs from the Village of Kivalina who filed a complaint alleging violations of the Clean Water Act. A consent decree constituting a full and complete settlement of the claims has been entered with the Court. In 2006, in accordance with the operating agreement governing the Red Dog mine, the royalty to the North Alaska Nature Association (“NANA”) increased to 25% of net proceeds of production. Previously, we paid an advance royalty of 4.5% of net smelter returns. The increase in royalty rate is partially offset by a decline in the base on which royalties are calculated, as operating, distribution, selling and management fees, an allowance for future reclamation and closure costs, capital costs and deemed interest are deductible in the calculation of the royalty. The 25% royalty became payable in the third quarter of 2007 after we had recovered the cumulative advance royalties previously paid to NANA. The net proceeds of production royalty rate will increase by 5% every fifth year to a maximum of 50%. The increase to 30% of net proceeds of production will occur in 2012.

98
20. Commitments and Contingencies, continued
TCAK leases, road and port facilities from the Alaska Industrial Development and Export Authority though which it ships all concentrates produced at the Red Dog mine. The lease requires TCAK to pay a minimum annual user fee of US$18 million, but has no minimum tonnage requirements. There are also fee escalation provisions based on zinc price and annual budgets. TCAK has also entered into agreements for the transportation and handling of concentrates from the mill site. These agreements have varying terms expiring at various dates through 2015 and include provisions for extensions. There are minimum tonnage requirements and the minimum annual fees amount to approximately US$15 million in 2009, US$7 million in 2010, US$5 million in 2011 and US$4 million thereafter with adjustment provisions based on variable cost factors.
d) Antamina Royalty
Our interest in the Antamina mine is subject to a net profits royalty equivalent to 7.4% of our share of the project’s required free cash flow after recovery of capital costs and an interest factor on approximately 60% of project costs. The recovery of accumulated capital costs together with interest was completed in 2006 and an expense of $20 million was recorded in 2008 (2007 - $22 million) in respect of this royalty.
e) Operating Leases Amounts payable under operating leases are $155 million, with annual payments of $38 million in 2009, $33 million in 2010, $23 million in 2011, $14 million in 2012, $8 million in 2013, and $39 million thereafter. The leases are primarily for office premises, mobile equipment and rail cars.
f) Forward Purchase Commitments We have a number of forward purchase commitments for the purchase of concentrates and power and for shipping and distribution of products, which are incurred in the normal course of business. The majority of these contracts are subject to force majeure provisions.
21. Accounting for Financial Instruments
a) Financial Risk Management
Our activities expose us to a variety of financial risks, which include foreign exchange risk, interest rate risk, commodity price risk, credit risk and liquidity risk. From time-to-time, we may use foreign exchange forward contracts, commodity price contracts and interest rate swaps to manage exposure to fluctuations in foreign exchange, metal prices and interest rates. We do not have a practice of trading derivatives. Our use of derivatives is based on established practices and parameters, which are subject to the oversight of our Hedging Committee and our Board of Directors. Liquidity Risk Liquidity risk arises from our general and capital funding needs. Further discussion on liquidity risk is included in Note 2.

Teck 2008 Annual Report 99
21. Accounting for Financial Instruments, continued
Contractual undiscounted cash flow requirements for financial liabilities as at December 31, 2008:
Less than More than (Cdn$ in millions) Total 1 year 1-3 years 4-5 years 5 years
Short-term debt (Note 11(g)) $ 6,516 $ 6,516 $ - $ - $ - Long-term debt (Note 11(g)) 6,452 1,329 3,905 - 1,218 Estimated interest payments on debt 2,107 436 411 144 1,116 Derivative liabilities 252 252 - - -
Foreign Exchange Risk
We operate on an international basis and therefore, foreign exchange risk exposures arise from transactions denominated in a foreign currency. Our foreign exchange risk arises primarily with respect to the US dollar. Our cash flows from Canadian operations are exposed to foreign exchange risk as commodity sales are denominated in US dollars, and the majority of operating expenses are denominated in Canadian dollars. We have hedged a portion of our future cash flows from US dollar coal sales until April 2009 with US dollar forward sales contracts. We have elected not to actively manage other foreign exchange exposures at this time.
We also have various investments in US dollar self-sustaining operations, whose net assets are exposed to foreign currency translation risk. This currency exposure is managed in part through our US dollar denominated debt as a hedge against these self-sustaining operations. As at December 31, 2008, $5.3 billion of debt was designated in this manner. Foreign exchange fluctuations on the remaining balance of US dollar denominated debt will affect the statement of earnings in the period of change. Changes in the US dollar exchange rate may result in significant fluctuations in our net earnings. This exposure is expected to be reduced as we pay down the debt, generate US dollar cash balances or generate and retain profits in US dollar self-sustaining operations. US dollar financial instruments subject to foreign exchange risk:
(US$ in millions) 2008 2007
Net working capital $ 293 $ 235 US dollar forward sales contracts (183) - Short-term debt (5,350) - Long-term debt (5,293) (1,457) Net investment in foreign self-sustaining operations 5,273 5,335
As at December 31, 2008, with other variables unchanged, a $0.01 strengthening (weakening) of the Canadian dollar against the US dollar would have a $50 million effect (2007 – nominal) on net earnings resulting from our financial instruments. There would also be a $11 million (2007 – nil) decrease (increase) in other comprehensive income from our US dollar forward sales contracts designated as cash flow hedges, and there would be no significant (2007 - $41 million) decrease (increase) in other comprehensive income resulting from our net US dollar investment in self-sustaining operations.

100
21. Accounting for Financial Instruments, continued
Interest Rate Risk Our interest rate risk mainly arises from our cash and cash equivalents, floating rate debt and interest rate swaps. Our interest rate management policy is generally to borrow at fixed rates to match the duration of our long lived assets. However, floating rate funding may be used, as in the case of our acquisition of Fording. The fair value of fixed-rate debt fluctuates with changes in market interest rates, but unless we make a prepayment, the cash flows in US dollars do not.
Cash flows related to floating rate debt fluctuate with changes in market interest rates, but the fair value in US dollars does not. Cash and cash equivalents have short terms to maturity and receive interest based on market interest rates. Interest rate risk associated with cash and cash equivalents is not significant. The fair value of our derivative interest rate swap changes with fluctuations in market interest rates. Unless we settle the contract early, the future cash outflows do not change. As at December 31, 2008, with other variables unchanged, a 1% change in the LIBOR rate would have a $75 million effect (2007 – nil) on net earnings. There would be no effect on other comprehensive income.
Commodity Price Risk
We are subject to price risk from fluctuations in market prices of the commodities that we produce. From time-to-time, we may use commodity price contracts to manage our exposure to fluctuations in commodity prices. At the balance sheet date, we had copper, gold and zinc forward sales contracts outstanding. Our commodity price risk associated with financial instruments primarily relates to changes in fair value caused by settlement adjustments to receivables and payables, the Cajamarquilla contingent receivable and forward contracts for copper, gold and zinc. Sales of metals in concentrate are recognized in revenue on a provisional pricing basis when title transfers and the rights and obligations of ownership pass to the customer, which usually occurs upon shipment. However, final pricing is typically not determined until a subsequent date. Accordingly, revenue in any period is based on current prices for sales occurring in the period and ongoing pricing adjustments from sales that are still subject to final pricing. These pricing adjustments result in additional revenues in a rising price environment and reductions to revenue in a declining price environment, taking into account the actual price participation terms in the concentrate sales agreements. The effect of these adjustments on earnings is mitigated by the effect that changing commodity prices have on price participation clauses in the concentrate sales agreements, royalties, taxes and non-controlling interests. The following represents the effect of financial instruments on after-tax net earnings from a 10% increase to commodity prices, based on the December 31, 2008 prices. There is no effect on other comprehensive income.
Price on December 31, Increase (decrease) on
after-tax net earnings(Cdn$ in millions) 2008 2007 2008 2007
Copper US$1.40/lb US$3.03/lb $15 $ 29 Zinc US$0.51/lb US$1.04/lb 1 (3) Lead US$0.43/lb US$1.15/lb 1 4 Gold US$865/oz US$837/oz (3) (4)

Teck 2008 Annual Report 101
21. Accounting for Financial Instruments, continued
Credit Risk Credit risk arises from the non-performance by counterparties of contractual financial obligations. Our primary counterparties related to our money market investments and derivative contracts carry investment grade ratings as assessed by external rating agencies. There is ongoing review to evaluate the creditworthiness of these counterparties. We manage credit risk for trade and other receivables through established credit monitoring activities. We do not have a significant concentration of credit risk with any single counterparty or group of counterparties. Our maximum exposure to credit risk at the reporting date is the carrying value of our cash and cash equivalents, receivables and derivative assets. While we are exposed to credit losses due to the non-performance of our counterparties, we consider any material risk of this to be unlikely despite the current market conditions.
b) Derivative Financial Instruments and Hedges
Sales and Purchases Contracts
The majority of our metal concentrates are sold under pricing arrangements where final prices are determined by quoted market prices in a period subsequent to the date of sale. In these circumstances, revenues are recorded at the time of sale based on forward prices for the expected date of the final settlement. Metal concentrates for smelting and refining operations are purchased under similar arrangements. Adjustments to the balance of our concentrate receivables and payables from changes in underlying market prices affect revenue or operating costs as appropriate.
Contingent Receivable Related to Sale of Discontinued Operations As a result of the sale of our Cajamarquilla zinc refinery in 2004, we are entitled to additional consideration linked to the price of zinc. Accordingly, we recorded the fair value of this additional consideration at the time of the sale and revalued it each period. This zinc price participation expires in 2009 and is considered an embedded derivative. This instrument is valued based on discounted cash flows using a zinc forward price curve, US dollar forward price and our credit adjusted risk-free interest rate. We recorded an after-tax loss of $18 million in respect of these items for the year in our earnings as discontinued operations (2007 - $46 million loss, 2006 - $36 million gain). These amounts are net of taxes of $3 million, $9 million and $7 million respectively. The pre-tax price participation due for 2008 is US$14 million (2007 - US$38 million).
Cash Flow Hedges US dollar forward sales contracts At December 31, 2008, US dollar forward sales contracts with a notional amount of $1.1 billion remained outstanding. This amount includes contracts that were assumed as part of our purchase of Fording’s assets. The contracts mature at varying dates from January to April 2009. These contracts have been designated as cash flow hedges of a portion of our future cash flows from anticipated US dollar coal sales. We have determined they are highly effective hedges from inception to December 31, 2008. Unrealized gains and losses on our US dollar forward sales contracts are recorded in other comprehensive income. Realized gains and losses on settled contracts are recorded in revenue. Economic Hedge Contracts Copper, zinc and gold forward sales contracts We enter into commodity forward sales contracts to mitigate the risk of price changes for a portion of our sales. These contracts economically lock in prices for a portion of our copper, zinc and gold sales. We do not apply hedge accounting to the commodity forward sales contracts.

102
21. Accounting for Financial Instruments, continued
Zinc forward purchase contracts Certain customers purchase refined metal products at fixed forward prices from our smelter and refinery operations. The forward purchase commitments for these metal products are matched to these fixed price sales commitments to customers.
c) The fair value of our fixed forward sale and purchase contracts is calculated using a discounted cash flow method based on forward metal prices. A summary of our fixed forward sales contracts as at December 31, 2008 is as follows:
2009 2010 2011 Total Fair
Value(Cdn$ in
Zinc (millions of lbs) millions)
Fixed forward sales contracts 57 57 57 171
Average price (US$/lb) 0.72 0.67 0.63 0.68 $ 19
Zinc (millions of lbs)
Fixed forward purchase contracts 3 - - 3
Average price (US$/lb) 0.84 - - 0.84 (2)
Gold (thousands of ozs)
Forward sales contracts 43 - - 43
Average price (US$/oz) 350 - - 350 (28)
US dollars (millions of US$)
Forward sales contracts 1,073 - - 1,073
Average rate (C$/US$) 1.01 - - 1.01 (223)
US dollars (millions of $)
Forward purchase contracts 167 - - 167
Average rate (C$/US$) 1.22 - - 1.22 -
Copper (millions of pounds)
Forward sales contracts 135 - - 135
Average price (US$/lb) 2.40 - - 2.40 163
$(71) We have an interest rate swap on our long-term debt whereby we have swapped a 7% interest rate on US$100 million to LIBOR plus 2.14%. The interest rate swap matures in September 2012 and has a fair market value of $13 million as at December 31, 2008.

Teck 2008 Annual Report 103
22. Capital Risk Management
Our objectives when managing capital are to safeguard our ability to continue as a going concern, to provide an adequate return to shareholders, and to meet external capital requirements on our debt and credit facilities. We monitor capital based on the debt to capitalization ratio. Covenant Requirements Our credit facilities and certain contracts establish a maximum total debt to total capitalization ratio of 60% or lower before September 30, 2009, and a ratio of 50% or lower on September 30, 2009 and thereafter. Management actively monitors this ratio. Total debt is generally defined as all interest bearing liabilities, plus any guarantees of debt. Total capitalization is defined as total debt plus accumulated other comprehensive income, share capital, contributed surplus and retained earnings. As at December 31, 2008, our total debt to total capitalization ratio was 54% (2007 – 17%). In order to meet our covenant requirements, we may adjust our capital structure, by issuing new shares, issuing new debt with different characteristics to replace existing debt, or selling assets to reduce debt and reducing expenditure levels. As part of our capital management plan, we suspended dividends for 2009, and announced the sale of the Lobo-Marte gold project in Chile, the Hemlo gold mines in Canada and our indirect interest in a Peruvian company, Sociedad Minera El Brocal S.A.A., and are actively seeking buyers for certain other assets. Long-Term Capital Management Our long-term strategy is to keep the total debt to total capitalization ratio below 40%. However, the ratio may be higher for periods of time due to certain transactions such as an acquisition. These transactions, while causing the ratio to be out of range for a period of time, are intended to help us meet our capital management objectives in the long run. The ratio was significantly higher in 2008 due to our acquisition of Fording’s assets. Our actions to meet our covenant requirements, such as suspension of dividend payments and sale of assets, also help to ensure we meet our long-term capital management goals.

104
23. Segmented Information We have six reportable segments: copper, coal, zinc, gold, energy and corporate, based on the primary products we produce or are developing. The corporate segment includes all of our initiatives in other commodities, our corporate growth activities and groups that provide administrative, technical, financial and other support to all of our business units. Other income (expense) includes general and administrative costs, research and development, and other income (expense). Prior year comparatives have been restated to conform to current year presentation.
2008
(Cdn$ in millions) Copper Coal Zinc Gold Energy Corporate Total
Segment revenues $ 2,156 $ 2,428 $ 2,262 $ 249 $ - $ - $ 7,095 Less inter-segment revenues - - (191) - - - (191)
Revenues 2,156 2,428 2,071 249 - - 6,904
Operating profit 882 1,160 301 39 - - 2,382 Interest and financing (12) (1) - - - (169) (182) Exploration (94) - (16) (15) - (10) (135) Asset impairment (483) - (71) - - (35) (589) Other income (expense) 283 - - (25) - (339) (81)
Earnings before taxes, non-controlling interests, equity
earnings and discontinued operations 576 1,159 214 (1) - (553) 1,395
Capital expenditures 596 118 117 19 50 39 939 Goodwill 533 1,191 - - - - 1,724
Total assets 7,941 18,008 3,172 404 895 1,113 31,533

Teck 2008 Annual Report 105
23. Segmented Information, continued
2007
(Cdn$ in millions) Copper Coal Zinc Gold Energy Corporate Total
Segment revenues $ 2,186 $ 951 $ 3,439 $ 182 $ - $ - $ 6,758 Less inter-segment revenues - - (387) - - - (387)
Revenues 2,186 951 3,052 182 - - 6,371
Operating profit (loss) 1,354 209 1,180 (5) - - 2,738 Interest and financing (13) (1) - - - (71) (85)Exploration (46) - (20) (22) - (17) (105)Asset impairment - - (43) - - (26) (69)Other income (expense) - - - (28) - 57 29
Earnings before taxes, non-controlling interests,
equity earnings and
discontinued operations 1,295 208 1,117 (55) - (57) 2,508
Capital expenditures 259 35 150 30 70 27 571
Goodwill 663 - - - - - 663
Total assets 6,524 1,359 2,865 357 529 1,939 13,573
2006
(Cdn$ in millions) Copper Coal Zinc Gold Energy Corporate Total
Segment revenues $ 2,220 $ 1,177 $ 3,467 $ 143 $ - $ - $ 7,007 Less inter-segment revenues - - (468) - - - (468)
2,220 1,177 2,999 143 - - 6,539 Revenues
Operating profit 1,617 444 1,493 7 - - 3,561 Interest and financing (11) (2) - - - (84) (97) Exploration (38) - (4) (24) - (6) (72) Asset impairment - - - - - - Other expense (10) - - - - 213 203
Earnings before taxes, non-controlling interests,
equity earnings and
discontinued operations 1,558 442 1,489 (17) - 123 3,595
Capital expenditures 102 18 133 44 73 21 391
Goodwill - - - - - - -
Total assets 1,211 779 4,431 402 190 4,434 11,447

106
23. Segmented Information, continued The geographic distribution of our property, plant and equipment and external sales revenue, with revenue attributed to regions based on the location of the customer, is as follows:
Property, plant and equipment Revenues
(Cdn$ in millions) 2008 2007 2008 2007 2006
Canada $ 16,936 $ 2,687 $ 614 $ 649 $ 724 United States 1,132 1,059 1,230 1,563 1,487 Latin America 5,810 4,020 479 361 251 Asia 4 5 3,204 2,673 2,770 Europe 6 3 1,317 993 1,201 Australia 21 33 45 126 106 Africa - - 15 6 -
$ 23,909 $ 7,807 $ 6,904 $ 6,371 $ 6,539

Teck 2008 Annual Report 107
24. Generally Accepted Accounting Principles in Canada and the United States The effect of the material measurement differences between generally accepted accounting principles in Canada and the United States on our net earnings is summarized as follows:
(Cdn$ in millions, except per share data) 2008 2007 2006
Net earnings under Canadian GAAP $ 659 $ 1,615 $ 2,431 Add (deduct)
Exchangeable debentures due 2024 (b) - - (4) Unrealized holding losses on investments (c) - - (14) Deferred start-up costs (d) 5 3 (11) Exploration expenses (e) (37) (32) (21) Derivative instruments (f) Embedded derivatives - - 94 Non-hedge derivatives 26 18 (53) Asset retirement obligations (g) (3) (3) (3) Deferred stripping (h) (84) (40) (17) Cumulative translation adjustment on partial redemption of subsidiary (i) - 59 - Other (j) - (3) (2) Tax effect of adjustments noted above (l) 3 37 40
Tax benefit on redemption of exchangeable debentures (b) - - 124
Net earnings under US GAAP before comprehensive income adjustments 569 1,654 2,564
Other comprehensive income under Canadian GAAP 934 (576) - Add (deduct) Unrealized gains (losses) on investments (c)
Arising during the period - - 104 Less: reclassification adjustments to net income - - (78)
- - 26 Losses on derivatives designated as cash flow hedges (f)
Arising during the period - - - Less: reclassification adjustments to net income (26) (18) (13)
(26) (18) (13)
Cumulative translation adjustment (i)(k) 4 (63) 21 Additional pension liability (m) 50 42 8
Tax effect of adjustments (l) (15) (10) (2)
Other comprehensive income under US GAAP 947 (625) 40
Comprehensive income (k) $ 1,516 $ 1,029 $ 2,604
Earnings per share under US GAAP before comprehensive income adjustments
Basic $ 1.26 $ 3.83 $ 6.09 Diluted $ 1.26 $ 3.81 $ 5.92 Basic from continuing operations $ 1.30 $ 3.94 $ 5.82
Diluted from continuing operations $ 1.30 $ 3.92 $ 5.65

108
24. Generally Accepted Accounting Principles in Canada and the United States, continued
Balance sheets under Canadian GAAP and US GAAP:
(Cdn$ in millions) 2008 2007
Canadian US Canadian US GAAP GAAP GAAP GAAP
ASSETS
Current assets Cash and cash equivalents $ 850 $ 850 $ 1,408 $ 1,408 Temporary investments 11 11 - - Income taxes receivable 1,130 1,130 33 33 Accounts and settlements receivable 769 769 560 560
Inventories 1,339 1,339 1,004 1,004 Deferred debt issuance costs (p) - 106 - -
4,099 4,205 3,005 3,005
Investments (j) 948 929 1,506 1,494
Property, plant and equipment (d)(e)(g)(h)(j) 23,909 23,574 7,807 7,576
Other assets (m)(p) 853 734 592 435
Goodwill 1,724 1,724 663 663
$ 31,533 $ 31,166 $ 13,573 $ 13,173
LIABILITIES AND SHAREHOLDERS’ EQUITY
Current liabilities Accounts payable and accrued liabilities $ 1,506 $ 1,506 $ 1,238 $ 1,238 Current portion of long-term debt (p) 1,336 1,362 31 31
Short-term debt (p) 6,436 6,516 - -
9,278 9,384 1,269 1,269
Long-term debt (p) 5,102 5,164 1,492 1,492
Other liabilities (g)(m) 1,184 1,098 994 974
Future income and resource taxes (l) 4,965 4,733 2,007 1,768
Non-controlling interests 104 105 92 92
Shareholders’ equity 10,900 10,682 7,719 7,578
$ 31,533 $ 31,166 $ 13,573 $ 13,173

Teck 2008 Annual Report 109
24. Generally Accepted Accounting Principles in Canada and the United States, continued
Shareholders’ equity under Canadian GAAP and US GAAP:
(Cdn$ in millions) 2008 2007
Canadian US Canadian USGAAP GAAP GAAP GAAP
Capital stock $ 5,079 $ 4,955 $ 3,281 $ 3,157 Retained earnings 5,476 5,561 5,038 5,213 Contributed surplus 82 82 71 71 Accumulated other comprehensive income (loss) (k) 263 84 (671) (863)
$ 10,900 $ 10,682 $ 7,719 $ 7,578
a) Adoption of New Accounting Standards
i. Fair Value Measurements In September 2006, the Financial Accounting Standards Board (“FASB”) issued FASB Statement No. 157, “Fair Value Measurements.” The standard defines fair value, establishes a framework for measuring fair value in US GAAP, and expands disclosure about fair value measurements. This standard does not require any new fair value measurements. In February 2008, the FASB issued FSP FAS 157-2, which delays the effective date of FAS 157 to fiscal years beginning after November 15, 2008 for nonfinancial assets and liabilities, except for items that are recognized or disclosed at fair value in the financial statements on a recurring basis. In 2008, we adopted FAS 157 for financial assets and liabilities recognized at fair value on a recurring basis. The adoption did not have a material effect on our financial results. The disclosures required by FAS 157 for financial assets and liabilities measured at fair value on a recurring basis as at December 31, 2008 are included in Note 24(n).
We will apply the requirements of FAS 157 for fair value measurements of financial and nonfinancial assets and liabilities not valued on a recurring basis in 2009. We are currently evaluating the effect of this application on our financial reporting and disclosures.
On October 10, 2008, the FASB issued FSP FAS 157-3, which clarifies the application of FAS 157 in determining the fair value of a financial asset when the market for that asset is not active. FSP FAS 157-3 is effective as of the issuance date and has not affected the valuation of our financial assets.
ii. Fair Value Option for Financial Assets and Financial Liabilities
In February 2007, the FASB issued FAS 159, “Fair Value Option for Financial Assets and Financial Liabilities,” which allows an irrevocable option, the Fair Value Option, to carry eligible financial assets and liabilities at fair value. The election is made on an instrument-by-instrument basis. Changes in fair value for these instruments are recorded in earnings. The objective of FAS 159 is to improve financial reporting by providing entities with the opportunity to mitigate volatility in reported earnings caused by measuring related assets and liabilities differently without having to apply complex hedge accounting provisions.
We applied FAS 159 prospectively in 2008. We have not adopted the Fair Value Option for any of our eligible financial instruments, which primarily include available-for-sale securities, equity-method investments and long-term debt.

110
24. Generally Accepted Accounting Principles in Canada and the United States, continued
iii. The Hierarchy of Generally Accepted Accounting Principles
In May 2008, FASB issued SFAS No. 162, “The Hierarchy of Generally Accepted Accounting Principles,” which identifies the sources of accounting and the framework for selecting the principles to be used in the preparation of financial statements of nongovernmental entities that are presented in conformity with US GAAP. SFAS 162 became effective in November 2008. The adoption of SFAS 162 did not result in any changes in our financial statements.
iv. Accounting for Transfers and Servicing of Financial Assets and Extinguishments of Liabilities and Consolidation of Variable Interest Entities
In December 2008 the FASB issued Staff Position (“FSP”) No. FAS 140-4 and FIN 46(R)-8, which amends FASB Statement No. 140, Accounting for Transfers and Servicing of Financial Assets and Extinguishments of Liabilities, to require public entities to provide additional disclosures about transfers of financial assets. It also amends FASB Interpretation No. 46 (revised December 2003), Consolidation of Variable Interest Entities, to require public enterprises to provide additional disclosures about their involvement with variable interest entities. The disclosures required by this FSP are intended to provide greater transparency to financial statement users about a transferor’s continuing involvement with transferred financial assets and an enterprise’s involvement with variable interest entities and qualifying SPEs. This FSP is effective for the first reporting period (interim or annual) ending after December 15, 2008. The adoption of the FSP in 2008 had no effect on our financial statement disclosures.
b) Exchangeable Debentures Due 2024
Our exchangeable debentures due 2024, redeemed in 2006, were classified as equity with related interest being charged directly to retained earnings. Under US GAAP, we classified these instruments as liabilities and interest was charged against current period earnings. The redemption of the debentures in 2006 was treated as a non-monetary transaction and the carrying value of the debentures was transferred to share capital. Tax benefits arising on the settlement of the debt instrument were recorded in earnings for US GAAP purposes.
c) Unrealized Holding Gains (Losses) on Investments
Under Canadian GAAP, prior to adopting the new financial instruments accounting standards, we recorded investments in marketable securities at cost. For US GAAP, our marketable securities are designated as available-for-sale. Available-for-sale securities are carried at fair value with unrealized gains or losses included in other comprehensive income until realized, or until an other-than-temporary decline occurs. With the adoption of the new Canadian financial instruments standards on January 1, 2007, we recognize our marketable securities at fair value for Canadian GAAP.
d) Deferred Start-up Costs Prior to December 31, 2008, we deferred mine start-up costs under Canadian GAAP until a mine reaches commercial levels of production and amortized these amounts over the life of the project. Under US GAAP, we expensed mine start-up costs as incurred.
e) Exploration Expense
Under Canadian GAAP, we capitalize exploration expenditures where resources, as defined under National Instrument 43-101, exist and it is expected that the expenditures can be recovered by future exploitation or sale. For US GAAP, exploration expenditures are expensed unless proven and probable reserves have been established by a feasibility study.

Teck 2008 Annual Report 111
24. Generally Accepted Accounting Principles in Canada and the United States, continued
f) Derivative Instruments
Under Canadian GAAP, we adopted the financial instruments accounting standards on January 1, 2007. Prior to adoption, derivative instruments, to which hedge accounting was applied, were held off-balance sheet with realized gains and losses recorded in net earnings. Non-hedge derivative instruments were recorded on the balance sheet at fair value with changes in fair value recorded in other income (expense).
For US GAAP purposes, all derivatives are recorded on the balance sheet as either assets or liabilities at fair value.
i. The Inco exchangeable debentures, settled in 2006, included an option to settle the debt with Inco shares. Under US GAAP, this option constituted an embedded derivative which was accounted for as a separate derivative instrument and recorded on the balance sheet at fair value with changes in fair value included in net earnings.
ii. TCAK’s agreement with the Northwest Arctic Borough includes an escalation clause based on zinc price. This
constitutes an embedded derivative and the derivative instrument has been separately valued and recorded at fair value on the balance sheet. Changes in fair value are included in net earnings. With the adoption of the new Canadian GAAP financial instruments standards on January 1, 2007, we recognized this embedded derivative for Canadian GAAP.
iii. Our contingent consideration from the sale of Cajamarquilla based on zinc prices (Note 21(b)) constitutes an
embedded derivative under US GAAP and the derivative instrument has been separately valued and recorded at fair value on the balance sheet. Changes in fair value are included in net earnings. With the adoption of the Canadian GAAP financial instruments standards on January 1, 2007 we recognized this embedded derivative for Canadian GAAP.
iv. With the adoption of the Canadian GAAP financial instruments accounting standards on January 1, 2007, our unrealized losses on cash flow hedges were charged, net of taxes, directly to opening accumulated other comprehensive income. As these previously designated cash flow hedges mature, losses are brought into net earnings. Under US GAAP, these derivatives were not designated as cash flow hedges, and accordingly, unrealized gains and losses were recorded in net earnings.
g) Asset Retirement Obligations
For US GAAP purposes, we adopted FASB Statement No. 143, “Accounting for Asset Retirement Obligations,” effective January 1, 2003. We adopted the provisions of CICA 3110, “Asset Retirement Obligations,” for Canadian GAAP purposes effective January 1, 2004. The United States and Canadian standards for asset retirement obligations are substantially the same, however, due to the difference in adoption dates, different discount rate assumptions were used in initial liability recognition. This resulted in differences in the asset and liability balances on adoption and will result in different amortization and accretion charges over time.
h) Deferred Stripping
Canadian GAAP differs from US GAAP in that it allows the capitalization of deferred stripping costs when such costs are considered a betterment of the asset. Under US GAAP, all stripping costs are treated as variable production costs.

112
24. Generally Accepted Accounting Principles in Canada and the United States, continued
i) Cumulative Translation Losses
Under Canadian GAAP, when a foreign subsidiary pays a dividend to the parent company and there has been a reduction in the net investment, a gain or loss equivalent to a proportionate amount of cumulative translation adjustment is recognized in net income.
Under US GAAP, a gain or loss from the cumulative translation adjustment is only recognized when the foreign subsidiary is sold, or the parent completely or substantially liquidates its investment.
j) Other Other adjustments include differences in respect of equity earnings, interest capitalization and other items.
k) Comprehensive Income
Under US GAAP, comprehensive income is recognized and measured in accordance with FASB Statement No. 130, “Reporting Comprehensive Income.” Comprehensive income includes all changes in equity other than those resulting from investments by owners and distributions to owners. Comprehensive income includes two components, net income and other comprehensive income. Other comprehensive income includes amounts that are recorded as an element of shareholders’ equity, but are excluded from net income as these transactions or events were attributable to changes from non-owner sources. These items include pension liability adjustments, holding gains and losses on certain investments, gains and losses on certain derivative instruments and foreign currency gains and losses related to self-sustaining foreign operations (cumulative translation adjustment). We adopted the Canadian GAAP standard for comprehensive income and other comprehensive income on January 1, 2007.
l) Income taxes
The adjustment to tax expense is the tax effect of adjustments under US GAAP. The computation of income taxes related to adjustments is based on the nature of the adjustment and the jurisdiction in which the adjustment originated. The company operates in various jurisdictions which are subject to local tax legislation, resulting in varying rates for each reconciling item. The model for recognition and measurement of uncertain tax positions is different under US GAAP. For US GAAP purposes, our unrecognized tax benefits on January 1, 2007 and 2008 were $11 million. There were additions, reductions and settlements to unrecognized tax benefits throughout the year and, as a result, the unrecognized tax benefits on December 31, 2008 increased to $27 million. Our unrecognized tax benefits, if recognized, would not significantly affect our effective tax rate. We recognize interest and penalties related to unrecognized tax benefits in other income and expenses. During the years ended December 31, 2008, 2007 and 2006, we did not recognize any significant tax related interest or penalties. We also did not accrue significant amounts of tax related interest and penalties at December 31, 2008 and 2007. The balance of the adjustment to tax expense is the tax effect of adjustments to net earnings under US GAAP.
m) Pension Liability
For US GAAP purposes, we are required to report the overfunded asset or underfunded liability of our defined benefit pension and other post-retirement plans on the balance sheet. Since the adoption of SFAS No. 158 on December 31, 2006, changes in the funded status are recorded through other comprehensive income. The information set out below should be read in conjunction with the information disclosed under Canadian GAAP requirements for pension and other employee future benefits provided in Note 12(b).

Teck 2008 Annual Report 113
24. Generally Accepted Accounting Principles in Canada and the United States, continued The funded status at the end of the year and the related amounts recognized on the statement of financial position for US GAAP purposes are as follows:
2008 2007
Other post- Other post- Pension retirement Pension retirement
(Cdn$ in millions) benefits benefits benefits benefits
Funded status at end of year Fair value of plan assets $ 1,213 $ - $ 1,257 $ - Benefit obligations 1,224 248 1,260 272
Funded status $ (11) $ (248) $ (3) $ (272)
Amounts recognized in the balance sheet Non-current asset $ 88 $ - $ 79 $ - Current liability (8) (10) (4) (10)
Non-current liability (91) (238) (78) (262)
$ (11) $ (248) $ (3) $ (272)
Amounts recognized in accumulated other comprehensive income
Net actuarial loss (gain) $ 108 $ (28) $ 110 $ 33 Prior service cost 93 22 68 30
$ 201 $ (6) $ 178 $ 63
The projected benefit obligation, accumulated benefit obligation and fair value of plan assets for pension plans with an accumulated benefit obligation in excess of plan assets at December 31, 2008 and 2007 were as follows:
(Cdn$ in millions) 2008 2007
Accumulated benefit obligation in excess of plan assets Projected benefit obligation $ 297 $ 347 Accumulated benefit obligation 285 321
Fair value of plan assets 212 269

114
24. Generally Accepted Accounting Principles in Canada and the United States, continued
The estimated amounts that will be amortized from accumulated other comprehensive income into net periodic benefit cost in 2009 are as follows:
Other post-Pension retirement
(Cdn$ in millions) benefits benefits
Actuarial (gain) loss $ 6 $ (1)Prior service cost 21 6
Total $ 27 $ 5
n) Fair Value Measurements
Our financial assets and liabilities are measured at fair value on a recurring basis and classified in their entirety based on the lowest level of input that is significant to the fair value measurement. There are three levels of fair value hierarchy that prioritize the inputs to valuation techniques used to measure fair value, with level 1 inputs having the highest priority. The levels and the valuation techniques used to value our financial assets and liabilities are described below: Level 1 - Unadjusted quoted prices in active markets that are accessible at the measurement date for identical,
unrestricted assets or liabilities.
Cash equivalents, including demand deposits and money market instruments, are valued using quoted market prices. Marketable equity securities are valued using quoted market prices in active markets, obtained from securities exchanges. Accordingly, these items are included in level 1 of the fair value hierarchy.
Level 2 - Quoted prices in markets that are not active, quoted prices for similar assets or liabilities in active
markets, or inputs that are observable, either directly or indirectly, for substantially the full term of the asset or liability.
Derivative instruments are included in level 2 of the fair value hierarchy as they are valued using pricing models or discounted cash flow models. These models require a variety of inputs, including, but not limited to, contractual terms, market prices, forward price curves, yield curves, and credit spreads. These inputs are obtained from or corroborated with the market where possible. Also included in level 2 are settlements receivable and settlements payable from provisional pricing on concentrate sales and purchases because they are valued using quoted market prices for similar assets and liabilities such as the forward price curves for copper, zinc and lead.
Level 3 - Unobservable (supported by little or no market activity) prices.
We include investments in debt securities in level 3 of the fair value hierarchy because they trade infrequently and have little price transparency. We review the fair value of these instruments periodically and estimate an impairment charge based on management’s best estimates, which are unobservable inputs.

Teck 2008 Annual Report 115
24. Generally Accepted Accounting Principles in Canada and the United States, continued The fair values of our financial assets and liabilities at December 31, 2008 are summarized in the following table:
(Cdn$ in millions)
Quoted prices in active markets
for identical assets
(Level 1)
Significant other
observable inputs
(Level 2)
Significant unobservable
inputs (Level 3) Total
Assets Cash and cash equivalents $ 850 $ - $ - $ 850Marketable equity securities 104 - - 104 Marketable debt securities - - 25 25
Settlements receivable - 184 - 184 Derivative instruments - 195 - 195
954 379 25 1,358
Liabilities Derivative instruments 252 - 252Settlements payable - 141 141
$ - $ 393 $ - $ 393
o) Proportionate Consolidation
US GAAP requires investments in joint ventures to be accounted for under the equity method, while under Canadian GAAP the accounts of joint ventures are proportionately consolidated. All of our joint ventures qualify for the Securities and Exchange Commission’s accommodation, which allows us to continue to follow proportionate consolidation. Additional information concerning our interests in joint ventures is presented in Note 18.
p) Debt Issuance Costs
Under Canadian GAAP, short-term and long-term debt are initially recorded at total proceeds received less direct issuance costs. Under US GAAP, direct issuance costs are recorded separately as an asset.
q) Recent US Accounting Pronouncements
i. Business Combinations
In December 2007 the FASB issued FAS 141(R), “Business Combinations,” which replaces FAS 141 prospectively for business combinations consummated in the fiscal year commencing after the effective date of December 15, 2008. Early adoption is not permitted. Under FAS 141(R), business acquisitions are accounted for under the “acquisition method,” compared to the “purchase method” mandated by FAS 141. The standard also presents revised guidance for a number of areas, including the measurement of assets acquired, liabilities assumed, and non-controlling interest in an acquisition of less than 100% of the acquiree, the definition of a business for the purpose of acquisitions, the measurement date for equity interests issued by the acquirer, the adjustment of income tax estimates in the acquisition, the treatment of acquisition-related costs of the acquirer, and the disclosure requirements around the nature and financial effects of the business combination. This statement will affect our financial statements for any business combinations commencing in 2009.

116
24. Generally Accepted Accounting Principles in Canada and the United States, continued
ii. Non-controlling Interests in Consolidated Financial Statements
In December 2007 the FASB issued FAS 160, “Non-controlling Interests in Consolidated Financial Statements,” which is effective for fiscal year 2009. Under FAS 160, non-controlling interests are measured at 100% of the fair value of assets acquired and liabilities assumed. Under current standards, the non-controlling interest is measured at book value. For presentation and disclosure purposes, non-controlling interests are classified as a separate component of shareholders’ equity. In addition, FAS 160 revises how changes in ownership percentages are accounted for, including when a parent company deconsolidates a subsidiary but retains a non-controlling interest. As well, attribution of losses to the non-controlling interests is no longer limited to the original carrying amount. The provisions of FAS 160 are to be applied prospectively with the exception of the presentation and disclosure provisions, which are to be applied for all prior periods presented in the financial statements. Early adoption is not permitted. We are currently evaluating the potential effect of adopting this statement on our financial statements.
iii. Disclosures about Derivative Instruments and Hedging Activities
In March 2008, the FASB issued FAS 161, “Disclosures about Derivative Instruments and Hedging Activities – an amendment of FASB Statement No. 133,” which requires entities to provide enhanced disclosures about (a) how and why an entity uses derivative instruments, (b) how derivative instruments and related hedged items are accounted for under FAS 133 and its related interpretations, and (c) how derivative instruments and related hedged items affect an entity’s financial position, financial performance and cash flows. We are currently evaluating the potential effect of adopting this standard on our note disclosures.
iv. Equity Method Investment Accounting In November 2008, the FASB issued EITF Issue No. 08-6 “Equity-Method Investment Accounting.” EITF 08-6 concludes that the cost basis of a new equity-method investment would be determined using a cost-accumulation model, which would continue the practice of including transaction costs in the cost of investment and would exclude the value or contingent consideration. Equity method investments should be subject to other-than-temporary impairment analysis. It also requires that a gain or loss be recognized on the portion of the investor’s ownership sold. EITF 08-6 is effective for fiscal years beginning after December 15, 2008. We are currently evaluating the effect the adoption of this ETIF may have on our financial statements.
v. Employers’ Disclosures about Post-retirement Benefit Plan Assets
In December 2008, the FASB issued FSP FAS 132(R)-1, “Employers’ Disclosures about Post-retirement Benefit Plan Assets”, which amends FAS 132 and provides guidance on an employer’s disclosures about plan assets of a defined benefit pension or other post-retirement plan. FSP FAS 132(R)-1 requires employers to consider certain overall objectives in providing disclosures about plan assets including how investment allocation decisions are made, the major categories of plan assets, the inputs and valuation techniques used to measure the fair value of plan assets, the effect of fair value measurements using significant unobservable inputs on changes in plan assets for the period and significant concentrations of risk within plan assets. FSP FAS 132(R)-1 is effective for disclosures about plan assets provided for fiscal years ending after December 15, 2009. We are currently evaluating the potential effect of adopting this standard on our note disclosures.

Teck 2008 Annual Report 117
Directors
Norman B. Keevil Chairman of the Board
Warren S. R. Seyffert Lead Director
Donald R. Lindsay President and Chief Executive Officer
Mayank M. Ashar J. Brian Aune Jalynn H. Bennett
Hugh J. Bolton Norman B. Keevil III Takashi Kuriyama
Takuro Mochihara Derek G. Pannell Janice G. Rennie
Keith E. Steeves Christopher M. T. Thompson
Officers
Norman B. Keevil Chairman of the Board Donald R. Lindsay President and Chief Executive Officer Michael E. Agg Senior Vice President, Zinc Roger J. Higgins Senior Vice President, Copper Douglas H. Horswill Senior Vice President, Sustainability and External Affairs G. Leonard Manuel Senior Vice President and General Counsel Ronald A. Millos Senior Vice President, Finance and Chief Financial Officer Boyd Payne Senior Vice President, Coal Peter C. Rozee Senior Vice President, Commercial Affairs
Ronald J. Vance Senior Vice President, Corporate Development Timothy C. Watson Senior Vice President, Project Development Michael J. Allan Vice President, Engineering Dale E. Andres Vice President, Copper Strategy and North American Operations David R. Baril Vice President, Chile Operations Fred S. Daley Vice President, Exploration Karen L. Dunfee Corporate Secretary Michel P. Filion Vice President, Environment Health and Safety John F. Gingell Controller
Gary M. Jones Vice President, Business Development Lawrence A. Mackwood Treasurer David R. Parker Vice President, Sustainability Raymond Reipas Vice President, Energy Robert G. Scott Vice President, Gold Andrew A. Stonkus Vice President, Base Metals Marketing John F. H. Thompson Vice President, Technology James A. Utley Vice President, Human Resources Gregory A. Waller Vice President, Investor Relations and Strategic Analysis Anthony A. Zoobkoff Senior Counsel and Assistant Secretary
More information on our directors and officers can be found in our most recent Annual Information Form, or Management Proxy Circular, which are available on our website at www.teck.com, or on the Canadian Securities Administrators website at www.sedar.com and on the EDGAR section of the SEC’s website at www.sec.gov.

118
Corporate Information 2008 Share Prices and Trading Volume Shareholder Relations
Karen L. Dunfee, Corporate Secretary Transfer Agents Inquiries regarding change of address, stock transfer, registered shareholdings, dividends or lost certificates should be directed to our Registrar and Transfer Agent: CIBC Mellon Trust Company 1600-1066 West Hastings Street Vancouver, British Columbia V6E 3X1 CIBC Mellon Trust Company provides an Answerline Service for the convenience of shareholders: Toll-free in Canada and the US 1-800-387-0825 Outside Canada and the US 1-416-643-5500 E-mail: [email protected] BNY Mellon Shareowner Services 480 Washington Boulevard Jersey City, NJ 07310 USA 1-800-589-9836 Email: [email protected] Website: www.bnymellon-investor.com Auditors PricewaterhouseCoopers LLP Chartered Accountants 250 Howe Street, Suite 700 Vancouver, British Columbia V6C 3S7
Annual Information Form We prepare an Annual Information Form (AIF) that is filed with the securities commissions or similar bodies in all the provinces of Canada. Copies of our AIF and annual and quarterly reports are available on request or on our website at www.teck.com, on the Canadian Securities Administrators’ website at www.sedar.com and on the EDGAR section of the SEC’s website at www.sec.gov.
Class B subordinate voting shares-TSX-C$/share
High Low Close Volume Q1 $43.44 $28.00 $42.09 234,594,248Q2 $52.90 $40.25 $49.17 154,650,082Q3 $49.24 $27.00 $30.22 196,305,940Q4 $29.89 $3.35 $6.02 572,112,338
1,157,662,608 Class B subordinate voting shares-NYSE-US$/share
High Low Close Volume Q1 $44.24 $27.06 $40.96 94,820,220Q2 $53.68 $39.21 $47.95 64,651,302Q3 $48.09 $26.07 $29.12 162,287,038Q4 $28.02 $2.60 $4.92 332,117,284
653,875,844 Class A common shares-TSX-C$/share
High Low Close Volume Q1 $48.89 $34.00 $47.85 202,995Q2 $56.49 $45.95 $51.00 247,896Q3 $51.99 $30.05 $33.40 167,718Q4 $33.50 $5.90 $7.26 494,405
1,113,014 Stock Exchanges Our Class A common and Class B subordinate voting shares are listed on the Toronto Stock Exchange under the symbols TCK.A and TCK.B respectively. Our Class B subordinate voting shares are listed on the New York Stock Exchange under the symbol TCK.
Dividends on Class A and B shares Amount per share Payment Date$0.50 January 3, 2008$0.50 July 3, 2008 These dividends are eligible for both the Federal and Provincial enhanced dividend tax credits. Shares Outstanding at December 31, 2008 Class A common shares 9,353,470Class B subordinate voting shares 477,512,086

Teck 2008 Annual Report 119
Caution on Forward-Looking Information This document contains certain forward-looking information and forward-looking statements as defined in applicable securities laws. All statements other than statements of historical fact are forward looking statements. These forward-looking statements, principally under the heading “Outlook,” but also elsewhere in this document, include estimates, forecasts, and statements as to management’s expectations with respect to, among other things, our future earnings and cash flow, our plans to reduce or refinance our outstanding indebtedness and the expected impact of steps that we have taken to reduce spending, potential sources of funds to repay indebtedness, our planned sales of assets, ongoing discussions with our lenders, the future availability of unused credit lines, our ability to comply with debt covenants, our plans for our oil sands investments, forecast recoveries and the resolution of geotechnical issues at Highland Valley Copper, expected progress and costs of our Andacollo concentrate project, the financial and accounting consequences of our acquisition of the assets of Fording Canadian Coal Trust, the sensitivity of our earnings to changes in commodity prices and exchange rates, the potential impact of transportation and other potential production disruptions, the impact of currency exchange rates, future trends for the company, progress in development of mineral properties, future production and sales volumes, capital expenditures and mine production costs, demand and market outlook for commodities, future commodity prices and treatment and refining charges, the settlement of coal contracts with customers, the outcome of mine permitting currently underway, our assessment of the quantum of potential natural resource damages and other costs in connection with the Upper Columbia River Basin and the outcome of legal proceedings involving the company. These forward-looking statements involve numerous assumptions, risks and uncertainties and actual results may vary materially. These statements are based on a number of assumptions, including, but not limited to, assumptions regarding general business and economic conditions, interest rates, the supply and demand for, deliveries of, and the level and volatility of prices of copper, coal, zinc and gold and other primary metals and minerals as well as oil, and related products, the timing of the receipt of regulatory and governmental approvals for our development projects and other operations, our costs of production and production and productivity levels, as well as those of our competitors, power prices, market competition, the accuracy of our reserve estimates (including with respect to size, grade and recoverability) and the geological, operational and price assumptions on which these are based, conditions in financial markets and the future financial performance of the company. The foregoing list of assumptions is not exhaustive. Events or circumstances could cause actual results to vary materially Factors that may cause actual results to vary materially include, but are not limited to, changes in commodity and power prices, changes in interest and currency exchange rates, acts of foreign governments and the outcome of legal proceedings, inaccurate geological and metallurgical assumptions (including with respect to the size, grade and recoverability of mineral reserves and resources), unanticipated operational difficulties (including failure of plant, equipment or processes to operate in accordance with specifications or expectations, cost escalation, unavailability of materials and equipment, government action or delays in the receipt of government approvals, industrial disturbances or other job action, adverse weather conditions and unanticipated events related to health, safety and environmental matters), political risk, social unrest, failure of customers or counterparties to perform their contractual obligations, the outcome of our ongoing discussions with lenders (including potential additional costs or covenants associated with the refinancing of our existing indebtedness and the risk that we may not be able to reach an appropriate accommodation with lenders), the results of our ongoing efforts to sell assets, further changes in our credit ratings, and changes or further deterioration in general economic conditions or continuation of current severe disruptions in credit and financial markets. Statements concerning future production costs or volumes, and the sensitivity of the company’s earnings to changes in commodity prices and exchange rates are based on numerous assumptions of management regarding operating matters and on assumptions that demand for products develops as anticipated, that customers and other counterparties perform their contractual obligations, that operating and capital plans will not be disrupted by issues such as mechanical failure, unavailability of parts and supplies, labour disturbances, interruption in transportation or utilities, adverse weather conditions, and that there are no material unanticipated variations in the cost of energy or supplies. We assume no obligation to update forward-looking statements except as required under securities laws. Further information concerning risks and uncertainties associated with these forward looking statements and our business can be found in our Annual Information Form for the year ended December 31, 2008, filed on SEDAR and on EDGAR under cover of Form 40F.

Teck Cominco Limited +1 604 699 4000 TelSuite 3300, 550 Burrard Street + 1604 699 4750 FaxVancouver, British Columbia www.teck.comCanada V6C 0B3