ted dejong department of plant sciences uc davis
TRANSCRIPT
Ted DeJong Department of Plant Sciences
UC DAVIS

CCalifornia Crop Acreage Trends (2005-2014) Apples 24000 15000 Apricots 12600 9500 Cherries 25000 333000 Figs 12000 7000 Kiwifruit 4500 3900 Nectarines 34000 21000 Olives 32000 337000 Peach (clingstone) 30400 20000 Peach (freestone) 33000 24000 Pears (Bartlett) 12000 8500 Pears (other) 4000 2600 Plums (fresh) 32000 18000 Plums (dried prunes) 67000 48000
CDFA 2015 Crop Statistics
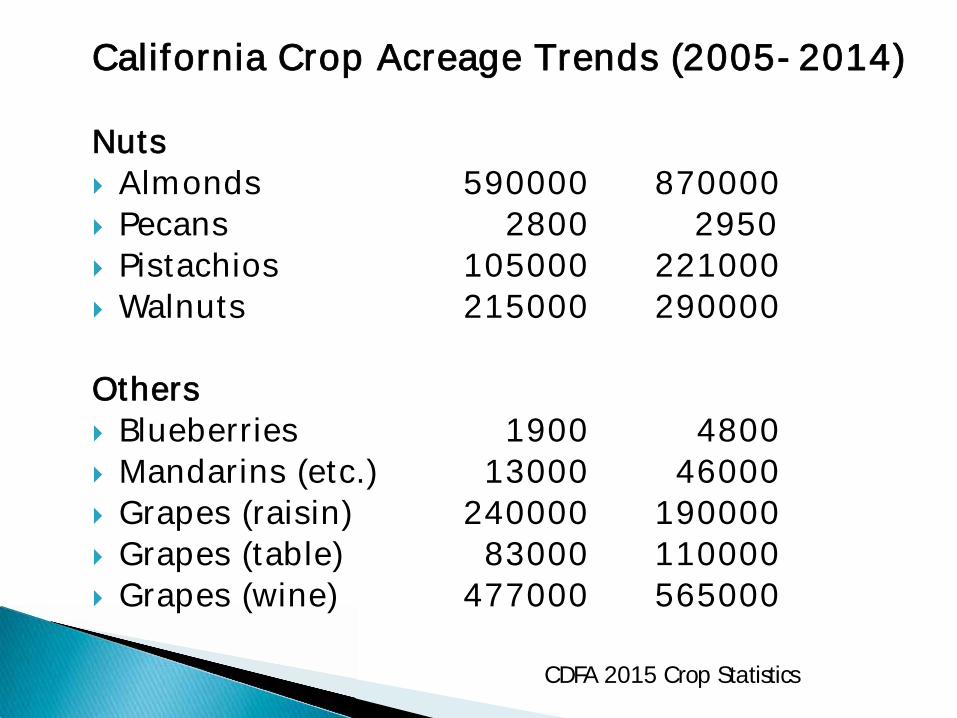
CCalifornia Crop Acreage Trends (2005-2014) Nuts Almonds 590000 870000 Pecans 2800 2950 Pistachios 105000 221000 Walnuts 215000 290000
Others Blueberries 1900 4800 Mandarins (etc.) 13000 46000 Grapes (raisin) 240000 190000 Grapes (table) 83000 110000 Grapes (wine) 477000 565000
CDFA 2015 Crop Statistics
California peach and nectarine growers have tried: ◦ White-fleshed sub acid ◦ White-fleshed normal acid ◦ Yellow-fleshed sub acid ◦ Flat (doughnut) shaped fruit
But today the majority of new plantings involve yellow-fleshed normal flavored varieties. Flavor and size of new early season cultivars has improved over past few years.
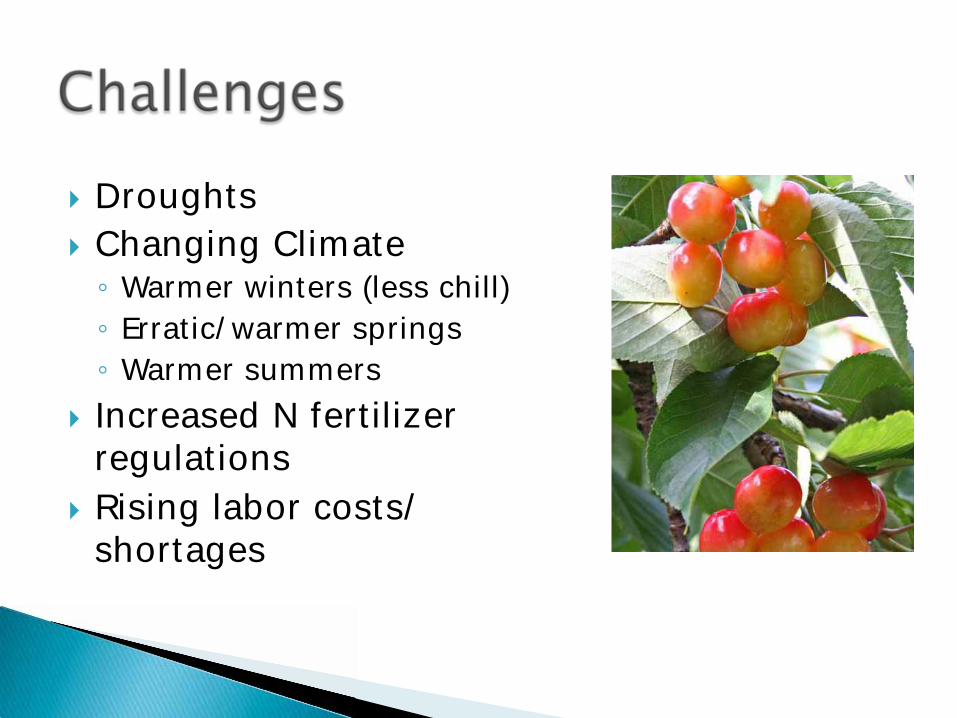
Droughts Changing Climate ◦ Warmer winters (less chill) ◦ Erratic/warmer springs ◦ Warmer summers
Increased N fertilizer regulations Rising labor costs/shortages

In spite of what some “scientists” may tell you, there is no known plant biological answer for maintaining high levels of productivity while coping with drought. Crop productivity is a direct function of crop light interception and the use of light energy to carry out photosynthesis.
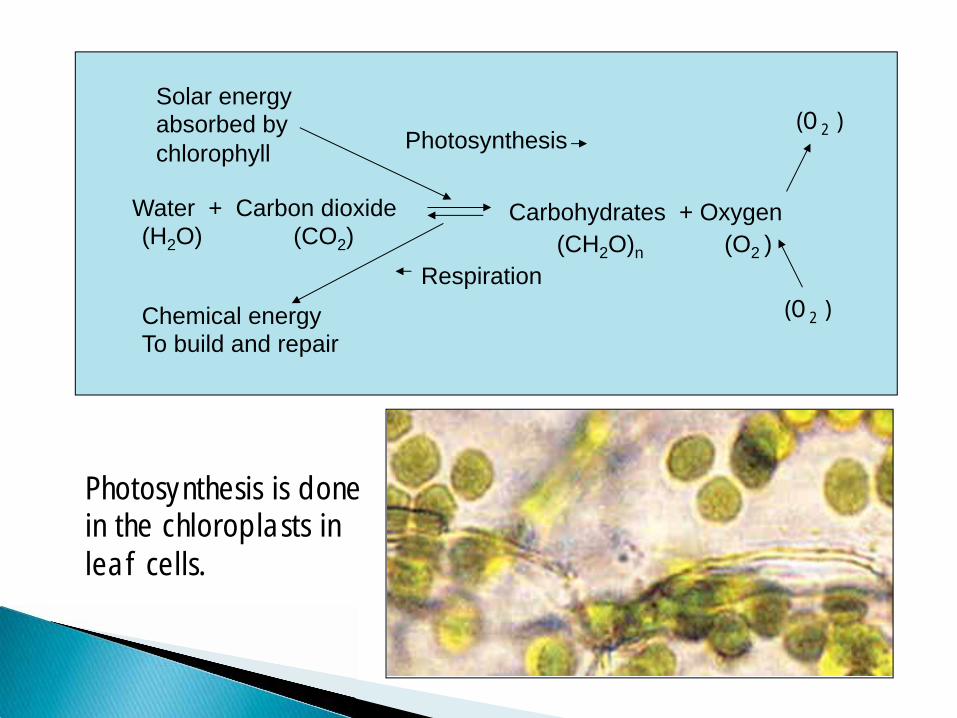
Carbohydrates + Oxygen (H2O) (CO2) (CH2O)n (O2 )
Photosynthesis
Respiration
Solar energy absorbed by chlorophyll
Chemical energy To build and repair
Water + Carbon dioxide
(O2 )
(O2 )
Photosynthesis is done in the chloroplasts in leaf cells.
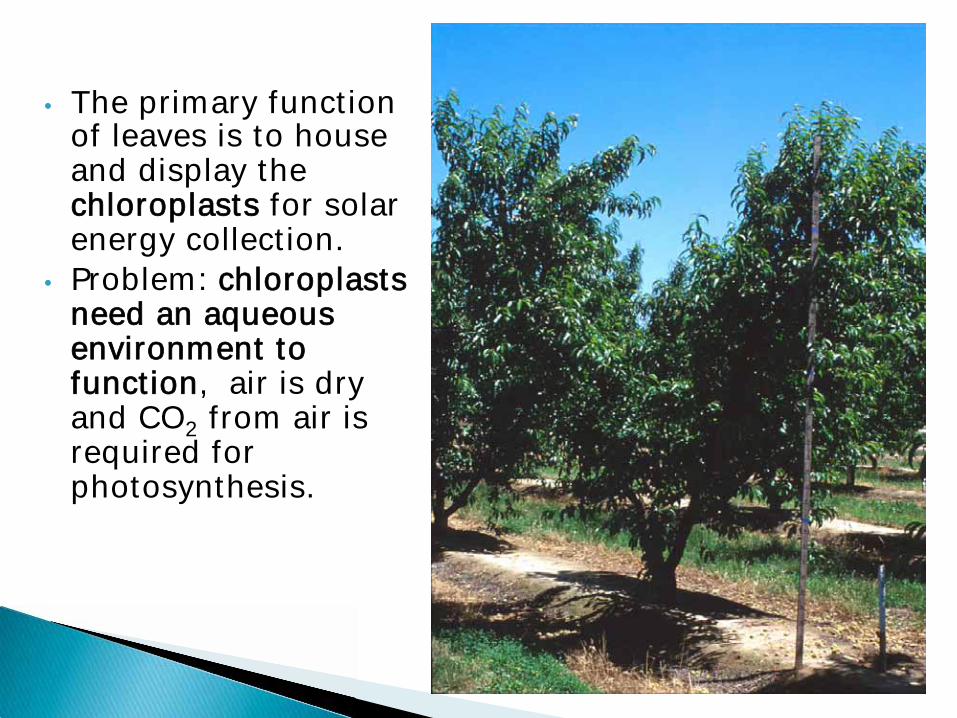
• The primary function of leaves is to house and display the cchloroplasts for solar energy collection.
• Problem: cchloroplasts need an aqueous environment to function, air is dry and CO2 from air is required for photosynthesis.
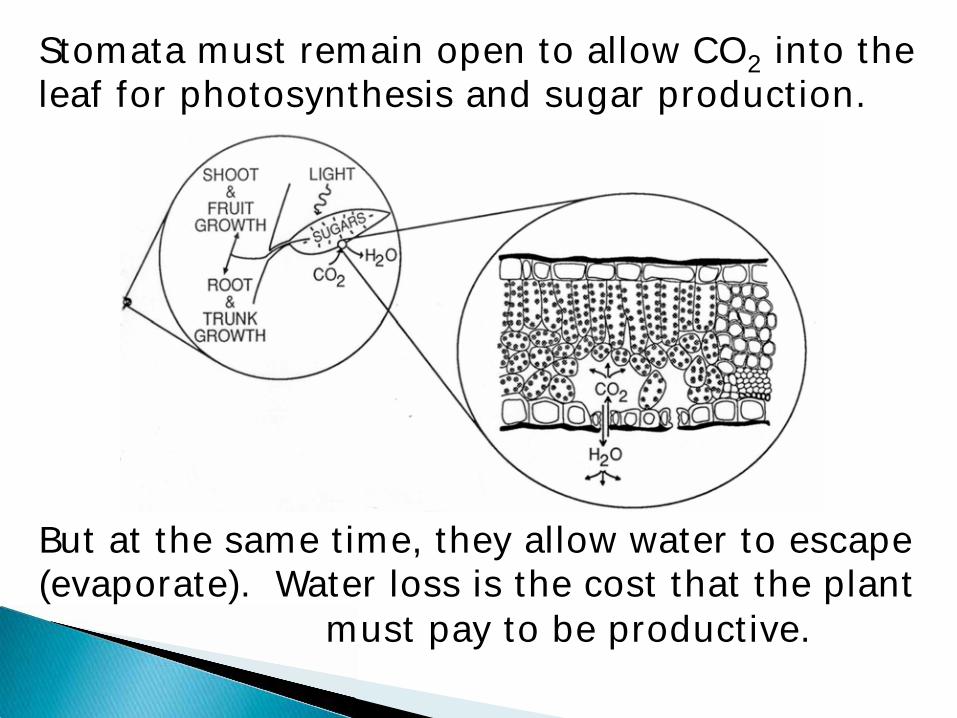
Stomata must remain open to allow CO2 into the leaf for photosynthesis and sugar production.
But at the same time, they allow water to escape (evaporate). Water loss is the cost that the plant
must pay to be productive.
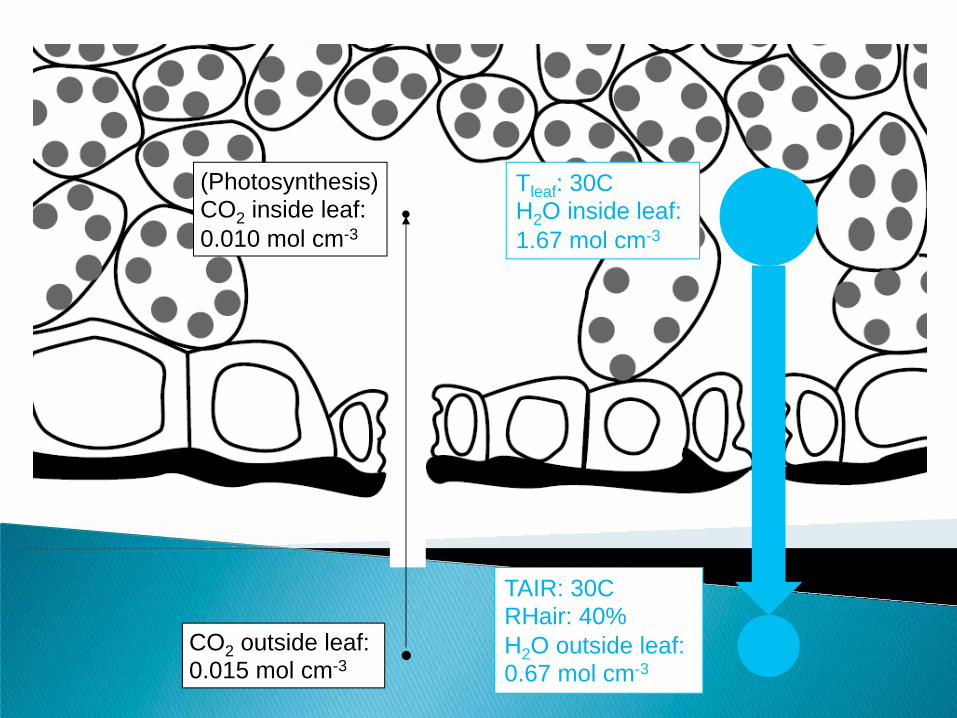
Tleaf: 30C H2O inside leaf: 1.67 mol cm-3
TAIR: 30C RHair: 40% H2O outside leaf: 0.67 mol cm-3
(Photosynthesis) CO2 inside leaf: 0.010 mol cm-3
CO2 outside leaf: 0.015 mol cm-3
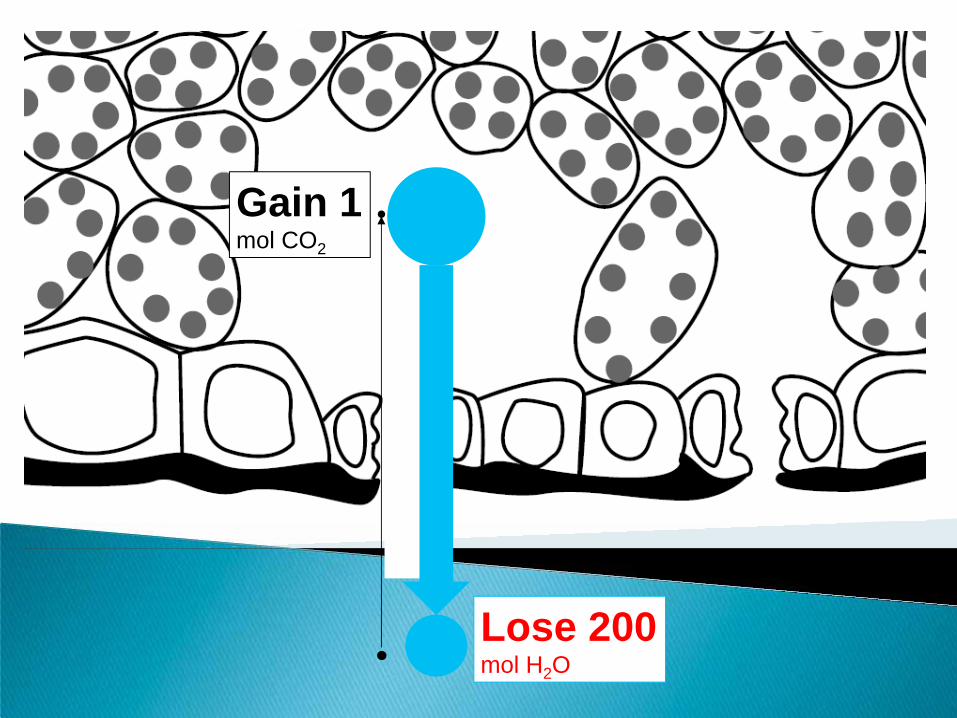
Lose 200 mol H2O
Gain 1 mol CO2
Is it reasonable to try to develop drought resistant rootstocks for fruit and nuts production? No, tree survival during drought is not the problem. Drought resistant rootstocks do not address the fundamental photosynthesis-water loss problem.

The only way to address drought is to optimize irrigation systems, scheduling and general practices and implement water conservation/regulated deficit irrigation where feasible. http://ciwr.ucanr.edu/California_Drought_Expertise/Drought_information/
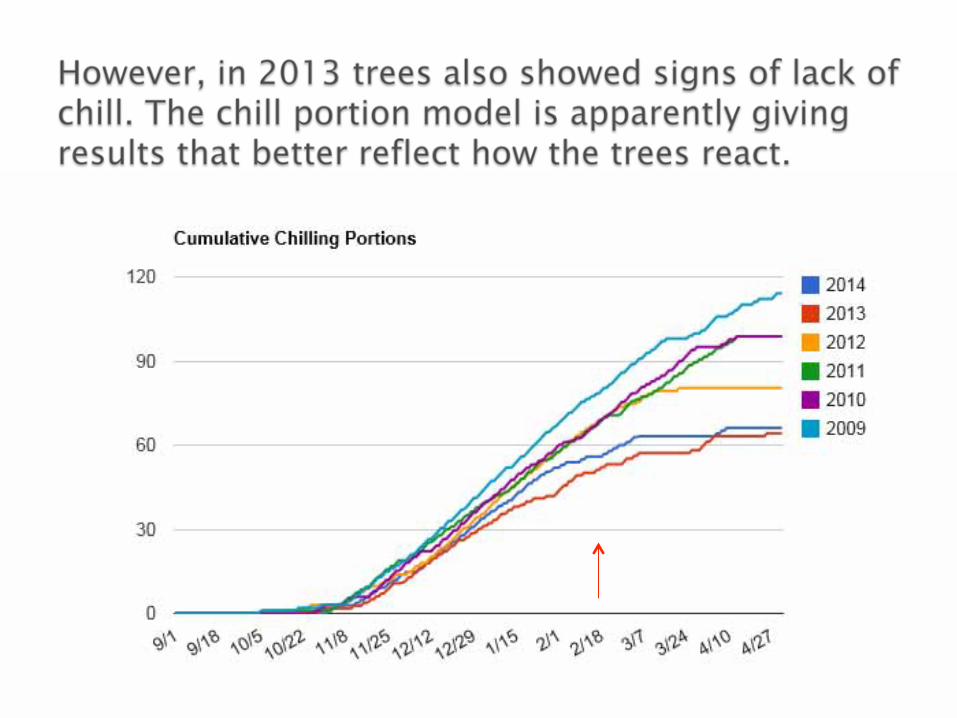
Lack of chilling can primarily be dealt with by switching to lower chill requiring cultivars/crops.
Dormancy breaking chemicals can work in some cases but they are really just a temporary solution.
There is some recent research done by my colleagues at UCD that indicate that CHO metabolism is still very active during dormancy and that large day/night temperature fluctuations in winter may deplete CHO reserves and affect subsequent cropping.
California prune production is dependent on one cultivar, ‘Improved French’ This cultivar does not set fruit when temperatures during bloom are > 25 oC Temperature spikes during bloom have caused reduced crops in prunes in 5 out of 12 years.
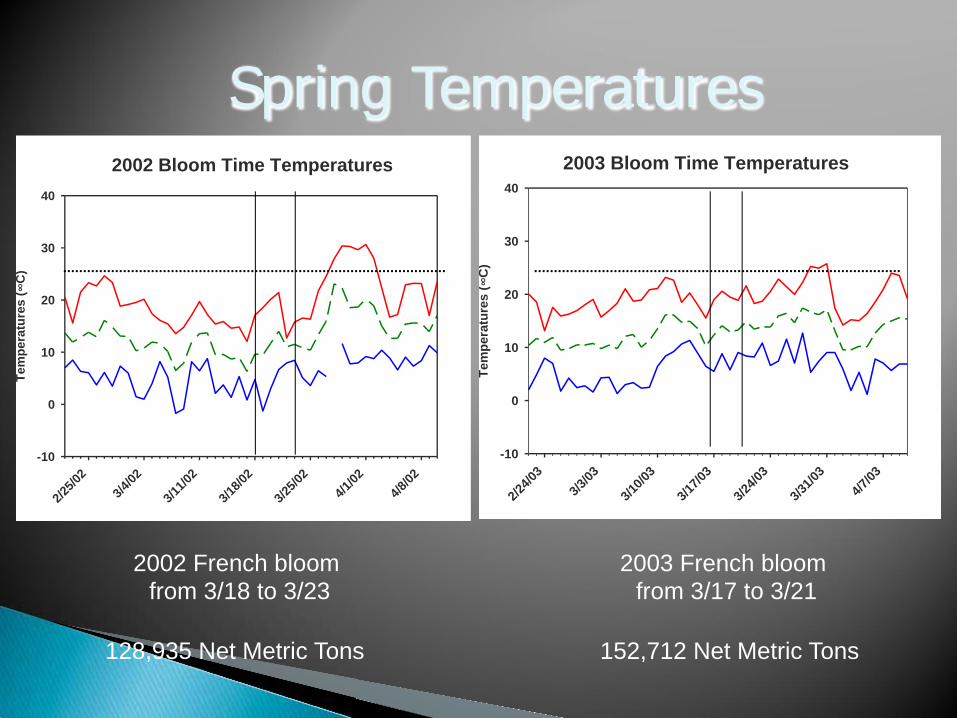
Spring Temperatures
2003 French bloom from 3/17 to 3/21
2002 French bloom from 3/18 to 3/23
2003 Bloom Time Temperatures
2/24/0
3
3/3/03
3/10/0
3
3/17/0
3
3/24/0
3
3/31/0
3
4/7/03
Te
mpe
ratu
res
(∞ C
)
-10
0
10
20
30
402002 Bloom Time Temperatures
2/25/0
2
3/4/02
3/11/0
2
3/18/0
2
3/25/0
2
4/1/02
4/8/02
Tem
pera
ture
s (∞
C)
-10
0
10
20
30
40
152,712 Net Metric Tons 128,935 Net Metric Tons
Spring Temperatures 2005 Bloom Time Temperatures
2/28/0
5
3/7/05
3/14/0
5
3/21/0
5
3/28/0
5
4/4/05
Te
mpe
ratu
re (∞
C)
-10
0
10
20
30
40
2004 Bloom Time Temperature
2/23/0
4
3/1/04
3/8/04
3/15/0
4
3/22/0
4
3/29/0
4
4/5/04
Tem
pera
ture
(∞ C
)
-10
0
10
20
30
40
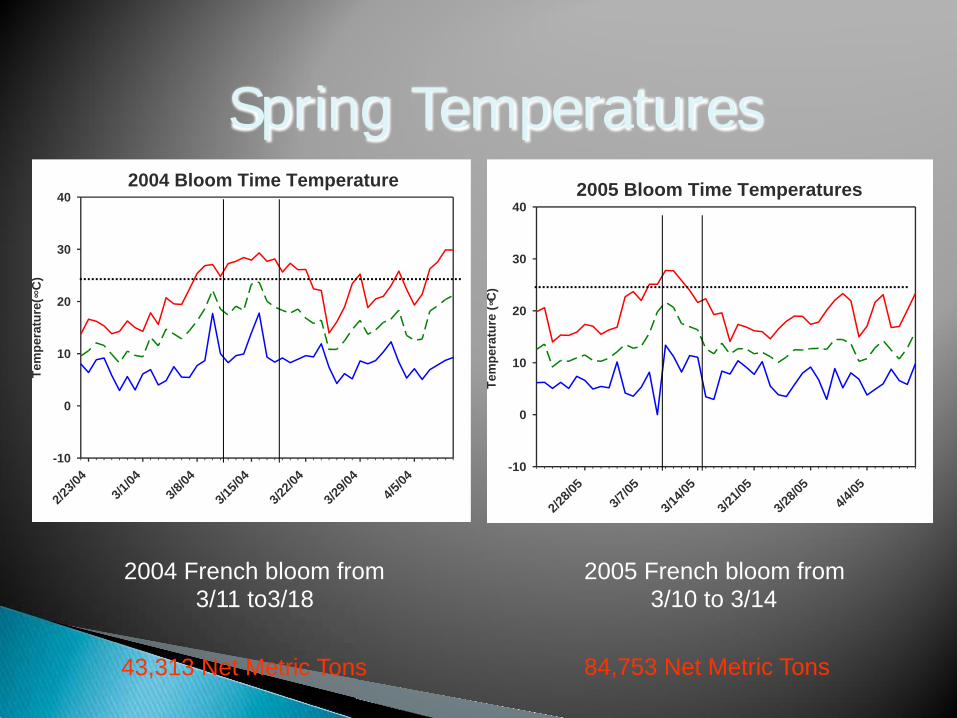
2005 French bloom from 3/10 to 3/14
2004 French bloom from 3/11 to3/18
84,753 Net Metric Tons 43,313 Net Metric Tons
2007 Bloom Time Temperatures
2/2/2626/07
3/3 5/07
3/3/12/07
3/3/19/07
3/2626/0/07
4/2/07
4/9/07
TeTm
pera
ture
(∞ C∞
)
-10
0
10
20
30
402006 Bloom Time Temperatures
2/27/0
6
3/6/06
3/13/0
6
3/20/0
6
3/27/0
6
4/3/06
4/10/0
6
Tem
pera
ture
(∞ C
)
-10
0
10
20
30
40
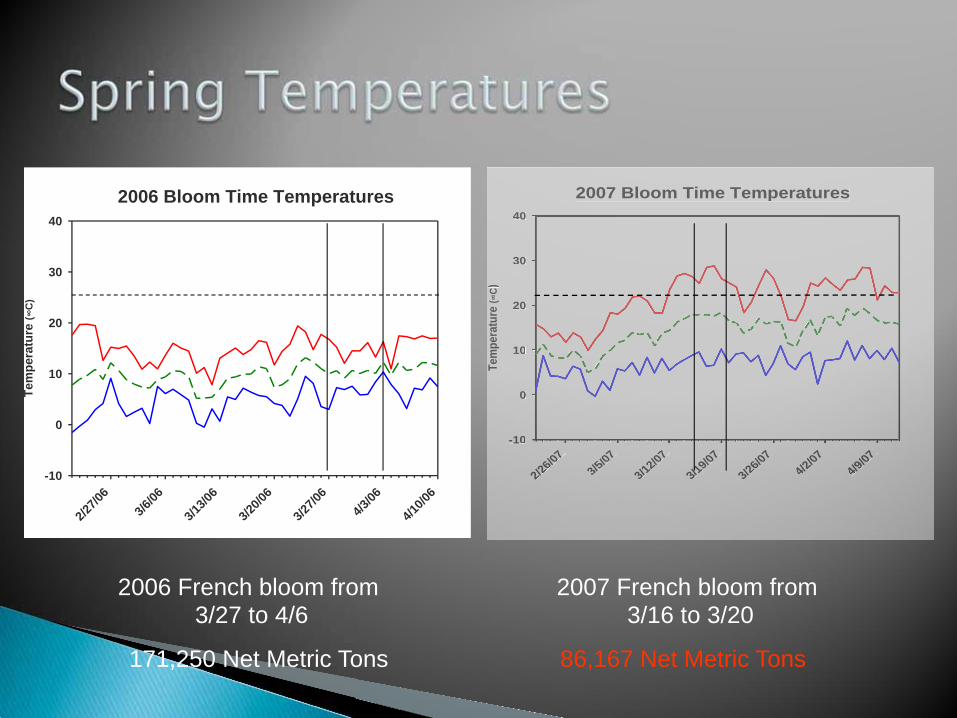
2007 French bloom from 3/16 to 3/20
2006 French bloom from 3/27 to 4/6
86,167 Net Metric Tons 171,250 Net Metric Tons
California prune production is dependent on one cultivar, ‘Improved French’ This cultivar does not set fruit when temperatures during bloom are > 25 oC Temperature spikes during bloom have caused reduced crops in prunes in 5 out of 12 years.
SSOLUTION: new cultivars that spread the bloom and the risk. UC has a prune breeding program to address this problem.
Temperatures have a large effect on rate of fruit development and temperatures are normally limiting during spring time.
Growing-degree-hour (heat) accumulation in the first 30 days after bloom strongly influences the rate of fruit development and harvest date for a given cultivar and year.
High early spring temperatures can also have a strong tendency to negatively effect fruit size.
To cope with this, growers must pay attention to early spring temperatures, thin earlier during warm springs and plan for earlier harvest.

Cling Peaches
y = -0.0066x + 215.55
y = -0.0080x + 190.87
y = -0.0063x + 180.23
y = -0.0035x + 179.41
y = -0.0068x + 173.52
y = -0.0066x + 168.16
y = -0.0086x + 207.37
y = -0.0066x + 207.36
y = -0.0076x + 218.74
y = -0.0106x + 218.81
110
120
130
140
150
160
170
180
190
200
3500 4000 4500 5000 5500 6000 6500 7000 7500 8000
Sum of GDH one month after bloom
Day
s o
f fru
it g
row
th
AndrossBowenCarolyneCarsonCoronaDavis
HalfordLoadelRossStarn
y = -0.001 x + 41. 55P < 0.001
R 2 = 0.4117
30
32
34
36
38
40
42
0 2 4 6 8 10
Kingsburg
Modesto
Yuba City
R D
F S
(
m m
)
G D H 3 0 ( x 10 3 )
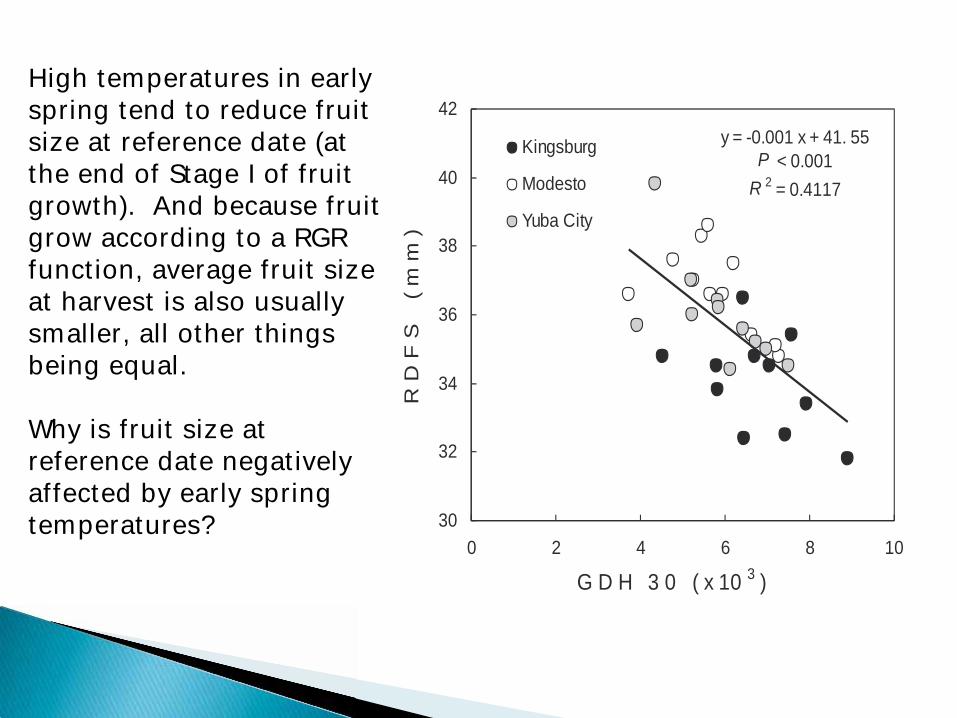
High temperatures in early spring tend to reduce fruit size at reference date (at the end of Stage I of fruit growth). And because fruit grow according to a RGR function, average fruit size at harvest is also usually smaller, all other things being equal. Why is fruit size at reference date negatively affected by early spring temperatures?
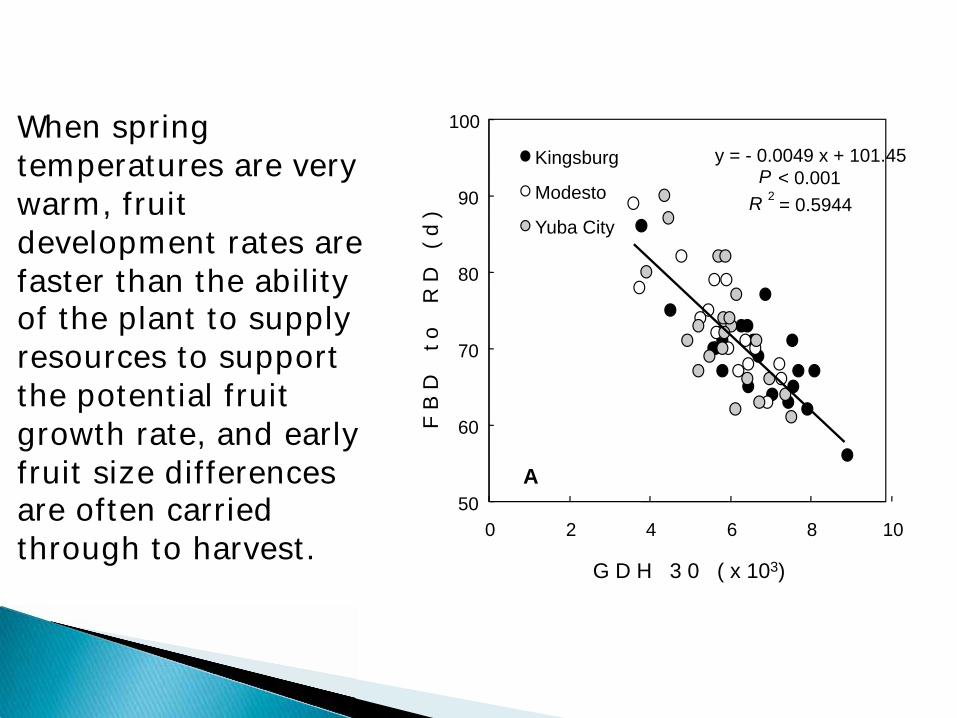
y = - 0.0049 x + 101.45
P < 0.001
R 2 = 0.5944
50
60
70
80
90
100
0 2 4 6 8 10
Kingsburg
Modesto
Yuba City
A
F B
D
t o
R
D
( d )
G D H 3 0 ( x 103)
When spring temperatures are very warm, fruit development rates are faster than the ability of the plant to supply resources to support the potential fruit growth rate, and early fruit size differences are often carried through to harvest.

In California our growers can go to the UC Davis Fruit and Nut Center web site to get data on aaccumulated winter chilling (both chill hours and chill portions) and post-bloom heat accumulation (growing-degree-hours or days) from weather stations near their farms. http://fruitsandnuts.ucdavis.edu/Weather_Services/chilling_accumulation_models/Chill_Calculators/index.cfm?type=harvest
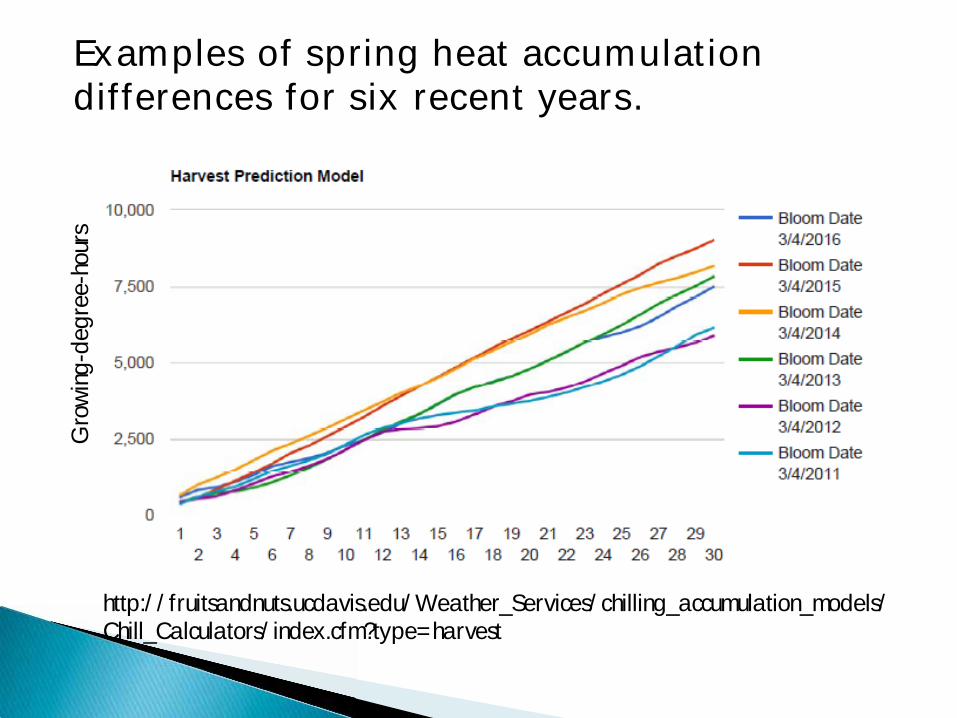
http://fruitsandnuts.ucdavis.edu/Weather_Services/chilling_accumulation_models/Chill_Calculators/index.cfm?type=harvest
Examples of spring heat accumulation differences for six recent years.
Gro
win
g-de
gree
-hou
rs
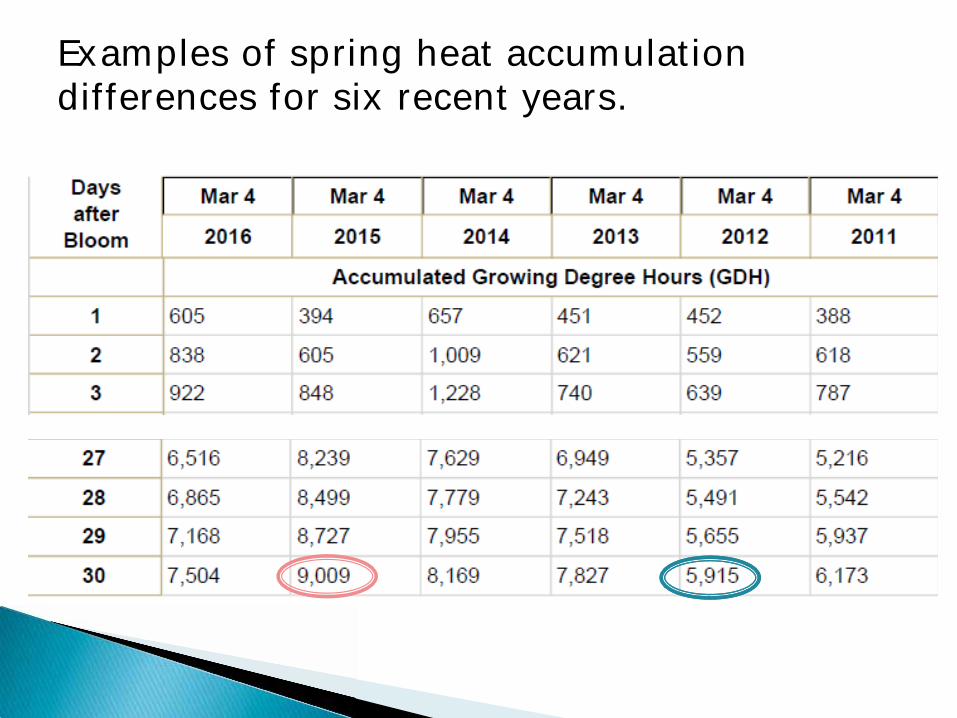
Examples of spring heat accumulation differences for six recent years.
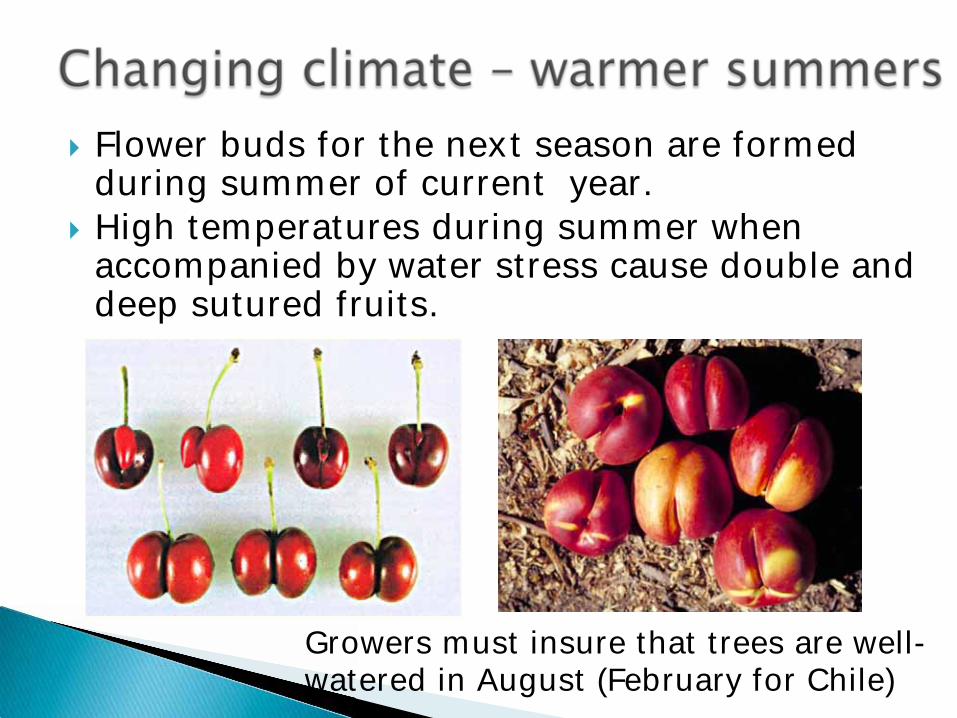
Flower buds for the next season are formed during summer of current year. High temperatures during summer when accompanied by water stress cause double and deep sutured fruits.
Growers must insure that trees are well-watered in August (February for Chile)
Many wells in California agricultural production areas have high nitrate concentrations in the water.
Current trend is to develop regulations for annual orchard N applications based on the amount of N removed in the crop plus a “fudge factor” for other N losses in the system.
This may work for nut crops that can account for large amounts N in the crop but will likely be a challenge for some fruit crops that require high tree vigor to achieve good fruit sizes but the crop does not account for much N removal in the crop.
High labor costs and labor shortages have driven many growers to switch from crops requiring a lot of hand labor (fresh fruits) to crops that can be managed mechanically (nuts).
Another solution is to develop orchards with shorter trees that don’t require as much hand labor and ladder work. (This has already been partially achieved with rootstocks in apples but not for most stone fruits.)
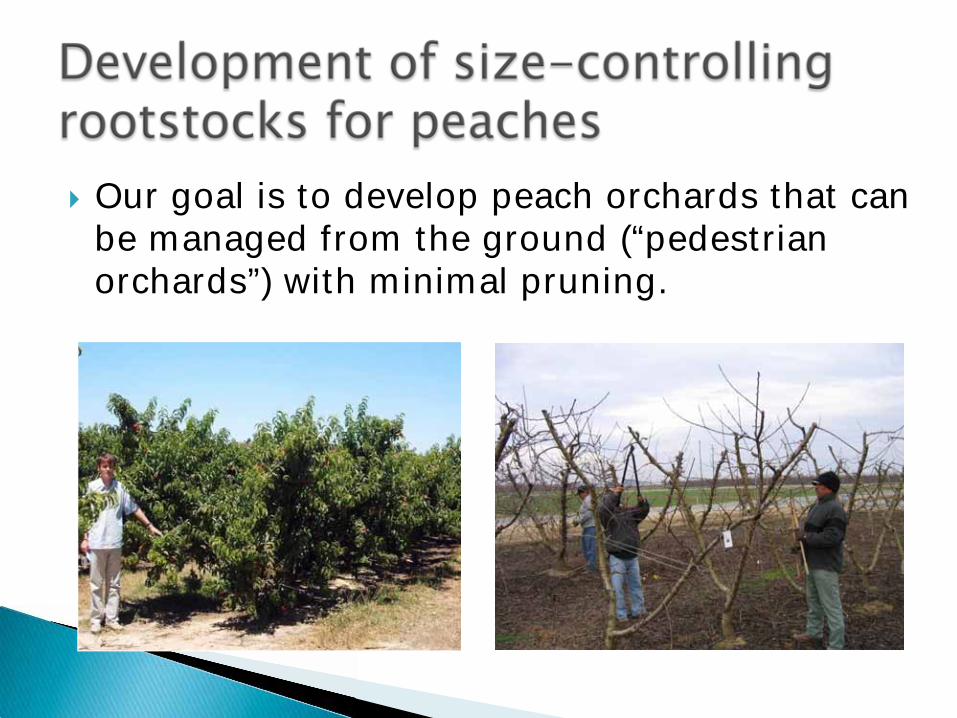
Our goal is to develop peach orchards that can be managed from the ground (“pedestrian orchards”) with minimal pruning.
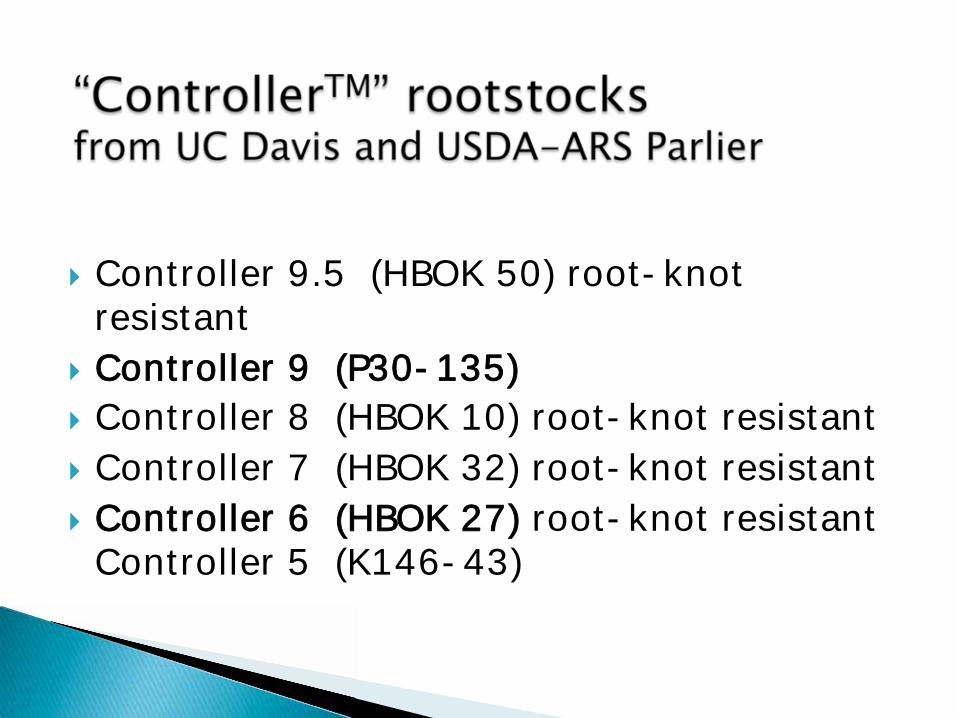
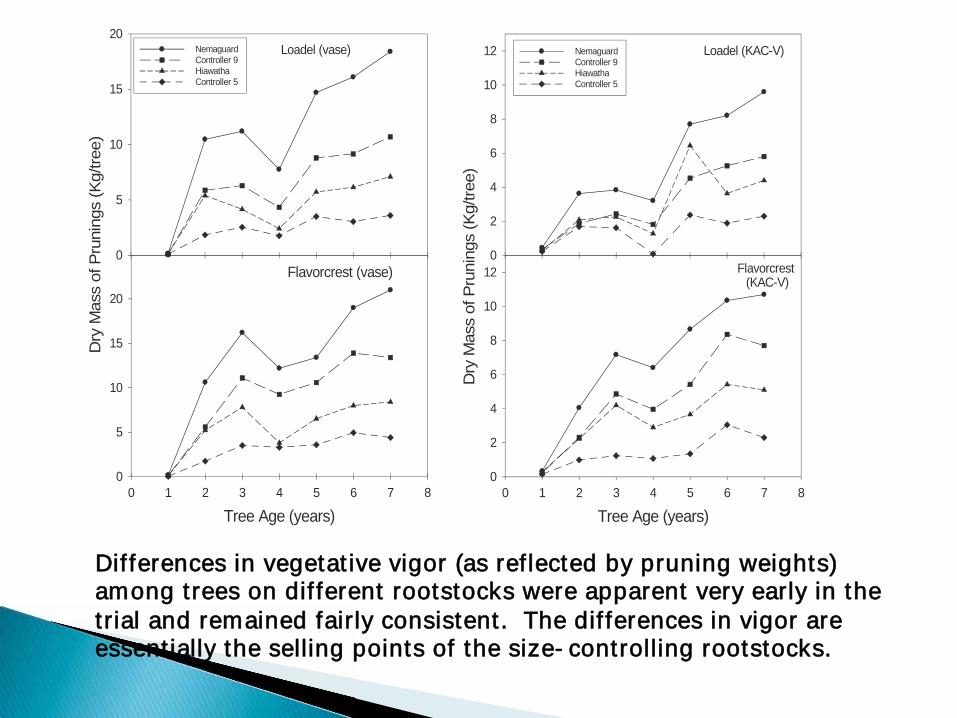
Controller 9.5 (HBOK 50) root-knot resistant CController 9 (P30-135) Controller 8 (HBOK 10) root-knot resistant Controller 7 (HBOK 32) root-knot resistant Controller 6 (HBOK 27) root-knot resistant Controller 5 (K146-43)
Tree Age (years)0 1 2 3 4 5 6 7 8
Dry
Mas
s of
Pru
ning
s (K
g/tre
e)
0
5
10
15
20
0
5
10
15
20Nemaguard Controller 9Hiawatha Controller 5
Flavorcrest (vase)
Loadel (vase)
Tree Age (years)0 1 2 3 4 5 6 7 8
0
2
4
6
8
10
12
Dry
Mas
s of
Pru
ning
s (K
g/tre
e)
0
2
4
6
8
10
12 Nemaguard Controller 9Hiawatha Controller 5
Loadel (KAC-V)
Flavorcrest (KAC-V)
DDifferences in vegetative vigor (as reflected by pruning weights) among trees on different rootstocks were apparent very early in the trial and remained fairly consistent. The differences in vigor are essentially the selling points of the size-controlling rootstocks.

Rootstock O Henry
peach as scion
TCA % of Control
Dormant pruning % of Control
Summer pruning % of Control
Nemaguard 100 100 100
Controller 9.5 93.1 78.7 124.6
Controller 8 69.6 65.2 76.9
Controller 7 61.1 49.2 46.2
Controller 6 59.2 44.4 34.5
Vigor control of four rootstocks that have recently been developed.
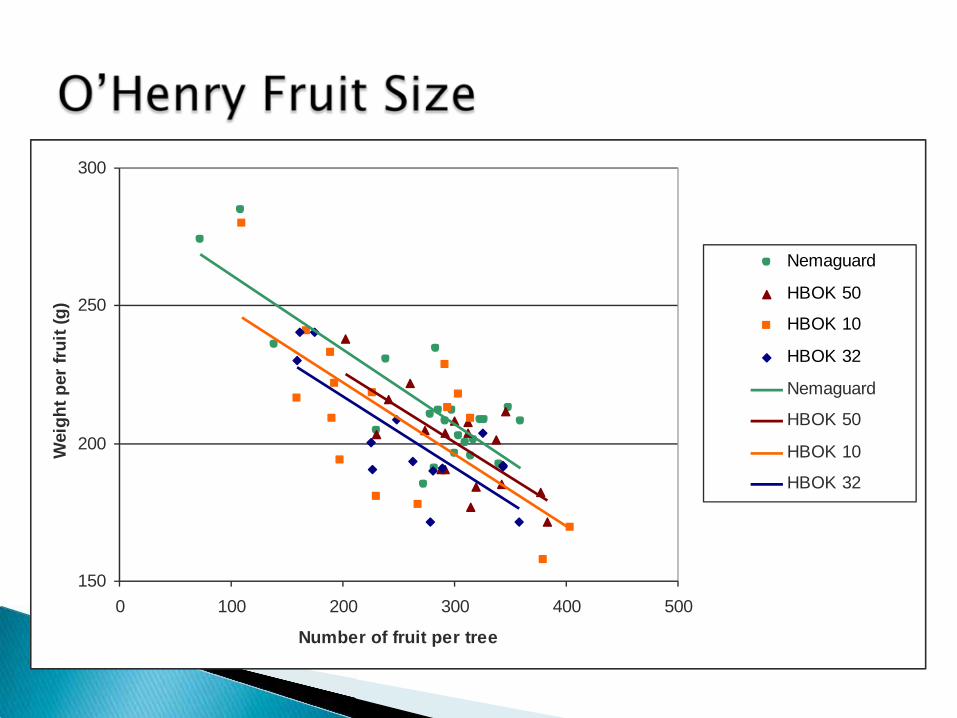
150
200
250
300
0 100 200 300 400 500
Number of fruit per tree
Wei
ght p
er fr
uit (
g)
Nemaguard
HBOK 50
HBOK 10
HBOK 32
Nemaguard
HBOK 50
HBOK 10
HBOK 32

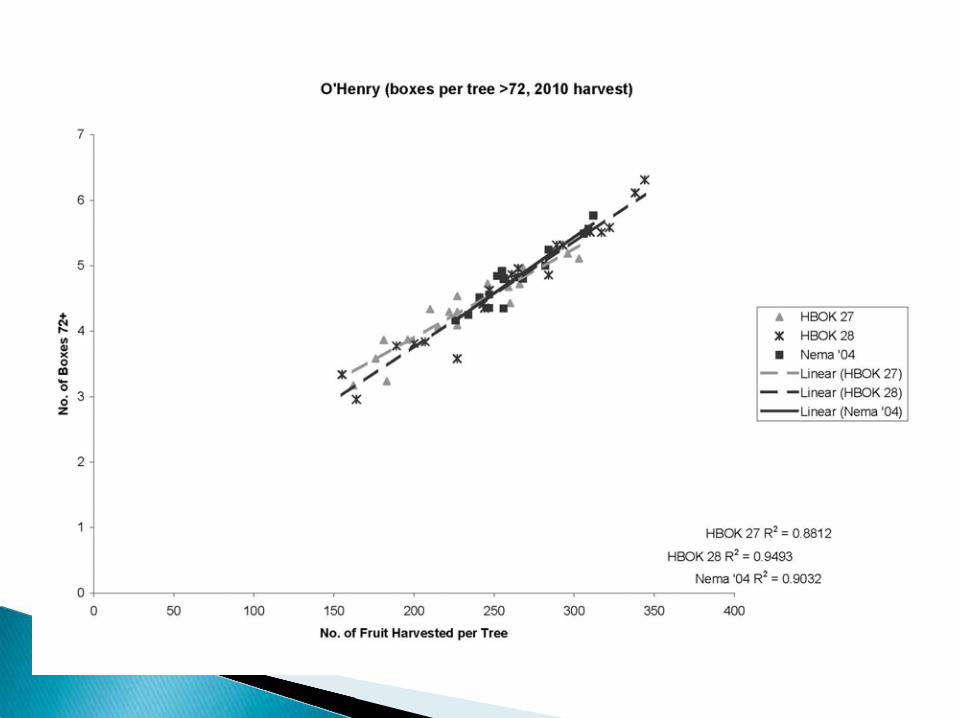
0
1
2
3
4
5
6
7
8
0 100 200 300 400 500
Number of fruit per tree
Sale
able
box
es p
er tr
ee
HBOK 50HBOK 32HBOK 10NemaguardLinear (HBOK 10)Linear (Nemaguard)Linear (HBOK 32)Linear (HBOK 50)
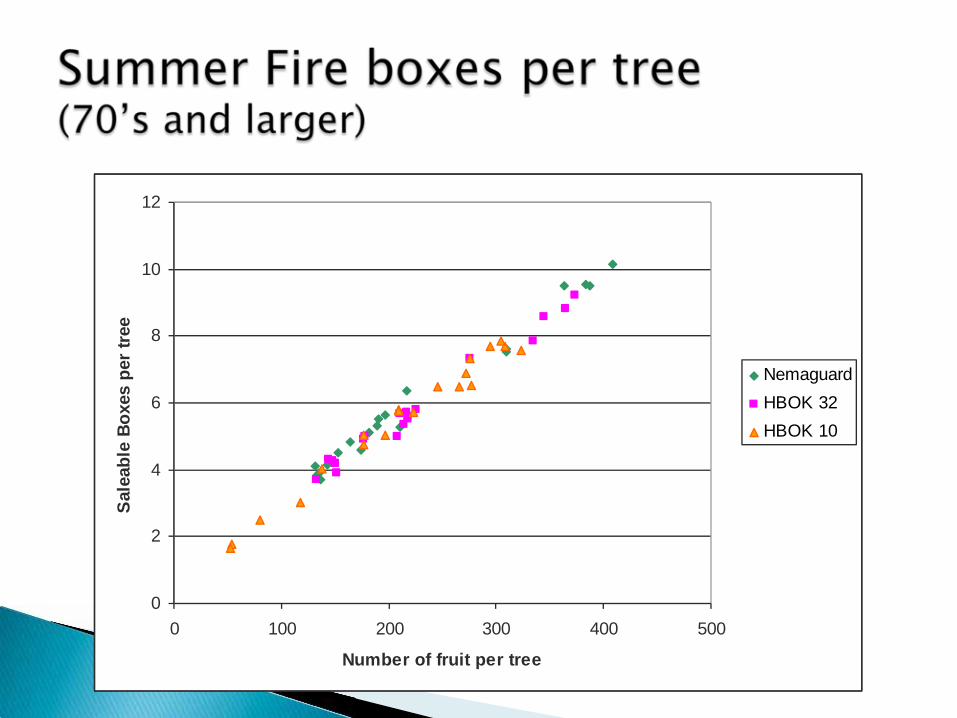
0
2
4
6
8
10
12
0 100 200 300 400 500
Number of fruit per tree
Sale
able
Box
es p
er tr
ee
NemaguardHBOK 32HBOK 10
HBOK 27 = Controller 6
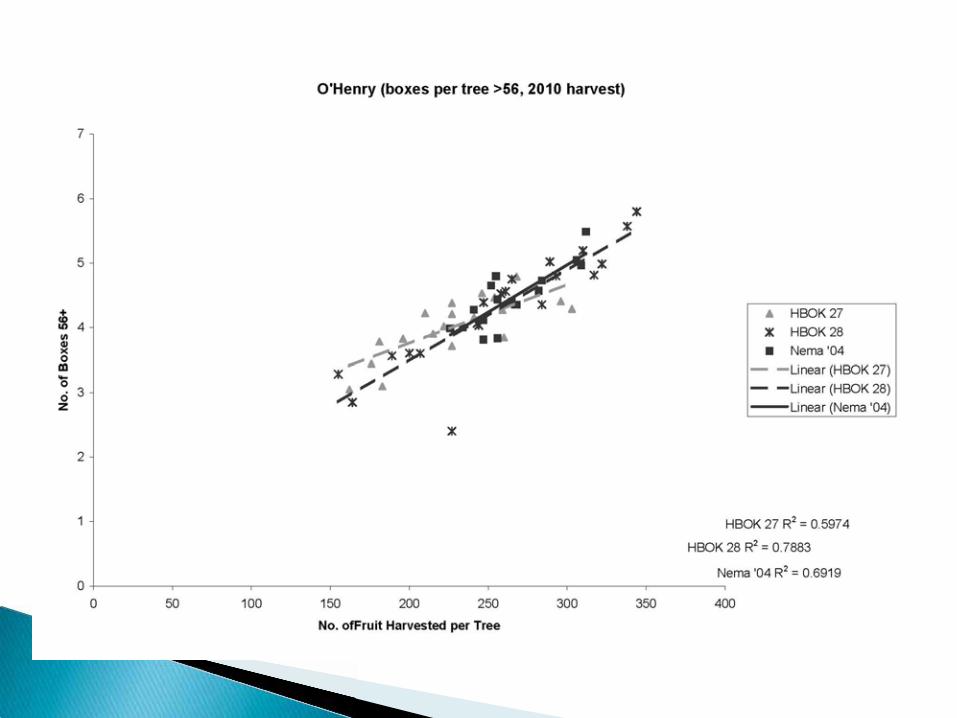
HBOK 27 = Controller 6
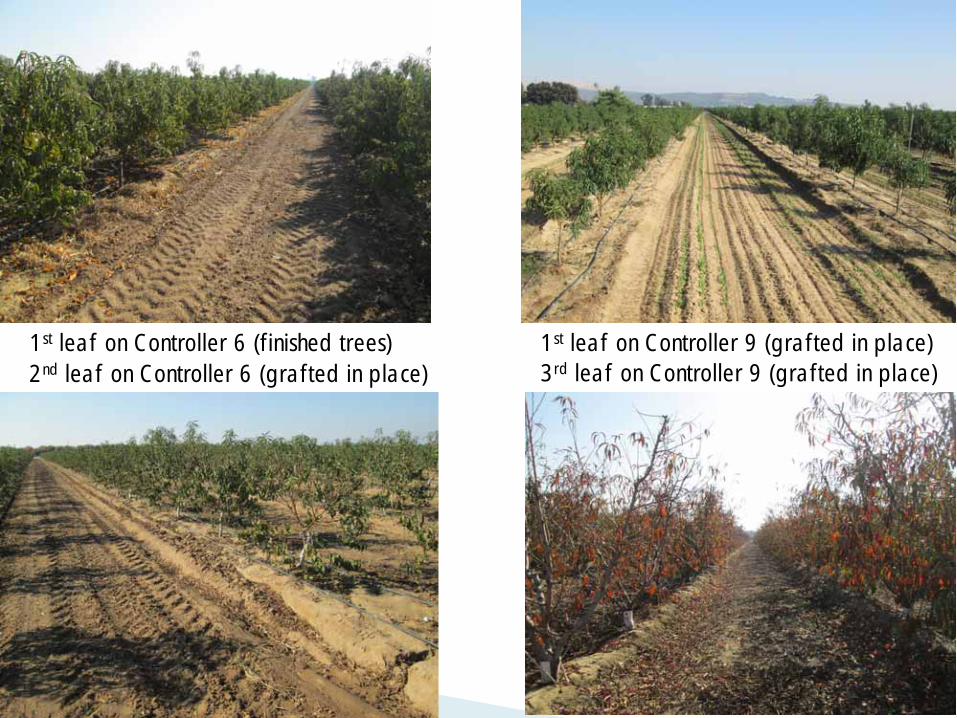
1st leaf on Controller 6 (finished trees) 1st leaf on Controller 9 (grafted in place) 2nd leaf on Controller 6 (grafted in place) 3rd leaf on Controller 9 (grafted in place)
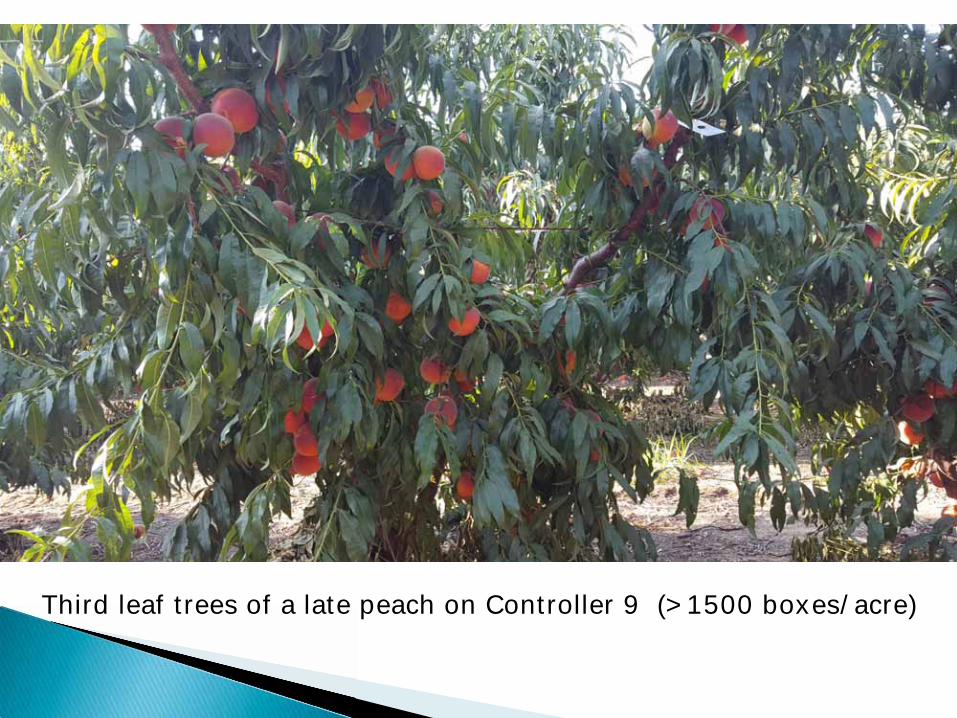
Third leaf trees of a late peach on Controller 9 (>1500 boxes/acre)
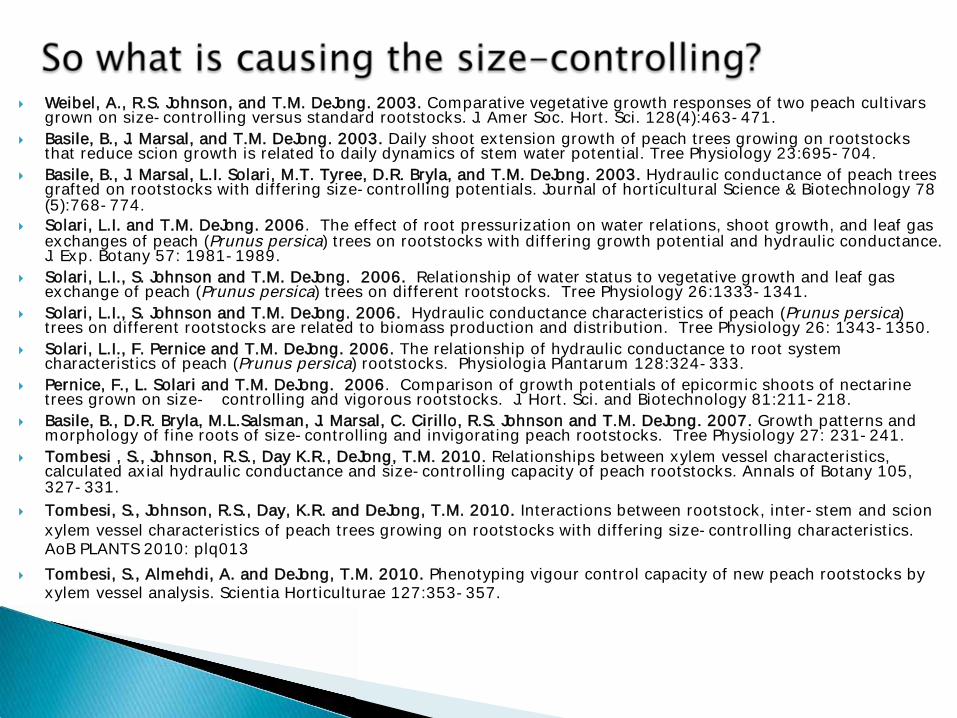
WWeibel, A., R.S. Johnson, and T.M. DeJong. 2003. Comparative vegetative growth responses of two peach cultivars grown on size-controlling versus standard rootstocks. J. Amer Soc. Hort. Sci. 128(4):463-471.
Basile, B., J. Marsal, and T.M. DeJong. 2003. Daily shoot extension growth of peach trees growing on rootstocks that reduce scion growth is related to daily dynamics of stem water potential. Tree Physiology 23:695-704.
Basile, B., J. Marsal, L.I. Solari, M.T. Tyree, D.R. Bryla, and T.M. DeJong. 2003. Hydraulic conductance of peach trees grafted on rootstocks with differing size-controlling potentials. Journal of horticultural Science & Biotechnology 78(5):768-774.
Solari, L.I. and T.M. DeJong. 2006. The effect of root pressurization on water relations, shoot growth, and leaf gas exchanges of peach (Prunus persica) trees on rootstocks with differing growth potential and hydraulic conductance. J. Exp. Botany 57: 1981-1989.
Solari, L.I., S. Johnson and T.M. DeJong. 2006. Relationship of water status to vegetative growth and leaf gas exchange of peach (Prunus persica) trees on different rootstocks. Tree Physiology 26:1333-1341.
Solari, L.I., S. Johnson and T.M. DeJong. 2006. Hydraulic conductance characteristics of peach (Prunus persica) trees on different rootstocks are related to biomass production and distribution. Tree Physiology 26: 1343-1350.
Solari, L.I., F. Pernice and T.M. DeJong. 2006. The relationship of hydraulic conductance to root system characteristics of peach (Prunus persica) rootstocks. Physiologia Plantarum 128:324-333.
Pernice, F., L. Solari and T.M. DeJong. 2006. Comparison of growth potentials of epicormic shoots of nectarine trees grown on size- controlling and vigorous rootstocks. J. Hort. Sci. and Biotechnology 81:211-218.
Basile, B., D.R. Bryla, M.L.Salsman, J. Marsal, C. Cirillo, R.S. Johnson and T.M. DeJong. 2007. Growth patterns and morphology of fine roots of size-controlling and invigorating peach rootstocks. Tree Physiology 27: 231-241.
Tombesi , S., Johnson, R.S., Day K.R., DeJong, T.M. 2010. Relationships between xylem vessel characteristics, calculated axial hydraulic conductance and size-controlling capacity of peach rootstocks. Annals of Botany 105, 327-331.
Tombesi, S., Johnson, R.S., Day, K.R. and DeJong, T.M. 2010. Interactions between rootstock, inter-stem and scion xylem vessel characteristics of peach trees growing on rootstocks with differing size-controlling characteristics. AoB PLANTS 2010: plq013
Tombesi, S., Almehdi, A. and DeJong, T.M. 2010. Phenotyping vigour control capacity of new peach rootstocks by xylem vessel analysis. Scientia Horticulturae 127:353-357.

Epicormic (water sprouts)
Proleptic (hangers)
Syleptic
Peach trees have three types of shoots.
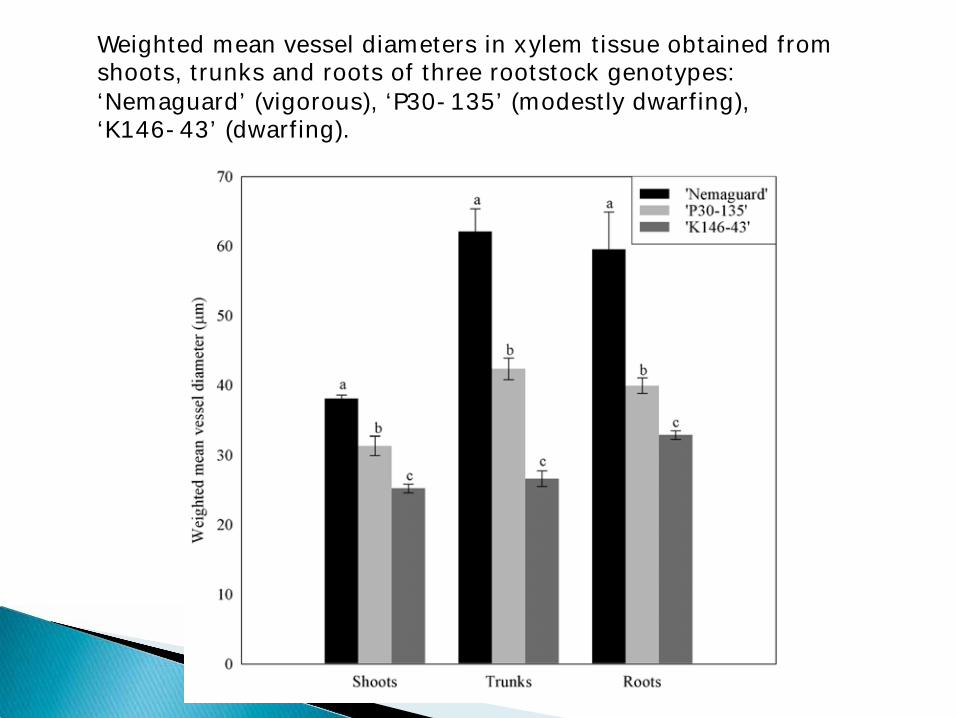
Weighted mean vessel diameters in xylem tissue obtained from shoots, trunks and roots of three rootstock genotypes: ‘Nemaguard’ (vigorous), ‘P30-135’ (modestly dwarfing), ‘K146-43’ (dwarfing).
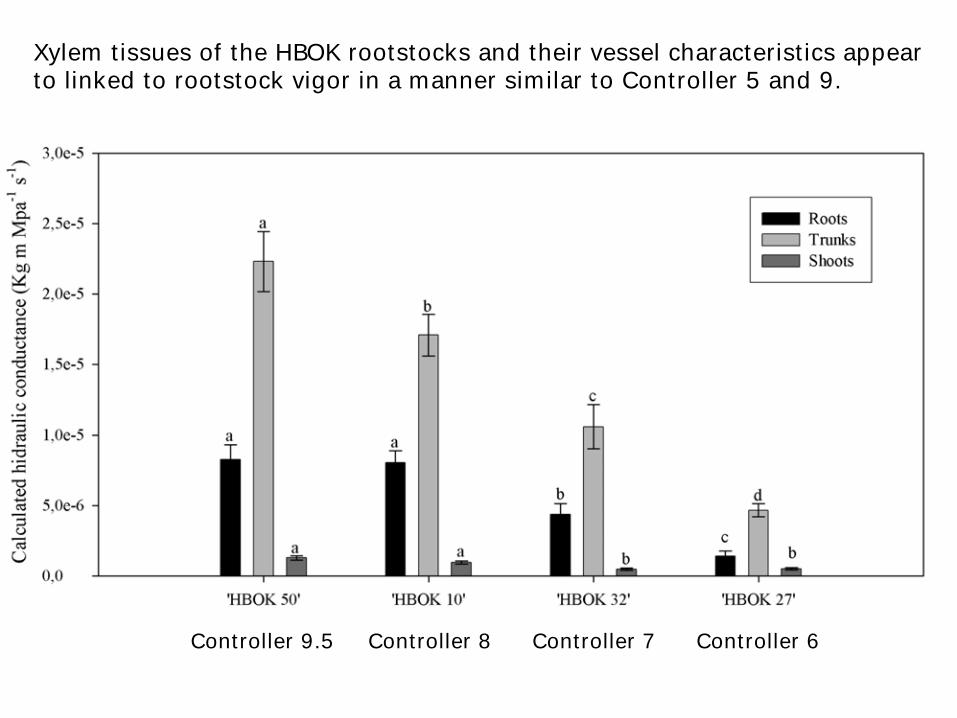
Xylem tissues of the HBOK rootstocks and their vessel characteristics appear to linked to rootstock vigor in a manner similar to Controller 5 and 9.
Controller 9.5 Controller 8 Controller 7 Controller 6
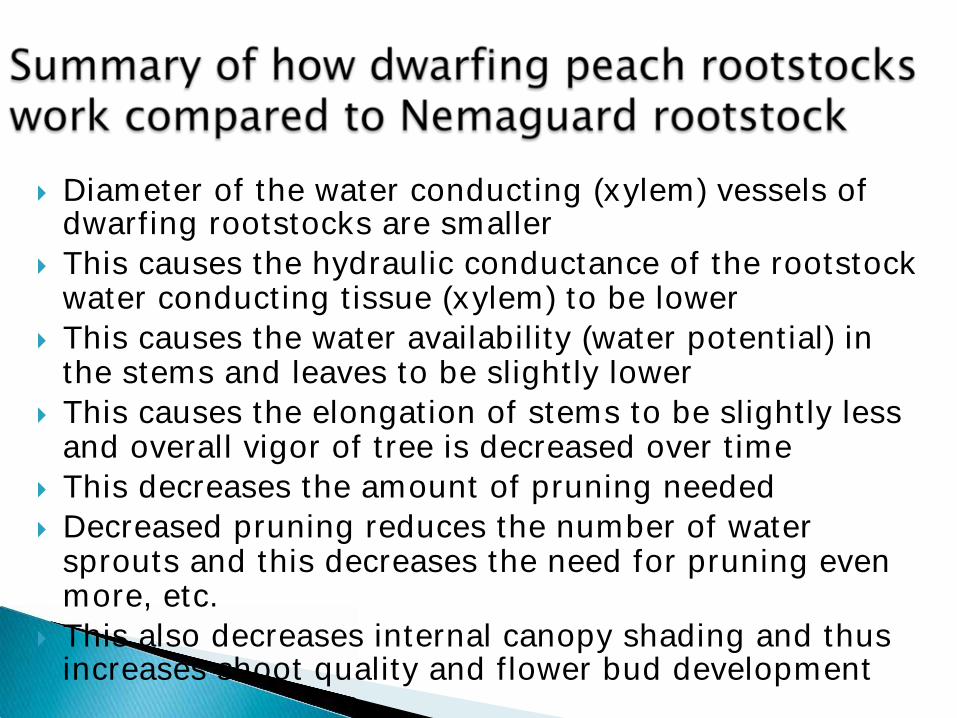
Diameter of the water conducting (xylem) vessels of dwarfing rootstocks are smaller
This causes the hydraulic conductance of the rootstock water conducting tissue (xylem) to be lower
This causes the water availability (water potential) in the stems and leaves to be slightly lower
This causes the elongation of stems to be slightly less and overall vigor of tree is decreased over time
This decreases the amount of pruning needed Decreased pruning reduces the number of water sprouts and this decreases the need for pruning even more, etc.
This also decreases internal canopy shading and thus increases shoot quality and flower bud development
Rootstock effects were simulated by simply reducing the hydraulic conductance of the rootstock by 50% (which was similar to the reduction caused by Controller 8 rootstock). This caused a 30% reduction in stem weight after the 4th simulated year and 29% reduction in dormant pruning weight after the 4th year in the field experiment.
Can we simulate it?
Controller 5 and 9 ◦ Dave Ramming, Scott Johnson, Kevin Day, Jim
Doyle Controller 6, 7, 8, 9.5 ◦ Ali Almehdi, Fred Bliss, Lyndsey Grace, Kevin Day Physiology ◦ Antonio Weibel, Boris Basile, Jordi Marsal, Luis
Solari, Sergio Tombesi, Fulvio Pernice Modeling ◦ David Da Silva, Romeo Favreau, Gerardo Lopez,
Inigo Auzmendi,
MMimoun, M. Ben and T.M. DeJong. 1999. Using the relation between growing degree hours and harvest date to estimate run-times for peach: A tree growth and yield simulation model. Acta Horticulturae 499:107-114. Marra, F.P., P. Inglese, T.M. DeJong and R.S. Johnson. 2002. Thermal time requirement and harvest time forecast for peach cultivars with different fruit development periods. Acta Horticulturae 592:523-529. Lopez, G. and T.M. DeJong. 2007. High spring temperatures decrease peach fruit size. California Agriculture 61: 31-34. Lopez, G. and T.M. DeJong. 2007. Spring temperatures have a major effect on early stages of peach fruit growth. J. Hort. Sci. and Biotechnology 82:507-512. Lopez, G. and T. DeJong. 2008. Using growing degree hours accumulated thirty days after bloom to help growers predict difficult fruit sizing years. Acta Hort. 803:175-180. Day K., G. Lopez and T. DeJong. 2008. Using growing degree hours accumulated thirty days after bloom to predict peach and nectarine harvest date. Acta Hort. 803:163-166. DeBuse C., G. Lopez and T. DeJong. 2010. Using spring weather data to predict harvest date for ‘Improved French’ prune. Acta Hort 974:107-112. Lopez, G., K.R. Day and T.M. DeJong. 2011. Why do early high spring temperatures reduce peach fruit size and yield at harvest? Acta Hort. 903:1055-1062. DeJong, T.M. 2012. Fruit growth and development as it relates to crop load, thinning and climate change. Acta Hort. 962: 233-238
Selected references: tree simulation modelling Grossman, Yaffa L. and Theodore M. DeJong. 1994. PEACH: A simulation model of reproductive and vegetative growth in peach trees. Tree Physiology 14: 329-345. Allen, M.T., P. Prusinkiewicz, and T.M. DeJong. 2005. Using L-systems for modeling source- sink interactions, architecture and physiology of growing trees: the L-PEACH model. New Phytologist 166:869-888. Lopez, G., R. R. Favreau, C. Smith, E. Costes, P. Prusinkiewicz and T. M. DeJong. 2008. Integrating simulation of architectural development and source–sink behaviour of peach trees by incorporating Markov chains and physiological organ function submodels into L-PEACH. Functional Plant Biology 35:761-771. Da Silva, D, R. Favreau, I. Auzmendi, T. DeJong. 2011. Linking water stress effects on carbon partitioning by introducing a xylem circuit into L-PEACH. Annals of Botany 108:1135-1145. Da Silva, D., L. Qin, C. DeBuse and T. M. DeJong, 2014. Measuring and modelling seasonal patterns of carbohydrate storage and mobilization in the trunks and root crowns of peach trees. Annals of Botany 114:643-652.

WWeibel, A., R.S. Johnson, and T.M. DeJong. 2003. Comparative vegetative growth responses of two peach cultivars grown on size-controlling versus standard rootstocks. J. Amer Soc. Hort. Sci. 128(4):463-471. Basile, B., J. Marsal, and T.M. DeJong. 2003. Daily shoot extension growth of peach trees growing on rootstocks that reduce scion growth is related to daily dynamics of stem water potential. Tree Physiology 23:695-704. Basile, B., J. Marsal, L.I. Solari, M.T. Tyree, D.R. Bryla, and T.M. DeJong. 2003. Hydraulic conductance of peach trees grafted on rootstocks with differing size-controlling potentials. Journal of horticultural Science & Biotechnology 78(5):768-774. Solari, L.I. and T.M. DeJong. 2006. The effect of root pressurization on water relations, shoot growth, and leaf gas exchanges of peach (Prunus persica) trees on rootstocks with differing growth potential and hydraulic conductance. J. Exp. Botany 57: 1981-1989. Solari, L.I., S. Johnson and T.M. DeJong. 2006. Relationship of water status to vegetative growth and leaf gas exchange of peach (Prunus persica) trees on different rootstocks. Tree Physiology 26:1333-1341. Solari, L.I., S. Johnson and T.M. DeJong. 2006. Hydraulic conductance characteristics of peach (Prunus persica) trees on different rootstocks are related to biomass production and distribution. Tree Physiology 26: 1343-1350. Solari, L.I., F. Pernice and T.M. DeJong. 2006. The relationship of hydraulic conductance to root system characteristics of peach (Prunus persica) rootstocks. Physiologia Plantarum 128:324-333. Pernice, F., L. Solari and T.M. DeJong. 2006. Comparison of growth potentials of epicormic shoots of nectarine trees grown on size- controlling and vigorous rootstocks. J. Hort. Sci. and Biotechnology 81:211-218. Basile, B., D.R. Bryla, M.L.Salsman, J. Marsal, C. Cirillo, R.S. Johnson and T.M. DeJong. 2007. Growth patterns and morphology of fine roots of size-controlling and invigorating peach rootstocks. Tree Physiology 27: 231-241. Tombesi , S., Johnson, R.S., Day K.R., DeJong, T.M. 2010. Relationships between xylem vessel characteristics, calculated axial hydraulic conductance and size-controlling capacity of peach rootstocks. Annals of Botany 105, 327-331. Tombesi, S., Johnson, R.S., Day, K.R. and DeJong, T.M. 2010. Interactions between rootstock, inter-stem and scion xylem vessel characteristics of peach trees growing on rootstocks with differing size-controlling characteristics. AoB PLANTS 2010: plq013 Tombesi, S., Almehdi, A. and DeJong, T.M. 2010. Phenotyping vigour control capacity of new peach rootstocks by xylem vessel analysis. Scientia Horticulturae 127:353-357. Tombesi, S., K. R. Day, R. S. Johnson, R. Phene and T. M. DeJong. 2014. Vigour reduction in girdled peach trees is related to lower midday stem water potentials. Functional Plant Biology, 2014, 41, 1336–1341
