tektronix rsa306 usb spectrum analyzer - farnell … · power the rsa306 by connecting the usb 3.0...
TRANSCRIPT
1
Tektronix RSA306 USB Spectrum Analyzer ‐ Simple Demos
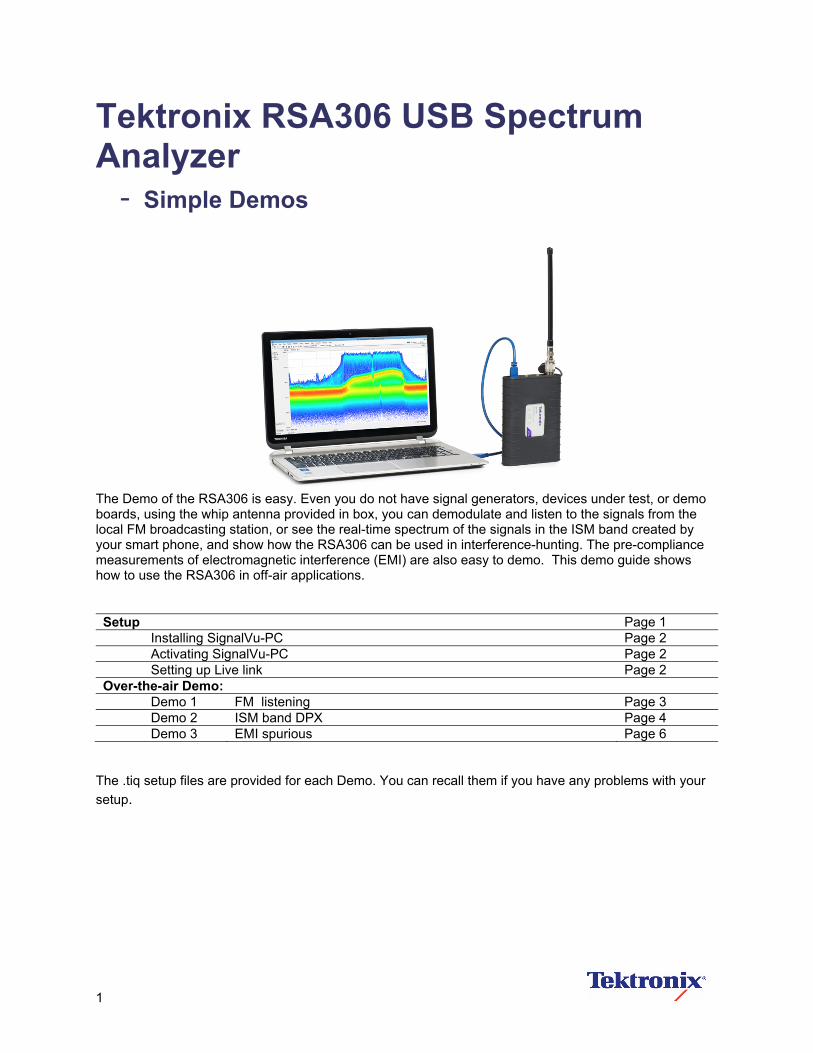
The Demo of the RSA306 is easy. Even you do not have signal generators, devices under test, or demo boards, using the whip antenna provided in box, you can demodulate and listen to the signals from the local FM broadcasting station, or see the real-time spectrum of the signals in the ISM band created by your smart phone, and show how the RSA306 can be used in interference-hunting. The pre-compliance measurements of electromagnetic interference (EMI) are also easy to demo. This demo guide shows how to use the RSA306 in off-air applications.
Setup Page 1 Installing SignalVu-PC Page 2 Activating SignalVu-PC Page 2 Setting up Live link Page 2
Over-the-air Demo: Demo 1 FM listening Page 3 Demo 2 ISM band DPX Page 4 Demo 3 EMI spurious Page 6
The .tiq setup files are provided for each Demo. You can recall them if you have any problems with your
setup.
RSA306 USB Real-Time Spectrum Analyzer Demo Guide
2
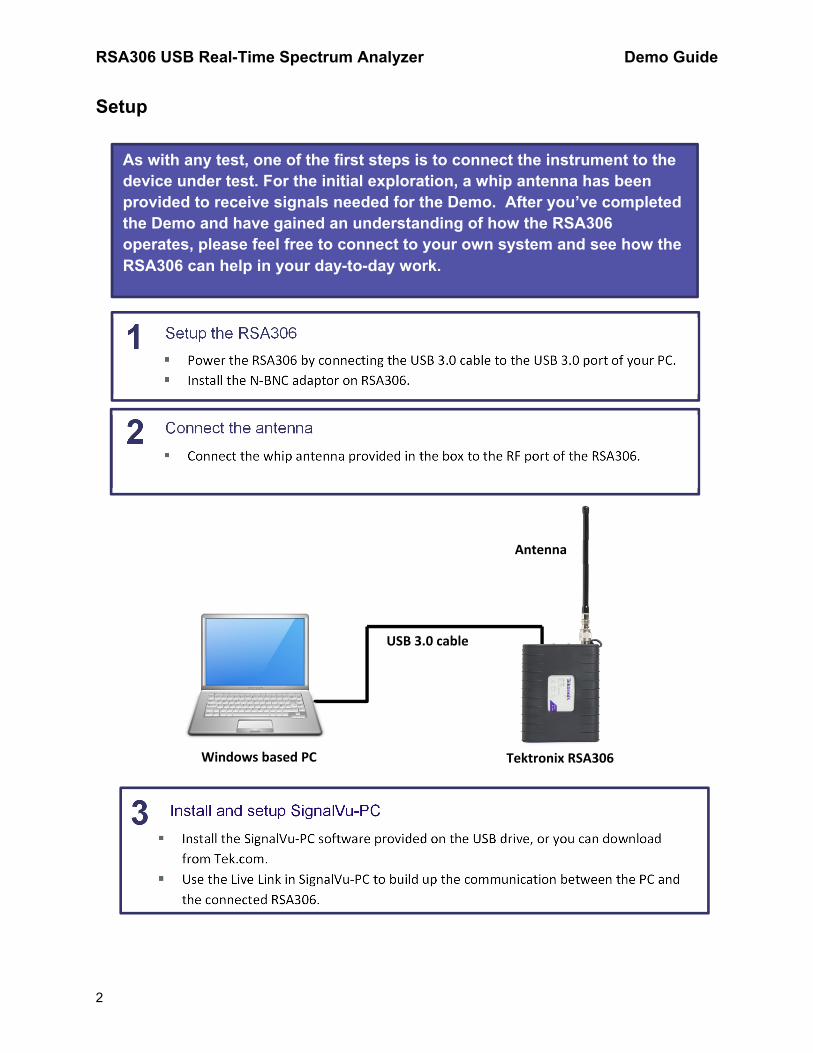
Setup
Power the RSA306 by connecting the USB 3.0 cable to the USB 3.0 port of your PC.
Install the N‐BNC adaptor on RSA306.
1 Setup the RSA306
3 Install the SignalVu‐PC software provided on the USB drive, or you can download
from Tek.com.
Use the Live Link in SignalVu‐PC to build up the communication between the PC and
the connected RSA306.
Install and setup SignalVu-PC
2 Connect the whip antenna provided in the box to the RF port of the RSA306.
Connect the antenna
USB 3.0 cable
Antenna
Windows based PC Tektronix RSA306
As with any test, one of the first steps is to connect the instrument to the device under test. For the initial exploration, a whip antenna has been provided to receive signals needed for the Demo. After you’ve completed the Demo and have gained an understanding of how the RSA306 operates, please feel free to connect to your own system and see how the RSA306 can help in your day-to-day work.

RSA306 USB Real-Time Spectrum Analyzer Demo Guide
3
Installing SignalVu-PC
SignalVu-PC can be downloaded from the Tektronix.com or included in the USB drive in the box.
1. Use Windows Explorer to navigate to the folder you extracted from the archive. 2. Double-click Setup.exe. Follow the on-screen instructions to install the software. 3. When installation is almost complete, a dialog box will appear to let you choose if you want to
install TekVISA. TekVISA is optimized for SignalVu-PC, especially for instrument searching, and is the recommended VISA application. You may also use another VISA application, such as NIVISA. To bypass TekVISA installation, uncheck the box.
TekVISA is NOT necessary to run SignalVu-PC with RSA306.
Activating SignalVu-PC
The SignalVu-PC SVE is free to use, so no activation is needed. To activate the other options in SignalVu-PC,
1. Launch SignalVu-PC. A window will be displayed stating that no license was found. 2. In the dialog, select I have a key – activate now. 3. In the Enter Activation Key text box, enter the activation key for SignalVu-PC. 4. Click OK in the License Activation window. SignalVu-PC will contact the license server and install
a license file provided by the license server.
Setting up Live link
1. Double click the SignalVu-PC icon on the Desktop of PC to start the application.
2. Click Live Link on the menu bar to view the drop down menu. Click Search for Instrument. A notification will briefly appear stating that the instrument was found.
3. Click Connect To Instrument. Select RSA306@USB USB::0. Note: initial connection of the instrument can take up to 20 seconds on a new installation.
4. A Connect Status dialog box will appear to confirm the instrument is connected. Click OK.
Quick Tips: Live Link
You can quickly verify connection status by looking at the connection indicator square on the menu bar. It is green ( ) when an instrument is connected. It is red ( ) when it is not. You can also view the name of the instrument that is connected by hovering the mouse indicator over the .

RSA306 USB Real-Time Spectrum Analyzer Demo Guide
4
Demo 1: FM listening
The RSA306 Series USB Spectrum Analyzers can demodulate audio signals, which can help you to identify unknown radio signals. You access the Audio Demod tab from the Settings control panel of the DPX Spectrum plot display. This Demo shows how to use RSA306 to demodulate the local FM radio signals and listen to your programming.
1. In the Presets button. 2. In the DPX display, set the CF to 97.75 MHz and
the Span to 20.5 MHz. 3. Set the RefLev to -30 dBm. 4. Right click the screen, and click Marker to peak. 5. Click To Center in the bottom marker setting area.
This sets the center frequency of the analyzer to the center of the signal.
6. Click the Audio settings. 7. Select FM – 200 kHz as the demodulation. 8. Click Run to start listen to the FM radio. 9. Adjust the Audio Gain setting so you can hear the
demodulated signal. Note that the sound level is also affected by the Windows volume control.
10. Click the Browse… button to select the location you want to save the steam file.
11. Enable the Activate button to start save the steaming audio, and disable the activate button when you want to stop saving. The saved .wav file can be played by windows media player.
Please also try to drag the marker to other peaks, and listen to the programming at other channels.
RSA306 USB Real-Time Spectrum Analyzer Demo Guide
5
Demo 2: ISM band DPX
The real time engine of the RSA306 series is designed to address the measurement challenges associated with dynamic RF signals such as the bursted packet transmissions of WLAN and Bluetooth. Combo devices that use both Bluetooth and 802.11b/g/n WLAN networks have a unique set of RF interference problems because they share the same 2.4 GHz Industrial/Scientific/Medical (ISM) frequency band. In this example, we will explore this real-world problem using a whip antenna.
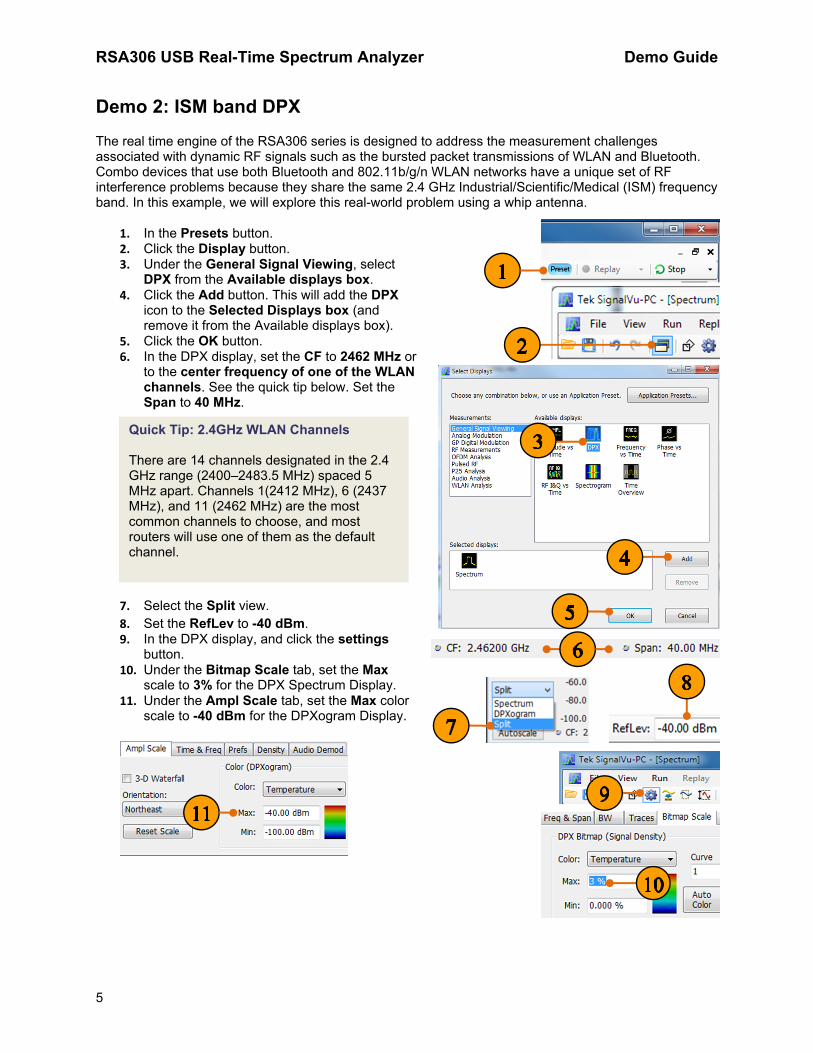
1. In the Presets button. 2. Click the Display button. 3. Under the General Signal Viewing, select
DPX from the Available displays box. 4. Click the Add button. This will add the DPX
icon to the Selected Displays box (and remove it from the Available displays box).
5. Click the OK button. 6. In the DPX display, set the CF to 2462 MHz or
to the center frequency of one of the WLAN channels. See the quick tip below. Set the Span to 40 MHz.
7. Select the Split view. 8. Set the RefLev to -40 dBm. 9. In the DPX display, and click the settings
button. 10. Under the Bitmap Scale tab, set the Max
scale to 3% for the DPX Spectrum Display. 11. Under the Ampl Scale tab, set the Max color
scale to -40 dBm for the DPXogram Display.
Quick Tip: 2.4GHz WLAN Channels There are 14 channels designated in the 2.4 GHz range (2400–2483.5 MHz) spaced 5 MHz apart. Channels 1(2412 MHz), 6 (2437 MHz), and 11 (2462 MHz) are the most common channels to choose, and most routers will use one of them as the default channel.
RSA306 USB Real-Time Spectrum Analyzer Demo Guide
6
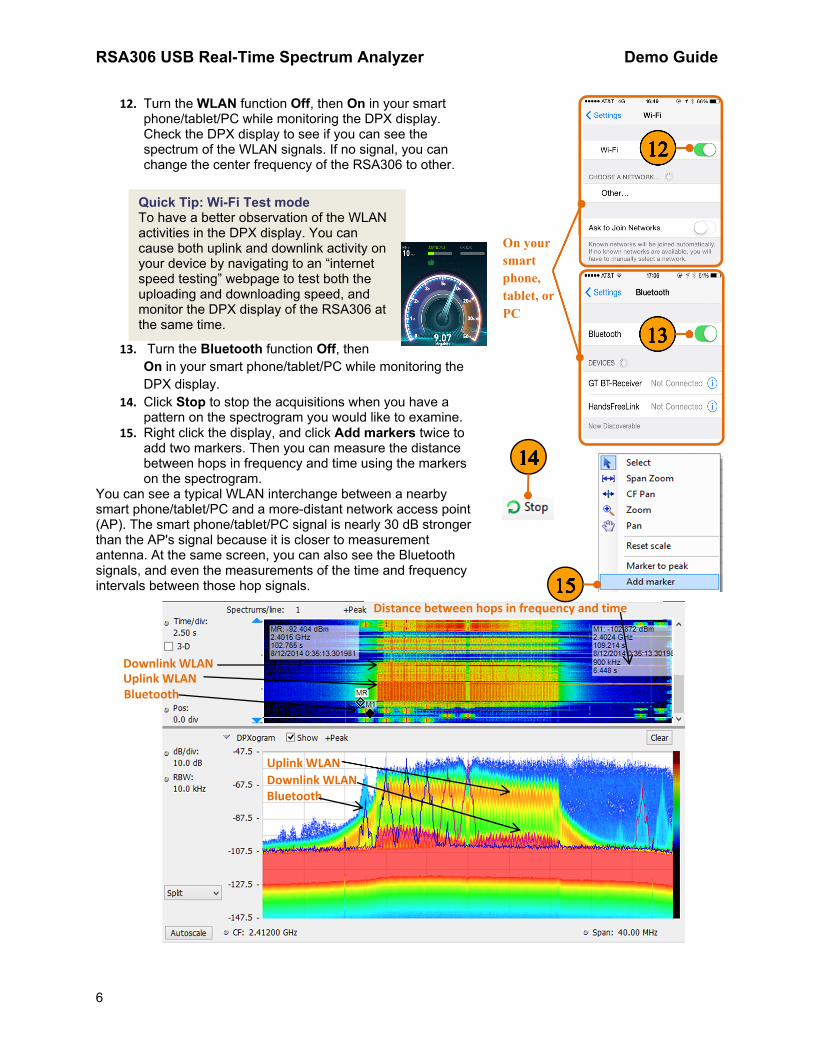
12. Turn the WLAN function Off, then On in your smart phone/tablet/PC while monitoring the DPX display. Check the DPX display to see if you can see the spectrum of the WLAN signals. If no signal, you can change the center frequency of the RSA306 to other.
13. Turn the Bluetooth function Off, then On in your smart phone/tablet/PC while monitoring the DPX display.
14. Click Stop to stop the acquisitions when you have a pattern on the spectrogram you would like to examine.
15. Right click the display, and click Add markers twice to add two markers. Then you can measure the distance between hops in frequency and time using the markers on the spectrogram.
You can see a typical WLAN interchange between a nearby smart phone/tablet/PC and a more-distant network access point (AP). The smart phone/tablet/PC signal is nearly 30 dB stronger than the AP's signal because it is closer to measurement antenna. At the same screen, you can also see the Bluetooth signals, and even the measurements of the time and frequency intervals between those hop signals.
Downlink WLAN
Uplink WLAN
Bluetooth
Downlink WLAN Uplink WLAN Bluetooth
Distance between hops in frequency and time
Quick Tip: Wi-Fi Test mode To have a better observation of the WLAN activities in the DPX display. You can cause both uplink and downlink activity on your device by navigating to an “internet speed testing” webpage to test both the uploading and downloading speed, and monitor the DPX display of the RSA306 at the same time.
On your smart phone, tablet, or PC
RSA306 USB Real-Time Spectrum Analyzer Demo Guide
7
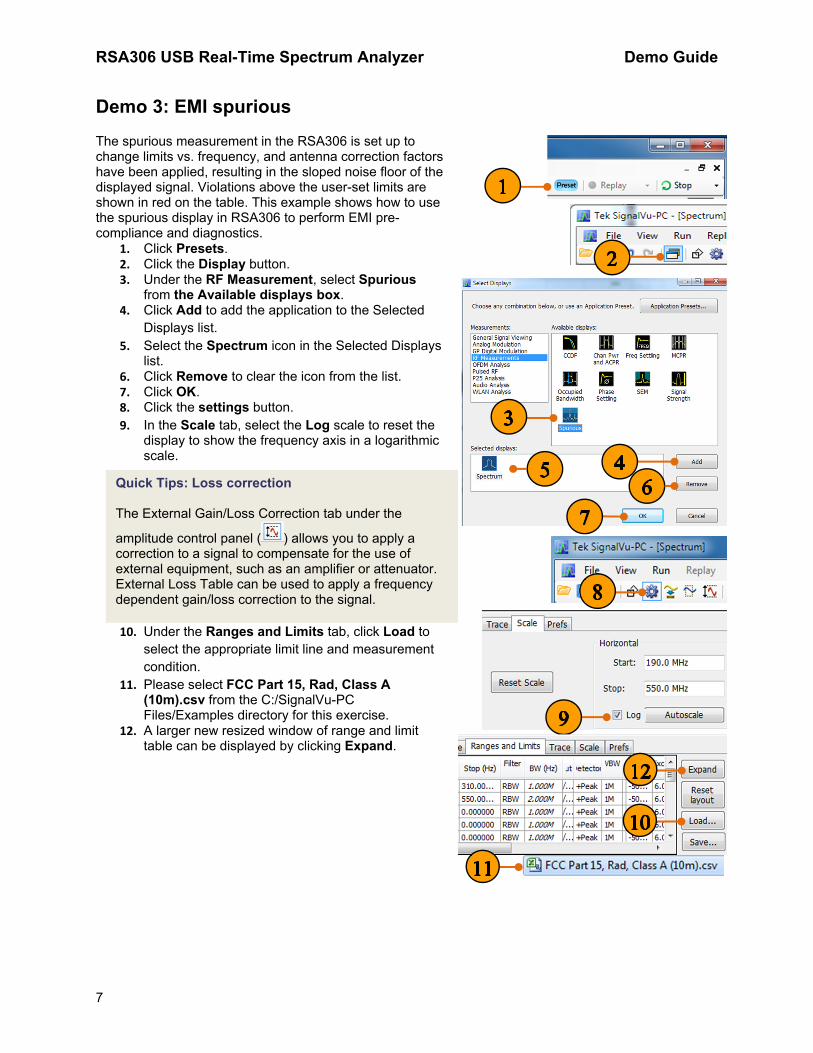
Demo 3: EMI spurious
The spurious measurement in the RSA306 is set up to change limits vs. frequency, and antenna correction factors have been applied, resulting in the sloped noise floor of the displayed signal. Violations above the user-set limits are shown in red on the table. This example shows how to use the spurious display in RSA306 to perform EMI pre-compliance and diagnostics.
1. Click Presets. 2. Click the Display button. 3. Under the RF Measurement, select Spurious
from the Available displays box. 4. Click Add to add the application to the Selected
Displays list. 5. Select the Spectrum icon in the Selected Displays
list. 6. Click Remove to clear the icon from the list. 7. Click OK. 8. Click the settings button. 9. In the Scale tab, select the Log scale to reset the
display to show the frequency axis in a logarithmic scale.
10. Under the Ranges and Limits tab, click Load to select the appropriate limit line and measurement condition.
11. Please select FCC Part 15, Rad, Class A (10m).csv from the C:/SignalVu-PC Files/Examples directory for this exercise.
12. A larger new resized window of range and limit table can be displayed by clicking Expand.
Quick Tips: Loss correction The External Gain/Loss Correction tab under the
amplitude control panel ( ) allows you to apply a correction to a signal to compensate for the use of external equipment, such as an amplifier or attenuator. External Loss Table can be used to apply a frequency dependent gain/loss correction to the signal.
RSA306 USB Real-Time Spectrum Analyzer Demo Guide
10/2014 © Tektronix 37W-30933--0
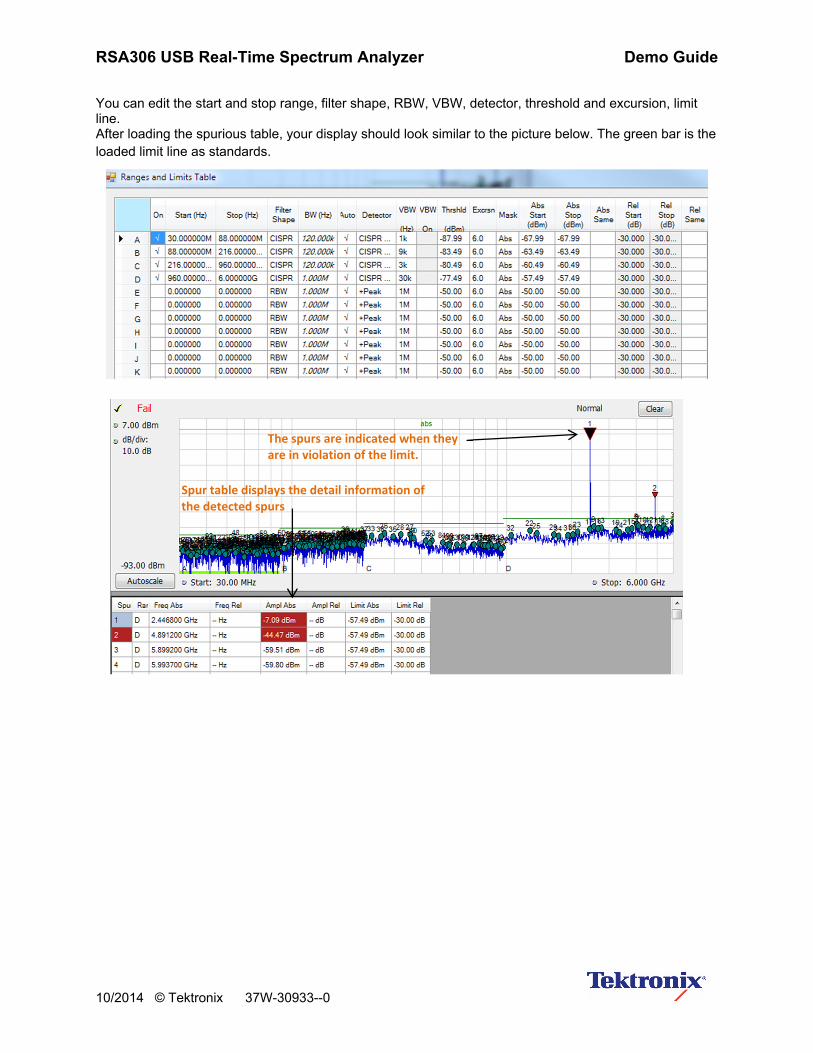
You can edit the start and stop range, filter shape, RBW, VBW, detector, threshold and excursion, limit line. After loading the spurious table, your display should look similar to the picture below. The green bar is the loaded limit line as standards.
The spurs are indicated when they are in violation of the limit.
Spur table displays the detail information of the detected spurs