telecom corporation of new zealand limited open - iis...
TRANSCRIPT

Open
Annual Report 2006
Telecom C
orporation of New
Zealand Lim
ited Annual Report for the year ended 30 June 2006
Financial Calendar 2006-20075 October 2006
Annual Meeting Wellington
3 November 2006
First quarter result announced
December 2006
First quarter dividend paid
February 2007
Half year result announced
March 2007
Second quarter dividend paid
May 2007
Third quarter result announced
June 2007
Third quarter dividend paid
30 June 2007
Financial year end
August 2007
Annual result announced
Contents
Wayne BoydChairman
INTRODUCTION
02 Meeting customers on their turf
04 The competitive environment
06 Enabling the promise of new technology
08 Building the Australian business
10 Leadership Statement
13 Key Performance
14 Five Year Review
15 Sharemarket Review
16 Executive Team
18 Strategy Overview
PERFORMANCE
22 Divisional Overviews
22 > Wired
23 > Wireless
24 > IT Services
25 > Australia
26 Our People
28 Telecom in the Community
29 Valuing the Environment
48 Management Commentary
58 Financial Statements
62 Notes to the Financial Statements
108 Auditors’ Report
FINANCIALS
109 Disclosures
113 Shareholder Inquiries
DISCLOSURESGOVERNANCE
30 Board of Directors
32 Governance at Telecom
Theresa GattungChief Executive
This report is dated 28 August 2006 and is signed on behalf of the Board of Telecom Corporation of New Zealand Limited by:
113
Shareholders with inquiries about transactions, changes of address or dividend payments should contact Telecom’s share registries.
New Zealand RegistryComputershare Investor Services LimitedPrivate Bag 92119, Auckland 1142Ph: 0-9-488 8777Fax: 0-9-488 8787NZ Toll Free: 0800 737 100Email: [email protected]: www.computershare.com
United States RegistryDetails for Depositary Receipts, Transfer Agent, and RegistrarThe Bank of New York101 Barclay StreetNew York, NY 10286United StatesPh (US): 1-888-BNY-ADRsPh (non-US): 1-610 382 7833Website: www.adrbny.comPlease note that no email address or fax number is provided. Inquiries can be submitted directly via the website.
Australian RegistryComputershare Investor Services Pty LimitedGPO Box 7045, SydneyNSW 2001, AustraliaPh: 0-2-8234 5000Freephone: 1 800 501 366Fax: 0-2-8234 5050Email: [email protected]: www.computershare.com
Shareholder inquiries about Telecom’s operating and financial performance should be emailed to [email protected] or addressed to:General ManagerInvestor RelationsTelecom New ZealandPO Box 570Wellington 6011New Zealand
Contact Phone Numbers:Australia 1800 123 350Canada 1800 280 0398Hong Kong 800 962 867New Zealand 0800 737 500Singapore 800 641 1013United Kingdom 0800 960 283United States 1800 208 2130
Visit our website at www.telecom.co.nz
Shareholder Inquiries
The paper used in this report is sourced from a sustainable resource and is chlorine free.

The telecommunications environment in New Zealand is changing and Telecom, as the largest player in the market, is taking a leadership role. We are transforming the Company and tackling the challenges to create a sustainable entity that delivers value to all the Telecom family including investors, employees, customers and the public of New Zealand.
Telecom has wasted no time in adapting to the new rules. We have embarked on a signifi cant process of organisational and cultural change. We have begun an operational separation of our Wholesale and Retail business. We have initiated a series of industry working parties and begun a more open and transparent sharing of information with the rest of the industry. We are genuinely committed to creating a level playing fi eld for competitors.
Naturally, customers, shareholders and other stakeholders want to know what the future will look like. They want to know what will change. They want to know how Telecom will succeed in the new environment and deliver the best for its customers and its shareholders.
The answers to those questions stand in our actions, not our words.
In this Annual Report we are starting as we mean to continue by welcoming an open exchange around the issues that will affect Telecom and the whole sector. We will look at some of the common perceptions and questions being asked of Telecom – and the actions we are taking to address them.
Kevin Kenrick and Simon Moutter on meeting customers on their turf page 2
Mark Ratcliffe on enabling the promise of new technology page 6
David Watson on building the Australian business page 8
Matt Crockett on the competitive environment page 4
Theresa Gattung and Wayne Boyd Leadership Statement: growing shareholder value page 10

– COMMENTATOR –
‘PHONE COMPANIES
WILL BE HISTORY WITHIN
TEN YEARS.’
2 Open New Doors: Meeting customers on their turf

Telecom recognised several years ago that customers want much more from telcos than the traditional phone calling that used to be our core business. That trend is illustrated in one clear statistic. In 2000 traditional revenue – local access and calling – made up 61% of Telecom’s total revenue. By 2005, it was down to 44%.
In the past, telecommunications was essentially about customers using a fixed line to make a one-to-one contact with another person. Now it is about using an ever-growing array of services – world-wide data networking such as mobile calls, websites, blogs, text messages, software applications, videoconferencing, music downloads – to communicate, inform, entertain, share data or deliver IT solutions to one person or a million people.
To move successfully into that new world, telecommunications companies must be agile and forward-thinking. Both our business customers and our residential customers expect us to cut through complexity to deliver the services they want.
In both Australia and New Zealand, we have aligned our business along customer lines. And we have more closely integrated our businesses on each side of the Tasman. This allows us, for instance, to take the converged Gen-i approach (combining the delivery of IT solutions and communications services), that has been so successful in New Zealand, to customers in Australia.
With our Next Generation Telecom initiative, we are realigning the whole business along customer lines. The customers’ needs are in the driver’s seat; the technology platforms are in the back seat. That’s a reversal of the way telcos used to do business.
This approach will mean simpler, more comprehensive services for customers and more customer control. We’re simplifying the way customers choose and order services and giving them the tools to make immediate, online changes to their plans.
We have moved Gen-i to the core of our delivery of services to business customers, offering totally integrated telecommunications and IT solutions. Through Gen-i, Telecom is a leading player in New Zealand’s IT market.
With Ferrit, the online shopping service, Telecom has started its move
into a range of value-added online services. We’ll be forming partnerships
with leading New Zealand service providers to offer a complete range of
products and services for both businesses and customers at home.
In addition, the Yellow Pages Group (previously known as Directories) has been significantly enhancing its capability and delivery of online advertising solutions for its customer base, as well as enhancing the core offerings in print. This again reflects the dynamic changes that are occurring in the advertising world.
Voice calling will remain a core service for Telecom, but it will be one application among many. And like all our services in future, it will be delivered over an Internet Protocol network, offering new options and flexibility for customers.
We are on a strong investment push across the consumer and small business market – designing new products and services that high-value customers are increasingly demanding, extending the scope and speed of broadband – and the services it will offer – and giving customers many more self-service options.
Just as through Gen-i we are now able to offer fuller converged telecommunications and IT services to business customers, for residential customers we are entering a world where what was once a phone connection is becoming the hub of their information, entertainment and communication needs.
Enhanced video services, including video-on-demand and ‘catch-up’ TV will become real options for customers and we will be partnering with content providers to bring the best in the world to our customers’ screens.
Just as well we’re not just a phone company.
Kevin Kenrick Chief Operating Offi cer Consumer
& Simon Moutter Chief Operating Offi cer Business
Customers have more and more choice. A fast-growing multitude of products and services is coming on stream, and it is not just the traditional companies which provide communications services. Competition is mounting from sectors as diverse as the entertainment sector, e-tailers and IP-telephony providers. For a company such as Telecom that means one, over-riding imperative is at the heart of our future: complete, compelling services for customers.
3

‘CAN I GET A
BETTER DEAL?’
– CUSTOMER –
Open Field: The competitive environment4
We’ll make sure of it!
Competition is good for customers. It offers them more options and, generally, better prices. That’s as true for telecommunications as it is for other sectors.
The mobile market in New Zealand has for several years been a great example of how competition works for customers – two companies fighting hard to bring world-leading services to New Zealand.
Now changes to the regulatory landscape mean more competition is coming so Telecom is changing the way we do business. After looking at the experiences of countries like Britain and Australia, we decided to separate our Retail and Wholesale businesses. There are a number of different ways of achieving separation, but we believe the operational separation we have begun is the best and speediest way to make the new environment work for New Zealand customers.
The new separation is based on the model adopted by British Telecom (BT). It will level the playing field for wholesale customers purchasing access services. It will be backed by a series of public, legally-binding undertakings about service delivery and transparency and it will be monitored by an Independent Oversight Group.
We are working with our wholesale customers to make the new environment work. Our unbundled network services product (UNS – the managed IP data access product derived from the One Office product) is in the final stages of development. We will be proactively launching full speed upstream unbundled bitstream service (UBS) plans in October, as well as a number of backhaul product enhancements by year end.
In addition, industry working parties have been established so that we can work in close consultation with our customers to decide the best way to deliver the next generation of wholesale products including local loop unbundling (LLU) and ‘naked DSL’ (broadband service independent of a phone service). With these developments our wholesale customers will soon be able to market the portfolio of products that they have wanted.
Telecom Wholesale is a business, and like any other, we are focused on providing excellent customer service and a product range that will deliver new revenue opportunities for our wholesale customers.
The new Wholesale model not only makes good business sense in that it opens up more channels to market for Telecom’s Wholesale network services, but it will also open up the retail market to more competition and more choice for New Zealanders.
In this new environment all players will be doing everything possible to attract and keep customers. Newcomers will have a relatively quick and simple path to enter the market. We understand what international experience has shown again and again – that to keep and grow our place in the market there is only one guarantee to success; outstanding service to customers.
That has to be a good outlook for our industry and our customers.
Matt Crockett General Manager Wholesale
5

‘Who in their right
mind is going to make big investment calls now?’
– ANALYST –
6 Open Prospects: Enabling the promise of new technology
We will!
Like all telecommunications companies, Telecom must make investment decisions in an environment of rapid technology change and shifting regulation. For the sake of its customers and its shareholders, Telecom has to navigate the environment to deliver world-class services and good returns for investors.
Open a newspaper any day and you will see reports of new communications technologies coming on stream – the latest, faster version of Mobile Broadband, new Internet Protocol applications, and customer-friendly videoconferencing tools.
Open a newspaper in almost any country and you will also see discussions about what is the right environment to encourage maximum investment and, with it, provide maximum choice for customers.
Shareholders, the people and institutions who fund this investment, provided they can see a reasonable rate of return, look at these technology developments and regulatory debates and then wonder if it is all getting too hard.
Without doubt, telecommunications is at a difficult and challenging time in the throes of a major technology transition. And equally, the regulatory environment has just become more uncertain in New Zealand.
In that environment, Telecom is making its investment decisions with one over-riding focus – positive outcomes for customers. Right now, Telecom is embarking on two major investments. They are the upgrade of our Mobile network with EV-DO Revision A to provide
faster Mobile Broadband across New Zealand. The other is the rollout of ADSL2+ technology over our fixed network which will provide faster broadband. Both these decisions share a number of features: they are cost-effective upgrades of our existing technology path to provide enhanced services for customers. That in turn keeps Telecom well placed to compete in the market.
The focus on outcomes for customers, rather than technology, means Telecom has maximum flexibility in its investment decisions. It is irrelevant to customers how services are provided; it’s just important that they deliver on customers’ needs. To investors, it is vital that we are making the most cost-effective decisions while planning for the future. In a world where technologies are converging and the lines between telecommunications and service provision are increasingly meaningless, that will mean options such as infrastructure sharing, more partnerships and creative ways of doing business.
In a market that is increasingly global – consider how often you and your family are online with international players such as Google, Yahoo, YouTube, Microsoft or MySpace – Telecom will continue to form partnerships to bring the best in the world to our customers. We are one player in a very big, complex market.
Mark Ratcliffe Chief Operating Offi cer Technology & Enterprises
7
‘WHY IS TELECOM STILL IN AUSSIE?’
– INVESTOR –
Open Opportunities: Building the Australian business8
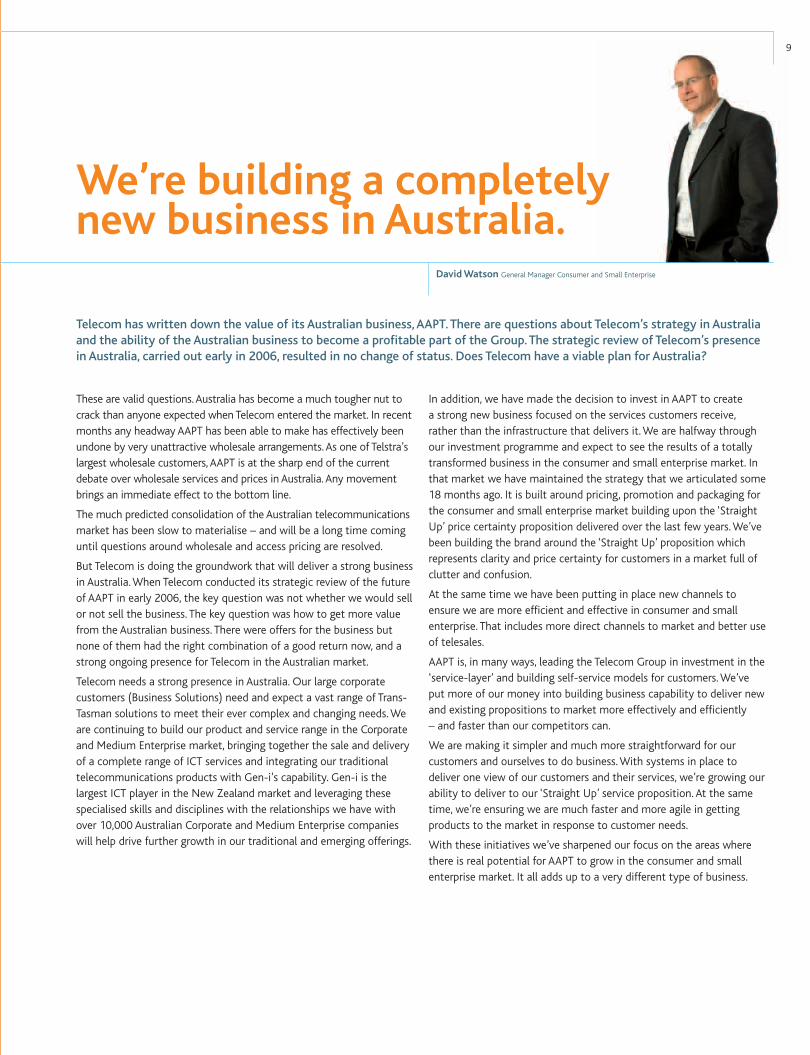
We’re building a completely new business in Australia.
Telecom has written down the value of its Australian business, AAPT. There are questions about Telecom’s strategy in Australia and the ability of the Australian business to become a profi table part of the Group. The strategic review of Telecom’s presence in Australia, carried out early in 2006, resulted in no change of status. Does Telecom have a viable plan for Australia?
These are valid questions. Australia has become a much tougher nut to crack than anyone expected when Telecom entered the market. In recent months any headway AAPT has been able to make has effectively been undone by very unattractive wholesale arrangements. As one of Telstra’s largest wholesale customers, AAPT is at the sharp end of the current debate over wholesale services and prices in Australia. Any movement brings an immediate effect to the bottom line.
The much predicted consolidation of the Australian telecommunications market has been slow to materialise – and will be a long time coming until questions around wholesale and access pricing are resolved.
But Telecom is doing the groundwork that will deliver a strong business in Australia. When Telecom conducted its strategic review of the future of AAPT in early 2006, the key question was not whether we would sell or not sell the business. The key question was how to get more value from the Australian business. There were offers for the business but none of them had the right combination of a good return now, and a strong ongoing presence for Telecom in the Australian market.
Telecom needs a strong presence in Australia. Our large corporate customers (Business Solutions) need and expect a vast range of Trans-Tasman solutions to meet their ever complex and changing needs. We are continuing to build our product and service range in the Corporate and Medium Enterprise market, bringing together the sale and delivery of a complete range of ICT services and integrating our traditional telecommunications products with Gen-i’s capability. Gen-i is the largest ICT player in the New Zealand market and leveraging these specialised skills and disciplines with the relationships we have with over 10,000 Australian Corporate and Medium Enterprise companies will help drive further growth in our traditional and emerging offerings.
In addition, we have made the decision to invest in AAPT to create a strong new business focused on the services customers receive, rather than the infrastructure that delivers it. We are halfway through our investment programme and expect to see the results of a totally transformed business in the consumer and small enterprise market. In that market we have maintained the strategy that we articulated some 18 months ago. It is built around pricing, promotion and packaging for the consumer and small enterprise market building upon the ‘Straight Up’ price certainty proposition delivered over the last few years. We’ve been building the brand around the ‘Straight Up’ proposition which represents clarity and price certainty for customers in a market full of clutter and confusion.
At the same time we have been putting in place new channels to ensure we are more efficient and effective in consumer and small enterprise. That includes more direct channels to market and better use of telesales.
AAPT is, in many ways, leading the Telecom Group in investment in the ‘service-layer’ and building self-service models for customers. We’ve put more of our money into building business capability to deliver new and existing propositions to market more effectively and efficiently – and faster than our competitors can.
We are making it simpler and much more straightforward for our customers and ourselves to do business. With systems in place to deliver one view of our customers and their services, we’re growing our ability to deliver to our ‘Straight Up’ service proposition. At the same time, we’re ensuring we are much faster and more agile in getting products to the market in response to customer needs.
With these initiatives we’ve sharpened our focus on the areas where there is real potential for AAPT to grow in the consumer and small enterprise market. It all adds up to a very different type of business.
David Watson General Manager Consumer and Small Enterprise
9

Leadership Statement: Growing shareholder value 10
Theresa Gattung Chief Executive & Wayne Boyd Chairman

11
40,000 NZ shareholders have a special interest in our performance.
recognises the changing regulatory environment
creates an entity that is sustainable
grows shareholder value
contributes to the growth of the New Zealand economy
and makes Kiwis proud to be a part of the Telecom family whether it be as an employee, a customer or investor.
As the leaders of this Company, we are taking full responsibility for the challenge ahead. We must deliver and focus on the long-term as much as the medium to short-term.
Changing Times Telecom has undoubtedly been through a turbulent few months as
markets have been digesting the Government’s regulatory stocktake. Telecom has been the subject of unprecedented scrutiny, with many questions being asked about how the Company will perform in the new environment.
Shareholders have some very rational and reasonable questions to
ask of boards in situations like the current circumstances: what is
the plan from here on, and what is it going to deliver? They want
to know what targets are being set so that they will know how to measure progress. Essentially they want to know the medium to long-term outlook for the stock.
The ground rules have changed, and as a mature company, Telecom is changing with them. The Board has total confidence that Telecom can and will succeed in the new environment.
In more than 15 years as New Zealand’s leading listed company, Telecom has been a key part of New Zealand’s business landscape. It is also a company that interacts with many New Zealanders one way or another. And for international investors Telecom has been the stock they look to first if they are thinking about New Zealand.
One way or another, the telecommunications sector often confronts uncertainty and ambiguity. That is the nature of this industry. The technology changes in ever-faster life cycles. Competitors emerge not just from our own but also from other areas. And now the regulatory environment has changed as well.
Telecom is becoming a very different company. It will require all of the strengths that have made it a strong performer in the past to succeed in the new environment.
Our focus for the future is on the transformation of Telecom as the country’s largest listed company in a way that:
Moving Forward in the New Environment The precise settings for the new regulatory environment are still being determined. Telecom looks forward to being part of the process and to clarification and certainty so it can sensibly move forward and bring about change. That is the path that best ensures Telecom’s medium and long-term outlook.
Telecom is well placed to succeed in this environment. We have known this sector for a long time. We know how to change, and change quickly. We have a team of more than 9,000 passionate New Zealanders and Australians. And we are always mindful of the fact that while we have investors around the world, we have some 40,000 New Zealand shareholders who have a special interest in our performance.
Transforming Telecom Telecom’s own transformation project has intersected with the new environment being created for the sector to see Telecom on the brink of the most profound shift in our history.
Our key focus this year has been on transforming Telecom into the company it must become to meet the very different environment that is emerging through changes in technology, customers’ expectations and regulation.
We launched the transformation process at the executive team level in April with some very big changes in responsibilities. Among the
key changes:
Mark Ratcliffe’s role was widened to oversee technology – network and IT – and Telecom Wholesale
Simon Moutter took over responsibility for business customers
Kevin Kenrick joined the executive team looking after the consumer business.
This organisation of the business along customer lines reflects the realignment we have also put in place in the Australian business.
The changes that are now rolling through the Telecom Group really do reflect the total repositioning of the Company. A few years ago Telecom was a traditional, highly performing ‘Telco’ – arranged around the network. The acquisition of Gen-i was a key step in bringing converged IT solutions delivery into the Company. With the transformation now underway, Gen-i becomes the face of Telecom for business customers in New Zealand and Australia.
For our residential customers the year has seen some key landmarks in the development of broadband, and 2006-07 will see more as we move to unconstrained speeds and begin the rollout of Next Generation Broadband.
In the Wholesale environment we have seen a lot of movement as we prepare for a total sea-change. We are responding to this by separating our Wholesale and Retail businesses in a way that is based on the best of overseas experience with some practical amendments to more suit New Zealand conditions. We plan to deliver the newly regulated services such as unbundled local loops and naked DSL as smoothly as possible.
With those big changes going on inside the Company, a key role for the Board is to listen to what all stakeholders – such as investors, customers, employees, the industry and Government – are expecting of us. Much of governance is about consulting and bringing people towards solutions that have wide acceptance. The Telecom Board will continue to listen to its investors, whether they are Mums and Dads, institutions or super funds.
Leadership Statement: Growing shareholder value 12
The Telecom Board will continue to listen to its investors and customers.
Growing Shareholder Value Although Telecom has seen major change in recent months, without doubt we are on a path that will bring sustainable results in the future. As a business Telecom is delivering strong results in New Zealand, fuelled by the key areas of broadband, mobile and IT, while putting in place big changes for the future.
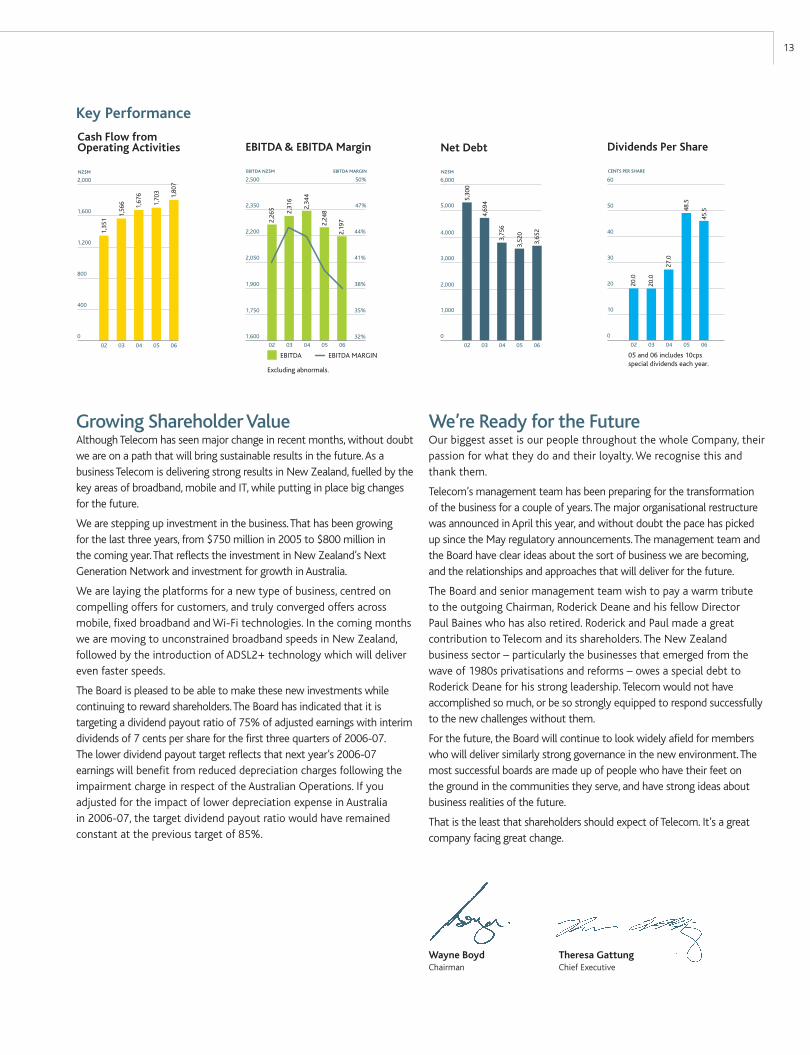
We are stepping up investment in the business. That has been growing for the last three years, from $750 million in 2005 to $800 million in the coming year. That reflects the investment in New Zealand’s Next Generation Network and investment for growth in Australia.
We are laying the platforms for a new type of business, centred on compelling offers for customers, and truly converged offers across mobile, fixed broadband and Wi-Fi technologies. In the coming months we are moving to unconstrained broadband speeds in New Zealand, followed by the introduction of ADSL2+ technology which will deliver even faster speeds.
The Board is pleased to be able to make these new investments while continuing to reward shareholders. The Board has indicated that it is targeting a dividend payout ratio of 75% of adjusted earnings with interim dividends of 7 cents per share for the first three quarters of 2006-07. The lower dividend payout target reflects that next year’s 2006-07 earnings will benefit from reduced depreciation charges following the impairment charge in respect of the Australian Operations. If you adjusted for the impact of lower depreciation expense in Australia in 2006-07, the target dividend payout ratio would have remained constant at the previous target of 85%.
We’re Ready for the FutureOur biggest asset is our people throughout the whole Company, their passion for what they do and their loyalty. We recognise this and thank them.
Telecom’s management team has been preparing for the transformation of the business for a couple of years. The major organisational restructure was announced in April this year, and without doubt the pace has picked up since the May regulatory announcements. The management team and the Board have clear ideas about the sort of business we are becoming, and the relationships and approaches that will deliver for the future.
The Board and senior management team wish to pay a warm tribute to the outgoing Chairman, Roderick Deane and his fellow Director Paul Baines who has also retired. Roderick and Paul made a great contribution to Telecom and its shareholders. The New Zealand business sector – particularly the businesses that emerged from the wave of 1980s privatisations and reforms – owes a special debt to Roderick Deane for his strong leadership. Telecom would not have accomplished so much, or be so strongly equipped to respond successfully to the new challenges without them.
For the future, the Board will continue to look widely afield for members who will deliver similarly strong governance in the new environment. The most successful boards are made up of people who have their feet on the ground in the communities they serve, and have strong ideas about business realities of the future.
That is the least that shareholders should expect of Telecom. It’s a great company facing great change.
13
Wayne BoydChairman
Theresa GattungChief Executive
Dividends Per Share
60
20
30
40
50
10
0
CENTS PER SHARE
20.0
20.0
27.0
48.5
45.5
02 03 04 0605
05 and 06 includes 10cpsspecial dividends each year.
Key Performance

NZ IFRS NZ GAAP
AS AT AND FOR THE YEAR ENDED 30 JUNE 2006 2005 2004 2003 2002
Financial Performance (all NZ$m)
Operating revenues (excluding abnormals) 5,755 5,650 5,360 5,199 5,537
EBITDA1 (excluding abnormals) 2,197 2,248 2,344 2,316 2,265
Abnormal items (net, before tax) (1,275) 95 (93) – (862)
Taxation (394) (386) (337) (391) (365)
Net (loss)/earnings (435) 967 754 709 (188)
Dividends2 891 946 521 377 374
Financial Position
Total assets (NZ$m) 6,203 7,504 7,500 7,755 8,246
Return on assets3 22.7% 21.8% 20.9% 19.3% 17.4%
Gearing4 77.5% 58.8% 63.0% 72.7% 80.0%
Other Financial Data
Interest cover5 5.6 5.2 4.5 3.8 3.4
Debt rating6 A2/A A2/A A2/A A2/A A2/A
Cash flow from operating activities (NZ$m) 1,807 1,703 1,676 1,566 1,351
Capital expenditure (NZ$m) 751 703 608 600 778
Earnings/(loss) per share (cents) (22.2) 49.6 39.2 37.6 (10.1)
Dividends per share2 (cents) 45.5 48.5 27.0 20.0 20.0
Note: Telecom adopted New Zealand equivalents to International Financial Reporting Standards (NZ IFRS) on 1 July 2005. Comparatives for the year ended 30 June 2005 have been restated to comply with NZ IFRS. For a summary of the adjustments made to comply with NZ IFRS, refer to Note 38 of the fi nancial statements. It was not possible to restate periods prior to this, accordingly, fi gures for 2002, 2003 and 2004 above are presented in accordance with previous New Zealand GAAP.
1. Earnings before interest, tax, depreciation and amortisation. 2. Excluding supplementary dividends. 3. Normalised earnings before interest and tax divided by average total assets (net of cash and short-term investments). 4. Net debt divided by net debt plus equity. 5. Normalised surplus from continuing operations divided by net interest expense (before interest capitalised). 6. Long-term foreign currency ratings from Moody’s Investors Services/Standard and Poor’s.
Five Year ReviewINTRODUCTION PERFORMANCE GOVERNANCE DISCLOSURESFINANCIALS
14
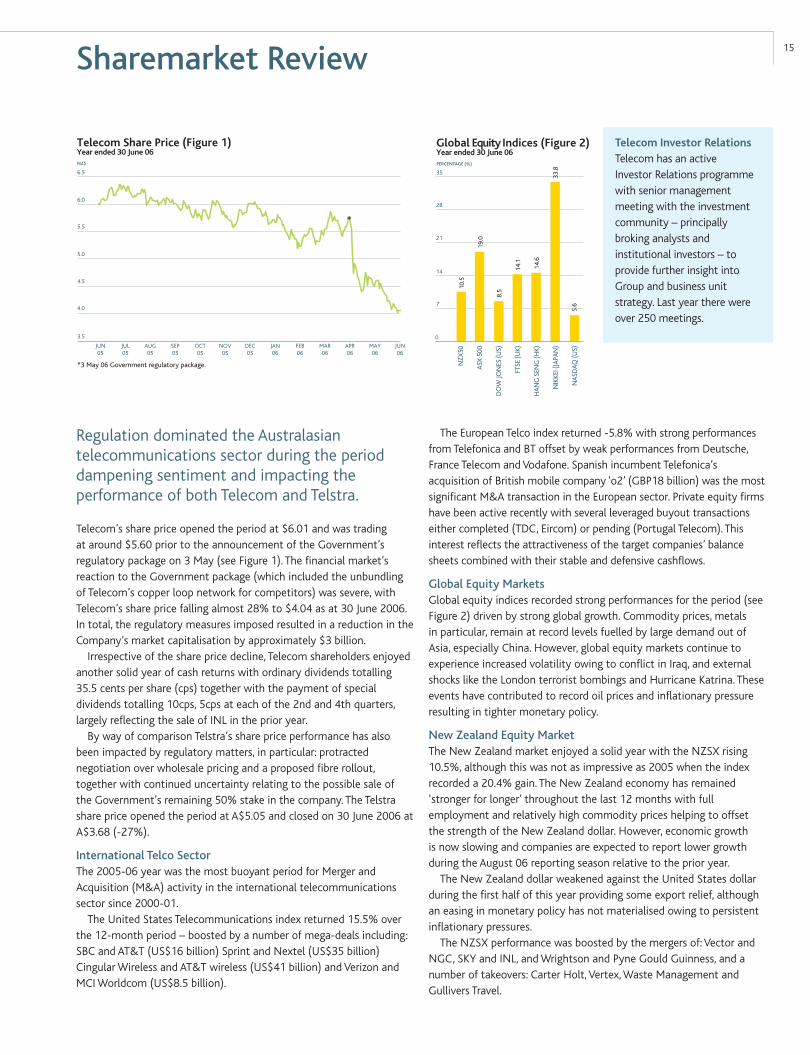
Regulation dominated the Australasian telecommunications sector during the period dampening sentiment and impacting the performance of both Telecom and Telstra.
Telecom’s share price opened the period at $6.01 and was trading at around $5.60 prior to the announcement of the Government’s regulatory package on 3 May (see Figure 1). The fi nancial market’s reaction to the Government package (which included the unbundling of Telecom’s copper loop network for competitors) was severe, with Telecom’s share price falling almost 28% to $4.04 as at 30 June 2006. In total, the regulatory measures imposed resulted in a reduction in the Company’s market capitalisation by approximately $3 billion.
Irrespective of the share price decline, Telecom shareholders enjoyed another solid year of cash returns with ordinary dividends totalling 35.5 cents per share (cps) together with the payment of special dividends totalling 10cps, 5cps at each of the 2nd and 4th quarters, largely refl ecting the sale of INL in the prior year.
By way of comparison Telstra’s share price performance has also been impacted by regulatory matters, in particular: protracted negotiation over wholesale pricing and a proposed fi bre rollout, together with continued uncertainty relating to the possible sale of the Government’s remaining 50% stake in the company. The Telstra share price opened the period at A$5.05 and closed on 30 June 2006 at A$3.68 (-27%).
International Telco SectorThe 2005-06 year was the most buoyant period for Merger and Acquisition (M&A) activity in the international telecommunications sector since 2000-01.
The United States Telecommunications index returned 15.5% over the 12-month period – boosted by a number of mega-deals including: SBC and AT&T (US$16 billion) Sprint and Nextel (US$35 billion) Cingular Wireless and AT&T wireless (US$41 billion) and Verizon and MCI Worldcom (US$8.5 billion).
15Sharemarket Review
The European Telco index returned -5.8% with strong performances from Telefonica and BT offset by weak performances from Deutsche, France Telecom and Vodafone. Spanish incumbent Telefonica’s acquisition of British mobile company ‘o2’ (GBP18 billion) was the most signifi cant M&A transaction in the European sector. Private equity fi rms have been active recently with several leveraged buyout transactions either completed (TDC, Eircom) or pending (Portugal Telecom). This interest refl ects the attractiveness of the target companies’ balance sheets combined with their stable and defensive cashfl ows.
Global Equity Markets Global equity indices recorded strong performances for the period (see Figure 2) driven by strong global growth. Commodity prices, metals in particular, remain at record levels fuelled by large demand out of Asia, especially China. However, global equity markets continue to experience increased volatility owing to confl ict in Iraq, and external shocks like the London terrorist bombings and Hurricane Katrina. These events have contributed to record oil prices and infl ationary pressure resulting in tighter monetary policy.
New Zealand Equity MarketThe New Zealand market enjoyed a solid year with the NZSX rising 10.5%, although this was not as impressive as 2005 when the index recorded a 20.4% gain. The New Zealand economy has remained ‘stronger for longer’ throughout the last 12 months with full employment and relatively high commodity prices helping to offset the strength of the New Zealand dollar. However, economic growth is now slowing and companies are expected to report lower growth during the August 06 reporting season relative to the prior year.
The New Zealand dollar weakened against the United States dollar during the fi rst half of this year providing some export relief, although an easing in monetary policy has not materialised owing to persistent infl ationary pressures.
The NZSX performance was boosted by the mergers of: Vector and NGC, SKY and INL, and Wrightson and Pyne Gould Guinness, and a number of takeovers: Carter Holt, Vertex, Waste Management and Gullivers Travel.
Telecom Investor RelationsTelecom has an active Investor Relations programme with senior management meeting with the investment community – principally broking analysts and institutional investors – to provide further insight into Group and business unit strategy. Last year there were over 250 meetings.

ResponsibilitiesTheresa leads Telecom’s Executive Team, overseeing the day-to-day management of the Company on behalf of the Board of Directors. This team meets regularly to consider strategy, policy, investment and corporate activities, and to monitor business performance.
Background
See Theresa’s Director profi le on page 30. Theresa has a Bachelor of Laws (LLB) from Victoria University of Wellington and a Bachelor of Management Studies (Hons) with majors in economics and marketing from the University of Waikato. Theresa’s pastimes include swimming, horse riding and badminton.
Theresa GattungMANAGING DIRECTOR &CHIEF EXECUTIVE OFFICER
ResponsibilitiesMarko manages the Corporate Finance function and oversees Telecom’s Group Strategy unit. He represents Telecom’s interests on the board of Hutchison 3G Australia Pty Limited and is the Executive Sponsor of the Consumer and Small Enterprise segment of the Australian business.
Background
Marko joined Telecom in May 2000 from the United States. He has held a number of senior fi nancial, operational and sales roles with Lion Nathan, Ansett, Elders Finance Group and PricewaterhouseCoopers. A Wellingtonian, he graduated from Victoria University with a Bachelor of Commerce and Administration. He also has an MBA from the Harvard Graduate School of Business. Outside of work he is a keen golfer and follower of his children’s sporting activities.
Marko BogoievskiCHIEF FINANCIAL OFFICER
ResponsibilitiesAppointed Group General Counsel in November 2000, Mark oversees the provision of legal services to Telecom and is responsible for internal audit and risk management, the Company Secretariat, compliance and public affairs. He also has responsibility for the international and Yellow Pages Group businesses and Telecom’s investment in the Southern Cross Cable.
Background
Mark has extensive experience in securities law, corporate and commercial law, competition law and the trade practices area. Mark gained a law degree from Victoria University of Wellington before starting his legal career in the early 1980s. Mark was a senior partner at national law fi rm Simpson Grierson for a considerable period, focusing on corporate advisory work, before joining Telecom. He is a director of Gas Industry Company Limited, a co-regulatory body established to assist in ensuring appropriate industry and regulation arrangements are in place for the gas industry in New Zealand. Away from the offi ce he enjoys golf, tennis, sailing and skiing.
Mark VerbiestGROUP GENERAL COUNSEL
ResponsibilitiesMark was appointed Chief Operating Officer Technology & Enterprises in April 2006. His previous role was Chief Information Officer. He is responsible for all of Telecom’s network and IT operations as well as wholesale activities.
Background
Prior to Telecom, Mark worked in senior accounting, IT, project management and consulting roles in England and New Zealand. Mark has a BA (accountancy and commerce) from Huddersfi eld University, England. His interests include spending time with his family and friends as well as watching and playing sport.
Mark RatcliffeCHIEF OPERATING OFFICER TECHNOLOGY & ENTERPRISES
Executive TeamINTRODUCTION PERFORMANCE GOVERNANCE DISCLOSURESFINANCIALS
16

ResponsibilitiesKevin was appointed Chief Operating Offi cer, Consumer for Telecom in April 2006. He has responsibility for the product development, marketing, sales and service functions of both fi xed and mobile in the Consumer customer segment. He also looks after brand management, sponsorship and marketing communications for this segment.
Background
Kevin joined Telecom in November 1999 as Sales and Marketing Manager, Xtra, and in July 2000 was appointed General Manager Marketing. He has held various marketing roles with a number of New Zealand’s leading corporate organisations, including Air New Zealand, Lion Nathan and Carter Holt Harvey, and spent a period of time working for British Telecom. Kevin graduated from Waikato University with a Bachelor of Management Studies. Outside of work he enjoys spending time with his family and is an avid sports fan.
Kevin KenrickCHIEF OPERATING OFFICER, CONSUMER
ResponsibilitiesSimon was appointed Chief Operating Offi cer, Business, in April 2006. He is responsible for all of Telecom’s managed customer business, including Gen-i, AAPT Business Solutions and Telecom Business Solutions, as well as the small enterprise segment in New Zealand. He also provides executive sponsorship for Ferrit – Telecom’s online shopping mall.
Background
Simon was appointed Chief Operating Offi cer, New Zealand in February 2002 after joining Telecom in September 1999 as General Manager Network Delivery. Before Telecom, Simon worked in various senior management positions in the energy sector, including as Chief Executive Offi cer of Powerco Ltd, General Manager of New Plymouth Energy, and Station Manager at the New Plymouth Power Station. Simon has a Master’s Degree in Engineering (Electrical) from Canterbury University and a Bachelor of Science (Physics) from Massey University. He enjoys spending time with his family and riding fast motorbikes.
Simon MoutterCHIEF OPERATING OFFICER, BUSINESS
ResponsibilitiesTrisha is responsible for the Human Resources Group which oversees and develops strategies and policies to ensure that Telecom people will most effectively contribute to the achievement of the Company’s business goals.
Background
Trisha joined Telecom in February 2002 from Sydney-based international recruitment consultants Korn Ferry where she was Head of the Management Assessment Practice. Her previous role was Group HR Director for Fletcher Challenge Ltd. Her career has included marketing, fi nancial, and human resource management roles and has spanned the forestry, oil, building, and paper industries. Ms McEwan holds a BA from Lancaster University and a post-graduate Diploma in Management Administration from Auckland University. She enjoys spending time with her husband and three children, working out at the gym, renovating and reading.
Trisha McEwanGROUP GENERAL MANAGER HUMAN RESOURCES
17

Strategy OverviewINTRODUCTION PERFORMANCE GOVERNANCE DISCLOSURESFINANCIALS
18
Telecom is committed to supporting the new regulatory environment.
It has been a year of signifi cant change in the New Zealand telecommunications industry. We have seen major developments in both the regulatory and competitive landscapes, and the coming 24 months will see the impact of these changes as they begin to shape New Zealand’s digital future.
Regulatory EnvironmentIn May 2006 the New Zealand Government announced a comprehensive set of proposed changes to telecommunications regulation. These changes include proposals to extend the range of regulated wholesale broadband services, and introduce local loop unbundling (LLU) to the New Zealand marketplace. In addition,
the Government has recently scheduled reviews of mobile market regulation, and referred to select committee to review the issue of whether some form of operational or structural separation model for Telecom is warranted. While the precise details of the new regulatory regime are determined and until the select committee reports back, much uncertainty remains. However, Telecom is committed to supporting the new regulatory environment and contributing to New Zealand’s digital future. We have chosen not to wait for the various reviews to be completed. To have done so would have been to stall progress and lose opportunities.
19
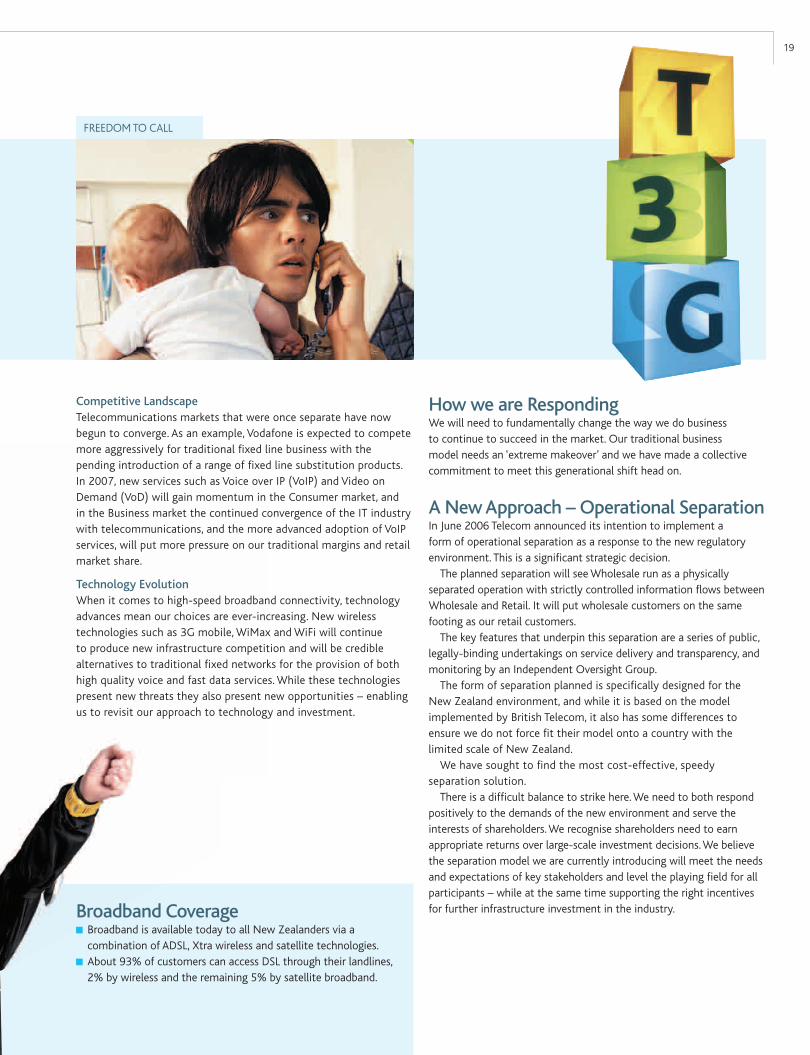
FREEDOM TO CALL
Competitive LandscapeTelecommunications markets that were once separate have now begun to converge. As an example, Vodafone is expected to compete more aggressively for traditional fi xed line business with the pending introduction of a range of fi xed line substitution products. In 2007, new services such as Voice over IP (VoIP) and Video on Demand (VoD) will gain momentum in the Consumer market, and in the Business market the continued convergence of the IT industry with telecommunications, and the more advanced adoption of VoIP services, will put more pressure on our traditional margins and retail market share.
Technology EvolutionWhen it comes to high-speed broadband connectivity, technology advances mean our choices are ever-increasing. New wireless technologies such as 3G mobile, WiMax and WiFi will continue to produce new infrastructure competition and will be credible alternatives to traditional fi xed networks for the provision of both high quality voice and fast data services. While these technologies present new threats they also present new opportunities – enabling us to revisit our approach to technology and investment.
How we are RespondingWe will need to fundamentally change the way we do business to continue to succeed in the market. Our traditional business model needs an ‘extreme makeover’ and we have made a collective commitment to meet this generational shift head on.
A New Approach – Operational SeparationIn June 2006 Telecom announced its intention to implement a form of operational separation as a response to the new regulatory environment. This is a signifi cant strategic decision.
The planned separation will see Wholesale run as a physically separated operation with strictly controlled information fl ows between Wholesale and Retail. It will put wholesale customers on the same footing as our retail customers.
The key features that underpin this separation are a series of public, legally-binding undertakings on service delivery and transparency, and monitoring by an Independent Oversight Group.
The form of separation planned is specifi cally designed for the New Zealand environment, and while it is based on the model implemented by British Telecom, it also has some differences to ensure we do not force fi t their model onto a country with the limited scale of New Zealand.
We have sought to fi nd the most cost-effective, speedy separation solution.
There is a diffi cult balance to strike here. We need to both respond positively to the demands of the new environment and serve the interests of shareholders. We recognise shareholders need to earn appropriate returns over large-scale investment decisions. We believe the separation model we are currently introducing will meet the needs and expectations of key stakeholders and level the playing fi eld for all participants – while at the same time supporting the right incentives for further infrastructure investment in the industry. Broadband Coverage
Broadband is available today to all New Zealanders via a combination of ADSL, Xtra wireless and satellite technologies.
About 93% of customers can access DSL through their landlines, 2% by wireless and the remaining 5% by satellite broadband.

Strategy Overview continued
INTRODUCTION PERFORMANCE GOVERNANCE DISCLOSURESFINANCIALS
20
Bringing the Future to Life Through the Next Generation Telecom (NGT) ProgrammeIn October 2005 Telecom’s senior management developed the blueprint of our future business. In the ensuing nine months, a project team of 20 of our best managers have developed this into an NGT plan.
The Key to SuccessLooking ahead, success will be determined by whoever is fi rst to market with the best products and whoever can deliver those services via the most effi cient service and distribution model. In both our New Zealand and Australian businesses, we are redesigning our end-to-end business models to meet these new imperatives and have begun by reorganising our internal structure to ensure we achieve our goals.
A Radically Different ModelOur future business will look very different. This model is exemplifi ed by our vision of ‘simple and complete’ – we expect to have signifi cantly fewer offers and products, fewer technology platforms, and fewer manual processes in the future. This will become evident through the emergence of simpler customer value propositions, online and self-service as predominant channels to market, and a targeted marketing approach that aligns investment against our most valuable customer segments.
Operational and Capital Effi ciency at the Heart of Enterprise GrowthTelecom recognises that one of the biggest drivers of value growth in the next 3-5 years will be the delivery of a radically lower-cost, more effi cient operating model. Migrating to this model will not be easy. Our current model, and the products and systems that support it, has evolved organically over many years and it will be challenging to transition our customers to the new world. To minimise the cost and complexity we are using a ‘clean sheet’ methodology in designing the new model and pursuing a customer ‘opt-in’ approach to deployment based on a compelling set of new market offerings.
Enhancing our Revenue Streams through the Introduction of New ServicesTelecom is meeting what some would call ‘disruptive technologies’ head on. Over the next 18 months we will begin to introduce a range of new, exciting communications and entertainment services including VoIP, video calling, converged fi xed/mobile offerings, and Video on Demand – all delivered over our Next Generation Network (NGN). We are only at the beginning of our roadmap, but have already introduced fi xed/mobile offers in the market with our Freedom plans, and recently formed a new unit to bring our video proposition to market. In the Business market we have introduced a range of IP Voice product and are investing in further enhancements to our IP Data and Remote Working products, and broadening the scope of our IT Services business to better serve the needs of our major corporate customers.
An Open ‘Ecosystem’ for Content and Applications ProvidersIn order to bring our customers the most innovative new services the market has to offer, we are introducing and formalising an open (non-exclusive) platform that allows third-party content and application developers – both big and small – equal and easy access to our fi xed and mobile technology infrastructure. As the market moves towards service-based competition, this capability could well become a key source of competitive advantage for Telecom, and also an area of future revenues.
Providing Simplicity, Personalisation and Cost Certainty to CustomersWe are committed to making life simpler and easier for our customers, in both the way they use our products, and in the way they interact with us. To that end, our new offers will be grounded in customer simplicity – they will be easier for customers to understand and largely subscription-based to provide more certainty when receiving the monthly bill. We will also introduce a new and considerably improved online self-service capability that gives customers the ultimate fl exibility and control in the way they manage their services and deal with us.
Aligning our Organisational Structure to our Future Business ModelIn order to deliver the wide range of changes required to transform our business, we have begun to reorganise our internal structure to ensure a more streamlined end-to-end delivery. In the new design we have
Next Generation broadband is coming.
21
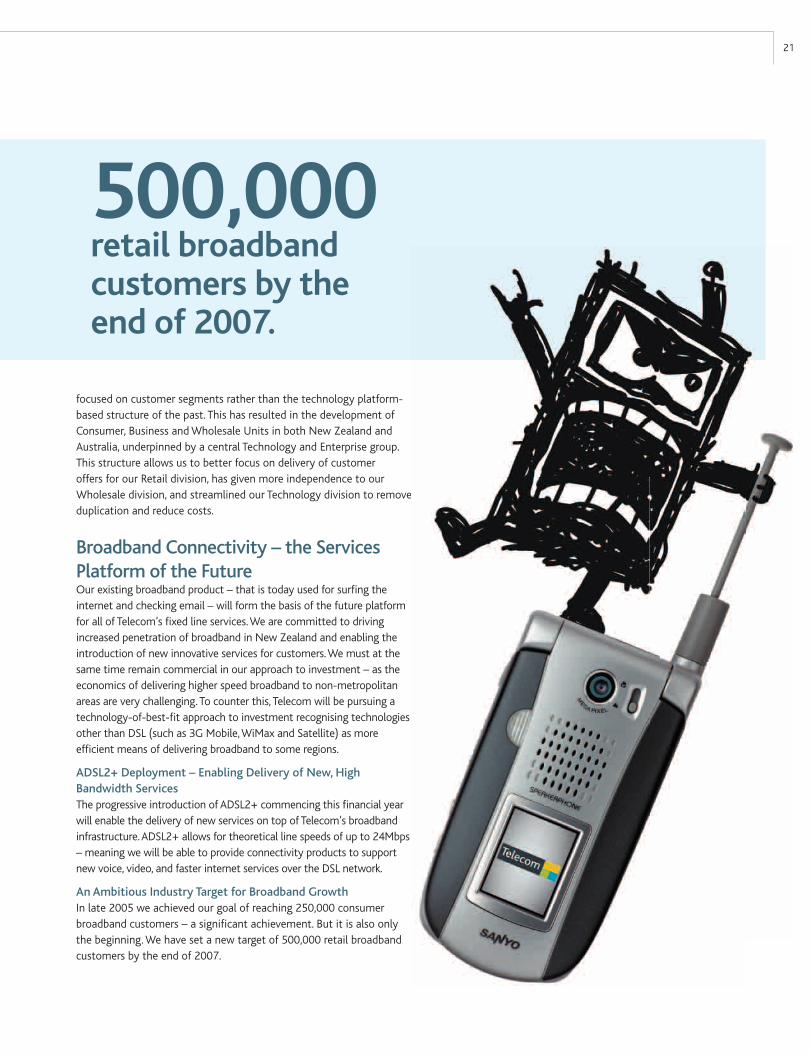
500,000
retail broadband customers by the end of 2007.
focused on customer segments rather than the technology platform-based structure of the past. This has resulted in the development of Consumer, Business and Wholesale Units in both New Zealand and Australia, underpinned by a central Technology and Enterprise group. This structure allows us to better focus on delivery of customer offers for our Retail division, has given more independence to our Wholesale division, and streamlined our Technology division to remove duplication and reduce costs.
Broadband Connectivity – the Services Platform of the FutureOur existing broadband product – that is today used for surfi ng the internet and checking email – will form the basis of the future platform for all of Telecom’s fi xed line services. We are committed to driving increased penetration of broadband in New Zealand and enabling the introduction of new innovative services for customers. We must at the same time remain commercial in our approach to investment – as the economics of delivering higher speed broadband to non-metropolitan areas are very challenging. To counter this, Telecom will be pursuing a technology-of-best-fi t approach to investment recognising technologies other than DSL (such as 3G Mobile, WiMax and Satellite) as more effi cient means of delivering broadband to some regions.
ADSL2+ Deployment – Enabling Delivery of New, High Bandwidth ServicesThe progressive introduction of ADSL2+ commencing this fi nancial year will enable the delivery of new services on top of Telecom’s broadband infrastructure. ADSL2+ allows for theoretical line speeds of up to 24Mbps – meaning we will be able to provide connectivity products to support new voice, video, and faster internet services over the DSL network.
An Ambitious Industry Target for Broadband GrowthIn late 2005 we achieved our goal of reaching 250,000 consumer broadband customers – a signifi cant achievement. But it is also only the beginning. We have set a new target of 500,000 retail broadband customers by the end of 2007.
INTRODUCTION PERFORMANCE GOVERNANCE DISCLOSURESFINANCIALS
22
OverviewThe Wired Division provides voice, data and internet services to New Zealand residential customers. Voice services include fi xed line, value-added services and national and international calling. Data communications services include residential and small business broadband, voice messaging, private network management services and information technology communications services.
Xtra is a strong New Zealand brand and xtramsn.co.nz is one of the most visited sites in this country.
The international division provides calling and managed data services between New Zealand, Australia and other countries worldwide to New Zealand and Australian customers. Yellow Pages Group is also incorporated within the Wired Division.
Strategic Priorities for 2005-06In 2005-06 Wired continued to build on Telecom’s integration and convergence strategy. A key challenge involved balancing changing revenue streams from traditional core fi xed line products while creating new revenue opportunities.
Telecom continues to be a leader in many parts of the core communications marketplace. But the business is changing fast. This was refl ected in the key strategies for Wired:
lead the transition to becoming a Next Generation communications, entertainment and information services business
continue to grow the broadband customer base, both retail and wholesale
simplify and streamline the current core communications business enhance and develop customer propositions and make strategic acquisitions in the Yellow Pages Group, particularly for online capability.
PerformanceThe 2005-06 year saw Wired deliver on its key focus areas and achieve several notable milestones. New services such as IP Voice and the enhancement of existing services such as broadband and One Offi ce, coupled with cost reduction initiatives underscored the performance of the Wired division.
The year saw continued strong competitive pressure in the voice calling market with long distance calling prices continuing to fall. There was also growing competition from local access service providers while alternative IP telephony services continued to gain traction.
Traditional residential fi xed line revenues and customer bases continued to decline year on year but not as rapidly as initially projected.
Telecom’s integrated calling and access plans Anytime and BusinessTime performed strongly, encouraged customer loyalty and offset against falling access prices. A signifi cant 459,000 consumer customers were on Anytime plans at year end.
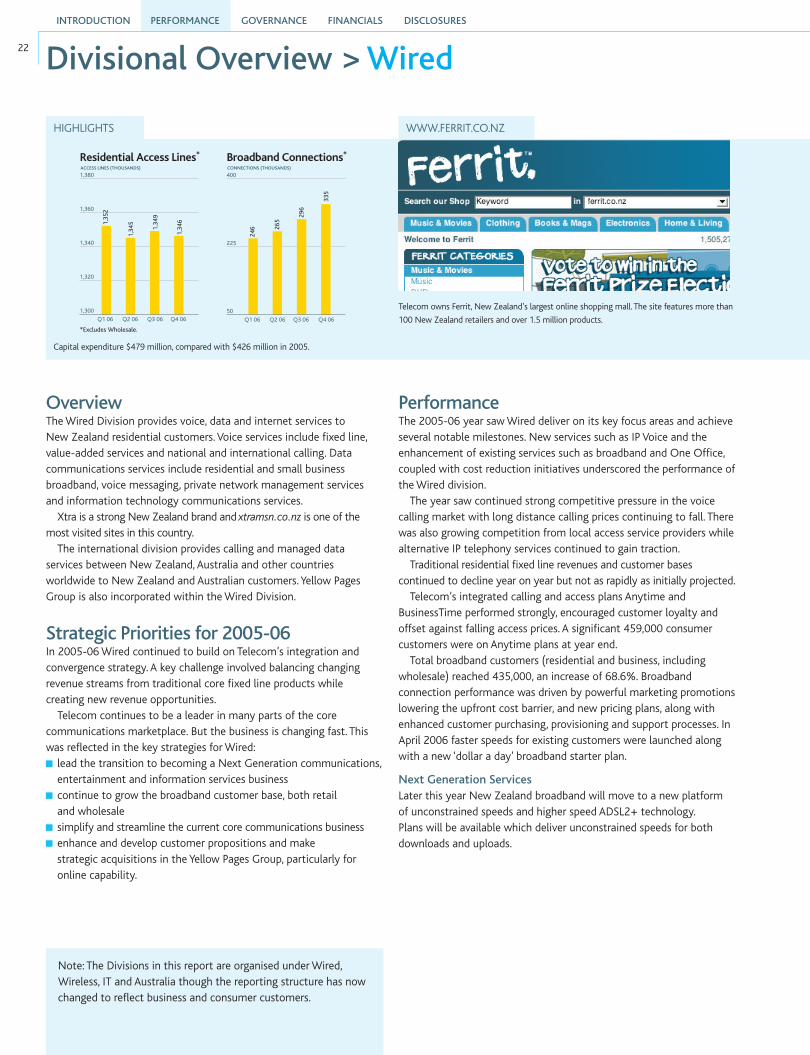
Total broadband customers (residential and business, including wholesale) reached 435,000, an increase of 68.6%. Broadband connection performance was driven by powerful marketing promotions lowering the upfront cost barrier, and new pricing plans, along with enhanced customer purchasing, provisioning and support processes. In April 2006 faster speeds for existing customers were launched along with a new ‘dollar a day’ broadband starter plan.
Next Generation ServicesLater this year New Zealand broadband will move to a new platform of unconstrained speeds and higher speed ADSL2+ technology. Plans will be available which deliver unconstrained speeds for both downloads and uploads.
Divisional Overview > Wired
Telecom owns Ferrit, New Zealand’s largest online shopping mall. The site features more than
100 New Zealand retailers and over 1.5 million products.
WWW.FERRIT.CO.NZ
Capital expenditure $479 million, compared with $426 million in 2005.
HIGHLIGHTS
Note: The Divisions in this report are organised under Wired, Wireless, IT and Australia though the reporting structure has now changed to refl ect business and consumer customers.

HIGHLIGHTS$10TXT FOR ALL OF 2007
23Divisional Overview > Wireless
OverviewMobile delivers voice and data services on Telecom’s 027 network (CDMA) and 025 (TDMA) networks including 3rd generation mobile (T3G) services.
Strategic PrioritiesOur CDMA platform continues to provide a sound base for the success of Telecom’s Wireless division evident in both continuing strong uptake of T3G services, and an unprecedented six consecutive quarters of strong connection growth winning back market share.
This growth in market share and connections has been achieved primarily by growing the market for T3G services; strong value offers ($10TXT, 3 minute hour, time and a half) and an improved handset range thanks in a large part to the relationship with US provider Sprint.
Success over the year was aided by a concerted focus on the December quarter, with a strong Christmas theme (King Kong) and sharp value offers.
New DevicesSince November 2004 Telecom has introduced a range of T3G products and services as well as a number of 3G devices.
Telecom’s smartphone range aimed at business customers also expanded markedly over the year, with the HTC Apache, Palm Treo 650 and Cyberbank Triton all entering the market.
A dual-mode satellite/CDMA mobile phone will be in the market in the last quarter of calendar 2006, virtually providing 100% coverage.
New ServicesThe newest T3G service is the Telecom Music Store, launched in December 2005 in time for Christmas, which now offers hundreds of thousands of tracks for purchase and download straight to mobile.
Other T3G services such as video messaging, Push 2 Talk and Telecom Video Clips continued to be strong performers over the 2005-06 year.
The launch of Telecom Freedom in March 2006 was a signifi cant milestone for the business, as it represented the fi rst fi xed-mobile converged offer to consumer customers. Freedom offers unlimited calls from a Telecom home line to a Telecom 027 mobile for a fi xed monthly fee. 50,000 mobiles were connected to the service just three months after launch.
In the business area, the superiority of Telecom’s Mobile Broadband product continues to win customers, as do other exciting applications.
CoverageCoverage was king throughout 2005-06, with a strong business focus on communicating Telecom’s superior 027 and 3G coverage.
Major ProjectsMobile number portability will be implemented from 1 April 2007, representing a large-scale operational and communications challenge.
In addition, the legacy 025 network will be retired at the end of March 2007. The migration of remaining 025 customers to 027 is proceeding well, and the percentage of revenue on 027 is ahead of plan at 98%.
Performance Six consecutive quarters of superior connection growth, including a December quarter (Q2) with 135,000 connections.
Mobile Broadband available in all New Zealand towns and cities by Christmas 2005, making it the most widely available 3G service in New Zealand.
Mobile data growing from 250GB per week in March 2005, to 800GB a week in March 2006.
Mobile Revenue
Voice revenue $526 million
Data revenue $171 million
Total revenue $774 million
Total connections 1,703,000
ARPU*
Postpaid $68.20 per month
Prepaid $11.30 per month
Capital Expenditure: $89 million (2005) $93 million (2006)
*Average Revenue Per User.
Rollout of Mobile Broadband (EVDO) to every main town and city in New Zealand by Christmas 2005.
Additional voice coverage added for the 027 network.
An agreement to deploy EVDO Rev A from December 2006.

INTRODUCTION PERFORMANCE GOVERNANCE DISCLOSURESFINANCIALS
24
Overview Gen-i, Telecom’s ICT arm for the business market, worked to win new business, retain existing clients during a period of organisational change, and continue its evolution towards being the most preferred ICT partner.
Gen-i works in partnership with clients to take advantage of the immediate technology benefi ts available and to ensure that each client’s business has a well considered roadmap aligned with their future business objectives.
While there has been growing awareness of Gen-i’s new identity and vision and of the wider ICT proposition, the market has been eager to see tangible proof points and milestones delivered.
Gen-i heads into the 2006-07 fi nancial year in a strong position backed by a service portfolio that includes mobile and commerce applications, IP and internet security, ICT infrastructure, hosting and storage systems, contact centre systems, and wireless, data and voice services. Gen-i also owns IT training brand Auldhouse, a good performing strategic part of the business, and open source company Asterisk.
Strategic PrioritiesGen-i is at the core of Telecom’s strategy to be a fully converged service provider for customers. Providing content and applications in addition to pure next generation connectivity is a key strategy for future growth.
Gen-i’s capability, expertise, market reach and scale mean it can support a raft of core ICT services. This is refl ected in the key strategies for Telecom’s IT services business.
Proving to customers the value of voice and data convergence in ICT solutions and the convenience of a partner which can provide a full solution.
Emphasising simplicity and completeness for delivering integrated ICT services offerings.
Ensuring business continuity and fl exibility for customers. Delivering world-leading technologies – investing and partnering with global leaders.
Investing in the future and ensuring access to the latest technological advancements on behalf of clients.
Maximising the new advantages of scale of investment. Maintaining the client intimacy and fl exibility expected of a preferred ICT partner.
The structure of Gen-i is now defi ned and the continuing integration of teams across Telecom and Gen-i will bring additional capabilities to all areas of the business. Gen-i’s lead position in ICT Services is sustainable and can be pushed out even further.
With the rollout of Next Generation Telecom, the Gen-i brand will become even more important within the Telecom Group and in the industry, and clients are supportive of this change.
Ensuring ongoing customer retention will be a priority. Alongside helping clients to realise the benefi ts of the full scope of ICT, Gen-i will continue to help customers to generate greater value from their traditional IT and telecommunications spend, while managing the transition from legacy networks and systems to converged technologies.
PerformanceGen-i has reached several signifi cant milestones in the past year. A key priority for the year was to integrate traditional IT services with Telecom’s network services, and to provide customers with access to the full range of integrated technology services. This was successfully completed with Gen-i account management teams looking after more than 50 of the largest customers, and Telecom Business Solutions looking after the remaining Business customers.
The year saw strong demand for services with a number of signifi cant customer wins which have underpinned sustained revenue growth: Air New Zealand, Ministry of Agriculture and Forestry, LINZ, AMP, Department of Labour, Defence, Shell, ANZ/National Bank, Fire Service, Christchurch International Airport, Invacare Dynamic Controls, Westpac, Lyttelton Port Company, Ravensdown, Solid Energy.
Offshore, the Gen-i Australia team has joined forces with the New Zealand team looking after the Commonwealth Bank of Australia as part of a 200-strong ICT presence in Australia.
Divisional Overview > IT Services
HIGHLIGHTS

AAPT – STRAIGHT UP
25Divisional Overview > Australia
AAPT can generally be thought of as an alternative telecommunications service provider,
with focused service, product and channel strategies. Capital expenditure was $131
million for the year to 30 June 2006, compared with $118 million in 2005.
OverviewIn Australia, AAPT operates Consumer and Business divisions which consist of segment-focused sales and marketing teams, supported by common network and customer services functions.
The Consumer division provides fi xed line, mobile and internet services to Australian residential and small business customers, and the Australian Business division provides fi xed line, mobile and internet services to business, corporate, government and wholesale customers. It includes Gen-i Australia business which provides IT and managed network services to corporates and government entities. Gen-i manages the communications outsourcing contract with the Commonwealth Bank of Australia.
Strategic Priorities Our goal is to deliver growth through service-layer strategies, this requires proportionately higher investment in information systems and people, and a detailed understanding of niche market segments, and differentiated pricing, service and delivery models.
AAPT is focused on growth in the mass consumer and business markets. The key strategic themes to implement the strategy and achieve market differentiation include:1. Pricing, promotion and packaging for consumer and small enterprises
with a focus on growing the number of customers who take multiple products and new services
2. Building a portfolio of sales channels for consumer and small enterprises3. Building self-service and back-end capability that streamlines
operations and delivers an improved service experience for customers4. Acquiring, retaining and growing key managed accounts, leveraging
our Trans-Tasman presence and growing our Gen-i footprint.By the end of 2006-07 AAPT will have a new consumer and small enterprise business model, operating off a newly implemented self-service and back-end capability centred on Bearing Point’s Infonova system. This will be the launch pad for service and product innovation in 2007-08.
PerformanceThe Group’s Australian Operations were impacted by a signifi cant increase in wholesale prices for carrier services and continued downward pressure on retail prices as competitive conditions continue
to remain challenging. The deterioration in current performance resulted in a $1,291 million (after tax) write-down in the carrying value of the Group’s Australian Operations during the year.
In Consumer and Small Enterprise AAPT focused on growing the number of customers taking more than one product. There was strong growth in the number of bundled customers, with 51% now taking more than one product, up from 30% 12 months ago, and 13% 24 months ago. Broadband also continued to be an area of growth, with more than 100,000 broadband customers at June 06, up 278% on the previous year. Total internet customers ended the year at 192,000.
In Business Solutions AAPT’s focus was on delivering a converged access service called Business Connect, which allows PSTN replacement with some PBX functionality, broadband internet and VPN capability over a single connection. There will be an increased focus on Trans-Tasman product development in the IPVPN and remote working markets and creation of an ADSL2+ capability. The percentage of customers buying more than one product increased this year from 26% to 59%.
Channel DevelopmentProgress was made to broaden AAPT’s portfolio of channels, with the appointment of IProvide in the business market. This new channel initiative is dedicated to helping small and medium enterprises take advantage of Internet Protocol (IP)-based services.
Gen-i and the Commonwealth Bank of AustraliaAn enhanced ICT focus in Australia brings TCNZA and the original Gen-i Australia business together to grow our ICT business under the Gen-i brand. Gen-i has established strong relationships delivering IT and network services to customers like IAG, Woolworths, ANZ and NSW Dept of Environment and Conservation. Gen-i has also worked with AAPT Trans-Tasman and Business retail groups to deliver ICT solutions to key AAPT customers. The Commonwealth Bank is the Group’s key client in Australia and further progress included:
completing the deployment of a major upgrade to the data network to all Bank sites in support of the major CRM initiative (CommSee)
extending the contract to supply voice and contact centre services to August 2008. As well, Gen-i will work with the Bank on delivering a converged voice, data and video services strategy, and managing security services
supporting consolidation of sites, new offi ces and data centres in Sydney.
HIGHLIGHTS

INTRODUCTION PERFORMANCE GOVERNANCE DISCLOSURESFINANCIALS
26
Working as a team has enabled us to meet the challenges of a defi ning year – fi ne-tuning our strategy and goals, changing our approach to business and redesigning our organisation around key customer segments.
The new organisation we are building is very different to the Telecom we and New Zealanders have been familiar with. As we’ve changed our approach the most prominent feature of our teamwork has been our people’s passion for what technology can do for our customers.
Our people* are our most important asset and our key focus is on ensuring we meet constantly changing customer requirements. With the pace of technological change accelerating across the entire market, our customers, particularly larger ones, are seeking a much more consultative and personalised approach.
To succeed, our people need to excel in this environment – they need to fully understand and deliver on our customers’ requirements. So we focus on developing our people at all levels in our organisation which we fundamentally believe improves customer outcomes and ultimately ensures our success.
This focus drives the two core elements underpinning our Group People Strategy – building our people capability, and maintaining a high performing organisation. We’re committed to making Telecom a place where people aspire to work and develop.
Career Development at TelecomOur focus on providing career and development opportunities was again reinforced by the 2006 Hewitt’s Engagement Survey 84 percent of our people participated in. In this survey, career opportunities has ranked as one of the top three drivers of our people’s engagement for three consecutive years. As a large employer in New Zealand and Australia, we also believe we have a social responsibility to develop people and leadership capability in our communities. Telecom prides itself on having a high performance culture.
We adopt a centralised approach to performance and development and to recruitment and internal movements, and have a number of key initiatives in place. As a result we have seen satisfaction in career opportunities at Telecom, measured through agreement with the statement ‘my career opportunities here look good’, improve signifi cantly – in New Zealand the increase was from 40 to 55 percent. We will be seeking further improvements in 2006-07.
Performance and DevelopmentEvery Telecom employee has an Individual Performance and Development plan which is maintained regularly through conversations with their line manager. This is a formal, structured process coordinated centrally to ensure ongoing progression for the individual’s development and that performance is measured consistently across the organisation. We have an achievement culture which is emphasised at all levels – our high achievers are rewarded through remuneration based on performance. (See page 110 for the Employee Remuneration table.)
Recruitment and Internal MovementsFirm principles around recruitment and the movement of our people are now strongly embedded in the organisation. We actively encourage and facilitate movement of our people into different roles across the Group. All vacancies are advertised internally before being opened to external applications and around half are fi lled by internal candidates each year. Over 90 percent of all placements now originate from our own sources; our Telecom Careers database, website and through referrals from our people.
CAREER DEVELOPMENT
Our People
Regular conversations between every Telecom person and their manager ensure each
individual can plan their ongoing development as they map out and strive towards their
performance objectives.
At all levels our people work together to achieve their goals. Our Graduate Leadership
Development Programme enables our graduates to work with each other, their managers
and with senior mentors.
WORKING TOGETHER
*9,136 permanent employees (full-time equivalents) at 30 June 2006.

MANAGEMENT DEVELOPMENT PROGRAMME TEAM PLAY
27
Key Development InitiativesCareer Development ProgrammeOver 80 percent of our New Zealand people have completed our career development workshops for development and career planning in their current roles and beyond.
Graduate Leadership Development ProgrammeThis year we welcomed 16 of New Zealand’s top graduates. There were over 1,200 applicants, and the recruitment activity saw Telecom named as the third most preferred employer amongst graduates (the Australian & New Zealand Graduate Careers Survey 2005).
We will now identify and recruit top graduates from various backgrounds annually to develop the leaders of the future.
The programme gives graduates a broad introduction to Telecom. They gain experience right across our business through structured role rotations, support through mentors and central training programmes.
High Performing Managers ProgrammeJuly 2006 saw the launch of our High Performing Managers Programme. Providing a complete and practical process for developing management skills, the programme is designed to complement existing responsibilities and focuses on: practical personal effectiveness, hiring the right people, setting expectations, motivating and developing a team, successful change management and persuasive communication.
This year over 120 of our managers across New Zealand and Australia will complete the programme – the three-year goal is for all eligible managers to complete it.
Management Development Programme (MDP)The MDP is our key initiative to develop senior managers aspiring toleadership positions. Delivered via a partnership with the universities of Waikato and Queensland, the MDP is specifi cally tailored to Telecom’s operating environment. This year we added a fi fth Action Research module, which is completed alongside the self, people, and business management and business transformation modules, and enables participants to apply their learnings to actual Telecom problems. These modifi cations see MDP graduates now receive a postgraduate Certifi cate in Management.
Valuing Our PeopleRetaining the best people is critical to our high performance goals. Our evolving employment brand has strengthened signifi cantly through focus on some key areas:
Work/life BalanceWe strongly encourage our people to fi nd the work/life balance they desire and are focused on creating an environment supportive of the choices our people make outside of work. On Father’s Day in 2005 we introduced one week’s paid parental leave for secondary caregivers on top of our generous parental leave package for primary caregivers. Remote working is increasingly becoming a key aspect of work/life balance for our people.
Increasing Engagement We are actively focused on making Telecom a more rewarding and fulfi lling place to work. Our Leadership team’s engagement is well in the Hewitt Best Performance zone – we’re now concentrating on instilling ‘followship’ – developing our leadership approach to build company-wide high engagement.
Product Benefi ts for Our PeopleWe provide our people with communications concessions so they can experience and understand our products and services. In New Zealand free access to a broadband connection and plan, a residential phone line, a mobile handset and monthly mobile usage concessions is made available, while in Australia our people receive access to account credits and plans.
Being Your BestWe recognised the achievement of hundreds of Telecom people during the year through our Group-wide Being Your Best (BYB) programme. In December, the top 45 BYB achievers from across the business celebrated their success at a function with members of the Executive.
Auckland graduates of our Management Development Programme celebrating with
Professor David McKie from the University of Waikato. The MDP builds Telecom
leaders, and there are now over 192 MDP Alumni.
New this year, Team Play brings Telecom people together to participate in team
sports building morale and encouraging our people to be healthy and active. Over 1,300
Telecom people took part in Team Play this year.

INTRODUCTION PERFORMANCE GOVERNANCE DISCLOSURESFINANCIALS
28
Telecom’s sponsorship of New Zealand’s three Health Schools helps seriously ill or
injured children continue their education in hospital or at home. This year the Northern
Health School took this to an entirely new level, using Xtra Broadband to beam a teacher
into a student’s home via webcam.
Our commitment to our communities is best refl ected in the breadth of our sponsorships.
Each year we invest more than $21 million in education, community and volunteer organisations, sports, innovation and the Arts. Education is an area where Telecom has made a signifi cant contribution. Our School Connection programme in New Zealand, for example, provides $10 million annually to schools and early childhood education centres nationwide, to help them access the tools they need to promote learning.
In addition, Telecom works closely with the Police and other community organisations to help educate young people, parents and schools about text bullying and its impact on young people. Telecom also provides education and safety tips around cyber safety.
During the year we began replacing the 16-year-old Telecom Voluntary Welfare Organisation Sponsorship with a new Telecom Community Connection sponsorship programme. This sponsorship will continue to provide more than 1,000 charitable organisations including IHC, St John, Red Cross, Heart Foundation and the Salvation Army, with $5 million in support each year and now makes available to these groups a wider range of telecommunications services.
In times of adversity Telecom goes the extra mile. Examples of this are the North Island fl oods in 2005 (February and June) where Telecom fi eldstaff worked around the clock to repair phone lines.
Telecom in the Community
Rugby’s the Winner on the DayTelecom is involved in many levels of rugby in New Zealand through its sponsorship of the All Blacks, all fi ve New Zealand Super 14 teams, the New Zealand International Sevens tournament, the Auckland provincial team and the Canterbury provincial team and local club competition. Telecom’s Virtual Rugby competition had more than 143,000 fans picking the outcome of games online.
BEAMING IN TEACHERS FOR SICK CHILDREN BEST IN THE WORLD
Telecom’s Community Support includes: Helped the young at heart through SeniorNet. There are 102 SeniorNet Learning Centres from Kaitaia to Invercargill.
Supported youth and local music with Boost Mobile Hook Up Tour and Aotearoa Hip Hop Summit.
Backed New Zealand’s biggest agricultural event – the Fieldays. Supported ethnic events including the Indian community’s Diwali Festivals in Auckland and Wellington in 2005, as well as the Chinese Lantern Festivals in Auckland and Christchurch in 2006.
Helped spread Christmas cheer with New Zealand staff donating NZ$30,000 to the Child Cancer Foundation and Australian staff donating A$30,000 to the Cancer Research Fund.
Assisted Mary Potter Hospice fundraise $25,000. Supported Auckland Philharmonia’s Education Programme Coordinator. Raised funds for What’s Up, a Kiwi kids free phone counselling service, by auctioning covers of the White Pages®.
Convened a Special Needs Advisory Panel to feedback on Telecom products, services and emerging technologies.
Acknowledged innovation by home-grown businesses through Telecom Home Business Awards.
Toured Telecom Information Technology Roadshow to 40 communities and schools.
Used videoconferencing to connect students with world rowing champions Caroline and Georgina Evers-Swindell.
Sponsored the National Library’s on-demand online librarian research service – Anyquestions.co.nz.
The Brisbane Lions Australian Football Club – naming sponsor through AAPT.
Sydney to Hobart challenger – sponsorship exclusive for ‘Team AAPT’. Received a ‘special merit’ in NBR 2005 Awards for Sponsorship of the Arts on success of 2004 Telecom International Film Festivals.
Recipient of a New Zealand Sponsorship Award for the 2006 IHC Telecom Art Awards, which attracted more than 600 entries from intellectually disabled artists throughout New Zealand.
Provided opportunities for artists to showcase their works on Telecom’s white pages and yellow pages covers.
Sponsorship of Wellington’s biennial New Zealand International Arts Festival and the Symphony Orchestra.
Telecom has been a long time supporter of Caroline and Georgina Evers-Swindell. The
twins also worked with Telecom and the New Zealand Police Youth Education Service on
the Stop Bullying campaign.
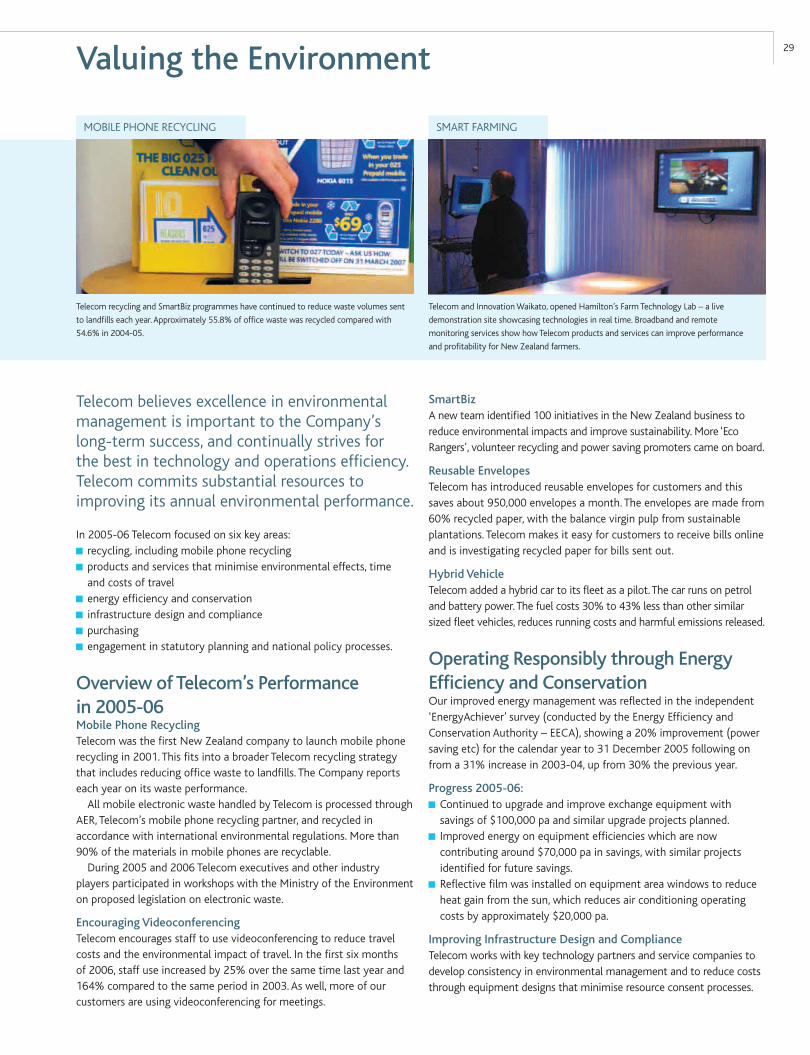
SMART FARMING
29
Telecom recycling and SmartBiz programmes have continued to reduce waste volumes sent
to landfi lls each year. Approximately 55.8% of offi ce waste was recycled compared with
54.6% in 2004-05.
Telecom and Innovation Waikato, opened Hamilton’s Farm Technology Lab – a live
demonstration site showcasing technologies in real time. Broadband and remote
monitoring services show how Telecom products and services can improve performance
and profi tability for New Zealand farmers.
Telecom believes excellence in environmental management is important to the Company’s long-term success, and continually strives for the best in technology and operations effi ciency. Telecom commits substantial resources to improving its annual environmental performance.
In 2005-06 Telecom focused on six key areas: recycling, including mobile phone recycling products and services that minimise environmental effects, time and costs of travel
energy effi ciency and conservation infrastructure design and compliance purchasing engagement in statutory planning and national policy processes.
Overview of Telecom’s Performance in 2005-06Mobile Phone RecyclingTelecom was the fi rst New Zealand company to launch mobile phone recycling in 2001. This fi ts into a broader Telecom recycling strategy that includes reducing offi ce waste to landfi lls. The Company reports each year on its waste performance.
All mobile electronic waste handled by Telecom is processed through AER, Telecom’s mobile phone recycling partner, and recycled in accordance with international environmental regulations. More than 90% of the materials in mobile phones are recyclable.
During 2005 and 2006 Telecom executives and other industry players participated in workshops with the Ministry of the Environment on proposed legislation on electronic waste.
Encouraging Videoconferencing Telecom encourages staff to use videoconferencing to reduce travel costs and the environmental impact of travel. In the fi rst six months of 2006, staff use increased by 25% over the same time last year and 164% compared to the same period in 2003. As well, more of our customers are using videoconferencing for meetings.
SmartBizA new team identifi ed 100 initiatives in the New Zealand business to reduce environmental impacts and improve sustainability. More ‘Eco Rangers’, volunteer recycling and power saving promoters came on board.
Reusable EnvelopesTelecom has introduced reusable envelopes for customers and this saves about 950,000 envelopes a month. The envelopes are made from 60% recycled paper, with the balance virgin pulp from sustainable plantations. Telecom makes it easy for customers to receive bills online and is investigating recycled paper for bills sent out.
Hybrid VehicleTelecom added a hybrid car to its fl eet as a pilot. The car runs on petrol and battery power. The fuel costs 30% to 43% less than other similar sized fl eet vehicles, reduces running costs and harmful emissions released.
Operating Responsibly through Energy Efficiency and ConservationOur improved energy management was refl ected in the independent ‘EnergyAchiever’ survey (conducted by the Energy Effi ciency and Conservation Authority – EECA), showing a 20% improvement (power saving etc) for the calendar year to 31 December 2005 following on from a 31% increase in 2003-04, up from 30% the previous year.
Progress 2005-06: Continued to upgrade and improve exchange equipment with savings of $100,000 pa and similar upgrade projects planned.
Improved energy on equipment effi ciencies which are now contributing around $70,000 pa in savings, with similar projects identifi ed for future savings.
Refl ective fi lm was installed on equipment area windows to reduce heat gain from the sun, which reduces air conditioning operating costs by approximately $20,000 pa.
Improving Infrastructure Design and ComplianceTelecom works with key technology partners and service companies to develop consistency in environmental management and to reduce costs through equipment designs that minimise resource consent processes.
Valuing the Environment
MOBILE PHONE RECYCLING

Board of Directors INTRODUCTION PERFORMANCE GOVERNANCE DISCLOSURESFINANCIALS
30
IndependentTerm of Offi ce: Appointed Director 1 July 2004, last re-elected 2004 Annual Meeting and appointed Chairman effective 1 July 2006
Board Committees: Chair of the Nominations and Corporate Governance Committee from 4 May 2006; Member of the Audit and Risk Management Committee; Member of the Human Resources and Compensation Committee from 27 June 2006
Wayne Boyd has a signifi cant
background in law and merchant
banking. Mr Boyd is a Director of
Forsyth Barr Group Limited and he is
also Chairman of Freightways Limited,
Meridian Energy Limited, Vulcan Steel
Limited and Auckland International
Airport Limited.
Mr Boyd recently announced his
intended resignation as Chairman of
Auckland International Airport Limited
and as a Director of Forsyth Barr
Group Limited.
In the past Mr Boyd was employed
by Bancorp Holdings Limited. He was
also Chairman of the South Island
Interim Development Group which
was charged with the establishment
of Meridian Energy Limited. Mr Boyd
has been involved in community
organisations as a Director of Sports
and Recreation New Zealand and
Chairman of both New Zealand Blood
Service Limited and the New Zealand
Hockey Federation.
Not IndependentTerm of Offi ce: Appointed Chief Executive Offi cer and Managing Director 11 October 1999, last re-elected 2000 Annual Meeting
Theresa Gattung has extensive
experience in companies in the
telecommunications, media, information
technology, banking and fi nance sectors.
She became Chief Executive and
Managing Director in October 1999.
She had previously been Telecom
Group General Manager Services
and before that General Manager,
Marketing. Before joining Telecom in
1994, Ms Gattung was Chief Manager
– Marketing, Bank of New Zealand
Limited, and previously held executive
positions with National Mutual and
Television New Zealand Limited.
Not IndependentTerm of Offi ce: Appointed Director 11 April 2001, last re-elected 2004 Annual Meeting, standing for re-election 2006 Annual Meeting
Board Committees: Member of the Human Resources and Compensation Committee; Member of the Nominations and Corporate Governance Committee
Rod McGeoch is Chairman of the
Boards of Sky City Entertainment Group
Limited, Pacifi c Healthcare Australia
Limited, Frontiers Group (Australasia)
Limited, Chairman of the Board of
Governors of the Sony Foundation
and the Trans-Tasman Advisory Board
of Saatchi & Saatchi Limited. He is
also a member of the NSW Board of
Advice of Aon Risk Services Limited and
a Trustee of the Sydney Cricket and
Sports Ground Trust. Mr McGeoch is a
Director of Ramsay Health Care Limited,
LIPA Pharmaceuticals Limited, Frontiers
Group (UK) Limited, Frontiers Group
(International) Limited and Gullivers
Travel Group Limited.
Mr McGeoch has signifi cant
experience as a solicitor and was
Chairman Emeritus of the Board of
law fi rm Corrs Chambers Westgarth.
Mr McGeoch was Chief Executive
of Sydney Olympics 2000 Bid
Limited and served on the Board of
the Organising Committee for the
games. He also was a member of the
successful NZ Rugby World Cup 2011
Bid Advisory Committee.
IndependentTerm of Offi ce: Appointed Director 26 July 2004, last re-elected 2004 Annual Meeting, standing for re-election 2006 Annual Meeting
Board Committees: Chair of the Audit and Risk Management Committee from 4 May 2006; Member of the Nominations and Corporate Governance Committee
Rob McLeod is currently Chairman of
the New Zealand Business Roundtable,
Sealord Group Limited, Aotearoa
Fisheries Limited and Raukura Moana
Fisheries Limited.
Mr McLeod is a Director of Sky
City Entertainment Group Limited,
Tainui Group Holdings Limited, ANZ
National Bank Limited, Te Ohu Kai
Moana Trustee Limited and Gullivers
Travel Group Limited.
Mr McLeod has wide business
experience in many areas. In the
past he has been a Councillor and
Member of the Executive Board of the
Institute of Chartered Accountants
of New Zealand. Mr McLeod was the
immediate past Chairman of Ernst
& Young Limited, was previously
Managing Partner at Andersen New
Zealand Limited and a partner
with McLeod Lojkine Associates
and Peat Marwick. Mr McLeod was
also a Commissioner of the Treaty
of Waitangi Fisheries Commission,
Chairman of the Tax Review 2001
and a Member of the 1990 Taxation
Consultative Committee on Capital
Gains Tax and the 1994 Ministerial
Taskforce on Tertiary Education.
Rob McLeodBCom, LLB, FCANON-EXECUTIVE DIRECTOR
Wayne BoydLLB (Hons)CHAIRMAN
Theresa GattungLLB, BMS (Hons) MANAGING DIRECTOR
Rod McGeochAM, LLBNON-EXECUTIVE DIRECTOR

31
IndependentTerm of Offi ce: Appointed Director 1 December 1997, last re-elected 2005 Annual Meeting
Board Committees: Chair of the Human Resources and Compensation Committee; Member of the Nominations and Corporate Governance Committee
Patsy Reddy has a signifi cant
background in legal and commercial
roles and has had experience over
the past 17 years as a Director of
a range of different New Zealand
companies. She has also been
involved in the governance and
administration of numerous arts and
community organisations.
Ms Reddy is currently Deputy
Chair of Sky City Entertainment
Group Limited, a Director of Active
Equities Limited and several other
unlisted companies. She is also a
member of NZX Discipline, the Adam
Art Gallery Advisory Board and is a
Trustee of the Sky City Community
Trust, the New Zealand International
Festival of the Arts and the Victoria
University of Wellington Art Collection
Funding Trust.
Her previous roles include non-
executive directorships of NZ Post
Limited, Air New Zealand Limited
and Southern Petroleum NL, various
senior executive positions at Brierley
Investments Limited and as a partner
in law fi rm Rudd Watts and Stone.
She has also been a lecturer in the
Law Faculty at Victoria University
of Wellington.
IndependentTerm of Offi ce: Appointed Director 1 June 1999, last re-elected 2004 Annual Meeting
Board Committees: Member of the Nominations and Corporate Governance Committee; Member of the Audit and Risk Management Committee from 27 June 2006
Michael Tyler has 32 years’ experience
in telecommunications, media and
electronic commerce. He is Managing
Director and Senior Partner of London-
based professional services fi rm
Tyler & Company, which provides
advisory and analytical services to the
telecommunications sector.
Before founding Tyler & Company,
Mr Tyler was a Senior Partner
and Director at Putnam, Hayes &
Bartlett Inc., where he headed the
telecommunications consulting
business, and before that, he led
the United States commercial
telecommunications practice as a
Partner and Vice-President at Booz,
Allen & Hamilton Inc. He is a former
member of the teaching and research
faculty of the Massachusetts Institute
of Technology. Mr Tyler started his
telecommunications career at British
Telecom in the 1970s.
Independent Term of Offi ce: Appointed Director 9 October 1992, Chairman since 11 October 1999, last re-elected 2003 Annual Meeting, resigned 30 June 2006
Board Committees: Chair of the Nominations and Corporate Governance Committee until 4 May 2006; Member of the Audit and Risk Management Committee;Member of the Human Resources and Compensation Committee
Roderick Deane has had an extensive
career in business as a Director
of New Zealand and Australian
companies. He is Chairman of Fletcher
Building Limited and the New Zealand
Seed Fund. Dr Deane is also a Director
of Woolworths Limited.
He is also Patron and on the Board of
Governance of IHC Inc., and a Member
of the Board of Trustees of MOTU
(Economic and Public Policy Research).
Dr Deane has been Chairman
of the State Services Commission,
Deputy Governor of the Reserve Bank
of New Zealand, and an Alternate
Executive Director of the International
Monetary Fund. He was Chief
Executive of Electricity Corporation
and, until October 1999, Chief
Executive and Managing Director
of Telecom. Until 30 June 2006, Dr
Deane was Chairman of ANZ National
Bank Limited, Te Papa Tongarewa
and Chairman of the City Gallery
Wellington Foundation and a Director
of the Australia and New Zealand
Banking Group Limited.
IndependentTerm of Offi ce: Appointed Director 14 May 1998, last re-elected 2003 Annual Meeting, resigned 30 June 2006
Board Committees: Chair of the Audit and Risk Management Committee until 4 May 2006 and thereafter a Member of the Audit and Risk Management Committee; Member of the Nominations and Corporate Governance Committee
Paul Baines has a signifi cant background
in fi nancial and strategic management
and has wide experience as a Director of
several New Zealand organisations. He
is a Director of Fletcher Building Limited,
Gough Gough and Hamer Limited,
Greenstone Fund, the Reserve Bank of
New Zealand and the New Zealand
School of Music. He is also a Board
Member of the New Zealand Institute
of Economic Research, Inc. and Barnados
New Zealand.
Mr Baines was previously Chief
Executive Offi cer of CS First Boston
New Zealand Limited and has also
held a number of senior positions
in the sharebroking and investment
banking fi rm Jarden & Co.
Roderick DeanePhD, BCom (Hons), FACA, FCIS, FNZIM, Honorary LLDCHAIRMAN – RESIGNED 30 JUNE 2006
Michael TylerMA NON-EXECUTIVE DIRECTOR
Paul BainesBCA, FCA, MPPNON-EXECUTIVE DIRECTOR – RESIGNED 30 JUNE 2006
Patsy ReddyLLM (Hons), F Inst D.NON-EXECUTIVE DIRECTOR

1 Telecom’s Approach to Corporate Governance1.1 FrameworkAs a result of Telecom’s stock exchange listings in New Zealand, Australia and New York it is subject to the governance requirements in each of these jurisdictions. This includes the United States Sarbanes-Oxley Act of 2002 and consequential United States Securities and Exchange Commission (SEC) rules; the New York Stock Exchange (NYSE) Corporate Governance Rules; the New Zealand Exchange Limited’s (NZX) listing rules and Corporate Governance Best Practice Code; the New Zealand Securities Commission’s report ‘Corporate Governance in New Zealand Principles and Guidelines’ (Securities Commission Principles and Guidelines); the Australian Stock Exchange Limited (ASX) listing rules and ASX Corporate Governance Council Best Practice Recommendations (ASX CGC Best Practice Recommendations).
Where there are confl icts between the requirements or best practice recommendations across New Zealand, Australia and the United States, the Telecom Board has resolved to adopt practices and policies consistent with best practice across these jurisdictions. The Board will continue to monitor developments in the governance area and review and update its governance practices to ensure Telecom continues to maintain the most appropriate standards of governance for Telecom.
1.2 Compliance with NZX Best Practice Code and ASX CGC Best Practice RecommendationsThe NZX listing rules require Telecom to include in its annual report a statement disclosing the extent to which it has followed the NZX Corporate Governance Best Practice Code for the reporting period. Telecom considers its governance practices comply with the Code in its entirety for the year to 30 June 2006.
In addition, the ASX listing rules require Telecom to include in its annual report a statement disclosing the extent to which Telecom’s governance practices comply with the 28 ASX CGC Best Practice Recommendations during the reporting period, identifying the recommendations that have not been followed and providing reasons for that variance. Telecom considers that its governance practices comply with all of the recommendations for the year to 30 June 2006, with the exception of ASX CGC Best Practice Recommendation 9.4 which recommends that companies seek shareholder approval of equity-based incentive schemes for executives. Telecom’s schemes were introduced prior to the ASX CGC Best Practice
Recommendations becoming effective and did not require shareholder approval at that time. Details of these schemes are disclosed in this Annual Report and have been extensively disclosed in past annual reports.
1.3 Compliance with NYSE Listing RulesAs a ‘foreign private issuer’ registered with the SEC with securities listed on the NYSE, Telecom is required to comply with certain corporate governance requirements contained in US securities laws, including the Sarbanes-Oxley Act of 2002 and applicable NYSE listing standards. As permitted under the NYSE listing standards, Telecom provides a description of the material differences between its corporate governance practices and the NYSE corporate governance requirements for foreign private issuers on Telecom’s website.Go to: www.telecom.co.nz/about telecom/governance at telecom.
More detail about Telecom’s governance practices and copies of its principal governance documents are available on the website, as well as comprehensive checklists cross-referencing the recommendations of NZX, the ASX CGC Best Practice Recommendations, the Securities Commission Principles and Guidelines and NYSE Corporate Governance Rules to the relevant Telecom governance documents. Go to: www.telecom.co.nz/about telecom/governance at telecom.
2 The Board of Directors2.1 Role of the Board and ResponsibilityThe Board of Directors is elected by shareholders to govern Telecom in the interests of shareholders, to protect and enhance the value of the assets of Telecom in the interests of Telecom and its shareholders. The Board is the overall and fi nal body responsible for all decision-making within the Company. In carrying out its role, the Board has the responsibility to work to enhance the value of Telecom in the interests of Telecom and its shareholders. The Board Charter describes the Board’s role and responsibilities and regulates internal Board procedure. The Board has also delegated a number of its responsibilities to its Committees. The role of the Committees is described below.
To enhance effi ciency, the Board has delegated to the Chief Executive Offi cer and subsidiary company boards the day-to-day leadership and management of the Company. The Chief Executive Offi cer has, in some cases, formally delegated certain authorities to her direct reports and has established a formal delegated authority framework for those direct reports to sub-delegate certain authorities.
The Board and management are committed to ensuring that the Company maintains international best practice governance structures and adheres to the highest ethical standards. The Board regularly reviews and assesses Telecom’s governance structures and processes to ensure that they are consistent with international best practice, both in form and substance.
Governance at TelecomINTRODUCTION PERFORMANCE GOVERNANCE DISCLOSURESFINANCIALS
32
For a copy of Telecom’s Board Charter go to: www.telecom.co.nz/about telecom/governance at telecom.
2.2 Board Membership, Size and Composition Effective 30 June 2006 Dr Deane and Mr Baines resigned from the Board and therefore as at 30 June the Board comprised six Directors: being a non-executive Chairman, an executive Director (the Chief Executive Offi cer) and four non-executive Directors. The Board has a broad range of telecommunications, fi nancial, legal, and international business skills and other relevant experience and expertise required to meet its objectives. For biography details of individual Directors go to pages 30-31.
The Nominations and Corporate Governance Committee is responsible for making recommendations to the Board regarding its size and composition. It also reviews the criteria for the selection of Directors to ensure the Board comprises the right mix of skills and experience to meet the needs of Telecom.
2.3 Selection and Role of ChairmanThe Chairman is elected by the Board from the non-executive Directors. The Board supports the separation of the role of Chairman and Chief Executive Offi cer. The Chairman’s role is to manage and provide leadership to the Board and to facilitate the Board’s interface with the Chief Executive Offi cer. The current Chairman, Wayne Boyd, is a non-executive Director and as required by the Board Charter he is independent on the basis outlined below. His biography details are set out on page 30. He is a member of each of the Board Committees and is also Chairman of the Nominations and Corporate Governance Committee.
The Board does not have a Deputy Chairman. However, prior to his resignation, Mr Baines, as Chair of the Audit and Risk Management Committee, undertook the role of Chairman in any matters concerning Dr Deane’s remuneration, terms of appointment or matters of confl ict of interest and has taken the Chair during any meetings when Dr Deane has been temporarily absent. Going forward, this role will be fulfi lled by Mr McLeod.
2.4 Director IndependenceThe Board is committed to having a majority of Directors who are judged by the Board to be independent of judgement and character and free of material relationships with Telecom and/or other entities and people that might infl uence, or could be perceived by others to infl uence, such judgement.
The corporate governance principles under the NZX listing rules, NYSE listing rules, and the guidance provided in the ASX CGC’s Best Practice Recommendations have each considered that different types of relationships constitute such ‘material relationships’ affecting independence, or the perception of independence. Independence standards consistent with the requirements of these jurisdictions have been adopted by Telecom and are contained in the Board Charter. From 1 July 2003 the Board Charter required that a majority of Directors be independent.
While the Board has not set materiality thresholds it will consider all relationships on a case by case basis, and as a general policy would consider a threshold of 5% to be relevant in determining materiality. Relationships will be considered from the perspective of both Telecom and the customer or supplier.
At its August 2006 Board Meeting the Board resolved, based on information provided by Directors regarding their interests, that all Directors on the Board at that time, except Rod McGeoch and Theresa Gattung, were independent.
The Board considers that Rod McGeoch’s role as Chairman of Saatchi & Saatchi’s Trans-Tasman Advisory Board could preclude Mr McGeoch from being reasonably perceived as independent. Saatchi & Saatchi supplies services to Telecom on arm’s-length commercial terms and does not derive revenue from Telecom by virtue of Mr McGeoch’s Chairmanship of Saatchi & Saatchi’s Trans-Tasman Advisory Board. In addition, decisions on the selection of advertising agencies are delegated to the Chief Executive Offi cer. Further, Mr McGeoch has no involvement in the selection of service providers in this area and has no ability to infl uence decisions on such matters. However, as Telecom is a material customer of Saatchi & Saatchi Mr McGeoch may not be perceived as independent. For that reason the Board has determined him not to be independent under the Board Charter.
Rob McLeod was until 30 September 2004 Chairman of Ernst & Young Limited (Ernst & Young). The Board does not consider that Rob McLeod’s relationship with Ernst & Young precludes him from being regarded as independent. Whilst Ernst & Young has in the past three years provided consulting services to Telecom, at no time have the fees for those services exceeded the materiality thresholds (5% of annual revenue) imposed by Telecom from either a Telecom or Ernst & Young perspective. In addition, Mr McLeod has not been involved in the provision of those services.
The Board will review any determination it makes on a Director’s independence on becoming aware of any information that indicates the Director may have a relevant material relationship with Telecom. For this purpose, Directors are required to ensure that they immediately advise of any new or changed relationships so the Board can consider and determine the materiality of the relationship.
For biographies of Directors in offi ce at 30 June 2006 go to pages 30-31. See Related Party Transactions (Note 29 to the Financial Statements on page 90) and the Disclosures of Interest by Directors on page 109.
2.5 Confl icts of InterestThe Board is conscious of its obligations to ensure that Directors avoid confl icts of interest (both real and apparent) between their duty to Telecom and their own interests. The Board Charter outlines the Board’s policy on confl icts of interest. Where confl icts of interest do exist at law then the Director must disclose their interest, excuse themselves from any Board discussions and not receive any Board papers in respect of those interests, and in accordance with the relevant stock exchange listing rules not exercise their right to vote in respect of such matters.
33

2.6 Nominations and Appointment of New DirectorsThe procedures for the appointment and removal of Directors are ultimately governed by the Company’s Constitution. Recommendations for nominations of new Directors are made by the Nominations and Corporate Governance Committee and considered by the Board as a whole. External consultants are used to access a wide base of potential candidates and to review the suitability of candidates for appointment based on pre-established criteria. When recommending candidates to act as Director, the Nominations and Corporate Governance Committee takes into account such factors as it deems appropriate, including the background, experience, professional skills, personal qualities, whether their skills and experience will augment the existing Board, and the availability to commit themselves to the role.
If the Board appoints a new Director during the year, that person will stand for election by shareholders at the next annual meeting. Shareholders are provided with relevant information on the candidates for election. Effective 30 June 2006 Dr Deane and Mr Baines resigned from the Board. The Board was, at the time of writing this Annual Report, undertaking a comprehensive process to consider the appointment of new Directors.
2.7 Letters of AppointmentAll Directors have formal letters of appointment setting out the arrangements of their appointment including their duties, terms and conditions and term of appointment, expectations of the role and remuneration. These may be amended by agreement of the Board.
2.8 Director Induction and Education The Board introduces new Directors to management and the business through specifi cally tailored induction programmes depending on their needs. The programme includes one-on-one meetings with management and visits to key Company sites.
All Directors are regularly updated on relevant industry and Company issues, which include visits to Telecom operations, briefi ngs from key executives and industry experts, and visits for briefi ngs and discussions of issues with companies in relevant industries. There is an ongoing programme of presentations to the Board by all business units. The Board expects all Directors to undertake continuous education so that they may appropriately and effectively perform their duties.
2.9 Board Performance ReviewIn August 2005 a performance review of the Board was conducted by the then Chairman Dr Deane in his role as Chairman of the Nominations and Corporate Governance Committee, where he assessed the performance of individual Directors. The Board also reviewed its own performance as a whole against the Board Charter, and each Committee against its Charter. This process included one-on-one meetings between the Chairman and each Director, as well as regular Board discussion on governance and performance issues. In addition, a comprehensive Board evaluation survey has been
undertaken to seek Director feedback on a range of matters relating to Board performance including its role and composition, procedures, practices and administration. The collective results of the evaluation were reported by the Chairman to the Board.
2.10 Chief Executive Offi cer Performance ReviewThe Human Resources and Compensation Committee regularly reviews the performance of the Chief Executive Offi cer. The formal annual review process is conducted in August in respect of the immediately preceding income year. This evaluation is undertaken using criteria set by the Committee that include the performance of the business, the accomplishment of strategic and operational objectives, and other non-quantitative objectives agreed at the beginning of each year. The Committee is responsible for the evaluation of the Chief Executive Offi cer against her key performance objectives, and periodically reviews these to ensure they are an appropriate measure of the Chief Executive Offi cer’s performance. Further details of the employment arrangements relating to the Chief Executive Offi cer can be found in the remuneration section of this Annual Report.
The Chief Executive Offi cer reports to the Human Resources and Compensation Committee at least annually on management succession planning and management development.
2.11 Retirement and Re-election of DirectorsThe Constitution provides for the retirement of Directors at age 70. In addition, within the provisions of the Constitution, a Director is required to stand for re-election at the third Annual Meeting following the Director’s appointment or three years, whichever is the longer. As a matter of policy the Board has agreed that no Director appointed after 1 July 2003 should remain a Director for more than six years (or two terms) following their fi rst election (or re-election if initially appointed by way of casual vacancy) by shareholders unless the Board determines otherwise. Where a Director is coming to the end of the six-year (or two-term) period the Board will consider whether the Director should be invited to stand for re-election for a further three-year term. The Director will not be present for that part of the meeting where the matter is discussed. This policy has applied since 1 July 2003.
Rob McLeod and Rod McGeoch are standing for re-election at this year’s Annual Meeting. The Board has resolved to support their re-election at the Annual Meeting on 5 October 2006.
2.12 Board Access to Information and AdviceTelecom’s Group General Counsel Mark Verbiest, and Company Secretary Linda Cox are responsible for supporting the effectiveness of the Board by ensuring that policies and procedures are followed and for coordinating the completion and dispatch of the Board agenda and papers.
All Directors have access to executives, including the Group General Counsel and Company Secretary, to discuss issues or obtain information on specifi c areas or items to be considered at the Board
Governance at Telecom continued
INTRODUCTION PERFORMANCE GOVERNANCE DISCLOSURESFINANCIALS
34
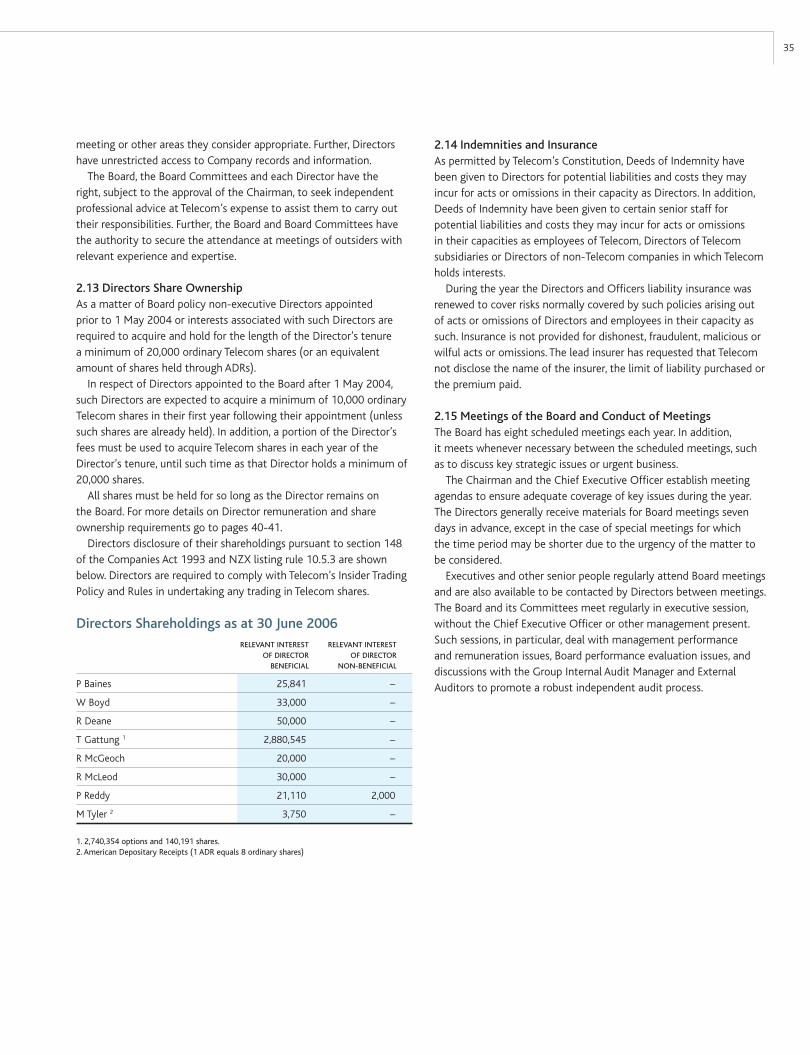
meeting or other areas they consider appropriate. Further, Directors have unrestricted access to Company records and information.
The Board, the Board Committees and each Director have the right, subject to the approval of the Chairman, to seek independent professional advice at Telecom’s expense to assist them to carry out their responsibilities. Further, the Board and Board Committees have the authority to secure the attendance at meetings of outsiders with relevant experience and expertise.
2.13 Directors Share Ownership As a matter of Board policy non-executive Directors appointed prior to 1 May 2004 or interests associated with such Directors are required to acquire and hold for the length of the Director’s tenure a minimum of 20,000 ordinary Telecom shares (or an equivalent amount of shares held through ADRs).
In respect of Directors appointed to the Board after 1 May 2004, such Directors are expected to acquire a minimum of 10,000 ordinary Telecom shares in their fi rst year following their appointment (unless such shares are already held). In addition, a portion of the Director’s fees must be used to acquire Telecom shares in each year of the Director’s tenure, until such time as that Director holds a minimum of 20,000 shares.
All shares must be held for so long as the Director remains on the Board. For more details on Director remuneration and share ownership requirements go to pages 40-41.
Directors disclosure of their shareholdings pursuant to section 148 of the Companies Act 1993 and NZX listing rule 10.5.3 are shown below. Directors are required to comply with Telecom’s Insider Trading Policy and Rules in undertaking any trading in Telecom shares.
RELEVANT INTEREST RELEVANT INTEREST OF DIRECTOR OF DIRECTOR BENEFICIAL NON-BENEFICIAL
P Baines 25,841 –
W Boyd 33,000 –
R Deane 50,000 –
T Gattung 1 2,880,545 –
R McGeoch 20,000 –
R McLeod 30,000 –
P Reddy 21,110 2,000
M Tyler 2 3,750 –
1. 2,740,354 options and 140,191 shares.2. American Depositary Receipts (1 ADR equals 8 ordinary shares)
Directors Shareholdings as at 30 June 2006
2.14 Indemnities and InsuranceAs permitted by Telecom’s Constitution, Deeds of Indemnity have been given to Directors for potential liabilities and costs they may incur for acts or omissions in their capacity as Directors. In addition, Deeds of Indemnity have been given to certain senior staff for potential liabilities and costs they may incur for acts or omissions in their capacities as employees of Telecom, Directors of Telecom subsidiaries or Directors of non-Telecom companies in which Telecom holds interests.
During the year the Directors and Offi cers liability insurance was renewed to cover risks normally covered by such policies arising out of acts or omissions of Directors and employees in their capacity as such. Insurance is not provided for dishonest, fraudulent, malicious or wilful acts or omissions. The lead insurer has requested that Telecom not disclose the name of the insurer, the limit of liability purchased or the premium paid.
2.15 Meetings of the Board and Conduct of Meetings The Board has eight scheduled meetings each year. In addition, it meets whenever necessary between the scheduled meetings, such as to discuss key strategic issues or urgent business.
The Chairman and the Chief Executive Offi cer establish meeting agendas to ensure adequate coverage of key issues during the year. The Directors generally receive materials for Board meetings seven days in advance, except in the case of special meetings for which the time period may be shorter due to the urgency of the matter to be considered.
Executives and other senior people regularly attend Board meetings and are also available to be contacted by Directors between meetings. The Board and its Committees meet regularly in executive session, without the Chief Executive Offi cer or other management present. Such sessions, in particular, deal with management performance and remuneration issues, Board performance evaluation issues, and discussions with the Group Internal Audit Manager and External Auditors to promote a robust independent audit process.
35

2.16 Attendance at Board and Committee Meetings for the Year 1 July 2005 – 30 June 2006The full Board held eight formal meetings during the year ended 30 June 2006. The table below shows Director attendance at these Board meetings and Committee member attendance at Committee meetings.
3 Board Committees 3.1 Board Committees and MembershipThree Board Committees assist in the execution of the Board’s responsibilities – the Human Resources and Compensation Committee; the Nominations and Corporate Governance Committee; and the Audit and Risk Management Committee. The Committees have a number of scheduled meetings each year to coincide with the timing of the various responsibilities of that Committee. Other Committees may be established to consider matters of special importance or to exercise the delegated authority of the Board. The number of Committee meetings held during the year, and attendance by Directors, is shown below.
3.2 Committee ChartersFor the Charters of each Committee go to: www.telecom.co.nz/about telecom/governance at telecom. The Board annually reviews the Charters of the Board Committees and their performance against those Charters.
3.3 Committee CompositionThe Board is responsible for appointing Committee members according to the skills, experience and other qualities they bring to the Committee. All Committees are required to comprise a minimum of three members. The composition of the Human Resources and Compensation Committee and the Nominations and Corporate Governance Committee each satisfi es the requirement of the respective Committee Charter that a majority of Directors be independent.
3.4 Committee Roles and OperationsAll Directors receive all Committee papers and can attend all Committee meetings. As soon as possible after each Committee meeting the Board is given a verbal report by the Chairman of the Committee on the outcomes of the meeting.
The structure, membership and responsibilities of the Board’s Committees are summarised opposite. The Committee’s role and responsibilities are outlined in the relevant Committee Charter. (Go to: www.telecom.co.nz/about telecom/governance at telecom.)
Audit and Risk Management CommitteeCompositionThe Audit and Risk Management Committee includes members who have appropriate fi nancial experience and an understanding for the industry in which Telecom operates. All Committee members are independent (in accordance with the Board Charter criteria) and are fi nancially literate. Committee members (and their family members and entities to which they are related) cannot receive (directly or indirectly) any compensation or consultancy, advisory or other fees from Telecom (other than those relating to their services as Committee and Board members or which are retirement payments made under the Constitution).
The Committee Charter requires that at least one member of the Committee must be a ‘fi nancial expert’ as defi ned in the Committee Charter.
The Board has determined that the Chairman of the Audit and Risk Management Committee, Rob McLeod is a ‘fi nancial expert’ for the purposes of the above defi nition.
The industry knowledge and fi nancial experience of other members of the Audit and Risk Management Committee are set out in the biographies of the Directors on pages 30-31.
Governance at Telecom continued
AUDIT AND HUMAN RESOURCES NOMINATIONS AND SPECIAL BOARD RISK MANAGEMENT AND COMPENSATION CORPORATE GOVERNANCE BOARD MEETINGS MEETINGS COMMITTEE MEETINGS COMMITTEE MEETINGS COMMITTEE MEETINGS
Total number of meetings held 8 3 4 6 3
P Baines 8 2 4 3
W Boyd 8 3 4 3
R Deane 8 2 4 6 3
T Gattung 8 3
R McGeoch 8 3 6 3
R McLeod 8 3 4 3
P Reddy 8 3 6 3
M Tyler 7 3 2
All Directors are entitled to attend all meetings of Board Committees by standing invitation. The above table shows attendance by Committee members at meetings of the Committee.In addition, specially constituted Board sub-committees met during the year to discuss specific issues.
Board and Committee Meeting Attendance
INTRODUCTION PERFORMANCE GOVERNANCE DISCLOSURESFINANCIALS
36

4 Audit Governance and Independence4.1 External Audit IndependenceThe Audit and Risk Management Committee is responsible for making recommendations to the Board concerning the appointment of Telecom’s external Auditors and the terms of engagement. In August 2005 the Board approved the re-appointment of KPMG as Auditors for the year ended 30 June 2006. Shareholders approved the Board setting the remuneration of the Auditors at the Annual Meeting in October 2005.
Telecom is committed to Auditor independence. The Audit and Risk Management Committee reviews the independence and objectivity of the external Auditors. For this reason the work of the external Auditors is limited to audit and related work only and the Audit and Risk Management Committee or its Chairman is required to pre-approve all audit and related assurance services. The External Audit Independence Policy requires rotation of audit partners every fi ve years and places restrictions on an audit partner or audit manager being employed by Telecom in another role and on the external Auditors employing Telecom’s Chief Executive Offi cer, Chief Financial Offi cer, Group Controller or any other member of Telecom management who has acted in a fi nancial oversight role.
The external Auditors review all Board and Committee papers and attend all Committee meetings. The Committee also meets with the external Auditors without management being present and meets management without the external Auditors being present. Committee members may contact the external Auditors directly at any time.
See page 108 for the External Auditors’ Report for the past fi nancial year.
4.2 Certifi cation and Discussion with External Auditors on IndependenceIt is a requirement of the Audit and Risk Management Committee Charter that the Committee annually assesses and confi rms to the Board the independence of the external Auditors after consideration of the External Audit Independence Policy criteria (go to: www.telecom.co.nz/about telecom/governance at telecom) including assessing whether the independence of the external audit process has been maintained in light of the performance of any other assurance services. The Audit and Risk Management Committee undertook this assessment at its meeting in August 2006 and confi rmed to the Board that it had complied in all respects with the External Audit Independence Policy and that the Committee was satisfi ed as to
Committee ResponsibilitiesHUMAN RESOURCES AND COMPENSATION COMMITTEE
AUDIT AND RISK MANAGEMENT COMMITTEE
NOMINATIONS AND CORPORATE GOVERNANCE COMMITTEE
Responsibilities To oversee the remuneration practices of Telecom
To review and make recommendations to the Board on Chief Executive Offi cer remuneration
To review and make recommendations to the Board on non-executive Director remuneration, taking into account the shareholder approved fee pool
To review and approve the remuneration and terms of employment of the Chief Executive Offi cer’s direct reports
To review and make recommendations to the Board with respect to incentive remuneration plans and equity-based plans.
Oversee all matters concerning the integrity of the fi nancial statements and fi nancial reporting systems and processes
Ensure compliance with fi nancial reporting and related regulatory requirements
Approve the appointment of the external Auditors
Review the external Auditors’ qualifi cations, performance and independence
Ensure that an appropriate risk management framework exists, and review principal risks
Approve the appointment of the internal auditor and review the activities and performance of the internal audit function.
Recommend candidates for appointment to the Board based on pre-established criteria
Oversee the performance evaluation of the Board and review Board succession planning
Review on an ongoing basis the governance structures and processes of the Board and make recommendations to the Board.
Members as at 30 June 2006
Patsy Reddy (Chair)Wayne BoydRod McGeoch
Rob McLeod (Chair)Wayne BoydMichael Tyler
Wayne Boyd (Chair)Rod McGeochRob McLeod Patsy ReddyMichael Tyler
37

KPMG’s independence. As part of this assessment KPMG confi rmed in writing that it has complied with all aspects of the External Audit Independence Policy and provided relevant details in support.
The External Audit Independence Policy is available on Telecom’s website. (Go to: www.telecom.co.nz/about telecom/governance at telecom.)
4.3 Attendance at Annual MeetingRepresentatives of Telecom’s external Auditors, KPMG, will be available at Telecom’s Annual Meeting to answer shareholder questions about the conduct of the audit and content of the External Auditors’ Report.
5 Controlling and Managing Risks5.1 Approach to Risk ManagementThrough its risk management framework, Telecom identifi es, assesses and manages risks which affect its business including specifi c pan-Telecom risks arising from the business direction and strategic environment.
Telecom’s risk management framework is implemented through business processes such as business planning, investment analysis, project management and operations management.
Specifi cally, Telecom’s Managing Risk Policy requires Telecom’s business and support groups to:
identify and record risks that relate to the achievement of their business objectives
assess those risks and determine if they are acceptable under existing controls or whether additional treatment is required
respond appropriately to the risks, based on that assessment monitor and report on the current status of risks and the effectiveness of their controls.
This systematic approach to managing risk is being implemented throughout the Telecom Group.
5.2 Risk Management Roles and ResponsibilitiesRisk management takes place in the context of normal business processes such as business planning, investment analysis, project management and operations management. In addition, risk is managed through the Delegation of Authority framework and other Telecom policies that provide a framework for managing specifi c pan-Telecom risks arising from the Company business direction and strategic environment. To manage fi nancial risks around treasury transactions, the Board has approved principles and policies that specify who may authorise transactions and segregate the duties of those carrying them out.
The Audit and Risk Management Committee has the responsibility to ensure that management has established a risk management framework that includes policies and procedures to effectively identify, treat and monitor principal business risks. The Committee also regularly reviews Telecom’s risk profi le.
Telecom’s Audit and Risk Management Committee receives reports on the effectiveness of the implementation of policies and processes designed to manage risk. Internal Audit reports to the Audit and
Risk Management Committee on the adequacy and effectiveness of Telecom’s internal controls. The Committee regularly reports this information to the Board.
5.3 Chief Executive Offi cer/Chief Financial Offi cer AssuranceThe Chief Executive Offi cer and Chief Financial Offi cer have stated to the Board in writing that in respect of the year ended 30 June 2006, to the best of their knowledge and belief:
a sound system of risk management and internal compliance and control, which implements the policies of the Telecom Board of Directors, exists to provide assurance that the Telecom fi nancial statements give a true and fair view of the matters to which they relate and are in accordance with New Zealand generally accepted accounting practice
Telecom’s risk management and internal compliance and control system in relation to fi nancial reporting risks and controls is operating effi ciently and effectively in all material respects.
5.4 Internal Audit Telecom has an internal audit group based in New Zealand and Australia. The Internal Audit Charter defi nes the group’s objectives, scope, independence, responsibilities and authority. The group’s primary objective is to assist the Board and Chief Executive Offi cer in exercising good governance by providing independent assurance on Telecom’s control and risk management processes. The Audit and Risk Management Committee approves the appointment and replacement of the Group Risk and Audit Manager. The Group Risk and Audit Manager reports to the Board through the Committee. The internal audit group is independent from the activities and operations it audits, including risk management systems and has unrestricted access to Telecom’s records and staff. The group regularly performs audits across Telecom business units in New Zealand, Australia and elsewhere. The internal audit team works to an internal audit plan approved by the Audit and Risk Management Committee. The Audit and Risk Management Committee ensures that the group is appropriately staffed and that its scope of work is adequate in light of the key risks facing Telecom.
The Internal Audit and Corporate Risk Services Teams have merged to provide a more consistent view of risks, their management and control, and provide a more explicit link between key risks identifi ed in the business and the internal auditing of processes and controls. The effectiveness of risk management within Telecom will continue to be audited, augmented by regular independent external reviews.
6 Promoting Ethical and Responsible Behaviour6.1 Code of EthicsThe Company expects all its employees and Directors to maintain the highest ethical standards. Telecom’s Code of Ethics establishes the framework by which Telecom employees are expected to conduct their professional lives by facilitating behaviour and decision-making that meets Telecom’s business goals and is also consistent with Telecom’s values, policies and legal obligations.
Governance at Telecom continued
INTRODUCTION PERFORMANCE GOVERNANCE DISCLOSURESFINANCIALS
38
The Code of Ethics addresses: confl icts of interest receipt of gifts corporate opportunities confi dentiality expected behaviours (including fair dealing) the proper use of Telecom’s assets and information, compliance with laws and Telecom policies
delegated authority reporting issues regarding breaches of the Code of Ethics, legal obligations or other Telecom policies.
Telecom also has a Directors’ Code of Ethics which addresses similar topics and establishes the behaviour expected of Directors.
For a copy of the Code of Ethics, Directors’ Code of Ethics and other policies go to: www.telecom.co.nz/about telecom/governance at telecom.
6.2 Internal Policies and ProceduresAll Telecom staff are responsible for ensuring that Telecom carries out its business activities in a way that gives due consideration to all applicable legal requirements, minimises the cost of legal risk and maximises business opportunities. Managers are responsible for making sure their staff understand what compliance means in their particular areas, by ensuring appropriate training and compliance information is available.
Beyond the Code of Ethics, Telecom has a number of internal policies and procedures:
Managing Risk Policies, including security and protection, crisis management, fraud and business continuity
Insider Trading Policy and procedures Market Disclosure and Communication Policy Health and Safety Policy and related protocols Human Resources Policies, including employment, remuneration and benefi ts, equal opportunity, anti-harrassment and discrimination
Legal Compliance Policy Information Management Policy Technology Policy.
6.3 Escalation Procedures and Whistle-blowingAny Telecom employee (including a contractor) who becomes aware of a legal, Policy or Code of Ethics compliance breach or issue has a responsibility to report it using Telecom’s Compliance Escalation Procedures. Employees can report compliance concerns anonymously by phone. In addition, Telecom has a procedure whereby accounting, auditing or internal control breaches or concerns may be reported confi dentially to the Audit and Risk Management Committee.
6.4 Insider Trading Policy and Trading in Telecom SharesDirectors and employees are subject to restrictions under the law relating to dealing in Telecom securities and other related Telecom derivatives if they are in possession of inside information. Inside information is information that is not generally available and, if it
were generally available, a reasonable person would expect it to have a material effect on the price or value of Telecom securities.
To ensure compliance with these legal requirements the Insider Trading Policy specifi es that Directors, Executives and certain other groups of people within Telecom may not buy or sell Telecom shares at any time other than during the six weeks following the announcement of quarterly, half-yearly and annual results. Within the framework of New Zealand’s insider trading laws, prior consent of such transactions must be granted by the Company Secretary, or in the case of Directors, by the Chairman and in the Chairman’s case, the Chairman of the Audit and Risk Management Committee. The completion of any such transaction must also be notifi ed to the Company Secretary.
Compliance with the Insider Trading Policy and Rules is monitored through education and random checks across the Telecom share register. Any breach of the Insider Trading Policy would be regarded very seriously. All trading by those persons subject to the Insider Trading Rules is reported to the Board. In addition, as required by the Securities Markets Act 1988 and the Securities Markets (Disclosure of Relevant Interests by Directors and Offi cers) Regulations 2003, all trading by Directors and Offi cers is reported to NZX. Trading by Directors is reported also to ASX and NYSE.
6.5 Market Disclosure Policy and Shareholder CommunicationsTelecom’s Market Disclosure Policy governs its communications with shareholders and other stakeholders. Telecom is committed to providing comprehensive continuous disclosure to shareholders and other stakeholders, and complying with the listing rules of the stock exchanges on which Telecom is listed.
Telecom requires certain senior people (the Chief Executive Offi cer, Chief Financial Offi cer, Group General Counsel, Company Secretary and the General Manager Investor Relations) and in some cases the Chairman, to discuss whether information is material prior to its release.
Telecom has appointed a Disclosure Offi cer (currently the General Manager Investor Relations) who, together with the Group General Counsel, is responsible for ensuring that all material information is lodged as soon as practicable simultaneously with the NZX, ASX and NYSE.
The Disclosure Offi cer ensures that such information is published on Telecom’s website where appropriate, with further dissemination through broadcast emails to news agencies and other market commentators. Disclosure practices are monitored by the Disclosure Offi cer.
Telecom has also appointed certain executives as authorised spokespeople who are required to ensure that all proposed public comments contain information already in the public domain or information which is not material. Management is responsible for ensuring compliance with the policy.
Telecom’s website contains media releases, quarterly fi nancial information since 1999, current and past annual reports, dividend histories, notices of meeting, a list of shareholders’ frequently asked questions and other information about the Company. Telecom shareholders can contact the Board directly using the dedicated email address: [email protected]. Telecom webcasts its investor and analyst briefi ngs over its website where appropriate.
39
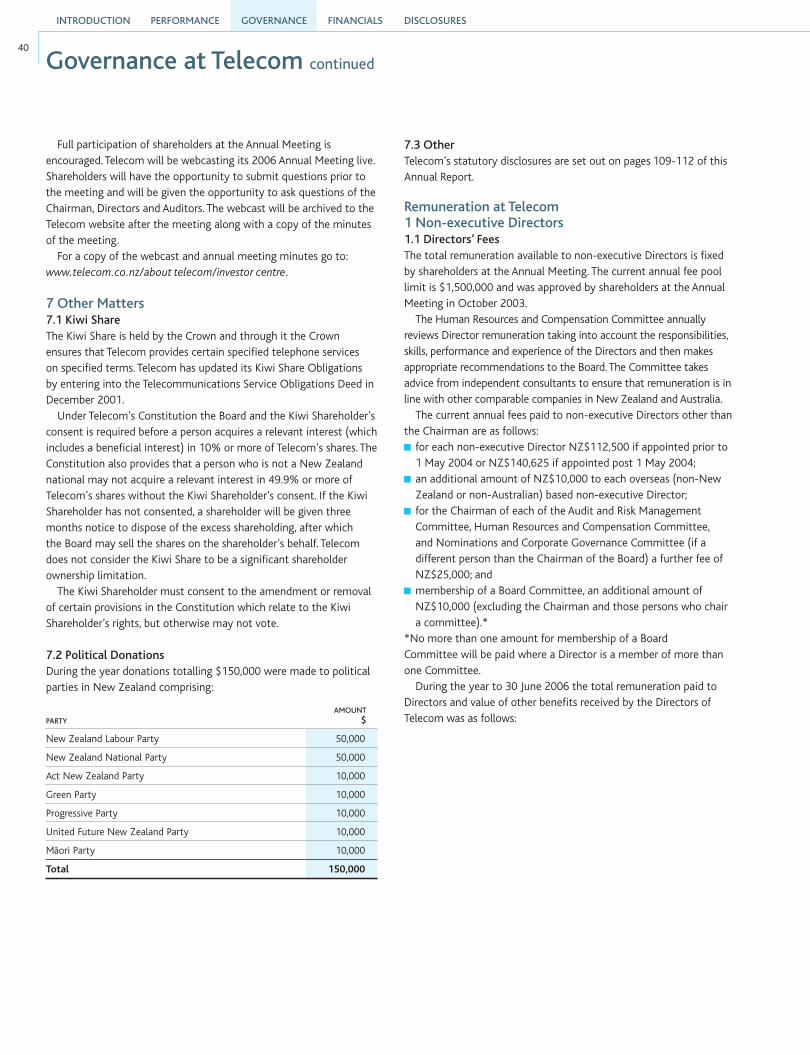
Full participation of shareholders at the Annual Meeting is encouraged. Telecom will be webcasting its 2006 Annual Meeting live. Shareholders will have the opportunity to submit questions prior to the meeting and will be given the opportunity to ask questions of the Chairman, Directors and Auditors. The webcast will be archived to the Telecom website after the meeting along with a copy of the minutes of the meeting.
For a copy of the webcast and annual meeting minutes go to: www.telecom.co.nz/about telecom/investor centre.
7 Other Matters7.1 Kiwi ShareThe Kiwi Share is held by the Crown and through it the Crown ensures that Telecom provides certain specifi ed telephone services on specifi ed terms. Telecom has updated its Kiwi Share Obligations by entering into the Telecommunications Service Obligations Deed in December 2001.
Under Telecom’s Constitution the Board and the Kiwi Shareholder’s consent is required before a person acquires a relevant interest (which includes a benefi cial interest) in 10% or more of Telecom’s shares. The Constitution also provides that a person who is not a New Zealand national may not acquire a relevant interest in 49.9% or more of Telecom’s shares without the Kiwi Shareholder’s consent. If the Kiwi Shareholder has not consented, a shareholder will be given three months notice to dispose of the excess shareholding, after which the Board may sell the shares on the shareholder’s behalf. Telecom does not consider the Kiwi Share to be a signifi cant shareholder ownership limitation.
The Kiwi Shareholder must consent to the amendment or removal of certain provisions in the Constitution which relate to the Kiwi Shareholder’s rights, but otherwise may not vote.
7.2 Political DonationsDuring the year donations totalling $150,000 were made to political parties in New Zealand comprising:
AMOUNTPARTY $
New Zealand Labour Party 50,000
New Zealand National Party 50,000
Act New Zealand Party 10,000
Green Party 10,000
Progressive Party 10,000
United Future New Zealand Party 10,000
M-aori Party 10,000
Total 150,000
7.3 Other Telecom’s statutory disclosures are set out on pages 109-112 of this Annual Report.
Remuneration at Telecom1 Non-executive Directors1.1 Directors’ FeesThe total remuneration available to non-executive Directors is fi xed by shareholders at the Annual Meeting. The current annual fee pool limit is $1,500,000 and was approved by shareholders at the Annual Meeting in October 2003.
The Human Resources and Compensation Committee annually reviews Director remuneration taking into account the responsibilities, skills, performance and experience of the Directors and then makes appropriate recommendations to the Board. The Committee takes advice from independent consultants to ensure that remuneration is in line with other comparable companies in New Zealand and Australia.
The current annual fees paid to non-executive Directors other than the Chairman are as follows:
for each non-executive Director NZ$112,500 if appointed prior to 1 May 2004 or NZ$140,625 if appointed post 1 May 2004;
an additional amount of NZ$10,000 to each overseas (non-New Zealand or non-Australian) based non-executive Director;
for the Chairman of each of the Audit and Risk Management Committee, Human Resources and Compensation Committee, and Nominations and Corporate Governance Committee (if a different person than the Chairman of the Board) a further fee of NZ$25,000; and
membership of a Board Committee, an additional amount of NZ$10,000 (excluding the Chairman and those persons who chair a committee).*
*No more than one amount for membership of a Board Committee will be paid where a Director is a member of more than one Committee.
During the year to 30 June 2006 the total remuneration paid to Directors and value of other benefi ts received by the Directors of Telecom was as follows:
Governance at Telecom continued
INTRODUCTION PERFORMANCE GOVERNANCE DISCLOSURESFINANCIALS
40
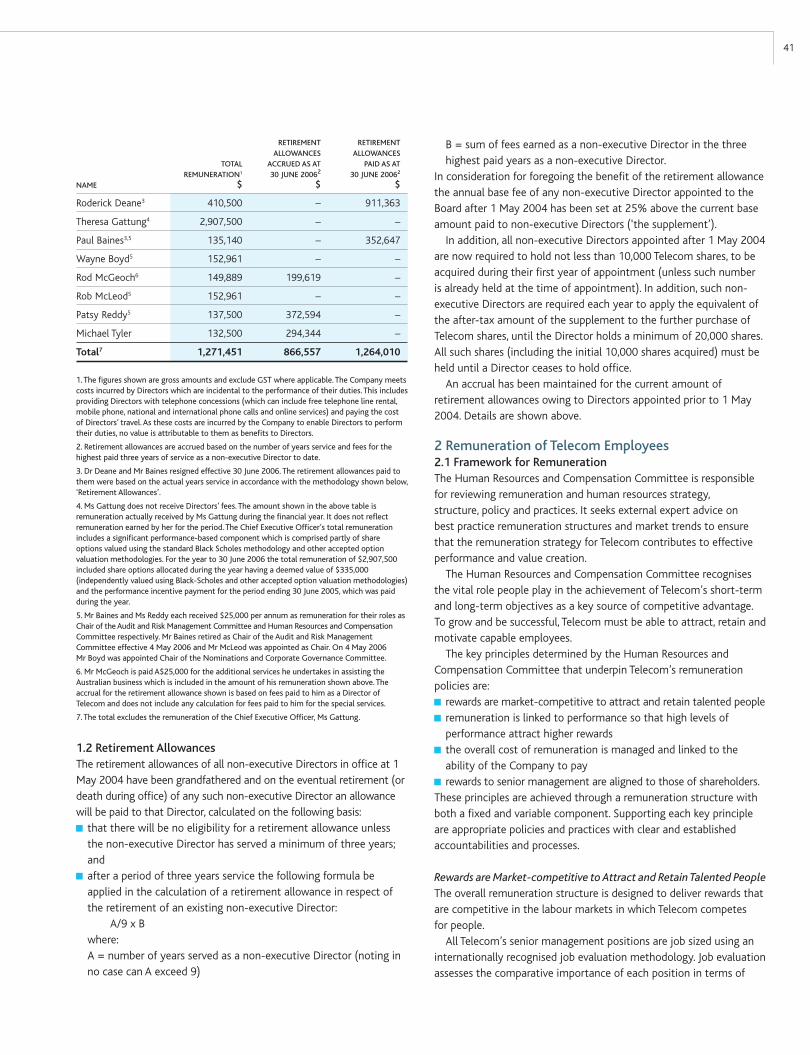
RETIREMENT RETIREMENT ALLOWANCES ALLOWANCES TOTAL ACCRUED AS AT PAID AS AT REMUNERATION1 30 JUNE 20062 30 JUNE 20062
NAME $ $ $
Roderick Deane3 410,500 – 911,363
Theresa Gattung4 2,907,500 – –
Paul Baines3,5 135,140 – 352,647
Wayne Boyd5 152,961 – –
Rod McGeoch6 149,889 199,619 –
Rob McLeod5 152,961 – –
Patsy Reddy5 137,500 372,594 –
Michael Tyler 132,500 294,344 –
Total7 1,271,451 866,557 1,264,010
1. The fi gures shown are gross amounts and exclude GST where applicable. The Company meets costs incurred by Directors which are incidental to the performance of their duties. This includes providing Directors with telephone concessions (which can include free telephone line rental, mobile phone, national and international phone calls and online services) and paying the cost of Directors’ travel. As these costs are incurred by the Company to enable Directors to perform their duties, no value is attributable to them as benefi ts to Directors.
2. Retirement allowances are accrued based on the number of years service and fees for the highest paid three years of service as a non-executive Director to date.
3. Dr Deane and Mr Baines resigned effective 30 June 2006. The retirement allowances paid to them were based on the actual years service in accordance with the methodology shown below, ‘Retirement Allowances’.
4. Ms Gattung does not receive Directors’ fees. The amount shown in the above table is remuneration actually received by Ms Gattung during the fi nancial year. It does not refl ect remuneration earned by her for the period. The Chief Executive Offi cer’s total remuneration includes a signifi cant performance-based component which is comprised partly of share options valued using the standard Black Scholes methodology and other accepted option valuation methodologies. For the year to 30 June 2006 the total remuneration of $2,907,500 included share options allocated during the year having a deemed value of $335,000 (independently valued using Black-Scholes and other accepted option valuation methodologies) and the performance incentive payment for the period ending 30 June 2005, which was paid during the year.
5. Mr Baines and Ms Reddy each received $25,000 per annum as remuneration for their roles as Chair of the Audit and Risk Management Committee and Human Resources and Compensation Committee respectively. Mr Baines retired as Chair of the Audit and Risk Management Committee effective 4 May 2006 and Mr McLeod was appointed as Chair. On 4 May 2006 Mr Boyd was appointed Chair of the Nominations and Corporate Governance Committee.
6. Mr McGeoch is paid A$25,000 for the additional services he undertakes in assisting the Australian business which is included in the amount of his remuneration shown above. The accrual for the retirement allowance shown is based on fees paid to him as a Director of Telecom and does not include any calculation for fees paid to him for the special services.
7. The total excludes the remuneration of the Chief Executive Offi cer, Ms Gattung.
1.2 Retirement AllowancesThe retirement allowances of all non-executive Directors in offi ce at 1 May 2004 have been grandfathered and on the eventual retirement (or death during offi ce) of any such non-executive Director an allowance will be paid to that Director, calculated on the following basis:
that there will be no eligibility for a retirement allowance unless the non-executive Director has served a minimum of three years; and
after a period of three years service the following formula be applied in the calculation of a retirement allowance in respect of the retirement of an existing non-executive Director: A/9 x B
where:A = number of years served as a non-executive Director (noting in no case can A exceed 9)
B = sum of fees earned as a non-executive Director in the three highest paid years as a non-executive Director.
In consideration for foregoing the benefi t of the retirement allowance the annual base fee of any non-executive Director appointed to the Board after 1 May 2004 has been set at 25% above the current base amount paid to non-executive Directors (‘the supplement’).
In addition, all non-executive Directors appointed after 1 May 2004 are now required to hold not less than 10,000 Telecom shares, to be acquired during their fi rst year of appointment (unless such number is already held at the time of appointment). In addition, such non-executive Directors are required each year to apply the equivalent of the after-tax amount of the supplement to the further purchase of Telecom shares, until the Director holds a minimum of 20,000 shares. All such shares (including the initial 10,000 shares acquired) must be held until a Director ceases to hold offi ce.
An accrual has been maintained for the current amount of retirement allowances owing to Directors appointed prior to 1 May 2004. Details are shown above.
2 Remuneration of Telecom Employees2.1 Framework for RemunerationThe Human Resources and Compensation Committee is responsible for reviewing remuneration and human resources strategy, structure, policy and practices. It seeks external expert advice on best practice remuneration structures and market trends to ensure that the remuneration strategy for Telecom contributes to effective performance and value creation.
The Human Resources and Compensation Committee recognises the vital role people play in the achievement of Telecom’s short-term and long-term objectives as a key source of competitive advantage. To grow and be successful, Telecom must be able to attract, retain and motivate capable employees.
The key principles determined by the Human Resources and Compensation Committee that underpin Telecom’s remuneration policies are:
rewards are market-competitive to attract and retain talented people remuneration is linked to performance so that high levels of performance attract higher rewards
the overall cost of remuneration is managed and linked to the ability of the Company to pay
rewards to senior management are aligned to those of shareholders. These principles are achieved through a remuneration structure with both a fi xed and variable component. Supporting each key principle are appropriate policies and practices with clear and established accountabilities and processes.
Rewards are Market-competitive to Attract and Retain Talented People The overall remuneration structure is designed to deliver rewards that are competitive in the labour markets in which Telecom competes for people.
All Telecom’s senior management positions are job sized using an internationally recognised job evaluation methodology. Job evaluation assesses the comparative importance of each position in terms of
41

its impact and accountability and ensures internal equity between positions. It also facilitates comparisons of remuneration data between Telecom positions and those in other companies that are meaningful and accurate. All senior manager position evaluations are confi rmed by an independent expert in job evaluation methodology.
All other positions are allocated to job bands that are defi ned by job evaluation ranges. A sample of positions is formally evaluated with others allocated to job bands through a matching process.
Telecom accesses market remuneration information by sourcing a number of New Zealand and Australasian remuneration surveys and seeking independent specialist remuneration expertise. This provides comprehensive market information such as remuneration trends and data, performance-based reward structures and pay levels including benefi ts and incentive components for different positions in various industries. These are used to ascertain Telecom’s competitive stance and ensure that Telecom’s rewards are suffi ciently competitive.
The Human Resources and Compensation Committee decides Telecom’s position within a comparative market and this determines remuneration ranges. Individual remuneration is set within these ranges which consider a number of factors including individual performance and capability, specifi c business needs, the criticality to Telecom of a specifi c position or individual, market shortages of specifi c skills and regional differences. Remuneration ranges are reviewed annually to refl ect movement in market remuneration.
Remuneration is Linked to Performance so that Higher Levels of Performance Attract Higher Rewards Telecom has a comprehensive performance management process. Overall business strategy shapes Telecom’s Corporate Plan. It cascades to business groups and is refl ected in business plans and fi nally in individual performance plans. Individual plans, established each year, clarify performance expectations against which individual achievement is assessed.
Individual performance is a key input into the annual remuneration review decision along with current market relativity of that individual’s remuneration package. Individuals receive remuneration increases based on performance.
The variable remuneration component is at-risk and entirely performance-based. This component includes a number of schemes. These are specifi cally designed sales incentives, annual cash-based incentives and equity-based or longer-term incentives. Each scheme links desired performance outcomes with appropriate rewards.
Sales incentives, specifi c to sales positions, are designed to drive achievement of sales, customer value and service targets. The annual cash-based incentives, either the Senior Short-term Incentive Scheme or the Short-term Incentive Scheme, drives Company, business and individual performance and links individual reward to shareholder value. An annual incentive scheme applies at all levels in the organisation with the specifi c structure and amount of incentive based on position level – senior managers participate in the Senior Short-term Incentive Scheme while others participate in a general Short-term Incentive Scheme. In line with market practice, equity-
based incentives apply only to senior management positions. These incentives link rewards of those individuals that directly impact business performance with improvements in shareholder value.
The Overall Cost of Remuneration is Managed and Linked to the Ability of the Company to Pay Telecom has a signifi cant fi nancial investment in its people. Effective growth is dependent on the quality, commitment, innovation and drive of these employees. Telecom aims, in a competitive market, to achieve the appropriate balance between managing overall remuneration costs and investing in people.
Telecom sets a conservative position for its fi xed remuneration and only pays remuneration at a higher market level when performance objectives are achieved. The overall remuneration cost is therefore linked to Telecom’s performance and therefore the ability to pay.
The total funding available for annual remuneration increases is based on market movement and is approved by the Human Resources and Compensation Committee prior to the remuneration review. The Human Resources and Compensation Committee monitors remuneration costs and practices to ensure that they are in line with policy.
The Human Resources and Compensation Committee reviews the Chief Executive Offi cer’s performance evaluation of her direct reports and approves the remuneration and other variations to the terms and conditions of employment of her direct reports.
Rewards to Senior Management are Aligned to those of Shareholders The Human Resources and Compensation Committee makes recommendations to the Board on senior management incentive remuneration plans, share option, and share ownership plans. Senior management remuneration packages comprise a fi xed portion and an at-risk portion that is only paid when performance objectives are met. Typically the Executive Team has approximately 50% of their remuneration package paid as a fi xed component. The remaining 50% is at-risk, with generally 30% an annual cash-based incentive and 20% in an equity-based scheme.
2.2 Annual Cash-based Incentive SchemeThe annual cash-based Incentive Scheme is an integral part of Telecom’s overall approach to competitive performance-based remuneration. It aims to reward individuals for meeting or exceeding individual, business group and Company goals that are aligned to Telecom’s strategic direction. Telecom Group performance is based on key fi nancial measures set by the Board.
The Board determines Telecom’s strategy and measures of success and agrees a Corporate Plan with reference to external performance benchmarks. Based on this agreed Plan, targets are set at the beginning of the year with the Board assessing performance against these following the completion of the fi nancial year. Similarly business group targets are set and assessed. Corporate and business group plans cascade down the Company to form the basis of individual performance plans. These plans translate high level corporate and business group strategies and targets into individual
Governance at Telecom continued
INTRODUCTION PERFORMANCE GOVERNANCE DISCLOSURESFINANCIALS
42
objectives that are specifi c, measurable, achievable, realistic and time bound.
The cash-based Incentive Scheme was refi ned with effect from the 2004-05 year. Changes have been made to the Scheme structure to achieve greater differentiation of incentive payments and to provide for a more dynamic performance management process. The incentive design balances business performance and individual performance so that above target performance in both results in above target payments, while below target performance in either results in lower incentive payments. In the future, a greater emphasis will be placed going-forward on longer-term strategic measures in the business performance component.
2.3 Equity-based Incentive SchemesTelecom also operates equity or non-cash based long-term incentive (LTI) schemes (see Note 24 to the Financial Statements for details of the number of shares and options issued under the schemes). These are designed to ensure there is an appropriate balance between short, medium and longer-term performance objectives and to align senior management with shareholder interests. Approximately 570 senior managers currently participate in equity-based incentive schemes. Telecom’s LTI programme has two types of equity-based schemes, the Share Option Scheme and a Restricted Share Scheme.
ASX best practice recommendation 9.4 recommends that companies seek shareholder approval of equity-based incentive schemes for executives. Telecom’s schemes were introduced prior to the ASX Corporate Governance Council best practice recommendations becoming effective and the details of these schemes have been extensively disclosed in this Annual Report and in previous annual reports. It is also relevant to note that the total number of shares, share rights and share options on issue under Telecom’s equity-based incentive schemes comprised less than 2% of the total shares on issue at 30 June 2006.
Telecom Share Option SchemeThe Telecom Share Option Scheme has operated since 1994. However, only a small number of senior managers participate in the scheme. This follows a reduction in share option scheme participation due to a change in policy and in recognition of shareholder concern about the wide use of share options. From 2003 many people who previously participated in the Share Option Scheme switched to the Restricted Share Scheme. Participation was further reduced through offering choice to certain senior managers as to whether they wished to participate in the Share Option Scheme or alternatively receive restricted shares. Approximately 38 people choose to participate in a combination of the Restricted Share Scheme and Share Option Scheme.
The Committee annually approves the option valuation based on analysis undertaken by independent external advisors, predominantly using Black-Scholes and other accepted option valuation methodologies.
Participants may, subject to employment conditions, exercise options following the completion of the stated vesting period. Generally, 25% of options can be exercised after a two-year period
with the remaining 75% after a three-year period. This refl ects the Board’s focus on medium to long-term reward. New ordinary shares are issued upon the exercise of options. Options have a maximum life of six years after which time they lapse.
The price payable on exercise of an option is equivalent to the average daily closing price of Telecom shares reported on NZSX for the month immediately preceding the date on which the options were granted.
Only individuals who meet satisfactory performance standards are eligible to be granted share options in any year. As from September 2003 a further performance hurdle must be met in order to exercise any share options. For these options to be exercised, Telecom’s share price must exceed the option exercise price escalated by the cost of equity less dividends paid, within the applicable period. The cost of equity is determined annually by the Board after receipt of advice from external advisors. Achievement of the performance hurdle will be verifi ed by the Human Resources and Compensation Committee, and once achieved, share options that have vested may be exercised at any time up to and including the lapse date of the share options.
The Board has determined that it will not grant any options in the 2006-07 year. Most senior managers with an equity incentive component in their remuneration package will receive this component in the form of Restricted Shares for the 2006-07 year. The Executive Team will have a portion of their equity-based incentive component replaced by a cash-based Incentive Scheme that will be paid subject to performance against specifi c strategic business transformation measures to secure the long-term value of the Company over a two-year period to 30 June 2008.
Telecom Restricted Share SchemesIn September 2001 restricted shares were introduced as a component of remuneration for selected senior people. Restricted shares are now the primary equity-based mechanism for LTI participants. They are intended to align employee incentives with shareholder value without the dilutionary impact of widespread use of share options.
Restricted shares are delivered via two different mechanisms that provide the same incentive and reward outcomes. These are the Telecom Restricted Share Scheme (RSS) and the Telecom Share Rights Scheme (SRS). The RSS is only used in New Zealand and the SRS is used in Australia and for New Zealand-based Executive Team members. The RSS and SRS are structured to deliver an equivalent benefi t to all participants.
Under the RSS, shares in Telecom are issued to Telecom Trustee Limited (TTL), a Telecom subsidiary. Participants purchase shares from TTL with funds lent to them by Telecom and which are held on their behalf by TTL. Generally the shares vest after a three-year period although a reduced period may be used in some cases. The price for each share is the average end-of-day market price for Telecom shares reported on NZSX in the 20 days immediately preceding the date on which the share is allocated, less a discount refl ecting the reduced value of those shares resulting from the fact that no dividends will be paid on them whilst they are held by TTL (consistent with the
43
relevant NZX waiver). If the individual is still employed by Telecom at the end of the specifi ed period the employee is given a cash bonus which must be used to repay the loan and the shares are then transferred to the individual. Under special circumstances individuals who cease employment prior to the end of the restricted period can receive a partial award under the RSS.
Under the SRS, participants are granted rights to purchase Telecom shares at a nil cost strike price. Generally rights cannot be exercised for a three-year period. The rights will be exercisable at the end of the restricted period only if the individual is still employed by Telecom, except in special circumstances. The price of a share right is determined under a similar methodology and subject to a similar NZX waiver as applies to the RSS.
2.4 Chief Executive Offi cer Employment AgreementThe Chief Executive Offi cer Theresa Gattung, has an employment agreement with Telecom Corporation of New Zealand Limited. The agreement does not contain a fi xed term. The conditions of employment under the agreement refl ect standard conditions that are appropriate to a senior executive operating within the New Zealand business community.
Ms Gattung’s employment agreement may be terminated by the Board on 12 months notice or immediately by paying 12 months base salary in lieu of notice. It may also be terminated by the Board without notice in the case of serious misconduct. Ms Gattung is entitled to terminate the agreement on six months notice.
RemunerationIn 2003 the Chief Executive Offi cer’s remuneration package was restructured to refl ect the scope and complexity of her role, more closely align the package to the interests of shareholders, enhance her long-term commitment to Telecom, and be performance-based so that at least 50% of the package is directly linked to performance outcomes. Ms Gattung’s remuneration package for the year ended 30 June 2006 included a fi xed cash component amount, an incentive award paid under the Performance Incentive Scheme, and an allocation of options under the Performance Option Scheme. The Performance Incentive Scheme and Performance Option Scheme were approved by shareholders at the 2003 Annual Meeting.
For specifi c details relating to Ms Gattung’s remuneration package see section 2.6 below.
The Performance Incentive Scheme is designed to reward Ms Gattung for achieving pre-specifi ed target levels of performance. The target value of the incentive award is set annually by the Board and paid at target value if Ms Gattung achieves target performance in the relevant year. This amount can be adjusted up or down in line with assessed under-or over-performance.
The key measure currently used in determining the amount of the incentive award is Telecom performance measured on an economic value added (EVA) basis or on specifi c derivatives of EVA such as EBITDA. In addition to the overall fi nancial targets, the Board sets specifi c performance objectives against which it measures
Ms Gattung’s performance. The specifi c performance objectives currently include fi nancial criteria based on Telecom’s business and strategic plans, and other criteria relating to corporate governance, reputation, effective leadership and management. These objectives are set at the beginning of each fi nancial year, and assessed at the end of the fi nancial year by the Board when it makes its determination of the incentive award.
The Performance Incentive Scheme may be delivered in two parts, being a 50% cash payment and 50% as fully paid ordinary Telecom shares subject to restrictive conditions. The exact number of shares to be issued each year is calculated as follows: Number of shares issued = 50% x A/B, Where: A = the after-tax value of the incentive award determined
following the end of that fi nancial year by the Board; and B = the average daily closing price of Telecom shares reported on
the NZSX for the 20 business days immediately preceding the effective date of issue.
The scheme provides that the Board may require (with the agreement of the Chief Executive Offi cer) that 50% of the after tax amount of the incentive award be applied to the subscription for new shares or the purchase of shares on market, or to pay the incentive award in cash. For the 2006 payment Ms Gattung has consented to the share component of the Performance Incentive Scheme being met by the payment in cash of the relevant after tax amount to Ms Gattung and the application of that amount to the issue of new shares.
The shares issued to or purchased by Ms Gattung under the Performance Incentive Scheme are not able to be sold or otherwise disposed of for a three-year period following issue. The shares have equivalent rights to shares held by all other Telecom shareholders. If Ms Gattung’s employment is terminated for cause then any shares issued or purchased under the Performance Incentive Scheme within the previous three years will be forfeited. If Ms Gattung’s employment otherwise ceases then the Board retains the discretion to remove the restrictions on disposal.
Under the Performance Option Scheme the Board determines, within the scope of the limit approved by the shareholders, the number of performance options granted in each year. Each performance option is granted for nil cash consideration and provides the right to purchase one ordinary share in Telecom at an exercise price equal to the average daily closing price of Telecom shares reported on the NZSX for the 20 business days immediately preceding the effective date on which the options are granted.
Options are granted in two tranches. Each tranche comprises 50% of the total number of options granted and is subject to different performance hurdles. Options can be exercised at any time on or after the third anniversary of the date of grant if the performance hurdle in respect of that particular tranche has been met and subject to compliance with Telecom’s Insider Trading Policy and other applicable laws. Performance options granted have a six-year term after which time they lapse.
The performance hurdle for one tranche requires Telecom’s share price to exceed the option exercise price escalated by the cost of
Governance at Telecom continued
INTRODUCTION PERFORMANCE GOVERNANCE DISCLOSURESFINANCIALS
44

equity less dividends paid, within the applicable period. Telecom’s cost of equity is determined by the Board after receipt of advice from external advisors. The cost of equity benchmark for each of the past three years has been set as follows, 2003-04 – 11.6%; 2004-05 – 11.2%, 2005-06 – 10.2%.
The performance hurdle for the other tranche is that Telecom’s total shareholder return (TSR) must exceed, over a comparable period, the gross returns on the MSCI World Integrated Telecommunication Services Index. TSR is a combination of dividends paid since the date of grant of the option and share price movement. The MSCI World Integrated Telecommunication Services Index comprises diversifi ed and integrated telecommunications companies and is calculated by Morgan Stanley Capital International Inc (‘MSCI’). This index refl ects the TSR of the constituent companies and is based on gross returns ie, share price movement and dividends paid.
Testing to determine whether the performance hurdles have been met may occur at any time on or after the third anniversary of the grant date until the options lapse.
Achievement of the performance hurdles is determined by the Board following receipt of external advice verifying that the performance hurdles have been met for each tranche of performance options. Once the performance hurdle has been met, the relevant options may be exercised at any time up to and including the lapse date.
If Ms Gattung resigns or her employment is terminated for cause then all options that have not reached the three-year anniversary will lapse but she may exercise others within a 12-month period if the relevant performance hurdles have been met. If Ms Gattung’s employment otherwise ceases then the Board will have the discretion to allow her up to 12 months to exercise any options granted and to waive any related performance hurdles.
The Board has determined that no options will be granted by the Company for the 2006-07 year and accordingly no options will be granted to the Chief Executive Offi cer under the Performance Option Scheme in the 2006-07 year. Instead, the longer-term component of her remuneration package will be delivered through a cash-based Incentive Scheme that will be paid subject to performance against specifi c strategic business transformation measures to secure the long-term value of the Company over a two-year period to 30 June 2008.
2.5 Telecom Performance Against Performance Hurdles Between September 2003 and August 2006 Telecom granted share options to certain senior people (including Ms Gattung) the exercise of which is subject to meeting prescribed performance hurdles. A summary of these performance hurdles and performance to date is described below.
Cost of Equity Performance Hurdle The cost of equity performance hurdle applies to one of the two tranches of options granted to Ms Gattung and to all options issued to senior managers under the Telecom Share Option Scheme since September 2003. For these options to be exercised, Telecom’s share price must exceed the option exercise price escalated by the cost of equity less dividends paid, within the applicable period.
Senior managers ESTIMATED ESTIMATED EARLIEST PERFORMANCE TELECOMTRANCHE VESTING EXERCISE HURDLE AS AT MEASURE AS AT GRANT DATE DATE PRICE 30 JUNE 2006 30 JUNE 2006
25% from Sept 2005 (subsequently vested) September 2003 75% from Sept 2006 $5.01 $5.52 $4.10
25% from Sept 2006 September 2004 75% from Sept 2007 $5.95 $6.12 $4.10
25% from Sept 2007 September 2005 75% from Sept 2008 $6.11 $6.25 $4.10
Chief Executive Offi cer, Theresa Gattung ESTIMATED ESTIMATED EARLIEST PERFORMANCE TELECOMTRANCHE VESTING EXERCISE HURDLE AS AT MEASURE AS AT GRANT DATE DATE PRICE 30 JUNE 2006 30 JUNE 2006
September 2003 September 2006 $5.01 $5.52 $4.10
September 2004 September 2007 $5.93 $6.10 $4.10
September 2005 September 2008 $6.10 $6.24 $4.10
MSCI Global Telecommunications Index Performance HurdleThe exercise of the second tranche of options granted to Ms Gattung requires Telecom’s calculated total shareholder returns to exceed the returns on the MSCI World Integrated Telecommunication Services Index, within the applicable period.
ESTIMATED ESTIMATED EARLIEST PERFORMANCE TELECOMTRANCHE VESTING EXERCISE HURDLE AS AT MEASURE AS AT GRANT DATE DATE PRICE 30 JUNE 2006 30 JUNE 2006
September 2003 September 2006 $5.01 26% (1%)
September 2004 September 2007 $5.93 18% (19%)
September 2005 September 2008 $6.10 7% (28%)
These estimates of performance to date have been based on internal Telecom calculations. Achievement of these hurdles will be verifi ed by an external party prior to the exercise of Ms Gattung’s share options.
2.6 Remuneration of Chief Executive Offi cer and Executive TeamThe table below shows the details of the nature and amount of each element of emolument earned by Telecom’s Chief Executive Offi cer, Theresa Gattung, for the year ending 30 June 2006. PERFORMANCE PERFORMANCE BASE INCENTIVE OPTION SALARY SCHEME SCHEME
Theresa GattungChief Executive Officer $1,250,000 $660,0001 $335,000
1. In accordance with the requirements of the Performance Incentive Scheme (detailed above) 50% of the performance incentive amount is paid in cash and the after-tax amount of this figure has been used to acquire Telecom shares which have restrictive conditions attached to them. The performance incentive amount is paid to Ms Gattung during the year ending 30 June 2007.
45
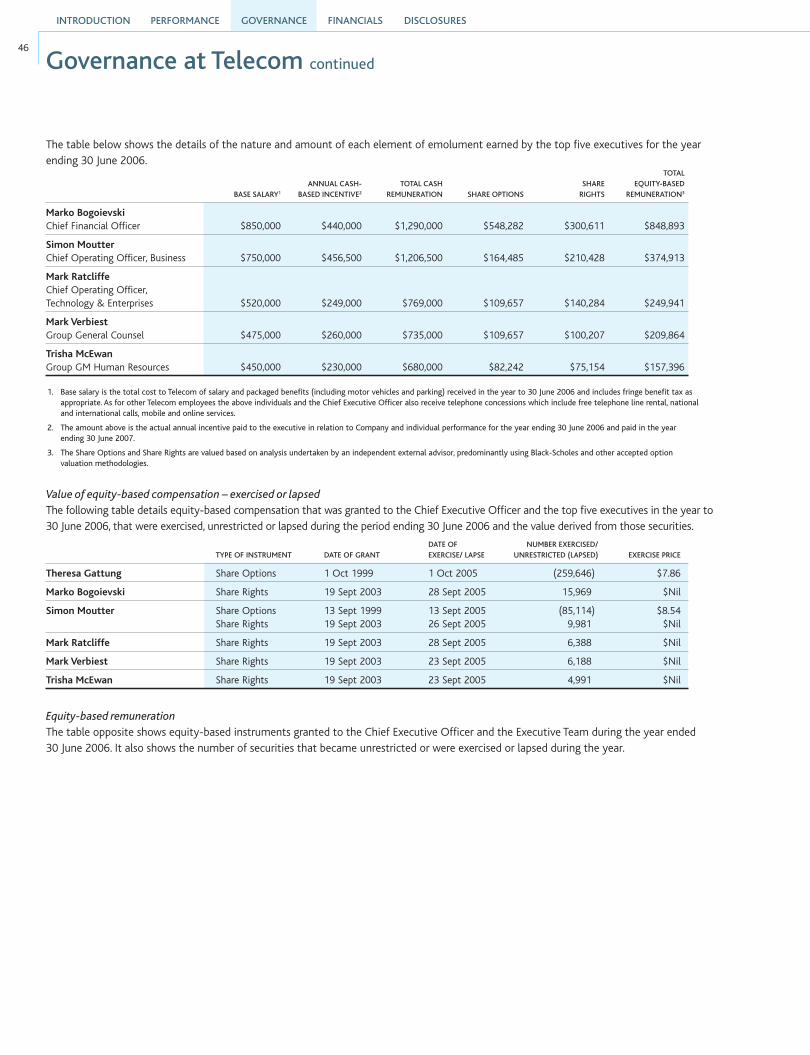
The table below shows the details of the nature and amount of each element of emolument earned by the top fi ve executives for the year ending 30 June 2006.
BASE SALARY1
ANNUAL CASH- BASED INCENTIVE2
TOTAL CASH REMUNERATION SHARE OPTIONS
SHARE RIGHTS
TOTAL EQUITY-BASED
REMUNERATION3
Marko BogoievskiChief Financial Officer $850,000 $440,000 $1,290,000 $548,282 $300,611 $848,893
Simon MoutterChief Operating Officer, Business $750,000 $456,500 $1,206,500 $164,485 $210,428 $374,913
Mark RatcliffeChief Operating Officer, Technology & Enterprises $520,000 $249,000 $769,000 $109,657 $140,284 $249,941
Mark VerbiestGroup General Counsel $475,000 $260,000 $735,000 $109,657 $100,207 $209,864
Trisha McEwanGroup GM Human Resources $450,000 $230,000 $680,000 $82,242 $75,154 $157,396
1. Base salary is the total cost to Telecom of salary and packaged benefits (including motor vehicles and parking) received in the year to 30 June 2006 and includes fringe benefit tax as appropriate. As for other Telecom employees the above individuals and the Chief Executive Officer also receive telephone concessions which include free telephone line rental, national and international calls, mobile and online services.
2. The amount above is the actual annual incentive paid to the executive in relation to Company and individual performance for the year ending 30 June 2006 and paid in the year ending 30 June 2007.
3. The Share Options and Share Rights are valued based on analysis undertaken by an independent external advisor, predominantly using Black-Scholes and other accepted option valuation methodologies.
Value of equity-based compensation – exercised or lapsedThe following table details equity-based compensation that was granted to the Chief Executive Offi cer and the top fi ve executives in the year to 30 June 2006, that were exercised, unrestricted or lapsed during the period ending 30 June 2006 and the value derived from those securities.
TYPE OF INSTRUMENT DATE OF GRANTDATE OF EXERCISE/ LAPSE
NUMBER EXERCISED/UNRESTRICTED (LAPSED) EXERCISE PRICE
Theresa Gattung Share Options 1 Oct 1999 1 Oct 2005 (259,646) $7.86
Marko Bogoievski Share Rights 19 Sept 2003 28 Sept 2005 15,969 $Nil
Simon Moutter Share OptionsShare Rights
13 Sept 199919 Sept 2003
13 Sept 200526 Sept 2005
(85,114)9,981
$8.54$Nil
Mark Ratcliffe Share Rights 19 Sept 2003 28 Sept 2005 6,388 $Nil
Mark Verbiest Share Rights 19 Sept 2003 23 Sept 2005 6,188 $Nil
Trisha McEwan Share Rights 19 Sept 2003 23 Sept 2005 4,991 $Nil
Equity-based remunerationThe table opposite shows equity-based instruments granted to the Chief Executive Offi cer and the Executive Team during the year ended 30 June 2006. It also shows the number of securities that became unrestricted or were exercised or lapsed during the year.
Governance at Telecom continued
INTRODUCTION PERFORMANCE GOVERNANCE DISCLOSURESFINANCIALS
46

47
Theresa GattungShare Options – pre September 2003 1,500,000 N/A N/A N/A 259,646 N/A 1,240,354 $4.70-$6.77 1/9/02 -1/9/05 1/9/06-1/9/08
Performance Options 1,000,000 500,000 N/A N/A N/A N/A 1,500,000 $5.01-$5.93 19/9/06-16/9/08 19/9/09 -19/9/11
Performance Shares 74,065 66,126 N/A N/A N/A N/A 140,191 Nil 1/9/07-16/9/08 N/A
Marko BogoievskiShare Options – pre September 2003 946,805 N/A N/A N/A N/A N/A 946,805 $4.70-$6.77 1/9/01-1/9/05 1/9/06-1/9/08
Share Options – post September 2003 752,837 818,331 N/A N/A N/A N/A 1,571,168 $5.01-$6.11 19/9/05 -16/9/08 19/9/09-16/9/11
Share Rights 97,907 60,607 N/A N/A N/A 15,969 142,545 Nil 19/9/06-16/9/08 19/12/06-16/12/08
Ordinary Shares 29,810 N/A 20,053 N/A N/A N/A 49,863 N/A N/A N/A
Simon MoutterShare Options – pre September 2003 700,532 N/A N/A N/A 85,114 N/A 615,418 $4.70-$6.77 1/9/01-1/9/05 1/9/06-1/9/08
Share Options – post September 2003 460,019 245,500 N/A N/A N/A N/A 705,519 $5.01-$6.11 19/9/05 -16/9/08 19/9/09-16/9/11
Share Rights 60,143 42,425 N/A N/A N/A 9,981 92,587 N/A 19/9/06-16/9/08 19/12/06-16/12/08
Ordinary Shares 9,086 N/A 9,981 N/A N/A N/A 19,067 N/A N/A N/A
Mark RatcliffeShare Options – pre September 2003 398,167 N/A N/A N/A N/A N/A 398,167 $4.70-$6.77 1/9/01-1/9/05 1/9/06-1/9/08
Share Options – post September 2003 301,136 163,667 N/A N/A N/A N/A 464,803 $5.01-$6.11 19/9/05-16/9/08 19/9/09-16/9/11
Share Rights 39,164 28,283 N/A N/A N/A 6,388 61,059 Nil 19/9/06-16/9/08 19/12/06-16/12/08
Ordinary Shares 10,146 N/A 6,388 N/A N/A N/A 16,534 N/A N/A N/A
Mark VerbiestShare Options – pre September 2003 281,003 N/A N/A N/A N/A N/A 281,003 $4.70-$5.78 15/11/01-1/9/05 15/11/06-1/9/08
Share Options – post September 2003 275,968 163,667 N/A N/A N/A N/A 439,635 $5.01-$6.11 19/9/05-16/8/08 19/9/09-16/9/11
Share Rights 36,364 20,203 N/A N/A N/A 6,188 50,379 Nil 19/9/06-16/9/08 19/12/06-16/12/08
Ordinary Shares 6,845 N/A 6,188 N/A N/A N/A 13,033 N/A N/A N/A
Trisha McEwanShare Options – pre September 2003 175,911 N/A N/A N/A N/A N/A 175,911 $4.94-$5.27 1/3/03-1/9/05 1/3/08-1/9/08
Share Options – post September 2003 230,010 122,750 N/A N/A N/A N/A 352,760 $5.01-$6.11 19/9/05-16/9/08 19/9/09-16/9/11
Share Rights 30,073 15,152 N/A N/A N/A 4,991 40,234 Nil 19/9/06-16/9/08 19/12/06-16/12/08
Ordinary Shares 3,254 N/A 5,098 N/A N/A N/A NIL N/A N/A N/A
1. Share options granted under the Telecom Share Option Scheme comprise options to acquire fully paid ordinary shares issued by Telecom. Vesting of options issued post September 2003 are subject to satisfying the cost of equity performance hurdle described in section 2.4 above. All options have a six-year life from the date of grant. The exercise price is the average end of day market price of Telecom’s shares reported on NZSX in the month immediately preceding the grant date. Share rights have been granted under the Telecom Share Rights Scheme. Scheme participants are granted rights to purchase Telecom shares at a nil cost strike price. Generally rights granted under the Share Rights Scheme cannot be exercised for a three-year period. Each share right vesting entitles the holder to one ordinary share in Telecom. The options and rights will be exercisable at the end of the restricted period only if the individual is still employed by Telecom, except in special circumstances.
2. Shareholder approval at the Annual Meeting in 2003 was obtained in order to grant Ms Gattung up to 1,500,000 options over the following three years. Pursuant to that approval, 500,000 options were granted in November 2003 effective 19 September 2003, a further 500,000 in September 2004 and a further 500,000 in September 2005 with exercise subject to satisfaction of performance hurdles. If her employment ceases for any reason (except as described below) then the Board will have the discretion to allow her up to 12 months to exercise any options that have been granted prior to the cessation of her employment and the discretion to waive any related performance hurdles. However, if she resigns or her employment is terminated for cause then all options that have not reached the three year anniversary date will immediately lapse. She has 12 months from the date of termination to exercise any other options, but only if the relevant performance hurdle is satisfied. The options have a six-year term from the date of issue and may be exercised following the third anniversary of that date subject to meeting the relevant performance hurdle. All grants are at the discretion of the Board within the context of the approval granted by shareholders and in no case will be later than three years after the date of the 2003 Annual Meeting of Shareholders. The Board has determined that no options will be issued to Ms Gattung in the 2006-07 year.
3. Marko Bogoievski and Trisha McEwan acquired ordinary shares during the year through the acquisition of shares under the Dividend Reinvestment Plan.
NU
MBE
R H
ELD
AT
STA
RT O
F Y
EAR
NU
MBE
R
GR
AN
TED
DU
RIN
G
THE
YEA
R A
S R
EMU
NER
ATIO
N
NU
MBE
R V
ESTE
D/
AC
QU
IRED
NU
MBE
R
UN
RES
TRIC
TED
D
UR
ING
TH
E Y
EAR
NU
MBE
R L
APS
ED
DU
RIN
G T
HE
YEA
R
NU
MBE
R
EXER
CIS
ED
DU
RIN
G T
HE
YEA
R
NU
MBE
R H
ELD
AT
THE
END
OF
THE
YEA
R
EXER
CIS
E PR
ICE
RA
NG
E
EAR
LIES
T PO
SSIB
LE
EXER
CIS
E D
ATE/
TRA
NSF
ER D
ATE
RA
NG
E
EXPI
RY D
ATE
RA
NG
E

INTRODUCTION PERFORMANCE GOVERNANCE DISCLOSURESFINANCIALS
48 Management Commentary
Telecom reported a net loss of $435 million for the year ended 30 June 2006 (‘2006’) compared to net earnings of $967 million for the year ended 30 June 2005 (‘2005’). The reported net loss reflected abnormal impairment charges totalling $1,291 million (net of a small associated tax credit) to write down the carrying value of Telecom’s Australian Operations to their fair value based on forecast future cash flows.
Excluding the impact of abnormal items, adjusted net earnings for the year ended 30 June 2006 of $820 million represent a decrease of 4.3% on adjusted earnings for the year ended 30 June 2005 of $857 million.
Results for Telecom’s NZ Operations strengthened, with growth in EBITDA of 2.7% for 2006. This reflected robust growth in broadband and internet, mobile, IT services and directories revenue, partly offset by declining revenues in Telecom’s traditional calling business, and moderate growth in costs. Results for Australian Operations continued to reflect a difficult competitive environment, with EBITDA for 2006 of A$75 million compared to A$152 million for 2005.
Reported results are summarised in the table below.
Telecom Group Reported Earnings
2006 2005 ChangeYEAR ENDED 30 JUNE $m $m %
Operating revenues (excluding abnormals) 5,755 5,650 1.9
Operating expenses (excluding abnormals) (3,558) (3,402) 4.6
Abnormal items (1,275) 95 NM
EBITDA* 922 2,343 (60.6)
Depreciation and amortisation (705) (698) 1.0
Earnings before interest and tax 217 1,645 (86.8)
Net interest expense (254) (289) (12.1)
(Loss)/earnings before tax (37) 1,356 (102.7)
Tax expense (394) (386) 2.1
Minority interest (4) (3) 33.3
Net (loss)/earnings (435) 967 (145.0)
*Earnings Before Interest, Tax, Depreciation and Amortisation.NM = Not a Meaningful comparison
The reported net loss for 2006 included the following abnormal items: Telecom recorded impairment charges totalling $1,301 million ($1,291 million net of a small associated tax credit) in respect of its Australian Operations in 2006, resulting from reviews that determined that the carrying value exceeded the stand-alone fair value of the business (calculated on a value in use basis). The decline in value is a consequence of a number of negative trends that are adversely affecting the short and long term earnings outlook for Australian Operations, in particular:
− a significant tightening of wholesale prices and terms with Telstra (the principal supplier to Telecom’s Australian Operations)
− continued downward pressure on retail prices
− the deferral of major project expenditure by key corporate customers.
As a result of these impairment charges, all remaining goodwill resulting from Telecom’s acquisition of AAPT has been written off. The remainder of
the write-down was applied against property, plant and equipment, as well as some smaller adjustments to current assets where realisation was no longer considered likely
On 23 December 2005 Telecom acquired a 100% shareholding in SCCL, a wholly-owned subsidiary of Southern Cross Cables, in which Telecom holds a 50% shareholding. SCCL’s sole asset at the time of acquisition was a tax operating loss carryforward. The value of the tax loss carryforward was $70 million and Telecom’s acquisition cost was $10 million. The value in excess of Telecom’s acquisition cost has been reflected as a gain in the Group’s consolidated Income Statement for the year ended 30 June 2006.
a charge of $22 million ($15 million after tax) was recognised in relation to inter-carrier and regulatory matters. This was made up of a settlement of $17.5 million agreed with TelstraClear Limited in January 2006 to resolve a number of longstanding commercial issues (principally involving backdating of pricing) between the two companies, and a one-off adjustment to the accrued Telecommunications Service Obligation (‘TSO’) receivable to reflect a determination by the Commerce Commission; and
Telecom provided $7 million ($5 million after tax) for the estimated potential liability that would result from unsuccessful outcomes relating to historic issues under the Fair Trading Act. Telecom has also recognised an expense of $5 million ($4 million after tax) for the cost of terminating an agreement with Hutchison Whampoa Limited.
Reported net earnings for 2005 included the following abnormal items: fees were payable to Telecom by Southern Cross in return for the provision of support by Telecom for Southern Cross’ bank debt. Telecom initially did not recognise these fees as collectability was considered uncertain. Following significant improvements in the financial position of Southern Cross, Telecom recognised total fees payable of $41 million ($37 million net of tax) in March 2005, representing fees for the period from April 2003 to March 2005. All accrued fees have since been paid by Southern Cross
an abnormal charge of $31 million ($21 million net of tax) was recognised in March 2005 by Telecom’s Australian subsidiary AAPT, following an extensive reassessment of accruals and provisions for disputes in the inter-carrier area. The charge was a one-off adjustment required to revise cost of sale accrual assumptions and to adjust the carrying value of disputed amounts receivable to amounts considered recoverable
in March 2005 Telecom received $22 million for the sale of its stake in Intelsat resulting in a gain on sale of $8 million
in September 2004 Telecom completed the sale of 15 of its business-focused retail stores to the Leading Edge Group for $16 million, resulting in a gain on sale of $10 million
Telecom issued $300 million of convertible notes in 2001. Telecom repurchased these notes in two tranches in 2005. Due to market movements since the notes were issued, the amount required to buy the notes back was $291 million, resulting in a gain on buyback of $9 million
in June 2005, Telecom sold its entire stake in Independent Newspapers Limited (‘INL’) for $272 million, resulting in a gain on sale of $86 million
Telecom recorded an impairment charge of $24 million ($16 million after tax) at 30 June 2005 to write the value of its TDMA mobile network down to nil, reflecting the acceleration of the migration of customers from TDMA to the newer CDMA network
following the purchase of Gen-i and Computerland, a number of savings were identified through the combination of these businesses. Costs of $4 million ($3 million net of tax) were incurred to achieve these savings.
Note: Other than the analysis of the results of Australian Operations, which is presented in Australian dollars (‘AUD’), all monetary amounts in this management commentary are expressed in New Zealand dollars (‘NZD’) unless otherwise stated. The prior period comparative results have been restated to comply with New Zealand equivalents to International Financial Reporting Standards (‘NZ IFRS’), which Telecom adopted from 1 July 2005.
Overview of Consolidated Results
49
The adjustments to remove abnormal items are shown in the table below.
Adjustments to Reported Net (Loss)/Earnings
2006 2005 ChangeYEAR ENDED 30 JUNE $m $m %
Reported net (loss)/earnings (435) 967 (145.0)
Adjusted for:
Australian Operations write-down* 1,291 –
Gain on acquisition of SCCL (60) –
Inter-carrier and regulatory costs* 15 21
Provision for contractual settlements* 9 –
Recognition of Southern Cross support fees* – (37)
Gain on sale of Intelsat – (8)
Gain on sale of retail stores – (10)
Gain on buyback of convertible note – (9)
Gain on sale of INL – (86)
Write-down of TDMA network* – 16
Provision for restructuring* – 3
Adjusted net earnings 820 857 (4.3) *Figures are net of tax. Other abnormal items are not subject to tax.
Telecom’s adjusted earnings are summarised in the table below.
Telecom Group Adjusted Earnings
2006 2005 ChangeYEAR ENDED 30 JUNE $m $m %
Adjusted operating revenues 5,755 5,650 1.9
Adjusted operating expenses (3,558) (3,402) 4.6
Adjusted EBITDA* 2,197 2,248 (2.3)
Depreciation and amortisation (705) (698) 1.0
Adjusted earnings beforeinterest and tax 1,492 1,550 (3.7)
Net interest expense (254) (289) (12.1)
Adjusted earnings before tax 1,238 1,261 (1.8)
Adjusted tax expense (414) (401) 3.2
Minority interest (4) (3) 33.3
Adjusted net earnings 820 857 (4.3) *Earnings Before Interest, Tax, Depreciation and Amortisation.
The reduction in adjusted net earnings for 2006 reflected a significant decline in earnings from Australian Operations, mainly as a result of the previously discussed adverse changes in the competitive environment and wholesale arrangements. Earnings from Telecom’s NZ Operations strengthened as mobile, broadband and internet, IT services and directories revenues remained robust, while expense growth moderated.
Adjusted operating revenues of $5,755 million for 2006 increased by $105 million (1.9%) compared to 2005. The growth included the acquisition of Computerland (effective 1 September 2004) which increased IT services revenue in the first two months of 2006 by $19 million. Broadband and internet revenue also grew, reflecting increased broadband penetration. Growth
in mobile revenue of $68 million in NZ Operations, resulting from growth in the customer base and penetration of mobile data services, was partly offset by a $34 million decline in mobile revenue in Australian Operations. Growth across these revenue categories has been partly offset by lower calling and local service revenues.
Adjusted operating expenses increased by $156 million (4.6%), with the majority of the increase occurring in NZ Operations as a result of business growth. The aforementioned acquisition of Computerland also added $18 million to operating expenses in 2006 compared to 2005. Operating expenses in Australian Operations increased as a result of investment in strategic initiatives including the opening of new telesales centres and a significant increase in advertising expenditure to promote new product initiatives.
Depreciation and amortisation expense increased slightly as a result of capital expenditure exceeding the depreciation and amortisation charge.
The decrease in net interest expense is the result of deleveraging in prior periods. However, with increased shareholder distributions, debt levels remained relatively stable in 2006 and hence further reduction in net interest expense is not expected. Tax expense for 2006 increased in line with higher earnings in NZ Operations. No tax effect was recognised on Australian Operations results for the majority of 2006 due to their loss-making position. Adjusted tax expense for 2006 represented an effective tax rate of 33.4%, in line with the New Zealand corporate tax rate of 33%.
Key TrendsTelecom’s operating results for 2006 largely reflected the evolution of significant trends evident in 2005 performance as a result of shifts occurring in its business. Recent financial performance and operating trends will, however, prove a less reliable guide to future performance, as the effect of recent regulatory announcements in New Zealand begin to take effect. In May 2006, the New Zealand Government announced a comprehensive set of proposed changes to telecommunications regulation. These changes include proposals to extend the range of regulated wholesale broadband services and introduce local loop unbundling (‘LLU’) to the New Zealand marketplace. In addition, the Government has recently scheduled reviews of mobile market regulation, and signalled an intention to conduct a review as to whether some form of operational or structural separation model for Telecom is warranted.
The Telecommunications Amendment Bill was introduced to the New Zealand Parliament on 29 June 2006, and at this stage it is too early to predict final outcomes regarding key pricing and service requirements. The process of finalising the legislation and implementing the detailed recommendations is expected to take the majority of the 2006-07 financial year. While the legislative and regulatory timetable suggest that the direct effects of the new regulatory regime may not be felt until 2007-08 fiscal year, Telecom is likely to proactively reset its strategies to reposition itself for the new environment. These strategies will directly impact capital and operating plans in 2006-07.
New Zealand Operations Strong growth in mobile voice and data revenue continues, with an increase of 12.1% in 2006. This has been the result of significantly enhanced uptake of mobile data services, with growth in mobile data revenues of 54.1%. One of the key drivers was very strong connection growth. Excluding a one-off adjustment to the TDMA customer base, additional net connections for 2006 were 301,000, taking Telecom’s total connection base to 1,703,000 at 30 June 2006.
Market penetration of mobile connections is trending towards 100% and the rate of penetration growth is expected to slow in the near to medium term. Future mobile data revenue growth is expected to be driven more by applications and content than by text messaging (which is currently the most significant driver). Future mobile voice revenues will be driven by share of connections and rate of substitution from fixed line services. As an integrated operator, Telecom also has a focus on the convergence of fixed and mobile services, which is expected to gain momentum in future periods.
INTRODUCTION PERFORMANCE GOVERNANCE DISCLOSURESFINANCIALS
50
New converged product offerings were released into the market in the current financial year.
The Government’s current review of mobile market regulation is likely to increase competitive intensity in the mobile market, and place further pressure on retail and wholesale prices. While the exact form of regulation is currently unknown, the objectives of the review appear to focus on facilitating the entry of new competitors, and encouraging the formation of wholesale mobile virtual network operator (‘MVNO’) models.
Significant growth in uptake of broadband services in New Zealand has also continued. Total broadband connections increased by 177,000 to 435,000 at 30 June 2006. New broadband offerings released in 2006 have stimulated further growth in the broadband customer base. A wholesale agreement was also reached with TelstraClear in January 2006, which should drive further growth of the wholesale broadband market.
The introduction of Unconstrained Bitstream Services (‘UBS’), naked DSL and LLU are likely to have the effect of accelerating the rate of broadband penetration, and may result in further downward pressure on wholesale and retail broadband prices. More importantly, the advent of naked DSL and LLU pose threats to Telecom’s fixed line access relationship with customers, and could accelerate the rate of decline in traditional telephony services such as calling.
Longer term, Telecom has announced that it will invest in ADSL2+ technology to deliver the next generation of broadband services, ensuring that broadband will remain a key driver of Telecom’s results in the future.
Telecom’s IT services business continues to grow following the successful integration of the acquired Gen-i and Computerland businesses with Telecom’s existing IT services business under the Gen-i brand. In 2006, Telecom has seen an improved contribution from the merged Gen-i business as a result of the benefits of integration. Telecom currently believes that the IT services market has the potential to grow faster than the traditional telecommunications market and accordingly, sees this segment as a potential source of future growth for the Group.
Directories revenue continues to display solid growth as a result of volume and price increases for printed directories. Telecom currently expects an increasing amount of revenue to be derived from online directory and search services in the future.
Offsetting these growing parts of the business, Telecom’s traditional calling business continues to decline due to ongoing product substitution and competitive pressure. Excluding the impact of international transit revenue, the decrease in calling revenue in NZ Operations was 6.8% in 2006.
The rate of decline in calling is expected to be impacted by the introduction of naked DSL and LLU regulated services. Refer to the previous discussion on broadband services above.
The overall operating margin percentage in the New Zealand business continues to come under pressure, given the shift in revenue mix from the high-margin traditional calling business to lower margin new business (particularly the IT services business, which is less capital intensive than Telecom’s traditional business). The growth in the mobile and broadband customer bases also continues to have a negative short-term impact on costs and margins, driving significantly greater customer acquisition and provisioning costs and necessitating investment in additional customer service capability.
In light of these factors, particularly the decline in the calling business, Telecom is pursuing operating cost efficiency initiatives to offset the negative impact of these trends. Longer term, Telecom is seeking to redesign its operating model to a fundamentally lower cost approach in order to maintain satisfactory operating margins.
Australian Operations Competitive conditions impacting on Telecom’s Australian Operations continue to be highly challenging. Retail prices continue to decline across all products, while wholesale prices have risen sharply following revisions to key supplier arrangements. This has resulted in a substantial decline in margins. These negative trends have been exacerbated by a deferral of project spend
by Telecom’s enterprise customers. As a result of the revisions to key supplier arrangements, AAPT is currently managing a number of disputes with suppliers. Financial results reflect management’s best estimate of expected outcomes, however final resolution of the disputes could have a further adverse impact on ongoing earnings.
Australian mobile revenue has continued to decline following the strategic decision in 2004 to cease selling mobile as a stand-alone product and instead focus on selling customers bundles of multiple products. The sale of AAPT’s prepaid mobile base in 2006 further reduced the number of stand-alone mobile customers. AAPT has, however, grown the percentage of its consumer bundled customer to 51.0% at 30 June 2006, an increase of 75.7% from 30 June 2005.
To respond to the challenges that the Australian operations are facing, further significant investment has been made in sales, customer service and IT capabilities in AAPT in order to support improved customer acquisition and retention. This investment has had a negative impact on costs and free cash flow in the short-term. This investment continues in 2006-07, and is part of a comprehensive strategic programme designed to fundamentally reposition AAPT services in the consumer and small enterprise market.
The continuation of the negative factors impacting Australian Operations has resulted in the write-down in the carrying value of Telecom’s Australian Operations as discussed above.
Future ExpectationsAs discussed in the ‘Key Trends’ section, expectations around Telecom’s future financial and operating performance have been materially impacted by the recently announced proposed changes to telecommunications regulation in New Zealand. While the specific changes have yet to be finalised, the cumulative effect of the proposed changes is likely to place downward pressure on operating margins and retail market share.
While the exact form of regulation, timetable for implementation, and likely competitor responses are uncertain, Telecom has begun to revise its strategies to proactively respond to the changes in the new environment. Specifically, Telecom intends to:
increase the level of investment and service offerings designed to attract high value customers to integrated service packages
further address the efficiency of current business processes
accelerate the introduction of the Next Generation Telecom (‘NGT’) business model. This model is a longer-term programme designed to fundamentally reduce the operating cost structure of the future business via a radical simplification of consumer and business offers and the construction of a next generation access network with related enhancements in service, provisioning, and product development capability.
Telecom proposes to implement a form of operational separation as a response to the new regulatory environment. The proposed model would operationally separate the Wholesale business unit from the retail business units, and reinforce the separation with legally binding undertakings, independent and auditable oversight, and other structural changes designed to support non-discriminatory treatment of competitors.
The following expectations of future performance are current as at August 2006. Uncertain future events including clarification of proposed changes to telecommunications regulation, changes in economic and market conditions, competitor activity and other significant factors as well as the further development of Telecom’s own strategies may necessitate the revision of these expectations as the 2007 financial year progresses.
For the year ending 30 June 2007 (2007), Telecom currently expects the following impacts in the New Zealand business:
an increase in the rate of broadband acquisition. Telecom is currently targeting 500,000 retail DSL broadband business and consumer customers by 30 June 2007
a moderation in the growth rate of mobile service revenues. The mobile
Management Commentary continued
51
market is approaching 100% penetration levels, and is subject to a pending review of mobile market regulation
the cumulative impact of the underlying trends, direct regulatory effects, and investments in revised strategies is currently expected to be a decline in 2007 EBITDA for New Zealand operations of 1.5 to 3.0% compared to 2006.
For 2007, Telecom currently expects the following outcomes in the Australian business:
EBITDA broadly consistent with 2006 levels of A$75 million. Telecom has yet to conclude new commercial arrangements for certain carrier costs and other network services, and therefore anticipates the potential for ongoing material variability in forecasts for Australian Operations during 2007.
Telecom currently expects net earnings after tax, excluding abnormal items, for 2007 to be within the range of $820 million to $860 million.
Telecom’s current capital expenditure forecast for 2007 is approximately $800 million. Group depreciation and amortisation expense for 2007 is expected to be within the range of $650 million to $670 million, of which $570 million to $585 million relates to New Zealand and $80 million to $85 million relates to Australia. The majority of the impairment charge in respect of the Australian operations at 30 June 2006 was applied against property, plant and equipment, and as a result, depreciation expense in 2007 will be at correspondingly lower levels.
Dividend Policy and Long-term Capital ManagementThe Board continues to be committed to Telecom maintaining strong ‘single A’ credit ratings from Moody’s Investors Service, and Standard and Poor’s and its capital management policies are designed to ensure this objective is met. Relevant factors include Telecom’s debt profile, operating outlook, cash flow, cost of capital, and level of imputation credits. As a guide, the Board expects Telecom to maintain a relatively stable capital structure with the intention that, in normal circumstances, the ratio of gross debt to EBITDA would not materially exceed 1.7 times on a long-run basis.
Based on Telecom’s current expectations for the next twelve months, the target dividend payout ratio for the financial year ended 30 June 2007 will be 75% of net earnings, adjusted for relevant non-cash items. This dividend payout target reflects that 2007 net earnings will benefit from reduced depreciation charges following the impairment charge in respect of the Australian operations. Adjusted for the impact of lower depreciation expense in Australia in 2007, the target dividend payout ratio would remain constant at 85%. Dividends for the first three quarters of the year are expected to be 7.0 cps with the fourth quarter dividend set to achieve the target full year payout ratio.
The Dividend Reinvestment Plan has been retained. Effective from the final dividend payment for 2006, a 3% discount to the prevailing market price will be applied to shares issued under the Dividend Reinvestment Plan. The Company will also cease its previous practice of buying back an equivalent number of shares on-market to eliminate an increase in capital arising from the plan.
Overview Of Geographic ResultsTelecom operates integrated businesses in New Zealand and Australia. Reporting therefore principally reflects the integrated nature of the business. Factors impacting Telecom’s NZ Operations differ significantly from those impacting Telecom’s Australian Operations due to differences in the characteristics of the markets in which they operate, their competitive positions, their stages of maturity and the scope of their operations. Accordingly, the discussion of financial performance that follows separately discusses New Zealand and Australian results.
Corporate expenses are not allocated to the operating segments and are included separately in a Corporate and Other category, along with other items that management excludes in assessing segment performance due primarily to their non-recurring and/or non-operational nature.
Telecom measures and evaluates the operating segments based on earnings from operations (defined as earnings before interest and tax, excluding abnormal items).
Telecom’s earnings from operations excluding abnormal items for 2006 were $1,492 million, compared to $1,550 million for 2005. The table below shows the breakdown of earnings by operating segment.
2006 2005 ChangeYEAR ENDED 30 JUNE $m $m %
Earnings from operations
NZ Operations 1,699 1,639 3.7
Australian Operations (85) 3 NM
Corporate and other (122) (92) (32.6)
Telecom Group 1,492 1,550 (3.7)
NM = Not a Meaningful comparison.
NZ OperationsWithin its integrated NZ Operations, Telecom provides fixed line and value added services for voice and data communications, wireless services for voice and data communications, calling and managed data network services between New Zealand, Australia and the rest of the world, internet access and online services, IT services and directories publishing.
The results for NZ Operations are set out in the table below.
2006 2005 ChangeYEAR ENDED 30 JUNE $m $m %
Operating revenues
Local service 1,049 1,063 (1.3)
Calling 976 994 (1.8)
Interconnection 162 163 (0.6)
Mobile 774 706 (9.6)
Data 438 414 5.8
Broadband and internet 336 285 17.9
IT services 346 308 12.3
Directories 248 229 8.3
Other operating revenue 110 117 (6.0)
Internal revenue 72 61 18.0
4,511 4,340 3.9
Operations and support expenses
Labour 531 504 5.4
Inter-carrier costs 500 468 6.8
Other operating expenses 1,236 1,181 4.7
Internal expenses 19 21 (9.5)
2,286 2,174 5.2
EBITDA 2,225 2,166 2.7
Depreciation 411 416 (1.2)
Amortisation 115 111 3.6
Earnings from operations 1,699 1,639 3.7
INTRODUCTION PERFORMANCE GOVERNANCE DISCLOSURESFINANCIALS
52
Further analysis of the NZ Operations result follows.
Local Service Revenue
YEAR ENDED 30 JUNE 2006 2005 Change %
Total local service revenue ($m) 1,049 1,063 (1.3)
Access Lines
Residential (000s) 1,414 1,417 (0.2)
Business (000s) 303 305 (0.7)
Centrex (000s) 66 68 (2.9)
Local service revenue decreased by $14 million (1.3%) in 2006. The decrease for 2006 is largely due to a decline in local call revenues of $12 million (14.3%) due to businesses migrating from dial-up internet access to broadband (with a corresponding shift in revenue from local service to broadband and internet) and declining call volumes as a result of competitive pressure. Access revenues decreased by $2 million (0.2%) with the effect of a minor decrease in total access lines and a small shift from retail to wholesale partly offset by a small increase in charges in March 2006 in line with movements in the Consumer Price Index.
Calling Revenue
YEAR ENDED 30 JUNE 2006 2005 Change %
Calling revenue
National ($m) 586 623 (5.9)
International outward ($m) 128 137 (6.6)
International inward ($m) 33 44 (25.0)
International transits ($m) 182 142 28.2
Other calling ($m) 47 48 (2.1)
976 994 (1.8)
Call minutes
National (m) 3,238 3,304 (2.0)
International outward (m) 641 574 11.7
International inward (m) 656 700 (6.3)
Transits (m) 2,836 1,867 51.9
Total national calling revenue (including national calls, calls to mobile networks, and national 0800) decreased by $37 million (5.9%) in 2006. Revenue from national calls decreased by $24 million (11.1%) with competitive pressure in retail and wholesale driving 8.0% lower average prices. Revenue from calls to mobile networks decreased $4 million (1.3%). Average prices decreased 4.3%, partly offset by a 3.2% increase in call minutes. National 0800 revenue decreased by $8 million (8.2%) largely driven by lower average prices, along with lower call minutes.
International calling revenue for NZ Operations comprises outward calling revenue, where New Zealand customers make calls originating in New Zealand and terminating overseas; inwards calling revenue, where calls originated by overseas carriers terminate on Telecom’s networks; and transit calling revenue, where Telecom acts as an intermediary carrier of international calls.
International calling revenue increased due to an increase in gross transit revenues. Excluding transit revenues, international calling declined 11.0% in 2006.
Outwards calling revenue decreased by $9 million (6.6%), with the impact of higher volumes more than offset by lower average prices, due largely to the impact of competition. Inwards calling revenue decreased by $11 million (25.0%) with both volumes and prices declining. The decrease in average price was largely due to a change in volume mix with a reduced proportion of higher rate mobile terminating minutes.
As a result of the adoption of International Financial Reporting Standards on 1 July 2005, transit revenues are now presented gross, with the corresponding costs included within inter-carrier costs. Previously only the net transit margin was included within international revenue. The gross presentation introduces some volatility into reported revenues and inter-carrier costs due to the nature of this business. Transit revenue increased by $40 million (28.2%) in 2006 as a result of strong volume growth. As margins per minute have declined in a tight market, volume growth has been required to grow overall margin from the transit business. This strong growth in volumes results in a corresponding increase in international settlement costs (see ‘Inter-carrier Costs’).
Interconnection RevenueInterconnection revenue decreased by $1 million (0.6%) in 2006. A small decrease in PSTN interconnection revenues was offset by a volume-driven increase in mobile interconnection.
Mobile Revenue
YEAR ENDED 30 JUNE 2006 2005 Change %
Mobile revenue
Voice revenue ($m) 526 511 2.9
Data revenue ($m) 171 111 54.1
Other mobile ($m) 77 84 (8.3)
774 706 9.6
Call minutes (m) 1,349 1,248 8.1
ARPU* including interconnection ($ per month) 45.8 50.4 (9.1)
Total connections (000s) 1,703 1,601 6.4
*Average Revenue Per User.
Mobile revenue increased by $68 million (9.6%) in 2006. Mobile voice and data revenue together increased by $75 million (12.1%) reflecting growth in data revenues through higher data volumes. Voice revenues have increased as a result of a higher connection base. Call minutes for 2006 increased 8.1% primarily due to an increase in the connection base. Other mobile revenue decreased $7 million (8.3%), driven by lower average handset sale prices.
Mobile revenue excludes any revenue from terminating calls and text messaging from competitors’ networks, which is included in interconnection revenue.
Total ARPU including interconnection decreased by 9.1% in 2006, predominantly due to the decrease in postpaid ARPU and lower per user interconnection revenues (interconnection includes notional revenue for PSTN calls to Telecom mobile networks based on market rates).
Total connections of 1,703,000 at 30 June 2006 grew by 102,000 (6.4%) during the year from 1,601,000 at 30 June 2005. This movement includes a one-off write-down of 199,000 non-active TDMA connections from the base in anticipation of the TDMA network closure in March 2007. Excluding this adjustment, growth in the mobile base was 301,000 for the year. Of the 30 June 2006 total connection base, 42.7% were postpaid connections, while 57.3% were prepaid connections.
Management Commentary continued

53
Data Revenue
2006 2005 ChangeYEAR ENDED 30 JUNE $m $m %
Data revenue
Managed IP data services 161 133 21.1
Traditional data services 277 281 (1.4)
438 414 5.8
Data revenue growth for 2006 has been driven by increased managed IP data services, while revenue from traditional data services has declined.
Managed IP data services revenue increased by $28 million (21.1%). Private Office and high speed data provided the vast majority of this increase through growth in Private Office connectivity and increased management of customers’ private office networks, combined with some product migration.
Traditional data services revenue decreased by $4 million (1.4%) reflecting migration to managed IP data services.
Broadband and Internet Revenue
YEAR ENDED 30 JUNE 2006 2005 Change %
Broadband and internet revenue
Broadband revenue ($m) 266 194 37.1
Internet revenue ($m) 70 91 (23.1)
336 285 17.9
Connections
Broadband (000s) 435 258 68.6
Dial-up (000s) 310 374 (17.1)
745 632 17.9
Broadband and internet revenue increased by $51 million (17.9%) in 2006.Broadband revenue increased by $72 million (37.1%), driven by the
continued uptake of Telecom’s broadband service. Total broadband connections of approximately 435,000 at 30 June 2006 increased by 177,000 (68.6%) from 30 June 2005, with retail residential connections increasing 114,000, retail business connections increasing 17,000 and wholesale connections increasing 65,000, while resale connections decreased by 19,000 with the closure of the Jetstream partnering programme (which was replaced by full wholesale arrangements).
Internet revenue decreased $21 million (23.1%) in 2006 driven by the continued migration of customers from dial-up internet to broadband. Total dial-up internet connections of approximately 310,000 at 30 June 2006 decreased by 64,000 (17.1%) from 30 June 2005.
IT Services Revenue IT services revenue includes provision of network based application services, management of customers’ information, communication and technology services and integration of these services.
2006 2005 ChangeYEAR ENDED 30 JUNE $m $m %
IT services revenue
Procurement 146 100 46.0
Software solutions 17 21 (19.0)
IT solutions 156 152 2.6
Other 27 35 (22.9)
346 308 12.3
IT services revenue increased by $38 million (12.3%) for 2006. Included in this revenue growth is Computerland revenue of $19 million for July and August 2005 (Computerland was acquired by Telecom in September 2004). Excluding this Computerland revenue, underlying IT services revenue grew $19 million (6.2%) due to growth in the existing IT services business, particularly within procurement.
Directories Revenue Directories revenue of $248 million increased by $19 million (8.3%) in 2006, driven by both price and volume increases in print directories and increasing revenues from online services.
Other Operating Revenue Other operating revenue decreased by $7 million (6.0%) for 2006, due to reduced equipment sales and a number of other minor movements.
Internal RevenueNZ Operations internal revenue represents charges from the International group to AAPT for delivering AAPT’s international retail and wholesale voice traffic, the provision of international data circuits, and the supply of AAPT’s international internet services. Internal revenue increased by $11 million (18.0%) in 2006.
Operations and Support ExpensesLabour
YEAR ENDED 30 JUNE 2006 2005 Change %
Total labour expense ($m) 531 504 5.4
Total staff at 30 June 6,677 6,236 7.1
Labour expense increased by $27 million (5.4%) in 2006. Included within the increased labour expense is Computerland labour of $4 million for July and August 2005. Excluding Computerland labour, total labour costs increased by $23 million (4.6%), due to a combination of additional resources focused on key customer-related areas (including call centre support and frontline sales), insourcing core activities (broadband helpdesk and IT operations staff) and salary increases in line with market movements.
Personnel numbers of 6,677 at 30 June 2006 increased by 441 (7.1%) compared to 30 June 2005. This increase results from a move to build internal capability to support the IT capital programme, and increased resources to support strategic initiatives (including additional call centre support and frontline sales).

INTRODUCTION PERFORMANCE GOVERNANCE DISCLOSURESFINANCIALS
54
Inter-carrier Costs
2006 2005 ChangeYEAR ENDED 30 JUNE $m $m %
Inter-carrier costs
Land to mobile, mobile to 0800 interconnection 105 118 (11.0)
Mobile interconnection 112 107 4.7
International settlements 283 243 16.5
500 468 6.8
Inter-carrier costs increased by $32 million (6.8%) in 2006, largely due to increasing international settlement costs.
Land to mobile and mobile to 0800 interconnection decreased by $13 million (11.0%) due to reduced costs paid to interconnection carriers. Mobile interconnection increased by $5 million (4.7%) due to increased data volumes.
International settlement costs increased by $40 million (16.5%) in 2006. This increase reflects strong growth in international transit volumes (see ‘International Calling Revenue’ for the corresponding increase in transit revenue).
Other Operating Expenses
2006 2005 ChangeYEAR ENDED 30 JUNE $m $m %
Other operating expenses
Direct costs 234 244 (4.1)
Other sales costs 571 509 12.2
Computer costs 136 132 3.0
Advertising, promotion and communications 92 88 4.5
Accommodation costs 84 74 13.5
Other 119 134 (11.2)
1,236 1,181 4.7
Other operating expenses increased by $55 million (4.7%) in 2006. Included within the increase were other operating expenses associated with the Computerland business of $14 million for July and August 2005. Excluding the growth attributable to Computerland, other operating expenses increased $41 million (3.5%).
Direct costs decreased by $10 million (4.1%) with savings generated from the rationalisation of maintenance and provisioning contracts partly offset by increased provisioning costs associated with higher broadband connections.
Other sales costs increased by $62 million (12.2%). Included within the 2006 increase were other sales costs associated with the Computerland business of $12 million for July and August 2005. Excluding this, other sales costs increased $50 million (9.8%), largely as a result of increased mobile connections driving higher mobile acquisition costs and dealer commissions and increased costs associated with the growth in procurement revenues within IT services.
Other sales costs for IT services, excluding the growth attributable to Computerland, increased by $22 million (15.0%) in 2006 driven principally by growth in the procurement business. Broadband and internet, directories and other costs increased by $8 million (8.5%), largely due to the increase in broadband connections.
Accommodation costs increased by $10 million (13.5%) largely due to higher lease and rental costs and higher electricity costs.
Other expenses decreased by $15 million (11.2%) due to lower legal and training expenses, and higher foreign exchange gains.
Depreciation and AmortisationDepreciation and amortisation decreased by $1 million (0.2%) for 2006. A decline in the Wireless depreciation of $16 million (21.1%), due largely to the final impairment on the TDMA mobile network recorded in June 2005, was partly offset by an increase in wired depreciation reflecting the impact of recent capital expenditure.
Amortisation expense primarily relates to software assets, spectrum licences and international cable capacity.
Australian OperationsAustralian Operations comprise Consumer and Business marketing units, and shared support functions. The Australian Consumer unit includes the full range of fixed, internet, pay TV and mobile telecommunications services provided to residential and small business customers of AAPT. The Australian Business unit includes the full range of telecommunications services (voice, data and IP) provided to AAPT’s business, corporate, government and wholesale customers. Also included are the IT and telecommunications services provided by Gen-i Australia to corporate customers.
Reported NZD results for Australian Operations are impacted by movements in exchange rates. The AUD strengthened against the NZD for the year ended 30 June 2006 compared to the corresponding period in the prior year. This had a relatively minor impact on reported full year results. To eliminate the impact of exchange rates on year on year comparisons, the analysis of Australian Operations in this section is stated in Australian dollars.
The consolidated results for Australian Operations are set out in the tables below.
2006 2005 ChangeYEAR ENDED 30 JUNE A$m A$m %
Operating revenues
Local service 29 36 (19.4)
Calling 376 413 (9.0)
Interconnection 37 40 (7.5)
Mobile 86 123 (30.1)
Data 148 174 (14.9)
Broadband and internet 101 84 20.2
Resale 325 310 4.8
Other operating revenue 74 75 (1.3)
Internal revenue 16 16 –
1,192 1,271 (6.2)
Operations and support expenses
Labour 190 175 8.6
Inter-carrier costs 630 664 (5.1)
Other operating expenses 230 223 3.1
Internal expenses 67 57 17.5
1,117 1,119 (0.2)
EBITDA* 75 152 (50.7)
Depreciation 110 120 (8.3)
Amortisation 41 28 46.4
(Loss)/earnings from operations (76) 4 NM
*Earnings Before Interest, Tax, Depreciation and Amortisation.NM = Not a Meaningful comparison.
Management Commentary continued

55
Australian Operations have continued to operate in an intensely competitive market. AAPT continues to focus on the consumer and small enterprise market segments with an acceleration of investment in product development, indirect channels, telesales capability and business support and operating support systems. In 2006, capital expenditure of A$40 million has been made as part of these ongoing strategic initiatives. These initiatives have also had a negative impact on operating expenditure. Gen-i Australia continues to focus on the enterprise and Information Technology and Telecommunications segments.
There are a number of disputes and uncertainties between AAPT and the carriers it uses. The accounting treatment adopted reflects management’s assessment of the most likely outcome for all of the key disputes. These include:
AAPT’s previous contract with Telstra expired on 31 December 2005. Following this date, Telstra tabled revised contractual arrangements with adverse terms and conditions to the previous contract. AAPT and Telstra continue to discuss the basis of future supply arrangements and have been unable to reach agreement to date. The latest contractual offer from Telstra has subsequently been withdrawn by Telstra;
in addition to the change in contractual arrangements, wholesale residential line rental prices were increased by Telstra in December 2005. This increase was the basis of a dispute lodged with the Australian Competition and Consumer Commission (‘ACCC’), and in April 2006 the ACCC issued a competition notice against Telstra alleging anti-competitive conduct. AAPT has accounted for the consumer line rental costs at the historic rates;
there are a number of other substantive disputes with Telstra related to 1-900 charges and interconnect;
there is uncertainty around the timing and nature of the resolution of these disputes. As at 30 June 2006, approximately $28m was subject to dispute and being withheld. Management has separately estimated possible outcomes and accounted for inter-carrier costs accordingly; and
local call prices and local call override penalties have been accrued for based on the current Telstra agreement.
Further analysis of significant line items within results for Australian Operations follows.
Calling Revenue
YEAR ENDED 30 JUNE 2006 2005 Change %
Calling revenue
Consumer (A$m) 179 205 (12.7)
Business (A$m) 197 208 (5.3)
376 413 (9.0)
Call minutes
Consumer (m) 1,167 1,231 (5.2)
Business (m) 2,311 2,216 4.3
Within Consumer, calling revenues declined due to both lower volumes and lower average prices. The decline in volumes was recorded despite a 1.4% increase in the fixed line customer base and reflected fixed to mobile substitution. The decrease in average prices resulted from the impact of capped calling offers.
Within Business, calling revenues declined by 5.3% despite an increase in total call minutes. This reflected a change in mix, with a greater proportion of lower priced wholesale minutes and a lesser proportion of retail minutes.
Mobile Revenue
YEAR ENDED 30 JUNE 2006 2005 Change %
Mobile revenue
Consumer (A$m) 63 98 (35.7)
Business (A$m) 23 25 (8.0)
86 123 (30.1)
Total connections – Consumer only (000s) 162 158 2.5
Mobile revenue is predominately recorded within the Consumer division. In 2004 the decision was taken to cease selling mobile as a stand-alone product and only sell it as part of a bundle with other products. AAPT also sold its prepaid mobile base in 2006. This has resulted in a much higher proportion of bundled customers in the base, with bundled customers representing 63.6% of the total base at 30 June 2006, compared to 29.7% at 30 June 2005. Bundled customers have displayed lower usage than stand-alone customers, a major driver in the reduction in revenue, however, they have also displayed lower churn. Lower revenue from handset sales was also a factor in the decline in revenue.
Data Revenue
2006 2005 ChangeYEAR ENDED 30 JUNE A$m A$m %
Data revenue
Consumer 4 3 33.3
Business 144 171 (15.8)
148 174 (14.9)
Data revenue within the Consumer division represents pay TV subscriptions. The vast majority of data revenue is generated by the Business division. Business data revenue declined by $27 million (15.8%) in 2006. This was due to the loss of one large volume, low margin corporate customer, the migration of the VicOne business to other carriers, the ending of the Customs ‘Tradegate’ contract and price erosion on the negotiation of new contracts.
Broadband and Internet Revenue
2006 2005 ChangeYEAR ENDED 30 JUNE A$m A$m %
Broadband and internet revenue
Consumer 36 17 111.8
Business 65 67 (3.0)
101 84 20.2
Strong growth in broadband and internet revenue within the Consumer division reflected significant growth in the broadband customer base, partly offset by price decreases driven by competitive activity in the sector. Consumer broadband customer numbers at 30 June 2006 were 102,000, an increase of 277.8% from broadband customers of 27,000 at 30 June 2005. Dial-up customers have remained steady at 90,000.
Broadband and internet revenue in the Business division decreased by $2 million (3.0%) in 2006. Volume declines in the retail business have been offset by growth in the wholesale business, despite a continuation of aggressive pricing in the market.
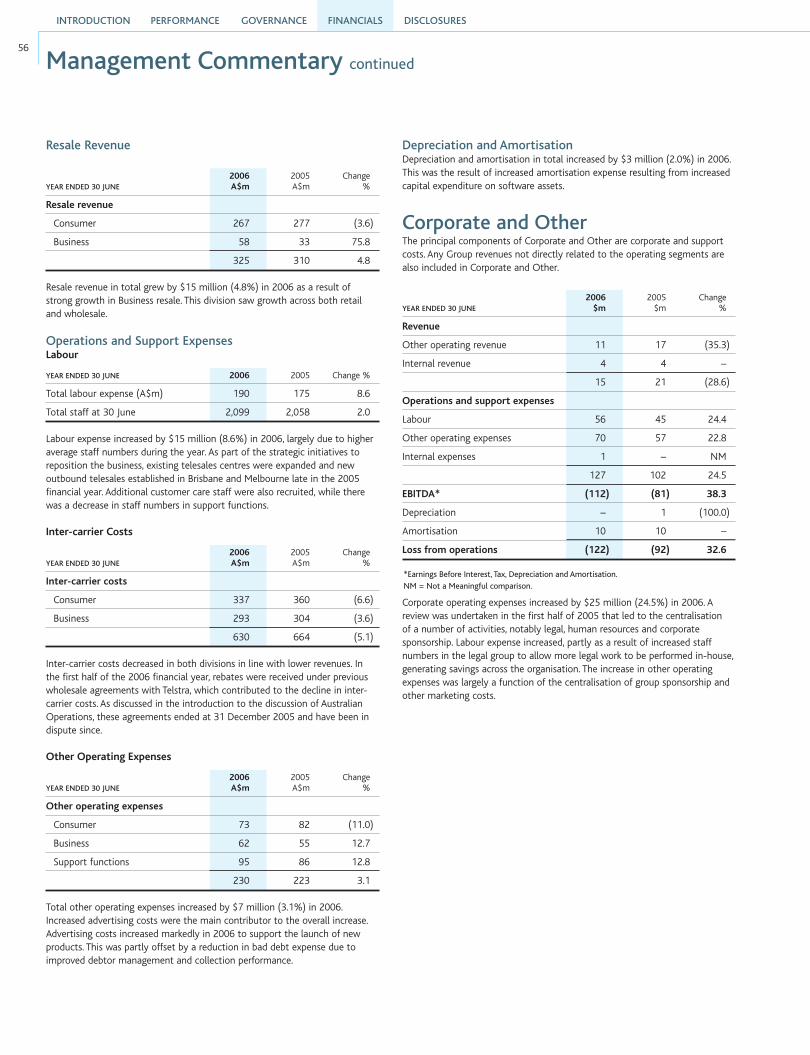
INTRODUCTION PERFORMANCE GOVERNANCE DISCLOSURESFINANCIALS
56
Resale Revenue
2006 2005 ChangeYEAR ENDED 30 JUNE A$m A$m %
Resale revenue
Consumer 267 277 (3.6)
Business 58 33 75.8
325 310 4.8
Resale revenue in total grew by $15 million (4.8%) in 2006 as a result of strong growth in Business resale. This division saw growth across both retail and wholesale.
Operations and Support ExpensesLabour
YEAR ENDED 30 JUNE 2006 2005 Change %
Total labour expense (A$m) 190 175 8.6
Total staff at 30 June 2,099 2,058 2.0
Labour expense increased by $15 million (8.6%) in 2006, largely due to higher average staff numbers during the year. As part of the strategic initiatives to reposition the business, existing telesales centres were expanded and new outbound telesales established in Brisbane and Melbourne late in the 2005 financial year. Additional customer care staff were also recruited, while there was a decrease in staff numbers in support functions.
Inter-carrier Costs
2006 2005 ChangeYEAR ENDED 30 JUNE A$m A$m %
Inter-carrier costs
Consumer 337 360 (6.6)
Business 293 304 (3.6)
630 664 (5.1)
Inter-carrier costs decreased in both divisions in line with lower revenues. In the first half of the 2006 financial year, rebates were received under previous wholesale agreements with Telstra, which contributed to the decline in inter-carrier costs. As discussed in the introduction to the discussion of Australian Operations, these agreements ended at 31 December 2005 and have been in dispute since.
Other Operating Expenses
2006 2005 ChangeYEAR ENDED 30 JUNE A$m A$m %
Other operating expenses
Consumer 73 82 (11.0)
Business 62 55 12.7
Support functions 95 86 12.8
230 223 3.1
Total other operating expenses increased by $7 million (3.1%) in 2006. Increased advertising costs were the main contributor to the overall increase. Advertising costs increased markedly in 2006 to support the launch of new products. This was partly offset by a reduction in bad debt expense due to improved debtor management and collection performance.
Depreciation and AmortisationDepreciation and amortisation in total increased by $3 million (2.0%) in 2006. This was the result of increased amortisation expense resulting from increased capital expenditure on software assets.
Corporate and OtherThe principal components of Corporate and Other are corporate and support costs. Any Group revenues not directly related to the operating segments are also included in Corporate and Other.
2006 2005 ChangeYEAR ENDED 30 JUNE $m $m %
Revenue
Other operating revenue 11 17 (35.3)
Internal revenue 4 4 –
15 21 (28.6)
Operations and support expenses
Labour 56 45 24.4
Other operating expenses 70 57 22.8
Internal expenses 1 – NM
127 102 24.5
EBITDA* (112) (81) 38.3
Depreciation – 1 (100.0)
Amortisation 10 10 –
Loss from operations (122) (92) 32.6
*Earnings Before Interest, Tax, Depreciation and Amortisation.NM = Not a Meaningful comparison.
Corporate operating expenses increased by $25 million (24.5%) in 2006. A review was undertaken in the first half of 2005 that led to the centralisation of a number of activities, notably legal, human resources and corporate sponsorship. Labour expense increased, partly as a result of increased staff numbers in the legal group to allow more legal work to be performed in-house, generating savings across the organisation. The increase in other operating expenses was largely a function of the centralisation of group sponsorship and other marketing costs.
Management Commentary continued

57
Cash Flows And Liquidity (Consolidated)
2006 2005 ChangeYEAR ENDED 30 JUNE $m $m %
Cash flows
Net cash flows from/(applied to):
Operating activities 1,807 1,703 6.1
Investing activities (453) (583) (22.3)
Financing activities (1,434) (1,123) 27.7
Net cash flow (80) (3) NM
NM= Not a Meaningful comparison.
Net cash flows from operating activities increased by $104 million (6.1%) for 2006 due to favourable working capital movements and lower interest and tax payments. The reduction in working capital reflected tight management of current assets and liabilities, while the decline in interest paid was in line with the reduction in interest expense resulting from lower average debt levels compared to the prior year. Tax payments reduced as a result of increased tax credits on supplementary dividend payments, tax deductions arising on the revaluation of foreign denominated intercompany debt and the receipt of tax refunds from prior years.
The net cash outflow for investing activities decreased by $130 million (22.3%) for 2006 compared to the prior period. Despite payments for capital expenditure being higher in the current year, the proceeds from Telecom’s stake in INL were received in the current year, while the prior year included the purchase of Gen-i and Computerland. Offsetting this, surplus funds were applied to the purchase of short-term investments in the current year, compared to the sale of short-term investments in the previous year.
The net cash outflow for financing activities increased by $311 million (27.7%) in 2006. The increase in financing cash outflows was primarily due to an increase in the dividend paid as a result of special dividends paid in the current year.
The net debt to net debt plus equity ratio was 77.5% at 30 June 2006, compared to 58.8% at 30 June 2005 (net debt is defined as total debt plus total derivative liabilities less cash, short-term investments and derivative assets). The increase in this ratio reflects the reduction in equity as a result of the write-down of Australian Operations in 2006.
Net debt was $3,652 million at 30 June 2006, an increase of $132 million from net debt at 30 June 2005 of $3,520 million.
Capital Expenditure
2006 2005 ChangeYEAR ENDED 30 JUNE $m $m %
Wired (NZ fixed line)
Growth 203 202 0.5
Upgrades and replacements 140 122 14.8
New Investment 136 102 33.3
Total Wired 479 426 12.4
Wireless 93 89 4.5
International 14 35 (60.0)
Australian Operations 131 118 11.0
Corporate and other 34 35 (2.9)
751 703 6.8
Total capital expenditure of $751 million grew by $48 million (6.8%) for 2006, with increases across all business areas except International and Corporate and other.
Wired investment for growth of $203 million increased by $1 million (0.5%), driven largely by increased demand for data services. Growth covers those capital costs directly associated with meeting demand for, and extending coverage of, existing products and services. This includes cabling new subdivisions and increasing capacity in existing areas, increasing capacity in exchanges for both voice and data products and increasing capacity on links between exchanges.
Wired upgrades and replacements investment of $140 million increased by $18 million (14.8%), largely due to planned increased activity, including the renewal of core network capability, information systems for improved robustness, and refreshing client networks. Upgrades and replacements include capital expenditure not directly associated with meeting growth or development of new capabilities.
Wired new investment of $136 million increased by $34 million (33.3%) mainly as a result of network infrastructure investment and development of new services including Ferrit. New investment involves the development of new products and the deployment of new capabilities into the network (such as Voice over IP capability) or IS systems (such as a new billing capability).
Wireless investment of $93 million increased by $4 million (4.5%) resulting from growth in data services and the expansion of EV-DO 3G mobile network coverage into provincial centres.
International investment of $14 million reduced by $21 million (60.0%) reflecting the purchase of Southern Cross Cable capacity in the prior year.
Australian Operations investment for 2006 of $131 million increased by $13 million (11.0%) compared to 2005. Expenditure for 2006 continued to move away from networks towards ‘enabling’ infrastructure such as call centre functionality and IT platforms.
For 2007, Telecom currently expects total capital expenditure of approximately $800 million. Of the $800 million, approximately $495 million relates to Wired, $100 million to Wireless, $26 million to International, $145 million to Australian Operations and $34 million to Corporate and Other.
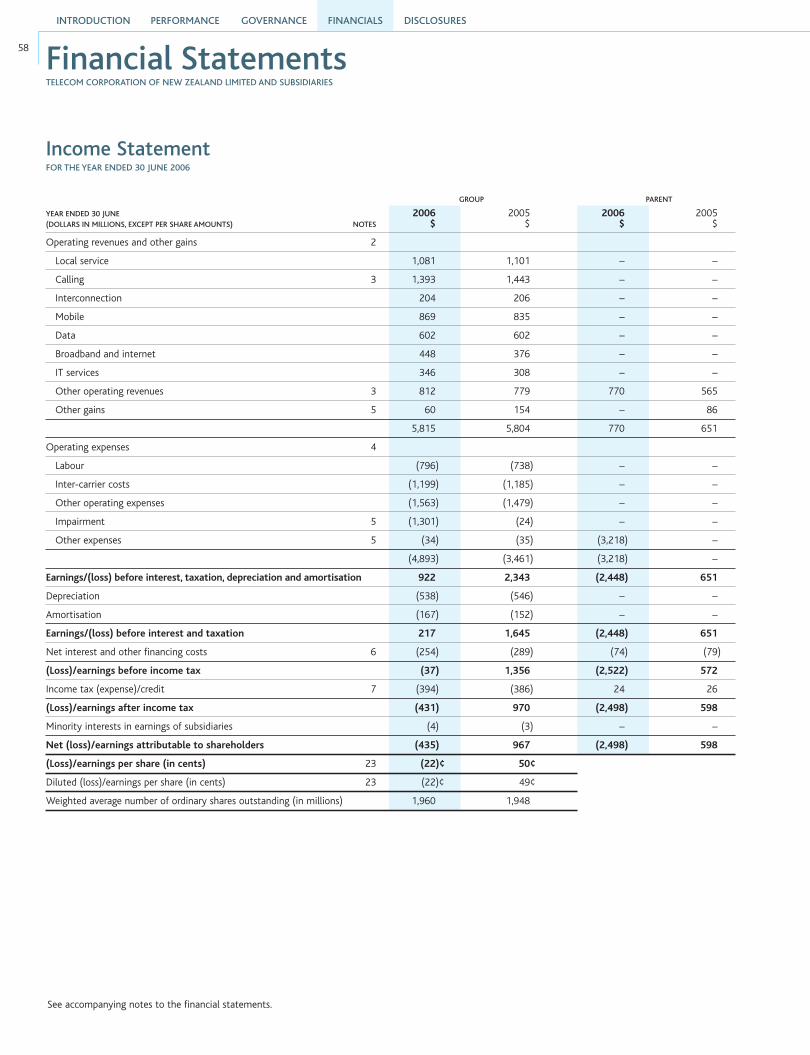
INTRODUCTION PERFORMANCE GOVERNANCE DISCLOSURESFINANCIALS
58
See accompanying notes to the financial statements.
Income StatementFOR THE YEAR ENDED 30 JUNE 2006
GROUP PARENT
YEAR ENDED 30 JUNE 2006 2005 2006 2005(DOLLARS IN MILLIONS, EXCEPT PER SHARE AMOUNTS) NOTES $ $ $ $
Operating revenues and other gains 2
Local service 1,081 1,101 – –
Calling 3 1,393 1,443 – –
Interconnection 204 206 – –
Mobile 869 835 – –
Data 602 602 – –
Broadband and internet 448 376 – –
IT services 346 308 – –
Other operating revenues 3 812 779 770 565
Other gains 5 60 154 – 86
5,815 5,804 770 651
Operating expenses 4
Labour (796) (738) – –
Inter-carrier costs (1,199) (1,185) – –
Other operating expenses (1,563) (1,479) – –
Impairment 5 (1,301) (24) – –
Other expenses 5 (34) (35) (3,218) –
(4,893) (3,461) (3,218) –
Earnings/(loss) before interest, taxation, depreciation and amortisation 922 2,343 (2,448) 651
Depreciation (538) (546) – –
Amortisation (167) (152) – –
Earnings/(loss) before interest and taxation 217 1,645 (2,448) 651
Net interest and other financing costs 6 (254) (289) (74) (79)
(Loss)/earnings before income tax (37) 1,356 (2,522) 572
Income tax (expense)/credit 7 (394) (386) 24 26
(Loss)/earnings after income tax (431) 970 (2,498) 598
Minority interests in earnings of subsidiaries (4) (3) – –
Net (loss)/earnings attributable to shareholders (435) 967 (2,498) 598
(Loss)/earnings per share (in cents) 23 (22)¢ 50¢
Diluted (loss)/earnings per share (in cents) 23 (22)¢ 49¢
Weighted average number of ordinary shares outstanding (in millions) 1,960 1,948
Financial StatementsTELECOM CORPORATION OF NEW ZEALAND LIMITED AND SUBSIDIARIES

59
Statement of Changes in EquityFOR THE YEAR ENDED 30 JUNE 2006
GROUP PARENT
YEAR ENDED 30 JUNE 2006 2005 2006 2005(DOLLARS IN MILLIONS) NOTE $ $ $ $
Balance at beginning of year 2,471 2,208 4,203 4,218
Transition adjustments on adoption of NZ IFRS – (15) – 4
Transition adjustment on adoption of NZ IAS 39 (41) – – –
Restated balance 2,430 2,193 4,203 4,222
Translation of foreign operations 118 (86) – –
Hedge of net investment in foreign operations (129) 21 – –
Cash flow hedges 8 – – –
Current tax 100 (8) – –
Deferred tax (3) – – –
Total surplus/(deficit) recognised directly in equity 94 (73) – –
Net (loss)/earnings for the year (431) 970 (2,498) 598
Total recognised income and expenses (337) 897 (2,498) 598
Dividends (1,184) (835) (1,179) (833)
Tax credit on supplementary dividends 131 95 131 95
Dividend reinvestment plan 114 84 114 84
Exercise of share options 18 27 18 27
Issuance of shares under employee share schemes 4 10 4 10
Repurchase of shares (114) – (114) –
Balance at end of year 23 1,062 2,471 679 4,203
See accompanying notes to the financial statements.

INTRODUCTION PERFORMANCE GOVERNANCE DISCLOSURESFINANCIALS
60
Balance SheetAS AT 30 JUNE 2006
GROUP PARENT
AS AT 30 JUNE 2006 2005 2006 2005(DOLLARS IN MILLIONS) NOTES $ $ $ $
ASSETS
Current assets:
Cash 155 235 – –
Short-term investments 8 64 81 – –
Short-term derivative assets 9 26 – – –
Receivables and prepayments 10 929 1,266 966 1,433
Taxation recoverable 100 45 – –
Inventories 11 51 56 – –
Total current assets 1,325 1,683 966 1,433
Non-current assets:
Receivables due after one year 12 109 117 – –
Long-term investments 13 520 427 7,007 7,998
Deferred tax asset 14 31 32 – –
Long-term derivative assets 15 88 – – –
Intangible assets 16 829 1,643 – –
Property, plant and equipment 17 3,301 3,602 – –
Total non-current assets 4,878 5,821 7,007 7,998
Total assets 6,203 7,504 7,973 9,431
LIABILITIES AND EQUITY
Current liabilities:
Accounts payable and accruals 18 1,039 1,044 22 16
Taxation payable – – 3 4
Short-term derivative liabilities 19 125 – – –
Debt due within one year 20 955 863 5,042 5,208
Total current liabilities 2,119 1,907 5,067 5,228
Non-current liabilities:
Deferred tax liability 14 117 153 – –
Long-term derivative liabilities 21 362 – – –
Long-term debt 22 2,543 2,973 2,227 –
Total non-current liabilities 3,022 3,126 2,227 –
Total liabilities 5,141 5,033 7,294 5,228
Equity:
Shareholders’ funds 1,055 2,463 679 4,203
Minority interests 7 8 – –
Total equity 23 1,062 2,471 679 4,203
Total liabilities and equity 6,203 7,504 7,973 9,431
On behalf of the Board
THERESA GATTUNGCHIEF EXECUTIVE OFFICER AND MANAGING DIRECTOR
Authorised for issue on 28 August 2006.See accompanying notes to the financial statements.
WAYNE BOYDCHAIRMAN
Financial Statements continuedTELECOM CORPORATION OF NEW ZEALAND LIMITED AND SUBSIDIARIES
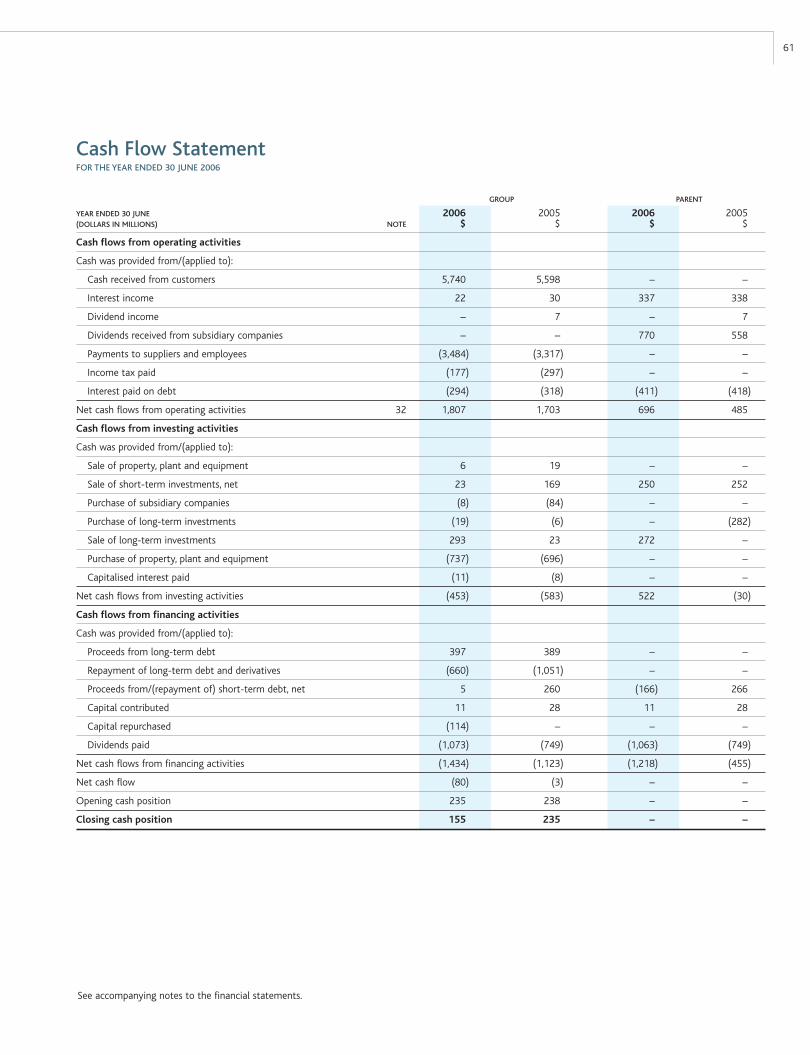
61
Cash Flow StatementFOR THE YEAR ENDED 30 JUNE 2006
GROUP PARENT
YEAR ENDED 30 JUNE 2006 2005 2006 2005(DOLLARS IN MILLIONS) NOTE $ $ $ $
Cash flows from operating activities
Cash was provided from/(applied to):
Cash received from customers 5,740 5,598 – –
Interest income 22 30 337 338
Dividend income – 7 – 7
Dividends received from subsidiary companies – – 770 558
Payments to suppliers and employees (3,484) (3,317) – –
Income tax paid (177) (297) – –
Interest paid on debt (294) (318) (411) (418)
Net cash flows from operating activities 32 1,807 1,703 696 485
Cash flows from investing activities
Cash was provided from/(applied to):
Sale of property, plant and equipment 6 19 – –
Sale of short-term investments, net 23 169 250 252
Purchase of subsidiary companies (8) (84) – –
Purchase of long-term investments (19) (6) – (282)
Sale of long-term investments 293 23 272 –
Purchase of property, plant and equipment (737) (696) – –
Capitalised interest paid (11) (8) – –
Net cash flows from investing activities (453) (583) 522 (30)
Cash flows from financing activities
Cash was provided from/(applied to):
Proceeds from long-term debt 397 389 – –
Repayment of long-term debt and derivatives (660) (1,051) – –
Proceeds from/(repayment of) short-term debt, net 5 260 (166) 266
Capital contributed 11 28 11 28
Capital repurchased (114) – – –
Dividends paid (1,073) (749) (1,063) (749)
Net cash flows from financing activities (1,434) (1,123) (1,218) (455)
Net cash flow (80) (3) – –
Opening cash position 235 238 – –
Closing cash position 155 235 – –
See accompanying notes to the financial statements.

INTRODUCTION PERFORMANCE GOVERNANCE DISCLOSURESFINANCIALS
62
Note 1 Statement of Accounting PoliciesReporting Entity and Statutory BaseTelecom Corporation of New Zealand Limited is a profit-oriented company registered in New Zealand under the Companies Act 1993, and is an issuer for the purposes of the Financial Reporting Act 1993.
The financial statements presented are those of Telecom Corporation of New Zealand Limited (the ‘Company’ or the ‘Parent Company’), its subsidiaries and associates (the ‘Telecom Group’ or ‘Telecom’).
Nature of OperationsTelecom is a major supplier of telecommunications and information technology services in New Zealand and Australia. Telecom provides a full range of telecommunications and information technology products and services including local, national, international and value-added telephone services, cellular and other mobile services, data and internet services, IT consulting, implementation and procurement, equipment sales and installation services, leased services and directories.
Basis of PreparationThe financial statements have been prepared in accordance with the Financial Reporting Act 1993 which requires compliance with accounting practice generally accepted in New Zealand. This differs in certain significant respects from accounting practice generally accepted in the United States (‘US GAAP’). For a description of the significant differences and related effect on these financial statements, see Note 37.
In December 2002 the New Zealand Accounting Standards Review Board announced that International Financial Reporting Standards (‘IFRS’) will apply to all New Zealand entities for periods commencing on or after 1 January 2007. Companies may adopt IFRS earlier if they choose. Telecom has elected to adopt the New Zealand equivalents to International Financial Reporting Standards (‘NZ IFRS’) from 1 July 2005 and these financial statements are prepared in compliance with NZ IFRS. In complying with NZ IFRS Telecom is also in compliance with IFRS.
Transition from existing NZ GAAP to NZ IFRS has been made in accordance with NZ IFRS 1 ‘First-time Adoption of New Zealand Equivalents to International Financial Reporting Standards’. Comparative information has been restated to conform to the requirements of NZ IFRS, except for NZ IAS 32 and NZ IAS 39, as permitted by NZ IFRS 1.
The financial statements are expressed in New Zealand dollars. References in these financial statements to ‘$’ and ‘NZ$’ are to New Zealand dollars, references to ‘US$’ are to US dollars, references to ‘A$’ are to Australian dollars and references to ‘GBP’ are to Pounds Sterling.
Measurement BasisThe measurement basis adopted in the preparation of these financial statements is historical cost, modified by the revaluation of certain investments and financial instruments as identified in specific accounting policies below.
Specific Accounting PoliciesBasis of ConsolidationSubsidiariesSubsidiaries are those entities controlled, directly or indirectly, by the Telecom Group.
The consolidated financial statements are prepared from the accounts of the Company and its subsidiaries using the purchase method of consolidation. All significant intercompany accounts and transactions are eliminated on consolidation.
AssociatesAssociates are entities in which the Telecom Group has significant influence, but not control, over the operating and financial policies.
Associate companies are reflected in the consolidated financial statements using the equity method, whereby Telecom’s share of the post-acquisition net surplus of associates is included in consolidated earnings before income tax.
Where the equity accounted carrying amount of an investment in an entity falls below zero, the equity method of accounting is suspended and the investment recorded at zero except where there is a legal or constructive obligation to fund those losses, in which case losses are recorded and a liability is recognised. If this occurs, the equity method of accounting is not resumed until such time as Telecom’s share of losses and reserve decrements, not recognised during the financial years in which the equity method was suspended, are offset by the current share of earnings and reserves.
GoodwillGoodwill represents the excess of purchase consideration over the fair value of net assets acquired at the time of acquisition of a business or shares in a subsidiary. Goodwill is assessed annually for impairment and to the extent that it is no longer probable it will be recovered from future economic benefits of the investment, it is recognised immediately as an expense.
Prior to conversion to NZ IFRS goodwill was amortised over a period not exceeding 20 years. NZ IFRS 1 does not permit goodwill previously recognised as an expense to be reinstated unless a previous business combination has been reopened. Telecom has not elected to reopen previous business combinations, therefore goodwill is stated at cost less previous amortisation charges and any accumulated impairment losses.
Acquisition or Disposal During the YearWhere an entity becomes or ceases to be a Telecom Group entity during the year, the results of that entity are included in the net earnings of the Telecom Group from the date that control or significant influence commenced or until the date that control or significant influence ceased.
Revenue Recognition Telecom recognises revenues as it provides services or delivers products to customers. Billings for telecommunications services (including fixed line, cellular and internet access billings) are made on a monthly basis. Unbilled revenues from the billing cycle date to the end of each month are recognised as revenue during the month the service is provided. Revenue is deferred in respect of the portion of fixed monthly charges that have been billed in advance.
Revenue from the sale of prepaid cellular minutes is initially deferred, with recognition occurring when the minutes are used by the customer.
Revenue from directories advertising and related publication costs are recognised upon publication of the directory.
Revenue from installations and connections and related costs are recognised upon completion of the installation or connection. Revenue from equipment sales is recognised upon delivery of equipment to the customer.
Accounts ReceivableAccounts receivable are recorded initially at fair value and subsequently measured at amortised cost using the effective interest method, less any provision for impairment losses due to bad and doubtful accounts. The provision for doubtful debts is based on management’s assessment of amounts considered to be uncollectable for specific customers or groups of customers based on age of debt, history of payments, account activity, economic factors and other relevant information. The amount of the provision is the difference between the asset’s unamortised cost and the present value of estimated future cash flows, discounted at the effective interest rate. The provision is recognised in the Income Statement.
Bad debts are written off against the provision for doubtful accounts in the period in which it is determined that the debts are uncollectable. If those debts are subsequently collected then a gain is recognised in the Income Statement.
InventoriesInventories principally comprise materials for self-constructed network assets, critical maintenance spares, customer premises equipment held for rental or sale and mobile equipment held for sale. Inventories are stated at the lower of
Notes to the Financial Statements

63
cost and net realisable value after due consideration for excess and obsolete items. Cost is determined on a weighted average cost basis.
Cost of inventories includes the transfer from equity of any gains or losses on qualifying cash flow hedges relating to purchases of raw materials.
Investments Telecom classifies its investments in the following categories: financial assets at fair value through profit or loss, loans and receivables, held-to-maturity investments and available-for-sale financial assets. The classification depends on the purpose for which the investments were acquired and is re-evaluated by management at each reporting date.
Investments are initially recognised at fair value plus transaction costs for all financial assets not carried at fair value through profit and loss.
Fair values of quoted investments are based on prices current at balance date. If the market for a financial asset is not active fair value is established by using valuation techniques including recent arm’s-length transactions, reference to other similar instruments, discounted cash flow analysis and option pricing models.
Where the fair value of equity instruments cannot be reliably determined then the investments are recorded at historical cost.
Financial Assets at Fair Value through Profit or LossAssets in this category are financial assets either held for trading, or designated at fair value through profit or loss at inception. Derivatives are also categorised as held for trading unless they are designated as hedges. These assets are classified as current assets if they are held for trading or are expected to be realised within twelve months of balance date. Realised and unrealised gains and losses arising from changes in the fair values are included in the Income Statement in the period in which they arise.
Loans and ReceivablesLoans and receivables are non-derivative financial assets with fixed or determinable payments that are not traded in an active market. These assets are carried at amortised cost using the effective interest method.
Held to Maturity InvestmentsHeld-to-maturity investments are non-derivative financial assets with fixed or determinable payments and fixed maturities that the Telecom Group has the positive intention and ability to hold to maturity. These assets are carried at amortised cost using the effective interest method.
Available-for-sale Financial Assets Available-for-sale financial assets are non-derivatives that are either designated as available-for-sale by management or not classified in any of the other categories. These investments are carried at fair value with any unrealised gains and losses arising from changes in fair value recognised in equity. On sale the accumulated fair value adjustments are included in the Income Statement as gains and losses from investment securities.
Where, in the opinion of the Directors, there has been an impairment in the value of investments this is recognised in the current period. In the case of equity securities classified as available for sale, losses arising from a significant or prolonged decline in the fair value are removed from equity and recognised in the Income Statement. Impairment losses recognised in the Income Statement on equity instruments are not reversed through the Income Statement.
Property, Plant and EquipmentProperty, plant and equipment is valued as follows:
the value of property, plant and equipment purchased from the Government was determined using deemed cost as at 1 April 1987.
subsequent additions are recognised at cost. The cost of additions to plant and equipment and other assets constructed by Telecom consists of all appropriate costs of development, construction and installation, comprising material, labour, direct overhead and transport costs.
for each qualifying asset project, interest costs incurred during the period required to complete and prepare the property, plant or equipment for its intended use are capitalised as part of the total cost.
DepreciationDepreciation is charged on a straight-line basis to write-down the cost of property, plant and equipment to its estimated residual value over its estimated useful lives, which are as follows:
Telecommunications equipment and plant:
Customer local access 3-50 years
Junctions and trunk transmission systems 10-50 years
Switching equipment 3-15 years
Customer premises equipment 3-5 years
Other network equipment 4-25 years
Buildings 40-50 years
Motor vehicles 4-10 years
Furniture and fittings 5-10 years
Computer equipment 3-5 years
Where the remaining useful lives or recoverable values have diminished due to technological change or market conditions, depreciation is accelerated or the assets are written down.
Land and capital work in progress are not depreciated.Where property, plant or equipment is disposed of, the profit or loss
recognised in the Income Statement is calculated as the difference between the sale price and the carrying value of the asset.
Leased AssetsTelecom is a lessor of customer premises equipment. Such leases are considered operating leases because substantially all the benefits and risks of ownership remain with Telecom. Rental income is taken to revenue on a monthly basis in accordance with the lease term.
Telecom is a lessee of certain plant, equipment, land and buildings under both operating and finance leases. Lease costs relating to operating leases are charged against earnings as incurred. Finance leases, which effectively transfer to Telecom substantially all the risks and benefits of ownership of the leased assets, are capitalised at the present value of the minimum lease payments. The leased assets and corresponding liabilities are disclosed and the leased assets are depreciated over the period Telecom is expected to benefit from their use.
Intangible AssetsThe cost of acquiring an intangible asset is amortised from the date the underlying asset is held ready for use on a straight-line basis over the periods of their expected benefit which is as follows:
Software 2-8 years
Capacity purchases 10-15 years
Spectrum licences 4-20 years
Other intangibles 1-99 years
Where the periods of expected benefit or recoverable values have diminished due to technological change or market conditions, amortisation is accelerated or the carrying value is written down.
Telecom capitalises the direct costs associated with the development of network and business software for internal use where project success is regarded as probable. Capitalised costs include external direct costs of materials and services consumed, payroll and direct payroll-related costs for employees (including contractors) directly associated with the project, and interest costs incurred while developing the software. Software developed for internal use is depreciated over its useful life to the Telecom Group.
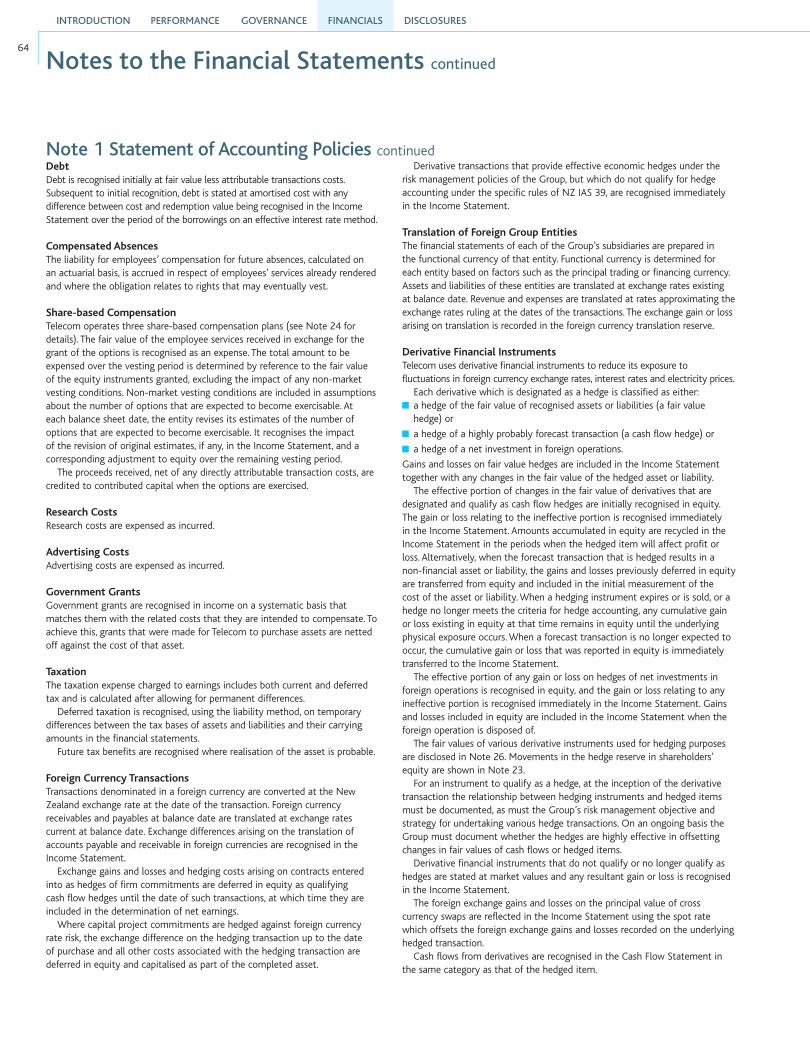
INTRODUCTION PERFORMANCE GOVERNANCE DISCLOSURESFINANCIALS
64
DebtDebt is recognised initially at fair value less attributable transactions costs. Subsequent to initial recognition, debt is stated at amortised cost with any difference between cost and redemption value being recognised in the Income Statement over the period of the borrowings on an effective interest rate method.
Compensated AbsencesThe liability for employees’ compensation for future absences, calculated on an actuarial basis, is accrued in respect of employees’ services already rendered and where the obligation relates to rights that may eventually vest.
Share-based CompensationTelecom operates three share-based compensation plans (see Note 24 for details). The fair value of the employee services received in exchange for the grant of the options is recognised as an expense. The total amount to be expensed over the vesting period is determined by reference to the fair value of the equity instruments granted, excluding the impact of any non-market vesting conditions. Non-market vesting conditions are included in assumptions about the number of options that are expected to become exercisable. At each balance sheet date, the entity revises its estimates of the number of options that are expected to become exercisable. It recognises the impact of the revision of original estimates, if any, in the Income Statement, and a corresponding adjustment to equity over the remaining vesting period.
The proceeds received, net of any directly attributable transaction costs, are credited to contributed capital when the options are exercised.
Research CostsResearch costs are expensed as incurred.
Advertising CostsAdvertising costs are expensed as incurred.
Government GrantsGovernment grants are recognised in income on a systematic basis that matches them with the related costs that they are intended to compensate. To achieve this, grants that were made for Telecom to purchase assets are netted off against the cost of that asset.
TaxationThe taxation expense charged to earnings includes both current and deferred tax and is calculated after allowing for permanent differences.
Deferred taxation is recognised, using the liability method, on temporary differences between the tax bases of assets and liabilities and their carrying amounts in the financial statements.
Future tax benefits are recognised where realisation of the asset is probable.
Foreign Currency TransactionsTransactions denominated in a foreign currency are converted at the New Zealand exchange rate at the date of the transaction. Foreign currency receivables and payables at balance date are translated at exchange rates current at balance date. Exchange differences arising on the translation of accounts payable and receivable in foreign currencies are recognised in the Income Statement.
Exchange gains and losses and hedging costs arising on contracts entered into as hedges of firm commitments are deferred in equity as qualifying cash flow hedges until the date of such transactions, at which time they are included in the determination of net earnings.
Where capital project commitments are hedged against foreign currency rate risk, the exchange difference on the hedging transaction up to the date of purchase and all other costs associated with the hedging transaction are deferred in equity and capitalised as part of the completed asset.
Derivative transactions that provide effective economic hedges under the risk management policies of the Group, but which do not qualify for hedge accounting under the specific rules of NZ IAS 39, are recognised immediately in the Income Statement.
Translation of Foreign Group EntitiesThe financial statements of each of the Group’s subsidiaries are prepared in the functional currency of that entity. Functional currency is determined for each entity based on factors such as the principal trading or financing currency. Assets and liabilities of these entities are translated at exchange rates existing at balance date. Revenue and expenses are translated at rates approximating the exchange rates ruling at the dates of the transactions. The exchange gain or loss arising on translation is recorded in the foreign currency translation reserve.
Derivative Financial InstrumentsTelecom uses derivative financial instruments to reduce its exposure to fluctuations in foreign currency exchange rates, interest rates and electricity prices.
Each derivative which is designated as a hedge is classified as either: a hedge of the fair value of recognised assets or liabilities (a fair value hedge) or
a hedge of a highly probably forecast transaction (a cash flow hedge) or
a hedge of a net investment in foreign operations.
Gains and losses on fair value hedges are included in the Income Statement together with any changes in the fair value of the hedged asset or liability.
The effective portion of changes in the fair value of derivatives that are designated and qualify as cash flow hedges are initially recognised in equity. The gain or loss relating to the ineffective portion is recognised immediately in the Income Statement. Amounts accumulated in equity are recycled in the Income Statement in the periods when the hedged item will affect profit or loss. Alternatively, when the forecast transaction that is hedged results in a non-financial asset or liability, the gains and losses previously deferred in equity are transferred from equity and included in the initial measurement of the cost of the asset or liability. When a hedging instrument expires or is sold, or a hedge no longer meets the criteria for hedge accounting, any cumulative gain or loss existing in equity at that time remains in equity until the underlying physical exposure occurs. When a forecast transaction is no longer expected to occur, the cumulative gain or loss that was reported in equity is immediately transferred to the Income Statement.
The effective portion of any gain or loss on hedges of net investments in foreign operations is recognised in equity, and the gain or loss relating to any ineffective portion is recognised immediately in the Income Statement. Gains and losses included in equity are included in the Income Statement when the foreign operation is disposed of.
The fair values of various derivative instruments used for hedging purposes are disclosed in Note 26. Movements in the hedge reserve in shareholders’ equity are shown in Note 23.
For an instrument to qualify as a hedge, at the inception of the derivative transaction the relationship between hedging instruments and hedged items must be documented, as must the Group’s risk management objective and strategy for undertaking various hedge transactions. On an ongoing basis the Group must document whether the hedges are highly effective in offsetting changes in fair values of cash flows or hedged items.
Derivative financial instruments that do not qualify or no longer qualify as hedges are stated at market values and any resultant gain or loss is recognised in the Income Statement.
The foreign exchange gains and losses on the principal value of cross currency swaps are reflected in the Income Statement using the spot rate which offsets the foreign exchange gains and losses recorded on the underlying hedged transaction.
Cash flows from derivatives are recognised in the Cash Flow Statement in the same category as that of the hedged item.
Notes to the Financial Statements continued
Note 1 Statement of Accounting Policies continued
65
Cash Flow StatementFor the purposes of the Cash Flow Statement, cash is considered to be cash on hand and in banks, net of bank overdrafts and highly liquid investments that are readily convertible to known amounts of cash which are subject to an insignificant risk of changes in values. Cash flows from certain items are disclosed net, due to the short-term maturities and volume of transactions involved.
Use of Estimates and JudgementThe preparation of financial statements in conformity with NZ IFRS requires management to make estimates and assumptions that affect the reported amounts of assets and liabilities at the date of the financial statements and the reported amounts of revenues and expenses during the reporting period. Actual results could differ from those estimates. The principal areas of judgement in preparing these financial statements are set out below.
Valuation of GoodwillThe carrying value of goodwill is assessed at least annually to ensure that it is not impaired. Performing this assessment generally requires management to estimate future cash flows to be generated by the investment, which entails making judgements including the expected rate of growth of revenues, margins expected to be achieved, the level of future capital expenditure required to support these outcomes and the appropriate discount rate to apply when valuing future cash flows.
Valuation of InvestmentsManagement performs an assessment of the carrying value of long-term investments at least annually. In assessing whether there has been an impairment, consideration is given to the financial performance of the investee and other factors that impact on management’s expectation of recovering the value of the investment. This assessment also requires management to make judgements about the expected future performance and cash flows of the investee, and an appropriate discount rate, in order to determine the fair value of investments based on discounted expected cash flows of investees.
Accounting for Property, Plant and Equipment and Finite-lived Intangible AssetsIn accounting for the creation of items of property, plant and equipment and finite-lived intangible assets, judgements must be made about whether costs incurred relate to bringing an asset to working condition for its intended use, and therefore are appropriate for capitalisation as part of the cost of the asset, or whether they should be expensed as incurred. In capitalising costs for internally constructed assets, judgements must be made about the likelihood of project success. Such judgements can be difficult where the project involves the application of unproven technology.
The determination of the appropriate useful life for a particular asset requires management to make judgements about, among other factors, the expected period of service potential of the asset, the likelihood of the asset becoming obsolete as a result of technological advances, and the likelihood of Telecom ceasing to use the asset in its business operations.
Assessing whether an asset is impaired may involve estimating the future cash flows that the asset is expected to generate. This will in turn involve a number of assumptions, including rates of expected revenue growth or decline, expected future margins and the selection of an appropriate discount rate for valuing future cash flows.
Provision for Doubtful DebtsTelecom maintains a provision for estimated losses incurred from customers being unable to make required payments. This provision takes into account known commercial factors impacting specific customer accounts, as well as the overall profile of Telecom’s debtors’ portfolio. In assessing the provision, factors such as past collection history, the age of receivable balances, the level of activity in customer accounts, as well as general macro-economic trends, are taken into account.
Accounting for Interconnection Revenues and ExpensesIn the course of its normal business operations Telecom interconnects its networks with other telecommunications operators. In some instances management may be required to estimate levels of traffic flows between networks in order to determine amounts receivable or payable for interconnection.
The terms of interconnection, including pricing, are subject to regulation in some instances. Pricing may be subject to retrospective adjustment, in which case estimates of the likely effect of these adjustments are required in order to determine revenues and expenses. Likewise, where interconnection rates are in dispute with another carrier, estimates of the likely outcome of disputes are required to determine financial results. Telecom bases these estimates on management’s interpretation of material facts, as well as independent advice.
Accounting for Income TaxesPreparation of the annual financial statements requires management to make estimates as to, amongst other things, the amount of tax that will ultimately be payable, the availability of losses to be carried forward and the amount of foreign tax credits that it will receive. Actual results may differ from these estimates as a result of reassessment by management and/or taxation authorities.
Adoption of NZ IFRSDuring the year ended 30 June 2006 Telecom adopted the requirements of NZ IFRS in accordance with NZ IFRS 1 ‘First-time Adoption of New Zealand Equivalents to International Financial Reporting Standards’. See Note 38 for an explanation of the changes in accounting policy that have resulted from the early adoption of these standards.
Comparative information has been restated to conform to the requirements of NZ IFRS as part of Telecom’s early adoption of NZ IFRS, except for the application of NZ IAS 32 and NZ IAS 39, as permitted by NZ IFRS 1. Debt and financial instruments were accounted for in the comparative year as follows:
debt was stated at face value adjusted for unamortised discounts, premiums and prepaid interest. Discounts, premiums and prepaid interest were amortised to interest expense on a yield to maturity basis over the period of the borrowing. Borrowing costs such as origination, commitment and transaction fees were deferred and amortised over the period of the borrowing
gains and losses on derivatives were accounted for on the same basis as the underlying physical exposures. For an instrument to qualify as a hedge, it must effective at reducing the risk associated with the exposure being hedged and must be designated as a hedge at the inception of the contract
interest rate swaps and cross currency interest rate swaps that hedged an underlying physical exposure were accounted for using the accrual method of accounting. Interest receivable and payable and unamortised discounts under the terms of the interest rate swaps and cross currency interest rate swaps were accrued over the period to which the payments or receipts related, and were treated as an adjustment to interest expense
the foreign exchange gains and losses on the principal value of cross currency swaps were reflected in the Income Statement using the spot rate which offset the foreign exchange gains and losses recorded on the underlying hedged transaction
premiums paid for interest rate and currency options and the net settlement on maturity of forward rate agreements were amortised over the life of the underlying hedged item.
exchange gains and losses and hedging costs arising on contracts entered into as hedges of firm commitments were deferred until the date of such transactions at which time they were included in the determination of net earnings.

INTRODUCTION PERFORMANCE GOVERNANCE DISCLOSURESFINANCIALS
66
Note 3 Calling and Other Operating Revenues GROUP PARENT
YEAR ENDED 30 JUNE 2006 2005 2006 2005(DOLLARS IN MILLIONS) $ $ $ $
Calling
National 905 980
International 442 415
Other 46 48
1,393 1,443
Other operating revenues
Resale 363 337 – –
Directories 248 230 – –
Equipment 55 69 – –
Miscellaneous other 146 136 – –
Dividends from investments – 7 – 7
Dividends from subsidiary companies – – 770 558
812 779 770 565
Notes to the Financial Statements continued
Note 2 Operating Revenues and Other Gains GROUP PARENT
YEAR ENDED 30 JUNE 2006 2005 2006 2005(DOLLARS IN MILLIONS) $ $ $ $
Sale of goods 283 256 – –
Rendering of services 5,472 5,387 – –
Dividends – 7 770 565
Total operating revenue 5,755 5,650 770 565
Other gains 60 154 – 86
Total operating revenue and other gains 5,815 5,804 770 651
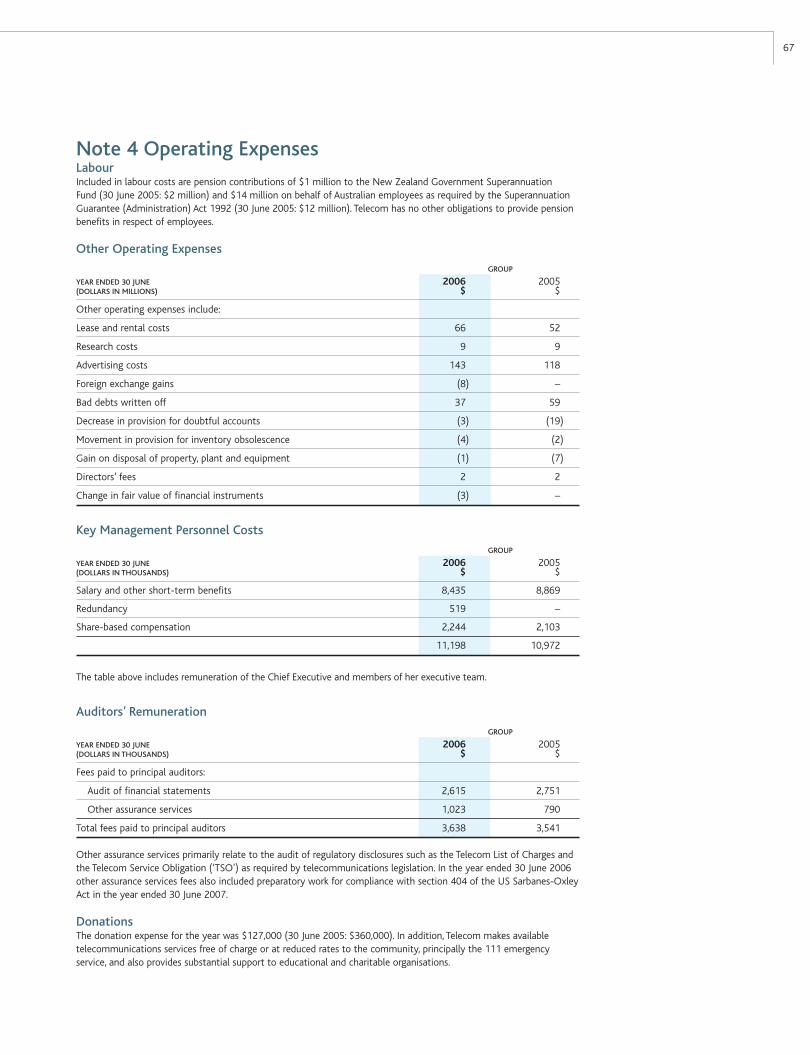
67
Note 4 Operating ExpensesLabourIncluded in labour costs are pension contributions of $1 million to the New Zealand Government Superannuation Fund (30 June 2005: $2 million) and $14 million on behalf of Australian employees as required by the Superannuation Guarantee (Administration) Act 1992 (30 June 2005: $12 million). Telecom has no other obligations to provide pension benefits in respect of employees.
Other Operating Expenses
GROUP
YEAR ENDED 30 JUNE 2006 2005(DOLLARS IN MILLIONS) $ $
Other operating expenses include:
Lease and rental costs 66 52
Research costs 9 9
Advertising costs 143 118
Foreign exchange gains (8) –
Bad debts written off 37 59
Decrease in provision for doubtful accounts (3) (19)
Movement in provision for inventory obsolescence (4) (2)
Gain on disposal of property, plant and equipment (1) (7)
Directors’ fees 2 2
Change in fair value of financial instruments (3) –
Key Management Personnel Costs
GROUP
YEAR ENDED 30 JUNE 2006 2005(DOLLARS IN THOUSANDS) $ $
Salary and other short-term benefits 8,435 8,869
Redundancy 519 –
Share-based compensation 2,244 2,103
11,198 10,972
The table above includes remuneration of the Chief Executive and members of her executive team.
Auditors’ Remuneration
GROUP
YEAR ENDED 30 JUNE 2006 2005(DOLLARS IN THOUSANDS) $ $
Fees paid to principal auditors:
Audit of financial statements 2,615 2,751
Other assurance services 1,023 790
Total fees paid to principal auditors 3,638 3,541
Other assurance services primarily relate to the audit of regulatory disclosures such as the Telecom List of Charges and the Telecom Service Obligation (‘TSO’) as required by telecommunications legislation. In the year ended 30 June 2006 other assurance services fees also included preparatory work for compliance with section 404 of the US Sarbanes-Oxley Act in the year ended 30 June 2007.
DonationsThe donation expense for the year was $127,000 (30 June 2005: $360,000). In addition, Telecom makes available telecommunications services free of charge or at reduced rates to the community, principally the 111 emergency service, and also provides substantial support to educational and charitable organisations.

INTRODUCTION PERFORMANCE GOVERNANCE DISCLOSURESFINANCIALS
68
Notes to the Financial Statements continued
Other GainsGain on Acquisition of Southern Cross Cables (NZ) Limited (‘SCCL’)On 23 December 2005 Telecom acquired a 100% shareholding in SCCL, a wholly-owned subsidiary of SouthernCross Cables in which Telecom holds a 50% shareholding. SCCL’s sole asset at the time of acquisition was a tax operating loss carryforward. The value of the tax loss carryforward was $70 million and Telecom’s acquisition cost was $10 million. The value in excess of Telecom’s acquisition cost has been reflected as a gain in the Group’s consolidated Income Statement for the year ended 30 June 2006.
Gain on Sale of Independent Newspapers Limited (‘INL’) Shares (Group and Parent)In June 2005 Telecom sold its entire stake in INL to Nationwide News Pty Limited, an affiliate of News Corporation for $272 million. This resulted in a gain on sale of $86 million being recognised in the year ended June 2005. Proceeds from the sale were received in July 2005.
Recognition of Southern Cross Support FeesSouthern Cross restructured its banking facilities with its senior bank syndicate in April 2003. As part of the restructure Telecom agreed to provide contingent credit support for a portion of the refinanced debt. In return for providing this support, support fees were payable to Telecom from Southern Cross. Telecom had not previously recognised these fees, as oversupply of capacity in the international telecommunications industry and uncertainties around future levels of demand were negatively impacting Southern Cross’ operations, creating uncertainty over the collectibility of the support fees. Since this time, acceleration in bandwidth utilisation has significantly improved the outlook for Southern Cross culminating in significant new sales being generated. As a result of the cash generated by the additional sales, collectibility of the support fees became expected and, accordingly, Telecom accrued fees payable by Southern Cross of $41 million at March 2005. This represents fees for the period from April 2003 to March 2005. These fees have now been fully paid.
Gain on Sale of Telecom Retail StoresIn August 2004 Telecom announced the sale of 15 of its business-focused retail stores to the Leading Edge Group for $16 million. The sale was completed on 30 September 2004, resulting in a gain on sale of $10 million.
Note 5 Other Gains, Expenses and Impairment GROUP PARENT
YEAR ENDED 30 JUNE 2006 2005 2006 2005(DOLLARS IN MILLIONS) $ $ $ $
Other Gains
Gain on acquisition of SCCL 60 – – –
Gain on sale of INL shares – 86 – 86
Recognition of Southern Cross support fees – 41 – –
Gain on sale of Telecom Retail Stores – 10 – –
Gain on repurchase of convertible notes – 9 – –
Gain on sale of Intelsat – 8 – –
60 154 – 86
Impairment
Impairment of Australian Operations 1,301 – – –
Impairment of TDMA network – 24 – –
1,301 24 – –
Other Expenses
Inter-carrier and regulatory costs 22 – – –
Provision for contractual settlements 12 – – –
Inter-carrier provisions – 31 – –
Restructuring costs – 4 – –
Provision for intercompany balances – – 3,218 –
34 35 3,218 –
69
Gain on Repurchase of Convertible NotesTelecom issued $300 million of convertible notes in 2001. In November 2004 Telecom repurchased $150 million of these notes. Due to market movements since the notes were issued, the amount required to buy the notes back was $145 million, resulting in a gain on buyback of $5 million. In February 2005 Telecom repurchased the remaining $150 million of notes. The amount required to buy the second tranche of notes back was $146 million, resulting in a gain on buyback of $4 million.
Gain on Sale of IntelsatIn January 2005, Intelsat Limited announced the successful closing of its amalgamation with a private equity group. As part of the amalgamation, Intelsat’s shareholders (including Telecom, which owned a stake of approximately 0.5%) received US$18.75 per share in return for their shares. In March 2005 Telecom received $22 million for the sale of its stake in Intelsat resulting in a gain on sale of $8 million.
ImpairmentImpairment of Australian OperationsTelecom has reviewed the carrying value of the assets relating to its Australian Operations (which is a reportable segment). Prior to the write-downs at 30 June 2006 and 31 December 2005 these assets had a total carrying value of A$1,464 million, including A$778 million of goodwill resulting from the purchase of AAPT. The recoverable amount for Telecom’s Australian Operations was assessed on a value-in-use basis.
In previous periods the recoverable amount had been determined to exceed carrying value. However, in the June 2006 and December 2005 assessments it was determined that the recoverable amount is significantly lower than the carrying value and hence impairments have occurred.
The decline in the recoverable amount was a consequence of a number of negative trends that are adversely affecting the short and long-term earnings outlook for Australian Operations, in particular:
a significant tightening of wholesale prices and terms with Telstra Corporation Limited (the principal supplier to Telecom’s Australian operations)
continued downward pressure on retail prices;
the deferral of major project expenditure by key corporate customers.
These fundamental changes in the industry, and revised expectations for implementation of new strategies within Australian Operations, have led to the recognition of impairment charges of $404 million (A$327 million) at 30 June 2006 and $897 million (A$836 million) at 31 December 2005. The December charge represents the writing down of $63 million (A$58 million) of individual assets and $834 million (A$778 million) of goodwill. As a result of this impairment, all remaining goodwill resulting from Telecom’s acquisition of AAPT has been written off. The June charge represents the further writing down of $404 million (A$330 million) of assets. In determining these impairments a discount rate of 9.7% was used.
Impairment of TDMA NetworkTelecom currently operates both TDMA and CDMA mobile networks. With the continued transition of customers from TDMA to CDMA, the cash flows generated by the TDMA network continued to decline to the point where at 30 June 2005 the present value of net future cash flows was negligible. Accordingly, an impairment charge of $24 million ($16 million after tax) was recognised at 30 June 2005 to write the network down to nil.
Other ExpensesInter-carrier and Regulatory CostsIn January 2006 Telecom and TelstraClear Limited reached an agreement that settled a number of long-standing commercial issues between the two companies, principally involving backdating of pricing of interconnection and wholesale arrangements. To settle these historical issues, Telecom agreed to make a one-off payment of $17.5 million to TelstraClear.
Also included in the current period is an adjustment to reflect a determination by the Commerce Commission. In December 2005 the Commission issued a draft determination of the cost to Telecom of meeting its Telecommunications Service Obligations (‘TSO’) for the year ended 30 June 2004. The determination represented a significant change from the 2003 and 2002 TSO determinations, which Telecom had used as the basis for accruing in 2004 and 2005 TSO revenue. Adopting the approach used by the Commission in its latest determination resulted in a one-off adjustment to the accrued TSO receivable.
Provision for Contractual SettlementsTelecom has provided $7 million for the estimated liability that would result from unsuccessful outcomes relating to historic issues under the Fair Trading Act.
Telecom has also recognised an expense of $5 million for the cost of terminating an agreement with Hutchison Whampoa Limited to receive 3G mobile services for Telecom’s New Zealand business. Telecom and Hutchison Whampoa have entered into a new agreement which reflects current business circumstances.
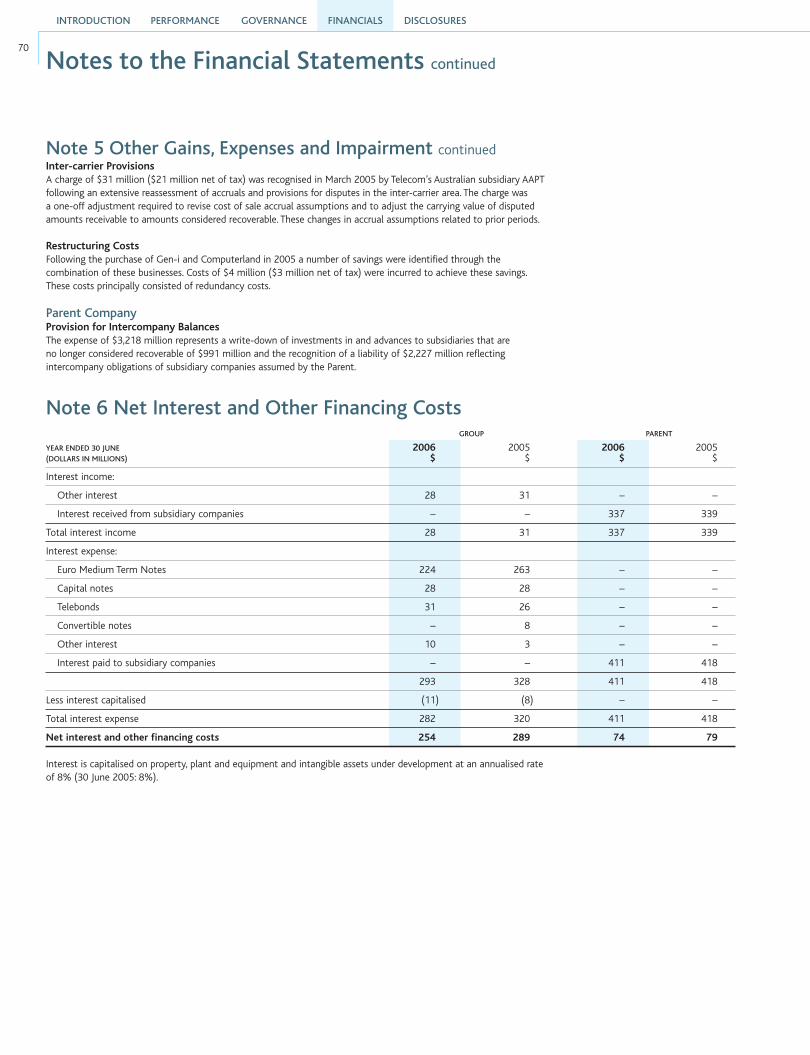
INTRODUCTION PERFORMANCE GOVERNANCE DISCLOSURESFINANCIALS
70
Note 6 Net Interest and Other Financing Costs GROUP PARENT
YEAR ENDED 30 JUNE 2006 2005 2006 2005(DOLLARS IN MILLIONS) $ $ $ $
Interest income:
Other interest 28 31 – –
Interest received from subsidiary companies – – 337 339
Total interest income 28 31 337 339
Interest expense:
Euro Medium Term Notes 224 263 – –
Capital notes 28 28 – –
Telebonds 31 26 – –
Convertible notes – 8 – –
Other interest 10 3 – –
Interest paid to subsidiary companies – – 411 418
293 328 411 418
Less interest capitalised (11) (8) – –
Total interest expense 282 320 411 418
Net interest and other financing costs 254 289 74 79
Interest is capitalised on property, plant and equipment and intangible assets under development at an annualised rate of 8% (30 June 2005: 8%).
Notes to the Financial Statements continued
Note 5 Other Gains, Expenses and Impairment continued Inter-carrier ProvisionsA charge of $31 million ($21 million net of tax) was recognised in March 2005 by Telecom’s Australian subsidiary AAPT following an extensive reassessment of accruals and provisions for disputes in the inter-carrier area. The charge was a one-off adjustment required to revise cost of sale accrual assumptions and to adjust the carrying value of disputed amounts receivable to amounts considered recoverable. These changes in accrual assumptions related to prior periods.
Restructuring CostsFollowing the purchase of Gen-i and Computerland in 2005 a number of savings were identified through the combination of these businesses. Costs of $4 million ($3 million net of tax) were incurred to achieve these savings. These costs principally consisted of redundancy costs.
Parent CompanyProvision for Intercompany BalancesThe expense of $3,218 million represents a write-down of investments in and advances to subsidiaries that are no longer considered recoverable of $991 million and the recognition of a liability of $2,227 million reflecting intercompany obligations of subsidiary companies assumed by the Parent.

71
Note 7 Income TaxThe income tax expense/(credit) is determined as follows:
GROUP PARENT
YEAR ENDED 30 JUNE 2006 2005 2006 2005(DOLLARS IN MILLIONS) $ $ $ $
Income statement
Current income tax
Current year income tax charge/(credit) 351 376 (24) (26)
Adjustments in respect of prior periods 1 (2) – –
Deferred income tax
Depreciation 54 12 – –
Provisions, accruals and other (5) (2) – –
Adjustments in respect of prior periods (7) 2 – –
Income tax charge/(credit) reported in income statement 394 386 (24) (26)
Statement of changes in equity
Current income tax
Current year income tax (credit)/charge (100) 8 – –
Deferred income tax
Fair value of financial instruments 3 – – –
Income tax (credit)/charge reported in equity (97) 8 – –
Note 8 Short-term Investments GROUP
30 JUNE 2006 2005(DOLLARS IN MILLIONS) $ $
Short-term deposits 63 80
Government securities 1 1
64 81
Reconciliation of Income Tax Expense
GROUP PARENT
YEAR ENDED 30 JUNE 2006 2005 2006 2005(DOLLARS IN MILLIONS) $ $ $ $
(Loss)/earnings before income tax (37) 1,356 (2,522) 572
Tax at current rate of 33% (12) 447 (832) 189
Adjustment to taxation:
Gain on sale of investments – (31) – (28)
Non-deductible write-downs 420 – 1,061 –
Non-taxable gain (20) – – –
Foreign sourced income not subject to tax (8) (19) – –
Intercompany dividends – – (253) (184)
Other 14 (11) – (3)
Income tax expense/(credit) 394 386 (24) (26)

INTRODUCTION PERFORMANCE GOVERNANCE DISCLOSURESFINANCIALS
72
Note 10 Receivables and Prepayments GROUP PARENT
30 JUNE 2006 2005 2006 2005(DOLLARS IN MILLIONS) $ $ $ $
Trade receivables 564 624 – –
Less allowance for doubtful accounts (39) (42) – –
525 582 – –
Unbilled rentals and tolls 298 292 – –
Prepaid expenses and other receivables 106 76 – –
Receivable from sale of INL shareholding – 272 – 272
Southern Cross support fees receivable – 44 – –
Due from subsidiaries – – 966 1,161
929 1,266 966 1,433
Sale of Shares in Listed CompaniesTelecom sold its entire stake in INL in June 2005 for total consideration of $272 million. This resulted in a gain on sale of $86 million being recognised in June 2005. Proceeds from the sale were received in July 2005, therefore at 30 June 2005 Telecom had recorded a receivable of $272 million.
Note 11 Inventories GROUP
30 JUNE 2006 2005(DOLLARS IN MILLIONS) $ $
Maintenance materials and consumables 8 4
Goods held for resale 38 39
Revenue work in progress 5 3
Materials for self-constructed assets – 13
51 59
Less provision for inventory obsolescence – (3)
51 56
Notes to the Financial Statements continued
Note 9 Short-term Derivative Assets GROUP
30 JUNE 2006 2005(DOLLARS IN MILLIONS) $ $
Foreign exchange forward contracts 22 –
Currency options 2 –
Interest rate swaps 2 –
26 –
The 2005 balances are presented as previously reported under NZ GAAP and have not been restated, as permitted by NZ IFRS 1 ‘First-time Adoption of New Zealand Equivalents to International Financial Reporting Standards’.

73
Note 12 Receivables Due After One Year GROUP
30 JUNE 2006 2005(DOLLARS IN MILLIONS) $ $
Loan to associate company 95 96
Other receivables 14 21
109 117
Note 13 Long-term Investments GROUP PARENT
30 JUNE 2006 2005 2006 2005(DOLLARS IN MILLIONS) $ $ $ $
Shares in unlisted companies 515 427 – –
Investment in associates 5 – – –
Subsidiary companies (see Note 30)
Shares – – 4,001 4,160
Term advances – – 3,006 3,838
520 427 7,007 7,998
Shares in Unlisted CompaniesShares in unlisted companies are classified as available for sale securities in accordance with NZ IAS 39 and include Telecom’s 19.9% stake in Hutchison 3G Australia Limited of A$400 million (30 June 2005: A$400 million). This investment is valued at cost as the fair value cannot be measured reliably as shares in this entity are not traded and the relatively immature nature of this entity means that a wide range of estimates of fair value exist.
Subsidiary Companies – Term AdvancesThese term advances have interest rates ranging between 0% and 10% (30 June 2005: 0% and 10%).
Associate CompaniesAssociate companies of the Telecom Group are listed in Note 30.
GROUP
30 JUNE 2006 2005(DOLLARS IN MILLIONS) $ $
Cost of investment in associates 36 31
Opening balance of share of associates’ equity (31) (31)
Equity accounted value of the investment 5 –
Extract from Associates’ Financial Statements
GROUP
30 JUNE 2006 2005(DOLLARS IN MILLIONS) $ $
Total assets 1,668 1,426
Total liabilities 2,098 1,785
Total revenues 192 175
Net earnings/(loss) 4 (1)

INTRODUCTION PERFORMANCE GOVERNANCE DISCLOSURESFINANCIALS
74
Note 14 Deferred Tax GROUP PROVISIONS30 JUNE 2006 TAX AND TAX(DOLLARS IN MILLIONS) DEPRECIATION ACCRUALS LOSSES OTHER TOTAL
Deferred tax:
Balance at beginning of the period (163) 36 – 6 (121)
NZ IFRS adjustment (see Note 38) – – – 21 21
(163) 36 – 27 (100)
Amounts recognised in earnings
Relating to the current period (59) (10) – 6 (63)
Adjustments in respect of prior periods 4 3 – – 7
Amounts recognised in equity
Relating to the current period – – – (3) (3)
Foreign exchange movement – – – 3 3
Other
Amounts relating to acquisition of subsidiary – – 70 – 70
(218) 29 70 33 (86)
Deferred tax assets – – – 31 31
Deferred tax liabilities (218) 29 70 2 (117)
(218) 29 70 33 (86)
GROUP PROVISIONS30 JUNE 2005 TAX AND TAX(DOLLARS IN MILLIONS) DEPRECIATION ACCRUALS LOSSES OTHER TOTAL
Deferred tax:
Balance at beginning of the period (152) 47 2 (9) (112)
Amounts recognised in earnings
Relating to the current period (11) (12) (2) 15 (10)
Adjustments in respect of prior periods – (2) – – (2)
Amounts recognised in equity
Foreign exchange movement – 3 – – 3
(163) 36 – 6 (121)
Deferred tax assets 5 4 – 23 32
Deferred tax liabilities (168) 32 – (17) (153)
(163) 36 – 6 (121)
The Telecom Group has not recognised in its deferred taxation balance the tax effect of accumulated losses and temporary differences in overseas subsidiaries amounting to $255 million at 30 June 2006 (30 June 2005: $94 million), based on the relevant corporation tax rate of the overseas subsidiary’s country of residence. Obtaining the benefits of the deferred tax balance is dependent upon deriving sufficient assessable income, meeting conditions for deductibility and complying with relevant tax legislation.
Notes to the Financial Statements continued
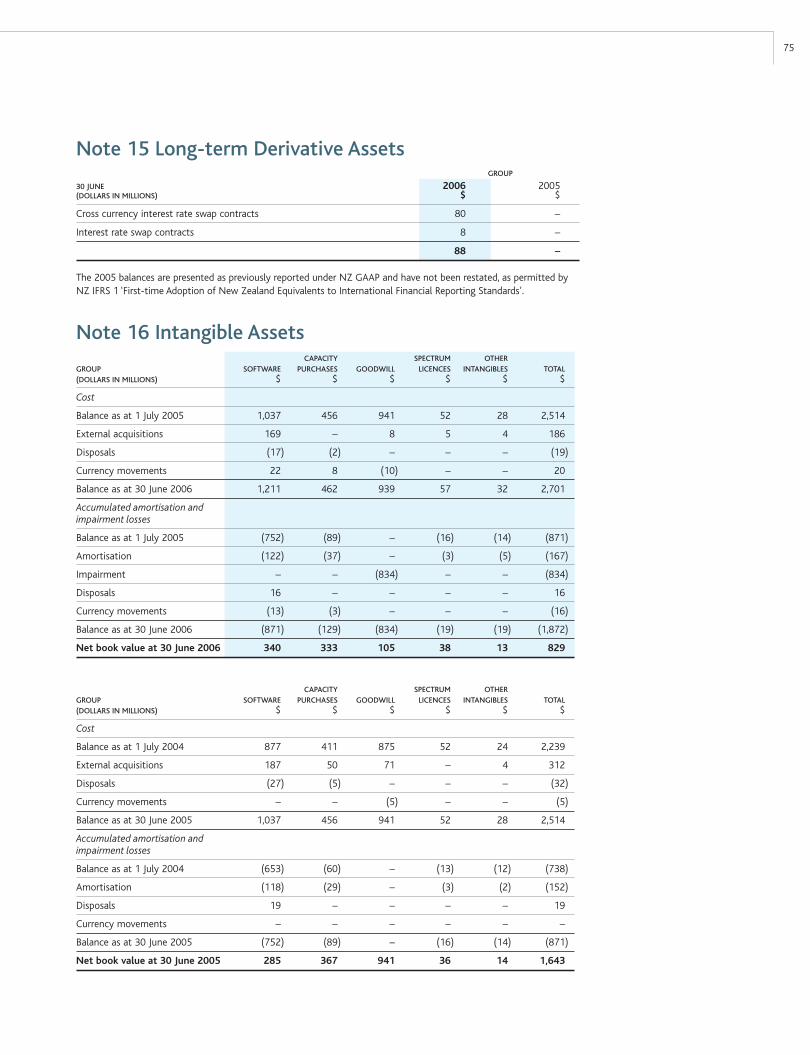
75
Note 15 Long-term Derivative Assets GROUP
30 JUNE 2006 2005(DOLLARS IN MILLIONS) $ $
Cross currency interest rate swap contracts 80 –
Interest rate swap contracts 8 –
88 –
The 2005 balances are presented as previously reported under NZ GAAP and have not been restated, as permitted by NZ IFRS 1 ‘First-time Adoption of New Zealand Equivalents to International Financial Reporting Standards’.
Note 16 Intangible Assets CAPACITY SPECTRUM OTHERGROUP SOFTWARE PURCHASES GOODWILL LICENCES INTANGIBLES TOTAL(DOLLARS IN MILLIONS) $ $ $ $ $ $
Cost
Balance as at 1 July 2005 1,037 456 941 52 28 2,514
External acquisitions 169 – 8 5 4 186
Disposals (17) (2) – – – (19)
Currency movements 22 8 (10) – – 20
Balance as at 30 June 2006 1,211 462 939 57 32 2,701
Accumulated amortisation and impairment losses
Balance as at 1 July 2005 (752) (89) – (16) (14) (871)
Amortisation (122) (37) – (3) (5) (167)
Impairment – – (834) – – (834)
Disposals 16 – – – – 16
Currency movements (13) (3) – – – (16)
Balance as at 30 June 2006 (871) (129) (834) (19) (19) (1,872)
Net book value at 30 June 2006 340 333 105 38 13 829
CAPACITY SPECTRUM OTHERGROUP SOFTWARE PURCHASES GOODWILL LICENCES INTANGIBLES TOTAL(DOLLARS IN MILLIONS) $ $ $ $ $ $
Cost
Balance as at 1 July 2004 877 411 875 52 24 2,239
External acquisitions 187 50 71 – 4 312
Disposals (27) (5) – – – (32)
Currency movements – – (5) – – (5)
Balance as at 30 June 2005 1,037 456 941 52 28 2,514
Accumulated amortisation and impairment losses
Balance as at 1 July 2004 (653) (60) – (13) (12) (738)
Amortisation (118) (29) – (3) (2) (152)
Disposals 19 – – – – 19
Currency movements – – – – – –
Balance as at 30 June 2005 (752) (89) – (16) (14) (871)
Net book value at 30 June 2005 285 367 941 36 14 1,643
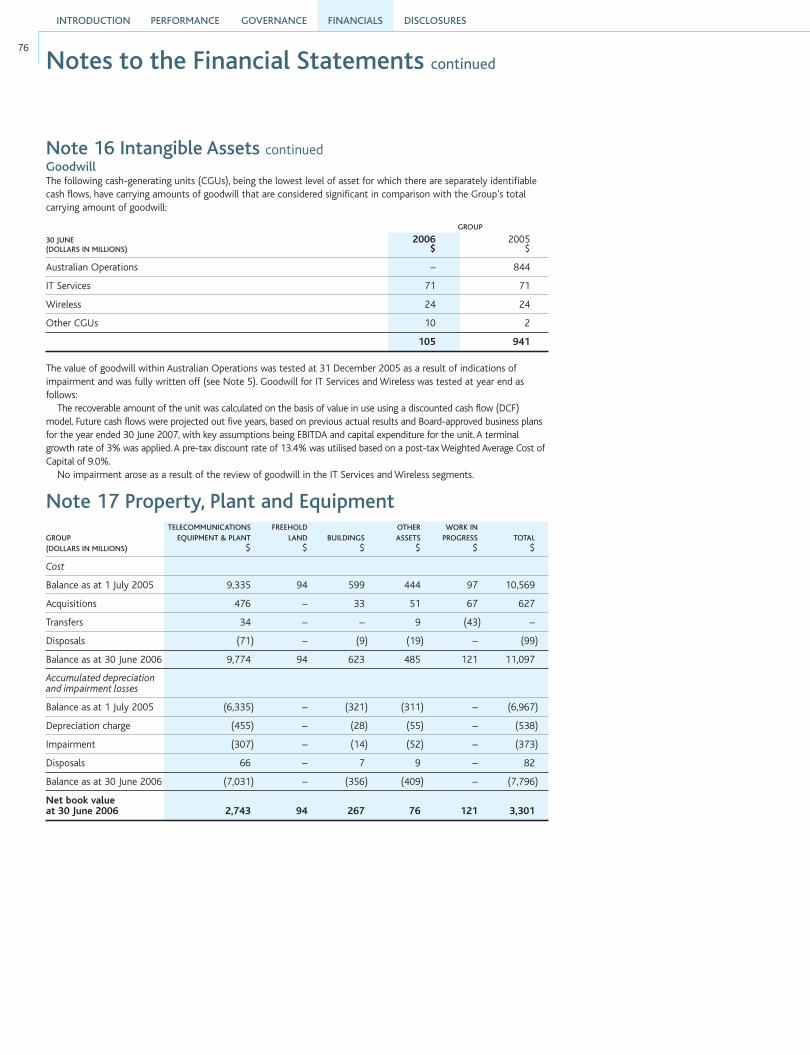
INTRODUCTION PERFORMANCE GOVERNANCE DISCLOSURESFINANCIALS
76
Notes to the Financial Statements continued
Note 16 Intangible Assets continuedGoodwillThe following cash-generating units (CGUs), being the lowest level of asset for which there are separately identifiable cash flows, have carrying amounts of goodwill that are considered significant in comparison with the Group’s total carrying amount of goodwill:
GROUP
30 JUNE 2006 2005(DOLLARS IN MILLIONS) $ $
Australian Operations – 844
IT Services 71 71
Wireless 24 24
Other CGUs 10 2
105 941
The value of goodwill within Australian Operations was tested at 31 December 2005 as a result of indications of impairment and was fully written off (see Note 5). Goodwill for IT Services and Wireless was tested at year end as follows:
The recoverable amount of the unit was calculated on the basis of value in use using a discounted cash flow (DCF) model. Future cash flows were projected out five years, based on previous actual results and Board-approved business plans for the year ended 30 June 2007, with key assumptions being EBITDA and capital expenditure for the unit. A terminal growth rate of 3% was applied. A pre-tax discount rate of 13.4% was utilised based on a post-tax Weighted Average Cost of Capital of 9.0%.
No impairment arose as a result of the review of goodwill in the IT Services and Wireless segments.
Note 17 Property, Plant and Equipment TELECOMMUNICATIONS FREEHOLD OTHER WORK INGROUP EQUIPMENT & PLANT LAND BUILDINGS ASSETS PROGRESS TOTAL(DOLLARS IN MILLIONS) $ $ $ $ $ $
Cost
Balance as at 1 July 2005 9,335 94 599 444 97 10,569
Acquisitions 476 – 33 51 67 627
Transfers 34 – – 9 (43) –
Disposals (71) – (9) (19) – (99)
Balance as at 30 June 2006 9,774 94 623 485 121 11,097
Accumulated depreciationand impairment losses
Balance as at 1 July 2005 (6,335) – (321) (311) – (6,967)
Depreciation charge (455) – (28) (55) – (538)
Impairment (307) – (14) (52) – (373)
Disposals 66 – 7 9 – 82
Balance as at 30 June 2006 (7,031) – (356) (409) – (7,796)
Net book value at 30 June 2006 2,743 94 267 76 121 3,301
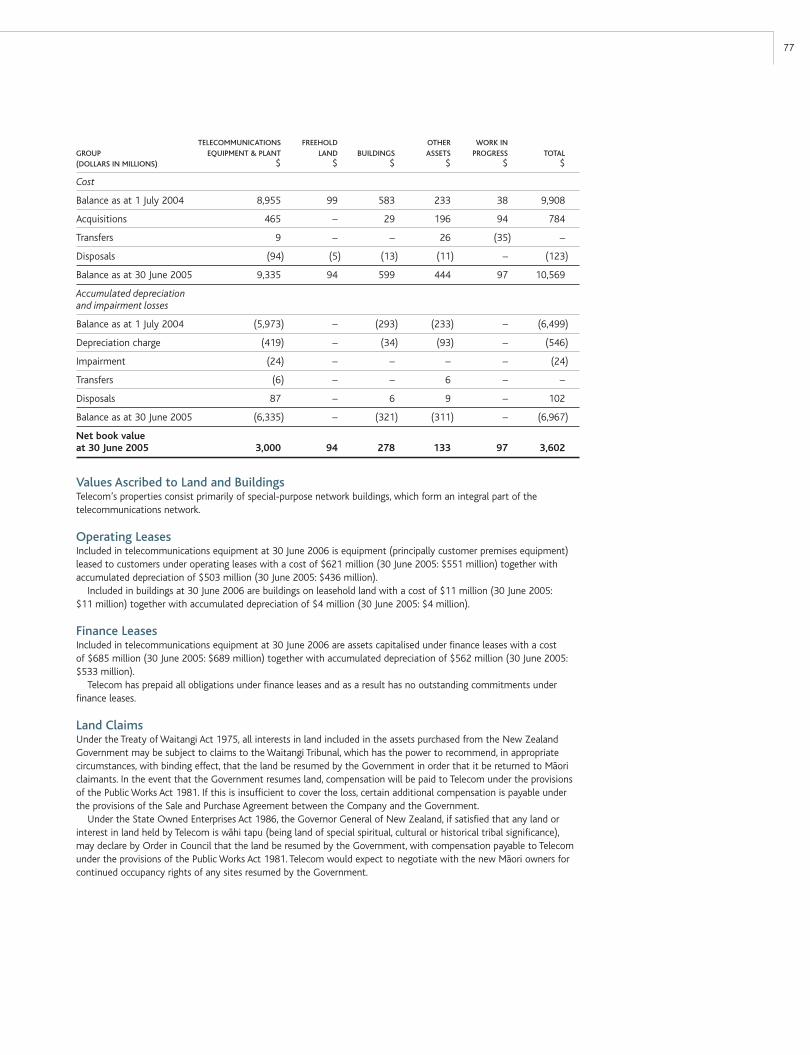
77
TELECOMMUNICATIONS FREEHOLD OTHER WORK INGROUP EQUIPMENT & PLANT LAND BUILDINGS ASSETS PROGRESS TOTAL(DOLLARS IN MILLIONS) $ $ $ $ $ $
Cost
Balance as at 1 July 2004 8,955 99 583 233 38 9,908
Acquisitions 465 – 29 196 94 784
Transfers 9 – – 26 (35) –
Disposals (94) (5) (13) (11) – (123)
Balance as at 30 June 2005 9,335 94 599 444 97 10,569
Accumulated depreciationand impairment losses
Balance as at 1 July 2004 (5,973) – (293) (233) – (6,499)
Depreciation charge (419) – (34) (93) – (546)
Impairment (24) – – – – (24)
Transfers (6) – – 6 – –
Disposals 87 – 6 9 – 102
Balance as at 30 June 2005 (6,335) – (321) (311) – (6,967)
Net book value at 30 June 2005 3,000 94 278 133 97 3,602
Values Ascribed to Land and BuildingsTelecom’s properties consist primarily of special-purpose network buildings, which form an integral part of the telecommunications network.
Operating LeasesIncluded in telecommunications equipment at 30 June 2006 is equipment (principally customer premises equipment) leased to customers under operating leases with a cost of $621 million (30 June 2005: $551 million) together with accumulated depreciation of $503 million (30 June 2005: $436 million).
Included in buildings at 30 June 2006 are buildings on leasehold land with a cost of $11 million (30 June 2005: $11 million) together with accumulated depreciation of $4 million (30 June 2005: $4 million).
Finance LeasesIncluded in telecommunications equipment at 30 June 2006 are assets capitalised under finance leases with a cost of $685 million (30 June 2005: $689 million) together with accumulated depreciation of $562 million (30 June 2005: $533 million).
Telecom has prepaid all obligations under finance leases and as a result has no outstanding commitments under finance leases.
Land ClaimsUnder the Treaty of Waitangi Act 1975, all interests in land included in the assets purchased from the New Zealand Government may be subject to claims to the Waitangi Tribunal, which has the power to recommend, in appropriate circumstances, with binding effect, that the land be resumed by the Government in order that it be returned to M-aori claimants. In the event that the Government resumes land, compensation will be paid to Telecom under the provisions of the Public Works Act 1981. If this is insufficient to cover the loss, certain additional compensation is payable under the provisions of the Sale and Purchase Agreement between the Company and the Government.
Under the State Owned Enterprises Act 1986, the Governor General of New Zealand, if satisfied that any land or interest in land held by Telecom is w-ahi tapu (being land of special spiritual, cultural or historical tribal significance), may declare by Order in Council that the land be resumed by the Government, with compensation payable to Telecom under the provisions of the Public Works Act 1981. Telecom would expect to negotiate with the new M-aori owners for continued occupancy rights of any sites resumed by the Government.

INTRODUCTION PERFORMANCE GOVERNANCE DISCLOSURESFINANCIALS
78
Note 20 Debt Due Within One Year GROUP
30 JUNE 2006 2005(DOLLARS IN MILLIONS) $ $
Long-term debt maturing within one year (see Note 22) 580 545
Short-term debt 375 318
955 863
None of Telecom’s debt due within one year is secured. The 2005 balances are presented as previously reported under NZ GAAP and have not been restated, as permitted by NZ IFRS 1 ‘First-time Adoption of New Zealand Equivalents to International Financial Reporting Standards’.
Note 21 Long-term Derivative Liabilities GROUP
30 JUNE 2006 2005(DOLLARS IN MILLIONS) $ $
Cross currency interest rate swaps 310 –
Interest rate swaps 49 –
Electricity price hedges 3 –
362 –
The 2005 balances are presented as previously reported under NZ GAAP and have not been restated, as permitted by NZ IFRS 1 ‘First-time Adoption of New Zealand Equivalents to International Financial Reporting Standards’.
Notes to the Financial Statements continued
Note 19 Short-term Derivative Liabilities GROUP
30 JUNE 2006 2005(DOLLARS IN MILLIONS) $ $
Cross currency interest rate swaps 124 –
Interest rate swaps 1 –
125 –
The 2005 balances are presented as previously reported under NZ GAAP and have not been restated, as permitted by NZ IFRS 1 ‘First-time Adoption of New Zealand Equivalents to International Financial Reporting Standards’.
Note 18 Accounts Payable and Accruals GROUP PARENT
30 JUNE 2006 2005 2006 2005(DOLLARS IN MILLIONS) $ $ $ $
Trade accounts payable 730 702 – –
Accrued personnel costs 121 121 – –
Revenue billed in advance 104 120 – –
Accrued interest 40 49 – –
Other accrued expenses 44 52 22 16
1,039 1,044 22 16

79
Euro Medium Term Notes
30 JUNE GROUP
(DOLLARS IN MILLIONS) FACE 2006 2005RATE DUE VALUE $ $
6.0% 14 Mar 2006 100m GBP – 332
1.85% 5 June 2007 20bn JPY 287 412
6.125% 12 Dec 2008 200m GBP 604 690
2.0% 8 June 2009 2bn JPY 29 41
6.75% 14 Dec 2011 250m USD 409 527
5.625% 14 May 2018 125m GBP 378 346
5.75% 6 April 2020 150m GBP 453 390
2,160 2,738
The 2005 balances are presented as previously reported under NZ GAAP and have not been restated, as permitted by NZ IFRS 1 ‘First-time Adoption of New Zealand Equivalents to International Financial Reporting Standards’.
Cross currency and interest rate swaps have been entered into to manage the Euro Medium Term Notes currency and interest rate risk exposures. See Note 26.
Note 22 Long-term Debt GROUP
30 JUNE 2006 2005(DOLLARS IN MILLIONS) $ $
Euro Medium Term Notes (EMTN) 2,160 2,738
Capital Notes 321 327
TeleBonds 659 321
Eurobonds – 150
3,140 3,536
Less unamortised discount (17) (18)
3,123 3,518
Less long-term debt maturing within one year (see Note 20) (580) (545)
2,543 2,973
Schedule of Maturities
Due 1 to 2 years 238 703
Due 2 to 3 years 643 243
Due 3 to 4 years 14 740
Due 4 to 5 years 14 15
Due over 5 years 1,634 1,272
Total due after one year 2,543 2,973
None of Telecom’s long-term debt is secured. The 2005 balances are presented as previously reported under NZ GAAP and have not been restated, as permitted by NZ IFRS 1 ‘First-time Adoption of New Zealand Equivalents to International Financial Reporting Standards’.
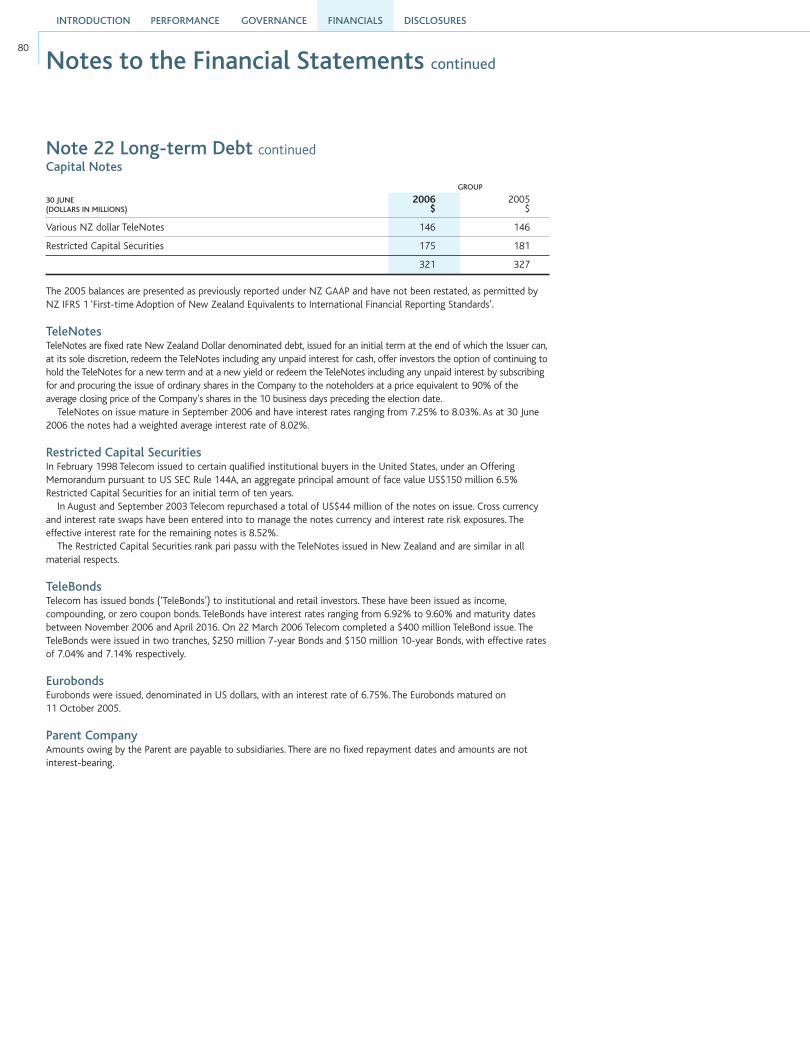
INTRODUCTION PERFORMANCE GOVERNANCE DISCLOSURESFINANCIALS
80
Note 22 Long-term Debt continuedCapital Notes
GROUP
30 JUNE 2006 2005(DOLLARS IN MILLIONS) $ $
Various NZ dollar TeleNotes 146 146
Restricted Capital Securities 175 181
321 327 The 2005 balances are presented as previously reported under NZ GAAP and have not been restated, as permitted by NZ IFRS 1 ‘First-time Adoption of New Zealand Equivalents to International Financial Reporting Standards’.
TeleNotes TeleNotes are fixed rate New Zealand Dollar denominated debt, issued for an initial term at the end of which the Issuer can, at its sole discretion, redeem the TeleNotes including any unpaid interest for cash, offer investors the option of continuing to hold the TeleNotes for a new term and at a new yield or redeem the TeleNotes including any unpaid interest by subscribing for and procuring the issue of ordinary shares in the Company to the noteholders at a price equivalent to 90% of the average closing price of the Company’s shares in the 10 business days preceding the election date.
TeleNotes on issue mature in September 2006 and have interest rates ranging from 7.25% to 8.03%. As at 30 June 2006 the notes had a weighted average interest rate of 8.02%.
Restricted Capital SecuritiesIn February 1998 Telecom issued to certain qualified institutional buyers in the United States, under an Offering Memorandum pursuant to US SEC Rule 144A, an aggregate principal amount of face value US$150 million 6.5% Restricted Capital Securities for an initial term of ten years.
In August and September 2003 Telecom repurchased a total of US$44 million of the notes on issue. Cross currency and interest rate swaps have been entered into to manage the notes currency and interest rate risk exposures. The effective interest rate for the remaining notes is 8.52%.
The Restricted Capital Securities rank pari passu with the TeleNotes issued in New Zealand and are similar in all material respects.
TeleBondsTelecom has issued bonds (‘TeleBonds’) to institutional and retail investors. These have been issued as income, compounding, or zero coupon bonds. TeleBonds have interest rates ranging from 6.92% to 9.60% and maturity dates between November 2006 and April 2016. On 22 March 2006 Telecom completed a $400 million TeleBond issue. The TeleBonds were issued in two tranches, $250 million 7-year Bonds and $150 million 10-year Bonds, with effective rates of 7.04% and 7.14% respectively.
EurobondsEurobonds were issued, denominated in US dollars, with an interest rate of 6.75%. The Eurobonds matured on 11 October 2005.
Parent CompanyAmounts owing by the Parent are payable to subsidiaries. There are no fixed repayment dates and amounts are not interest-bearing.
Notes to the Financial Statements continued
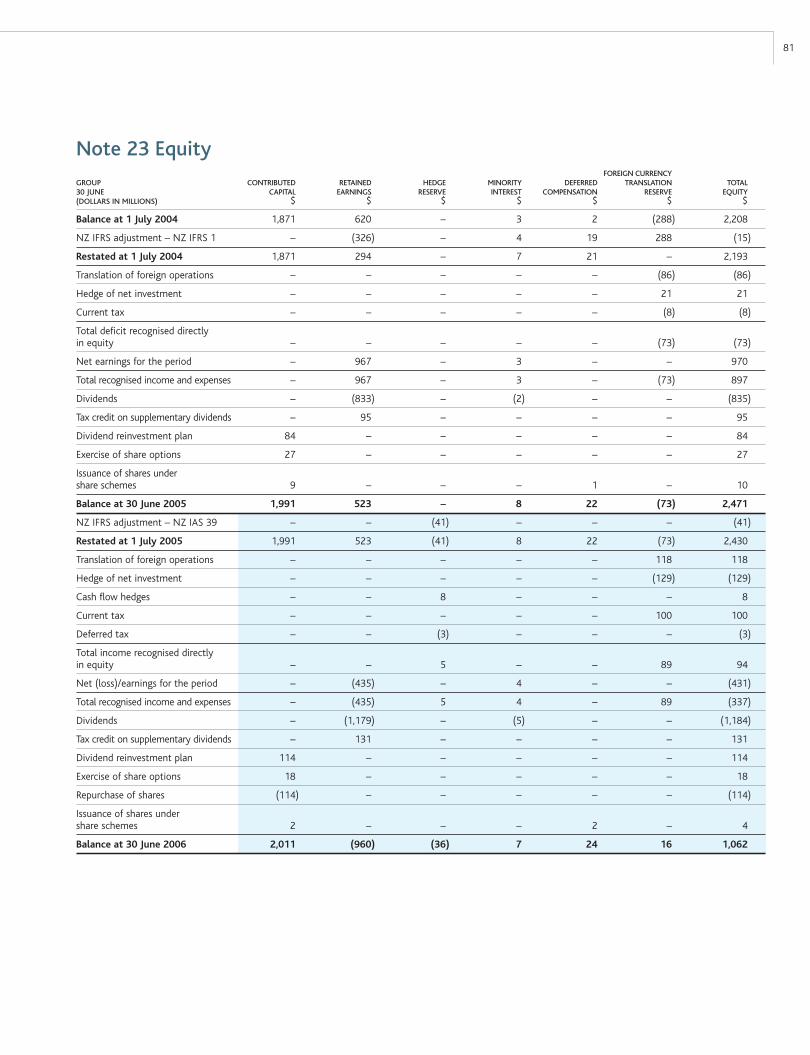
81
Note 23 Equity FOREIGN CURRENCYGROUP CONTRIBUTED RETAINED HEDGE MINORITY DEFERRED TRANSLATION TOTAL 30 JUNE CAPITAL EARNINGS RESERVE INTEREST COMPENSATION RESERVE EQUITY(DOLLARS IN MILLIONS) $ $ $ $ $ $ $
Balance at 1 July 2004 1,871 620 – 3 2 (288) 2,208
NZ IFRS adjustment – NZ IFRS 1 – (326) – 4 19 288 (15)
Restated at 1 July 2004 1,871 294 – 7 21 – 2,193
Translation of foreign operations – – – – – (86) (86)
Hedge of net investment – – – – – 21 21
Current tax – – – – – (8) (8)
Total deficit recognised directly in equity – – – – – (73) (73)
Net earnings for the period – 967 – 3 – – 970
Total recognised income and expenses – 967 – 3 – (73) 897
Dividends – (833) – (2) – – (835)
Tax credit on supplementary dividends – 95 – – – – 95
Dividend reinvestment plan 84 – – – – – 84
Exercise of share options 27 – – – – – 27
Issuance of shares under share schemes 9 – – – 1 – 10
Balance at 30 June 2005 1,991 523 – 8 22 (73) 2,471
NZ IFRS adjustment – NZ IAS 39 – – (41) – – – (41)
Restated at 1 July 2005 1,991 523 (41) 8 22 (73) 2,430
Translation of foreign operations – – – – – 118 118
Hedge of net investment – – – – – (129) (129)
Cash flow hedges – – 8 – – – 8
Current tax – – – – – 100 100
Deferred tax – – (3) – – – (3)
Total income recognised directly in equity – – 5 – – 89 94
Net (loss)/earnings for the period – (435) – 4 – – (431)
Total recognised income and expenses – (435) 5 4 – 89 (337)
Dividends – (1,179) – (5) – – (1,184)
Tax credit on supplementary dividends – 131 – – – – 131
Dividend reinvestment plan 114 – – – – – 114
Exercise of share options 18 – – – – – 18
Repurchase of shares (114) – – – – – (114)
Issuance of shares under share schemes 2 – – – 2 – 4
Balance at 30 June 2006 2,011 (960) (36) 7 24 16 1,062
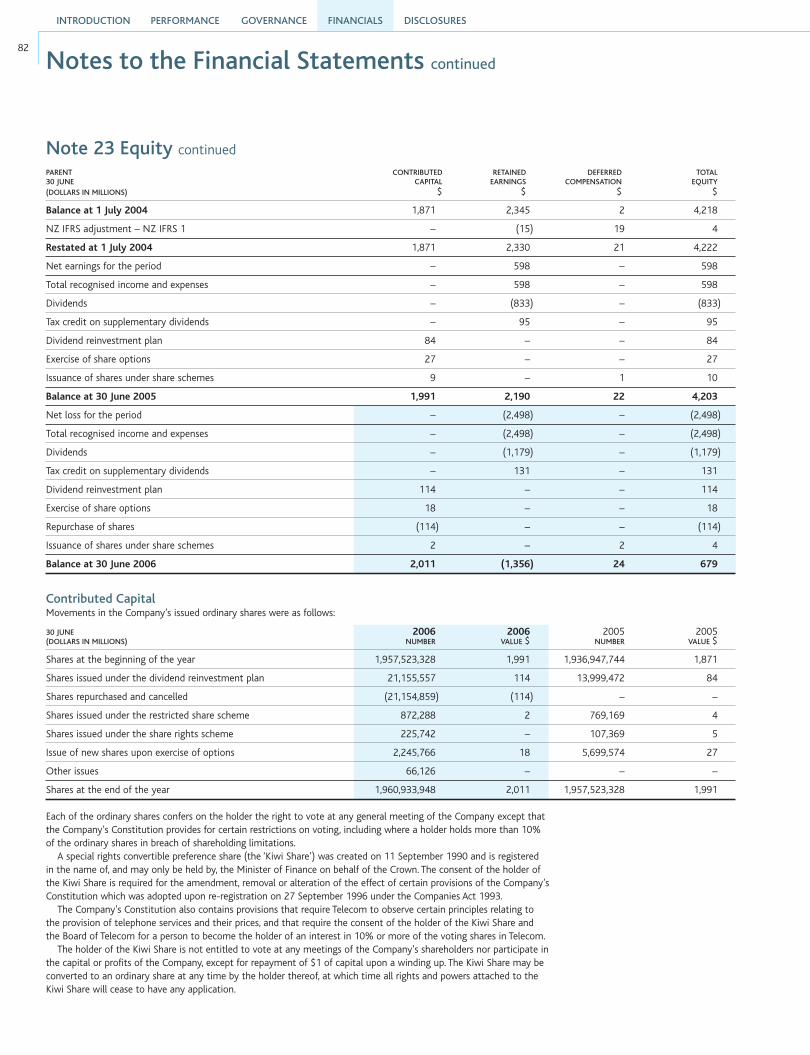
INTRODUCTION PERFORMANCE GOVERNANCE DISCLOSURESFINANCIALS
82
Note 23 Equity continued
PARENT CONTRIBUTED RETAINED DEFERRED TOTAL 30 JUNE CAPITAL EARNINGS COMPENSATION EQUITY(DOLLARS IN MILLIONS) $ $ $ $
Balance at 1 July 2004 1,871 2,345 2 4,218
NZ IFRS adjustment – NZ IFRS 1 – (15) 19 4
Restated at 1 July 2004 1,871 2,330 21 4,222
Net earnings for the period – 598 – 598
Total recognised income and expenses – 598 – 598
Dividends – (833) – (833)
Tax credit on supplementary dividends – 95 – 95
Dividend reinvestment plan 84 – – 84
Exercise of share options 27 – – 27
Issuance of shares under share schemes 9 – 1 10
Balance at 30 June 2005 1,991 2,190 22 4,203
Net loss for the period – (2,498) – (2,498)
Total recognised income and expenses – (2,498) – (2,498)
Dividends – (1,179) – (1,179)
Tax credit on supplementary dividends – 131 – 131
Dividend reinvestment plan 114 – – 114
Exercise of share options 18 – – 18
Repurchase of shares (114) – – (114)
Issuance of shares under share schemes 2 – 2 4
Balance at 30 June 2006 2,011 (1,356) 24 679
Contributed CapitalMovements in the Company’s issued ordinary shares were as follows:
30 JUNE 2006 2006 2005 2005(DOLLARS IN MILLIONS) NUMBER VALUE $ NUMBER VALUE $
Shares at the beginning of the year 1,957,523,328 1,991 1,936,947,744 1,871
Shares issued under the dividend reinvestment plan 21,155,557 114 13,999,472 84
Shares repurchased and cancelled (21,154,859) (114) – –
Shares issued under the restricted share scheme 872,288 2 769,169 4
Shares issued under the share rights scheme 225,742 – 107,369 5
Issue of new shares upon exercise of options 2,245,766 18 5,699,574 27
Other issues 66,126 – – –
Shares at the end of the year 1,960,933,948 2,011 1,957,523,328 1,991
Each of the ordinary shares confers on the holder the right to vote at any general meeting of the Company except that the Company’s Constitution provides for certain restrictions on voting, including where a holder holds more than 10% of the ordinary shares in breach of shareholding limitations.
A special rights convertible preference share (the ‘Kiwi Share’) was created on 11 September 1990 and is registered in the name of, and may only be held by, the Minister of Finance on behalf of the Crown. The consent of the holder of the Kiwi Share is required for the amendment, removal or alteration of the effect of certain provisions of the Company’s Constitution which was adopted upon re-registration on 27 September 1996 under the Companies Act 1993.
The Company’s Constitution also contains provisions that require Telecom to observe certain principles relating to the provision of telephone services and their prices, and that require the consent of the holder of the Kiwi Share and the Board of Telecom for a person to become the holder of an interest in 10% or more of the voting shares in Telecom.
The holder of the Kiwi Share is not entitled to vote at any meetings of the Company’s shareholders nor participate in the capital or profits of the Company, except for repayment of $1 of capital upon a winding up. The Kiwi Share may be converted to an ordinary share at any time by the holder thereof, at which time all rights and powers attached to the Kiwi Share will cease to have any application.
Notes to the Financial Statements continued
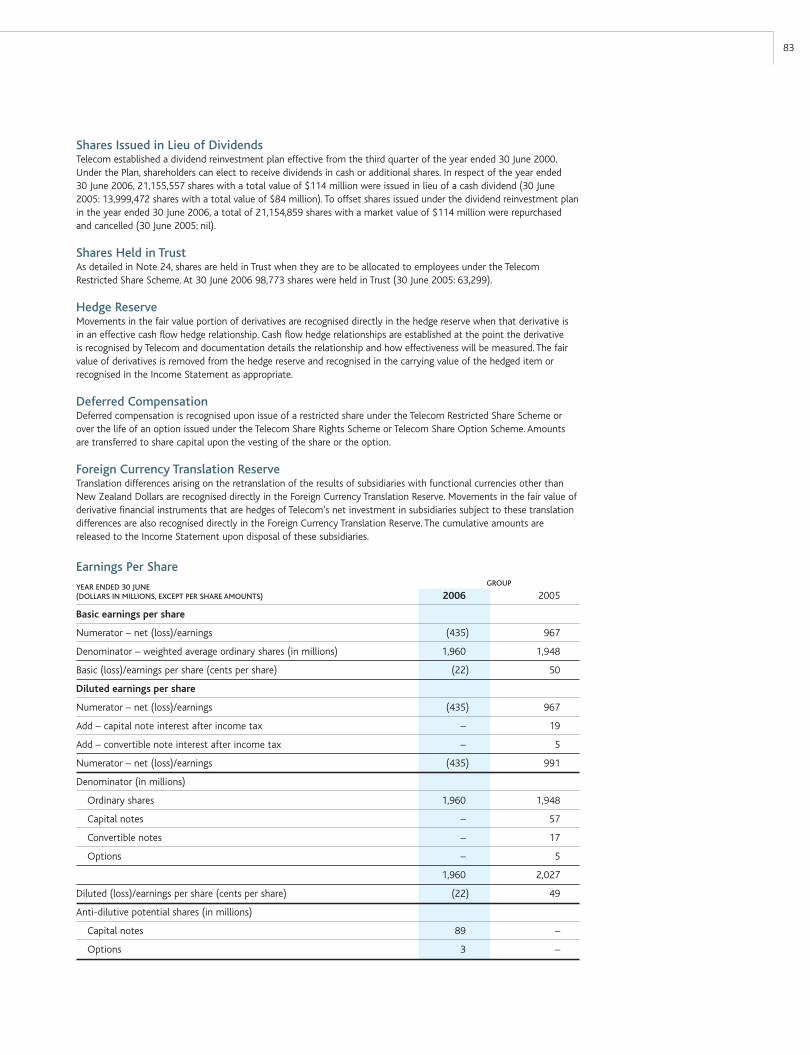
83
Earnings Per Share
YEAR ENDED 30 JUNE GROUP
(DOLLARS IN MILLIONS, EXCEPT PER SHARE AMOUNTS) 2006 2005
Basic earnings per share
Numerator – net (loss)/earnings (435) 967
Denominator – weighted average ordinary shares (in millions) 1,960 1,948
Basic (loss)/earnings per share (cents per share) (22) 50
Diluted earnings per share
Numerator – net (loss)/earnings (435) 967
Add – capital note interest after income tax – 19
Add – convertible note interest after income tax – 5
Numerator – net (loss)/earnings (435) 991
Denominator (in millions)
Ordinary shares 1,960 1,948
Capital notes – 57
Convertible notes – 17
Options – 5
1,960 2,027
Diluted (loss)/earnings per share (cents per share) (22) 49
Anti-dilutive potential shares (in millions)
Capital notes 89 –
Options 3 –
Shares Issued in Lieu of DividendsTelecom established a dividend reinvestment plan effective from the third quarter of the year ended 30 June 2000. Under the Plan, shareholders can elect to receive dividends in cash or additional shares. In respect of the year ended 30 June 2006, 21,155,557 shares with a total value of $114 million were issued in lieu of a cash dividend (30 June 2005: 13,999,472 shares with a total value of $84 million). To offset shares issued under the dividend reinvestment plan in the year ended 30 June 2006, a total of 21,154,859 shares with a market value of $114 million were repurchased and cancelled (30 June 2005: nil).
Shares Held in TrustAs detailed in Note 24, shares are held in Trust when they are to be allocated to employees under the Telecom Restricted Share Scheme. At 30 June 2006 98,773 shares were held in Trust (30 June 2005: 63,299).
Hedge ReserveMovements in the fair value portion of derivatives are recognised directly in the hedge reserve when that derivative is in an effective cash flow hedge relationship. Cash flow hedge relationships are established at the point the derivative is recognised by Telecom and documentation details the relationship and how effectiveness will be measured. The fair value of derivatives is removed from the hedge reserve and recognised in the carrying value of the hedged item or recognised in the Income Statement as appropriate.
Deferred CompensationDeferred compensation is recognised upon issue of a restricted share under the Telecom Restricted Share Scheme or over the life of an option issued under the Telecom Share Rights Scheme or Telecom Share Option Scheme. Amounts are transferred to share capital upon the vesting of the share or the option.
Foreign Currency Translation ReserveTranslation differences arising on the retranslation of the results of subsidiaries with functional currencies other than New Zealand Dollars are recognised directly in the Foreign Currency Translation Reserve. Movements in the fair value of derivative financial instruments that are hedges of Telecom’s net investment in subsidiaries subject to these translation differences are also recognised directly in the Foreign Currency Translation Reserve. The cumulative amounts are released to the Income Statement upon disposal of these subsidiaries.
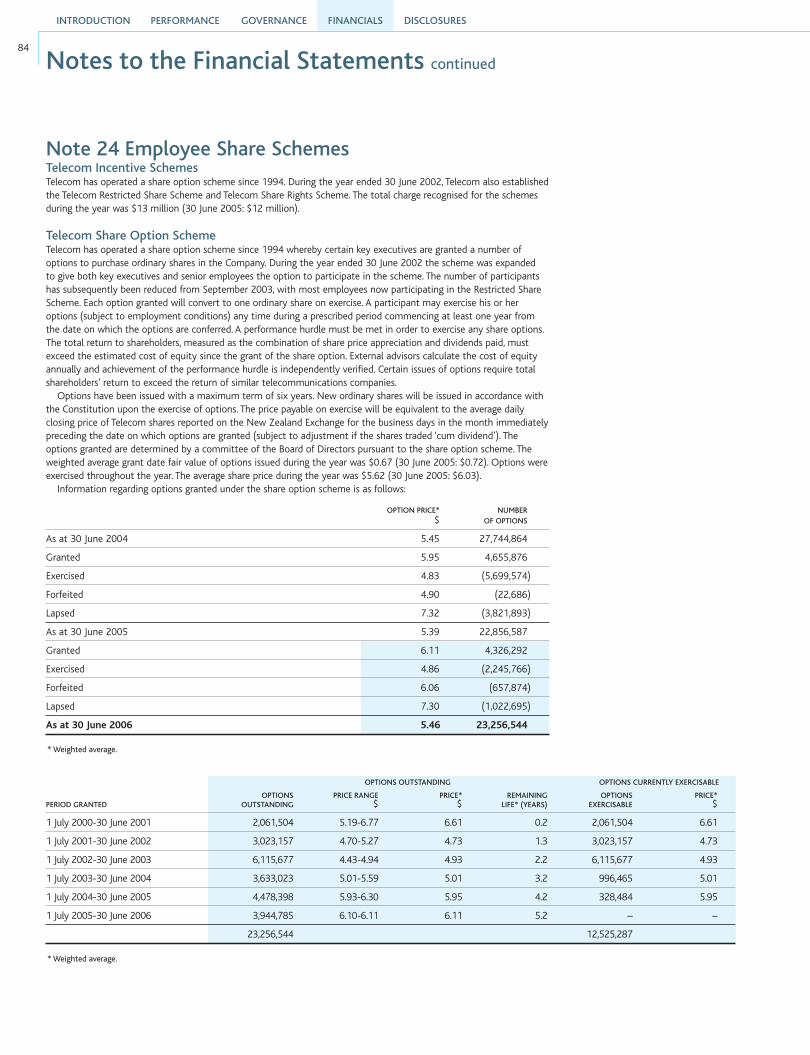
INTRODUCTION PERFORMANCE GOVERNANCE DISCLOSURESFINANCIALS
84
Note 24 Employee Share SchemesTelecom Incentive SchemesTelecom has operated a share option scheme since 1994. During the year ended 30 June 2002, Telecom also established the Telecom Restricted Share Scheme and Telecom Share Rights Scheme. The total charge recognised for the schemes during the year was $13 million (30 June 2005: $12 million).
Telecom Share Option SchemeTelecom has operated a share option scheme since 1994 whereby certain key executives are granted a number of options to purchase ordinary shares in the Company. During the year ended 30 June 2002 the scheme was expanded to give both key executives and senior employees the option to participate in the scheme. The number of participants has subsequently been reduced from September 2003, with most employees now participating in the Restricted Share Scheme. Each option granted will convert to one ordinary share on exercise. A participant may exercise his or her options (subject to employment conditions) any time during a prescribed period commencing at least one year from the date on which the options are conferred. A performance hurdle must be met in order to exercise any share options. The total return to shareholders, measured as the combination of share price appreciation and dividends paid, must exceed the estimated cost of equity since the grant of the share option. External advisors calculate the cost of equity annually and achievement of the performance hurdle is independently verified. Certain issues of options require total shareholders’ return to exceed the return of similar telecommunications companies.
Options have been issued with a maximum term of six years. New ordinary shares will be issued in accordance with the Constitution upon the exercise of options. The price payable on exercise will be equivalent to the average daily closing price of Telecom shares reported on the New Zealand Exchange for the business days in the month immediately preceding the date on which options are granted (subject to adjustment if the shares traded ‘cum dividend’). The options granted are determined by a committee of the Board of Directors pursuant to the share option scheme. The weighted average grant date fair value of options issued during the year was $0.67 (30 June 2005: $0.72). Options were exercised throughout the year. The average share price during the year was $5.62 (30 June 2005: $6.03).
Information regarding options granted under the share option scheme is as follows:
OPTION PRICE* NUMBER $ OF OPTIONS
As at 30 June 2004 5.45 27,744,864
Granted 5.95 4,655,876
Exercised 4.83 (5,699,574)
Forfeited 4.90 (22,686)
Lapsed 7.32 (3,821,893)
As at 30 June 2005 5.39 22,856,587
Granted 6.11 4,326,292
Exercised 4.86 (2,245,766)
Forfeited 6.06 (657,874)
Lapsed 7.30 (1,022,695)
As at 30 June 2006 5.46 23,256,544
* Weighted average.
OPTIONS OUTSTANDING OPTIONS CURRENTLY EXERCISABLE
OPTIONS PRICE RANGE PRICE* REMAINING OPTIONS PRICE*PERIOD GRANTED OUTSTANDING $ $ LIFE* (YEARS) EXERCISABLE $
1 July 2000-30 June 2001 2,061,504 5.19-6.77 6.61 0.2 2,061,504 6.61
1 July 2001-30 June 2002 3,023,157 4.70-5.27 4.73 1.3 3,023,157 4.73
1 July 2002-30 June 2003 6,115,677 4.43-4.94 4.93 2.2 6,115,677 4.93
1 July 2003-30 June 2004 3,633,023 5.01-5.59 5.01 3.2 996,465 5.01
1 July 2004-30 June 2005 4,478,398 5.93-6.30 5.95 4.2 328,484 5.95
1 July 2005-30 June 2006 3,944,785 6.10-6.11 6.11 5.2 – –
23,256,544 12,525,287
* Weighted average.
Notes to the Financial Statements continued
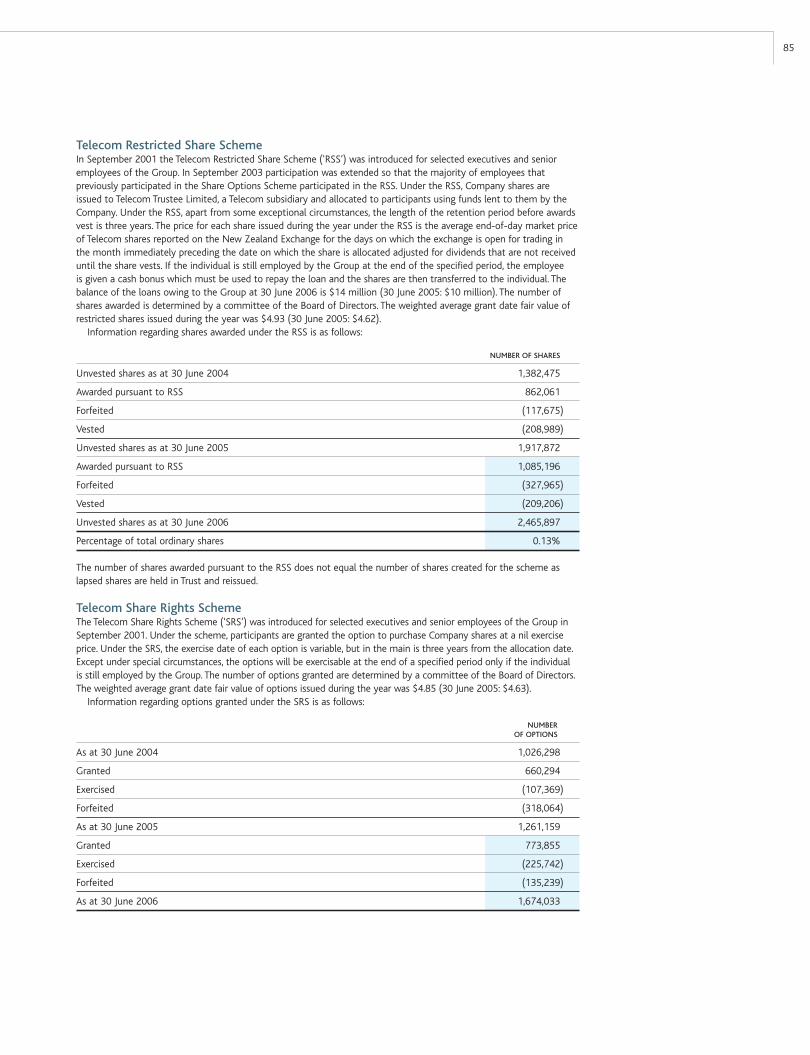
85
Telecom Restricted Share SchemeIn September 2001 the Telecom Restricted Share Scheme (‘RSS’) was introduced for selected executives and senior employees of the Group. In September 2003 participation was extended so that the majority of employees that previously participated in the Share Options Scheme participated in the RSS. Under the RSS, Company shares are issued to Telecom Trustee Limited, a Telecom subsidiary and allocated to participants using funds lent to them by the Company. Under the RSS, apart from some exceptional circumstances, the length of the retention period before awards vest is three years. The price for each share issued during the year under the RSS is the average end-of-day market price of Telecom shares reported on the New Zealand Exchange for the days on which the exchange is open for trading in the month immediately preceding the date on which the share is allocated adjusted for dividends that are not received until the share vests. If the individual is still employed by the Group at the end of the specified period, the employee is given a cash bonus which must be used to repay the loan and the shares are then transferred to the individual. The balance of the loans owing to the Group at 30 June 2006 is $14 million (30 June 2005: $10 million). The number of shares awarded is determined by a committee of the Board of Directors. The weighted average grant date fair value of restricted shares issued during the year was $4.93 (30 June 2005: $4.62).
Information regarding shares awarded under the RSS is as follows:
NUMBER OF SHARES
Unvested shares as at 30 June 2004 1,382,475
Awarded pursuant to RSS 862,061
Forfeited (117,675)
Vested (208,989)
Unvested shares as at 30 June 2005 1,917,872
Awarded pursuant to RSS 1,085,196
Forfeited (327,965)
Vested (209,206)
Unvested shares as at 30 June 2006 2,465,897
Percentage of total ordinary shares 0.13%
The number of shares awarded pursuant to the RSS does not equal the number of shares created for the scheme as lapsed shares are held in Trust and reissued.
Telecom Share Rights Scheme The Telecom Share Rights Scheme (‘SRS’) was introduced for selected executives and senior employees of the Group in September 2001. Under the scheme, participants are granted the option to purchase Company shares at a nil exercise price. Under the SRS, the exercise date of each option is variable, but in the main is three years from the allocation date. Except under special circumstances, the options will be exercisable at the end of a specified period only if the individual is still employed by the Group. The number of options granted are determined by a committee of the Board of Directors. The weighted average grant date fair value of options issued during the year was $4.85 (30 June 2005: $4.63).
Information regarding options granted under the SRS is as follows:
NUMBER OF OPTIONS
As at 30 June 2004 1,026,298
Granted 660,294
Exercised (107,369)
Forfeited (318,064)
As at 30 June 2005 1,261,159
Granted 773,855
Exercised (225,742)
Forfeited (135,239)
As at 30 June 2006 1,674,033
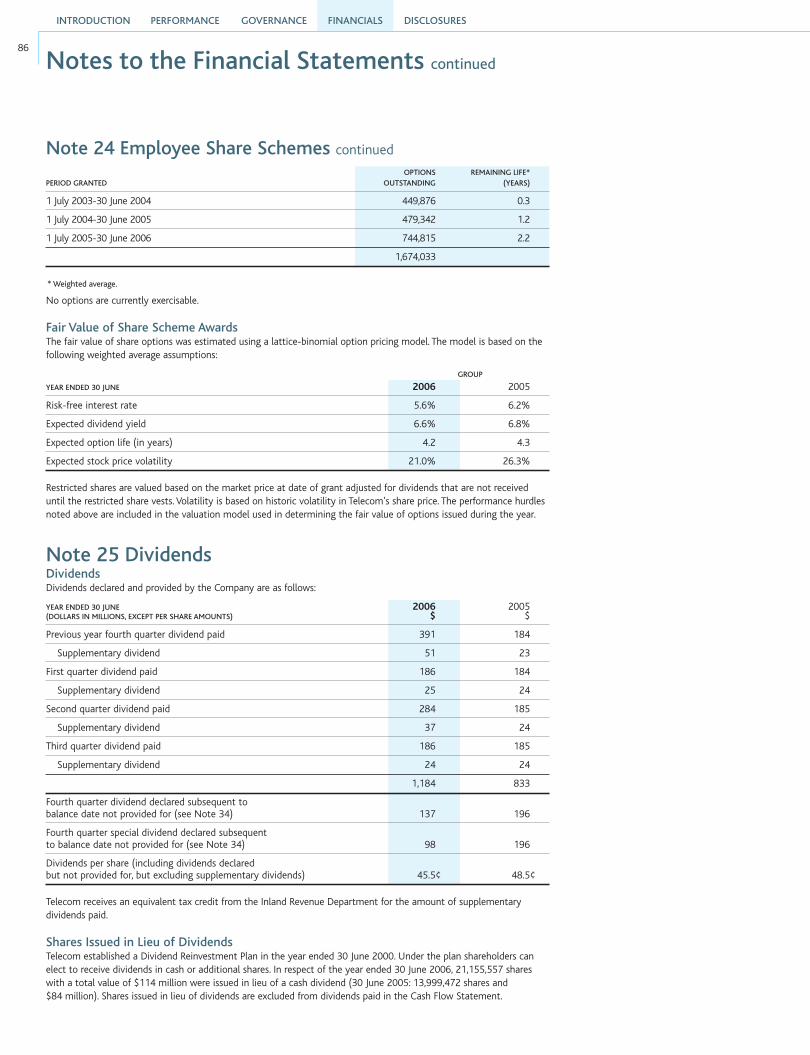
INTRODUCTION PERFORMANCE GOVERNANCE DISCLOSURESFINANCIALS
86
Note 25 DividendsDividendsDividends declared and provided by the Company are as follows:
YEAR ENDED 30 JUNE 2006 2005(DOLLARS IN MILLIONS, EXCEPT PER SHARE AMOUNTS) $ $
Previous year fourth quarter dividend paid 391 184
Supplementary dividend 51 23
First quarter dividend paid 186 184
Supplementary dividend 25 24
Second quarter dividend paid 284 185
Supplementary dividend 37 24
Third quarter dividend paid 186 185
Supplementary dividend 24 24
1,184 833
Fourth quarter dividend declared subsequent to balance date not provided for (see Note 34) 137 196
Fourth quarter special dividend declared subsequent to balance date not provided for (see Note 34) 98 196
Dividends per share (including dividends declared but not provided for, but excluding supplementary dividends) 45.5¢ 48.5¢
Telecom receives an equivalent tax credit from the Inland Revenue Department for the amount of supplementary dividends paid.
Shares Issued in Lieu of DividendsTelecom established a Dividend Reinvestment Plan in the year ended 30 June 2000. Under the plan shareholders can elect to receive dividends in cash or additional shares. In respect of the year ended 30 June 2006, 21,155,557 shares with a total value of $114 million were issued in lieu of a cash dividend (30 June 2005: 13,999,472 shares and $84 million). Shares issued in lieu of dividends are excluded from dividends paid in the Cash Flow Statement.
Note 24 Employee Share Schemes continued
OPTIONS REMAINING LIFE* PERIOD GRANTED OUTSTANDING (YEARS)
1 July 2003-30 June 2004 449,876 0.3
1 July 2004-30 June 2005 479,342 1.2
1 July 2005-30 June 2006 744,815 2.2
1,674,033
* Weighted average.
No options are currently exercisable.
Fair Value of Share Scheme AwardsThe fair value of share options was estimated using a lattice-binomial option pricing model. The model is based on the following weighted average assumptions:
GROUP
YEAR ENDED 30 JUNE 2006 2005
Risk-free interest rate 5.6% 6.2%
Expected dividend yield 6.6% 6.8%
Expected option life (in years) 4.2 4.3
Expected stock price volatility 21.0% 26.3%
Restricted shares are valued based on the market price at date of grant adjusted for dividends that are not received until the restricted share vests. Volatility is based on historic volatility in Telecom’s share price. The performance hurdles noted above are included in the valuation model used in determining the fair value of options issued during the year.
Notes to the Financial Statements continued

87
Note 26 Financial Instruments and Risk ManagementShort-term FinancingTelecom has four short-term financing programmes in place: a US$1 billion European Commercial Paper Programme, a $500 million Note facility, an A$1.5 billion Short-term Note and Medium-term Note Programme and a $200 million Asian Commercial Paper Programme.
As at 30 June 2006 Telecom had committed stand-by facilities of US$500 million with various major banks. Telecom also had committed overdraft facilities of $20 million with New Zealand banks and A$20 million with Australian banks. There are no compensating balance requirements associated with these facilities.
Telecom does not currently hold or issue derivative financial instruments for trading purposes, although under the classifications of NZ IAS 32 derivative financial instruments are classified as ‘held for trading’ unless they are designated hedges. Currency options held by Telecom are therefore classified as held for trading. All other derivative financial instruments are designated hedges.
Interest Rate and Currency RiskTelecom employs the use of derivative financial instruments for the purpose of reducing its exposure to fluctuations in interest rates and foreign exchange rates. Telecom effectively monitors the use of derivative financial instruments through the use of well-defined market and credit risk limits and timely reports to senior management.
The majority of Telecom’s long-term debt has been issued in foreign currencies. Telecom enters into cross currency interest rate swaps to convert issue proceeds into a floating rate New Zealand dollar or Australian dollar exposure. New Zealand dollar and Australian dollar interest rate swaps are used to convert floating rate exposure into fixed rate exposure where it is considered appropriate. As a result of these hedging activities the majority of Telecom’s long-term debt is subject to fixed interest rates.
Telecom enters into forward exchange contracts to protect it from the risk that the eventual New Zealand dollar net cash flows resulting from purchases from foreign suppliers and short-term foreign currency borrowings will be adversely affected by changes in exchange rates. Forward exchange contracts are also used to hedge foreign currency assets.
The notional principal or contract amounts outstanding are as follows:
GROUP
30 JUNE 2006 2005(DOLLARS IN MILLIONS) CURRENCY MATURITIES $ $
Cross currency interest rate swaps AUD:USD 2011 591 526
NZD:GBP 2008-2020 1,426 1,759
NZD:JPY 2007-2009 453 453
NZD:USD 2008 181 331
Interest rate swaps AUD 2011 456 625
NZD 2007-2020 2,395 2,727
Forward exchange contracts NZD:AUD 2006-2007 907 898
NZD:USD 2006-2007 430 351
Other 2006-2007 30 80
Currency options NZD:USD 2006-2007 64 12
Other 2006-2007 34 19
An increase in interest rates of 1% would increase interest expense on a pre-tax forecasted basis by approximately $4 million for the year ending 30 June 2007.
Electricity Price RiskTelecom uses electricity hedges to reduce exposure to electricity spot price movements. At 30 June 2006 Telecom had contracts to hedge electricity consumption of 20 megawatts per hour (30 June 2005: 17 megawatts per hour) with maturity dates ranging from December 2007 to March 2009.
Concentration of Credit RiskIn the normal course of its business, Telecom incurs credit risk from trade receivables and transactions with financial institutions. Telecom has a credit policy, which is used to manage this exposure to credit risk. As part of this policy, limits on exposures with counterparties have been set and approved by the Board of Directors and are monitored on a regular basis.
Telecom has certain derivative transactions that are subject to bilateral credit support agreements that require Telecom or the counterparty to post collateral to support mark-to-market valuation differences. No collateral has been posted by Telecom or any counterparty in the year ended 30 June 2006 or 30 June 2005.
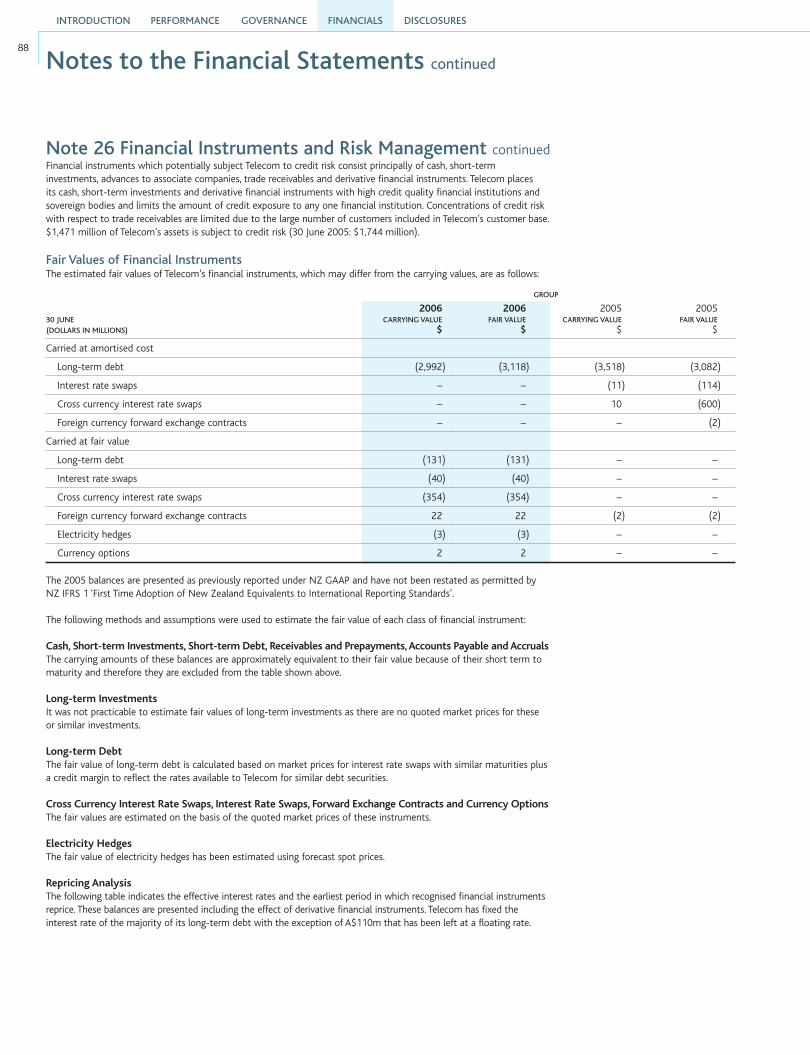
INTRODUCTION PERFORMANCE GOVERNANCE DISCLOSURESFINANCIALS
88
Fair Values of Financial InstrumentsThe estimated fair values of Telecom’s financial instruments, which may differ from the carrying values, are as follows:
GROUP
2006 2006 2005 2005 30 JUNE CARRYING VALUE FAIR VALUE CARRYING VALUE FAIR VALUE (DOLLARS IN MILLIONS) $ $ $ $
Carried at amortised cost
Long-term debt (2,992) (3,118) (3,518) (3,082)
Interest rate swaps – – (11) (114)
Cross currency interest rate swaps – – 10 (600)
Foreign currency forward exchange contracts – – – (2)
Carried at fair value
Long-term debt (131) (131) – –
Interest rate swaps (40) (40) – –
Cross currency interest rate swaps (354) (354) – –
Foreign currency forward exchange contracts 22 22 (2) (2)
Electricity hedges (3) (3) – –
Currency options 2 2 – –
Notes to the Financial Statements continued
Note 26 Financial Instruments and Risk Management continuedFinancial instruments which potentially subject Telecom to credit risk consist principally of cash, short-term investments, advances to associate companies, trade receivables and derivative financial instruments. Telecom places its cash, short-term investments and derivative financial instruments with high credit quality financial institutions and sovereign bodies and limits the amount of credit exposure to any one financial institution. Concentrations of credit risk with respect to trade receivables are limited due to the large number of customers included in Telecom’s customer base. $1,471 million of Telecom’s assets is subject to credit risk (30 June 2005: $1,744 million).
The 2005 balances are presented as previously reported under NZ GAAP and have not been restated as permitted by NZ IFRS 1 ‘First Time Adoption of New Zealand Equivalents to International Reporting Standards’.
The following methods and assumptions were used to estimate the fair value of each class of financial instrument:
Cash, Short-term Investments, Short-term Debt, Receivables and Prepayments, Accounts Payable and AccrualsThe carrying amounts of these balances are approximately equivalent to their fair value because of their short term to maturity and therefore they are excluded from the table shown above.
Long-term Investments It was not practicable to estimate fair values of long-term investments as there are no quoted market prices for these or similar investments.
Long-term Debt The fair value of long-term debt is calculated based on market prices for interest rate swaps with similar maturities plus a credit margin to reflect the rates available to Telecom for similar debt securities.
Cross Currency Interest Rate Swaps, Interest Rate Swaps, Forward Exchange Contracts and Currency OptionsThe fair values are estimated on the basis of the quoted market prices of these instruments.
Electricity HedgesThe fair value of electricity hedges has been estimated using forecast spot prices.
Repricing Analysis The following table indicates the effective interest rates and the earliest period in which recognised financial instruments reprice. These balances are presented including the effect of derivative financial instruments. Telecom has fixed the interest rate of the majority of its long-term debt with the exception of A$110m that has been left at a floating rate.
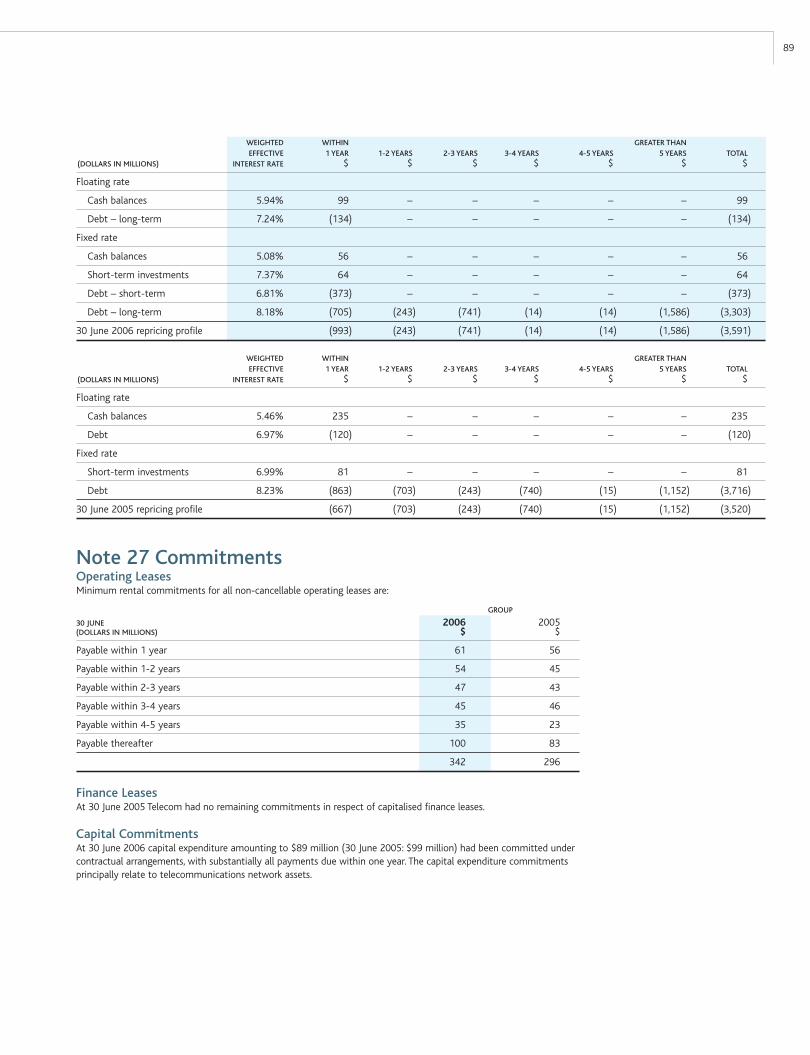
89
WEIGHTED WITHIN GREATER THAN EFFECTIVE 1 YEAR 1-2 YEARS 2-3 YEARS 3-4 YEARS 4-5 YEARS 5 YEARS TOTAL(DOLLARS IN MILLIONS) INTEREST RATE $ $ $ $ $ $ $
Floating rate
Cash balances 5.46% 235 – – – – – 235
Debt 6.97% (120) – – – – – (120)
Fixed rate
Short-term investments 6.99% 81 – – – – – 81
Debt 8.23% (863) (703) (243) (740) (15) (1,152) (3,716)
30 June 2005 repricing profile (667) (703) (243) (740) (15) (1,152) (3,520)
Note 27 CommitmentsOperating LeasesMinimum rental commitments for all non-cancellable operating leases are:
GROUP
30 JUNE 2006 2005(DOLLARS IN MILLIONS) $ $
Payable within 1 year 61 56
Payable within 1-2 years 54 45
Payable within 2-3 years 47 43
Payable within 3-4 years 45 46
Payable within 4-5 years 35 23
Payable thereafter 100 83
342 296
Finance LeasesAt 30 June 2005 Telecom had no remaining commitments in respect of capitalised finance leases.
Capital CommitmentsAt 30 June 2006 capital expenditure amounting to $89 million (30 June 2005: $99 million) had been committed under contractual arrangements, with substantially all payments due within one year. The capital expenditure commitments principally relate to telecommunications network assets.
WEIGHTED WITHIN GREATER THAN EFFECTIVE 1 YEAR 1-2 YEARS 2-3 YEARS 3-4 YEARS 4-5 YEARS 5 YEARS TOTAL(DOLLARS IN MILLIONS) INTEREST RATE $ $ $ $ $ $ $
Floating rate
Cash balances 5.94% 99 – – – – – 99
Debt – long-term 7.24% (134) – – – – – (134)
Fixed rate
Cash balances 5.08% 56 – – – – – 56
Short-term investments 7.37% 64 – – – – – 64
Debt – short-term 6.81% (373) – – – – – (373)
Debt – long-term 8.18% (705) (243) (741) (14) (14) (1,586) (3,303)
30 June 2006 repricing profile (993) (243) (741) (14) (14) (1,586) (3,591)

INTRODUCTION PERFORMANCE GOVERNANCE DISCLOSURESFINANCIALS
90
Note 28 ContingenciesContingent LiabilitiesLawsuits and Other ClaimsIn March 2004 the Commerce Commission issued proceedings against Telecom claiming that its implementation and maintenance of new retail and wholesale high speed data transmission service pricing since 1998 constituted a breach by Telecom of s36 of the Commerce Act (abuse of a dominant position/taking advantage of market power). The Commission seeks a declaration that s36 of the Commerce Act was breached, a pecuniary penalty, and costs.
In July 2000 the Commerce Commission issued proceedings against Telecom claiming that the introduction of 0867 constituted a use by Telecom of its dominant position for proscribed purposes. The Commission seeks a declaration that this contravened s36 of the Commerce Act, a pecuniary penalty, and costs.
In November 2003 the Commerce Commission issued proceedings against Telecom Mobile Limited alleging that it had breached the Fair Trading Act and the Door to Door Sales Act 1967. The Commission alleged that Telecom Mobile misled customers who thereby entered into 14,196 agreements with Telecom Mobile. The Commission sought a declaration that the agreements were void and that, therefore, customers may claim back any monies paid to Telecom Mobile under the agreements. The Commission lost at first instance but succeeded on appeal to the Court of Appeal. In a judgement dated 30 March 2006, the Supreme Court granted Telecom Mobile’s appeal. Telecom Mobile has now transitioned all customers who were on affected contracts off those contracts and there is no ongoing risk in relation to this matter.
Various other minor lawsuits, claims and investigations have been brought or are pending against Telecom.The Directors of Telecom cannot reasonably estimate the adverse effect (if any) on Telecom if any of the foregoing
claims are ultimately resolved against Telecom’s interests, and there can be no assurance that such litigation will not have a material adverse effect on Telecom’s business, financial condition or results of operations.
All of the proceedings summarised above have been commenced in the High Court of New Zealand unless otherwise stated.
Land Claims As previously stated in Note 17, interests in land included in property, plant and equipment purchased from the Government may be subject to claims to the Waitangi Tribunal or deemed to be w-ahi tapu and, in either case, may be resumed by the Government. Certain claims have been brought or are pending against the Government under the Treaty of Waitangi Act 1975. Some of these claims may affect land transferred to the Company by the Government and/or by the Company to its subsidiary companies. In the event that land is resumed by the Government, there is provision for compensation to Telecom.
Financial Instruments There are contingent liabilities in respect of outstanding contracts for the sale and purchase of foreign currencies, cross currency interest rate swaps, interest rate swaps, interest rate options and foreign currency options. No significant losses are anticipated in respect of these matters.
AAPT had issued bank guarantees totalling A$5 million as at 30 June 2006 (30 June 2005: A$5 million).
Cross Border Lease Guarantees Telecom has entered into several cross border leases in respect of certain telecommunications assets. Telecom has given certain undertakings including letters of credit in accordance with limited guarantees entered into as part of the transactions. The likelihood of losses in respect of these matters is considered to be remote.
Parent CompanyThe Parent Company has guaranteed, along with guaranteeing subsidiary companies, indebtedness of TCNZ Finance Limited amounting to $3,166 million (30 June 2005: $3,510 million) under a guarantee dated 27 May 1997 and trust deeds dated 25 October 1988, 3 April 1992, 17 March 2000, 18 December 2000 and 11 May 2001, together with subsequent supplemental trust deeds and interest thereon. The Parent Company has issued further guarantees in relation to commercial paper and other treasury activities of TCNZ Finance Limited. The Parent Company has also provided intercompany guarantees to Telecom New Zealand Limited.
Note 29 Related Party TransactionsInterest of Directors in Certain TransactionsCertain Directors have relevant interests in a number of companies with which Telecom has transactions in the normal course of business. A number of Telecom’s Directors are also non-executive Directors of other companies. Any transactions undertaken with these entities have been entered into on an arm’s-length commercial basis.
Advances to Associate CompaniesAs at 30 June 2006 Telecom had made a long-term shareholders’ advance of US$57 million (NZ$95 million) to Southern Cross Cables Holdings Limited at an interest rate of Libor + 0.75% (30 June 2005: US$67 million, NZ$95 million).
Other Transactions with Associate CompaniesThe Group provides network operations and management services to Southern Cross in respect of its operations in New Zealand. The Group makes operations and maintenance payments to Southern Cross in connection with capacity it has purchased on Southern Cross. Any transactions undertaken with these entities have been entered into on an arm’s-length commercial basis. Balances in respect of these transactions with associate companies are set out in the table opposite.
Notes to the Financial Statements continued
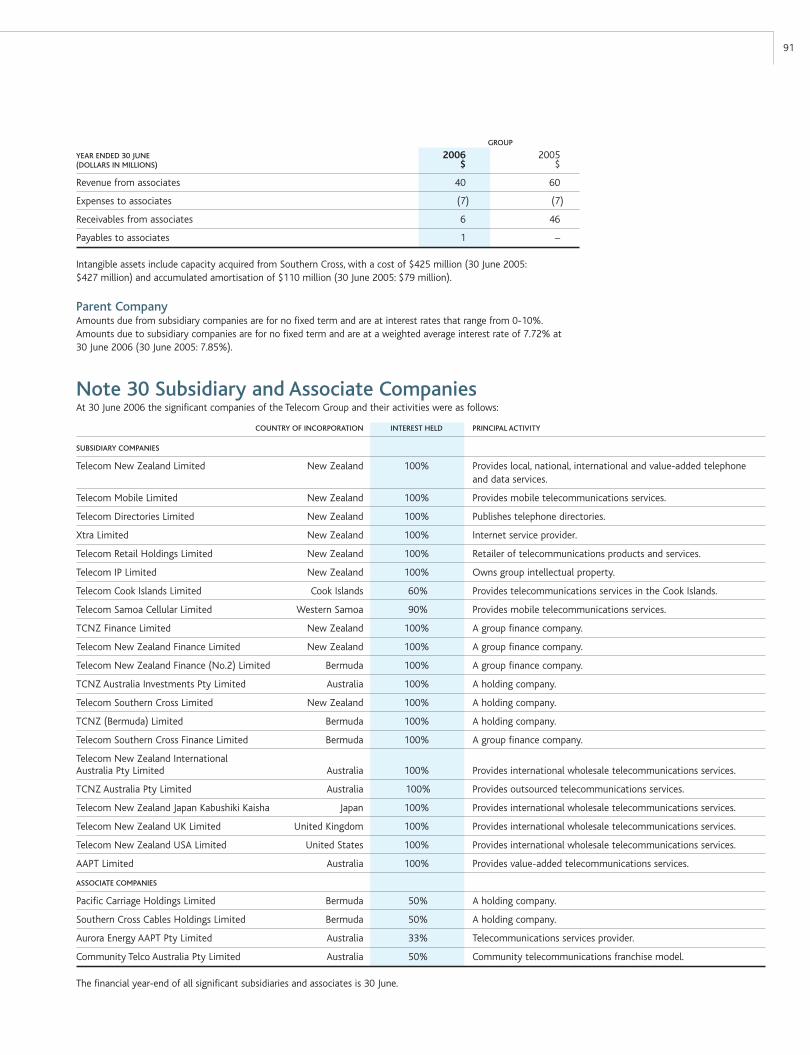
91
Note 30 Subsidiary and Associate CompaniesAt 30 June 2006 the significant companies of the Telecom Group and their activities were as follows:
COUNTRY OF INCORPORATION INTEREST HELD PRINCIPAL ACTIVITY
SUBSIDIARY COMPANIES
Telecom New Zealand Limited New Zealand 100% Provides local, national, international and value-added telephone and data services.
Telecom Mobile Limited New Zealand 100% Provides mobile telecommunications services.
Telecom Directories Limited New Zealand 100% Publishes telephone directories.
Xtra Limited New Zealand 100% Internet service provider.
Telecom Retail Holdings Limited New Zealand 100% Retailer of telecommunications products and services.
Telecom IP Limited New Zealand 100% Owns group intellectual property.
Telecom Cook Islands Limited Cook Islands 60% Provides telecommunications services in the Cook Islands.
Telecom Samoa Cellular Limited Western Samoa 90% Provides mobile telecommunications services.
TCNZ Finance Limited New Zealand 100% A group finance company.
Telecom New Zealand Finance Limited New Zealand 100% A group finance company.
Telecom New Zealand Finance (No.2) Limited Bermuda 100% A group finance company.
TCNZ Australia Investments Pty Limited Australia 100% A holding company.
Telecom Southern Cross Limited New Zealand 100% A holding company.
TCNZ (Bermuda) Limited Bermuda 100% A holding company.
Telecom Southern Cross Finance Limited Bermuda 100% A group finance company.
Telecom New Zealand International Australia Pty Limited Australia 100% Provides international wholesale telecommunications services.
TCNZ Australia Pty Limited Australia 100% Provides outsourced telecommunications services.
Telecom New Zealand Japan Kabushiki Kaisha Japan 100% Provides international wholesale telecommunications services.
Telecom New Zealand UK Limited United Kingdom 100% Provides international wholesale telecommunications services.
Telecom New Zealand USA Limited United States 100% Provides international wholesale telecommunications services.
AAPT Limited Australia 100% Provides value-added telecommunications services.
ASSOCIATE COMPANIES
Pacific Carriage Holdings Limited Bermuda 50% A holding company.
Southern Cross Cables Holdings Limited Bermuda 50% A holding company.
Aurora Energy AAPT Pty Limited Australia 33% Telecommunications services provider.
Community Telco Australia Pty Limited Australia 50% Community telecommunications franchise model.
The financial year-end of all significant subsidiaries and associates is 30 June.
GROUP
YEAR ENDED 30 JUNE 2006 2005(DOLLARS IN MILLIONS) $ $
Revenue from associates 40 60
Expenses to associates (7) (7)
Receivables from associates 6 46
Payables to associates 1 –
Intangible assets include capacity acquired from Southern Cross, with a cost of $425 million (30 June 2005: $427 million) and accumulated amortisation of $110 million (30 June 2005: $79 million).
Parent CompanyAmounts due from subsidiary companies are for no fixed term and are at interest rates that range from 0-10%. Amounts due to subsidiary companies are for no fixed term and are at a weighted average interest rate of 7.72% at 30 June 2006 (30 June 2005: 7.85%).

INTRODUCTION PERFORMANCE GOVERNANCE DISCLOSURESFINANCIALS
92
Notes to the Financial Statements continued
TOTAL GROUP INTER- IT AUSTRALIAN OPERATING CORPORATE AS AT AND FOR THE YEAR ENDED 30 JUNE 2006 WIRED WIRELESS NATIONAL SERVICES OPERATIONS SEGMENTS & OTHER ELIMINATIONS TOTAL(DOLLARS IN MILLIONS) $ $ $ $ $ $ $ $ $
Operating revenue
External customers 2,941 865 265 368 1,305 5,744 11 – 5,755
Internal customers 22 – 210 18 18 268 4 (272) –
Total revenue 2,963 865 475 386 1,323 6,012 15 (272) 5,755
Result
Earnings before interest and tax 1,374 220 44 27 (1,386) 279 (62) – 217
Other information
Depreciation and amortisation 376 74 68 8 169 695 10 – 705
Capital expenditure 448 93 14 31 131 717 34 – 751
Impairment – – – – (1,301) (1,301) – – (1,301)
Other expenses (22) (12) – – – (34) – – (34)
Balance sheet
Total assets 3,364 636 663 95 529 5,287 2,288 (1,372) 6,203
Total liabilities 498 159 234 63 164 1,118 4,182 (159) 5,141
TOTAL GROUP INTER- IT AUSTRALIAN OPERATING CORPORATE AS AT AND FOR THE YEAR ENDED 30 JUNE 2005 WIRED WIRELESS NATIONAL SERVICES OPERATIONS SEGMENTS & OTHER ELIMINATIONS TOTAL(DOLLARS IN MILLIONS) $ $ $ $ $ $ $ $ $
Operating revenue
External customers 2,921 799 231 328 1,354 5,633 17 – 5,650
Internal customers 19 – 196 9 17 241 4 (245) –
Total revenue 2,940 799 427 337 1,371 5,874 21 (245) 5,650
Result
Earnings before interest and tax 1,403 161 40 17 (28) 1,593 52 – 1,645
Other information
Depreciation and amortisation 365 88 64 10 160 687 11 – 698
Capital expenditure 403 89 35 23 118 668 35 – 703
Impairment – (24) – – – (24) – – (24)
Other expenses – – – (4) (31) (35) – – (35)
Balance sheet
Total assets 3,266 629 651 105 962 5,613 2,741 (850) 7,504
Total liabilities 452 154 221 67 248 1,142 4,291 (400) 5,033
Telecom’s primary segments consist of:Wired – Provider of calling, internet and data products to residential, wholesale and business customers in New Zealand.Wireless – Provider of mobile calling and data products to residential and business customers in New Zealand.International – Provider of international telecommunications services globally.IT services – Provider of IT services to business customers in New Zealand.Australian Operations – Provider of telecommunications services to residential and business customers in Australia.Corporate and other – Head office support services for the Group.
Note 31 Segmental ReportingIndustry SegmentsResults are reported for five operating segments, being the Group’s main areas of operations and a corporate amount containing revenues and costs not allocated to the operating segments. Previously Telecom reported results for four operating segments. However, with the purchase of Gen-i and Computerland, IT services has now been shown as a separate segment. This was previously reported as part of the Wired segment. Comparatives have been restated to reflect this change. Disclosure of revenues, earnings before interest and tax (‘segment result’) and total assets on an operating segment basis is set out below. Intersegment sales are priced on an arm’s-length basis.
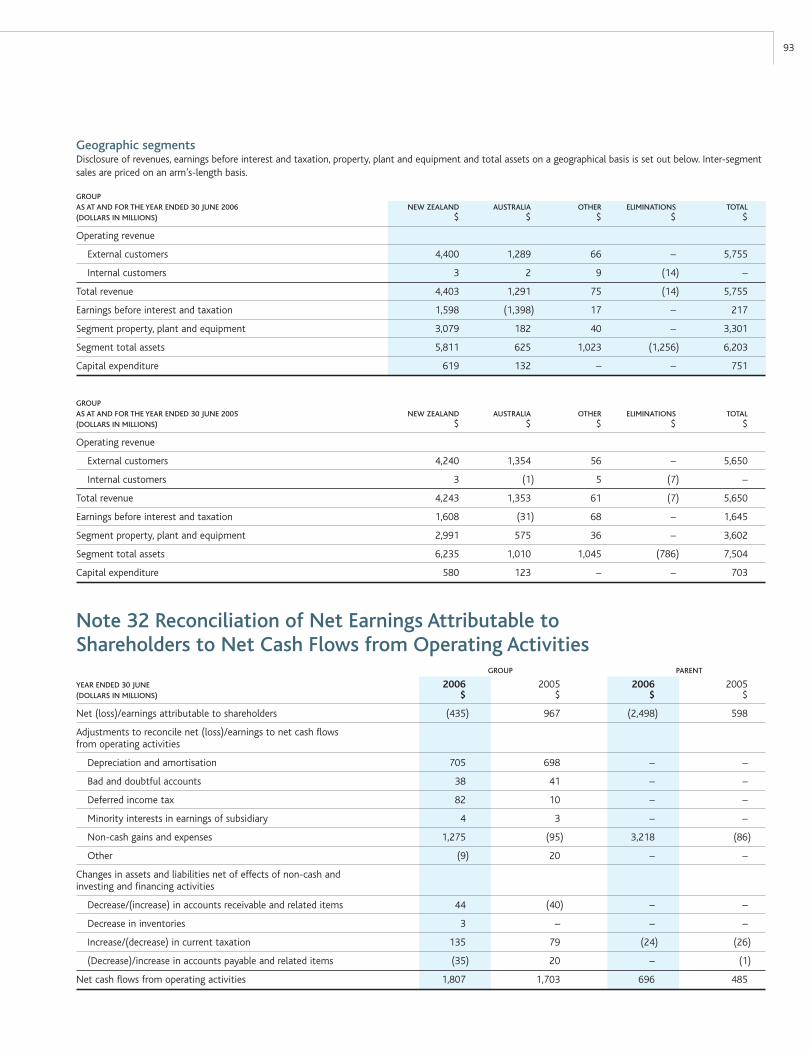
93
Note 32 Reconciliation of Net Earnings Attributable to Shareholders to Net Cash Flows from Operating Activities GROUP PARENT
YEAR ENDED 30 JUNE 2006 2005 2006 2005(DOLLARS IN MILLIONS) $ $ $ $
Net (loss)/earnings attributable to shareholders (435) 967 (2,498) 598
Adjustments to reconcile net (loss)/earnings to net cash flows from operating activities
Depreciation and amortisation 705 698 – –
Bad and doubtful accounts 38 41 – –
Deferred income tax 82 10 – –
Minority interests in earnings of subsidiary 4 3 – –
Non-cash gains and expenses 1,275 (95) 3,218 (86)
Other (9) 20 – –
Changes in assets and liabilities net of effects of non-cash and investing and financing activities
Decrease/(increase) in accounts receivable and related items 44 (40) – –
Decrease in inventories 3 – – –
Increase/(decrease) in current taxation 135 79 (24) (26)
(Decrease)/increase in accounts payable and related items (35) 20 – (1)
Net cash flows from operating activities 1,807 1,703 696 485
Geographic segmentsDisclosure of revenues, earnings before interest and taxation, property, plant and equipment and total assets on a geographical basis is set out below. Inter-segment sales are priced on an arm’s-length basis.
GROUP AS AT AND FOR THE YEAR ENDED 30 JUNE 2006 NEW ZEALAND AUSTRALIA OTHER ELIMINATIONS TOTAL(DOLLARS IN MILLIONS) $ $ $ $ $
Operating revenue
External customers 4,400 1,289 66 – 5,755
Internal customers 3 2 9 (14) –
Total revenue 4,403 1,291 75 (14) 5,755
Earnings before interest and taxation 1,598 (1,398) 17 – 217
Segment property, plant and equipment 3,079 182 40 – 3,301
Segment total assets 5,811 625 1,023 (1,256) 6,203
Capital expenditure 619 132 – – 751
GROUP AS AT AND FOR THE YEAR ENDED 30 JUNE 2005 NEW ZEALAND AUSTRALIA OTHER ELIMINATIONS TOTAL(DOLLARS IN MILLIONS) $ $ $ $ $
Operating revenue
External customers 4,240 1,354 56 – 5,650
Internal customers 3 (1) 5 (7) –
Total revenue 4,243 1,353 61 (7) 5,650
Earnings before interest and taxation 1,608 (31) 68 – 1,645
Segment property, plant and equipment 2,991 575 36 – 3,602
Segment total assets 6,235 1,010 1,045 (786) 7,504
Capital expenditure 580 123 – – 703
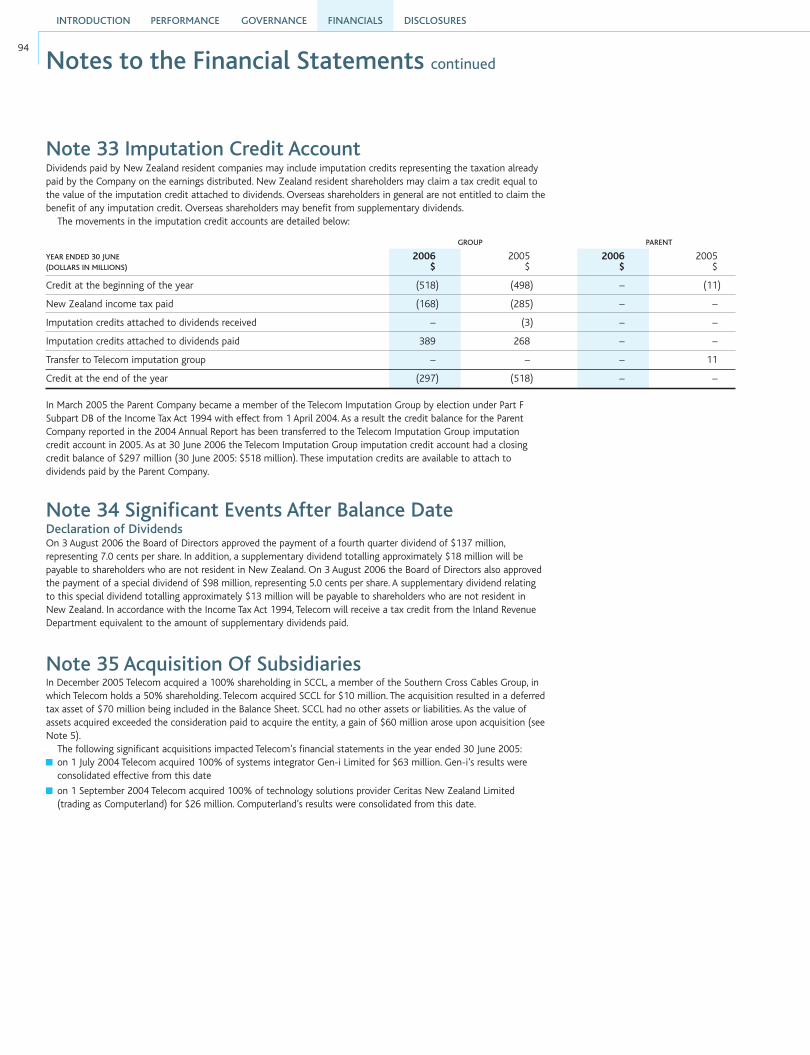
INTRODUCTION PERFORMANCE GOVERNANCE DISCLOSURESFINANCIALS
94
Notes to the Financial Statements continued
GROUP PARENT
YEAR ENDED 30 JUNE 2006 2005 2006 2005(DOLLARS IN MILLIONS) $ $ $ $
Credit at the beginning of the year (518) (498) – (11)
New Zealand income tax paid (168) (285) – –
Imputation credits attached to dividends received – (3) – –
Imputation credits attached to dividends paid 389 268 – –
Transfer to Telecom imputation group – – – 11
Credit at the end of the year (297) (518) – –
In March 2005 the Parent Company became a member of the Telecom Imputation Group by election under Part F Subpart DB of the Income Tax Act 1994 with effect from 1 April 2004. As a result the credit balance for the Parent Company reported in the 2004 Annual Report has been transferred to the Telecom Imputation Group imputation credit account in 2005. As at 30 June 2006 the Telecom Imputation Group imputation credit account had a closing credit balance of $297 million (30 June 2005: $518 million). These imputation credits are available to attach to dividends paid by the Parent Company.
Note 34 Significant Events After Balance DateDeclaration of DividendsOn 3 August 2006 the Board of Directors approved the payment of a fourth quarter dividend of $137 million, representing 7.0 cents per share. In addition, a supplementary dividend totalling approximately $18 million will be payable to shareholders who are not resident in New Zealand. On 3 August 2006 the Board of Directors also approved the payment of a special dividend of $98 million, representing 5.0 cents per share. A supplementary dividend relating to this special dividend totalling approximately $13 million will be payable to shareholders who are not resident in New Zealand. In accordance with the Income Tax Act 1994, Telecom will receive a tax credit from the Inland Revenue Department equivalent to the amount of supplementary dividends paid.
Note 33 Imputation Credit AccountDividends paid by New Zealand resident companies may include imputation credits representing the taxation already paid by the Company on the earnings distributed. New Zealand resident shareholders may claim a tax credit equal to the value of the imputation credit attached to dividends. Overseas shareholders in general are not entitled to claim the benefit of any imputation credit. Overseas shareholders may benefit from supplementary dividends.
The movements in the imputation credit accounts are detailed below:
Note 35 Acquisition Of SubsidiariesIn December 2005 Telecom acquired a 100% shareholding in SCCL, a member of the Southern Cross Cables Group, in which Telecom holds a 50% shareholding. Telecom acquired SCCL for $10 million. The acquisition resulted in a deferred tax asset of $70 million being included in the Balance Sheet. SCCL had no other assets or liabilities. As the value of assets acquired exceeded the consideration paid to acquire the entity, a gain of $60 million arose upon acquisition (see Note 5).
The following significant acquisitions impacted Telecom’s financial statements in the year ended 30 June 2005: on 1 July 2004 Telecom acquired 100% of systems integrator Gen-i Limited for $63 million. Gen-i’s results were consolidated effective from this date
on 1 September 2004 Telecom acquired 100% of technology solutions provider Ceritas New Zealand Limited (trading as Computerland) for $26 million. Computerland’s results were consolidated from this date.

95
Note 36 Quarterly Financial Information (Unaudited) OPERATING EARNINGS NET EARNINGS REVENUES BEFORE INTEREST ATTRIBUTABLE NET EARNINGS(DOLLARS IN MILLIONS, AND GAINS EBITDA* AND TAXATION TO SHAREHOLDERS PER SHAREEXCEPT PER SHARE AMOUNTS) $ $ $ $ ¢
Quarter ended
30 June 2006 1,454 140 (42) (191) (10)
31 March 2006 1,447 583 405 222 11
31 December 2005 1,482 (333) (508) (665) (34)
30 September 2005 1,432 532 362 199 10
Year ended 30 June 2006 5,815 922 217 (435) (22)
Quarter ended
30 June 2005 1,517 619 437 281 14
31 March 2005 1,474 619 452 273 14
31 December 2004 1,412 550 376 210 11
30 September 2004 1,401 555 380 203 11
Year ended 30 June 2005 5,804 2,343 1,645 967 50
*Earnings before Interest, Taxation, Depreciation and Amortisation.
Earnings per share is computed independently for each of the quarters presented. Consequently, the sum of the quarters does not necessarily equal total annual earnings per share for the year.
The effect of these acquisitions on the Group’s assets and liabilities in those years was:
GROUP
30 JUNE 2006 2005(DOLLARS IN MILLIONS) $ $
ASSETS
Current assets:
Receivables and prepayments – 41
Inventories – 4
Total current assets – 45
Deferred tax asset 70 –
Property, plant and equipment – 9
Total assets 70 54
LIABILITIES
Current liabilities:
Accounts payable and accruals – 37
Total liabilities – 37
Net assets acquired 70 17
Net consideration:
Net cash paid (10) (89)
(Gain)/goodwill arising on acquisition (60) 72
70 17

INTRODUCTION PERFORMANCE GOVERNANCE DISCLOSURESFINANCIALS
96
Notes to the Financial Statements continued
Note 37 Significant Differences Between New Zealand and United States Generally Accepted Accounting PrinciplesThe consolidated financial statements are prepared in accordance with NZ IFRS which differ in certain significant respects to the generally accepted accounting principles (‘GAAP’) applicable in the United States (‘US’). These differences and the effect of the adjustments necessary to present earnings and shareholders’ funds are detailed below. A more detailed discussion of significant differences between NZ IFRS and US GAAP is provided in Note 37 in our Annual Report on Form 20-F, which will be available on our website www.telecom.co.nz when filed with the US Securities and Exchange Commission.
Effect on Net Loss/Earnings of Differences Between NZ IFRS and US GAAP
GROUP
YEAR ENDED 30 JUNE 2006 2005(DOLLARS IN MILLIONS) $ $
Net (loss)/earnings in accordance with NZ IFRS (435) 967
US GAAP Adjustments
Derivative financial instruments (b) (128) 38
Depreciation of interest costs capitalised in prior years (c) (2) (4)
Capacity sales (d) 2 2
Government grants (e) 1 1
Provisions (f) – 6
Impairment of goodwill (g) (118) –
Consolidation of Southern Cross (h) 30 (21)
Deconsolidation of Southern Cross (h) 526 –
Repayment of associate advance (i) 20 –
Tax effect of US GAAP adjustments 43 (11)
Net (loss)/earnings in accordance with US GAAP (61) 978
Basic net (loss)/earnings per share in accordance with US GAAP (j) (3)¢ 50¢
Diluted net (loss)/earnings per share in accordance with US GAAP (j) (3)¢ 49¢
Cumulative Effect on Shareholders’ Funds of Differences Between NZ IFRS and US GAAP
GROUP
YEAR ENDED 30 JUNE 2006 2005(DOLLARS IN MILLIONS) $ $
Shareholders’ funds in accordance with NZ IFRS 1,055 2,463
US GAAP Adjustments
Fair value of derivatives – derivative financial instruments (b) (4) (61)
Property, plant and equipment – capitalisation of interest costs, net of accumulated depreciation (c) 1 3
Unearned revenue – capacity sales (d) (19) (21)
Property, plant and equipment – government grants (e) (9) (10)
Intangibles – non-amortisation of goodwill (g) 14 132
Consolidation of Southern Cross (h) – (517)
Share of losses of associate companies (i) (93) (45)
Dividends from associates (i) – (102)
Foreign currency movement on associate advance (i) (2) 52
Deferred tax liabilities 8 28
Shareholders’ funds in accordance with US GAAP 951 1,922

97
Consolidated Statement of Shareholders’ Funds in Accordance with US GAAP
GROUP
YEAR ENDED 30 JUNE 2006 2005(DOLLARS IN MILLIONS) $ $
Shareholders’ funds at beginning of year in accordance with US GAAP 1,922 1,648
Net (loss)/earnings (61) 978
Other comprehensive income/(loss) (a) 116 (87)
Total comprehensive income 55 891
Dividends (1,179) (833)
Tax credit on supplementary dividends 131 95
Capital contributed 20 120
Movement in deferred compensation 2 1
Shareholders’ funds at end of year in accordance with US GAAP 951 1,922
Represented by:
Contributed capital 2,056 2,036
Retained earnings/(loss) (941) 168
Other comprehensive loss (a) (188) (304)
Deferred compensation 24 22
Shareholders’ funds at end of year in accordance with US GAAP 951 1,922
(a) Total Comprehensive IncomeTotal comprehensive income consists of net income and other gains and losses affecting shareholders’ investment that, under US GAAP, are excluded from net earnings.
Changes in the components of other comprehensive income/(loss) are as follows:
GROUP
YEAR ENDED 30 JUNE 2006 2005(DOLLARS IN MILLIONS) $ $
Net (loss)/earnings in accordance with US GAAP (61) 978
Other comprehensive income/(loss):
Foreign currency translation adjustments 72 (73)
Transfer to earnings on deconsolidation of Southern Cross (13) –
Hedge of net investment – 21
Derivative (gains)/losses transferred to earnings – (9)
Unrealised holding gain on available-for-sale securities – 65
Realisation of gain on available-for-sale securities – (86)
Tax effect of other comprehensive income/(loss) 57 (5)
Other comprehensive income/(loss) 116 (87)
Total comprehensive income 55 891
Components of accumulated other comprehensive loss were:
GROUP
30 JUNE 2006 2005(DOLLARS IN MILLIONS) $ $
Foreign currency translation adjustments (188) (304)
(188) (304)
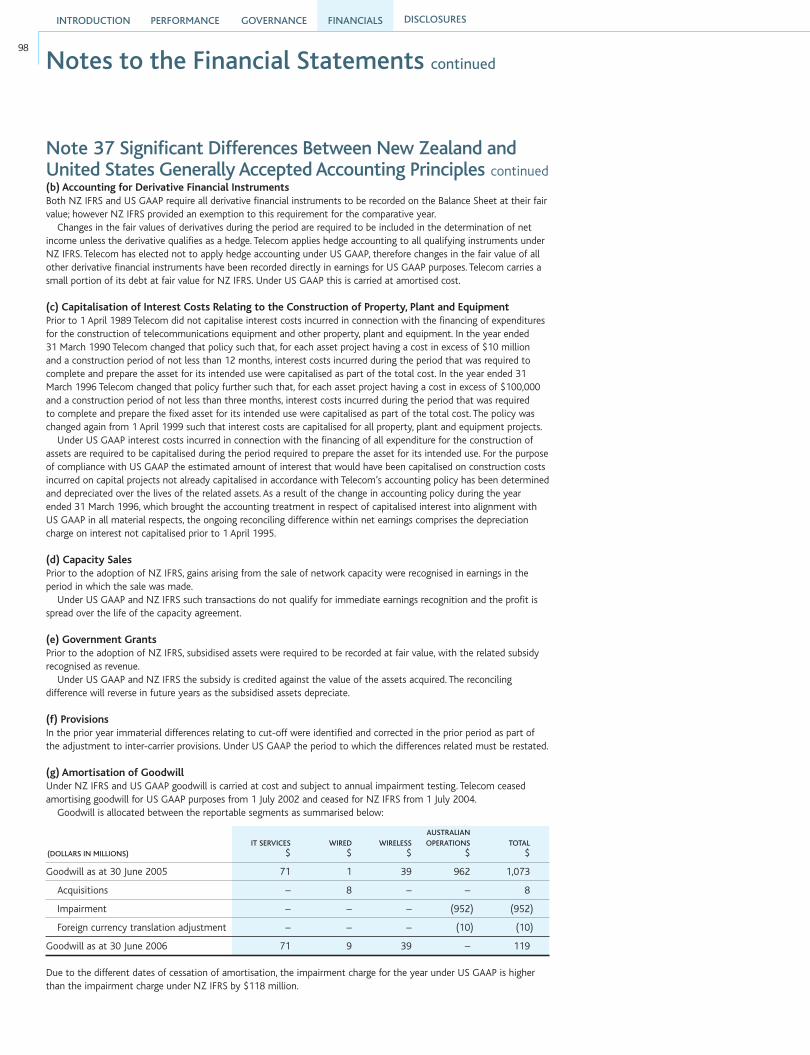
Notes to the Financial Statements continued
INTRODUCTION PERFORMANCE GOVERNANCE DISCLOSURESFINANCIALS
98
Note 37 Significant Differences Between New Zealand and United States Generally Accepted Accounting Principles continued(b) Accounting for Derivative Financial InstrumentsBoth NZ IFRS and US GAAP require all derivative financial instruments to be recorded on the Balance Sheet at their fair value; however NZ IFRS provided an exemption to this requirement for the comparative year.
Changes in the fair values of derivatives during the period are required to be included in the determination of net income unless the derivative qualifies as a hedge. Telecom applies hedge accounting to all qualifying instruments under NZ IFRS. Telecom has elected not to apply hedge accounting under US GAAP, therefore changes in the fair value of all other derivative financial instruments have been recorded directly in earnings for US GAAP purposes. Telecom carries a small portion of its debt at fair value for NZ IFRS. Under US GAAP this is carried at amortised cost.
(c) Capitalisation of Interest Costs Relating to the Construction of Property, Plant and EquipmentPrior to 1 April 1989 Telecom did not capitalise interest costs incurred in connection with the financing of expenditures for the construction of telecommunications equipment and other property, plant and equipment. In the year ended 31 March 1990 Telecom changed that policy such that, for each asset project having a cost in excess of $10 million and a construction period of not less than 12 months, interest costs incurred during the period that was required to complete and prepare the asset for its intended use were capitalised as part of the total cost. In the year ended 31 March 1996 Telecom changed that policy further such that, for each asset project having a cost in excess of $100,000 and a construction period of not less than three months, interest costs incurred during the period that was required to complete and prepare the fixed asset for its intended use were capitalised as part of the total cost. The policy was changed again from 1 April 1999 such that interest costs are capitalised for all property, plant and equipment projects.
Under US GAAP interest costs incurred in connection with the financing of all expenditure for the construction of assets are required to be capitalised during the period required to prepare the asset for its intended use. For the purpose of compliance with US GAAP the estimated amount of interest that would have been capitalised on construction costs incurred on capital projects not already capitalised in accordance with Telecom’s accounting policy has been determined and depreciated over the lives of the related assets. As a result of the change in accounting policy during the year ended 31 March 1996, which brought the accounting treatment in respect of capitalised interest into alignment with US GAAP in all material respects, the ongoing reconciling difference within net earnings comprises the depreciation charge on interest not capitalised prior to 1 April 1995.
(d) Capacity SalesPrior to the adoption of NZ IFRS, gains arising from the sale of network capacity were recognised in earnings in the period in which the sale was made.
Under US GAAP and NZ IFRS such transactions do not qualify for immediate earnings recognition and the profit is spread over the life of the capacity agreement.
(e) Government GrantsPrior to the adoption of NZ IFRS, subsidised assets were required to be recorded at fair value, with the related subsidy recognised as revenue.
Under US GAAP and NZ IFRS the subsidy is credited against the value of the assets acquired. The reconciling difference will reverse in future years as the subsidised assets depreciate.
(f) ProvisionsIn the prior year immaterial differences relating to cut-off were identified and corrected in the prior period as part of the adjustment to inter-carrier provisions. Under US GAAP the period to which the differences related must be restated.
(g) Amortisation of GoodwillUnder NZ IFRS and US GAAP goodwill is carried at cost and subject to annual impairment testing. Telecom ceased amortising goodwill for US GAAP purposes from 1 July 2002 and ceased for NZ IFRS from 1 July 2004.
Goodwill is allocated between the reportable segments as summarised below:
AUSTRALIAN IT SERVICES WIRED WIRELESS OPERATIONS TOTAL(DOLLARS IN MILLIONS) $ $ $ $ $
Goodwill as at 30 June 2005 71 1 39 962 1,073
Acquisitions – 8 – – 8
Impairment – – – (952) (952)
Foreign currency translation adjustment – – – (10) (10)
Goodwill as at 30 June 2006 71 9 39 – 119
Due to the different dates of cessation of amortisation, the impairment charge for the year under US GAAP is higher than the impairment charge under NZ IFRS by $118 million.
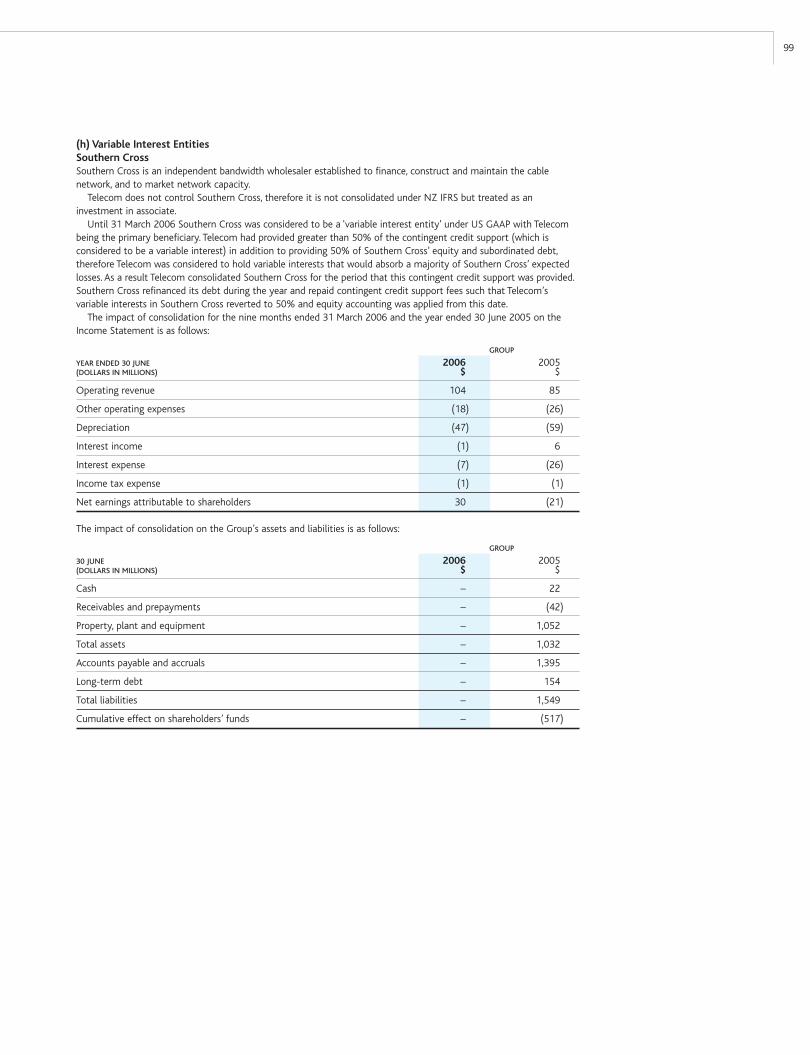
(h) Variable Interest EntitiesSouthern Cross Southern Cross is an independent bandwidth wholesaler established to finance, construct and maintain the cable network, and to market network capacity.
Telecom does not control Southern Cross, therefore it is not consolidated under NZ IFRS but treated as an investment in associate.
Until 31 March 2006 Southern Cross was considered to be a ‘variable interest entity’ under US GAAP with Telecom being the primary beneficiary. Telecom had provided greater than 50% of the contingent credit support (which is considered to be a variable interest) in addition to providing 50% of Southern Cross’ equity and subordinated debt, therefore Telecom was considered to hold variable interests that would absorb a majority of Southern Cross’ expected losses. As a result Telecom consolidated Southern Cross for the period that this contingent credit support was provided. Southern Cross refinanced its debt during the year and repaid contingent credit support fees such that Telecom’s variable interests in Southern Cross reverted to 50% and equity accounting was applied from this date.
The impact of consolidation for the nine months ended 31 March 2006 and the year ended 30 June 2005 on the Income Statement is as follows:
GROUP
YEAR ENDED 30 JUNE 2006 2005(DOLLARS IN MILLIONS) $ $
Operating revenue 104 85
Other operating expenses (18) (26)
Depreciation (47) (59)
Interest income (1) 6
Interest expense (7) (26)
Income tax expense (1) (1)
Net earnings attributable to shareholders 30 (21)
The impact of consolidation on the Group’s assets and liabilities is as follows:
GROUP
30 JUNE 2006 2005(DOLLARS IN MILLIONS) $ $
Cash – 22
Receivables and prepayments – (42)
Property, plant and equipment – 1,052
Total assets – 1,032
Accounts payable and accruals – 1,395
Long-term debt – 154
Total liabilities – 1,549
Cumulative effect on shareholders’ funds – (517)
99
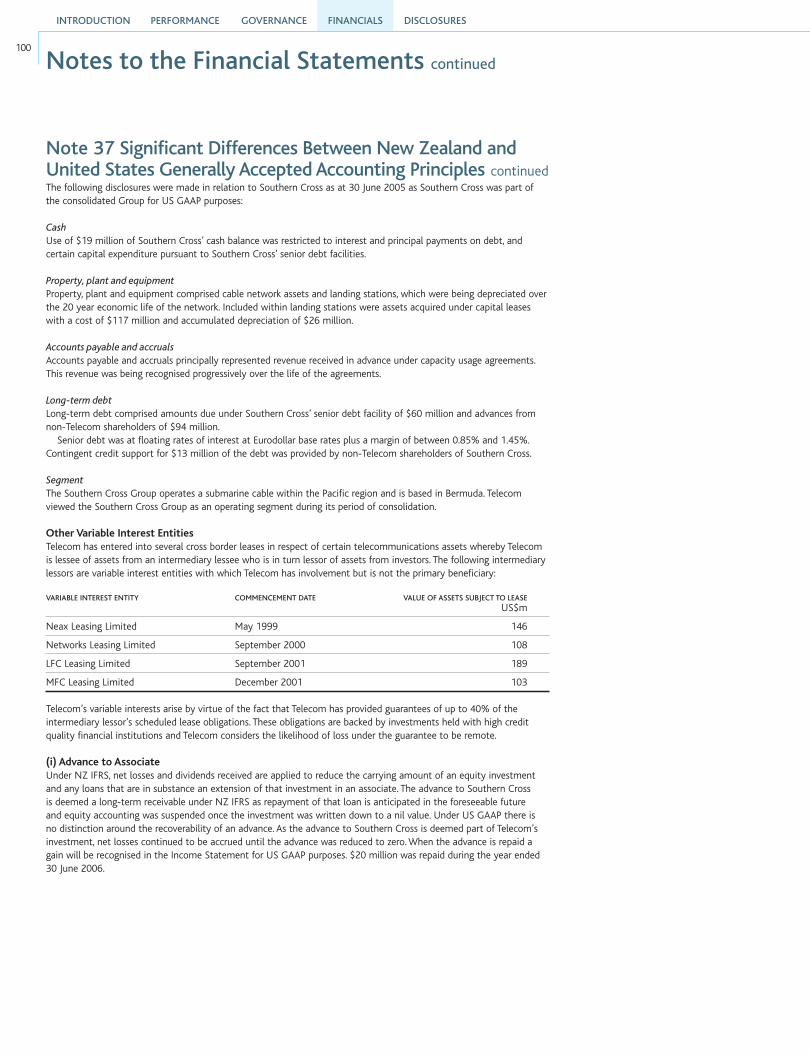
Notes to the Financial Statements continued
INTRODUCTION PERFORMANCE GOVERNANCE DISCLOSURESFINANCIALS
100
Note 37 Significant Differences Between New Zealand and United States Generally Accepted Accounting Principles continuedThe following disclosures were made in relation to Southern Cross as at 30 June 2005 as Southern Cross was part of the consolidated Group for US GAAP purposes:
CashUse of $19 million of Southern Cross’ cash balance was restricted to interest and principal payments on debt, and certain capital expenditure pursuant to Southern Cross’ senior debt facilities.
Property, plant and equipmentProperty, plant and equipment comprised cable network assets and landing stations, which were being depreciated over the 20 year economic life of the network. Included within landing stations were assets acquired under capital leases with a cost of $117 million and accumulated depreciation of $26 million.
Accounts payable and accrualsAccounts payable and accruals principally represented revenue received in advance under capacity usage agreements. This revenue was being recognised progressively over the life of the agreements.
Long-term debtLong-term debt comprised amounts due under Southern Cross’ senior debt facility of $60 million and advances from non-Telecom shareholders of $94 million.
Senior debt was at floating rates of interest at Eurodollar base rates plus a margin of between 0.85% and 1.45%. Contingent credit support for $13 million of the debt was provided by non-Telecom shareholders of Southern Cross.
SegmentThe Southern Cross Group operates a submarine cable within the Pacific region and is based in Bermuda. Telecom viewed the Southern Cross Group as an operating segment during its period of consolidation.
Other Variable Interest EntitiesTelecom has entered into several cross border leases in respect of certain telecommunications assets whereby Telecom is lessee of assets from an intermediary lessee who is in turn lessor of assets from investors. The following intermediary lessors are variable interest entities with which Telecom has involvement but is not the primary beneficiary:
VARIABLE INTEREST ENTITY COMMENCEMENT DATE VALUE OF ASSETS SUBJECT TO LEASE US$m
Neax Leasing Limited May 1999 146
Networks Leasing Limited September 2000 108
LFC Leasing Limited September 2001 189
MFC Leasing Limited December 2001 103
Telecom’s variable interests arise by virtue of the fact that Telecom has provided guarantees of up to 40% of the intermediary lessor’s scheduled lease obligations. These obligations are backed by investments held with high credit quality financial institutions and Telecom considers the likelihood of loss under the guarantee to be remote.
(i) Advance to Associate Under NZ IFRS, net losses and dividends received are applied to reduce the carrying amount of an equity investment and any loans that are in substance an extension of that investment in an associate. The advance to Southern Cross is deemed a long-term receivable under NZ IFRS as repayment of that loan is anticipated in the foreseeable future and equity accounting was suspended once the investment was written down to a nil value. Under US GAAP there is no distinction around the recoverability of an advance. As the advance to Southern Cross is deemed part of Telecom’s investment, net losses continued to be accrued until the advance was reduced to zero. When the advance is repaid a gain will be recognised in the Income Statement for US GAAP purposes. $20 million was repaid during the year ended 30 June 2006.

(j) Earnings Per ShareUS GAAP requires companies to present basic earnings per share and diluted earnings per share. The numerators and the denominators used in the computation of basic and diluted earnings per share are reconciled below:
GROUP
YEAR ENDED 30 JUNE 2006 2005(DOLLARS IN MILLIONS) $ $
Basic EPS
Numerator – net earnings (61) 978
Denominator – ordinary shares (in millions) 1,960 1,948
Basic (loss)/earnings per share (in cents) (3)¢ 50¢
Diluted EPS
Numerator – net (loss)/earnings (61) 978
Add – capital note interest after income tax – 19
Add – convertible note interest after income tax – 5
(61) 1,002
Denominator (in millions)
Ordinary shares 1,960 1,948
Capital notes – 57
Convertible notes – 17
Options – 5
1,960 2,027
Diluted (loss)/earnings per share (in cents) (3)¢ 49¢
(k) Connection RevenueUnder NZ IFRS charges for connecting customers to the network and costs related to connecting the customer are recognised in revenue/expenses as received/incurred.
US GAAP requires connection revenues to be deferred and recognised over the life of the connection, with related costs also deferred to the extent that they do not exceed deferred revenues. Telecom’s costs of connection exceed the revenue it derives from connection and therefore an adjustment to comply with US GAAP would result in equal deferral of income and expenditure. This would have no impact on net earnings or shareholders’ funds calculated in accordance with US GAAP.
(l) Cash Flow StatementUnder both NZ IFRS and US GAAP a Cash Flow Statement, which discloses cash flows from operating, investing and financing activities, is required to be presented. Telecom’s cash flows under US GAAP include the cash flows of Southern Cross for the period that it was consolidated under US GAAP.
GROUP
30 JUNE 2006 2005(DOLLARS IN MILLIONS) $ $
Net cash flows from
Operating activities 1,922 1,771
Investing activities (456) (660)
Financing activities (1,549) (1,207)
Net cash flow (83) (96)
Opening cash position 238 334
Closing cash position 155 238
101
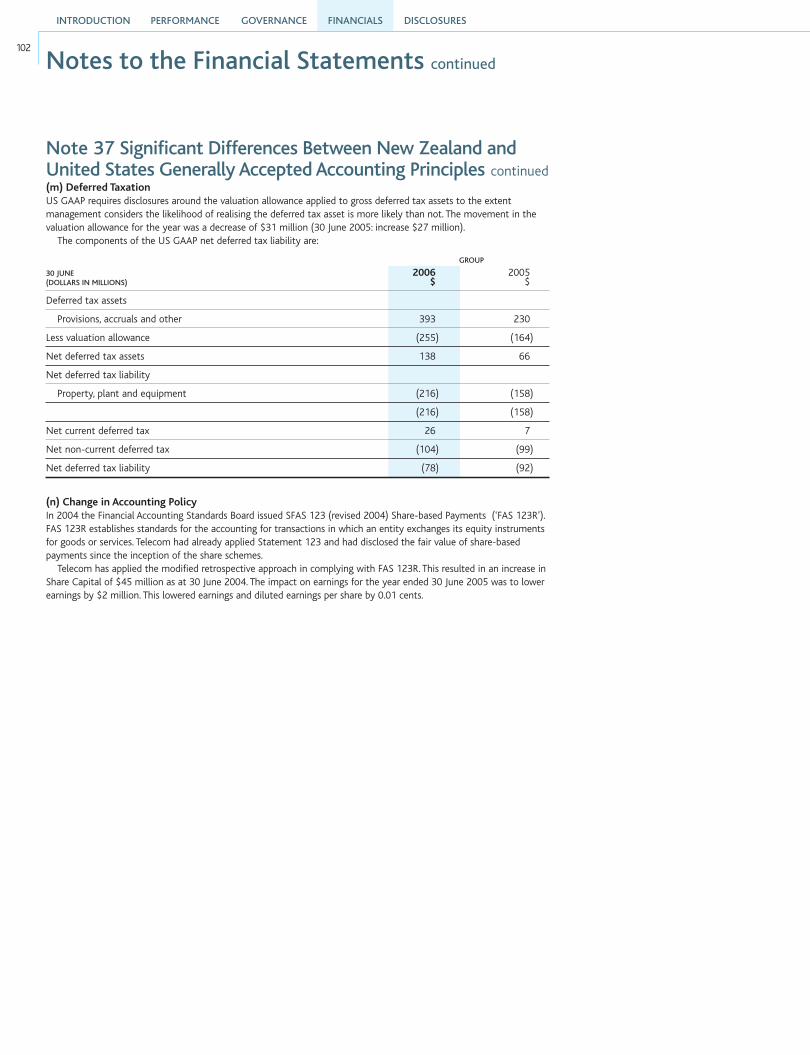
Notes to the Financial Statements continued
INTRODUCTION PERFORMANCE GOVERNANCE DISCLOSURESFINANCIALS
102
Note 37 Significant Differences Between New Zealand and United States Generally Accepted Accounting Principles continued(m) Deferred TaxationUS GAAP requires disclosures around the valuation allowance applied to gross deferred tax assets to the extent management considers the likelihood of realising the deferred tax asset is more likely than not. The movement in the valuation allowance for the year was a decrease of $31 million (30 June 2005: increase $27 million).
The components of the US GAAP net deferred tax liability are:
GROUP
30 JUNE 2006 2005(DOLLARS IN MILLIONS) $ $
Deferred tax assets
Provisions, accruals and other 393 230
Less valuation allowance (255) (164)
Net deferred tax assets 138 66
Net deferred tax liability
Property, plant and equipment (216) (158)
(216) (158)
Net current deferred tax 26 7
Net non-current deferred tax (104) (99)
Net deferred tax liability (78) (92)
(n) Change in Accounting PolicyIn 2004 the Financial Accounting Standards Board issued SFAS 123 (revised 2004) Share-based Payments (‘FAS 123R’). FAS 123R establishes standards for the accounting for transactions in which an entity exchanges its equity instruments for goods or services. Telecom had already applied Statement 123 and had disclosed the fair value of share-based payments since the inception of the share schemes.
Telecom has applied the modified retrospective approach in complying with FAS 123R. This resulted in an increase in Share Capital of $45 million as at 30 June 2004. The impact on earnings for the year ended 30 June 2005 was to lower earnings by $2 million. This lowered earnings and diluted earnings per share by 0.01 cents.

Note 38 New Zealand Equivalents to International Financial Reporting StandardsThe IFRS ProjectIn December 2002 the New Zealand Accounting Standards Review Board announced that International Financial Reporting Standards (‘IFRS’) will apply to all New Zealand entities from 1 January 2007. In adopting IFRS for issue as NZ IFRS certain adaptations of IFRS have been made to reflect New Zealand circumstances. In complying with NZ IFRS Telecom will also be in compliance with IFRS. Early adoption of NZ IFRS from 1 January 2005 was allowed as Australian entities and the European Union adopted IFRS from that date. Telecom has elected to apply NZ IFRS for the year ended 30 June 2006.
Basis of Preparation of DataThe restated financial information has been prepared on the basis of all NZ IFRS and New Zealand Equivalents to Standing Interpretations Committee (‘NZ SIC’) and New Zealand Equivalents to International Financial Reporting Interpretations Committee (‘NZ IFRIC’).
In accordance with NZ IFRS 1, First Time Adoption of New Zealand equivalents to International Financial Reporting Standards, the transition date to NZ IFRS was 1 July 2004, the start of the comparative period for the year ended 30 June 2006. Normally accounting changes of this nature would require full retrospective application, but NZ IFRS 1 presents optional and mandatory exemptions to full retrospective application.
NZ IFRS 1 ExemptionsNZ IFRS 1 permits those companies adopting NZ IFRS for the first time to take some exemptions from the full requirements of NZ IFRS when applying those standards to the comparative period. Telecom has applied the following key exemptions:
Business CombinationsBusiness combinations prior to the transition date (1 July 2004) have not been restated on an NZ IFRS basis.
Share-based PaymentsRestricted shares and share options that had vested by 1 July 2004 have not been expensed. All restricted shares and share options that had been granted prior to 1 July 2004 but had not vested at that date will be expensed over their remaining vesting period.
Financial InstrumentsAccounting for financial instruments in the comparative period will continue under NZ GAAP. The date of transition to accounting for financial instruments under NZ IFRS was 1 July 2005. On this date Telecom adopted NZ IAS 32 and NZ IAS 39. The effect of this is disclosed below.
Translation DifferencesThe balance of the foreign currency translation reserve, representing all cumulative translation differences that have arisen on the retranslation of overseas entities was set to zero at 1 July 2004.
Compound Financial InstrumentsIn conjunction with the exemption of applying financial instrument accounting, the equity and liability element of compound financial instruments has not been restated where the liability element was extinguished prior to 1 July 2005.
103
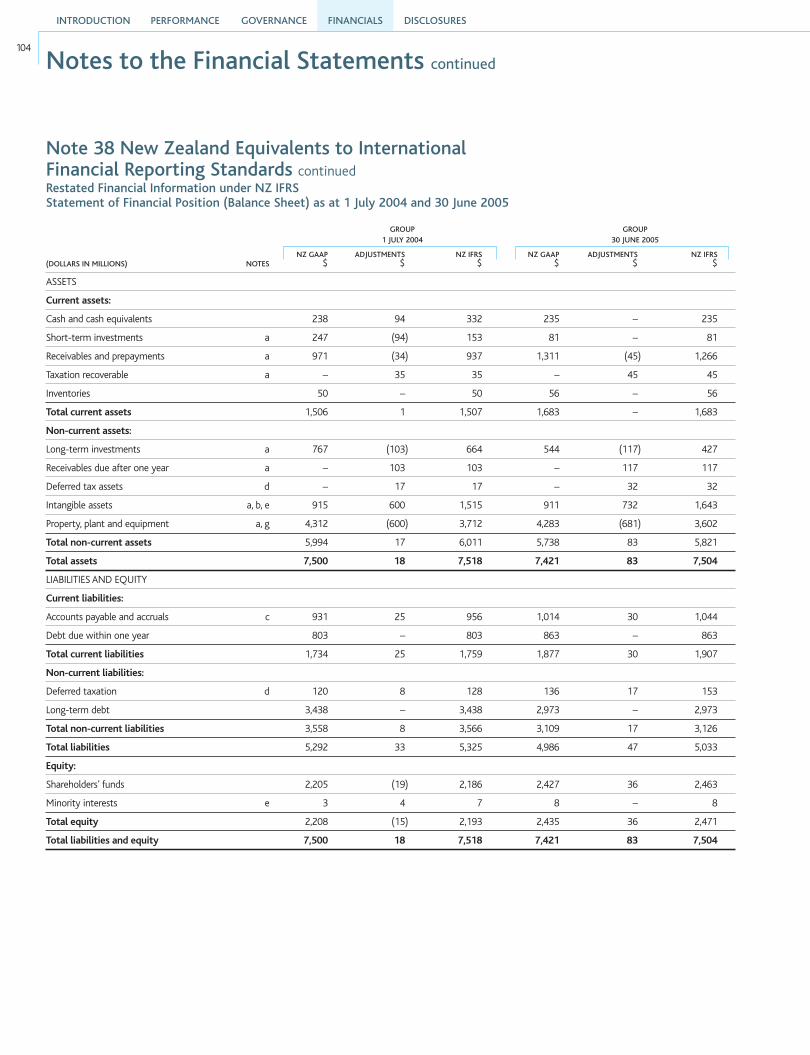
Notes to the Financial Statements continued
INTRODUCTION PERFORMANCE GOVERNANCE DISCLOSURESFINANCIALS
104
Note 38 New Zealand Equivalents to International Financial Reporting Standards continuedRestated Financial Information under NZ IFRSStatement of Financial Position (Balance Sheet) as at 1 July 2004 and 30 June 2005
GROUP GROUP 1 JULY 2004 30 JUNE 2005
NZ GAAP ADJUSTMENTS NZ IFRS NZ GAAP ADJUSTMENTS NZ IFRS(DOLLARS IN MILLIONS) NOTES $ $ $ $ $ $
ASSETS
Current assets:
Cash and cash equivalents 238 94 332 235 – 235
Short-term investments a 247 (94) 153 81 – 81
Receivables and prepayments a 971 (34) 937 1,311 (45) 1,266
Taxation recoverable a – 35 35 – 45 45
Inventories 50 – 50 56 – 56
Total current assets 1,506 1 1,507 1,683 – 1,683
Non-current assets:
Long-term investments a 767 (103) 664 544 (117) 427
Receivables due after one year a – 103 103 – 117 117
Deferred tax assets d – 17 17 – 32 32
Intangible assets a, b, e 915 600 1,515 911 732 1,643
Property, plant and equipment a, g 4,312 (600) 3,712 4,283 (681) 3,602
Total non-current assets 5,994 17 6,011 5,738 83 5,821
Total assets 7,500 18 7,518 7,421 83 7,504
LIABILITIES AND EQUITY
Current liabilities:
Accounts payable and accruals c 931 25 956 1,014 30 1,044
Debt due within one year 803 – 803 863 – 863
Total current liabilities 1,734 25 1,759 1,877 30 1,907
Non-current liabilities:
Deferred taxation d 120 8 128 136 17 153
Long-term debt 3,438 – 3,438 2,973 – 2,973
Total non-current liabilities 3,558 8 3,566 3,109 17 3,126
Total liabilities 5,292 33 5,325 4,986 47 5,033
Equity:
Shareholders’ funds 2,205 (19) 2,186 2,427 36 2,463
Minority interests e 3 4 7 8 – 8
Total equity 2,208 (15) 2,193 2,435 36 2,471
Total liabilities and equity 7,500 18 7,518 7,421 83 7,504
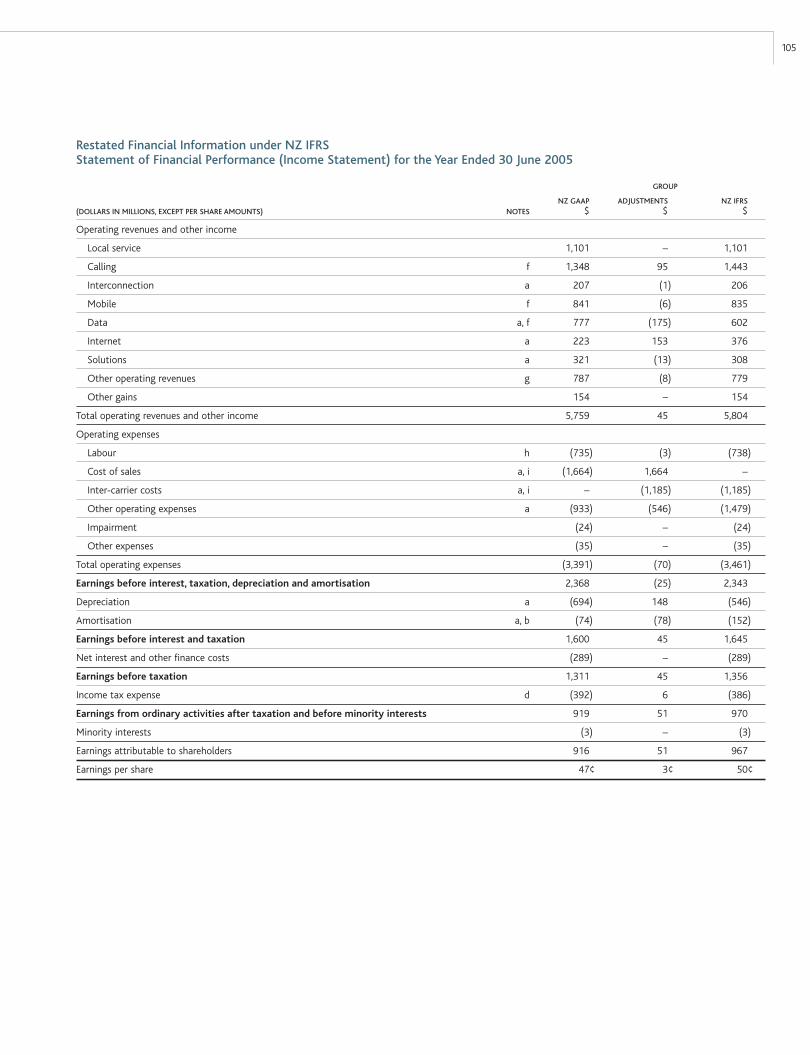
Restated Financial Information under NZ IFRSStatement of Financial Performance (Income Statement) for the Year Ended 30 June 2005
GROUP
NZ GAAP ADJUSTMENTS NZ IFRS(DOLLARS IN MILLIONS, EXCEPT PER SHARE AMOUNTS) NOTES $ $ $
Operating revenues and other income
Local service 1,101 – 1,101
Calling f 1,348 95 1,443
Interconnection a 207 (1) 206
Mobile f 841 (6) 835
Data a, f 777 (175) 602
Internet a 223 153 376
Solutions a 321 (13) 308
Other operating revenues g 787 (8) 779
Other gains 154 – 154
Total operating revenues and other income 5,759 45 5,804
Operating expenses
Labour h (735) (3) (738)
Cost of sales a, i (1,664) 1,664 –
Inter-carrier costs a, i – (1,185) (1,185)
Other operating expenses a (933) (546) (1,479)
Impairment (24) – (24)
Other expenses (35) – (35)
Total operating expenses (3,391) (70) (3,461)
Earnings before interest, taxation, depreciation and amortisation 2,368 (25) 2,343
Depreciation a (694) 148 (546)
Amortisation a, b (74) (78) (152)
Earnings before interest and taxation 1,600 45 1,645
Net interest and other finance costs (289) – (289)
Earnings before taxation 1,311 45 1,356
Income tax expense d (392) 6 (386)
Earnings from ordinary activities after taxation and before minority interests 919 51 970
Minority interests (3) – (3)
Earnings attributable to shareholders 916 51 967
Earnings per share 47¢ 3¢ 50¢
105
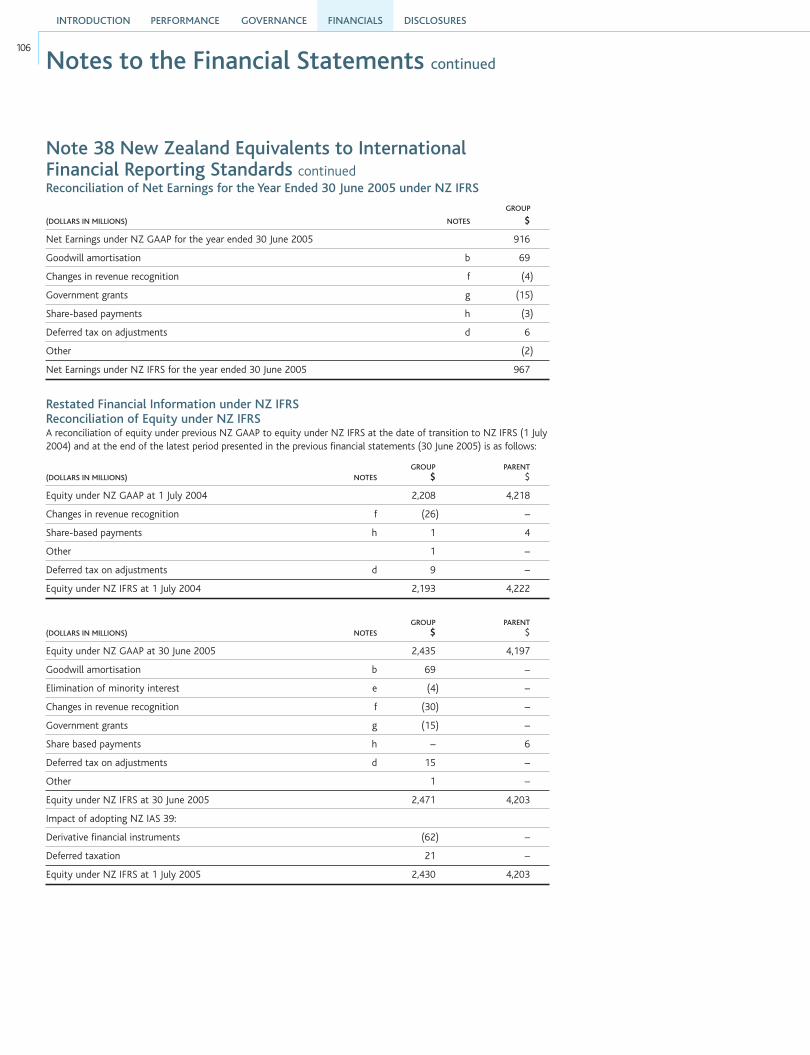
Notes to the Financial Statements continued
INTRODUCTION PERFORMANCE GOVERNANCE DISCLOSURESFINANCIALS
106
Note 38 New Zealand Equivalents to International Financial Reporting Standards continuedReconciliation of Net Earnings for the Year Ended 30 June 2005 under NZ IFRS
GROUP
(DOLLARS IN MILLIONS) NOTES $
Net Earnings under NZ GAAP for the year ended 30 June 2005 916
Goodwill amortisation b 69
Changes in revenue recognition f (4)
Government grants g (15)
Share-based payments h (3)
Deferred tax on adjustments d 6
Other (2)
Net Earnings under NZ IFRS for the year ended 30 June 2005 967
Restated Financial Information under NZ IFRSReconciliation of Equity under NZ IFRSA reconciliation of equity under previous NZ GAAP to equity under NZ IFRS at the date of transition to NZ IFRS (1 July 2004) and at the end of the latest period presented in the previous financial statements (30 June 2005) is as follows:
GROUP PARENT(DOLLARS IN MILLIONS) NOTES $ $
Equity under NZ GAAP at 1 July 2004 2,208 4,218
Changes in revenue recognition f (26) –
Share-based payments h 1 4
Other 1 –
Deferred tax on adjustments d 9 –
Equity under NZ IFRS at 1 July 2004 2,193 4,222
GROUP PARENT(DOLLARS IN MILLIONS) NOTES $ $
Equity under NZ GAAP at 30 June 2005 2,435 4,197
Goodwill amortisation b 69 –
Elimination of minority interest e (4) –
Changes in revenue recognition f (30) –
Government grants g (15) –
Share based payments h – 6
Deferred tax on adjustments d 15 –
Other 1 –
Equity under NZ IFRS at 30 June 2005 2,471 4,203
Impact of adopting NZ IAS 39:
Derivative financial instruments (62) –
Deferred taxation 21 –
Equity under NZ IFRS at 1 July 2005 2,430 4,203

Notes to Restated Financial Information(a) Presentational DifferencesNZ IFRS 1 specifies how financial information should be presented under NZ IFRS. The Statement of Financial Performance is referred to as the Income Statement and the Statement of Financial Position is referred to as the Balance Sheet.
Other presentation differences include: software is now classified as an intangible asset rather than as an item of property, plant and equipment where that software is not integral to a piece of equipment
international telecommunications capacity acquired pursuant to capacity usage agreements is also now classified as an intangible asset rather than as an item of property, plant and equipment
short-term investments are considered to be cash or cash equivalents where they are a highly liquid resource
taxation recoverable must be presented separately on the face of the Balance Sheet
advances made to Southern Cross that are not due within 12 months are now classified as receivables due in more than one year
certain revenue streams where Telecom has determined it is acting as agent or is exchanging goods and services are reported as the net margin, and certain other revenue streams where Telecom has determined it is acting asthe principal in a transaction are reported gross. The effect on the net profit is nil.
(b) GoodwillGoodwill is not amortised. Periodic impairment reviews will be used to assess whether it has become impaired during the year. Where impairment is identified the write-down will be taken to the Income Statement.
(c) Accounts Payable and AccrualsIn accordance with the deferral of certain revenue streams, a deferred revenue liability has been created.
(d) Deferred TaxationDeferred taxation is provided in full on temporary differences arising between the accounting and tax base of assets and liabilities. Deferred tax assets are only recognised to the extent that there will be future taxable profits or deferred tax liabilities to offset those assets. Deferred tax assets are shown separately from deferred tax liabilities on the face of the balance sheet. This resulted in a reclassification from non-current liabilities to non-current assets. Deferred tax assets have been restated to present them on a net basis where Telecom has legal right of set off within a tax jurisdiction.
(e) Minority InterestsA negative minority interest was reclassified to retained earnings at 30 June 2004. This minority interest was bought out during the year ended 30 June 2005.
(f) Revenue RecognitionRevenues received in advance for certain miscellaneous services are deferred until the expiry of the obligation upon Telecom to provide the service. This will have a minor impact on ongoing earnings.
(g) Government GrantsGovernment grants that are granted for the specific purpose of purchasing assets will be netted off against the cost of those assets if and when the conditions attached to that grant are met.
(h) Share-based PaymentsRestricted shares and share options are valued using a binomial-lattice model. All shares issued since September 2001 have been valued and expensed over their vesting period.
(i) Cost of SalesNZ IAS 1 requires expenses to be presented by function or by nature. Cost of sales is a functional presentation, while other items in Telecom’s Income Statement are classified by nature, so it has been reclassified into inter-carrier costs and other operating expenses, in order to achieve a consistent presentation of expenses by nature.
(j) Financial InstrumentsTelecom has applied the exemption that defers the date of transition for accounting for financial instruments under NZ IFRS. On 1 July 2005 Telecom applied these accounting policies and a number of adjustments were made to the opening Balance Sheet for the year ending 30 June 2006. The principal adjustments were to recognise all derivative financial instruments at fair value. This created a net liability that should principally unwind to the extent that Telecom’s derivatives can be deemed effective hedges under NZ IFRS.
(k) Cash FlowThere will be no significant adjustments to the reported cash flows of Telecom under NZ IFRS other than the change in definition of cash to include short-term investments, as detailed in Note (a) above.
107

INTRODUCTION PERFORMANCE GOVERNANCE DISCLOSURESFINANCIALS
108
To the Shareholders of Telecom Corporation of New Zealand LimitedWe have audited the financial statements on pages 58 to 107. The financial statements provide information about the past financial performance and financial position of the Company and Group as at 30 June 2006. This information is stated in accordance with the accounting policies set out on pages 62 to 65.
Directors’ responsibilitiesThe Directors are responsible for the preparation of financial statements which give a true and fair view of the financial position of the Company and Group as at 30 June 2006 and the results of their operations and cash flows for the year ended on that date.
Auditors’ responsibilitiesIt is our responsibility to express an independent opinion on the financial statements presented by the Directors and report our opinion to you.
Basis of opinionAn audit includes examining, on a test basis, evidence relevant to the amounts and disclosures in the financial statements. It also includes assessing:
• the significant estimates and judgments made by the Directors in the preparation of the financial statements;
• whether the accounting policies are appropriate to the Company’s and Group’s circumstances, consistently applied and adequately disclosed.
We conducted our audit in accordance with New Zealand Auditing Standards. We planned and performed our audit so as to obtain all the information and explanations which we considered necessary in order to provide us with sufficient evidence to obtain reasonable assurance that the financial statements are free from material misstatements, whether caused by fraud or error. In forming our opinion we also evaluated the overall adequacy of the presentation of information in the financial statements.
Other than in our capacity as auditors we have no relationship with or interests in the Company. In our capacity as auditors, the firm has provided other assurance related services during the year, in addition to the statutory audit. Partners and employees of our firm may also deal with the Company and Group on normal terms within the ordinary course of trading activities of the business of the Company and Group. These matters have not impaired our independence as auditors of the Company and Group.
Unqualified opinionWe have obtained all the information and explanations we have required.
In our opinion:
• proper accounting records have been kept by the Company as far as appears from our examination of those records;
• the financial statements on pages 58 to 107:
− comply with New Zealand generally accepted accounting practice;
− give a true and fair view of the financial position of the Company and Group as at 30 June 2006 and the results of their operations and cash flows for the year ended on that date.
Our audit was completed on 28 August 2006 and our unqualified opinion is expressed as at that date.
Wellington
Auditors’ Report

109Disclosures
Interests Register The following are particulars of entries made in the Interests Register for the period 1 July 2005 to 30 June 2006.
Disclosure of Interest Directors disclosed interests, or a cessation of interest, in the following entities pursuant to section 140 of the Companies Act 1993.
Roderick Deane
ENTITY RELATIONSHIP
ANZ National Bank Limited Ceased to be Chairman and Director
Australia and New Zealand Banking Group Limited Ceased to be a Director
City Gallery Wellington Foundation Ceased to be Chairman and Trustee
Te Papa Tongarewa Ceased to be Chairman and Director
Theresa Gattung
ENTITY RELATIONSHIP
Wellington Kiwi Can Charitable Trust Resigned as Chair
Wayne Boyd
ENTITY RELATIONSHIP
Landco Limited Appointed a Director
Fairfax Advisory Board Ceased to be Board member
Rod McGeoch
ENTITY RELATIONSHIP
RWC 2011 Bid Advisory Committee Appointed and Ceased to be a member
Rob McLeod
ENTITY RELATIONSHIP
Sealord Group Limited Appointed Chairman
Kura Limited Appointed Director
Relevant Interest in Shares Directors disclosed, pursuant to Section 148 of the Companies Act 1993, the following acquisitions and disposals of relevant interest in Telecom shares during the year ended 30 June 2006:
Roderick Deane
DATE OF NUMBER OF SHARES DISPOSAL/ACQUISITION CONSIDERATION ACQUISITIONS/(DISPOSITIONS)
18 December 2005 Services to Telecom (246,774)1
1. Indicates options which lapsed during the year.
Theresa Gattung
DATE OF NUMBER OF SHARES DISPOSAL/ACQUISITION CONSIDERATION ACQUISITIONS/(DISPOSITIONS)
16 September 2005 Services to Telecom 500,0001
19 September 2005 Services to Telecom 66,1262
1 October 2005 Services to Telecom (259,646)3
1. This transaction relates to a grant of options under the Performance Option Scheme.2. This transaction relates to an issue of shares under the Performance Incentive Scheme.3. This transaction relates to the lapse of options granted under the Telecom Share Option Scheme.
Wayne Boyd
DATE OF NUMBER OF SHARES DISPOSAL/ACQUISITION CONSIDERATION ACQUISITIONS/(DISPOSITIONS)
19 May 2006 $18,600 4,000
29 June 2006 $60,750 15,000
Rob McLeod
DATE OF NUMBER OF SHARES DISPOSAL/ACQUISITION CONSIDERATION ACQUISITIONS/(DISPOSITIONS)
29 June 2006 $40,912 10,000
Employee Remuneration The number of employees (including employees holding offi ce as Directors of subsidiaries) whose remuneration and benefi ts are within specifi ed bands are as follows:
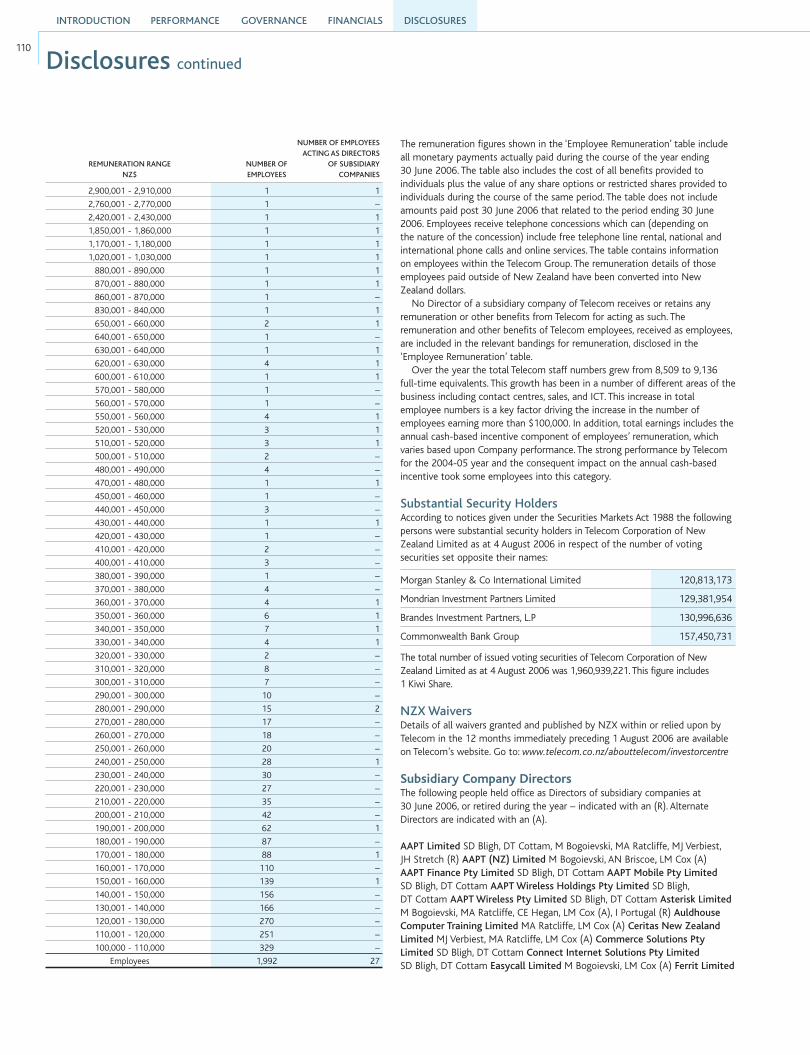
NUMBER OF EMPLOYEES ACTING AS DIRECTORS REMUNERATION RANGE NUMBER OF OF SUBSIDIARY NZ$ EMPLOYEES COMPANIES
2,900,001 - 2,910,000 1 1
2,760,001 - 2,770,000 1 –
2,420,001 - 2,430,000 1 1
1,850,001 - 1,860,000 1 1
1,170,001 - 1,180,000 1 1
1,020,001 - 1,030,000 1 1
880,001 - 890,000 1 1
870,001 - 880,000 1 1
860,001 - 870,000 1 –
830,001 - 840,000 1 1
650,001 - 660,000 2 1
640,001 - 650,000 1 –
630,001 - 640,000 1 1
620,001 - 630,000 4 1
600,001 - 610,000 1 1
570,001 - 580,000 1 –
560,001 - 570,000 1 –
550,001 - 560,000 4 1
520,001 - 530,000 3 1
510,001 - 520,000 3 1
500,001 - 510,000 2 –
480,001 - 490,000 4 –
470,001 - 480,000 1 1
450,001 - 460,000 1 –
440,001 - 450,000 3 –
430,001 - 440,000 1 1
420,001 - 430,000 1 –
410,001 - 420,000 2 –
400,001 - 410,000 3 –
380,001 - 390,000 1 –
370,001 - 380,000 4 –
360,001 - 370,000 4 1
350,001 - 360,000 6 1
340,001 - 350,000 7 1
330,001 - 340,000 4 1
320,001 - 330,000 2 –
310,001 - 320,000 8 –
300,001 - 310,000 7 –
290,001 - 300,000 10 –
280,001 - 290,000 15 2
270,001 - 280,000 17 –
260,001 - 270,000 18 –
250,001 - 260,000 20 –
240,001 - 250,000 28 1
230,001 - 240,000 30 –
220,001 - 230,000 27 –
210,001 - 220,000 35 –
200,001 - 210,000 42 –
190,001 - 200,000 62 1
180,001 - 190,000 87 –
170,001 - 180,000 88 1
160,001 - 170,000 110 –
150,001 - 160,000 139 1
140,001 - 150,000 156 –
130,001 - 140,000 166 –
120,001 - 130,000 270 –
110,001 - 120,000 251 –
100,000 - 110,000 329 –
Employees 1,992 27
The remuneration figures shown in the ‘Employee Remuneration’ table include all monetary payments actually paid during the course of the year ending 30 June 2006. The table also includes the cost of all benefits provided to individuals plus the value of any share options or restricted shares provided to individuals during the course of the same period. The table does not include amounts paid post 30 June 2006 that related to the period ending 30 June 2006. Employees receive telephone concessions which can (depending on the nature of the concession) include free telephone line rental, national and international phone calls and online services. The table contains information on employees within the Telecom Group. The remuneration details of those employees paid outside of New Zealand have been converted into New Zealand dollars.
No Director of a subsidiary company of Telecom receives or retains any remuneration or other benefits from Telecom for acting as such. The remuneration and other benefits of Telecom employees, received as employees, are included in the relevant bandings for remuneration, disclosed in the ‘Employee Remuneration’ table.
Over the year the total Telecom staff numbers grew from 8,509 to 9,136 full-time equivalents. This growth has been in a number of different areas of the business including contact centres, sales, and ICT. This increase in total employee numbers is a key factor driving the increase in the number of employees earning more than $100,000. In addition, total earnings includes the annual cash-based incentive component of employees’ remuneration, which varies based upon Company performance. The strong performance by Telecom for the 2004-05 year and the consequent impact on the annual cash-based incentive took some employees into this category.
Substantial Security Holders According to notices given under the Securities Markets Act 1988 the following persons were substantial security holders in Telecom Corporation of New Zealand Limited as at 4 August 2006 in respect of the number of voting securities set opposite their names:
Morgan Stanley & Co International Limited 120,813,173
Mondrian Investment Partners Limited 129,381,954
Brandes Investment Partners, L.P 130,996,636
Commonwealth Bank Group 157,450,731
The total number of issued voting securities of Telecom Corporation of New Zealand Limited as at 4 August 2006 was 1,960,939,221. This figure includes 1 Kiwi Share.
NZX Waivers Details of all waivers granted and published by NZX within or relied upon by Telecom in the 12 months immediately preceding 1 August 2006 are available on Telecom’s website. Go to: www.telecom.co.nz/abouttelecom/investorcentre
Subsidiary Company Directors The following people held office as Directors of subsidiary companies at 30 June 2006, or retired during the year – indicated with an (R). Alternate Directors are indicated with an (A).
AAPT Limited SD Bligh, DT Cottam, M Bogoievski, MA Ratcliffe, MJ Verbiest, JH Stretch (R) AAPT (NZ) Limited M Bogoievski, AN Briscoe, LM Cox (A) AAPT Finance Pty Limited SD Bligh, DT Cottam AAPT Mobile Pty Limited SD Bligh, DT Cottam AAPT Wireless Holdings Pty Limited SD Bligh, DT Cottam AAPT Wireless Pty Limited SD Bligh, DT Cottam Asterisk Limited M Bogoievski, MA Ratcliffe, CE Hegan, LM Cox (A), I Portugal (R) Auldhouse Computer Training Limited MA Ratcliffe, LM Cox (A) Ceritas New Zealand Limited MJ Verbiest, MA Ratcliffe, LM Cox (A) Commerce Solutions Pty Limited SD Bligh, DT Cottam Connect Internet Solutions Pty Limited SD Bligh, DT Cottam Easycall Limited M Bogoievski, LM Cox (A) Ferrit Limited
INTRODUCTION PERFORMANCE GOVERNANCE DISCLOSURESFINANCIALS
110
Disclosures continued

111
SP Moutter, RE Brayham, LM Cox (A) Gen-i Australia Pty Limited SD Bligh, DT Cottam, CA Mulholland (R) Gen-i Limited MA Ratcliffe, LM Cox (A) Illuminationz Limited MA Ratcliffe, LM Cox (A) Pacific Star Services Pty Limited SD Bligh, DT Cottam TCNZ (Bermuda) Limited M Bogoievski, C Adderley, J Collis, MT Ammisah (A), AN Briscoe (A), A Parker (A), MJ Verbiest (A), AJ Carroll (A), NJ Olson (A), A Dyer-Fagundo (A), J Taggart (A), B Law (R) TCNZ (UK) Investments Limited M Bogoievski, NJ Olson TCNZ (United Kingdom) Securities Limited NJ Olson, WY Chee, NJ Batchelor, TCNZ Australia Investments Pty Limited TE Gattung, SD Bligh, DT Cottam, M Bogoievski (A), JH Stretch (R), CA Mulholland (R) TCNZ Australia Pty Limited SD Bligh, DT Cottam, JH Stretch (R), CA Mulholland (R) TCNZ Cook Islands Holdings Limited PA Garty, SL Davies (A) TCNZ Cook Islands Limited PA Garty TCNZ Equities Limited M Bogoievski, MJ Verbiest, LM Cox (A) TCNZ Finance Limited NJ Olson, TE Gattung, M Bogoievski, MJ Verbiest, M Bogoievski (A), LM Cox (A), MJ Verbiest (A), AJ Carroll (A) TCNZ Financial Services Limited M Bogoievski, LM Cox (A) Teleco Insurance Investments Limited NJ Olson, D Lines, C E Adderley, MJ Verbiest (A), AG Parker (A), J Collis (A), P Bubenzer (A), J Redden-Soares (A) Teleco Insurance (NZ) Limited M Bogoievski, LM Cox (A) Teleco Insurance Limited NJ Olson, D Lines, C Adderley, MJ Verbiest (A), AG Parker (A), J Collis (A), P Bubenzer (A), J Redden-Soares (A) Telecom 3G Limited MJ Verbiest, KJ Kenrick, LM Cox (A) Telecom 3G Holdings Limited MJ Verbiest, KJ Kenrick, LM Cox (A) Telecom Cook Islands Limited PA Garty, JR Mitchell, GO Pitt, MC Mitchell, SL Davies Telecom Corporation of New Zealand (Overseas Finance) Limited M Bogoievski, MJ Verbiest, LM Cox (A) Telecom Credit Limited M Bogoievski, LM Cox (A) Telecom Directories Holdings Limited DJ Enoka, MJ Verbiest, LM Cox (A) Telecom Directories Limited DJ Enoka, MJ Verbiest, LM Cox (A) Telecom Enterprises Limited M Bogoievski, LM Cox (A) Telecom Europe ApS M Bogoievski, B Kreiborg, J van Rijn Telecom Europe Holdings ApS M Bogoievski, B Kreiborg, J van Rijn Telecom Europe 3G ApS M Bogoievski, B Kreiborg, J van Rijn Telecom Investments Limited M Bogoievski, LM Cox (A) Telecom IP Limited MJ Verbiest, LM Cox (A) Telecom Leasing Limited MJ Verbiest, M Bogoievski, AN Briscoe (A), LM Cox (A) Telecom Mobile Leasing No.1 Limited M Bogoievski, LM Cox (A) Telecom Mobile Leasing No.2 Limited M Bogoievski, LM Cox (A) Telecom Mobile Limited KJ Kenrick, SP Moutter, LM Cox (A) Telecom NZ (No.1) Limited M Bogoievski, LM Cox (A) Telecom New Zealand Australia Pty Limited SD Bligh, DT Cottam Telecom New Zealand Communications (USA) Limited AN Briscoe, IA Neale, CB Beedell, LB Miller Telecom New Zealand Finance Limited M Bogoievski, NJ Olson, LM Cox (A) Telecom New Zealand Finance (No.2) Limited J Collis, C Adderley, N Olson, A Dyer-Fagundo (A), MT Ammisah (A), AN Briscoe (A), AG Parker (A), MJ Verbiest (A), J Taggart (A), B Law (R) Telecom New Zealand International Limited AN Briscoe, SP Moutter, LM Cox (A) Telecom New Zealand International Australia Pty Limited AN Briscoe, PG Barrett, SD Bligh, CA Mulholland (R) Telecom New Zealand Japan Kabushiki Kaisha AN Briscoe, CN Angove, I Tamagawa Telecom New Zealand Limited TE Gattung, MJ Verbiest, M Bogoievski, SP Moutter, LM Cox (A), MJ Verbiest (A) Telecom New Zealand (UK) Licences Limited AN Briscoe, NJ Batchelor, WY Chee, JB van Woerkem Telecom New Zealand UK Limited AN Briscoe, NJ Batchelor, WY Chee, JB van Woerkem Telecom New Zealand USA Limited AN Briscoe, IA Neale, LB Miller, JB van Woerkem Telecom Pacific Investments Limited PA Garty, LM Cox (A) Telecom Pacific Limited M Bogoievski, MJ Verbiest, LM Cox (A) Telecom Pagenet Limited M Bogoievski, LM Cox (A) Telecom Purchasing Limited M Bogoievski, LM Cox (A) Telecom Retail Holdings Limited KJ Kenrick, LM Cox (A), SP Moutter (A) Telecom Samoa Cellular Limited AN Briscoe, E Tuioti, CB Beedell, PA Garty Telecom Southern Cross Finance Limited J Collis, C Adderley, NJ Olson, MJ Verbiest (A), AN Briscoe (A), AJ Carroll (A), A Parker (A), MT Ammisah (A), A Dyer-Fagundo (A), J Taggart (A), B Law (R) Telecom Southern Cross Limited M Bogoievski, LM Cox (A) Telecom Trustee Limited MJ Verbiest, LM Cox (A) Telecom US Leasing Limited M Bogoievski, SP Moutter, LM Cox (A) Telecom US Leasing No.2 Limited M Bogoievski, SP Moutter, LM Cox (A) Telecom Wellington Investments Limited M Bogoievski, LM Cox (A) Telegistics Repair Limited
Twenty Largest Registered Shareholders as at 1 August 2006 RANK HOLDER NAME HOLDING %
1 ANZ Nominees Limited 488,298,451 24.90
2 National Nominees New Zealand Limited 271,169,788 13.83
3 Westpac Banking Corporation – Client Assets No 2 102,775,249 5.24
4 J P Morgan Nominees Australia Limited 86,898,140 4.43
5 Citibank Nominees (New Zealand) Limited 83,406,472 4.25
6 Westpac Custodian Nominees Limited 77,154,010 3.94
7 ASB Nominees Limited 75,100,000 3.83
8 National Nominees Limited 69,805,897 3.56
9 Premier Nominees Limited – Armstrong Jones – Cash Fund 54,010,458 2.75
10 ANZ Nominees Limited 53,778,373 2.74
11 RBC Dexia Investor Services Australia Nominees Pty Limited 39,591,608 2.02
12 Accident Compensation Corporation 37,794,802 1.93
13 Cogent Nominees Pty Limited 23,601,537 1.20
14 RBC Dexia Investor Services Australia Nominees Pty Limited 15,445,246 0.79
15 Custody and Investment Nominees Limited 14,152,127 0.72
16 HSBC Nominees (NZ) Limited 13,218,516 0.67
17 Citicorp Nominees Pty Limited 11,176,320 0.57
18 NZ Superannuation Fund Nominees Limited 10,832,000 0.55
19 Citicorp Nominees Pty Limited 9,350,994 0.48
20 First NZ Capital Custodians Limited 8,864,081 0.45
FROM TO HOLDER COUNT % HOLDING QUANTITY %
1 999 13,037 25.81 6,619,261 0.34
1,000 4,999 27,448 54.34 58,303,558 2.97
5,000 9,999 5,659 11.20 36,618,794 1.87
10,000 99,999 4,148 8.21 79,696,529 4.06
100,000 and over 216 0.43 1,779,701,079 90.76
50,508 99.99 1,960,939,221 100.00
Non-marketable parcels – as at 4 August 2006 there were 65 shareholders holding a parcel of between 1 and 49 Telecom shares.
Analysis of Shareholding as at 1 August 2006
K Kenrick, SP Moutter, LM Cox (A) The Mobile Phone Company Limited M Bogoievski, LM Cox (A) Xtra Limited RJ Snodgrass, MA Ratcliffe, LM Cox (A) Yellow Pages Group Limited MJ Verbiest, DJ Enoka, LM Cox (A) Yellow Pages Limited M Bogoievski, LM Cox (A).
Stock Exchange Listing The ordinary shares of Telecom Corporation of New Zealand Limited (‘Telecom shares’) are listed on the NZSX Market and Australian Stock Exchange. Telecom shares are listed on the New York Stock Exchange in the form of American Depositary Shares. Due to the Kiwi Share provisions contained in Telecom’s Constitution (which are described in more detail on page 40 of this Annual Report) NZX has given Telecom’s shares a Non-Standard designation.

ASX Listing Telecom changed its admission category on the Australian Stock Exchange (‘ASX’) from ASX Exempt Foreign to ASX Listing in the 2002 financial year. As a consequence of becoming fully listed on the ASX, Telecom is required to make the following statements:
Telecom is incorporated in Wellington, New Zealand
Telecom is not subject to Chapters 6, 6A, 6B and 6C of the Corporations Act 2001 dealing with the acquisition of shares
Telecom’s Constitution provides that:
(1) No person shall have a relevant interest in 10% or more of the total voting shares for the time being without, and except in accordance with the terms of, the written approvals of each of the Kiwi Shareholder and the Board; and
(2) No person who is not a New Zealand national shall have a relevant interest in more than 49.9% of the total voting shares for the time being without, and except in accordance with the terms of, the prior written approval of the Kiwi Shareholder.
However, the power of the Board to limit the acquisition of more than 10% of the total voting shares as set out above must be read subject to the New Zealand Takeovers Code (‘the Code’) and in particular clauses 38 and 39 of the Code. Clauses 38 and 39 of the Code provide as follows:
(1) Clause 38 of the Code requires that if Telecom receives a takeover notice (a notice required when a full or partial offer is being made under the Code) or has reason to believe that a bona fide offer is imminent, the Directors must not take any action, in relation to the affairs of Telecom, that would effectively result in an offer being frustrated or Telecom shareholders being denied the opportunity to decide on the merits of an offer.
(2) Clause 39 of the Code permits Directors to take or permit:
(a) actions approved by an ordinary resolution of Telecom shareholders; or
(b) actions taken or permitted under contractual obligations entered into by Telecom, or in the implementation of proposals approved by Telecom Directors, where the obligations were entered into, or the proposals approved, before Telecom received the takeover notice or became aware that the offer was imminent.
Rights Attaching to Shares Telecom’s ordinary shares each carry a right to vote on any resolution on a poll at a meeting of shareholders. Holders of ordinary shares may vote at a meeting in person, or by proxy, representative, or attorney. Voting may be conducted by voice, or show of hands, or poll. The Kiwi Share and the options carry no right to vote at a meeting of shareholders.
Buyback As at 4 August 2006 there was no current on-market share buyback arrangement.
Annual Meeting of Shareholders Telecom’s Annual Meeting of shareholders will be held in the Ballroom, level 6, Duxton Hotel, Wakefield Street, Wellington on Thursday, 5 October 2006 at 10am. A notice of Annual Meeting and Proxy Form are circulated to shareholders with this Annual Report.
Registered Office The registered office of Telecom is:Telecom House, 68 Jervois QuayPO Box 570, Wellington 6011Ph +64-4-801 9000
Company Secretary Linda Cox
Dividends Paid The following is a summary of all dividends paid by Telecom since listing in July 1991. NZ cents per ordinary share, US cents per American Depositary Share (ADS).
1STQUARTER
2NDQUARTER
3RDQUARTER
4THQUARTER
1992 NZ cents 6.50 6.50
US cents 72.62 70.93
1993 NZ cents 7.25 8.25
US cents 74.49 91.34
1994 NZ cents 8.25 14.75
US cents 89.90 141.46
1995 NZ cents 13.50 16.50
US cents 135.82 172.10
1996 NZ cents 17.00 8.50 9.50
US cents 178.05 91.66 103.36
1997 NZ cents 9.50 9.50 9.50 10.50
US cents 104.60 106.10 104.50 57.90*
1998 NZ cents 10.50 10.50 10.50 8.00
US cents 62.65 49.19 55.96 35.35
1998 Special Dividend
NZ cents 3.50
US cents 18.05
1999 NZ cents 11.50 11.50 11.50 11.50
US cents 47.23 47.95 48.95 48.97
1999 Interim June Quarter
NZ cents 11.50
US cents 48.11
2000 NZ cents 11.50 11.50 11.50 11.50
US cents 45.18 48.03 46.07 45.35
2001 NZ cents 5.00 5.00 5.00 5.00
US cents 17.04 16.40 16.66 16.91
2002 NZ cents 5.00 5.00 5.00 5.00
US cents 16.26 16.60 17.63 19.55
2003 NZ cents 5.00 5.00 5.00 5.00
US cents 18.84 20.10 22.21 23.41
2004 NZ cents 5.00 5.00 7.50 9.50
US cents 24.06 25.93 39.54 49.55
2005 NZ cents 9.50 9.50 9.50 10.00
US cents 50.64 52.89 55.28 54.77
2005 Special Dividend
NZ cents 10.00
US cents 54.77
2006 NZ cents 9.50 9.50 9.50 7.00
US cents 51.83 51.83 46.75 33.84
2006 Special Dividend
NZ cents 5.00 5.00
US cents 27.28 24.17
The amount of US cents is calculated based on an exchange rate calculated at the end of each quarter.*On 1 April 1997 Telecom’s ADR to Ordinary Share ratio changed from 1:16 to 1:8.
Disclosures continued
INTRODUCTION PERFORMANCE GOVERNANCE DISCLOSURESFINANCIALS
112
Financial Calendar 2006-20075 October 2006
Annual Meeting Wellington
3 November 2006
First quarter result announced
December 2006
First quarter dividend paid
February 2007
Half year result announced
March 2007
Second quarter dividend paid
May 2007
Third quarter result announced
June 2007
Third quarter dividend paid
30 June 2007
Financial year end
August 2007
Annual result announced
Contents
Wayne BoydChairman
INTRODUCTION
02 Meeting customers on their turf
04 The competitive environment
06 Enabling the promise of new technology
08 Building the Australian business
10 Leadership Statement
13 Key Performance
14 Five Year Review
15 Sharemarket Review
16 Executive Team
18 Strategy Overview
PERFORMANCE
22 Divisional Overviews
22 > Wired
23 > Wireless
24 > IT Services
25 > Australia
26 Our People
28 Telecom in the Community
29 Valuing the Environment
48 Management Commentary
58 Financial Statements
62 Notes to the Financial Statements
108 Auditors’ Report
FINANCIALS
109 Disclosures
113 Shareholder Inquiries
DISCLOSURESGOVERNANCE
30 Board of Directors
32 Governance at Telecom
Theresa GattungChief Executive
This report is dated 28 August 2006 and is signed on behalf of the Board of Telecom Corporation of New Zealand Limited by:
113
Shareholders with inquiries about transactions, changes of address or dividend payments should contact Telecom’s share registries.
New Zealand RegistryComputershare Investor Services LimitedPrivate Bag 92119, Auckland 1142Ph: 0-9-488 8777Fax: 0-9-488 8787NZ Toll Free: 0800 737 100Email: [email protected]: www.computershare.com
United States RegistryDetails for Depositary Receipts, Transfer Agent, and RegistrarThe Bank of New York101 Barclay StreetNew York, NY 10286United StatesPh (US): 1-888-BNY-ADRsPh (non-US): 1-610 382 7833Website: www.adrbny.comPlease note that no email address or fax number is provided. Inquiries can be submitted directly via the website.
Australian RegistryComputershare Investor Services Pty LimitedGPO Box 7045, SydneyNSW 2001, AustraliaPh: 0-2-8234 5000Freephone: 1 800 501 366Fax: 0-2-8234 5050Email: [email protected]: www.computershare.com
Shareholder inquiries about Telecom’s operating and financial performance should be emailed to [email protected] or addressed to:General ManagerInvestor RelationsTelecom New ZealandPO Box 570Wellington 6011New Zealand
Contact Phone Numbers:Australia 1800 123 350Canada 1800 280 0398Hong Kong 800 962 867New Zealand 0800 737 500Singapore 800 641 1013United Kingdom 0800 960 283United States 1800 208 2130
Visit our website at www.telecom.co.nz
Shareholder Inquiries
The paper used in this report is sourced from a sustainable resource and is chlorine free.

Open
Annual Report 2006
Telecom C
orporation of New
Zealand Lim
ited Annual Report for the year ended 30 June 2006