telecom new zealand q1 fy10 result briefinginvestors.sparknz.co.nz/formbuilder/_resource/... · it...
TRANSCRIPT

TELECOM NEW ZEALAND H2 FY12 RESULT BRIEFING
Chief Executive Officer (Acting) – Chris Quin Chief Financial Officer – Nick Olson
2
CONTENTS
• Chris Quin
• Key messages
• Vision 2013 strategy update
• Market trends
• Business unit performance
• Nick Olson
• Group financials
• Chris Quin
• Outlook
3
H2 FY12 KEY MESSAGES
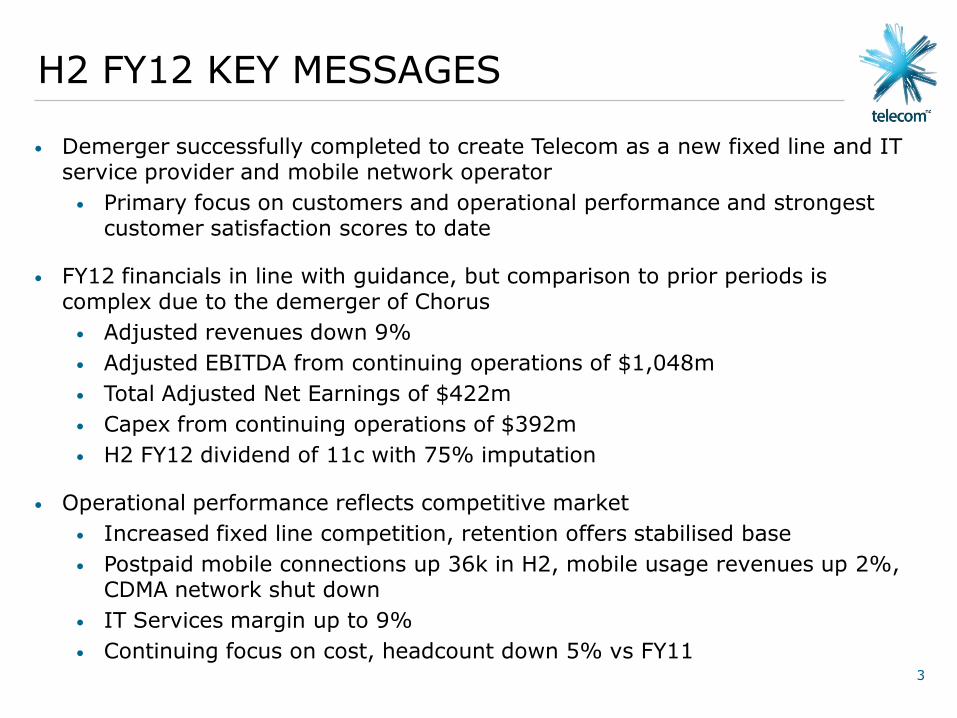
• Demerger successfully completed to create Telecom as a new fixed line and IT service provider and mobile network operator
• Primary focus on customers and operational performance and strongest customer satisfaction scores to date
• FY12 financials in line with guidance, but comparison to prior periods is complex due to the demerger of Chorus
• Adjusted revenues down 9%
• Adjusted EBITDA from continuing operations of $1,048m
• Total Adjusted Net Earnings of $422m
• Capex from continuing operations of $392m
• H2 FY12 dividend of 11c with 75% imputation
• Operational performance reflects competitive market
• Increased fixed line competition, retention offers stabilised base
• Postpaid mobile connections up 36k in H2, mobile usage revenues up 2%, CDMA network shut down
• IT Services margin up to 9%
• Continuing focus on cost, headcount down 5% vs FY11

4
VISION 2013 STRATEGY UPDATE
Vision 2013 Initiatives Full year performance to 30 June 2012
Improve customer satisfaction
• Customer satisfaction up in all areas with highest
scores to date
#1 in mobile, broadband and
ICT
• Fixed line competition resulting in declining market
share
• 2% growth in mobile usage revenues
• IT Services market share 14% and growing
Cost reduction and
simplification
• CDMA network shut down
• Headcount reduced by a further 5%
• In-sourcing of support functions
• Corporate centre costs down 7%
Innovation in fibre and mobile • Managed customers products in market with
~4,200 connections
• Consumer fibre products being delivered early 2013
• LTE trial on track for late 2012
5
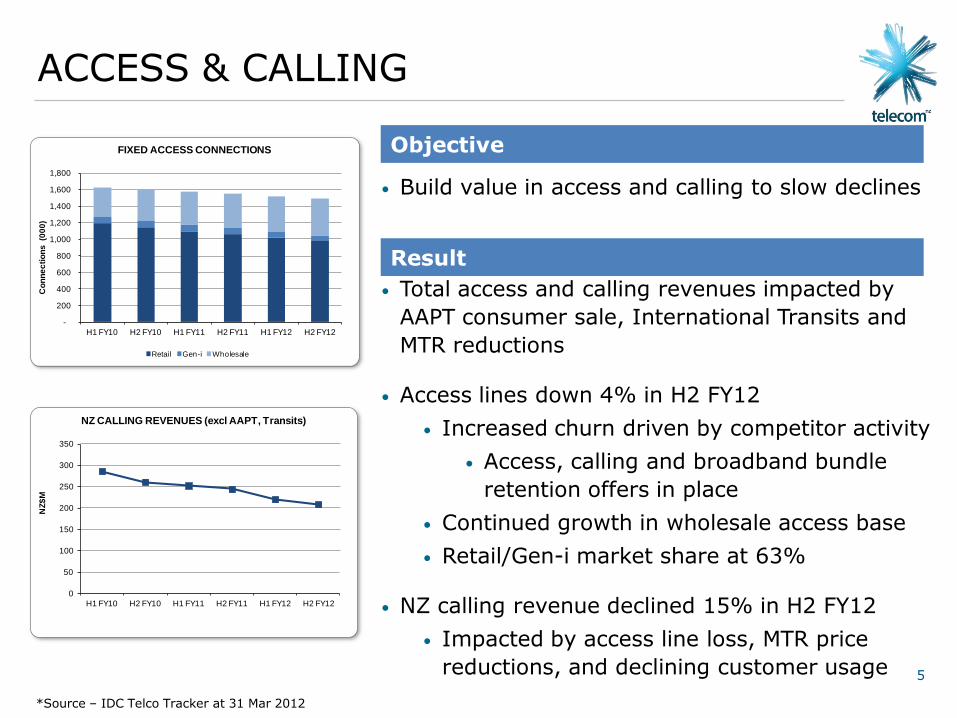
• Build value in access and calling to slow declines
• Total access and calling revenues impacted by
AAPT consumer sale, International Transits and
MTR reductions
• Access lines down 4% in H2 FY12
• Increased churn driven by competitor activity
• Access, calling and broadband bundle
retention offers in place
• Continued growth in wholesale access base
• Retail/Gen-i market share at 63%
• NZ calling revenue declined 15% in H2 FY12
• Impacted by access line loss, MTR price
reductions, and declining customer usage
ACCESS & CALLING
Objective
Result
*Source – IDC Telco Tracker at 31 Mar 2012
-
200
400
600
800
1,000
1,200
1,400
1,600
1,800
H1 FY10 H2 FY10 H1 FY11 H2 FY11 H1 FY12 H2 FY12
Co
nn
ec
tio
ns
(0
00
)
FIXED ACCESS CONNECTIONS
Retail Gen-i Wholesale
0
50
100
150
200
250
300
350
H1 FY10 H2 FY10 H1 FY11 H2 FY11 H1 FY12 H2 FY12
NZ
$M
NZ CALLING REVENUES (excl AAPT, Transits)
6
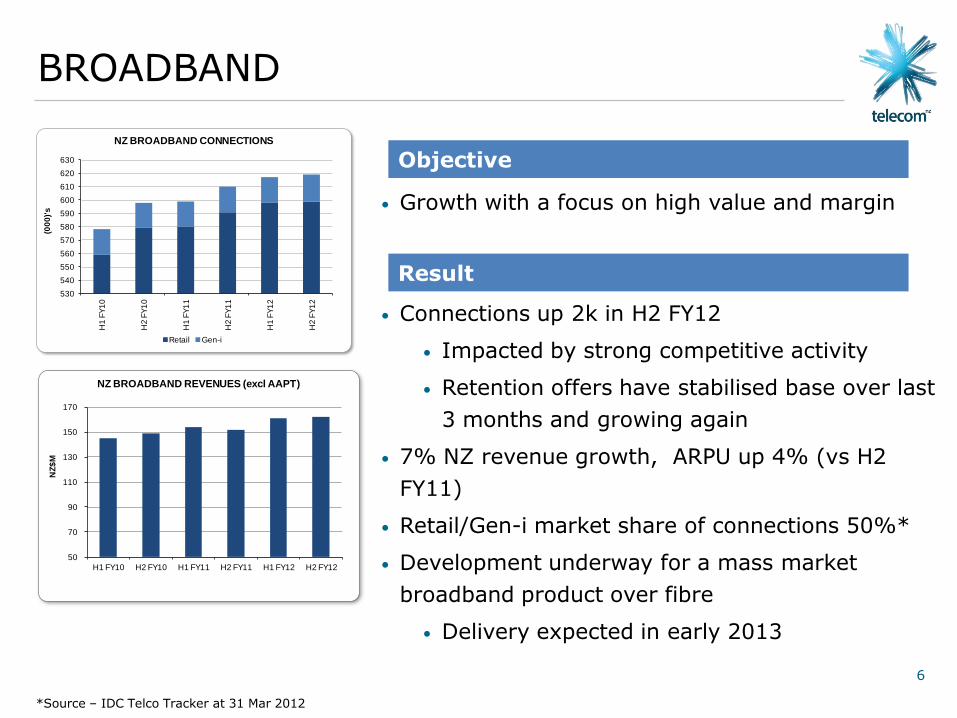
• Growth with a focus on high value and margin
• Connections up 2k in H2 FY12
• Impacted by strong competitive activity
• Retention offers have stabilised base over last
3 months and growing again
• 7% NZ revenue growth, ARPU up 4% (vs H2
FY11)
• Retail/Gen-i market share of connections 50%*
• Development underway for a mass market
broadband product over fibre
• Delivery expected in early 2013
BROADBAND
Objective
Result
*Source – IDC Telco Tracker at 31 Mar 2012
530
540
550
560
570
580
590
600
610
620
630
H1
FY
10
H2
FY
10
H1
FY
11
H2
FY
11
H1
FY
12
H2
FY
12
(00
0)'
s
NZ BROADBAND CONNECTIONS
Retail Gen-i
50
70
90
110
130
150
170
H1 FY10 H2 FY10 H1 FY11 H2 FY11 H1 FY12 H2 FY12
NZ
$M
NZ BROADBAND REVENUES (excl AAPT)

7
MOBILE
• Grow ARPU and revenue by focusing on high value customers and increasing data usage
• Market share of connections ~37%*
• NZ revenue up 10% vs H2 FY11
• Usage revenues up 2%, ARPU up 9% vs H2 FY11
• Gen-i revenues up 8%, Retail postpaid revenues up 4%, prepaid revenues down 10%
• Postpaid connections up 36k in H2
• Gen-i 70%+ market share
• Consumer connection growth with good payback
but increased cost of sales
• Prepaid connections down 34k in H2 (prior to CDMA closure)
• Declines in low usage connections
• Smartphone penetration ~25%, (~11% H2 FY11)
Objective
Result
* Source – IDC Telco Tracker at 31 Mar 2012
-
50
100
150
200
250
300
350
400
450
500
H1 FY10 H2 FY10 H1 FY11 H2 FY11 H1 FY12 H2 FY12
$M
NZ MOBILE REVENUES
Voice revenue Data/SMS revenue Handset revenue
-
500
1,000
1,500
2,000
2,500
3,000
H1 FY10 H2 FY10 H1 FY11 H2 FY11 H1 FY12 H2 FY12
Co
nn
ec
tio
ns
(0
00
)
NZ MOBILE CONNECTIONS
Telecom Vodafone 2 Degrees*
-
5
10
15
20
25
30
35
H1 FY10 H2 FY10 H1 FY11 H2 FY11 H1 FY12 H2 FY12
AR
PU
p/m
th
NZ MOBILE ARPU
Voice + Data Voice Data

8
MOBILE – CDMA CLOSURE
• 10+ year old CDMA network successfully shut down as planned
• High level of revenue migrated to XT
• XT mobile base at 31 July ~1.6m connections, with ARPU of ~$35
• Primarily low usage connections that did not migrate
• Low value connections generating ~$600k revenue p/mth
• Cost savings of $5-10m expected, relating to lower support costs, electricity and backhaul costs
• Spectrum now available for use on XT network

9
IT SERVICES
• Increase value of fixed and mobile services
with Hosted ICT Services
• Grow IT Services quality and margin
• Gen-i IT Services FY12 EBITDA up 5% vs FY11
• Sale of Software Solutions in H1 FY12
• IT Services margin of 8.8% (vs 8.5% in FY11)
• EBITDA growth stronger than revenue
growth of 1%, reflecting focus on efficiency
• Strong government relationships
Objective
Result 0%
2%
4%
6%
8%
10%
12%
0
50
100
150
200
250
300
H1 FY10 H2 FY10 H1 FY11 H2 FY11 H1 FY12 H2 FY12
EB
ITD
A M
arg
in
Re
ve
nu
e $
M
GEN-i IT SERVICES
Revenue EBITDA margin Linear (EBITDA margin)
0
100
200
300
400
500
600
700
800
900
H1 FY09
H2 FY09
H1 FY10
H2 FY10
H1 FY11
H2 FY11
H1 FY12
H2 FY12
$M
GEN-i CONTRACTS CLOSED (INCL. RENEWALS)
10
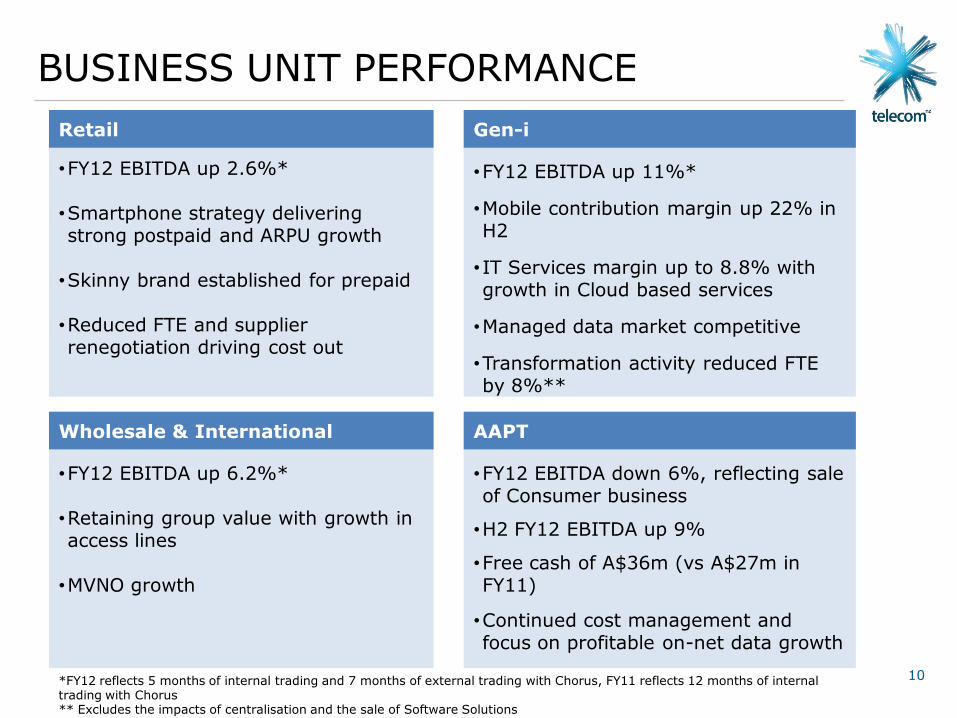
BUSINESS UNIT PERFORMANCE
Wholesale & International •FY12 EBITDA up 6.2%*
•Retaining group value with growth in access lines
•MVNO growth
Retail
•FY12 EBITDA up 2.6%*
•Smartphone strategy delivering strong postpaid and ARPU growth
•Skinny brand established for prepaid
•Reduced FTE and supplier renegotiation driving cost out
•FY12 EBITDA up 11%*
•Mobile contribution margin up 22% in H2
• IT Services margin up to 8.8% with growth in Cloud based services
•Managed data market competitive
•Transformation activity reduced FTE by 8%**
•FY12 EBITDA down 6%, reflecting sale of Consumer business
•H2 FY12 EBITDA up 9%
•Free cash of A$36m (vs A$27m in FY11)
•Continued cost management and focus on profitable on-net data growth
Wholesale & International
Retail Gen-i
AAPT
*FY12 reflects 5 months of internal trading and 7 months of external trading with Chorus, FY11 reflects 12 months of internal trading with Chorus ** Excludes the impacts of centralisation and the sale of Software Solutions

Group Financials

12
CFO OVERVIEW
KPIs Full year performance to 30 June 2012
Adjusted Revenue Declines driven by AAPT and termination rates
Adjusted Cost Headcount down 5% vs H2 FY11
EBITDA - continuing Complicated by demerger, flat on a pro-forma
basis
D&A – continuing Down 19%
Total Adjusted Net
Earnings
Up 9%
Capex – continuing $392m, 8.6% capex to sales ratio
Adjusted free cash flow* $656m generated
Net Debt $851m, capital management underway
*Adjusted free cash flow calculated as Adjusted EBITDA from continuing operations of $1,048m less capex from continuing operations of $392m

13
FINANCIAL SUMMARY
REPORTED ADJUSTED ADJUSTED
FY12 $M
FY12 $M
H2 FY12 $M
EBITDA - continuing 1,079 1,048 560
EBITDA - discontinued 1,103 321 0
Total EBITDA 2,182 1,369 560
Net Earnings 1,157 422 182
Total Capex 528 528 203
• Comparison of results with prior periods is complex following changes
to the trading arrangements with Chorus

14
• FY12 Adjusted EBITDA from continuing operations up 4.8%
• 5 months of internal trading with Chorus; and
• 7 months of external trading following demerger
• FY12 pro-forma EBITDA of $1,093m
• Estimated EBITDA as if demerger had occurred on 1 July 2011
• FY11 pro-forma EBITDA of $1,086m
• Underlying performance flat
PRO FORMA EBITDA
10001048
0
200
400
600
800
1000
1200
FY
11
FY
12
$M
ADJUSTED EBITDA FROM CONTINUING OPERATIONS
1086 1093
0
200
400
600
800
1000
1200
FY
11
FY
12
$M
PRO FORMA ADJUSTED EBITDA

15
• Revenue decline impacted by
• Mobile termination rate price declines
• Rationalisation of International business
• AAPT Consumer sale
• Reductions in AAPT resale revenue
• Underlying decline in NZ business revenues 2%
REVENUE TRENDS
4986 26194
167
9813 4540
3000
3500
4000
4500
5000
5500
FY
11
Re
ve
nu
e
(Ad
j)
Mo
bile
Ha
nd
se
t a
cco
un
tin
g
Inte
rna
tio
na
l tr
an
sits, A
AP
T
Co
nsu
me
r, M
TR
AA
PT
de
clin
e
(excl C
on
su
me
r)
NZ
De
clin
e
So
uth
ern
Cro
ss
FY
12
Re
ve
nu
e
(Ad
j)
$M
REVENUE COMPARISON - FY11 v FY12
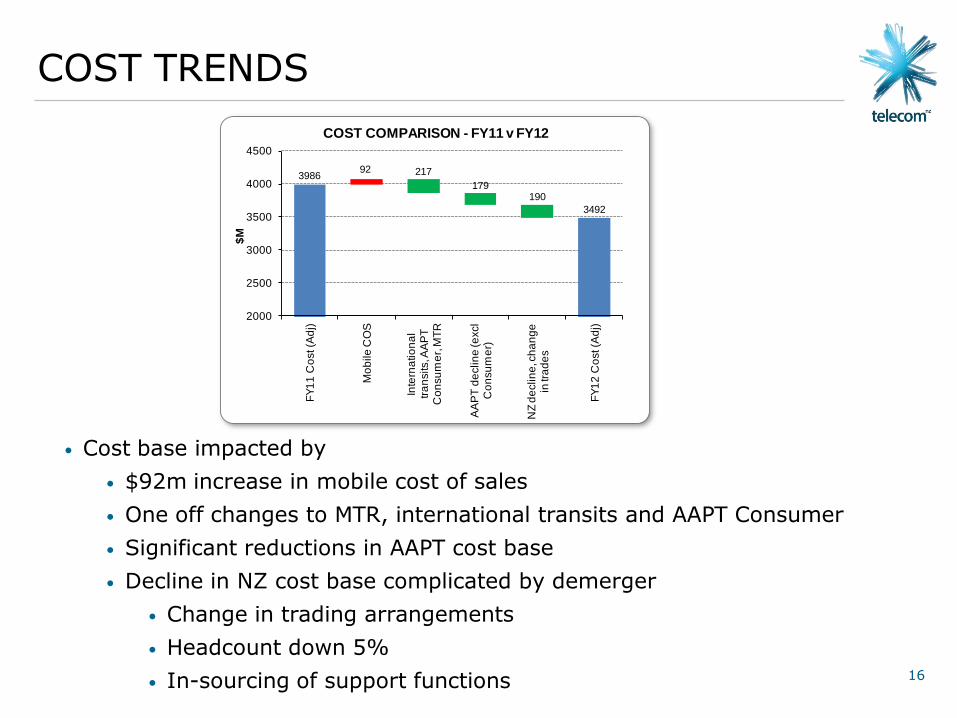
16
• Cost base impacted by
• $92m increase in mobile cost of sales
• One off changes to MTR, international transits and AAPT Consumer
• Significant reductions in AAPT cost base
• Decline in NZ cost base complicated by demerger
• Change in trading arrangements
• Headcount down 5%
• In-sourcing of support functions
COST TRENDS
398692 217
179190
3492
2000
2500
3000
3500
4000
4500
FY
11
Co
st (A
dj)
Mo
bile
CO
S
Inte
rna
tio
na
l tr
an
sits, A
AP
T
Co
nsu
me
r, M
TR
AA
PT
de
clin
e (e
xcl
Co
nsu
me
r)
NZ
de
clin
e, c
ha
ng
e
in tr
ad
es
FY
12
Co
st (A
dj)
$M
COST COMPARISON - FY11 v FY12

17
CAPITAL EXPENDITURE
• Capex from continuing operations of $392m for FY12, which equates
to 8.6% capex to sales ratio
• Total capex of $528m for FY12, down 42%
• Includes Chorus related capex of ~$136m
• FY13 capex outlook of around $460m
• Includes spend on 850 MHz spectrum and an allowance for new
data centres which are under investigation
0
50
100
150
200
250
300
350
400
450
500
FY12 Actual FY13 Outlook
$M
CAPEX FROM CONTINUING OPERATIONS
18
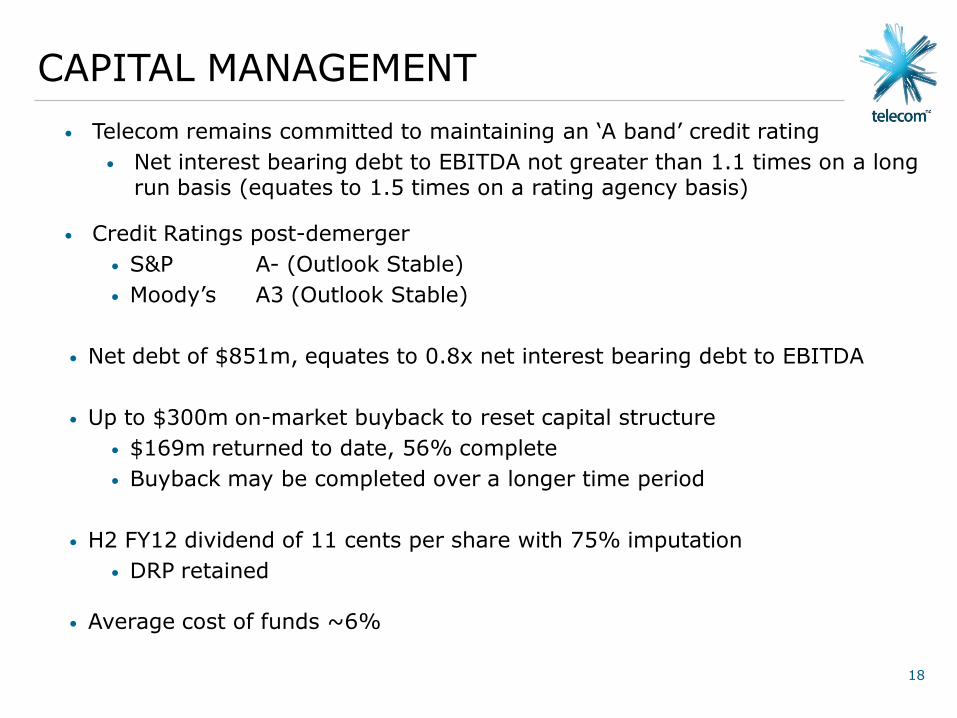
CAPITAL MANAGEMENT
• Telecom remains committed to maintaining an ‘A band’ credit rating
• Net interest bearing debt to EBITDA not greater than 1.1 times on a long run basis (equates to 1.5 times on a rating agency basis)
• Credit Ratings post-demerger
• S&P A- (Outlook Stable)
• Moody’s A3 (Outlook Stable)
• Net debt of $851m, equates to 0.8x net interest bearing debt to EBITDA
• Up to $300m on-market buyback to reset capital structure
• $169m returned to date, 56% complete
• Buyback may be completed over a longer time period
• H2 FY12 dividend of 11 cents per share with 75% imputation
• DRP retained
• Average cost of funds ~6%

Outlook

20
OUTLOOK
• Market trends
• New industry model post demerger to create Telecom as a new fixed line and
IT Services provider and mobile network operator
• Strong competition to continue with industry consolidation
• Telecom focused on winning in key markets to drive long term value
• Create effortless customer experiences and simplify business
• Compete aggressively in fixed line to maintain broadband market share
• Lead the transition to fibre
• Grow mobile while managing acquisition and retention costs
• Grow IT Services and AAPT
• Focused capital investment for the future
• Further detail to be provided via strategy day

21
FY13 FINANCIAL OUTLOOK
• FY13 financial outlook remains subject to strategy review
• FY13 EBITDA – flat to low single digit percentage decline
• Investing to hold broadband market share
• FY13 Capex of approximately $460m (includes spectrum and allowance for
new data centres)
• FY13 dividend policy – continuation of 90% pay out ratio
• DRP retained
• Imputation expected to be between 70% and 100%
22
DISCLAIMER
Forward-looking statements and disclaimer
This announcement includes forward-looking statements within the meaning of the U.S. Private Securities Litigation Reform Act of 1995 regarding future events and the future financial performance of Telecom. Such forward-looking statements are based on the beliefs of management as well as on assumptions made by
and information currently available at the time such statements were made.
These forward-looking statements can be identified by words such as ‘anticipate’, ‘believe’, ‘estimate’, ‘expect’, ‘intend’, ‘will’, ‘plan’, ‘may’, ‘could’ and similar expressions. Any statements in this announcement that are not historical facts are forward-looking statements. These forward-looking statements are not guarantees or predictions of future performance, and involve known and unknown risks, uncertainties and other factors, many of which are beyond Telecom’s control, and which may cause actual results to differ materially from those projected in the forward-looking statements contained in this release. Factors that could cause actual results or performance to differ materially from those expressed or implied in the forward-looking statements are discussed herein and also include Telecom's anticipated growth strategies, Telecom's future results of operations and financial condition, economic conditions in New Zealand and Australia; the regulatory environment in New Zealand; competition in the markets in which Telecom operates; risks related to the sharing arrangements with Chorus, other factors or trends affecting the telecommunications industry generally and Telecom’s financial condition in particular and risks detailed in Telecom's filings with the U.S. Securities and Exchange Commission. Except as required by law or the listing rules of the stock exchanges on which Telecom is listed, Telecom undertakes no obligation to update any forward-looking statements whether as a result of new information, future events or otherwise.
The securities referred to in this announcement have not been, and will not be, registered under the United States Securities Act of 1933 or under the securities laws of any state or other jurisdiction of the United States. This announcement does not constitute an offer of securities in the United States or to any person to whom it would not be lawful outside Australia and New Zealand. Any securities described herein may not be offered or sold in the United States absent registration under the Securities Act or pursuant to an applicable exemption from registration, or to any person to whom it would not be lawful outside Australia and New Zealand.
Non-GAAP financial measures
Telecom results are reported under IFRS. This release includes non-GAAP financial measures which are not prepared in accordance with IFRS. The non-GAAP financial measures used in this presentation include:
1. EBITDA. Telecom calculates EBITDA by adding back (or deducting) depreciation, amortisation, finance expense/(income), share of associates’ (profits)/losses and taxation expense to net earnings/(loss) from continuing operations.
2. Adjusted EBITDA. Adjusted EBITDA excludes significant one-off gains, expenses and impairments.
3. Capital expenditure. Capital expenditure is the additions to property, plant and equipment and intangible assets, excluding goodwill and other non-cash additions that may be required by IFRS such as decommissioning costs.
4. ARPU. Telecom calculates ARPU as revenue for the period (for mobile this is only voice and data) divided by an average number of customers.
5. Free cash flow. Free cash flow is defined as EBITDA less capital expenditure.
6. Adjusted free cash flow. Adjusted free cash flow utilises adjusted EBITDA rather than underlying EBITDA defined above.
7. Adjusted operating revenue. Adjusted operating revenue excludes significant one-off gains.
8. Adjusted net earnings. Adjusted net earnings are net earnings for the year adjusted by the same items to determine adjusted EBITDA, together with any adjustments to depreciation, amortisation and financing costs, whilst also allowing for any tax impact of those items.
Telecom believes that these non-GAAP financial measures provide useful information to readers to assist in the understanding of the financial performance, financial position or returns of Telecom, but that they should not be viewed in isolation, nor considered as a substitute for measures reported in accordance with IFRS. Non-GAAP financial measures as reported by Telecom may not be comparable to similarly titled amounts reported by other companies.

23
APPENDIX: FULL YEAR INCOME STATEMENT - REPORTED
Year ended 30 June 2012
$M
2011
$M
Change
%
Revenue 4,576 5,004 -8.6%
Expenses (3,497) (4,243) -17.6%
EBITDA 1,079 761 41.8%
Depreciation & amortisation (576) (708) -18.6%
EBIT 503 53 NM
Net finance expense (80) (137) -41.6%
Share of associates’ profit/(losses) 0 1 NM
Income tax expense (112) 4 NM
Net Earnings from Continuing Operations 311 (79) NM
Earnings from discontinued operations, net of tax 846 245 NM
Net Earnings 1,157 166 NM
EPS 60 9 NM
DPS 20 20 0%
24
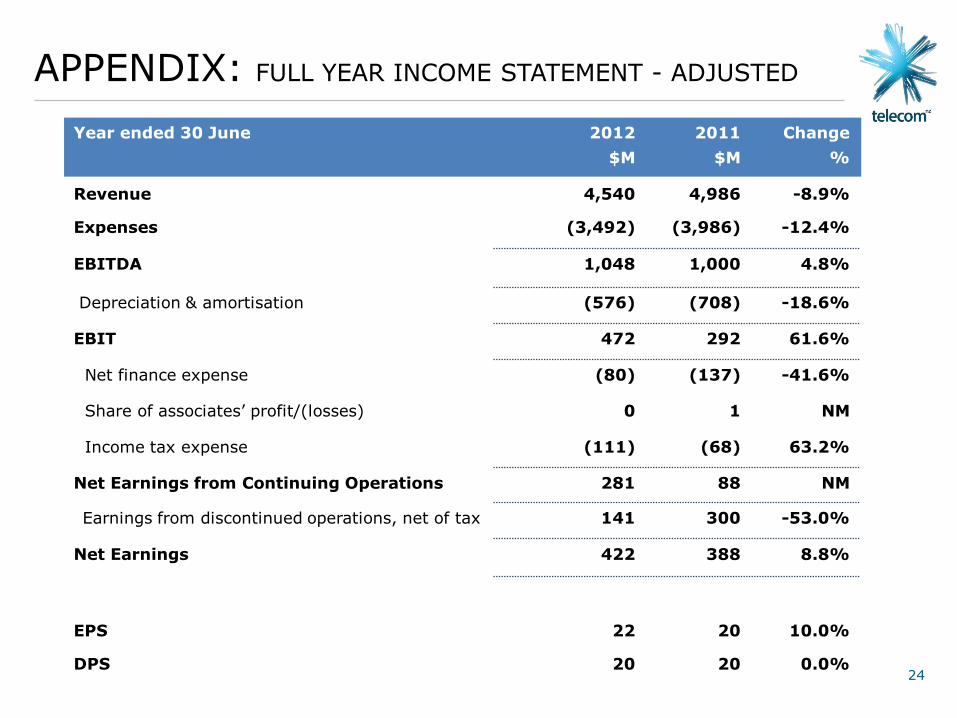
APPENDIX: FULL YEAR INCOME STATEMENT - ADJUSTED
Year ended 30 June 2012
$M
2011
$M
Change
%
Revenue 4,540 4,986 -8.9%
Expenses (3,492) (3,986) -12.4%
EBITDA 1,048 1,000 4.8%
Depreciation & amortisation (576) (708) -18.6%
EBIT 472 292 61.6%
Net finance expense (80) (137) -41.6%
Share of associates’ profit/(losses) 0 1 NM
Income tax expense (111) (68) 63.2%
Net Earnings from Continuing Operations 281 88 NM
Earnings from discontinued operations, net of tax 141 300 -53.0%
Net Earnings 422 388 8.8%
EPS 22 20 10.0%
DPS 20 20 0.0%

25
APPENDIX: HALF YEAR INCOME STATEMENT - ADJUSTED
Half year ended 30 June 2012
$M
2011
$M
Change
%
Revenue 2,218 2,449 -9.4%
Expenses (1,658) (1,936) -14.4%
EBITDA 560 513 9.2%
Depreciation & amortisation (292) (331) -11.8%
EBIT 268 182 47.3%
Net finance expense (21) (74) -71.6%
Share of associates’ profit/(losses) 0 0 NM
Income tax expense (65) (39) 66.7%
Net Earnings from Continuing Operations 182 69 NM
Earnings from discontinued operations, net of tax 0 161 NM
Net Earnings 182 230 -20.9%
EPS 9 12 -25.0%
DPS 11 13 -15.4%

26
APPENDIX: ADJUSTING ITEMS
Year ended 30 June 2012
$M
2011
$M
H2 FY12
$M
H2 FY11
$M
Reported Net Earnings 1,157 166 151 1
Add/(Subtract) adjusting items
Gain on demerger of Chorus (832) 31
Debt restructuring costs 110
Simplified corporate structure (28)
Demerger/UFB related costs 50 29 3 17
Earthquake impact (3) 42 38
Asset Impairments 257 257
Gain on sale of AAPT Consumer (18)
Related tax effects (32) (88) (3) (83)
Adjusted Net Earnings 422 388 182 230
TELECOM NEW ZEALAND H2 FY12 RESULT BRIEFING
Chief Executive Officer (Acting) – Chris Quin Chief Financial Officer – Nick Olson